Pelton Wheel
22
MUHAMAD RIDZUAN BIN ARIFIN – CD 060091 1.0 TITLE Pelton Wheel 1
-
Upload
limakupangmat -
Category
Documents
-
view
241 -
download
11
Transcript of Pelton Wheel

MUHAMAD RIDZUAN BIN ARIFIN – CD 060091
1.0
TITLE
Pelton Wheel
1
MUHAMAD RIDZUAN BIN ARIFIN – CD 060091
2.0
OBJECTIVE :
To determine the characteristic of performance and torque of Pelton Wheel.
2
MUHAMAD RIDZUAN BIN ARIFIN – CD 060091
3.0
THEORY
The Pelton Wheel is a hydraulic turbine. It is also known as Impulse Turbine. In the
Pelton Wheel a jet of fluid issuing from a nozzle impinges on vanes of the turbine wheel
or runner, thus producing power as the runner rotates (see Figure1).
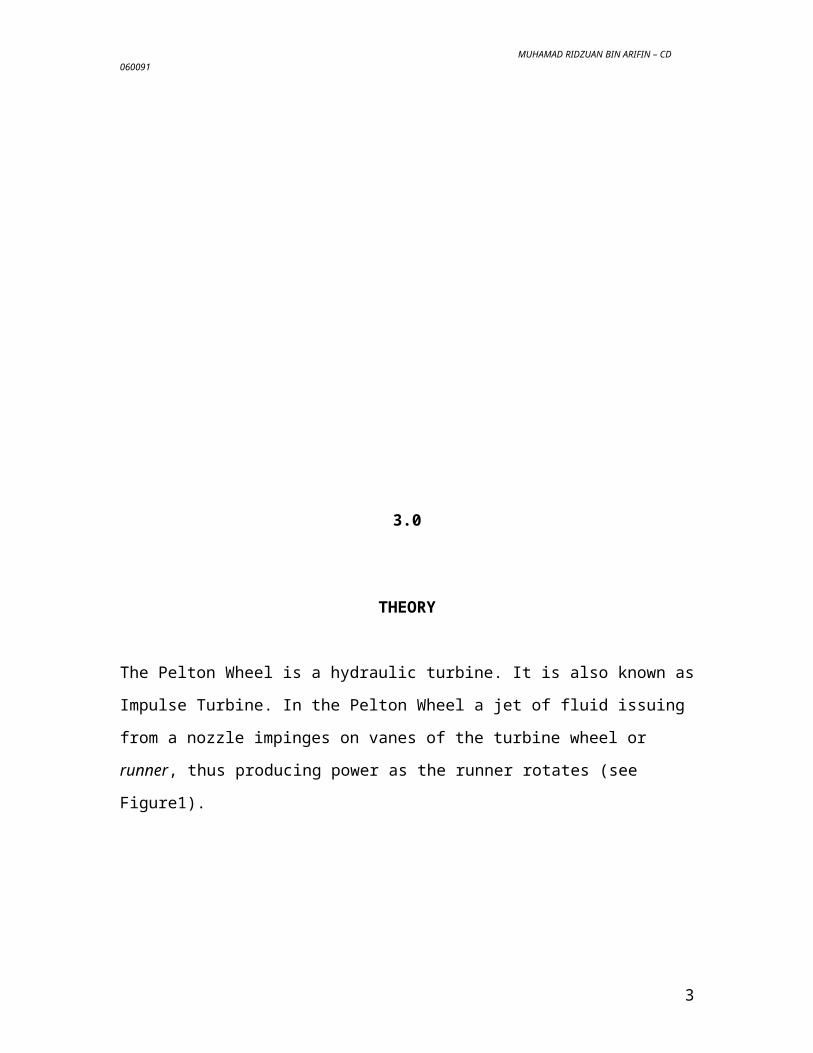
Figure 1: Pelton Wheel
Figure 2 shows a runner for the Henry Borden hydroelectric plant in Brazil. In primary
feature of the impulse turbine with respect to fluid mechanics is the power production as
the jet is deflected by the moving vanes.
3
MUHAMAD RIDZUAN BIN ARIFIN – CD 060091
Figure 2: Spare runner for the Henry Borden power plant in Brazil (Courtesy of Voith Hydro Inc.)
When the momentum equation is applied to this deflected jet, it can be shown for
idealized conditions that the maximum power will be developed when vane speed is one
half of the initial jet speed. With such conditions the existing jet speed will be zero- all
the kinetic energy of the jet will have been expended in driving the vane. Thus if we
apply the energy equation between the incoming jet and the exiting fluid (assuming
negligible head loss and negligible kinetic energy at exit), we find that the head given up
to turbine is hi = V2j /2g and the power thus developed is
P=Qγht …………………………………..(1)
4
MUHAMAD RIDZUAN BIN ARIFIN – CD 060091
Where Q is the discharge of the incoming jet, γ is the specific weight of jet fluid, and hi =
V2j /2g, or the velocity head of the jet. Thus equation (1) reduces to
P=ρQ V2j /2 ……………………………..(2)
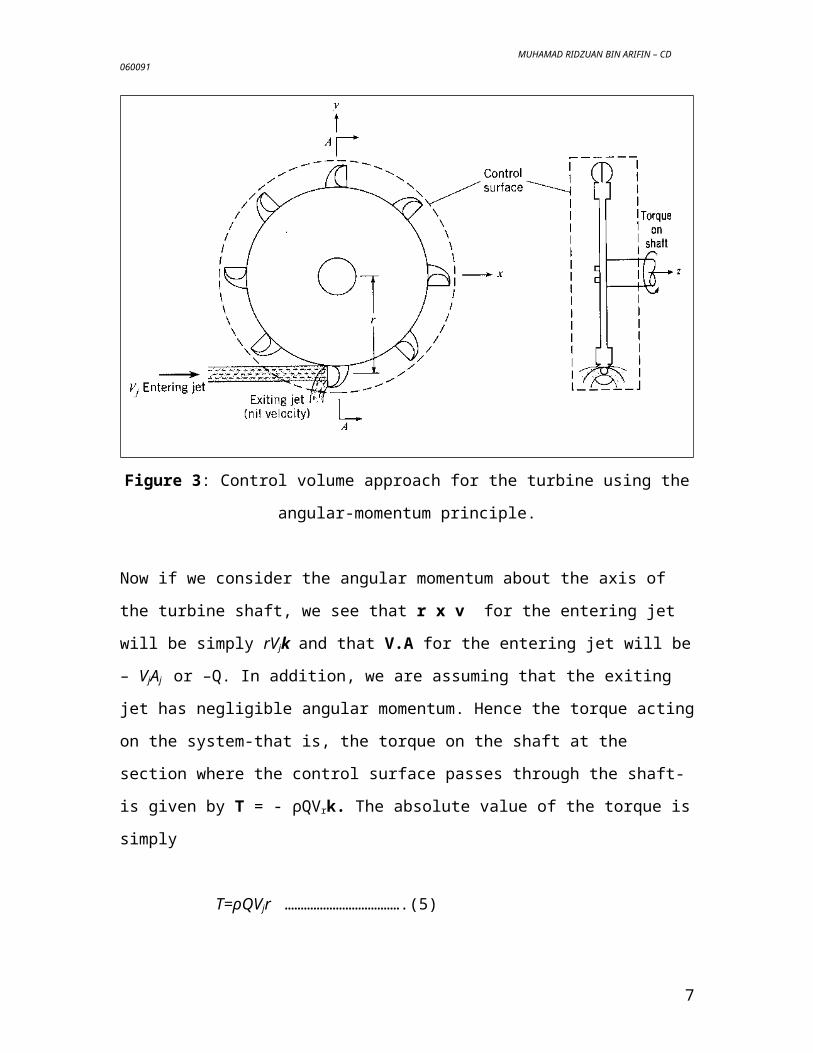
To obtain the torque on the turbine shaft, we apply the angular-momentum equation, to a
control volume, as shown in Figure 3. Then for steady flow we have
∑M = ∑ ( r x v ) ρV.A …………………(3)
or
Tshaft = ∑ ( r x v) ρ V.A …………………(4)
Figure 3: Control volume approach for the turbine using the angular-momentum
principle.
Now if we consider the angular momentum about the axis of the turbine shaft, we see that
r x v for the entering jet will be simply rVjk and that V.A for the entering jet will be –
5
MUHAMAD RIDZUAN BIN ARIFIN – CD 060091
VjAj or –Q. In addition, we are assuming that the exiting jet has negligible angular
momentum. Hence the torque acting on the system-that is, the torque on the shaft at the
section where the control surface passes through the shaft-is given by T = - ρQVrk. The
absolute value of the torque is simply
T=ρQVjr ……………………………….(5)
The power developed by the turbine is Tω, or
P= ρQVjrω ……………………………...(6)
Furthermore, if the velocity of the turbine is ½ Vj for maximum power, as noted earlier,
we have P = ρQV2j /2, the same as equation (2).
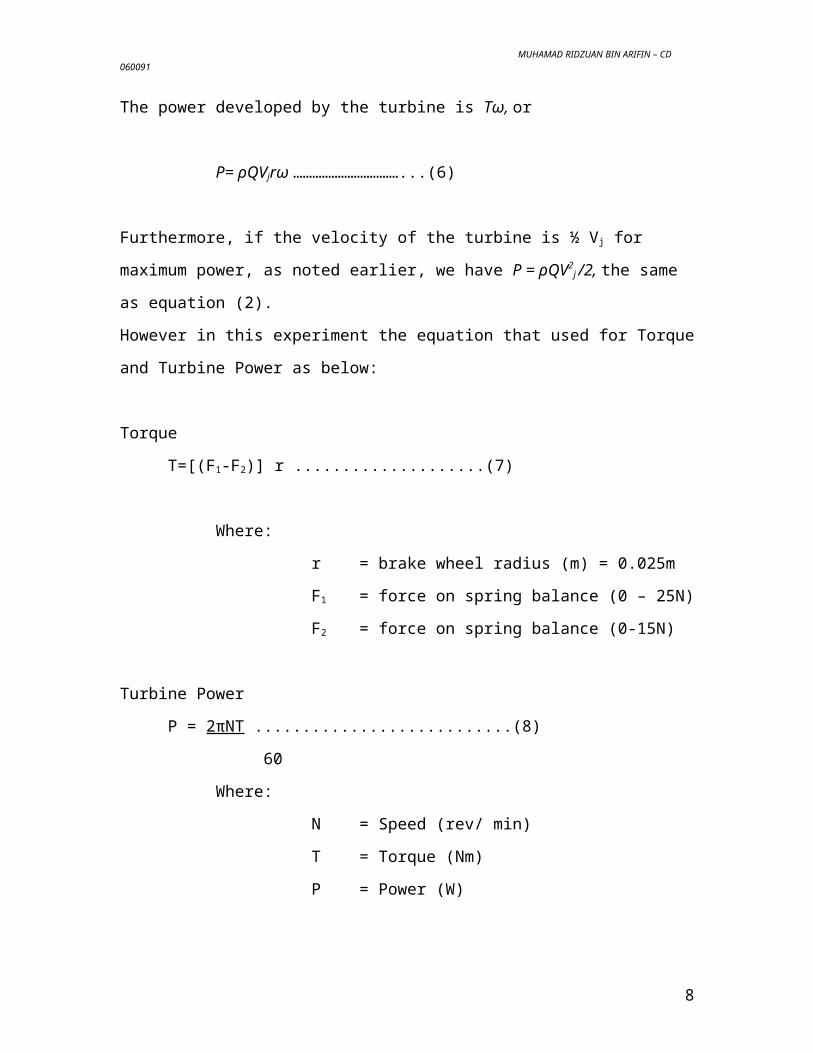
However in this experiment the equation that used for Torque and Turbine Power as
below:
Torque
T=[(F1-F2)] r ....................(7)
Where:
r = brake wheel radius (m) = 0.025m
F1 = force on spring balance (0 – 25N)
F2 = force on spring balance (0-15N)
Turbine Power
P = 2πNT ...........................(8)
60
Where:
N = Speed (rev/ min)
T = Torque (Nm)
P = Power (W)
6
MUHAMAD RIDZUAN BIN ARIFIN – CD 060091
4.0
DATA/ RESULTS:
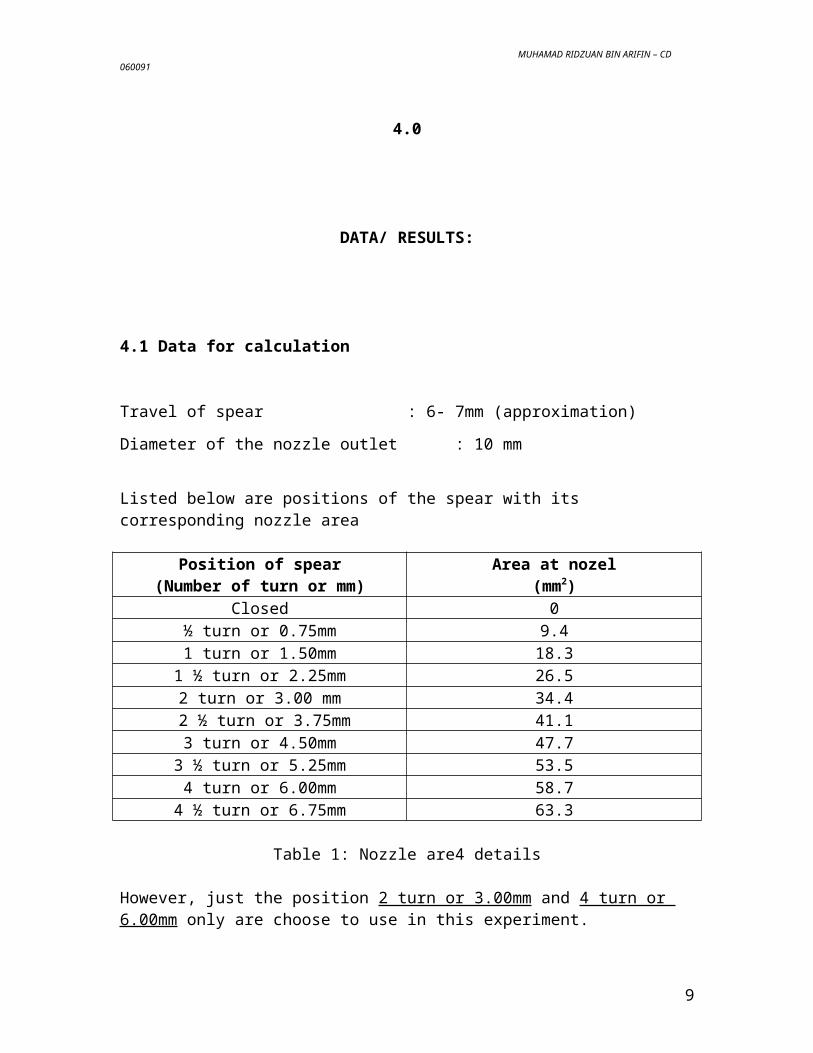
4.1 Data for calculation
Travel of spear : 6- 7mm (approximation)
Diameter of the nozzle outlet : 10 mm
Listed below are positions of the spear with its corresponding nozzle area
Position of spear(Number of turn or mm)
Area at nozel(mm2)
Closed 0½ turn or 0.75mm 9.41 turn or 1.50mm 18.3
1 ½ turn or 2.25mm 26.52 turn or 3.00 mm 34.4
2 ½ turn or 3.75mm 41.13 turn or 4.50mm 47.7
3 ½ turn or 5.25mm 53.54 turn or 6.00mm 58.7
4 ½ turn or 6.75mm 63.3
Table 1: Nozzle are4 details
However, just the position 2 turn or 3.00mm and 4 turn or 6.00mm only are choose to use in this experiment.
7
MUHAMAD RIDZUAN BIN ARIFIN – CD 060091
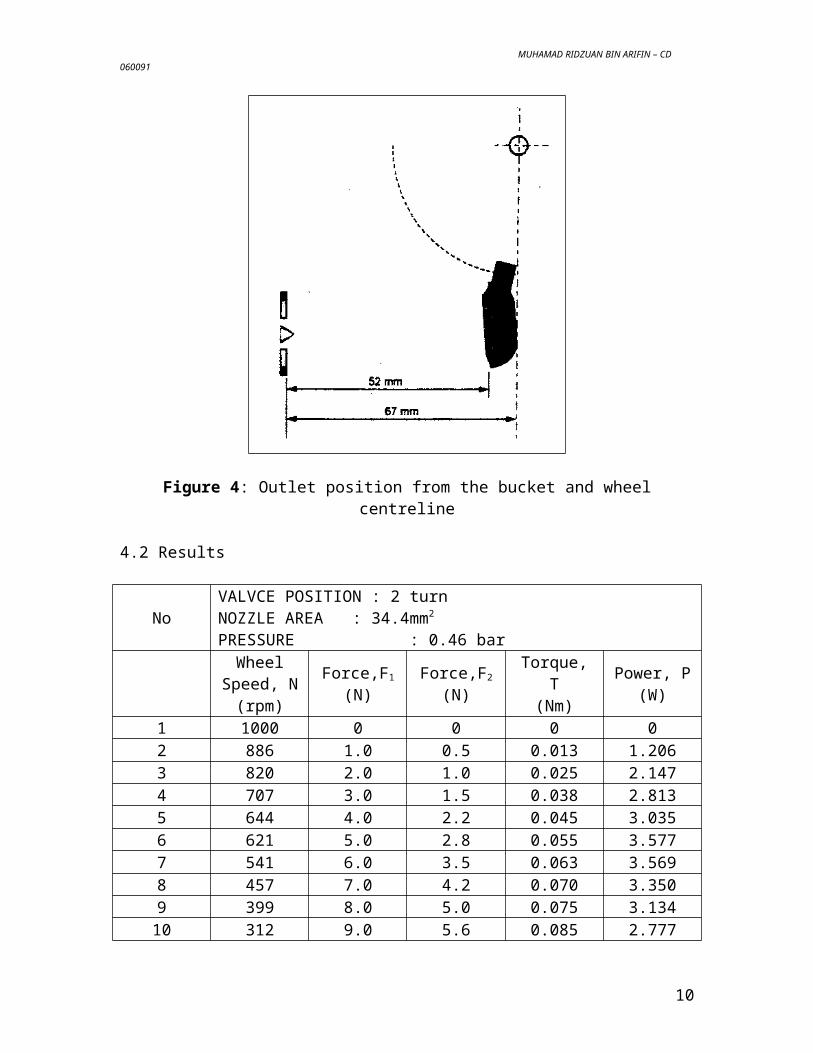
Figure 4: Outlet position from the bucket and wheel centreline
4.2 Results
NoVALVCE POSITION : 2 turnNOZZLE AREA : 34.4mm2
PRESSURE : 0.46 barWheel
Speed, N(rpm)
Force,F1
(N)Force,F2
(N)Torque, T
(Nm)Power, P
(W)
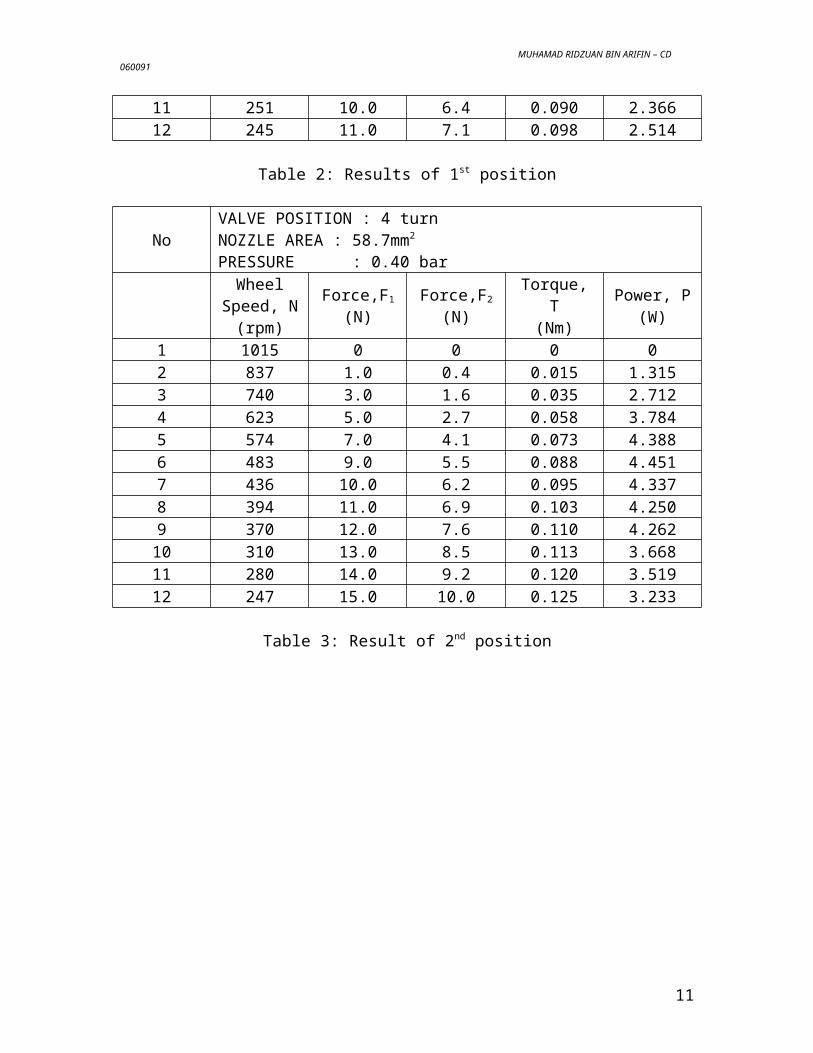
1 1000 0 0 0 02 886 1.0 0.5 0.013 1.2063 820 2.0 1.0 0.025 2.1474 707 3.0 1.5 0.038 2.8135 644 4.0 2.2 0.045 3.0356 621 5.0 2.8 0.055 3.5777 541 6.0 3.5 0.063 3.5698 457 7.0 4.2 0.070 3.3509 399 8.0 5.0 0.075 3.13410 312 9.0 5.6 0.085 2.77711 251 10.0 6.4 0.090 2.36612 245 11.0 7.1 0.098 2.514
Table 2: Results of 1st position
8
MUHAMAD RIDZUAN BIN ARIFIN – CD 060091
NoVALVE POSITION : 4 turnNOZZLE AREA : 58.7mm2
PRESSURE : 0.40 barWheel
Speed, N(rpm)
Force,F1
(N)Force,F2
(N)Torque, T
(Nm)Power, P
(W)
1 1015 0 0 0 02 837 1.0 0.4 0.015 1.3153 740 3.0 1.6 0.035 2.7124 623 5.0 2.7 0.058 3.7845 574 7.0 4.1 0.073 4.3886 483 9.0 5.5 0.088 4.4517 436 10.0 6.2 0.095 4.3378 394 11.0 6.9 0.103 4.2509 370 12.0 7.6 0.110 4.26210 310 13.0 8.5 0.113 3.66811 280 14.0 9.2 0.120 3.51912 247 15.0 10.0 0.125 3.233
Table 3: Result of 2nd position
9
MUHAMAD RIDZUAN BIN ARIFIN – CD 060091
5.0
OBSERVATION
Our observations are the experiment done successfully. These experiments are start with
the introduction about the safety by the technician. First, the spear valves are closed and
the water supply switches on. After this step, the water can see in the pipe that continued
to the Pelton Wheel, but the spear valve still not open so the Pelton Wheel still not rotate.
Before that, the both spring balance are set to the zero position. After that, the spear
valves are slowly open allowing the jet to drive the Pelton Wheel. The spear valve are
open by the number of turn (refer to the Table 1). At this position we can see the Pelton
Wheel are rotates with faster. After this, the speeds of the Pelton Wheel are measured
with use optical Tachometer. At the Tachometer we can see the speeds of the Pelton
Wheel are not constant, so to solve this problem we take the average speed. After that,
the loads are increased by adjusting the knob above the spring balance F1 at desired
interval. At this time we can see the changes of the load at the spring balance F2. The
value of the both spring are record and the speed of the Pelton Wheel are measured again,
or with the simple to say at each interval, the wheel speed, both spring balances and jet
inlet pressure are recorded. These experiments are repeated with the four turn of the spear
valve. When the spear valves are turned to the four turn, we can see that the Pelton Wheel
rotates very faster than the second turn. Besides, the maximum loads of the spring
balance F1 are larger than experiment before.
10
MUHAMAD RIDZUAN BIN ARIFIN – CD 060091
6.0
CALCULATION
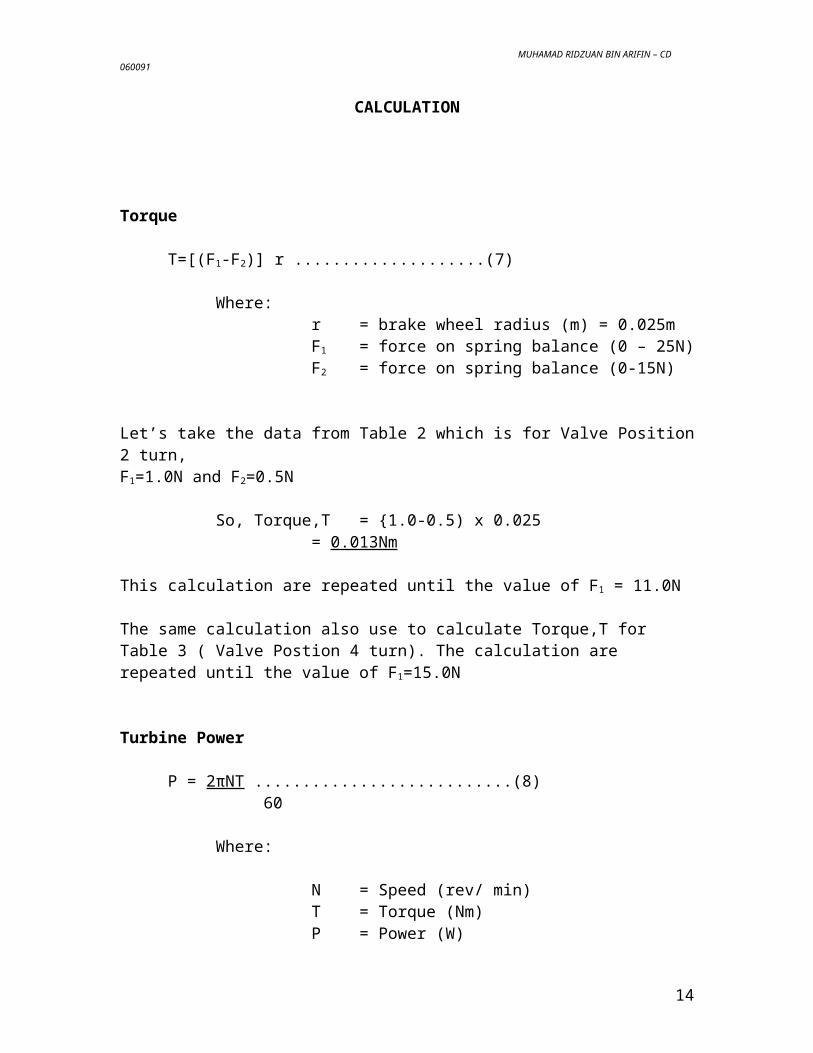
Torque
T=[(F1-F2)] r ....................(7)
Where:r = brake wheel radius (m) = 0.025mF1 = force on spring balance (0 – 25N)F2 = force on spring balance (0-15N)
Let’s take the data from Table 2 which is for Valve Position 2 turn, F1=1.0N and F2=0.5N
So, Torque,T = {1.0-0.5) x 0.025= 0.013Nm
This calculation are repeated until the value of F1 = 11.0N
The same calculation also use to calculate Torque,T for Table 3 ( Valve Postion 4 turn). The calculation are repeated until the value of F1=15.0N
Turbine Power
P = 2πNT ...........................(8) 60
Where:
N = Speed (rev/ min)T = Torque (Nm)P = Power (W)
11
MUHAMAD RIDZUAN BIN ARIFIN – CD 060091
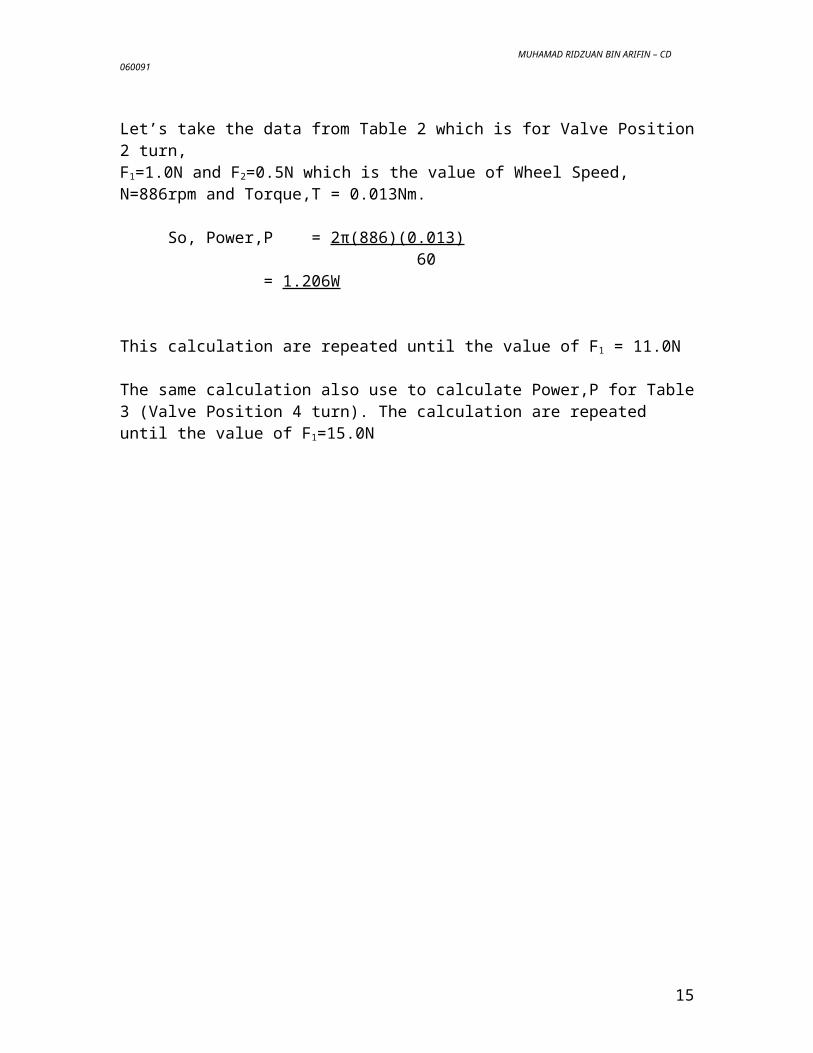
Let’s take the data from Table 2 which is for Valve Position 2 turn, F1=1.0N and F2=0.5N which is the value of Wheel Speed, N=886rpm and Torque,T = 0.013Nm.
So, Power,P = 2π(886)(0.013) 60
= 1.206W
This calculation are repeated until the value of F1 = 11.0N
The same calculation also use to calculate Power,P for Table 3 (Valve Position 4 turn). The calculation are repeated until the value of F1=15.0N
12
MUHAMAD RIDZUAN BIN ARIFIN – CD 060091
7.0
DISCUSSION
7.1 Discuss the results from the graph
The graph for 2 turn, the shape graph for Torque,T against Measured Speed,N are linear.
The sketch of this graph has some points that not touch the line. This caused the
experiment are influencing by some error that happened while the experiment. Refer to
this graph, it shows us that when the T is small value, hence the N is small value too. So,
that can say the value of torque,T depends to the Measured Speed,N.
Refer to the graph Power,P against Measured Speed,N, the shape of graph is parabolic.
The maximum value of power,P is 3.58W when Torque,T equal to 0.089Nm. This graph
shown us that when the torque,T and Speed,N are added, the Power,P are followed add
too. But when the power achieve the maximum value, the power decrease.
So, the correlation between two graph are when the Speed, N up so, the torque,T
increase. When torque,T increase the power,P increase until the power maximum, the
power will decrease but at the same time the torque,T and speed,N are still increase.
Lets refer to the graph for 4 turn, the shape of this graph are same like graph for 2
turn, but the different between both are the slope of the graph. Without calculation, we
can see the different of the slope. For 4 turn graph the slope are higher than 2 turn. This
caused when the spear valve are open 4 turn, the wheel rotates highly. So, this can give
more torque,T and power to the wheel. But the same case had happened which is when
the power achieves maximum state, the power will decrease automatically. Besides, we
can see the power maximum for 4 turn are greater than 2 turn, it is equal 4.45W at torque
equal to 0.111Nm.
13
MUHAMAD RIDZUAN BIN ARIFIN – CD 060091
7.2 What suggestions do you have to improve the experiment?
1. Use the spring that have the small scale.
2. Ensure that the space between tachometer with wheel is same while measure the
speed of wheel, or use the equipment that when the spear valve are opened and
drive the wheel the equipment can measure the speed automatically.
3. Ensure the bucket is clean and avoid of dirty.
4. The water out from the spear valve must through the bucket exactly.
7.3 Give suggestion to reduce the friction in the experiment.
1. Make sure the water that use must clean without dirty.
2. Ensure the bearing at the wheel are working.
3. Put the lubricant to the bearing to reduce the friction.
4. Ensure the water does not dirty.
5. The pressure that out of the nozzle must invariant.
6. The casing of the Pelton Wheel must enlarge than before.
7.4 State four of error in the experiment
This experiment we can see that some of the errors are happened that gives the
effect to the data of this experiment. The errors are:
1. Parallax error = this error caused the wrong position of the eyes of the
observatory while take the data, it is mean the eyes position is not parallel
while take the data from measure scale. The examples in this experiment are
while reading the measure at the spring balance.
14
MUHAMAD RIDZUAN BIN ARIFIN – CD 060091
2. System error which is this error caused by the damage or some error at the
equipment In this experiment the both spring not work very well, it means
when the spring does not have any load, the spring shown the measure. This
maybe caused the spring are used for long time.
3. Error when measure the speed of the wheel use tachometer, it is the space
between the tachometer and wheel is not constant. So this error can give
different measurement for each interval.
4. The water those out from spear valve are not constant.
5. The error at the rope. It is the rope has dirty and the dirty can cause the
friction between rope and wheel. So the suggestion to solve this is use the new
rope for one experiment.
15
MUHAMAD RIDZUAN BIN ARIFIN – CD 060091
8.0
CONCLUSION
The objectives of this experiment are achieved. However, have some error that gives
effect to the data of this experiment. The value of power,P refer to the torque,T and
wheel speed,N. The torque,T depend to the wheel speed,N. When the speed,N increase
the torque,T increased and when the torque,T increase, the power,P increase, but when
power achieves the maximum point, the power will increase. The value of torque can
calculated if we know the force of F1 and F2. The power can be calculated if we got the
value of torque,T and wheel speed,N.
16
MUHAMAD RIDZUAN BIN ARIFIN – CD 060091
9.0
REFERENCES
John A. Roberson and Clayton T. Crowe 1997.ENGINEERING FLUID MECHANICS, 6th Edition, John Wiley and Sons.
17