Parramatta Road PRECINX Sustainability Report · 2019-03-04 · Sustainability and resilience....
57
Parramatta Road PRECINX Sustainability Report September 2015 www.newparramattard.com.au
Transcript of Parramatta Road PRECINX Sustainability Report · 2019-03-04 · Sustainability and resilience....

Parramatta Road PRECINX Sustainability Report September 2015
www.newparramattard.com.au

NPR Kinesis - Precinx Strategy Report 20150828.docx August 14 | PAGE 2
Note: This report is provided subject to some important assumptions and qualifications:
The results presented in this report are modelled estimates using mathematical
calculations. The data, information and scenarios presented in this report have not been
separately confirmed or verified. Accordingly, the results should be considered to be
preliminary in nature and subject to such confirmation and verification.
Energy, water and greenhouse consumption estimates are based on local climate and
utility data available to the consultant at the time of the report. These consumption
demands are, where necessary, quantified in terms of primary energy and water
consumptions using manufacturer’s data and scientific principles.
Generic precinct-level cost estimates provided in this report are indicative only based on
Kinesis’s project experience and available data from published economic assessments.
These have not been informed by specific building design or construction plans and
should not be used for design and construct cost estimates.
The Kinesis software tool and results generated by it are not intended to be used as the
sole or primary basis for making investment or financial decisions (including carbon credit
trading decisions). Accordingly, the results set out in this report should not be relied on as
the sole or primary source of information applicable to such decisions.
Prepared by Kinesis
Level 6, 155 Clarence Street
Sydney, 2000 NSW
P.O. Box Q164
Queen Victoria Building
NSW 1230
Document Version
Final
Authors
Bruce Taper, Director
David Holden, Associate Director
Tom Watson, Sustainability Analyst
NPR Kinesis - Precinx Strategy Report 20150828.docx August 14 | PAGE 3
While every effort has been made to ensure that this document is correct at the time of
printing, UrbanGrowth NSW (including its agents and employees) makes no warranties
as to the accuracy or completeness of the information in the document. Not all concepts
considered in these papers reflect government policy or are under active consideration.
UrbanGrowth NSW disclaims any and all liability to any person in connection with
anything done or committed to be done in reliance upon the whole or any part of the
document.

NPR Kinesis - Precinx Strategy Report 20150828.docx August 14 | PAGE 4
Parramatta Road Urban Transformation PRECINX Strategy Report
Contents 1. Introduction .......................................................................... 5
1.1. OVERVIEW 5
1.2. THE STUDY AREA 6
1.3. PARRAMATTA ROAD URBAN TRANSFORMATION PROGRAM 8
1.4. PURPOSE OF THIS REPORT 10
1.5. OUR APPROACH 10
1.6. KEY FINDINGS 13
2. Understanding the Corridor .............................................. 15
3. Quantifying the Benefits of PRUTP .................................. 28
4. Precinct Analysis ............................................................... 30
4.1 PRECINCT ANALYSIS RESULTS 30
4.2 HIGH PERFORMANCE BUILDINGS 31
4.3 REDUCED AND DECOUPLED STRATEGIC PARKING 34
4.4 URBAN RESILIENCE AND INFRASTRUCTURE DELIVERY 39
5. Progressing to Implementation ........................................ 41
6. Performance Outcomes .................................................... 43
GRANVILLE – INDICATOR RESULTS 47
OPTIMISING GRANVILLE 47
AUBURN – SUMMARY 48
OPTIMISING AUBURN 48
HOMEBUSH - SUMMARY 49
OPTIMISING HOMEBUSH 49
BURWOOD - SUMMARY 50
OPTIMISING BURWOOD 50
KINGS BAY - SUMMARY 51
OPTIMISING KINGS BAY 51
TAVERNERS HILL - SUMMARY 53
OPTIMISING TAVERNERS HILL 53
LEICHHARDT - SUMMARY 54
OPTIMISING LEICHHARDT 54
CAMPERDOWN - SUMMARY 55
OPTIMISING CAMPERDOWN 55
7. Key Assumptions ............................................................... 56

NPR Kinesis - Precinx Strategy Report 20150828.docx August 14 | PAGE 5
1. Introduction
1.1. OVERVIEW
Over the next 20 years, Sydney’s population will grow by 1.6 million people.
Sydney will need to provide more diverse and affordable housing, a broader
range of job opportunities aligned with our changing economic structure and
easier and more sustainable ways for people and goods to move around the
city to support this growth. As the city grows, we must look to the renewal of
our existing urban areas to provide a more sustainable way of meeting
increasing demand for housing, transport and services.
The Parramatta Road Corridor (the Corridor) is identified in A Plan for Growing
Sydney as an urban renewal corridor that will be the focus for increased
housing, economic activity and social infrastructure. The Corridor is proposed
to be transformed through the implementation of the Draft New Parramatta
Road Urban Transformation Strategy over the next 30 years. In 2050, the
Corridor will have an estimated resident population of 70,000, approximately
40,000 new dwellings and 30,000 new jobs.
Realising the Corridor’s full potential is important to the future productivity
and liveability of metropolitan Sydney. Urban transformation within the
Corridor presents a unique opportunity to optimise sustainability
performance and implement new strategies that could achieve best practice
outcomes.
Under the right commercial and technical conditions, precincts along the
Corridor could potentially incorporate building and infrastructure optimisation
strategies to improve resource efficiency, reduce peak demand impacts and
lower capital and recurrent costs for infrastructure providers, developers and
householders above and beyond a business as usual scenario.
The exact technologies and strategies to achieve these gains will need to be
considered at the next phase of planning. However, a range of potential
optimised sustainability strategies have been identified that could be
considered by planning authorities when undertaking future strategic and
statutory planning processes.
The construction of WestConnex will allow for significant improvements to
local amenity by reducing through-traffic on surface roads, and allowing for
enhanced north-south local connectivity. The Government will investigate
the feasibility of light rail along Parramatta Road for the length of the
corridor.
The corridor will be a focus for increased housing, economic activity and
social infrastructure, especially around centres with good public transport
access and amenity. An Urban Renewal Strategy is being prepared to guide
development in selected precincts in the Parramatta Road Corridor and to
bring new life to local communities. Burwood, Sydney Olympic Park and
Rhodes will continue to be a particular focus for employment.
A Plan for Growing Sydney

NPR Kinesis - Precinx Strategy Report 20150828.docx August 14 | PAGE 6
1.2. THE STUDY AREA
Due to the nature of the required inputs and key deliverables of the draft
Strategy, the Corridor and its components are referred to in different ways,
for various components and stages of work.
The Study Area covers the 10 LGAs which the Corridor spans and includes
the geographical area between Parramatta CBD and Sydney CBD and the
Parramatta River in the north to the Western Rail Line in the south.
The Parramatta Road Corridor is the continuous length of Parramatta Road,
and includes land with direct frontage to Parramatta Road, as well as the
eight Precincts.
Change and growth along the Corridor is focused in eight Precincts which
have been chosen for their ability to support growth, and their access to
public transport, services, and jobs. The Precincts have been informed by a
range of factors including natural features or barriers, built form or land use
change, and subdivision patterns. In some cases, the Precincts straddle LGA
boundaries.
Frame Areas are portions of the Corridor located between the identified
Precincts with direct frontage to Parramatta Road, and typically capture the
first strip of lots or land to the first street/laneway running parallel to the
north or south of Parramatta Road. The Frame Areas form important links
that may experience some change, but at a lower intensity than that
anticipated in the Precincts. The NPUTP should not be seen as the
redevelopment of precincts alone, but rather the combined renewal of
Precincts and Frame Areas that will collectively deliver a transformational
effect along the Corridor.
Figure 1 identifies the extent of the Study Area, Corridor, Precincts, and
Frame Areas. Figure 1 also illustrates the extent of the Transport Study Area
used by Transport NSW for the purposes of the Draft
Transport Plan (which is a wider catchment than the Study Area used for the
draft Strategy). Table 1 identifies the LGAs that the Precincts are located
within.
Precinct Corresponding LGAs
Granville Parramatta City Council
Holroyd Council
Auburn Auburn City Council
Homebush Strathfield Municipal Council
City of Canada Bay Council
Burwood Burwood Council
City of Canada Bay Council
Kings Bay
Burwood Council
City of Canada Bay Council
Ashfield Council
Leichhardt Leichhardt Municipal Council
Marrickville Council
Taverners Hill
Leichhardt Municipal Council
Marrickville Council
Ashfield Council
Camperdown City of Sydney
Leichhardt Municipal Council
Table 1: Parramatta Road Corridor precincts by Local Government Area

NPR Kinesis - Precinx Strategy Report 20150828.docx August 14 | PAGE 7
Figure 1: Parramatta Road Corridor Study Area and Corridor

NPR Kinesis - Precinx Strategy Report 20150828.docx August 14 | PAGE 8
1.3. PARRAMATTA ROAD URBAN TRANSFORMATION PROGRAM
The Parramatta Road Urban Transformation Program (PRUTP) is the
integrated, cross-agency project established by the NSW Government in
2013 to explore, capture and deliver on opportunities for urban
transformation along the Corridor resulting from the WestConnex Motorway
and in line with A Plan for Growing Sydney.
The PRUTP incorporates three key deliverables:
An Urban Transformation Strategy for the Parramatta Road Corridor
to establish a framework for the future growth and development of
the Corridor. This document is known as the Draft New Parramatta
Road Urban Transformation Strategy.
A transport infrastructure program for the Corridor. This document is
known as the Draft Sydney CBD to Parramatta Strategic Transport
Plan.
A $200 million1 program of local urban amenity improvement works
to deliver tangible public domain improvements to the Corridor
aligned with its staged redevelopment. This document is known as
the Draft Parramatta Road Urban Amenity Improvement Plan.
The PRUTP is led by UrbanGrowth NSW, the NSW Government's urban
transformation delivery organisation. UrbanGrowth NSW leads an Integrated
Project Team (IPT) that includes Transport for NSW, Roads and Maritime
Services, WestConnex Delivery Authority, the Department of Planning and
Environment (DPE), and the ten Councils along the Corridor.
1 In 2015 dollars
1.3.1 The Draft New Parramatta Road Urban Transformation Strategy
The draft New Parramatta Road Urban Transformation Strategy (draft
Strategy) articulates the long term growth vision for the Corridor. The purpose
of the draft Strategy is to facilitate the coordinated transformation of
Parramatta Road and its adjoining lands by integrating land use and built
form with transport initiatives and public domain improvements. This
integrated approach recognises the importance of the Corridor as a single
strategic entity, by combining the benefits of applying a subregional response
to ‘big picture’ issues with the depth of local knowledge required to plan for
existing and future communities.
More specifically, the draft Strategy contains:
a long-term vision for the transformation of the Parramatta Road Corridor;
an Integrated Land Use and Transport Concept Plan that includes land
use and development intensity, public and active transport initiatives,
green space and links, key infrastructure and eight growth Precincts;
guiding land use, transport and development and public domain
principles that will apply to all land within the Corridor;
Precinct Plans and associated building envelopes for each Precinct,
providing more detailed principles and targets for growth and
development, and actions for implementation; and
an action-oriented framework for implementation and delivery including a
high level program that should be considered in the assessment of land
use and development proposals across the Corridor.
The draft Strategy will build on five principles to meet this vision:
Plan for a diversity in housing and employment.
Make the Corridor accessible and connected.
Focus on community and places.
Sustainability and resilience.
Deliver, drive, facilitate and monitor action.
The full urban transformation of Parramatta Road to 2050 will deliver far-
reaching benefits for Sydney:
The vision for the Parramatta Road Corridor is:
A balanced, high quality multi-use corridor with improved amenity, better
transport choices, more job opportunities and an increased quantity and
diversity of housing.
sballango
Text Box
A high quality multi-use corridor with improved transport choices, better amenity and balanced growth of housing and jobs
sballango
Text Box
sballango
Text Box

NPR Kinesis - Precinx Strategy Report 20150828.docx August 14 | PAGE 9
a targeted 40,000 homes, well-located to transport and services, with a
diverse mix of housing types and choices, including affordable homes;
$64 billion in economic benefits to the State, arising from new residential
development;
a productive business environment, to support viable and prosperous
businesses, and a variety of employment opportunities that will deliver
50,000 new jobs;
more efficient and reliable public transport, providing both east-west and
north-south connections; and
eight well-serviced and well-connected Precincts, each with diverse
spaces, places and links for people to live in, work in, visit, connect with
and enjoy.
1.3.2 The Draft Parramatta – Sydney CBD Strategic Transport Plan
The draft Parramatta – Sydney CBD Strategic Transport Plan (draft Transport
Plan) sets the strategic context for current plans, proposals and interventions
in the Sydney CBD to Parramatta Corridor. It is an integrated transport and
land use plan that considers a holistic view of growth and renewal in the
Corridor, as well as metropolitan, regional and local influences on future
transport, housing and employment.
The draft Plan identifies a framework to guide future transport requirements
and appropriate interventions at the regional, intermediate and local levels to
guide future investment and to meet changing demands. Accordingly, the
Draft Plan has informed the Draft Parramatta Road Urban Transformation
Strategy.
1.3.3 The Draft Urban Amenities Improvement Program
The draft Urban Amenities Improvement Program (UAIP is a $200 million
initiative under the Draft New Parramatta Road Urban Transformation
Strategy to stimulate the transformation of the Parramatta Road Corridor.
The UAIP identifies a suite of early local amenity improvement works to help
realise the vision of the Parramatta Road Corridor. The UAIP recognises that
the Precincts and existing communities along the Corridor must respond to
population growth and change. It also recognises that some existing
infrastructure is ageing or unable to respond to the needs of communities as
they grow and change. Local amenity infrastructure is therefore required to
be delivered quickly to achieve positive social and economic outcomes.
UrbanGrowth NSW has jointly prepared the UAIP with the collaborating
councils along the Corridor: the City of Sydney, Marrickville Council, Ashfield
Council, City of Canada Bay Council, Burwood City Council, Strathfield
Council, Auburn City Council, Parramatta City Council and Holroyd City
Council.

NPR Kinesis - Precinx Strategy Report 20150828.docx August 14 | PAGE 10
1.4. PURPOSE OF THIS REPORT
Sustainability analysis has been undertaken to determine the benefits of
urban transformation proposed within the Corridor. This Report describes the
interventions that could be implemented to ensure future communities within
the Corridor are sustainable, affordable and resilient.
The Report establishes metrics to define the success of the Draft New
Parramatta Road Urban Transformation Strategy based on four key measures
of success:
Transport use (vehicle kilometres travelled per person per day);
Water consumption (ML per person per year);
Greenhouse gas emissions (tonnes per person per year); and
Household affordability ($ per household per year).
1.5. OUR APPROACH
Analysis included in this report was undertaken using UrbanGrowth NSW’s
integrated sustainability, infrastructure and design tool, PRECINX. PRECINX is
a tool used to evaluate the sustainability of a neighbourhood or large urban
transformation projects. It is designed to test a project’s social, economic and
environmental performance against existing conditions, a business-as-usual
base case, and can also calculate and the assess performance of an
optimised scenario that relies on the introduction of additional interventions
above and beyond existing or base requirements.
PRECINX was integrated into the various project streams prepared
under the PRUTP to provide a measurable and quantifiable basis to
determine the potential benefits of the PRUTP and identify strategies to
improve its performance and outcomes (see Figure 2).
Key land use and transport themes and principles were identified and
adopted by the Integrated Project Team to apply to the PRUT. The analysis
and strategies outlined in this report expand on and seek to measure these
key principles. In order to assess the success and benefits of PRUT, Kinesis
identified 19 indicators under four of the five Draft Strategy’s principles:
1. Plan for a diversity of housing and jobs to meet existing and future needs
(measured through land use mix, employment and housing provision).
2. Reshape and better connect places and associated movement networks
to better serve customers and encourage sustainable travel (measured
through car dependence, mobility choice, access to public transport and
pedestrian and cycling facilities).
3. Promote quality places and built form outcomes to transform the Corridor
over time (measured through the provision of pedestrian facilities, open
space and street improvements).
4. Create liveable local Precincts along the Corridor that are sustainable,
resilient and make Sydney a better place (measured through greenhouse
gas emissions, resource consumption, car dependence and affordability
outcomes).

NPR Kinesis - Precinx Strategy Report 20150828.docx August 14 | PAGE 11
Figure 2: Relationship of PRECINX to PRUTP project streams

NPR Kinesis - Precinx Strategy Report 20150828.docx August 14 | PAGE 12
It should be noted that the fifth principle - Establish an effective
implementation, governance, monitoring and reporting framework – was not
measured by PRECINX given that it relates primarily to the administration of
the Draft Strategy.
For the PRUTP, Kinesis has used PRECINX to test each of the proposed
Precincts as well as determine the average performance of the Corridor. This
has comprised testing three scenarios:
1. Existing Conditions, which measures how the Precincts perform currently
in terms of travel behaviours and patterns, energy and water
consumptions and costs, and proportion of landscaping and tree canopy
cover.
2. PRUTP Base Case which assumes urban transformation takes place
through development that proceeds under existing planning and
development controls, such as current BASIX, Section J (BCA) and car
parking requirements.
3. PRUTP Optimised which assumes urban transformation takes place
through development that is includes sustainability interventions at
either the Corridor and/or the precinct scale. The sustainability
interventions are policy, planning or development controls that could be
implemented by Council or the Department of Planning and Environment
as part of a future strategic or statutory planning processes.
Finally, to establish whether or not PRUTP will, at a metropolitan level, have a
positive or negative impact on the city, the results of each scenario were
benchmarked against the Sydney Metropolitan Average (where available).
In order to determine the future potential of the Corridor, population, dwelling
and employment growth over the next 30 years has been established using a
complex growth model prepared by AECOM for UrbanGrowth NSW. The model
is underpinned by a series of assumptions and is a capacity based tool that
provides an indication of the potential growth which could be achieved under
the Draft Strategy to 2050.
For the purposes of testing the Precincts, and particularly the PRUTP Base
Case and PRUTP Optimised scenarios, Kinesis has worked with UrbanGrowth
NSW’s urban designers Cox, to develop an indicative urban transformation
test scenario. The test scenarios are provided in Table 2 but do not form part
of the Draft Strategy. The primary purpose of the test scenarios is to test how
future transformation could perform based on a range of business-as-usual
or innovative sustainability interventions.
The interventions modelled for each Precinct are a combination of those
discussed in later sections of this report.
NPR Kinesis - Precinx Strategy Report 20150828.docx August 14 | PAGE 13
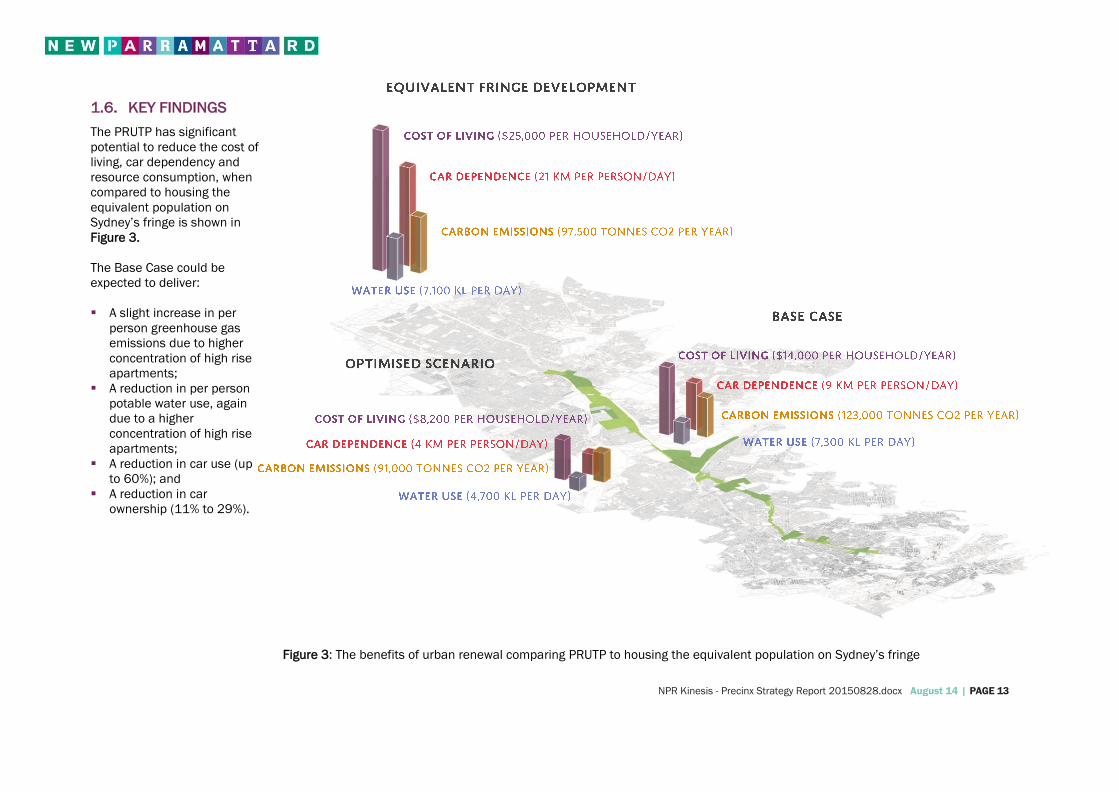
1.6. KEY FINDINGS
The PRUTP has significant
potential to reduce the cost of
living, car dependency and
resource consumption, when
compared to housing the
equivalent population on
Sydney’s fringe is shown in
Figure 3.
The Base Case could be
expected to deliver:
A slight increase in per
person greenhouse gas
emissions due to higher
concentration of high rise
apartments;
A reduction in per person
potable water use, again
due to a higher
concentration of high rise
apartments;
A reduction in car use (up
to 60%); and
A reduction in car
ownership (11% to 29%).
Figure 3: The benefits of urban renewal comparing PRUTP to housing the equivalent population on Sydney’s fringe

NPR Kinesis - Precinx Strategy Report 20150828.docx August 14 | PAGE 14
1.6.1 Key Interventions for World Class Urban Renewal
In order to deliver world class urban renewal outcomes along the Corridor,
the opportunity exists to strive for sustainability outcomes that exceed
current requirements. Several key strategies have been identified and
recommended as potential additional options to optimise development
outcomes along the Corridor, as outlined below.
1. High Performance Buildings
Ensuring all new development is built to achieve higher than Base Case
performance outcomes via increased BASIX and establishment of NABERS
targets.
This intervention has the potential to deliver:
24 to 27% reduction in greenhouse gas emissions from lower electricity
and gas consumption;
31 to 40% reduction in potable water consumption;
18 to 39% reduction in peak electricity demand
19% to 33% reduction in peak sewer load requirements, reducing the
need for significant infrastructure upgrades; and
37 to 48% lower household costs and associated strata fees associated
with energy, water and transport.
2. Reduced and Decoupled Strategic Parking
Reducing and decoupling car parking improves development feasibility,
increases housing affordability and supports public transport objectives,
established for the PRUTP.
This intervention has the potential to deliver:
Reduced vehicle traffic and household car ownership rates throughout a
Precinct;
Lower construction costs associated with excavation and construction of
underground parking;
Between a $50,000 to $70,000 reduction in the sales price of a new
apartment;
Less energy demand for parking lighting and ventilation, equating to
lower compliance costs with BASIX Energy Targets and lower energy
costs for an apartment body corporate.
The potential for private investment in the delivery of approximately car
share pods, each servicing 8-12 households across the Precinct.
3. Urban Resilience and Infrastructure Delivery
Delivering recycled water and significant tree canopy to ensure a resilient
and cool urban environment and public domain – an urban oasis that is
cooler, more comfortable and more walkable on hot summer days.
This intervention has the potential to deliver:
Significantly reduced potable water consumption for public space
irrigation;
Reduced electricity consumption and peak infrastructure demands from
air conditioning through cooler streets;
Significantly reduced sewer infrastructure requirements to the Corridor;
Reliable and consistent source of water for public domain irrigation
which is not reliant on rainfall patterns and is resilient to future
variations in rainfall; and
Reduced heat island effect and impacts of heat waves.

NPR Kinesis - Precinx Strategy Report 20150828.docx August 14 | PAGE 15
2. Understanding the Corridor
This section provides context to the development of the strategies and
infrastructure solutions for PRUTP.
The Corridor is identified in A Plan for Growing Sydney as an urban renewal
corridor that will be the focus for increased housing, economic activity and
social infrastructure. The Corridor is proposed to be transformed through the
implementation of the Draft New Parramatta Road Urban Transformation
Strategy over the next 30 years. In 2050, the Corridor will have an estimated
resident population of 70,000, approximately 40,000 new dwellings and
30,000 new jobs.
For the scope of this project, three key trends have been identified that
require particular consideration:
Travel, car ownership and parking trends
Climate variability and trends
Cost of living and affordability
2.1 TRAVEL, CAR OWNERSHIP AND PARKING
Car ownership rates have been analysed by ABS Census statistical area
(SA) 1 zones. Data is shown for 2011.
Car ownership rates (average vehicles per household) vary significantly
along the Corridor (Figure 4).
There are a number of areas along the Corridor where existing
households own less than 1 vehicle. This is primarily in areas close to
the existing rail line and within walking distance of high frequency public
transport.
Households without vehicles are highest in the City of Sydney Local
Government Area, however there are other pockets along the Corridor
with high proportions of these households, including Parramatta,
Granville, Strathfield and Ashfield (Figure 5).
At a metropolitan level the following additional trends were also
observed:
1. Vehicle license rates for the younger demographic are falling.
Across the Sydney Metropolitan Area, 1 in 4 people aged 18 to 35
do not have a license or own a car (Bureau of Transport Statistics,
2009).
2. Currently, approximately 8% of City of Sydney residents are car
share members. This is as high as 20% in high density, highly
accessible locations such as Darlinghurst and Surry Hills.
Travel patterns have been analysed to understand travel and
containment patterns along the corridor. This data was sourced from
the Bureau of Transport Statistic’s Household Travel Survey and the ABS
Census Journey to Work (2011).
Employment containment can be measured by the percent of population
who walk or cycle to work. High levels of containment currently exist
within the City of Sydney Local Government Area and adjacent inner city
locations. However, similar levels of containment can also be seen in
and around the Parramatta CBD and Granville Precincts (Figure 6).
Lower commute and trip times were observed in and around the Sydney
and Parramatta CBDs. These times increase away from major
employment hubs (Figure 7 and 8).

NPR Kinesis - Precinx Strategy Report 20150828.docx August 14 | PAGE 16
Figure 4: Average existing car ownership rates (ABS Census 2011)

NPR Kinesis - Precinx Strategy Report 20150828.docx August 14 | PAGE 17
Figure 5: Percent of housing with no vehicles (ABS Census 2011)
Parramatta (30-40%)
Granville (30-40%)
Strathfield (30-40%)
Ashfield (30-40%)

NPR Kinesis - Precinx Strategy Report 20150828.docx August 14 | PAGE 18
Figure 6: Percent of persons who walk or cycle to work (ABS census 2011)
Parramatta + Granville (10-15%)
Leichhardt (10-15%)

NPR Kinesis - Precinx Strategy Report 20150828.docx August 14 | PAGE 19
Figure 7: Average commute time in minutes (source: ABS census 2011)

NPR Kinesis - Precinx Strategy Report 20150828.docx August 14 | PAGE 20
Figure 8: Average trip time in minutes for all tripe (ABS census 2011)

NPR Kinesis - Precinx Strategy Report 20150828.docx August 14 | PAGE 21
2.2 CLIMATE VARIABILITY AND TRENDS
Urban centres are hotter than their rural surrounds because dark roofs, car
parks, paved areas and roads absorb and keep heat in the area. Lack of
shade and high density buildings trapping heat increase the effect. This is
intensified in areas like Western Sydney that do not have access to coastal
breezes or nearby large bodies of water whose thermal mass serve to
regulate temperature. Analysis of temperature records over the last 40 years
shows that Western Sydney has seen a rise in annual temperatures above
that experienced in coastal parts of the city (Figure 9). Residents of
Blacktown, Richmond, Camden, Liverpool and Parramatta have all
experienced this effect: the gap between coastal and Western Sydney
temperatures has widened, and the number of extreme hot days has
increased in the west2.
From a climate projection perspective, the Corridor is located in the East
Coast South sub-cluster. Climate projections published by the Department of
Environment in partnership with CSIRO and the Bureau of Meteorology
outline the following changes for this sub-cluster:
Average temperatures will continue to increase in all seasons.
More hot days and warm spells are projected with very high confidence.
Fewer frosts are projected.
Decreases in winter rainfall are projected.
Increased intensity of extreme rainfall events is projected.
Mean sea level will continue to rise and height of extreme sea-level
events will also increase.
A harsher fire-weather climate in the future.
On annual and decadal basis, natural variability in the climate system can act
to either mask or enhance any long-term human induced trend, particularly in
the next 20 years and for rainfall.
2 Climate Commission, The Critical Decade, NSW Climate Impacts and Opportunities
Figure 9: Measured days of 35 degrees for Parramatta and Sydney from 1968 to
2011 (source: BOM)
Figure 10: Relative land surface temperature from thermal imagery (aerial imagery
acquired on 22/08/2013, 1:35 - 2:21 pm)

NPR Kinesis - Precinx Strategy Report 20150828.docx August 14 | PAGE 22
In addition, Major heat waves are Australia’s deadliest natural hazards. Major
heat waves have caused more deaths since 1890 than bushfires, cyclones,
earthquakes, floods and severe storms combined3. People living in urban
environments can be more susceptible than non-urban dwellers to the
effects of heatwaves as a result of the urban heat island. The urban heat
island is effectively the difference between the land surface temperature and
the average air temperature. This is caused by the prevalence in cities of
heat-absorbing materials such as dark coloured pavements and roofs,
concrete, urban canyons trapping hot air, and a lack of shade and green
space in dense urban environments.
Studies undertaken by the Parramatta City Council highlight a strong
correlation between surface types and vegetation with lower land surface
temperatures. Error! Reference source not found. shows the land surface
emperature in and around the Granville Precinct in the middle of a spring
day, highlighting the temperature variation between vegetated and non-
vegetated urban environments.
2.3 COST OF HOUSING AND COST OF LIVING
Affordability is often considered only in the context of the cost of housing.
However, when looking at average expenditure, costs associated with private
vehicle usage can comparable to mortgage or rental housing costs (see
Figure 11). Like housing, expenditure on transport is highly context specific.
It is also important to understand how planning for new development can
affect household expenditure. For the PRUTP, how buildings are designed
and where development occurs will affect household costs related to
housing, transport and utilities (energy and water).
3 Department of Infrastructure and Regional Development (2013) State of Australian Cities
Figure 11: NSW average household expenditure (ABS Household Expenditure Survey 09-10).
Housing19%
Transport16%
Utilities2%
Food and Beverages
20%
Clothing4%
Household Equipment
10%
Medical5%
Recreational13%
Other11%
=35%

NPR Kinesis - Precinx Strategy Report 20150828.docx August 14 | PAGE 23
To better understand this variable, housing, transport and utility expenditure
analysis was undertaken along the Corridor. Given the availability of data,
this analysis was undertaken for each local government area and
incorporated the following:
Housing costs were calculated based on the purchase of a home at the
median house and unit sales price in the LGA for the last 12 months,
assuming 5% deposit, 30 year loan, 5% interest rate.
Transport costs were calculated based on existing car ownership and
travel patterns (car use and public transport use) in the LGA.
Utility costs were calculated based on existing average energy and water
consumption for the average household in the LGA, assuming current
retail tariffs.
For the purpose of this analysis, all other household expenditure
including food, clothing, household items, medical and recreation was
assumed to be the same across all areas (based on ABS Household
Expenditure Survey).
The results of this analysis are shown in Figures 12 to 15 showing housing
and transport costs separately and as combined results. The results
highlight the following:
The general trend shows high household costs at the eastern end of the
Corridor and higher transport costs at the western end of the Corridor.
Both car ownership rates and travel patterns are a strong indicator of
cost of living. After housing, transport is the highest household cost and
the ability to affect transport costs can drive significant affordability
outcomes.
Utility costs are low when compared to housing and private vehicle
ownership costs. However, significant household savings can still be
achieved through more efficient housing design.
NPR Kinesis - Precinx Strategy Report 20150828.docx August 14 | PAGE 24
Figure 12: Estimated household expenditure highlighting housing, transport and utility
costs compared to other expenses
$0
$500
$1,000
$1,500
$2,000
$2,500
$3,000
Esta
imte
d h
ou
seh
old
exp
end
itu
re p
er w
eek Housing
Transport
Utilities
Other

NPR Kinesis - Precinx Strategy Report 20150828.docx August 14 | PAGE 25
Figure 13: Estimated weekly mortgage costs based on based on the purchase of a
home at the median house and unit sales price in the LGA
Mortgage

NPR Kinesis - Precinx Strategy Report 20150828.docx August 14 | PAGE 26
Figure 14: Estimated weekly transport costs based on existing car ownership and
travel patterns (car use and public transport use) in the LGA

NPR Kinesis - Precinx Strategy Report 20150828.docx August 14 | PAGE 27
Figure 15: Relative household expenditure along the corridor highlighting housing,
transport and utility costs compared to other expenses
Transport
Housing36%
Transport20%
Utilities2%
Other42%
Housing32%
Transport22%
Utilities2%
Other44%
Housing35%
Transport21%
Utilities2%
Other42%
Housing51%
Transport15%
Utilities1%
Other33%
Housing47%
Transport15%
Utilities2%
Other36%
Housing50%
Transport13%
Utilities1%
Other36%
Housing45%
Transport11%
Utilities2%
Other42%
Housing

NPR Kinesis - Precinx Strategy Report 20150828.docx August 14 | PAGE 28
3. Quantifying the Benefits of PRUTP PRECINX has been applied to the PRUTP as the basis from which
UrbanGrowth NSW can determine potential future strategies that could be
implemented by Councils or the DPE when carrying out future strategic or
statutory planning processes. The suite of potential strategies have been
measured to determine whether they would deliver a tangible benefit or
improvement.
Through workshops and discussions with the IPT, there was clear consensus
that the PRUTP should seek to delivery “liveable communities” along the
Corridor. Significant research has gone into defining indices and measures
of liveability. Drawing on these previous studies, the following definition is
used to define liveability:
“Liveability is the sum of the aspects that add up to the quality of life of a
place, including its economy, amenity, environmental sustainability,
health and wellbeing, equity, education and learning, and leadership”.
A significant body of local and international work exists on community
indicator frameworks to support the delivery of liveable communities. A high
level desktop review of these frameworks identifies a number of key themes
that relate to establishing a liveable community:
Quality of life
Built and natural environment
Economic prosperity
Access and opportunities
Adaptability and flexibility
For the PRUTP, it is important to recognise the realistic and tangible
outcomes that could be achieved. The IPT therefore developed a series of
principles under the following key themes that relate to delivering liveable
outcomes for the Corridor:
Measurable Indicator Principle
Addressed
Land Use Mix within precinct (%)
Number of jobs within each precinct (number)
Percent of dwelling types within each precinct (%)
Estimated percent reduction in vehicle kilometres travelled (%)
Estimated percent reduction in vehicle hours travelled (%)
Estimated car ownership rates (vehicles per household)
Potential car share take-up rate (%)
Average walk and wait time to frequent public transport (minutes)
Kilometres of safe, connected cycle ways within each precinct (km)
Kilometres of safe, connected pedestrian paths within each precinct (km)
Kilometres of green streets with high tree planting and canopy cover (km)
Amount of open space (ha)
Distance to open space (m)
Estimated greenhouse gas emissions (tonnes CO2-e/person/year)
Estimated water consumption (litres/person/day)
Percent of water reused/recycled within the precinct (%)
Estimated peak electricity demand (MW)
Estimated peak sewer loads (L/min)
Estimated cost of living ($ per household per year)
Diverse Housing and Jobs
Accessible and Connected
Community and Places
Resilient and Sustainable
Table 2: Established measures of success for the PRUTP

NPR Kinesis - Precinx Strategy Report 20150828.docx August 14 | PAGE 29
Diverse Housing and Jobs
Accessible and Connected
Community and Places
Resilient and Sustainable
Deliver, Drive, Facilitate and Monitor Action
Kinesis worked closely with UrbanGrowth NSW to establish measurable
indicators for each theme to quantify the outcomes of the project. These
indicators are outlined in Table 2.
The PRUTP indicators have been used as the principle basis for analysing the
benefits of the precinct plans along the Corridor and helping to identify key
sustainability and infrastructure strategies to improve the liveability
outcomes for PRUTP. This analysis is provided in the following sections of this
report.

NPR Kinesis - Precinx Strategy Report 20150828.docx August 14 | PAGE 30
4. Precinct Analysis
For each Precinct along the Corridor, scenario analysis has been performed
using the strategic infrastructure and urban design tool PRECINX. PRECINX is
used in the analysis of key performance metrics of precincts, integrating land
use and development inputs with demographic, utility, transport and
affordability models.
Land use and development scenarios have been developed and provided by
Cox Richardson Architects and Planners for each of the Precincts along the
Corridor. In order to better understand the outcomes of the proposed
Precinct Plans, Kinesis has adopted the assumptions listed below for
modelling purposes. It should be noted that the assumptions do not have a
significant impact on the strategies or results outlined in this report.
Drawing on the precinct plan information provided by Cox Richardson
Architects and Planners, analysis was undertaken across each of the
measures of success and indicators outlined in the previous section for two
key scenarios:
1. PRUTP Base Case Scenario
Estimated dwelling and floor space as provided by Cox Richardson
Architects and Planners.
Parking rates based on existing local parking ratios.
All new development was modelled to meet BASIX and Section J building
compliance.
2. PRUTP Optimised Scenario
Drawing on the results of the Base Case Scenario, Kinesis identified a
series of interventions and opportunities for each scenario to deliver
optimised outcomes for the PRUTP.
These interventions are:
1. High Performance Buildings
2. Reduced and decoupled strategic parking
3. Urban Resilience and Infrastructure Delivery
The key interventions and opportunities explored in the Optimised Scenario
are outlined below.
4.1 PRECINCT ANALYSIS RESULTS
The results of the Base Case Scenario and Optimised Scenario analysis are
documented for each precinct in Section 6 of this report. When reviewing
these results, several comparisons can be made in the analysis of the
indicators:
Are we making the city better or worse, this can be measured against
what exists (Existing Scenario) and the Sydney Metropolitan Average.
How does the PRUTP enable better outcomes, this can be measured
against the Base Case which highlights the performance of the PRUTP if
development was delivered under current controls and the additional
strategies outlined in the previous section of this report where not
implemented.

NPR Kinesis - Precinx Strategy Report 20150828.docx August 14 | PAGE 31
4.2 HIGH PERFORMANCE BUILDINGS
Development along the Corridor will see significant growth in low, mid and
high rise apartment living. Over 65% of dwellings are expected to be located
in high or medium high rise residential building and apartment living is often
seen as more sustainable than single houses, given the proximity to
transport and services.
However, studies have shown that at a building level, energy consumption
per person can be greater in high-rise apartments due to large common area
energy demands associated with underground parking and common area
lighting and ventilation demands4. This energy demand is often a significant
component of residential apartment strata fees and provides a significant
opportunity for both energy and cost savings for residents. In addition, high
density development has limited potential for local energy generation from
solar as the roof area to energy demand ratio is low.
Water demand, on the other hand, is typically lower in high density buildings
as there is little demand for garden irrigation. At the same time, however,
high density development has little opportunity to collect and reuse rainwater
as the roof area to water demand ratio is low.
In addition, strata buildings are typically more challenging to retrofit than
single dwellings due to multiple owners and the long, complex decision-
making processes associated with strata buildings.
To address this, the environmental performance standard can be cost-
effectively improved such that new buildings have a significantly higher
performance at the start of their life. This is currently addressed by BASIX,
requiring new buildings to be designed to achieve a 40% reduction in water
demand and a 20% to 40% reduction in stationary greenhouse gas
emissions. Recent trends in both energy consumption and new development
specifications have highlighted the ability for these targets to be more
stringent to drive excellence in building performance and deliver more
4 Myors et al (2005) Multi Unit Residential Building Energy and Peak Demand Study
(http://www.transgrid.com.au/network/nsdm/Documents/Multi%20Unit%20Investigation%20Summary%20Report.PDF)
sustainable, resilient and affordable building outcomes.
This can be seen in following three key areas:
1. Current average consumption is approaching BASIX targets. Residential
electricity and gas consumption has, on average, reduced in recent years
due to price signals, appliance and lighting efficiency and solar PV. The
current average Sydney resident’s stationary greenhouse gas emissions
are approximately equivalent to BASIX Energy 25, i.e. existing homes
perform the same as a new home that meets the BASIX Energy targets for
mid-rise development.
2. Recent developments are achieving beyond BASIX compliance. Since the
introduction of BASIX, Sydney has seen an increasing trend in over-
compliance, particularly in BASIX Energy, i.e. new developments are
achieving higher BASIX targets. In 2013/14, over 60% of new dwellings
exceeded minimum requirements with BASIX Energy targets, with 23%
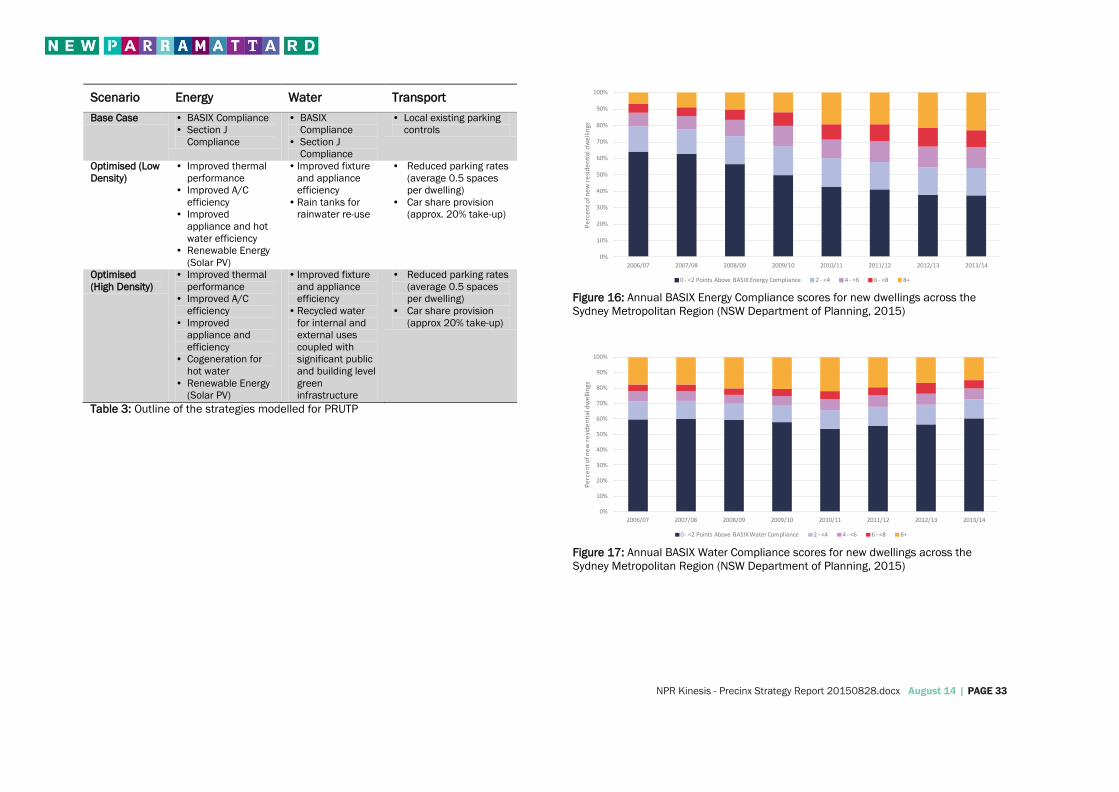
exceeding by 8 or more points (Figure 16), reflecting the building
industry’s capacity and willingness to deliver high performance building
outcomes.
3. Local Councils are driving higher performance standards. Councils have
established planning controls that provide incentives to developments
that exceed BASIX compliance. Bankstown Councils LEP 2001, Clause
30A provides for a FSR Bonus of 0.5:1 in the Bankstown CBD where
developers can demonstrate that commercial buildings achieve 5-star
NABERS Energy rating and 4.5-star NABERS Water rating and residential
buildings achieve 10-point increase for BASIX Energy and BASIX Water 60
(see Case Study below).

NPR Kinesis - Precinx Strategy Report 20150828.docx August 14 | PAGE 32
Given this context, best practice technology and design strategies were
analysed by PRECINX to determine appropriate performance standards for
new development along the Corridor. These strategies are equivalent to the
following performance standard outcomes:
Residential buildings
BASIX Energy: increase current target by up to 20 BASIX points
BASIX Water: increase the target to 60
Non-Residential buildings (greater than 2,000m2)
NABERS Energy: minimum 5-star performance
NABERS Water: minimum 5-star performance
BASIX was always envisaged to be spatially and typology relevant. This is
evidenced by the existing variation in targets between climate zones (for
water) and typologies (for energy). Further, the original thinking behind BASIX
was that it was envisaged to interact with land use and transport
infrastructure. PRUTP is the project to enable this.
Given the scale of development, it is recommended that a higher BASIX and
increased NABERS target should be considered in line with the analysis
outlined in this report.
CASE STUDY
Linking Environmental Performance to Development Incentives
Clause 30A of Bankstown Local Environmental Plan (LEP) 2001 provides for
Floor Space Ratio (FSR) Bonus of 0.5 on the FSRs allowed under the Local
Area Plan for the Bankstown CBD on the condition that they achieve the
following environmental design standards:
Residential component of a building:
• Energy target is a minimum 10-point increase in the BASIX score
compared to current requirements.
• Water target is a minimum BASIX 60.
Non-Residential component of a building:
• Energy target is a maximum 135 kg of CO2/m2 per year (equivalent
to a 5-star NABERS rating for commercial buildings)
• Water target is a maximum 0.47 kL/m2 per year for office
(equivalent to a 4.5-star NABERS rating for commercial buildings)
As the FSR Bonus will increase the size of new buildings this will lead to
increased environmental impact, in terms of increased greenhouse gas
emissions from energy consumption and increased water consumption. The
environmental performance standards established by Council seek to offset
the impact of the increased floor space so that buildings which receive the FSR
Bonus have the same environmental performance as buildings which do not.
NPR Kinesis - Precinx Strategy Report 20150828.docx August 14 | PAGE 33
Scenario Energy Water Transport
Base Case • BASIX Compliance
• Section J
Compliance
• BASIX
Compliance
• Section J
Compliance
• Local existing parking
controls
Optimised (Low
Density)
• Improved thermal
performance
• Improved A/C
efficiency
• Improved
appliance and hot
water efficiency
• Renewable Energy
(Solar PV)
• Improved fixture
and appliance
efficiency
• Rain tanks for
rainwater re-use
• Reduced parking rates
(average 0.5 spaces
per dwelling)
• Car share provision
(approx. 20% take-up)
Optimised
(High Density)
• Improved thermal
performance
• Improved A/C
efficiency
• Improved
appliance and
efficiency
• Cogeneration for
hot water
• Renewable Energy
(Solar PV)
• Improved fixture
and appliance
efficiency
• Recycled water
for internal and
external uses
coupled with
significant public
and building level
green
infrastructure
• Reduced parking rates
(average 0.5 spaces
per dwelling)
• Car share provision
(approx 20% take-up)
Table 3: Outline of the strategies modelled for PRUTP
Figure 16: Annual BASIX Energy Compliance scores for new dwellings across the
Sydney Metropolitan Region (NSW Department of Planning, 2015)
Figure 17: Annual BASIX Water Compliance scores for new dwellings across the
Sydney Metropolitan Region (NSW Department of Planning, 2015)
0%
10%
20%
30%
40%
50%
60%
70%
80%
90%
100%
2006/07 2007/08 2008/09 2009/10 2010/11 2011/12 2012/13 2013/14
Pe
rce
nt o
f ne
w r
esi
de
nti
al d
we
llin
gs
0 - <2 Points Above BASIX Energy Compliance 2 - <4 4 - <6 6 - <8 8+
0%
10%
20%
30%
40%
50%
60%
70%
80%
90%
100%
2006/07 2007/08 2008/09 2009/10 2010/11 2011/12 2012/13 2013/14
Pe
rce
nt o
f ne
w r
esi
de
nti
al d
we
llin
gs
0 - <2 Points Above BASIX Water Compliance 2 - <4 4 - <6 6 - <8 8+

NPR Kinesis - Precinx Strategy Report 20150828.docx August 14 | PAGE 34
.
4.3 REDUCED AND DECOUPLED STRATEGIC PARKING
Metropolitan trends in car ownership and the desire for more walkable and
urban environments lend themselves to a different approach to car
ownership, parking and mobility strategies:
Analysis along the Corridor highlights that there is already an existing market
for low car ownership with some areas having 30% to 40% of households
without a vehicle (Figure 18). This is particular significant in major centres
and areas with close proximity to public transport.
The RMS update to Guide to Traffic Generating Developments (2013)
surveyed 10 high-rise residential buildings around Sydney that were close to
public transport, greater than six storeys in height and almost exclusively
residential in nature. Whole only a small sample, this survey showed an
oversupply of car parking compared to demonstrated demand for car parking
in all the surveyed high-density residential buildings5.
At a metropolitan level, 1 in 4 people aged 18 to 35 do not have a license or
own a car (BTS, 2009).
Both car ownership rates and travel patterns are a strong indicator of cost of
living. After housing, transport is the highest household cost. The general
trend shows high housing costs at the eastern end of the Corridor and high
transport costs at the western end of the Corridor.
Currently, approximately 8% of City of Sydney residents are car share
members. This is as high as 20% in high density, highly accessible locations
such as Darlinghurst and Surry Hills.
Planning for the Precincts has the opportunity to achieve similar outcomes
and therefore should consider how to accommodate and leverage off the
above trends.
5 RMS (2013) Update Traffic Surveys
http://www.rms.nsw.gov.au/trafficinformation/downloads/td13-04a.pdf
Figure 18: Percent of housing with no vehicles (Source: ABS Census 2011)
Parramatta (30-40%)
Granville (30-40%)
Strathfield (30-40%)
Ashfield (30-40%)

NPR Kinesis - Precinx Strategy Report 20150828.docx August 14 | PAGE 35
4.2.1 A Different Approach to Parking
Based on the accessibility, density and mix of use proposed for each
Precinct, a different approach to parking could be pursued which seeks to
achieve the principles of the PRUTP and delivers the outcomes sought for the
Corridor. This strategic approach to parking and mobility incorporates the
following elements:
Reduced Parking Ratios
Under current planning controls, it is estimated that the Corridor will see a
ten-fold increase in the number of local vehicles. The Optimised PRUTP
Scenario adopts average parking rates of 0.5 spaces per dwelling, reducing
local parking and vehicles to approximately half of that under the Base Case.
The immediate benefits of lowering parking rates are significant:
Reduced vehicle traffic within the precinct;
Lower construction costs associated with excavation and construction of
underground parking;
The sales price of a new apartment could be reduced by $50,000 to
$70,000 by reducing its parking by one space;
Less energy demands for parking lighting and ventilation would equate
to lower compliance costs with BASIX Energy Targets and lower energy
costs for an apartment body corporate; and
The reduction in parking provides a business case for private
investment in the provision of car share.
Decoupled Parking
To mitigate the risk of providing low off-street parking ratios, decoupled,
adaptable and temporary car parking strategies are recommended.
Council or privately owned and operated parking stations at the periphery of
each Precinct (as opposed to the centre) would address short term parking
needs and enable the potential need for individual developments to supply
car parking on-site. This would also minimise the impact of traffic in the
Precinct and help support a gradual change in travel behaviour and patterns.
This could be funded by a development fee in lieu of providing parking on-
site, if considered appropriate.
Flexible Parking Ratio Provision
Generally parking ratios are established per dwelling. In addition to parking
being managed more efficiently at the precinct level, parking provision can
also be managed more efficiently at the building level.
Establishing parking rates for different dwelling types but allowing the
provision to be disaggregated across a building will allow development to
distribute the total delivered parking to different typologies allowing for a
higher mix of housing with, for example, 2 parking spaces provided for some
3 bedroom apartments and no parking for some 2 bedroom apartments. The
total provided parking would remain the same.
Parking Design Considerations
Several parking design considerations should be incorporated into the
planning and development of both decoupled and on-site parking across
each Precinct:
Parking could be provided above ground and sleaved as a buffer to
retail, commercial and residential development (Figure 19) as an
appropriate response to environmental constraints such as noise or
economic influences. This approach could be designed with appropriate
floor to ceiling heights to enable transition to other uses over time as
and when required. For example, if there is an identified long term
potential to accommodate a new supermarket and specialty retail
premises, above ground and sleaved parking would future proof land
and provide an interim use (car parking). This could then be

NPR Kinesis - Precinx Strategy Report 20150828.docx August 14 | PAGE 36
decommissioned relatively easily when economic and market conditions
support the introduction of the aforementioned retail space.
Standalone above ground parking can also be designed to be flexible
both in its current use (used for other community uses) or repurposed
for other uses over time as parking requirements are reduced. For
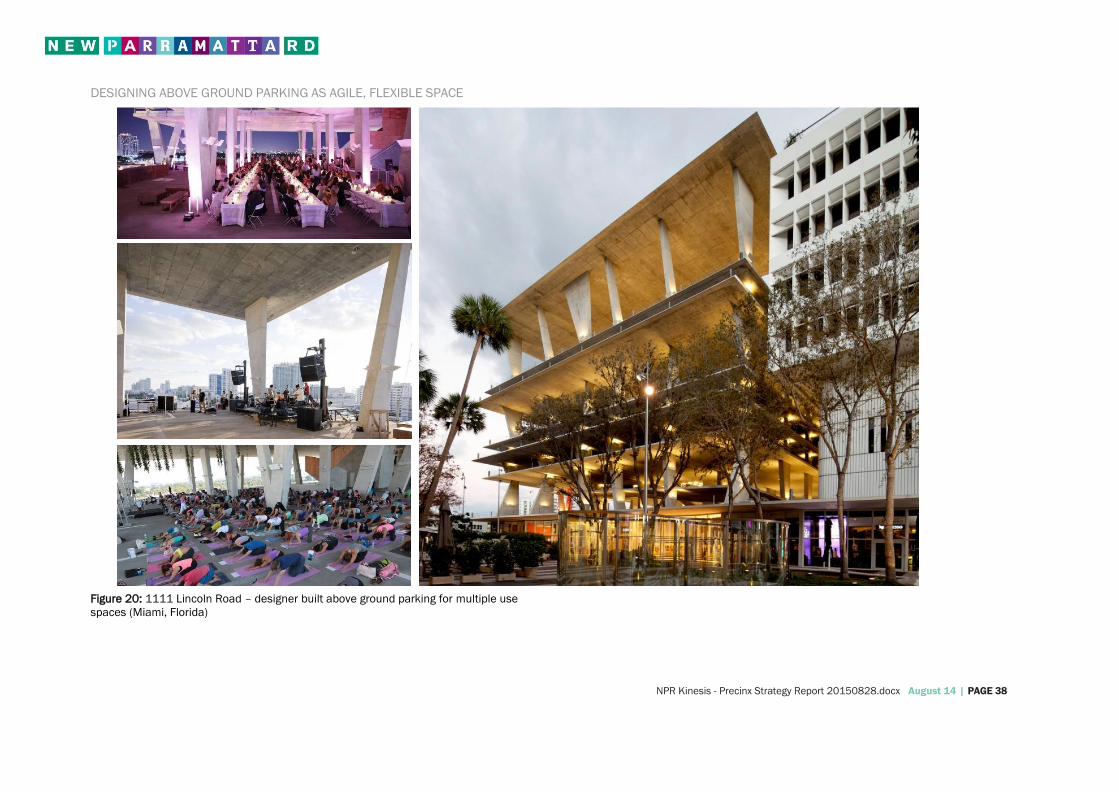
example (Figure 20), in Florida design firm, Herzog & de Meuron,
demonstrated how a parking area could be adapted and eventually
restricted into a community space, when a critical mass in the
population had been achieved, and sufficient alternative public and
active transport modes were available. Construction standards would
need to incorporate appropriate floor to ceiling heights to enable the
facility to be repurposed over time to and alternate use.
Car Share
Car share provides an alternative to traditional car ownership, allowing
residents or businesses to use a shared vehicle fleet. Car share relies on the
restriction of parking and car ownership in areas of high public transport and
mobility choice, and is considered an additional strategy that could be
explained as a means of supporting the transition to low car use and car
ownership rates.

NPR Kinesis - Precinx Strategy Report 20150828.docx August 14 | PAGE 37
USING PARKING TO SLEAVE DEVELOPMENTS ALONG PARRAMATTA ROAD
Figure 19: Using above ground parking to buffer residential development from
Parramatta Road (20m noise boundary)
Commercial/RetailActive
frontage
Mixed Use
Residential
NPR Kinesis - Precinx Strategy Report 20150828.docx August 14 | PAGE 38
DESIGNING ABOVE GROUND PARKING AS AGILE, FLEXIBLE SPACE
Figure 20: 1111 Lincoln Road – designer built above ground parking for multiple use
spaces (Miami, Florida)

NPR Kinesis - Precinx Strategy Report 20150828.docx August 14 | PAGE 39
4.4 URBAN RESILIENCE AND INFRASTRUCTURE DELIVERY
Under each Precinct Plan the number of dwellings and jobs is expected to
increase considerably which will drive an increase in population. If developed
under current building performance stands (BASIX and Section J), significant
infrastructure upgrades for electricity, water and sewer will be required to
support the increase in total and peak demands. High efficiency buildings,
local energy generation and recycled water or rain water re-use would reduce
the need for infrastructure upgrades.
The purpose of this strategy is to:
Assist in the delivery of high performance building and precinct
outcomes.
Reduce the need for significant infrastructure upgrades along the
corridor, in particular electricity peak demand and sewer augmentation;
and
Create resilient urban centres that support the improved public domain
outcomes identified along the Corridor.
4.4.1 Resilient Infrastructure Delivery
This strategy effectively decouples public domain from potable water. While
water reuse has traditionally been considered as a water conservation
objective, recycled water from black and grey wastewater provides the
opportunity to flip this goal on its head. In addition, urban renewal should
seek to deliver a resilient and cool urban environment and public domain –
an urban oasis that is cooler, more comfortable and more walkable on hot
summer days.
Climate projections from CSIRO and the Bureau of Meteorology (BOM)
highlight the need to build climate resilience into sustainable communities
and for Granville, future projections estimate that average temperatures will
continue to increase in all seasons and more hot days and warm spells.
Increased open space, green infrastructure and networks provides the
potential to improve resilience against a changing climate and, furthermore,
the effects of urban heat island. When compared to an un-vegetated public
domain, a well-managed, lush tree canopy can reduce land surface
temperature by up to 15 degrees on a 35 degree day.
Each Precinct has identified streets for reinforced streetscapes which include
enhanced green corridors with increased verge planting and WSUD
pavements. The delivery of this improved public space with inevitably higher
irrigation demands from broad leaf canopy, soft surfaces and green walls and
roofs can be effectively linked to recycled water to ensure an unlimited
supply of water for this public and private domain.
Further, linking recycled water systems to public domain management
enables a liveable, walkable, urban oasis. This is evident at Central Park
where the green wall is part of the recycled water system, allowing constant
irrigation and high use of treated recycled water on-site (further reducing
sewer infrastructure requirements).
The delivery of integrated recycled water and public domain has the potential
to deliver the following outcomes:
Significantly reduce potable water consumption for public space
irrigation;
Reduce electricity consumption and peak infrastructure demands from
air conditioning through cooler streets;
Significantly reduce sewer infrastructure requirements to the Corridor;
Ensure public domain irrigation demand is not reliant on rainfall
patterns and is resilient to future variations in rainfall; and
Reduce the heat island effect and the impact of heat waves

NPR Kinesis - Precinx Strategy Report 20150828.docx August 14 | PAGE 40
4.4.2 District Energy
It is clear that there are benefits to be explored in the coupling of district
energy solutions with district water recycling and urban regeneration
agendas. The analysis for high performance buildings was done agnostic of
the way those services are delivered, i.e. building by building or precinct
solutions (or combinations of both).
It would be considered prudent to ensure that given the 30-100 year life of
these urban assets that they are designed to accommodate both approaches
and future proof their owners and tenants against a rapidly changing energy
services environment. There are clear examples globally where significant
buildings are required to install appropriate services and plant space for
ground or roof connection to accommodate the energy services provider of
tomorrow.
Case Study – Recycled water and urban green space
Precinct scale recycled water systems are currently in operation in two locations
across Sydney:
1. Central Park, currently supplying 1,400 customers with water for irrigation,
toilet flushing and laundry use. A private water utility operates and maintains
all water related infrastructure across the precinct. The recycled water system
is housed in a Local Water Centre, built over four basement levels under the
residential buildings. For more information see
flowsystems.com.au/communities/central-park-water.
2. Discovery Point, is designed to serve 1,800 apartments, capturing 100% of
wastewater from the apartments and non-residential and used for irrigation,
toilet flushing and laundry as well as adjacent council parks and sporting fields.
For more information see www.metrowater.nsw.gov.au/recycling/australand-
discovery-point-wolli-creek.

NPR Kinesis - Precinx Strategy Report 20150828.docx August 14 | PAGE 41
5. Progressing to Implementation
When considering sustainability interventions, the Draft Strategy’s 30+ year
outlook will need to be acknowledged. This Report is based on best available
data and trends, however it is imperative that the future development of the
Corridor incorporates the notion that there will be different demographic,
transport, technology and affordability drivers in 30 years.
This report provides a framework of potential opportunities available to the
Precincts along the Corridor to deliver world class urban transformation in
the short-medium term.
Following adoption of the Draft Strategy, Councils and/or DPE will need to
consider whether to pursue the Base Case, or alternatively incorporate some
or all suggested interventions under an Optimised Scenario which has the
potential to deliver additional benefits above and beyond business as usual
outcomes. Councils and/or DPE may also wish to explore
additional/alternative interventions beyond those explored within this Report.
It is recommended that the following issues are considered as part of the
future implementation of the Draft Strategy and the recommendations of this
Report.
5.1 Transitional and Adaptable Space
Existing Council land and assets, such as parking stations, present the
opportunity to be repurposed as future open space to meet the needs of
future population and employment growth. Parking assets should therefore
be managed as transitional facilities and adaptable multi-use spaces that are
capable of housing decoupled parking, precinct energy or water
infrastructure, as well as open space. If and when parking is no longer
required, the full transition to open space could be achieved as illustrated in
Figure 21.
TRANSITIONAL AND ADAPTABLE SPACE, MANAGED FLEXIBLY
Figure 21: The transition of existing, Council owned, off-street parking to multi-use, transitional
and adaptable space.
NPR Kinesis - Precinx Strategy Report 20150828.docx August 14 | PAGE 42
5.2 Autonomous Vehicles
The emergence of autonomous vehicles will reduce the need for parking and
investment in underground parking. In particular, parking stations/basement
parking may lose value as vehicles may no longer need to be parked or
housed at origin or destination locations.
The strategies outlined in this report seek to minimise underground parking.
The emergence of autonomous vehicles should further support the approach
to more flexible and agile parking structures that can be adapted over time.
5.3 Continue to Drive New Building Standards
Trends in building performance have shown that current BASIX requirements
are no longer driving best practice outcomes. BASIX was always intended to
drive incremental improvements over time to ensure new development was
always delivering an improvement on existing consumption benchmarks.
As new technologies emerge or become feasible, such as electric vehicles,
battery storage and geothermal heating and cooling, building performance
standards for residential and non-residential buildings should respond to
ensure the benchmark of high performance buildings is maintained through
the life of the delivery of the PRUTP. An increase in BASIX targets via a State
Government led amendment should be pursued. Alternatively, consideration
should be given to increasing BASIX targets on a precinct by precinct basis at
the time of rezoning.

NPR Kinesis - Precinx Strategy Report 20150828.docx August 14 | PAGE 43
6. Performance Outcomes
PRECINX is used as a basis from which UrbanGrowth NSW can measure key
components of the PRUTP. Under the four themes and associated principles,
19 indicators were determined for analysis and measurement through
PRECINX under the four key Principles:
1. Diverse Housing and Jobs to meeting existing and future needs
(measured through land use mix, employment and housing provision).
2. Accessible and Connected – reshape and better connect places and
associated movement networks to better serve customers and
encourage more sustainable travel (measured through car dependence,
mobility choice, access to public transport and pedestrian and cycling
facilities).
3. Community and Places – promote quality places and built form
outcomes to transform the corridor over time (measured through the
provision of pedestrian facilities, open space and street improvements).
4. Resilient and Sustainable – create liveable local precincts along the
corridor that deliver sustainable, adaptable and resilient communities
(measured through greenhouse gas emissions, resource consumption,
car dependence and affordability outcomes)
The results for the each Precinct under the Base Case and Optimised
scenarios are provided in the following pages of this report.
When reviewing these results, several comparisons can be made in the
analysis of the indicators:
Are we making the city better or worse, this can be measured against
what exists (Existing Scenario) and the Sydney Metropolitan Average.
How does the PRUTP enable better outcomes, this can be measured
against the Base Case which highlights the performance of the PRUTP if
development was delivered under current controls and the additional
strategies outlined in the previous section of this report where not
implemented.

NPR Kinesis - Precinx Strategy Report 20150828.docx August 14 | PAGE 44
6.1 Key Results for the Corridor under the Base Case
Scenario
UP TO 60% LESS CAR DEPENDANCE
UP TO 30% MORE AFFORDABLE LIVING
UP TO 25% LESS stationary emissions
UP TO 40% LESS WATER USE
0
5
10
15
20
25
km
per p
ers
on p
er
day
$0
$5,000
$10,000
$15,000
$20,000
$25,000
$30,000
$ p
er
ho
useho
ld p
er
year
for energ
y,
wate
r and
tra
nsp
ort
0
0.5
1
1.5
2
2.5
3
3.5
To
nnes C
O2 p
er
pers
on p
er
year
0
50
100
150
200
250
Litre
s p
ers
on p
er
day

NPR Kinesis - Precinx Strategy Report 20150828.docx August 14 | PAGE 45
6.2 Key Results for the Corridor under the Optimised
Scenario
UP TO 70% LESS CAR DEPENDANCE
UP TO 50% MORE AFFORDABLE LIVING
UP TO 40% LESS stationary emissions
UP TO 60% LESS WATER USE
0
5
10
15
20
25
km
per p
ers
on p
er
day
$0
$5,000
$10,000
$15,000
$20,000
$25,000
$30,000
$ p
er
ho
useho
ld p
er
year
for energ
y,
wate
r and
tra
nsp
ort
0
0.5
1
1.5
2
2.5
3
3.5
To
nnes C
O2 p
er
pers
on p
er
year
0
50
100
150
200
250
Litre
s p
ers
on p
er
day

NPR Kinesis - Precinx Strategy Report 20150828.docx August 14 | PAGE 46
NPR Kinesis - Precinx Strategy Report 20150828.docx August 14 | PAGE 47
GRANVILLE – INDICATOR RESULTS
Measurable Indicator Sydney
Metro Existing Base Case Optimised
Land use mix - 0.86 0.85 0.85
Estimated number of dwellings - 500 7,276 7,276
Estimated number of jobs - 1,470 4,051 4,051
Estimated vehicle kilometres travelled per
person/day 20 15 6 3
Estimated vehicle hours per person/week 5.0 4.3 1.7 0.9
Estimated car ownership rates (vehicles
per household) 1.5 1.4 1.0 0.5
Car share potential (number of pods) - 0 70 92
Average walk + wait time to public
transport (minutes) - 9 9 9
New safe, connected cycle ways (km) - n/a 0.0 0.0
New pedestrian connections (km) - n/a 1.3 1.3
New green corridors (km) - n/a 1.7 1.7
Amount of zoned open space (ha) - 3.1 10.5 10.5
Residential lots within walking distance to
a large park (%) - 74% 100% 100%
Estimated greenhouse gas emissions
(tCO2-e/person/year) 2.4 2.5 2.5 1.9
Estimated water consumption
(litres/person/day) 238 249 146 98
Percent of water reused/recycled within
the precinct (%) - 0% 0% 14%
Estimated peak electricity demand (MW) - - 28 21
Estimated peak sewer loads (kL/hr) - - 349 278
Estimated cost of living ($ per
household/year) $20,800 $18,700 $13,400 $8,200
OPTIMISING GRANVILLE
The Optimised Scenario for Granville would achieve:
1. High Performance Buildings
Compared to the Base Case, the Optimised Case would deliver:
25% reduction in greenhouse gas emissions from lower electricity and
gas consumption;
33% reduction in potable water consumption;
23% reduction in peak electricity demand and 20% reduction in peak
sewer demand; and
16% reduction in household utility costs (energy and water).
2. Car Dependence and Cost of Living
Compared to the Base Case, the Optimised Case would deliver:
50% reduction in car use (kilometres travelled per person per day).
45% reduction in car ownership.
47% reduction in associated household costs.
The potential for private investment in the delivery of approx. 100 car
share pods each servicing 8-12 households.
3. Infrastructure
Compared to the Base Case, the Optimised Case would deliver:
23% reduced peak electricity demand; and
20% reduced peak sewer demand.

NPR Kinesis - Precinx Strategy Report 20150828.docx August 14 | PAGE 48
AUBURN – SUMMARY
Measurable Indicator Sydney
Metro Existing Base Case Optimised
Land use mix - 0.00 0.67 0.67
Estimated number of dwellings - 1,882 2,094 2,094
Estimated number of jobs - 660 67 67
Estimated vehicle kilometres travelled per
person/day 20 14 10 4
Estimated vehicle hours per person/week 5.0 4.2 2.9 1.3
Estimated car ownership rates (vehicles
per household) 1.5 1.4 1.2 0.6
Car share potential (number of pods) - 0 19 25
Average walk + wait time to public
transport (minutes) - 9 9 9
New safe, connected cycle ways (km) - n/a 467.0 467.0
New pedestrian connections (km) - n/a 3.1 3.1
New green corridors (km) - n/a 1.3 1.3
Amount of zoned open space (ha) - 0.0 0.0 0.0
Residential lots within walking distance to
a large park (%) - 85% 100% 100%
Estimated greenhouse gas emissions
(tCO2-e/person/year) 2.4 1.7 2.3 1.8
Estimated water consumption
(litres/person/day) 238 n/a 148 100
Percent of water reused/recycled within
the precinct (%) - 0% 0% 16%
Estimated peak electricity demand (MW) - - 5 4
Estimated peak sewer loads (kL/hr) - - 88 70
Estimated cost of living ($ per
household/year) $20,800 $18,900 $15,800 $8,300
OPTIMISING AUBURN
The Optimised Scenario for Auburn would achieve:
1. High Performance Buildings
Compared to the Base Case, the Optimised Case would deliver:
24% reduction in greenhouse gas emissions from lower electricity and
gas consumption;
32% reduction in potable water consumption;
18% reduction in peak electricity demand and 20% reduction in peak
sewer demand; and
21% reduction in household utility costs (energy and water).
2. Car Dependence
Compared to the Base Case, the Optimised Case would deliver:
55% reduction in car use (kilometres travelled per person per day);
53% reduction in car ownership;
54% reduction in associated household costs; and
The potential for private investment in the delivery of approx. 30 car
share pods each servicing 8-12 households.
3. Infrastructure
Compared to the Base Case, the Optimised Case would deliver:
18% reduced peak electricity demand; and
20% reduced peak sewer demand.
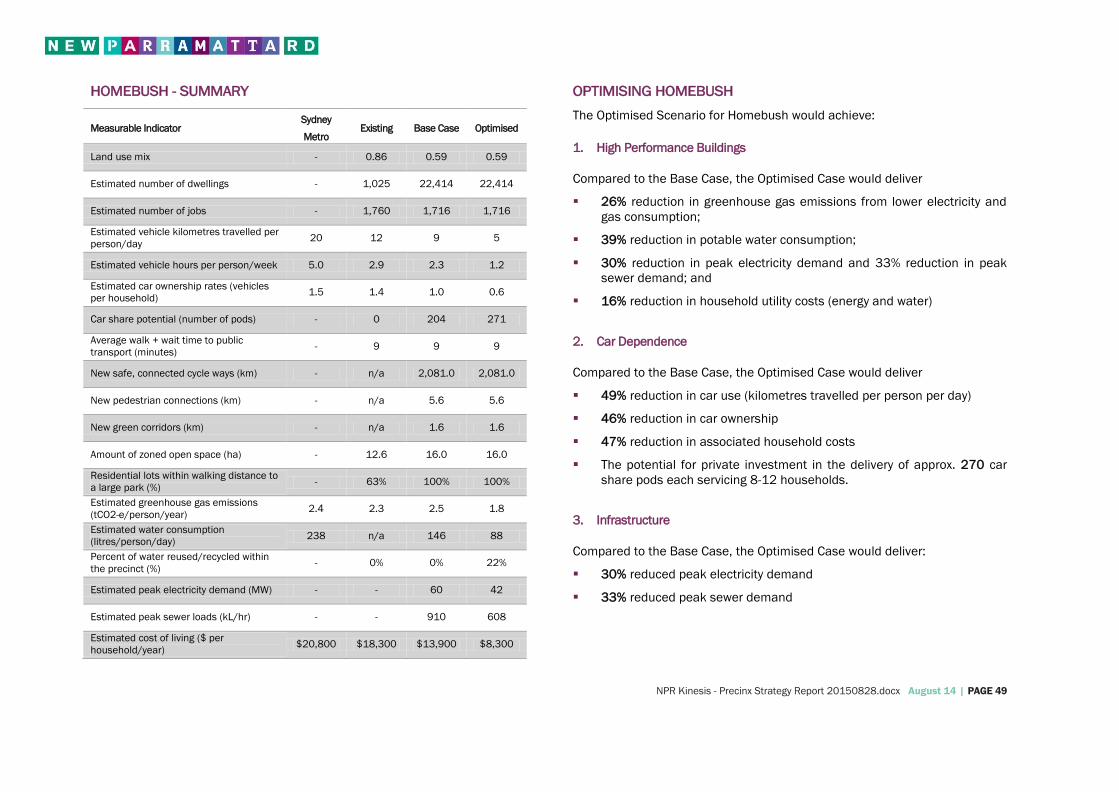
NPR Kinesis - Precinx Strategy Report 20150828.docx August 14 | PAGE 49
HOMEBUSH - SUMMARY
Measurable Indicator Sydney
Metro Existing Base Case Optimised
Land use mix - 0.86 0.59 0.59
Estimated number of dwellings - 1,025 22,414 22,414
Estimated number of jobs - 1,760 1,716 1,716
Estimated vehicle kilometres travelled per
person/day 20 12 9 5
Estimated vehicle hours per person/week 5.0 2.9 2.3 1.2
Estimated car ownership rates (vehicles
per household) 1.5 1.4 1.0 0.6
Car share potential (number of pods) - 0 204 271
Average walk + wait time to public
transport (minutes) - 9 9 9
New safe, connected cycle ways (km) - n/a 2,081.0 2,081.0
New pedestrian connections (km) - n/a 5.6 5.6
New green corridors (km) - n/a 1.6 1.6
Amount of zoned open space (ha) - 12.6 16.0 16.0
Residential lots within walking distance to
a large park (%) - 63% 100% 100%
Estimated greenhouse gas emissions
(tCO2-e/person/year) 2.4 2.3 2.5 1.8
Estimated water consumption
(litres/person/day) 238 n/a 146 88
Percent of water reused/recycled within
the precinct (%) - 0% 0% 22%
Estimated peak electricity demand (MW) - - 60 42
Estimated peak sewer loads (kL/hr) - - 910 608
Estimated cost of living ($ per
household/year) $20,800 $18,300 $13,900 $8,300
OPTIMISING HOMEBUSH
The Optimised Scenario for Homebush would achieve:
1. High Performance Buildings
Compared to the Base Case, the Optimised Case would deliver
26% reduction in greenhouse gas emissions from lower electricity and
gas consumption;
39% reduction in potable water consumption;
30% reduction in peak electricity demand and 33% reduction in peak
sewer demand; and
16% reduction in household utility costs (energy and water)
2. Car Dependence
Compared to the Base Case, the Optimised Case would deliver
49% reduction in car use (kilometres travelled per person per day)
46% reduction in car ownership
47% reduction in associated household costs
The potential for private investment in the delivery of approx. 270 car
share pods each servicing 8-12 households.
3. Infrastructure
Compared to the Base Case, the Optimised Case would deliver:
30% reduced peak electricity demand
33% reduced peak sewer demand

NPR Kinesis - Precinx Strategy Report 20150828.docx August 14 | PAGE 50
BURWOOD - SUMMARY
Measurable Indicator Sydney
Metro Existing Base Case Optimised
Land use mix - 0.24 0.69 0.69
Estimated number of dwellings - 1,056 8,632 8,632
Estimated number of jobs - 2,180 885 885
Estimated vehicle kilometres travelled per
person/day 20 7 8 4
Estimated vehicle hours per person/week 5.0 1.8 2.1 1.0
Estimated car ownership rates (vehicles
per household) 1.5 1.3 1.0 0.5
Car share potential (number of pods) - 0 80 108
Average walk + wait time to public
transport (minutes) - 9 9 9
New safe, connected cycle ways (km) - n/a 2,247.0 2,247.0
New pedestrian connections (km) - n/a 0.9 0.9
New green corridors (km) - n/a 0.0 0.0
Amount of zoned open space (ha) - 0.0 0.3 0.3
Residential lots within walking distance to
a large park (%) - 92% 100% 100%
Estimated greenhouse gas emissions
(tCO2-e/person/year) 2.4 2.1 2.4 1.8
Estimated water consumption
(litres/person/day) 238 n/a 146 99
Percent of water reused/recycled within
the precinct (%) - 0% 0% 16%
Estimated peak electricity demand (MW) - - 24 17
Estimated peak sewer loads (kL/hr) - - 337 267
Estimated cost of living ($ per
household/year) $20,800 $16,700 $13,500 $8,100
OPTIMISING BURWOOD
The Optimised Scenario for Burwood would achieve:
1. High Performance Buildings
Compared to the Base Case, the Optimised Case would deliver
26% reduction in greenhouse gas emissions from lower electricity and
gas consumption;
32% reduction in potable water consumption;
29% reduction in peak electricity demand and 21% reduction in peak
sewer demand; and
14% reduction in household utility costs (energy and water)
2. Car Dependence
Compared to the Base Case, the Optimised Case would deliver
51% reduction in car use (kilometres travelled per person per day)
47% reduction in car ownership
48% reduction in associated household costs
The potential for private investment in the delivery of approx. 100 car
share pods each servicing 8-12 households.
3. Infrastructure
Compared to the Base Case, the Optimised Case would deliver:
29% reduced peak electricity demand
21% reduced peak sewer demand

NPR Kinesis - Precinx Strategy Report 20150828.docx August 14 | PAGE 51
KINGS BAY - SUMMARY
Measurable Indicator Sydney
Metro Existing Base Case Optimised
Land use mix - 0.41 0.72 0.72
Estimated number of dwellings - 260 5,592 5,592
Estimated number of jobs - 1,370 1,050 1,050
Estimated vehicle kilometres travelled per
person/day 20 14 11 4
Estimated vehicle hours per person/week 5.0 3.0 2.3 0.9
Estimated car ownership rates (vehicles
per household) 1.5 1.5 1.3 0.6
Car share potential (number of pods) - 0 52 67
Average walk + wait time to public
transport (minutes) - 9 9 9
New safe, connected cycle ways (km) - n/a 3,483.0 3,483.0
New pedestrian connections (km) - n/a 1.1 1.1
New green corridors (km) - n/a 1.9 1.9
Amount of zoned open space (ha) - 0.0 0.9 0.9
Residential lots within walking distance to
a large park (%) - 69% 100% 100%
Estimated greenhouse gas emissions
(tCO2-e/person/year) 2.4 2.2 2.5 1.8
Estimated water consumption
(litres/person/day) 238 n/a 146 99
Percent of water reused/recycled within
the precinct (%) - 0% 0% 14%
Estimated peak electricity demand (MW) - - 17 12
Estimated peak sewer loads (kL/hr) - - 241 194
Estimated cost of living ($ per
household/year) $20,800 $18,600 $16,400 $8,500
OPTIMISING KINGS BAY
The Optimised Scenario for Kings Bay would achieve:
1. High Performance Buildings
Compared to the Base Case, the Optimised Case would deliver
27% reduction in greenhouse gas emissions from lower electricity and
gas consumption;
32% reduction in potable water consumption;
28% reduction in peak electricity demand and 19% reduction in sewer
demand.
13% reduction in household utility costs (energy and water)
2. Car Dependence
Compared to the Base Case, the Optimised Case would deliver
61% reduction in car use (kilometres travelled per person per day)
55% reduction in car ownership
56% reduction in associated household costs
The potential for private investment in the delivery of approx. 70 car
share pods each servicing 8-12 households.
3. Infrastructure
Compared to the Base Case, the Optimised Case would deliver:
28% reduced peak electricity demand
19% reduced peak sewer demand

NPR Kinesis - Precinx Strategy Report 20150828.docx August 14 | PAGE 52

NPR Kinesis - Precinx Strategy Report 20150828.docx August 14 | PAGE 53
TAVERNERS HILL - SUMMARY
Measurable Indicator Sydney
Metro Existing Base Case Optimised
Land use mix - 0.64 0.69 0.69
Estimated number of dwellings - 367 4,306 4,306
Estimated number of jobs - 300 436 436
Estimated vehicle kilometres travelled per
person/day 20 10 9 4
Estimated vehicle hours per person/week 5.0 2.5 2.2 1.1
Estimated car ownership rates (vehicles
per household) 1.5 1.1 1.0 0.5
Car share potential (number of pods) - 3 40 54
Average walk + wait time to public
transport (minutes) - 9 9 9
New safe, connected cycle ways (km) - n/a 0.0 0.0
New pedestrian connections (km) - n/a 0.3 0.3
New green corridors (km) - n/a 1.3 1.3
Amount of zoned open space (ha) - 0.4 1.2 1.2
Residential lots within walking distance to
a large park (%) - 78% 100% 100%
Estimated greenhouse gas emissions
(tCO2-e/person/year) 2.4 2.0 2.5 1.8
Estimated water consumption
(litres/person/day) 238 n/a 146 100
Percent of water reused/recycled within
the precinct (%) - 0% 0% 14%
Estimated peak electricity demand (MW) - - 12 7
Estimated peak sewer loads (kL/hr) - - 167 134
Estimated cost of living ($ per
household/year) $20,800 $15,300 $13,400 $8,000
OPTIMISING TAVERNERS HILL
The Optimised Scenario for Taverners Hill would achieve:
1. High Performance Buildings
Compared to the Base Case, the Optimised Case would deliver:
26% reduction in greenhouse gas emissions from lower electricity and
gas consumption;
32% reduction in potable water consumption;
39% reduction in peak electricity demand and 20% reduction in peak
sewer demand; and
14% reduction in household utility costs (energy and water)
2. Car Dependence
Compared to the Base Case, the Optimised Case would deliver:
51% reduction in car use (kilometres travelled per person per day)
46% reduction in car ownership
48% reduction in associated household costs
The potential for private investment in the delivery of approx. 50 car
share pods each servicing 8-12 households.
3. Infrastructure
Compared to the Base Case, the Optimised Case would deliver:
39% reduced peak electricity demand
20% reduced peak sewer demand

NPR Kinesis - Precinx Strategy Report 20150828.docx August 14 | PAGE 54
LEICHHARDT - SUMMARY
Measurable Indicator Sydney
Metro Existing Base Case Optimised
Land use mix - 0.52 0.73 0.73
Estimated number of dwellings - 380 1,455 1,455
Estimated number of jobs - 2,130 202 202
Estimated vehicle kilometres travelled per
person/day 20 10 8 4
Estimated vehicle hours per person/week 5.0 2.1 1.7 0.8
Estimated car ownership rates (vehicles
per household) 1.5 1.2 1.0 0.5
Car share potential (number of pods) - 2 14 18
Average walk + wait time to public
transport (minutes) - 9 9 9
New safe, connected cycle ways (km) - n/a 0.0 0.0
New pedestrian connections (km) - n/a 0.3 0.3
New green corridors (km) - n/a 0.4 0.4
Amount of zoned open space (ha) - 0.0 0.1 0.1
Residential lots within walking distance to
a large park (%) - 100% 100% 100%
Estimated greenhouse gas emissions
(tCO2-e/person/year) 2.4 2.3 2.5 1.9
Estimated water consumption
(litres/person/day) 238 n/a 146 98
Percent of water reused/recycled within
the precinct (%) - 0% 0% 16%
Estimated peak electricity demand (MW) - - 4 3
Estimated peak sewer loads (kL/hr) - - 57 46
Estimated cost of living ($ per
household/year) $20,800 $16,600 $13,400 $8,100
OPTIMISING LEICHHARDT
The Optimised Scenario for Leichhardt would achieve:
1. High Performance Buildings
Compared to the Base Case, the Optimised Case would deliver
26% reduction in greenhouse gas emissions from lower electricity and
gas consumption;
33% reduction in potable water consumption;
37% reduction in peak electricity demand and 21% reduction in peak
sewer demand; and
15% reduction in household utility costs (energy and water)
2. Car Dependence
Compared to the Base Case, the Optimised Case would deliver
51% reduction in car use (kilometres travelled per person per day)
45% reduction in car ownership
47% reduction in associated household costs
The potential for private investment in the delivery of approx. 20 car
share pods each servicing 8-12 households.
3. Infrastructure
Compared to the Base Case, the Optimised Case would deliver:
37% reduced peak electricity demand
21% reduced peak sewer demand
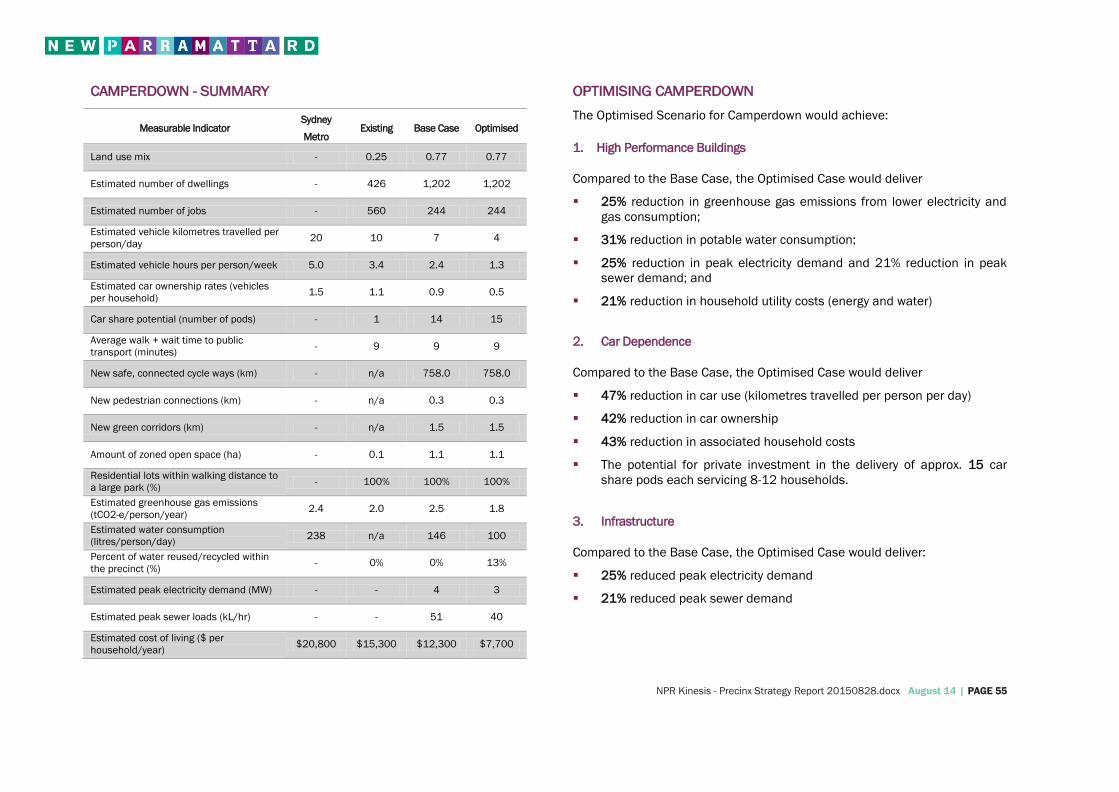
NPR Kinesis - Precinx Strategy Report 20150828.docx August 14 | PAGE 55
CAMPERDOWN - SUMMARY
Measurable Indicator Sydney
Metro Existing Base Case Optimised
Land use mix - 0.25 0.77 0.77
Estimated number of dwellings - 426 1,202 1,202
Estimated number of jobs - 560 244 244
Estimated vehicle kilometres travelled per
person/day 20 10 7 4
Estimated vehicle hours per person/week 5.0 3.4 2.4 1.3
Estimated car ownership rates (vehicles
per household) 1.5 1.1 0.9 0.5
Car share potential (number of pods) - 1 14 15
Average walk + wait time to public
transport (minutes) - 9 9 9
New safe, connected cycle ways (km) - n/a 758.0 758.0
New pedestrian connections (km) - n/a 0.3 0.3
New green corridors (km) - n/a 1.5 1.5
Amount of zoned open space (ha) - 0.1 1.1 1.1
Residential lots within walking distance to
a large park (%) - 100% 100% 100%
Estimated greenhouse gas emissions
(tCO2-e/person/year) 2.4 2.0 2.5 1.8
Estimated water consumption
(litres/person/day) 238 n/a 146 100
Percent of water reused/recycled within
the precinct (%) - 0% 0% 13%
Estimated peak electricity demand (MW) - - 4 3
Estimated peak sewer loads (kL/hr) - - 51 40
Estimated cost of living ($ per
household/year) $20,800 $15,300 $12,300 $7,700
OPTIMISING CAMPERDOWN
The Optimised Scenario for Camperdown would achieve:
1. High Performance Buildings
Compared to the Base Case, the Optimised Case would deliver
25% reduction in greenhouse gas emissions from lower electricity and
gas consumption;
31% reduction in potable water consumption;
25% reduction in peak electricity demand and 21% reduction in peak
sewer demand; and
21% reduction in household utility costs (energy and water)
2. Car Dependence
Compared to the Base Case, the Optimised Case would deliver
47% reduction in car use (kilometres travelled per person per day)
42% reduction in car ownership
43% reduction in associated household costs
The potential for private investment in the delivery of approx. 15 car
share pods each servicing 8-12 households.
3. Infrastructure
Compared to the Base Case, the Optimised Case would deliver:
25% reduced peak electricity demand
21% reduced peak sewer demand

NPR Kinesis - Precinx Strategy Report 20150828.docx August 14 | PAGE 56
7. Key Assumptions
Metropolitan Sydney average benchmarks
Electricity 2,132 kWh per person/year
Gas 3,888 MJ per person/year
Water 237.8 L per person/day
Transport 19.98 km per person/day
Tariffs and rates
Household cost savings outlined in this report are based on current tariffs
outlined below:
Residential Water Rate Unit
Mains tariff 2.232 $/kL
Recycled water tariff 2.068 $/kL
Service charge per dwelling 765 $/yr
Recycled water service charge 0 $/yr
Residential Grid Electricity Rate Unit
Applied tariff 0.2514 $/kWh
Solar feed-in tariff 0.06 $/kWh
Service charge per dwelling 289.16 $/yr
Residential Gas Rate Unit
Gas (first 3,775 MJ per qtr/remaining) 0.041/0.023 $/MJ
Service charge per dwelling 207 $/yr
Residential Transport Rate Unit
Fuel 1.50 $/L
Annual capital costs (devaluation) 6,642 $/yr
Annual registration/insurance 2,172 $/yr
Key Data Sources
• ACADS-BSG Australian Climatic Data (Reference Meteorological Year,
RMY) for hourly temperature, insulation and humidity.
• Bureau of Meteorology local rainfall and evaporation data
- Data is from the representative weather station for the local climate
zone
- The RMY (Representative Meteorological Year) is synthesized from a
composite of 12 typical meteorological months that best represent
the historic average of the specified location using post-1986 data in
addition to the earlier weather data for each of the 69 climate zones
in Australia.
• Sydney Water (2009) Rouse Hill 15 minute and daily demand profiles
(Kinesis request, unpublished)
• Department of Resources, Energy and Tourism, 2010, Energy in Australia
– 2010, ABARE, Canberra
• Kinesis 2014, Additional water end use breakdowns derived from first
principle analysis of residential and non-residential building types.
• National Water Commission, 2011, National performance report 2009-
2010: urban water utilities, National Water Commission, Canberra
• NSW Department of Planning, BASIX Residential Water Consumption
Data (2010)
• Sydney Water Best Practice Guidelines for water conservation in
commercial office buildings and shopping centres (2007),
http://www.sydneywater.com.au/web/groups/publicwebcontent/docum
ents/document/zgrf/mdu0/~edisp/dd_054580.pdf
• Sydney Water Best Practice Guidelines for holistic open space turf
management (2011),
www.sydneywater.com.au/web/groups/publicwebcontent/documents/d
ocument/zgrf/mdq1/~edisp/dd_045253.pdf

NPR Kinesis - Precinx Strategy Report 20150828.docx August 14 | PAGE 57
• Water Corporation. (2014). Mapping water use at school. from
https://www.watercorporation.com.au/home/teachers/lesson-plans-
and-teaching-resources/lesson-plan-search/lesson-
plan/?id=%7BD9516524-4A2C-4B98-A113-3891D59F1AAA%7D
• Department of Resources, Energy and Tourism, 2010, Energy in Australia
– 2010, ABARE, Canberra
• Department of Infrastructure and Transport, 2011, Road vehicle
kilometres travelled: estimations from state and territory fuel sales,
Australian Government, Canberra
• Department of the Environment, 2014, National Greenhouse Accounts
Factors,
http://www.environment.gov.au/system/files/resources/b24f8db4-
e55a-4deb-a0b3-32cf763a5dab/files/national-greenhouse-accounts-
factors-2014.pdf
• Energy Use in the Australian Residential Sector, 1986 – 2020, Australian
Government Department of the Environment, Water, Heritage and the
Arts (DEHWA), 2008.
• Energy Efficient Strategies (2009), Appliance Energy Consumption in
Australia: Equations for Appliance Star Ratings
• Building Code of Australia (2007) Energy Efficiency Requirements in
Commercial Buildings
• Transport Data Centre (2006) The Development of a Sydney VKT
Regression Model
• ABS (2010) ‘Household Expenditure Survey, Australia: Summary of
Results’, catalogue number 65300DO001_200910, Australian Bureau
of Statistics, Canberra.