MRC Equal Pay Audit 2015
18
MRC Equal Pay Audit 2015
Transcript of MRC Equal Pay Audit 2015

MRC Equal Pay Audit 2015

2
Executive summary
The MRC is committed to eliminating unjustified discrimination, promoting equality of
opportunity and good relations between employees and encouraging diversity
throughout the workforce. We believe that our success depends on our ability to
embrace diversity and draw on the skills, understanding and experience of all our
people.
This Equal Pay Audit has thoroughly reviewed the pay of men and women doing work of
equal value within the MRC as at 1st April 2015. It also looks at specific staff groups and
other protected characteristic groups.
The review identifies and investigates where there are gender pay gaps of 5% and
above, and makes recommendations to close the gap in the absence of a satisfactory
explanation on grounds other than gender.
The overall MRC gender pay gap at 1st April 2015 was 13.7%. However, as the report
notes when comparing males and females doing work of equal value (e.g. by pay band)
there are no significant pay gaps of concern, in fact in many bands females on average
earn more than males.
The overall pay gap can be attributed to a lack of representation of females at higher
levels within the organisation, as is commonly seen in academia and the wider UK
workforce. This is noted, and dealt with within the recommendations.
The MRC is pleased with the results of the Equal Pay Audit and with progress made since
the last audit in 2009. Nevertheless our recommendations represent our commitment to
eliminating unjustified discrimination and promoting equality of opportunity.
Foreword by MRC National Trade Union Side
The MRC Trade Unions support the findings of the MRC Equal Pay Audit 2015. We are
pleased that the current pay structure has been effective in rebalancing pay and
reducing the number of employees over band maximum. We welcome the MRC’s
commitment to further reducing any perceived gender distinction, in particular through
the recruitment of women to senior appointments and on Boards and Panels.

3
Equal Pay – The legal background and context
Equal pay is an aspect of sex discrimination law and has been in force for over 40 years. It
gives the right for men and women to be paid the same for the same, or equivalent, work.
Where men and women are paid at different rates for the same, or similar, work, the
employer must prove that there is a reason for it which is not gender-related.
The Equality Act 2010 replaces the previous anti-discrimination laws with a single Act. The
Equality Act 2010 gives women (and men) a right to equal pay for equal work. It replaces
previous legislation on equal pay, including the Equal Pay Act 1970, the Sex Discrimination
Act 1975, and the equality provisions in the Pensions Act 1995.
In their 2015 election manifesto the Conservative Party announced future plans that will
require companies with more than 250 employees to publish the difference between the
average pay of their male and female employees. Following two periods of consultation, the
government published the Gender Pay Gap Information Regulations in February 2016. The
Regulations will require employers with more than 250 employees to collect their gender
pay gap data as at 30 April 2017 and then to publish it within the following 12 months (and
on an annual basis going forward).
Whilst this legislation is not yet in force the MRC is committed to openly publishing our own
equal pay gap ahead of this as at 1st April 2015.
What is an Equal Pay Audit?
An equal pay audit involves comparing the pay of protected groups who are doing equal
work in an organisation, investigating the causes of any pay gaps by gender, ethnicity,
disability or working pattern and planning to close any gaps that cannot be justified on
grounds other than one of those characteristics
An equal pay audit is concerned with an important, but narrow, aspect of potential
discrimination in employment - unequal pay for equal work. It does not directly address
other aspects of inequality, such as the glass ceiling, but such aspects - which may well
contribute to overall pay gaps between, for example, men and women - may be highlighted
by the pay audit.
An equal pay audit is not simply a data collection exercise. It entails a commitment to put
right any unjustified pay inequalities and this means that the audit must have the
involvement and support of managers with the authority to deliver the necessary changes.
It is also important to involve workforce representatives to maximise the validity of the
audit and success of subsequent action taken.
The MRC and Equal Pay
In May 2015 the MRC Remuneration Committee commissioned an Equal Pay Audit to be
carried out to assess the current equal pay gaps at work in the organisation. The last Equal
Pay Audit was carried out in 2009 which is prior to not only a period of public sector pay
restraint but also significant changes to the MRC pay structure which took place in both
2012 and 2014.

4
MRC Equal Pay Audit 2009
The last Equal Pay Audit, carried out in 2009, found that overall there was “no
evidence of discrimination in base or total pay on the grounds of gender, ethnicity,
disability or age as MRC’s results are very good”.
However, it did find some issues including:
- Neither band 2 or 1 had a maximum pay rate. This, effectively, created open-ended
pay ranges and therefore allowed individuals undertaking broadly equivalent work to
be paid very differently;
- Although bands 7 to 3 did each contain a maximum, a considerable number of
employees are currently paid above their maximum. Out of the 2,979 employees in
these ranges 782 (which is 26%) were being paid above their maximum;
- Even those pay ranges that had pay range maximum figures contained a very wide
spread of base pay figures;
- There was a strong relationship between age and salary level (i.e. the older an
employee is, the higher their salary is when compared to their colleagues in the same
grade). This is typical of an incremental pay system with stepped pay ranges but it
attaches little or no value to the performance, contribution or competence of the
individuals.
- MRC’s policy on promotion was that the individual should progress their base pay to
the minimum of the new Band, with an under-pinning assurance that they will get an
increase of at least 10% (of their current pay). The reality was that these pay
increases on promotion ranged from 11.1% to 46.3% with the majority being in the
high teens/low twenty percentage range;
- The starting base pay of individuals ranging from the minimum to a position above
the maximum i.e. there are many examples of two new appointments to the same
grade where one has started on the minimum and the other has started above the
maximum.
The publication of these findings contributed significantly to the development of
changes to the MRC pay and grading structure including:
- The introduction of maximum salary rates for bands 2 and 1;
- More opportunities for progression into Band 1 through Personal Promotion for
scientific staff, and a Job Evaluation process for non-scientists;
- Revised pay ranges in bands 7 – 3 with now only 14 employees in total over band
maximums (0.7% of staff compared to 26% in 2009 audit);
- The introduction of a new spot rate section, Senior Contract Pay, for those with
salaries over £100,000;
- The introduction of the A and B sections to recognise competence, and the S-zone to
recognise sustained excellence;

5
Current MRC Pay Structure
The MRC pay and grading model consists of a single pay and grading structure that includes
scientific, research support, technical, management and administrative posts. The structure
comprises of 7 main bands (band 7 – band 1). In addition there is a personal pay section
which sits above band 1; Senior Contract Pay.
Each of these bands (excluding Senior Contract Pay) is split into 3 sections:
A section Entry/Developmental
B section Experienced/Competent
S-zone Fully Competent AND Sustained Excellence
Data collection and methodology
Data was extracted from the Oracle HR system, as at 1st April 2015 to provide consistency
in comparison. Data was analysed for all employees regardless of terms and conditions to
calculate pay gaps. Subsequently, employee data was grouped as considered appropriate.
The gender pay gap is calculated using the mean salaries of female employees expressed as
a percentage of the mean salaries of male employees doing work of equal value. ‘Salary’ is
the full-time equivalent salary.
A negative % demonstrates a pay gap in favour of women.. The Equality and Human Rights
Commission recommend that any pay gaps of 5% or greater are considered to be
significant and should be investigated further.
Gaps of 5% or over in favour of males are shown in red and gaps of 5% of over in favour of
females are shown in yellow.
To ensure the audit was as credible as possible advice was also sought and followed from a
Programme Leader at the MRC Biostatistics Unit.
The overall analysis was split into four distinct sections:
Section 1 – MRC overall gender pay gap analysis
Section 2 – Science roles only gender pay gap analysis
Section 3 - MRC overall gender analysis of other pay related elements
Section 4 - MRC overall pay gap analysis for other protected characteristics including
ethnicity, job category and full-time/part-time staff
Data privacy within the report
The data shown in this report has been reviewed to mitigate the risk of individuals being
identified; this means that in some areas detailed comparisons are not shown however all
detailed data has been reviewed by the MRC Remuneration Committee, National Trade
Union Side, MRC Management Board and HR Leads group. Employee counts have been
rounded to the nearest multiple of 5 in line with HESA guideline to ensure anonymity within
small groups. Where a value of 5 is shown this should be read as indicating a value of 5 or
less.

6
Section 1: MRC overall gender pay gap analysis
On 1st April 2015 the MRC employed 1,935 staff on our pay structure which includes bands
1 – 7, SCP and also hourly paid staff. Females accounted for 50.8% of this total, with males
accounting for 49.2%, demonstrating an overall equality in the composition of workforce.
1.1 Overall gender pay gap
Comparing the whole data for MRC base salaries shows an overall pay gap of 13.7%.
However, it is important to consider this in more detail.
Table A) All employees – mean pay gap
Female Male
Employee
Count
Average FTE
Salary
Employee
Count
Average FTE
Salary Pay Gap
980 £32,372 950 £37,519 13.7%
1.2 Mean gender pay gaps by band
To be able to analyse the pay gaps reported in Table A) it is important to look at the gender
pay gap by pay band. The table below provides information by gender and headcount and
shows the median salaries and resulting pay gaps for each MRC pay band:
Table B) Gender pay gaps by band – Average FTE Salary
Female Male
Band Employee
Count
Average
FTE
Salary
Employee
Count
Average
FTE
Salary
Pay Gap
SCP 5 £122,369 20 £120,776 -1.3%
Band 1 20 £84,992 40 £83,765 -1.5%
Band 2 40 £57,253 85 £59,640 4.0%
Band 3 170 £42,861 160 £43,146 0.7%
Band 4 370 £30,979 375 £31,002 0.1%
Band 5 240 £25,249 155 £24,806 -1.8%
Band 6 125 £19,439 80 £19,345 -0.5%
Band 7 20 £16,157 30 £16,032 -0.8%
Table C) Gender pay gap by band - chart
-1.30%
-1.50%
4.00%
0.70%
0.10%
-1.80%
-0.50%
-0.80%
-3% -2% -1% 0% 1% 2% 3% 4% 5%
SCP
Band 1
Band 2
Band 3
Band 4
Band 5
Band 6
Band 7
7
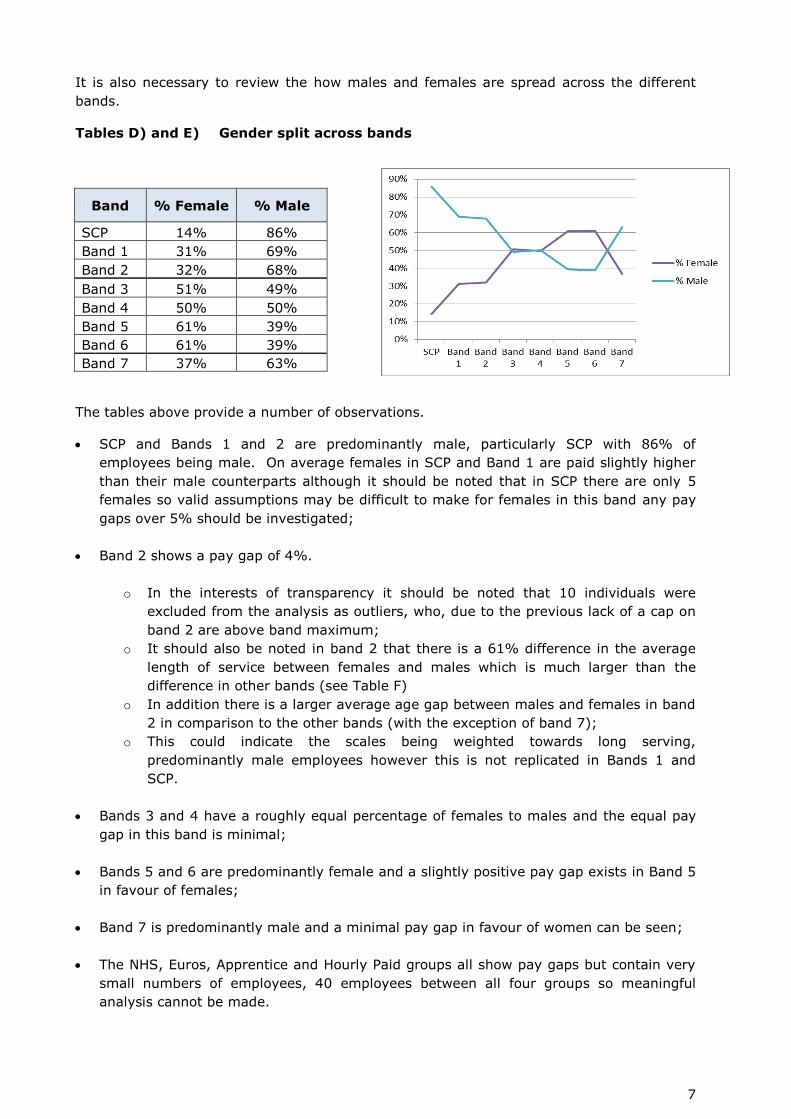
It is also necessary to review the how males and females are spread across the different
bands.
Tables D) and E) Gender split across bands
Band % Female % Male
SCP 14% 86%
Band 1 31% 69%
Band 2 32% 68%
Band 3 51% 49%
Band 4 50% 50%
Band 5 61% 39%
Band 6 61% 39%
Band 7 37% 63%
The tables above provide a number of observations.
SCP and Bands 1 and 2 are predominantly male, particularly SCP with 86% of
employees being male. On average females in SCP and Band 1 are paid slightly higher
than their male counterparts although it should be noted that in SCP there are only 5
females so valid assumptions may be difficult to make for females in this band any pay
gaps over 5% should be investigated;
Band 2 shows a pay gap of 4%.
o In the interests of transparency it should be noted that 10 individuals were
excluded from the analysis as outliers, who, due to the previous lack of a cap on
band 2 are above band maximum;
o It should also be noted in band 2 that there is a 61% difference in the average
length of service between females and males which is much larger than the
difference in other bands (see Table F)
o In addition there is a larger average age gap between males and females in band
2 in comparison to the other bands (with the exception of band 7);
o This could indicate the scales being weighted towards long serving,
predominantly male employees however this is not replicated in Bands 1 and
SCP.
Bands 3 and 4 have a roughly equal percentage of females to males and the equal pay
gap in this band is minimal;
Bands 5 and 6 are predominantly female and a slightly positive pay gap exists in Band 5
in favour of females;
Band 7 is predominantly male and a minimal pay gap in favour of women can be seen;
The NHS, Euros, Apprentice and Hourly Paid groups all show pay gaps but contain very
small numbers of employees, 40 employees between all four groups so meaningful
analysis cannot be made.

8
Table F) Average length of service and age by gender, by pay band
MRC Remuneration Committee, Management Board and National Trade Union Side also
reviewed the findings in relation to total earnings in addition to basic earnings which has
been reviewed above, however the analysis did not highlight any differences from the base
salary analysis and so has not been included.
Female Male
Band Avg Length
of Service Avg Age
Avg Length
of Service Avg Age
SCP 16.6 57 19.7 60
Band 1 15.2 51 16.9 53
Band 2 9.2 46 14.8 51
Band 3 9.7 45 9.1 45
Band 4 5.9 38 6.1 38
Band 5 7.9 40 6.3 38
Band 6 6.6 41 7.6 42
Band 7 6.4 42 9.3 47

9
Section 2: Science roles only gender pay gap analysis
At the request of the MRC Remuneration Committee this section has been included to
review those classed in the “scientific” cadre only at the MRC and includes:
- Programme Leaders (PLs)
- Programme Leader Tracks (PLTs)
- Senior Investigator Scientist
- Investigator Scientist
- Career Development Fellows/Postdoctoral Training Posts (CDF/PD)
Science posts account for the most significant percentage of all employees at 39%. An
analysis of all job functions pay gaps is shown in Section 4.
Table G) and H) Composition of science employees by pay band
As with the overall MRC population the composition of science employees shows an
imbalance at the senior level, particularly from band 2 upwards.
Table I) Science employees only – mean pay gap
Female Male
Function Employees Avg Annual
Salary Employees
Avg Annual
Salary Pay Gap
Science 260 £37,038 420 £44,370 16.5%
The table above shows a 16.5% overall pay gap in the scientific cadre which is larger than
the overall MRC pay gap of 13.7%. However, in context of the spread of males and females
across science bands then further investigation needs to be undertaken to understand this
gap:
Table J) Science employees – mean pay gap by pay band
Female Male
Band Employees
Avg Annual
Salary Employees
Avg Annual
Salary Pay Gap
SCP 5 £122,369 10 £118,362 -3.4%
Band 1 5 £82,883 30 £84,040 1.4%
Band 2 20 £58,209 75 £61,161 4.8%
Band 3 50 £42,698 80 £42,564 -0.3%
Band 4 170 £29,981 215 £29,972 0.0%
Band 5 10 £23,979 10 £23,627 -1.5%
0%
20%
40%
60%
80%
100%
SCP Band 1 Band 2 Band 3 Band 4 Band 5
% Female
% Male
Band %
Female % Male
SCP 20% 80%
Band 1 16% 84%
Band 2 23% 77%
Band 3 39% 61%
Band 4 44% 56%
Band 5 50% 50%

10
Reviewing the average gender salaries across bands shows that there are generally only
minor differences in salaries across the bands. Again band 2 shows the biggest gap of
4.8% this remains below the recommended 5% warning level, it should however be noted.
Table K) average pay gap by difference science roles
Female Male
Band Employee
Count
Average
FTE Salary
Employee
Count
Average
FTE Salary Pay Gap
PL (B1) 5 £83,265 30 £84,040 0.92%
PL (B2) 15 £59,983 55 £62,378 3.84%
PLT 5 £50,952 10 £51,737 1.52%
Senior Investigator
Scientist 40 £43,959 70 £45,372 3.11%
Investigator Scientist 80 £33,484 120 £33,351 -0.40%
CDF/PD 85 £28,600 105 £28,927 1.13%
The table above reviews the gender pay gap in the different types of roles in the science
category. The analysis shows that there are no major differences in the average salaries
across the different science roles.

11
Section 3: MRC overall gender analysis of other pay related elements
3.1 Starting Salaries
The MRC policy is that starting salaries is that new starters are expected to start on the minimum point of the relevant A section of the pay
band. Where the new starter can provide evidence of working at the same level as the role they are recruited to then a higher starting point
may be agreed within the band to reflect the skills that the new starter has already acquired at that level.
Responsibility is devolved to the Units/Institutes to manage their approach to starting salaries.
Table L) shows the average starting salaries for new staff in bands 2-7 (SCP & Band 1 excluded due to small numbers of new appointments).
The following points are noted;
For Band 2 the range of starting salaries is similar however there is one male band 2 appointee with an abnormally high starting salary
for exceptional, specific reasons. This has increased the average (mean) male starting salary, which would otherwise align with the
average female starting salary;
At Band 3 there is a male outlier. This role is in a specialist area and carries a higher salary in order to remain competitive;
Bands 4, 5 & 7 show similar starting salaries for both genders;
In Band 6 there are almost twice as many female appointments as male with a wide range of roles within the band. This is reflected in a
wider range of starting salaries and a slightly higher average for females;
Only one male appointment out of 60 was to an administrative position whereas a third of female appointments were to administrative
positions. Most admin appointments were at Head Office and on band minimum.
Table L) Starting salary statistics across bands
Band 2 Band 3 Band 4 Band 5 Band 6 Band 7
Female Male Female Male Female Male Female Male Female Male Female Male
Q1 £50,051 £49,594 £36,294 £39,676 £27,183 £27,084 £21,303 £21,303 £16,338 £16,088 £14,195 £14,195
Min £49,103 £47,699 £35,935 £35,935 £26,022 £26,022 £21,092 £21,092 £16,088 £16,088 £13,470 £13,470
Median £55,267 £51,912 £38,227 £42,240 £28,083 £28,224 £21,912 £22,022 £16,640 £16,463 £14,195 £14,420
Mean £55,455 £57,936 £39,458 £42,556 £28,502 £28,579 £22,642 £22,591 £17,164 £16,876 £14,443 £14,528
Max £70,167 £92,000 £60,000 £70,000 £37,785 £36,509 £28,671 £27,434 £21,467 £19,442 £16,048 £15,869
Q3 £59,228 £60,051 £41,292 £44,341 £29,274 £29,806 £23,506 £23,741 £17,745 £17,256 £14,920 £14,914

12
3.2 Allowances
The MRC has a number of allowances in place through the MRC Allowances Policy. The
majority relate to either job specific requirements (e.g. Bioinformatics Allowance) or are
location specific (Inner and Central London Allowances). These have not been analysed as
they are flat rate allowances which apply to all those covered so there is no opportunity for
differences.
The two allowances investigated in the audit are the Recruitment and Retention Allowances
(RRAs), and Responsibility Allowances (RAs), as these are both person specific and may be
open to subjectivity in application.
A detailed analysis comparing RRAs and RAs both by pay band has been carried out and
shared with MRC Remuneration Committee, Management Board and National Trade Union
Side.
The findings from this analysis are shared below however the full breakdown cannot be
shared as the small sample size in some groups could lead to individuals being identified.
The following has been noted for RRAs:
There is limited use of RRAs in bands 1 & 2 which provides for unreliable data to make
comparisons (only 6 across both bands);
From the data available, there is no specific evidence of bias in the value of RRAs
awarded between the genders;
It is worth noting over half of all RRAs are awarded at one site to technical posts. This is
likely due to external competition in the area. Whilst not an equal pay issue, it could be
explored as a separate reward issue.
The following has been noted for RAs:
Responsibility Allowances are not in widespread use across all Units, with the majority
being awarded in at two sites. Again minimal allowances are in place in bands 2 and 1
which means it is difficult to make any assumptions for these bands;
From the data available there is no evidence of gender bias in the values awarded
although on average Females are receiving a higher rate of responsibility allowance.
3.3 Bonus Payments
The MRC runs two bonus schemes, an In Year Special Awards Scheme (IY SAS), which
provides year round payments of up to £1,000 and an End of Year Special Awards Scheme
(EY SAS), which is run in March/April each year and has higher set rates for each band as
shown below.
A maximum 25% of staff receive a bonus through the End of Year process:
(2015 rates)
Basic Standard Maximum
band 7 £317 £555 £793
band 6 £387 £677 £968
band 5 £504 £882 £1,261
band 4 £646 £1,131 £1,616
band 3 £862 £1,508 £2,154
band 2 £1,204 £2,107 £3,009
band 1 £1,734 £3,035 £4,335

13
The table below shows the spread of IY SAS across the different bands by gender in the
past year; bands 1, 2, 6, 7 have been excluded due to very small numbers in each which
could lead to persons being identified:
Table M) Spread of IY SAS across different bands
Female Male
Pay Band
# IY
SAS
Average
SAS
# IY
SAS
Average
SAS
Pay
Gap
Band 3 15 £700.00 15 £688.46 -1.6%
Band 4 40 £576.32 20 £647.37 12.3%
Band 5 30 £578.21 25 £573.08 -0.9%
Grand
Total 85 £578.86 60 £640.30
The table shows that 170 IY SAS awards were made and the following was noted:
IY SAS were predominantly made in bands 4 and 5;
the small numbers of awards in other bands means that it is difficult to make any
assumptions from the pay gaps e.g. only 2 awards made in band 1, and 7 awards in
band 2;
However in band 4, 60 awards were made and the data shows a pay gap in favour
of males of 12.3%. Reviewing the awards data shows that 29% of awards for
females were above £500, whereas 47% of awards for males were above £500.
This is noted and considered as part of the audit recommendations.
The table below shows the spread of EY SAS across the different bands by gender in the
past year, bands SCP and 7 have been excluded due to very small numbers in each which
could lead to persons being identified:
Table N) Spread of EY SAS across different bands
Female Male
Pay Band # EY SAS
Average
SAS # EY SAS
Average
SAS
Pay
Gap
Band 1 10 £4,004.29 15 £2,938.86
-
26.6%
Band 2 15 £2,120.06 25 £2,114.87 -0.2%
Band 3 50 £1,571.72 40 £1,538.71 -2.1%
Band 4 80 £1,122.29 50 £1,141.55 1.7%
Band 5 40 £879.59 25 £996.17 13.3%
Band 6 25 £720.33 10 £751.20 4.3%
Grand Total 220 £1,346.19 165 £1,758.39
The following points were noted:
In Band 1 25 awards were made and there is a pay gap in favour of females of
26.6%. Looking at the breakdown shows that all females awarded EY SAS in band 1
were made at the Standard or Maximum level, whereas 5 males were awarded the
basic level.

14
Band 5 shows a pay gap of 13.3% in favour of males for EY SAS awards. Again
reviewing the actual data shows that more awards were made at the lower level for
females than males.
The above is noted and considered as part of the audit recommendations.
3.4 Pay on promotion
The MRC policy on pay on promotion (e.g. Band 4 to 3) is that on promotion to a new band
employees will either (whichever is the greater of the two): receive a 7.5% consolidated
pay increase on their current pay point move onto the next equal (or higher pay point if
there is not an equal point) in the new band; or, progress to the minimum pay point of the
A section of the new band.
The below information reviews the average salary increase on promotion across different
bands during the three year period preceding 1st April 2015.
Table O) Average salary increase on promotion 2011/12 to 2014/15
:
The following points are noted:
Since the introduction of the SCP band in 2012 Oracle data indicated that there have
been no females promoted from band 1 to SCP. In comparison 5 males have been
promoted from band 1 to SCP over the same period;
Bands 1, 4 & 6 show a negligible gender difference in the average % salary increase
on promotion;
In band 2 there is 6% difference in favour of males being promoted. There are no
obvious factors that the difference can be attributed to;
In band 3 there is 4% difference in favour of males being promoted.
In band 5 there is 4% difference in favour of females being promoted. There are no
obvious factors that the difference can be attributed to.
15.3%
13.3%
15%
13.5%
20.1%
13%
16.2% 16.3%
19.3% 19%
14.2%
16.4%
12.8%
0%
5%
10%
15%
20%
25%
SCP Band 1 Band 2 Band 3 Band 4 Band 5 Band 6
Female
Male
15
The above is noted and considered as part of the audit recommendations.
Section 4: MRC overall pay gap analysis for other protected characteristics
A detailed analysis comparing each protected characteristic group by pay band has been
carried out and shared with MRC Remuneration Committee, Management Board and
National Trade Union Side.
The findings from this analysis are shared below however the full breakdown cannot be
shared the small sample size in some groups could lead to individuals being identified.
4.1 Ethnicity
Of the 1,935 staff employed on 1st April 2015 those identifying as white accounted for 77%
of all employees, those identifying as BME accounted for 14% of all employees, and those
choosing to withhold their ethnicity, 9%.
The data shows pay gaps at Bands SCP, Band 1 and 2. SCP and Band 2 show a gap in
favour of those identifying as white whilst Band 1 shows a gap in favour of those identifying
as BME. However, due to the small numbers of BME employees at senior levels the gaps
are not statistically relevant to investigate further.
In Bands 3 to 7 where there are larger numbers of those identifying as BME, there are no
relevant pay gaps to investigate. This demonstrates that, where there are more significant
sample sizes to allow for analysis, the MRC pay structure does not show any discrimination
in this area.
4.2 Disability
Of the 1,935 staff employed on 1st April 2015 those disclosing a disability accounted for 2%
of all employees. This has made any statistical analysis difficult due to very small numbers
of those disclosing disability in any one band.
From the limited data analysed no statistical pay gaps are present between those disclosing
a disability and those not.
4.3 Full time/Part Time staff
Of the 1,935 staff employed on 1st April 2015 part-time workers accounted for 12% of the
overall workforce. In addition 75% of the part-time population is female.
The numbers for comparison to full time roles are small but there are positive pay gaps for
part time employees across most bands. This demonstrates that there is no salary
disadvantage to those contracted to work part time.
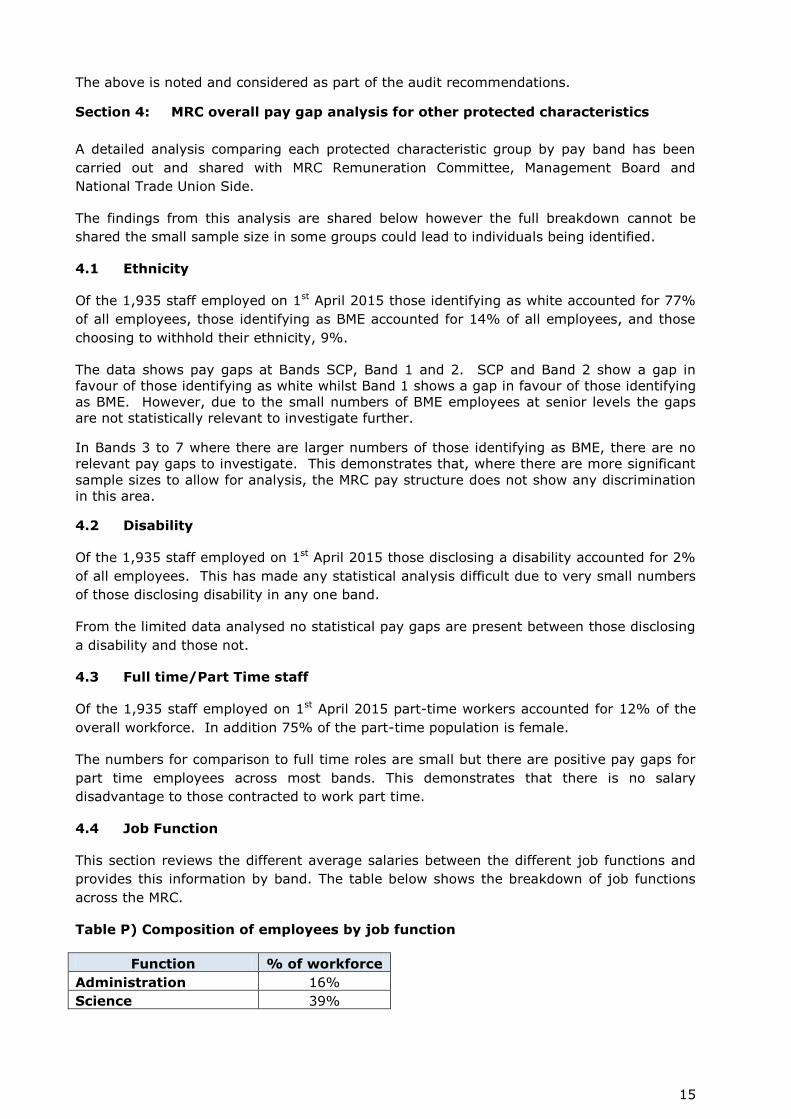
4.4 Job Function
This section reviews the different average salaries between the different job functions and
provides this information by band. The table below shows the breakdown of job functions
across the MRC.
Table P) Composition of employees by job function
Function % of workforce
Administration 16%
Science 39%

16
Science Support 24%
Technical 21%
Table Q) Average salary across each overall job function
Function Administration Science Science Support Technical
Average FTE Salary £36,656.81 £40,510.85 £32,196.99 £26,213.21
This table shows the average salary across each job function; however, as with the gender
analysis it is important to consider this in the context in the position of job functions across
the different pay bands.
Table R) Average salary across each overall job function by pay band
Function Administration Science Science Support Technical
SCP £125,602.00 £119,163.67
Band 1 £85,626.50 £83,587.23 £83,839.33
Band 2 £59,339.04 £60,374.44 £58,765.06 £62,266.75
Band 3 £44,273.65 £42,595.92 £42,460.53 £43,525.14
Band 4 £32,007.72 £30,114.90 £31,820.60 £32,733.34
Band 5 £25,065.98 £24,474.60 £24,851.95 £25,528.14
Band 6 £19,728.53
£18,576.08 £19,555.28
Band 7 £14,920.00 £16,023.88 £16,117.95
This table shows the average FTE salary for Job Function by pay band. It demonstrates a
similarity in the application of pay value across the functions. However it should be noted
that Science roles do not come out top in any band whereas Technical roles, despite not
having any staff in bands SCP and 1, do comparatively well. This is potentially caused by
higher numbers of staff in Science roles, giving a wider range of salaries, whereas Technical
roles are fewer and salaries likely more concentrated.

17
Conclusions
The MRC is committed to delivering equal treatment for all staff regardless of gender, race,
disability, staff group or employment status. Our pay gap reflects the greater incidence of
men at the higher ends of our pay scales and of women at the lower. This mirrors existing
patterns in the wider UK workforce, particularly within research and academia. It does not
mean that our pay practices are flawed, but we will examine them regularly to check their
justification, eliminate bias and maximise fairness.
The Equal Pay Audit underlines our commitment to monitoring our pay practices in order to
reward fairly the skills, experience and potential of all staff and thereby to increase
efficiency and enhance the MRC reputation.
We will continue to monitor pay data every year and seek on-going improvement as our
equal pay recommendations are adopted and put into practice.
We will commit to carrying out our next full Equal Pay Audit in three years, using data at 1st
April 2018. Not withstanding this, we will also publish our data as required in 2017 under
the Equality Act 2010.
Recommendations
These recommendations have been developed in partnership with the MRC Remuneration
Committee, Management Board and National Trade Union Side. A separate strand of work
will be started to look at their priority, implementation and timescales.
1) To work closely with those supporting Equalities and Diversity in relation to getting
more females into senior roles e.g. unconscious bias training, flexible working
arrangements, personal development plans, coaching;
2) To review in more depth:
a. those outliers who are over the maximum of Band 2;
b. the use of Job Evaluation for senior posts;
c. starting salaries on appointment
d. the use of Recruitment & Retention Allowances and Responsibility Allowances
3) To look in more depth at Special Awards including:
a. to consider setting a fixed amount for in-year SAS payments to eliminate any
bias on grade
b. to review End of Year Awards, so that there is not such a range of bonus
amounts in bands; ( to note that this has already been achieved, in 2016
awards there are now only 2 two set rates for each band (1 rate in band 6
and 7) instead of 3 rates)
4) To strengthen guidance and monitor pay on promotion with the HR teams across the
MRC to raise awareness of potential differences in pay promotion rates between
males and females;

18
Appendix 1 – MRC payscales at 1st April 2015
Point 1 Point 2 Point 3 Point 4 Point 5 Point 6 Point 7 Point 8 Point 9 Point 10 Point 11 Point 12 Point 13 Point 14 Point 15 Point 16 Point 17 Point 19
Band 1
S-zone £87,576 £89,508 £91,440 £93,372 £95,303 £97,235 £99,167 £99,999
B £81,780 £83,712 £85,644 £87,576 £89,508 £91,440 £93,372 £95,303
A £72,122 £74,054 £75,985 £77,917 £79,849 £81,780
Band 2
S-zone £65,060 £66,507 £67,954 £69,401 £70,847 £72,294 £74,054 £75,985
B £60,720 £62,167 £63,613 £65,060 £66,507 £67,954 £69,401 £70,847 £72,294
A £49,145 £50,591 £52,040 £53,486 £54,932 £56,379 £57,826 £59,273 £60,720
Band 3
S-zone £46,769 £47,851 £48,933 £50,016 £52,040 £53,486
B £43,520 £44,604 £45,686 £46,769 £47,851 £48,933 £50,016
A £37,024 £38,108 £39,191 £40,272 £41,356 £42,439 £43,520
Band 4
S-zone £35,405 £36,325 £37,244 £38,163 £39,191 £40,272
B £32,648 £33,567 £34,486 £35,405 £36,325 £37,244 £38,163
A £27,355 £28,007 £28,935 £29,863 £30,791 £31,719 £32,648
Band 5
S-zone £27,356 £27,987 £28,618 £29,248 £29,954 £30,791
B £25,463 £26,094 £26,724 £27,356 £27,987 £28,618 £29,248
A £21,733 £22,354 £22,976 £23,597 £24,219 £24,840 £25,463
Band 6
S-zone £20,783 £21,375 £21,967 £22,558 £23,150 £23,613 £24,844
B £19,600 £20,192 £20,783 £21,375 £21,967 £22,558 £23,150
A £16,838 £17,390 £18,083 £18,495 £19,047 £19,600
Band 7
S-zone £16,976 £17,409 £17,833 £19,047
B £16,119 £16,548 £16,976 £17,409 £17,833
A £15,170 £15,644 £16,119