Equal Pay Report 2019 Executive Summary
14
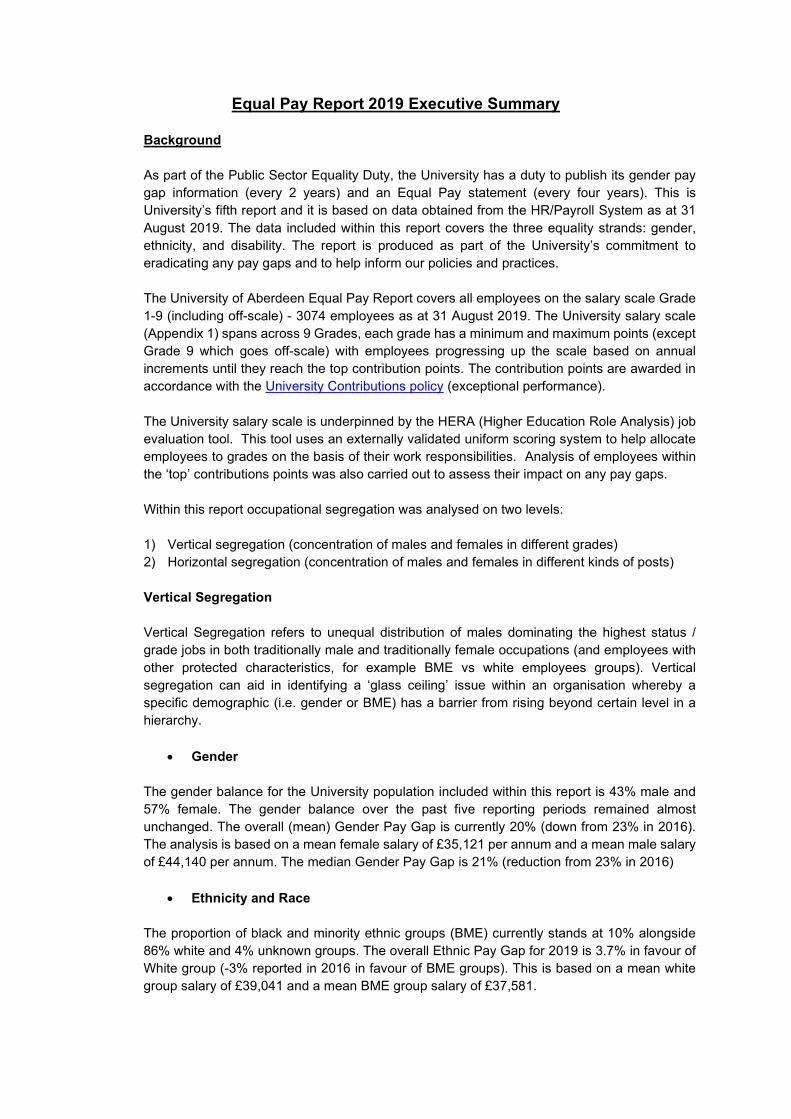
Equal Pay Report 2019 Executive Summary Background As part of the Public Sector Equality Duty, the University has a duty to publish its gender pay gap information (every 2 years) and an Equal Pay statement (every four years). This is University’s fifth report and it is based on data obtained from the HR/Payroll System as at 31 August 2019. The data included within this report covers the three equality strands: gender, ethnicity, and disability. The report is produced as part of the University’s commitment to eradicating any pay gaps and to help inform our policies and practices. The University of Aberdeen Equal Pay Report covers all employees on the salary scale Grade 1-9 (including off-scale) - 3074 employees as at 31 August 2019. The University salary scale (Appendix 1) spans across 9 Grades, each grade has a minimum and maximum points (except Grade 9 which goes off-scale) with employees progressing up the scale based on annual increments until they reach the top contribution points. The contribution points are awarded in accordance with the University Contributions policy (exceptional performance). The University salary scale is underpinned by the HERA (Higher Education Role Analysis) job evaluation tool. This tool uses an externally validated uniform scoring system to help allocate employees to grades on the basis of their work responsibilities. Analysis of employees within the ‘top’ contributions points was also carried out to assess their impact on any pay gaps. Within this report occupational segregation was analysed on two levels: 1) Vertical segregation (concentration of males and females in different grades) 2) Horizontal segregation (concentration of males and females in different kinds of posts) Vertical Segregation Vertical Segregation refers to unequal distribution of males dominating the highest status / grade jobs in both traditionally male and traditionally female occupations (and employees with other protected characteristics, for example BME vs white employees groups). Vertical segregation can aid in identifying a ‘glass ceiling’ issue within an organisation whereby a specific demographic (i.e. gender or BME) has a barrier from rising beyond certain level in a hierarchy. • Gender The gender balance for the University population included within this report is 43% male and 57% female. The gender balance over the past five reporting periods remained almost unchanged. The overall (mean) Gender Pay Gap is currently 20% (down from 23% in 2016). The analysis is based on a mean female salary of £35,121 per annum and a mean male salary of £44,140 per annum. The median Gender Pay Gap is 21% (reduction from 23% in 2016) • Ethnicity and Race The proportion of black and minority ethnic groups (BME) currently stands at 10% alongside 86% white and 4% unknown groups. The overall Ethnic Pay Gap for 2019 is 3.7% in favour of White group (-3% reported in 2016 in favour of BME groups). This is based on a mean white group salary of £39,041 and a mean BME group salary of £37,581.
Transcript of Equal Pay Report 2019 Executive Summary
Equal Pay Report 2019 Executive Summary
Background
As part of the Public Sector Equality Duty, the University has a duty to publish its gender pay gap information (every 2 years) and an Equal Pay statement (every four years). This is University’s fifth report and it is based on data obtained from the HR/Payroll System as at 31 August 2019. The data included within this report covers the three equality strands: gender, ethnicity, and disability. The report is produced as part of the University’s commitment to eradicating any pay gaps and to help inform our policies and practices. The University of Aberdeen Equal Pay Report covers all employees on the salary scale Grade 1-9 (including off-scale) - 3074 employees as at 31 August 2019. The University salary scale (Appendix 1) spans across 9 Grades, each grade has a minimum and maximum points (except Grade 9 which goes off-scale) with employees progressing up the scale based on annual increments until they reach the top contribution points. The contribution points are awarded in accordance with the University Contributions policy (exceptional performance). The University salary scale is underpinned by the HERA (Higher Education Role Analysis) job evaluation tool. This tool uses an externally validated uniform scoring system to help allocate employees to grades on the basis of their work responsibilities. Analysis of employees within the ‘top’ contributions points was also carried out to assess their impact on any pay gaps. Within this report occupational segregation was analysed on two levels: 1) Vertical segregation (concentration of males and females in different grades) 2) Horizontal segregation (concentration of males and females in different kinds of posts) Vertical Segregation Vertical Segregation refers to unequal distribution of males dominating the highest status / grade jobs in both traditionally male and traditionally female occupations (and employees with other protected characteristics, for example BME vs white employees groups). Vertical segregation can aid in identifying a ‘glass ceiling’ issue within an organisation whereby a specific demographic (i.e. gender or BME) has a barrier from rising beyond certain level in a hierarchy.
• Gender The gender balance for the University population included within this report is 43% male and 57% female. The gender balance over the past five reporting periods remained almost unchanged. The overall (mean) Gender Pay Gap is currently 20% (down from 23% in 2016). The analysis is based on a mean female salary of £35,121 per annum and a mean male salary of £44,140 per annum. The median Gender Pay Gap is 21% (reduction from 23% in 2016)
• Ethnicity and Race The proportion of black and minority ethnic groups (BME) currently stands at 10% alongside 86% white and 4% unknown groups. The overall Ethnic Pay Gap for 2019 is 3.7% in favour of White group (-3% reported in 2016 in favour of BME groups). This is based on a mean white group salary of £39,041 and a mean BME group salary of £37,581.
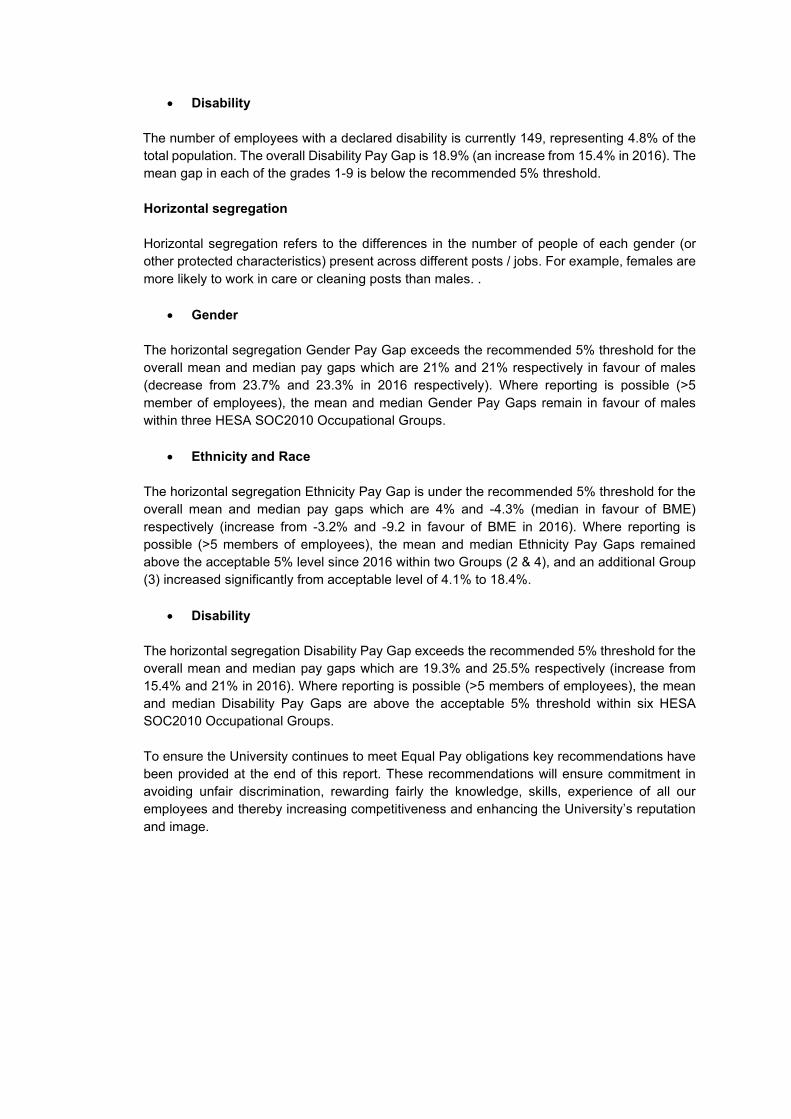
• Disability The number of employees with a declared disability is currently 149, representing 4.8% of the total population. The overall Disability Pay Gap is 18.9% (an increase from 15.4% in 2016). The mean gap in each of the grades 1-9 is below the recommended 5% threshold. Horizontal segregation Horizontal segregation refers to the differences in the number of people of each gender (or other protected characteristics) present across different posts / jobs. For example, females are more likely to work in care or cleaning posts than males. .
• Gender The horizontal segregation Gender Pay Gap exceeds the recommended 5% threshold for the overall mean and median pay gaps which are 21% and 21% respectively in favour of males (decrease from 23.7% and 23.3% in 2016 respectively). Where reporting is possible (>5 member of employees), the mean and median Gender Pay Gaps remain in favour of males within three HESA SOC2010 Occupational Groups.
• Ethnicity and Race The horizontal segregation Ethnicity Pay Gap is under the recommended 5% threshold for the overall mean and median pay gaps which are 4% and -4.3% (median in favour of BME) respectively (increase from -3.2% and -9.2 in favour of BME in 2016). Where reporting is possible (>5 members of employees), the mean and median Ethnicity Pay Gaps remained above the acceptable 5% level since 2016 within two Groups (2 & 4), and an additional Group (3) increased significantly from acceptable level of 4.1% to 18.4%.
• Disability
The horizontal segregation Disability Pay Gap exceeds the recommended 5% threshold for the overall mean and median pay gaps which are 19.3% and 25.5% respectively (increase from 15.4% and 21% in 2016). Where reporting is possible (>5 members of employees), the mean and median Disability Pay Gaps are above the acceptable 5% threshold within six HESA SOC2010 Occupational Groups. To ensure the University continues to meet Equal Pay obligations key recommendations have been provided at the end of this report. These recommendations will ensure commitment in avoiding unfair discrimination, rewarding fairly the knowledge, skills, experience of all our employees and thereby increasing competitiveness and enhancing the University’s reputation and image.

University of Aberdeen
Equal Pay Report – August 2019
1. Background 1.1 As part of the Public Sector Equality Duty, the University has a duty to publish its gender pay
gap information (every 2 years) and an Equal Pay Statement (every four years). This is University’s fifth report and it is based on data obtained from the HR/Payroll System as at 31 August 2019. The data included within this report covers the three equality strands: gender, ethnicity, and disability. The report is produced as part of the University’s commitment to eradicating any pay gaps and to help inform our policies and practices. The report is published in addition to the Gender Pay Gap report which has been produced each year since 2018 and follows a different methodology used in data analysis.
The University of Aberdeen four yearly Equal Pay Statement is included within the 2017 Mainstreaming and Equality Outcomes Report.
2. Methodology 2.1 This report follows the methodology and data set used in previous Equal Pay reports. The report
calculates the pay gap using mean (the method used in previous reviews) and median salaries (minimising the influence of salary extremes especially when employee numbers are small). Figures presented throughout the report correspond to mean and median salary values.
2.2 A horizontal pay gap has also been calculated for employees within the grade structure. For
the purposes of this report Grades 1-9 have been considered. The Grade 9 off-scale category refers to those employees who have been evaluated at the Grade 9 level but who are in receipt of salaries in excess of the Spinal Point 54 maximum and are hence considered ‘off-scale”. In line with previous reports, the data used in this report excludes the salaries of: Principal, Senior Vice-Principal, Vice- Principals, Clinicians and TUPE transfers with protected grades and where there are less than 5 employees in any group the data has been withheld to protect confidentiality.
2.3 An additional analysis has been carried out on employees who are in receipt of the ‘top’
contribution points within the grade structure. For each equality strand included in this report the number of people on a ‘top’ contribution point and those who received a contribution point(s) has been calculated and expressed as a percentage of the total population within the group.
2.4 Further analysis was carried out considering Standard Occupational Classification: SOC2010
– HESA. This analysis included the Principal, Senior Vice-Principal and Vice-Principals but excluded clinicians and TUPE transfer with protected grades.
3. Gender
3.1 The University employs a total of 3074 employees (as at 31 August 2019) - of this total, 1305
are male (43%) and 1769 are female (57%). The gender balance over the past five reporting periods remained almost unchanged.
3.2 The overall Gender Pay Gap based on a mean female salary of £35,121 and a mean male salary of £44,140 currently stands at 20% (and 21% based on median calculation). This is the lowest mean Gender Pay Gap since the reporting has started in 2007 (Tables 1 and 2 below). The median Gender Pay Gap is 21% (reduction from 23% in 2016).

Table 1
Pay Gap by Gender and Grade
Grade
Number of Employees MEAN (FTE Salary £'s) MEDIAN (FTE Salary £'s)
Female Male Total % of total population Female Male
Gap (%) Female Male
Gap (%)
1 212 83 295 10 17,389 17,389 0 17,389 17,389 0 2 70 53 123 4 18,701 18,674 0 19,133 19,133 0 3 216 109 325 11 21,600 21,893 1 22,417 22.417 0 4 194 89 283 9 25,664 26,416 3 26,328 26,715 1 5 264 140 404 13 30,975 30,851 0 31,865 31,865 0 6 328 231 559 18 38,176 38,291 0 39,152 40,323 3 7 274 219 493 16 46,962 47,690 1 41,114 49,552 3 8 137 211 348 11 58,402 58,645 0 59,135 59,135 0 9 21 33 54 2 65,027 65,778 1 64,605 66,539 3
9 Off 53 137 190 6 85,945 89,631 4 81,990 85,512 4 TOTAL 1769 1305 3074 100 35,121 44,140 20 31,865 40,323 21
Table 2 Mean Pay Gap by Gender and Grade (Annual Comparisons)
Grade
Mean Pay Gap %
2007 2010 2013 2016
2019 1 2% -1% -2% 0% 0 2 -6% -8% -1% -1% 0 3 2% 1% 2% 1% 1 4 5% 6% 2% 2% 3 5 0% 0% 1% 1% 0 6 1% 0% 1% 0% 0 7 0% 0% 0% 0% 1 8 2% 0% 1% 1% 0 9 2% 1% 1% 5% 1
9 Off 1% 2% 5% 7% 4 Total 29% 36% 25% 23% 20%
3.3 The percentage of female employees in Grades 1-7 is higher (63%) than in Grades 8-9 (37%) (Including Grade 9 Off-Scale). Within grades 8-9, the percentage of males is higher (64%) than females (36%) (Figure 1)

Figure 1
3.4 The imbalance of gender amongst the high and mid to lower grades can suggest that females
are facing a ‘glass ceiling’ which prevents them from entering / receiving promotion into the higher posts that are mainly occupied by males. Nonetheless, despite this imbalance of gender in the high and mid/low grades, the horizontal Gender Pay Gap at grade level shows acceptable gaps within the recommended 5% threshold throughout all grades (including Grade 9 Off-scale) – this is also an improvement from 2016, when the Grades 9 and 9 Off-scale had a mean Gender Pay Gap of 5% and 8% respectively.
3.5 Furthermore, more females continue to work part time compared to males. The percentage of females and employees is part –time posts is 73% and male 27%. The percentage of female employees in full-time posts currently stands at 49% and male at 51% - this represents only a minimal change from 2016, which was 48% and 52% respectively
3.6 A total of 137 females (increased from 119 in 2016) are in receipt of the ‘top’ contribution points
from an eligible population of 1695, hence an 8% representation. The total number of males in receipt of the ‘top’ contribution point cannot be included within this report due to low numbers (<5) within some grades (Table 3).
Table 3
Contribution Points By Gender & Grade
Grade
Number of Employees Number on Normal
Grade Point Number on Contribution
Point % On Contribution Point
Female Male Total Female Male Female Male Female Male
1 212 83 295 212 83 0 0 0 0
2 70 53 123 64 50 6 <5 8.6 **
3 216 109 325 203 90 13 19 6 17
4 194 89 283 175 67 19 22 9.8 24.7
5 264 140 404 240 127 24 13 9 9
6 328 231 559 317 220 11 11 3.4 4.8
7 274 219 493 240 203 34 16 12.4 7.3
8 137 211 348 107 167 30 44 21.9 20.9
63
3637
64
0
10
20
30
40
50
60
70
% Grades 1-7 % Grades 8-9
Gender Representation (Grades 1-7 & 8-9)
Female Male

Total 1695 1135 2830 1558 1007 137 ** 8 ** **/<5 – less than 5 employees within the group, data withheld due to confidentiality 0 (zero - no employees within the group) 4. Ethnicity and Race 4.1 The proportion of black and minority ethnic groups (BME) currently stands at 10% alongside
86% white and 4% unknown groups. The BME representation remained the same in comparison with 2016. The data demonstrates that the white group is more highly represented than BME group across all grades. This is contributed to the disproportion of the BME group in the overall University population
4.2 The overall Ethnicity Pay Gap for 2019 is 3.7% (Table 4) – an increase from -3% in 2016. This is based on a mean white group salary of £39,041 and a mean BME group salary of £37,581.
4.3 The horizontal Ethnicity Pay Gap at grade level shows that the mean gap in Grades 1-8 is below the recommended 5% threshold – which is similar to the figures reported in 2016. However Grade 9 off - scale saw an increase in the gap to 6% respectively from -38% in 2016. The gap for Grade 9 could not be included due to low numbers of employee within this grade.
Table 4
Pay Gap by Ethnicity and Grade
Grade Number of Employees MEAN Salary
(£'s) MEAN Gap
(%) MEDIAN Salary
(£'s) MEDIAN Gap (%)
BME
(BME) White (W)
Unknown (U) Total BME White BME/White BME White BME/White
1 43 240 12
295 17,389 17,389 0 17,389 17,389 0
2 8 111 <5
** 18,519 18,706 1 18,525 19,133 3
3 24 293 8 325 21,146 21,733 2.7 20,403 22,417 9
4 13 265 5 283 25,128 25,929 3 25,217 26,715 5.6
5 31 355 18 404 30,372 30,994 2 30,942 31,865 3
6 75 457 27 559 37,479 38,358 2 36,914 39,152 5.7
7 53 421 19 493 46,953 47,349 0.8 48,114 48,114 0
8 43 288 17 348 57,905 58,695 1 59,135 59,135 0
9 <5 50 <5 ** ** 65,627 ** ** 65,572 **
9 Off 9 173 8 190 83,609 89,217 6 81,818 84,005 2.6
Total ** 2653 ** 3074 37,581 39,041 3.7 36,379 34,803 -4.5 **/<5 – less than 5 employees within the group, data withheld due to confidentiality
0 (zero - no employees within the group)
4.4 A total of 14 employees from the BME group are in receipt of the ‘top’ contribution point (total eligible population cannot be reported due to low numbers of employees). The total number from the white group in receipt of the ‘top’ contribution point is 246 from an eligible population of 2430, representing 10% (slight decrease from 11% in 2016) (Table 5)
Table 5
Contribution Points by Ethnicity and Grade
Grade Number of Employees Number on Normal
Grade Point
Number on Contribution
Point
% on Contribution
Point
BME (BME) White (W) Unknown
(U) Total BME White BME White BME White
1 43 240 12
295 43 240 0 0 0 0

2 8 111
<5 <5 8 102 0 9 0 8
3 24 293 8 325 22 264 0 29 8 9.9
4 13 265 5 283 12 225 0 40 7.7 15
5 31 355 18 404 30 322 <5 33 ** 9
6 75 457 27 559 73 437 <5 20 ** 4
7 53 421 19 493 51 373 <5 48 ** 11
8 43 288 17 348 37 221 6 67 14 23
Total 290 2430 ** ** 276 2184 14 246 4.8 10 **/<5 – less than 5 employees within the group, data withheld due to confidentiality
0 (zero - no employees within the group) 5. Disability
5.1 The number of employees with a declared disability is currently 149, representing 4.8% of the
total population. For comparison, the number of employees declaring a disability in 2016 report was 103, representing less than 4% of the total population. In 2013, this figure was 35, representing 1% of the total population.
5.2 The overall Disability Pay Gap is 18.9% (Table 6). In comparison, the Disability Pay Gap for
2016 was 15% with a mean disabled group salary of £33,140 compared to non- disabled group salary £39,161. In 2013, the Disability Pay Gap was 11% and a mean disabled group salary of £31,972 compared to non-disabled group salary £35,980.
Table 6
Pay Gap by Disability and Grade
Grade Number of Employees MEAN Salary (£'s) MEAN Gap
(%) MEDIAN Salary (£'s) MEDIAN Gap (%)
Disabled Non-
Disabled Unknown Disabled Non-
Disabled Disabled /
Non-disabled Disabled Non-
Disabled Disabled / Non-
disabled
1 23 257 13 17,389 17,389 0 17,389 17,389 0
2 11 101 9 18,656 18,688 0.2 19,133 19,133 0
3 26 284 5 21,358 21,722 1.7 21,236 22,417 5
4 18 256 5 25,384 25,945 2 25,217 26,715 5
5 19 365 12 29,761 31,025 4 29,176 31,865 8
6 19 525 6 38,042 38,218 0.5 39,152 39,152 0
7 22 457 <5 48,100 47,255 -1.8 49,552 48,114 -3
8 6 327 0 58,007 58,618 1 59,135 59,135 0
9 <5 51 0 ** 65,535 ** ** 64,605 **
9 Off <5 180 0 ** 88,794 ** ** 83,996 **
Total ** 2803 ** ** 39,474 18.9 26,715 35,844 ** **/<5 – less than 5 employees within the group, data withheld due to confidentiality 0 (zero - no employees within the group)
5.3 A total of 9 disabled employees from an eligible population of 144 are in receipt of the ‘top’
contribution point, representing 6%. There are 248 non-disabled employees in receipt of the ‘top’ contribution point salary from an eligible population of 2572, representing 10.7% (Table 7). In 2016, a total of 10 disabled employees from an eligible population of 98 were in receipt of the ‘top’ contribution point, representing 10%. There were 241 non-disabled employees in receipt of the ‘top’ contribution point from an eligible population of 2310, representing 10%.
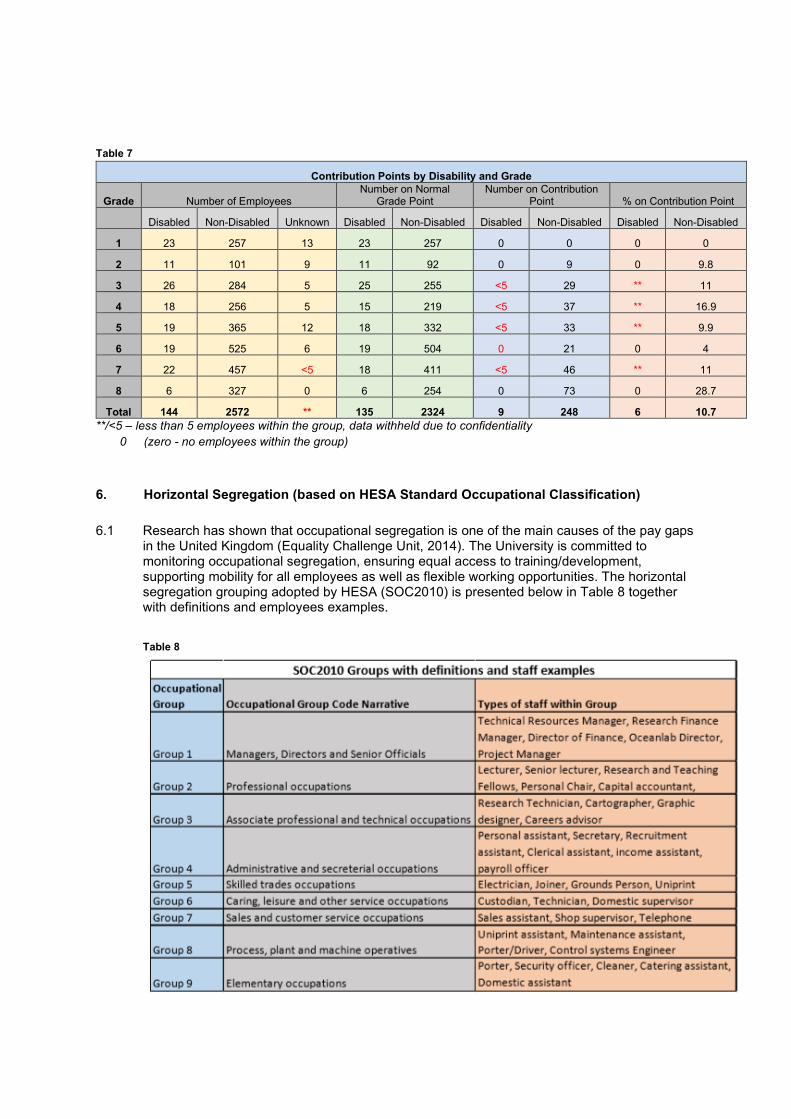
Table 7
Contribution Points by Disability and Grade
Grade Number of Employees Number on Normal
Grade Point Number on Contribution
Point % on Contribution Point
Disabled Non-Disabled Unknown Disabled Non-Disabled Disabled Non-Disabled Disabled Non-Disabled
1 23 257 13 23 257 0 0 0 0
2 11 101 9 11 92 0 9 0 9.8
3 26 284 5 25 255 <5 29 ** 11
4 18 256 5 15 219 <5 37 ** 16.9
5 19 365 12 18 332 <5 33 ** 9.9
6 19 525 6 19 504 0 21 0 4
7 22 457 <5 18 411 <5 46 ** 11
8 6 327 0 6 254 0 73 0 28.7
Total 144 2572 ** 135 2324 9 248 6 10.7 **/<5 – less than 5 employees within the group, data withheld due to confidentiality
0 (zero - no employees within the group)
6. Horizontal Segregation (based on HESA Standard Occupational Classification)
6.1 Research has shown that occupational segregation is one of the main causes of the pay gaps in the United Kingdom (Equality Challenge Unit, 2014). The University is committed to monitoring occupational segregation, ensuring equal access to training/development, supporting mobility for all employees as well as flexible working opportunities. The horizontal segregation grouping adopted by HESA (SOC2010) is presented below in Table 8 together with definitions and employees examples. Table 8

7. Gender
7.1 The spread of the University employees’ population across the 9 Standard Occupational Classifications (SOC2010) groups can be identified in Figure 2 below.
Figure 2
7.2 Horizontal segregation analysis according to HESA SOC2010 Occupational Groups shows
that none of the nine groups have comparable distribution of males and females. Group 1 consists of slightly higher number of females, Groups 3, 4, 6, 7 & 9 are characterised by a significantly higher distribution of females, whilst Groups 2,5 & 9 are characterised by a significantly higher number of males. (Figure 2)
7.3 Examples of imbalanced groups’ composition using the University ‘Post Long Description’ (F/M):
Group 2: Trial Manager (12/1) Group 3: Counsellor (8/0), HR Partner (5/1), IT Support Technician (2/8) Research Technician (21/5) Group 4: Administrative Assistant (11/1), Income Assistant (3/0), Information Assistant (13/3), Payroll officer (4/0), Personal Assistant (14/0), School Admin Officer (7/1), School Support Assistant (31/3), School Support Coordinator (11/1), Secretary (53/0), Senior Information Assistant (9/1), Senior Secretary (7/0) Group 5: Ground Person (1/10), Assistant Engineer/Electrician (0/4), Electrician (0/9), Engineer (0/6)
Group 8: Porter/Driver (0/13) Group 9: Cleaner (39/6), Domestic Assistant (27/0), Porter (1/12)
7.4 The imbalanced groups within the HESA Occupational Groups represent a wider socio –economic issue, whereby females and males are clustered into particular types of occupation,
e.g. more females working in Admin or Cleaning posts than males or more males working in Porter/Driver posts than females.
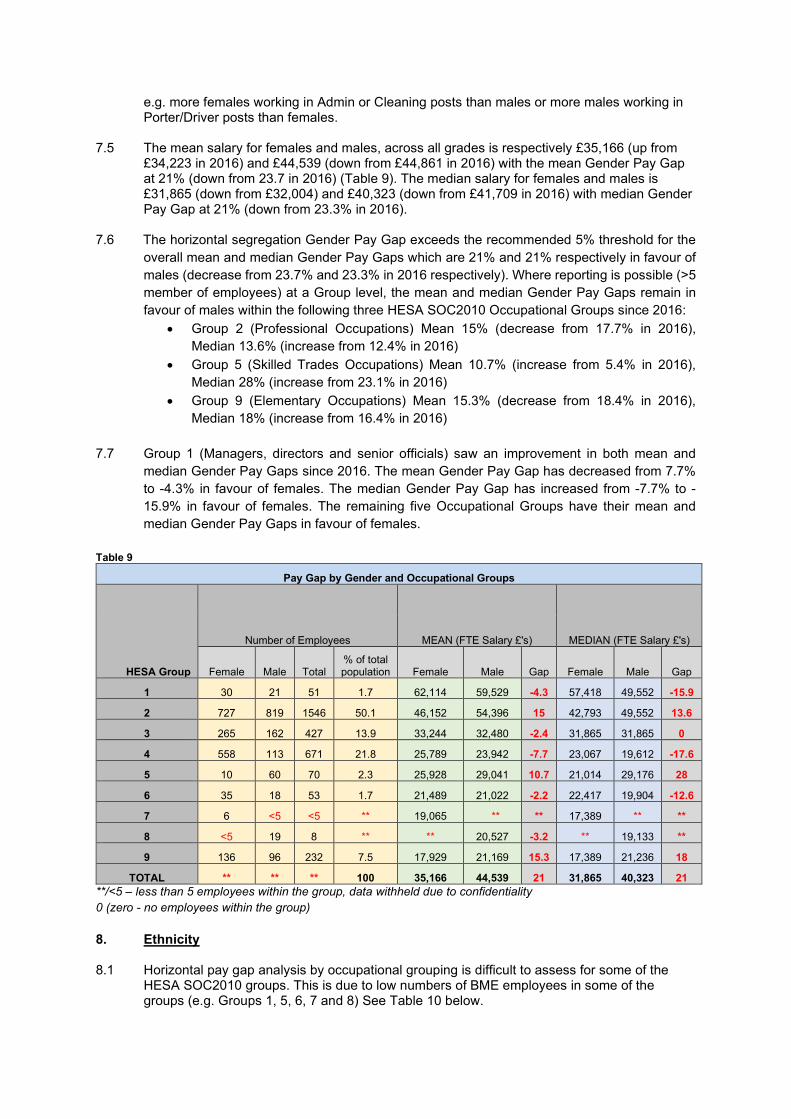
7.5 The mean salary for females and males, across all grades is respectively £35,166 (up from £34,223 in 2016) and £44,539 (down from £44,861 in 2016) with the mean Gender Pay Gap at 21% (down from 23.7 in 2016) (Table 9). The median salary for females and males is £31,865 (down from £32,004) and £40,323 (down from £41,709 in 2016) with median Gender Pay Gap at 21% (down from 23.3% in 2016).
7.6 The horizontal segregation Gender Pay Gap exceeds the recommended 5% threshold for the overall mean and median Gender Pay Gaps which are 21% and 21% respectively in favour of males (decrease from 23.7% and 23.3% in 2016 respectively). Where reporting is possible (>5 member of employees) at a Group level, the mean and median Gender Pay Gaps remain in favour of males within the following three HESA SOC2010 Occupational Groups since 2016:
• Group 2 (Professional Occupations) Mean 15% (decrease from 17.7% in 2016), Median 13.6% (increase from 12.4% in 2016)
• Group 5 (Skilled Trades Occupations) Mean 10.7% (increase from 5.4% in 2016), Median 28% (increase from 23.1% in 2016)
• Group 9 (Elementary Occupations) Mean 15.3% (decrease from 18.4% in 2016), Median 18% (increase from 16.4% in 2016)
7.7 Group 1 (Managers, directors and senior officials) saw an improvement in both mean and median Gender Pay Gaps since 2016. The mean Gender Pay Gap has decreased from 7.7% to -4.3% in favour of females. The median Gender Pay Gap has increased from -7.7% to - 15.9% in favour of females. The remaining five Occupational Groups have their mean and median Gender Pay Gaps in favour of females.
Table 9
Pay Gap by Gender and Occupational Groups
HESA Group
Number of Employees MEAN (FTE Salary £'s) MEDIAN (FTE Salary £'s)
Female Male Total % of total population Female Male Gap Female Male Gap
1 30 21 51 1.7 62,114 59,529 -4.3 57,418 49,552 -15.9
2 727 819 1546 50.1 46,152 54,396 15 42,793 49,552 13.6
3 265 162 427 13.9 33,244 32,480 -2.4 31,865 31,865 0
4 558 113 671 21.8 25,789 23,942 -7.7 23,067 19,612 -17.6
5 10 60 70 2.3 25,928 29,041 10.7 21,014 29,176 28
6 35 18 53 1.7 21,489 21,022 -2.2 22,417 19,904 -12.6
7 6 <5 <5 ** 19,065 ** ** 17,389 ** **
8 <5 19 8 ** ** 20,527 -3.2 ** 19,133 **
9 136 96 232 7.5 17,929 21,169 15.3 17,389 21,236 18
TOTAL ** ** ** 100 35,166 44,539 21 31,865 40,323 21 **/<5 – less than 5 employees within the group, data withheld due to confidentiality 0 (zero - no employees within the group) 8. Ethnicity
8.1 Horizontal pay gap analysis by occupational grouping is difficult to assess for some of the
HESA SOC2010 groups. This is due to low numbers of BME employees in some of the groups (e.g. Groups 1, 5, 6, 7 and 8) See Table 10 below.

8.2 The horizontal segregation Ethnicity Pay Gap is under the recommended 5% threshold for the
overall mean and median pay gaps which are 4.1% and -4.3% (median in favour of BME) respectively (increase from -3.2% and -9.2 in favour of BME in 2016). Where reporting is possible (>5 members of employees) at a Group level, the mean and median Ethnicity Pay Gaps remained above the acceptable 5% level since 2016 within two Groups (2 & 4), and an additional Group (3) increased significantly from acceptable level of 4.1% to 18.4%. The mean and median Ethnicity Pay Gaps for these HESA SOC2010 Occupational Groups are as below:
• Group 2 (Professional Occupations) Mean 10.4% (decrease from 13.4% in 2016),
Median 11% (unchanged) • Group 3 (Associate professional and technical Occupations) Mean 18.4% (increase
from 4.1% in 2016), Median 21% (increase from 11% in 2016) • Group 4 (Administrative and secretarial occupations) Mean 22.5% (increase from
16.7% in 2016), Median 24.6% (increase from 17.2% in 2016)
8.3 Two Occupational Groups (1 & 8) did not have any BME representation within them; therefore no Ethnicity Pay Gap has been calculated. Three Occupational Groups (5, 6, 7) cannot have their Ethnicity Pay Gap included in this report due to low numbers of employees (<5) within them. Group 9 has the Ethnicity Pay Gap within the recommended threshold 3.6% (an increase from 0.5% in 2016).
Table 10
Pay Gap by Ethnicity and Occupational Groups
HESA Group
Number of Employees MEAN (FTE Salary £'s) MEDIAN (FTE Salary £'s)
BME White Unknown % of total population BME White Gap BME White Gap
1 0 50 <5 ** N/A 61.088 N/A N/A 55,775 N/A
2 196 1274 76 50.1 45,868 51,220 10.4 42,793 48,114 11
3 31 381 15 13.9 27,259 33,413 18.4 25,217 31,865 21
4 50 598 23 21.8 20,088 25,936 22.5 17,389 23,067 24.6
5 <5 65 <5 ** ** 28,649 ** ** 28,332 **
6 <5 50 0 ** ** 21,501 ** ** 21,814 **
7 <5 6 <5 ** ** 19,065 ** ** 17,389 **
8 0 22 0 0.7 N/A 20,616 N/A N/A 19,133 N/A
9 17 211 <5 ** 18,649 19,355 3.6 17,389 17,389 0
TOTAL 300 2657 123 100 37,581 39,194 4.1 36,379 34,803 -4.3 **/<5 – less than 5 employees within the group, data withheld due to confidentiality 0 (zero - no employees within the group) 9. Disability 9.1 The horizontal segregation Disability Pay Gap (Table 11) exceeds the recommended 5%
threshold for the overall mean and median pay gaps which are 19.3% and 25.5% respectively (increase from 15.4% and 21% in 2016). Where reporting is possible (>5 members of employees), the mean and median Disability Pay Gaps are above the acceptable 5% threshold within the three following HESA SOC2010 Occupational Groups:
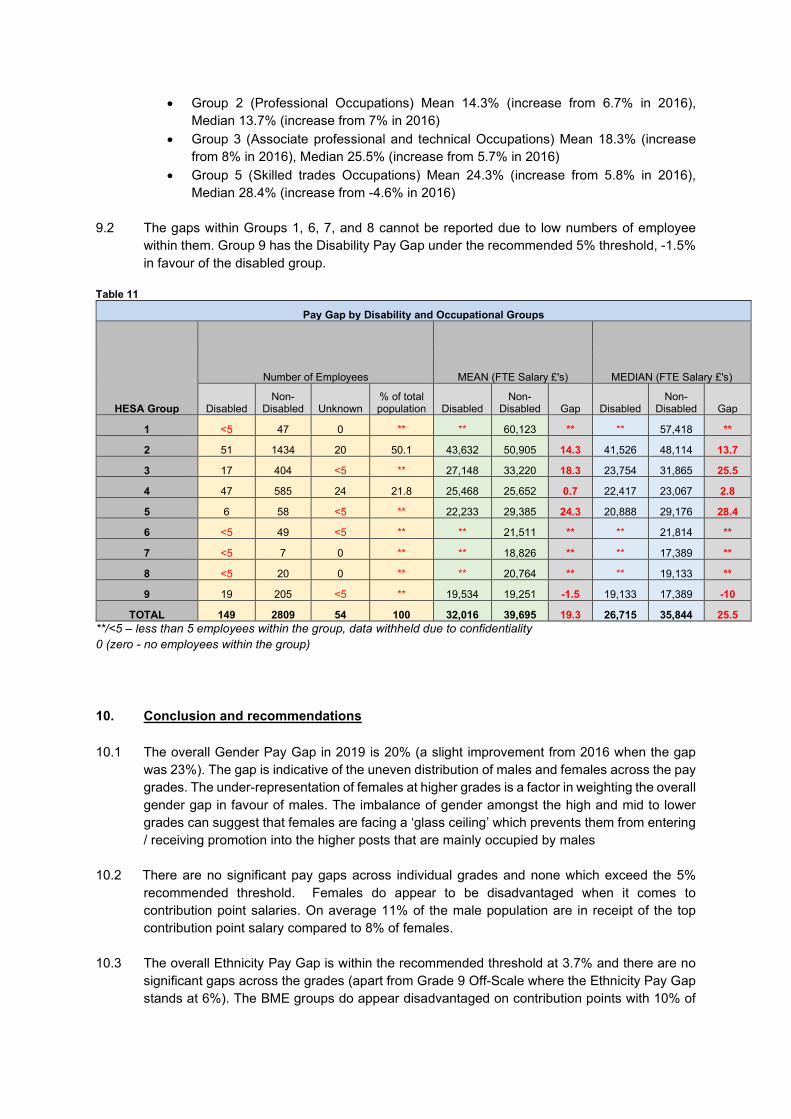
• Group 2 (Professional Occupations) Mean 14.3% (increase from 6.7% in 2016), Median 13.7% (increase from 7% in 2016)
• Group 3 (Associate professional and technical Occupations) Mean 18.3% (increase from 8% in 2016), Median 25.5% (increase from 5.7% in 2016)
• Group 5 (Skilled trades Occupations) Mean 24.3% (increase from 5.8% in 2016), Median 28.4% (increase from -4.6% in 2016)
9.2 The gaps within Groups 1, 6, 7, and 8 cannot be reported due to low numbers of employee
within them. Group 9 has the Disability Pay Gap under the recommended 5% threshold, -1.5% in favour of the disabled group.
Table 11
Pay Gap by Disability and Occupational Groups
HESA Group
Number of Employees MEAN (FTE Salary £'s) MEDIAN (FTE Salary £'s)
Disabled Non-
Disabled Unknown % of total population Disabled
Non-Disabled Gap Disabled
Non-Disabled Gap
1 <5 47 0 ** ** 60,123 ** ** 57,418 **
2 51 1434 20 50.1 43,632 50,905 14.3 41,526 48,114 13.7
3 17 404 <5 ** 27,148 33,220 18.3 23,754 31,865 25.5
4 47 585 24 21.8 25,468 25,652 0.7 22,417 23,067 2.8
5 6 58 <5 ** 22,233 29,385 24.3 20,888 29,176 28.4
6 <5 49 <5 ** ** 21,511 ** ** 21,814 **
7 <5 7 0 ** ** 18,826 ** ** 17,389 **
8 <5 20 0 ** ** 20,764 ** ** 19,133 **
9 19 205 <5 ** 19,534 19,251 -1.5 19,133 17,389 -10
TOTAL 149 2809 54 100 32,016 39,695 19.3 26,715 35,844 25.5 **/<5 – less than 5 employees within the group, data withheld due to confidentiality 0 (zero - no employees within the group)
10. Conclusion and recommendations
10.1 The overall Gender Pay Gap in 2019 is 20% (a slight improvement from 2016 when the gap was 23%). The gap is indicative of the uneven distribution of males and females across the pay grades. The under-representation of females at higher grades is a factor in weighting the overall gender gap in favour of males. The imbalance of gender amongst the high and mid to lower grades can suggest that females are facing a ‘glass ceiling’ which prevents them from entering / receiving promotion into the higher posts that are mainly occupied by males
10.2 There are no significant pay gaps across individual grades and none which exceed the 5%
recommended threshold. Females do appear to be disadvantaged when it comes to contribution point salaries. On average 11% of the male population are in receipt of the top contribution point salary compared to 8% of females.
10.3 The overall Ethnicity Pay Gap is within the recommended threshold at 3.7% and there are no
significant gaps across the grades (apart from Grade 9 Off-Scale where the Ethnicity Pay Gap stands at 6%). The BME groups do appear disadvantaged on contribution points with 10% of
the white group in receipt of the ‘top’ contribution point salary compared to only 4.8% of BME group.
10.4 The number of colleagues who have a declared disability is low; it equates to 4.8% of the total
population of employees at the University and these low numbers of declared disability could contribute to the fluctuation of the gap for this characteristic. The overall Disability Pay Gap is 18.9%, the disabled group appears disadvantaged on contribution points with 10.7% of non-disabled group in receipt of the ‘top’ contribution point salary compared to only 6% of disabled group.
10.5 The horizontal segregation Gender Pay Gap crosses the recommended 5% threshold at three
different HESA Occupational Groups. The gap is in favour of males at 15% for Group 2 (Professional occupations), 10.7% for Group 5 (Skilled trade occupations) and 15.3% for Group 9 (Elementary occupations). The gap (mean calculation) is -4.3, -2.4, -7.7, -2.2, -3.2, in favour of females in Groups 1, 3, 4, 6, and 8.
10.6 Due to the low numbers of BME employees in some of the HESA Occupational Groups it is
difficult to assess the Ethnicity Pay Gap at each Group level. Where measurements are possible, the Ethnicity Pay Gap by Occupational Groups exceeds the 5% threshold for three groups: Group 2 (mean gap 10.4%, median gap 11%), Group 3 (mean gap 18.4%, median gap 21%), and Group 4 (mean gap 22.5%, median gap 24.6%). The overall Ethnicity Pay Gap based on mean salaries is below the recommended threshold at 4.1% (median -4.3%).
10.7 Similarly, due to the low numbers of declared disabled employees in some of the HESA
Occupational Groups it is difficult to assess the Disability Pay Gap at each group level. Where measurements are possible, the Disability Pay Gap by Occupational Groups exceeds the 5% threshold for three groups: Group 2 (mean gap 14%, median gap 13.7%), Group 3 (mean gap 18.3%, median gap 25.5%). Group 5 (mean gap 24.3%, median gap 28.4%). The overall Disability Pay Gap based on mean salaries is 19.3% (median 25.5%). For Group 9, the mean and median Disability Pay Gap is in favour of the disabled groups (-1.5% and -10% respectively)
Recommendations
• Undertake a robust Equal Pay audit which will follow all criteria required for the audit as per the JNCHES and the Equality and Human Rights Commission guidelines
• All gaps of 5%> or repeated gaps of 3% to be investigated on an annual basis • Continue to monitor the rates of successful and unsuccessful promotions/regrading
applicants within each of the protected characteristics included in this report • Monitor the pay gap in relation to the protected characteristics included in this report in
relation to promotions and salaries at appointment • Undertake a review of internal and external recruitment outcomes and practices • Participate in job fairs or apprenticeships programmes which can target job
opportunities to individuals from the under-represented gender • Work with local schools to promote positive role models in occupations which have
historically been dominated by one particular gender • For future reports, include analysis of the number of the employees who received a
contribution award in within each protected characteristics included in this report • Continued commitment to Athena SWAN across the University to ensure that action
plans are implemented and monitored • Continue to deliver the unconscious bias training to University employees

• Continue to monitor the representation across the equality strands within the University Committees and influential bodies
• Continue to offer flexible working and review procedures regularly to ensure they continue to meet the University and employees’ needs
• Continue the development of the Unconscious Bias Observer scheme within the University to eradicate any discriminatory behaviour in promotions panels
• Continue with a Blind Review of anonymised promotions and regrading applications to reduce the potential for unconscious bias and ensure that all interviewers/panellists have undergone unconscious bias training
• Ensure that females have the opportunity and ability to progress their careers within the University through talent management and on-going personal development. Continue to offer mentoring and coaching programmes to our employees
• Continue the work of the Senior Women’s Network. This network meets to identify and address the issues that are central to career development for female colleagues and particularly those in, or aspiring to, senior positions.