Monetization thru business intelligence
43
Putting Data to Use: Business Intelligence and Analytics Jan 2015
-
Upload
yadu-balehosur -
Category
Data & Analytics
-
view
91 -
download
0
Transcript of Monetization thru business intelligence

Putting Data to Use:
Business Intelligence and Analytics
Jan 2015

2
Contents
• About Us
• Uses of Data
• BI Applications
• BI Platform
• Customer Analytics

ABOUT US
4
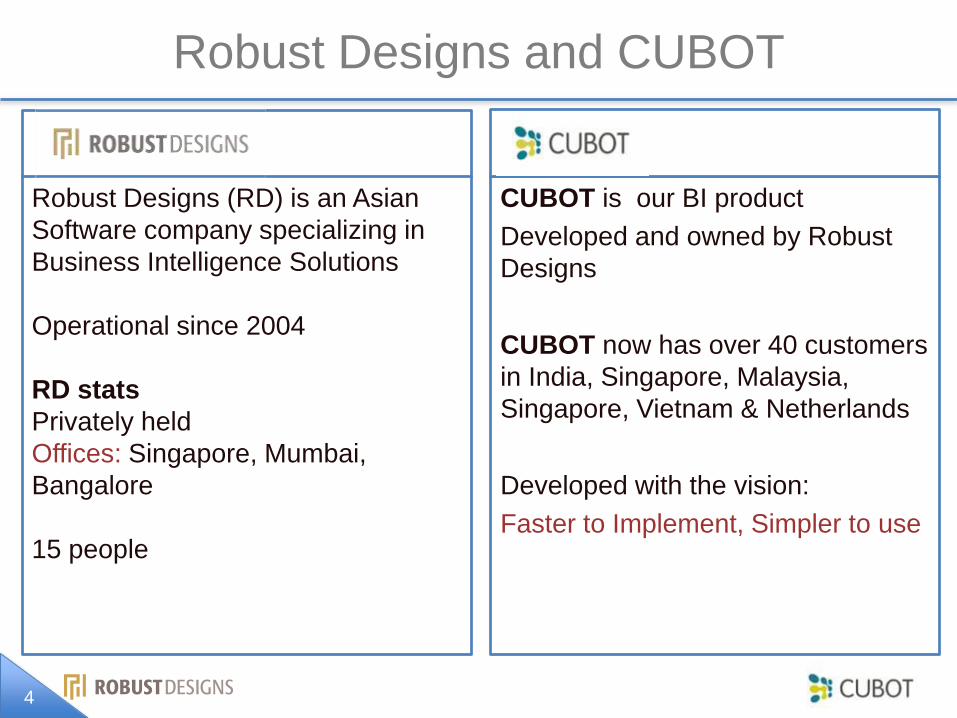
CUBOT
CUBOT is our BI product
Developed and owned by Robust
Designs
CUBOT now has over 40 customers
in India, Singapore, Malaysia,
Singapore, Vietnam & Netherlands
Developed with the vision:
Faster to Implement, Simpler to use
Robust Designs and CUBOT
CUBOT
Robust Designs (RD) is an Asian
Software company specializing in
Business Intelligence Solutions
Operational since 2004
RD stats
Privately held
Offices: Singapore, Mumbai,
Bangalore
15 people
5
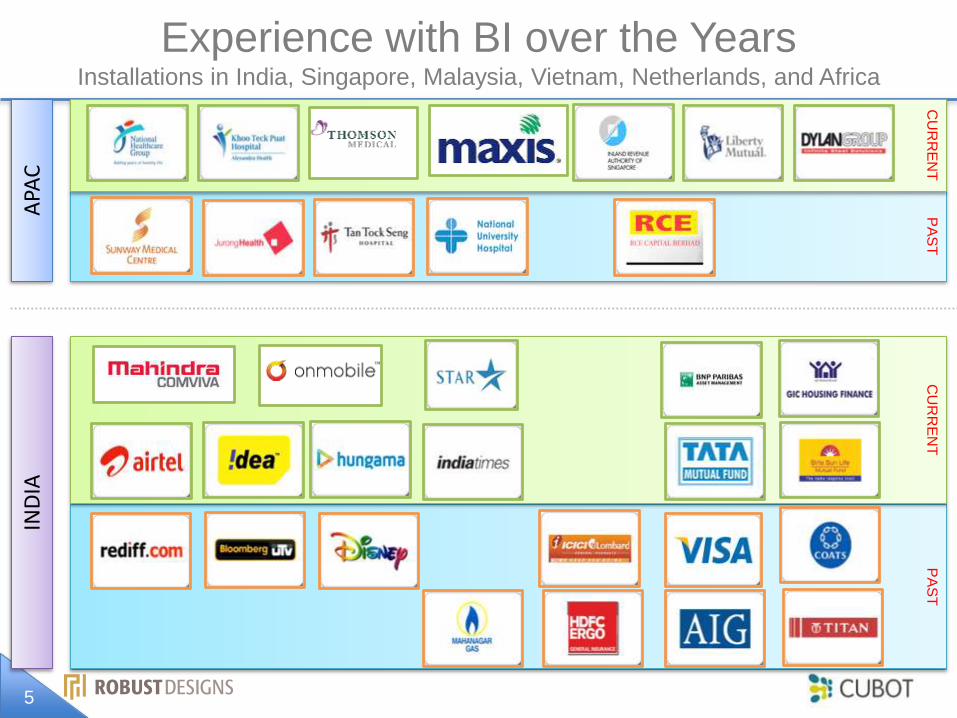
Experience with BI over the YearsInstallations in India, Singapore, Malaysia, Vietnam, Netherlands, and Africa
PA
ST
CU
RR
EN
TA
PAC
IND
IAP
AS
TC
UR
RE
NT
6
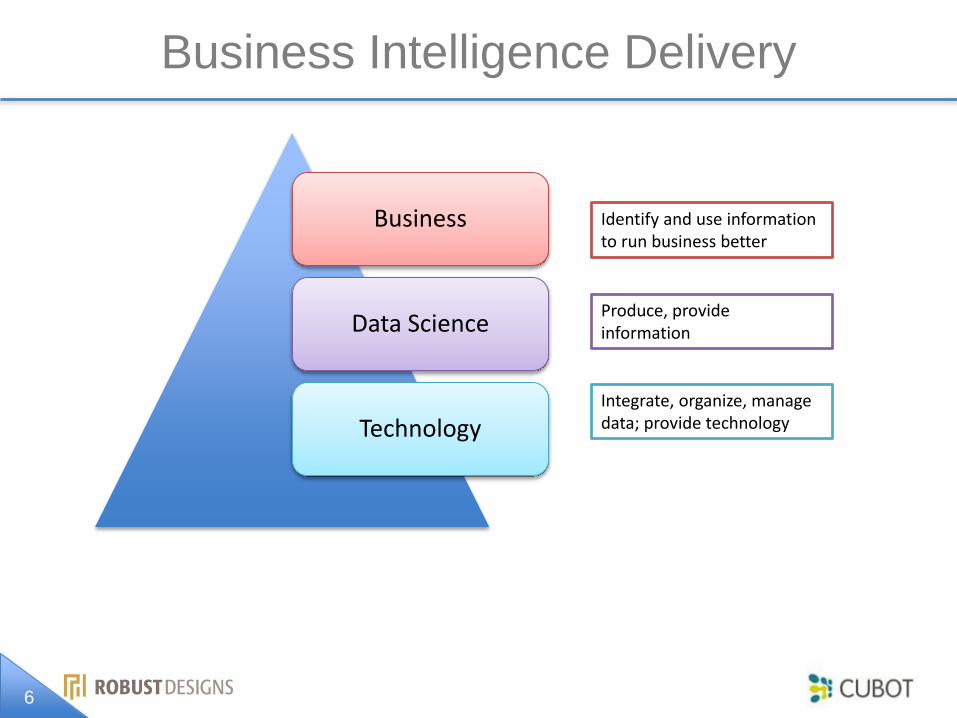
Business Intelligence Delivery
Business
Data Science
Technology
Identify and use information to run business better
Produce, provide information
Integrate, organize, manage data; provide technology
7
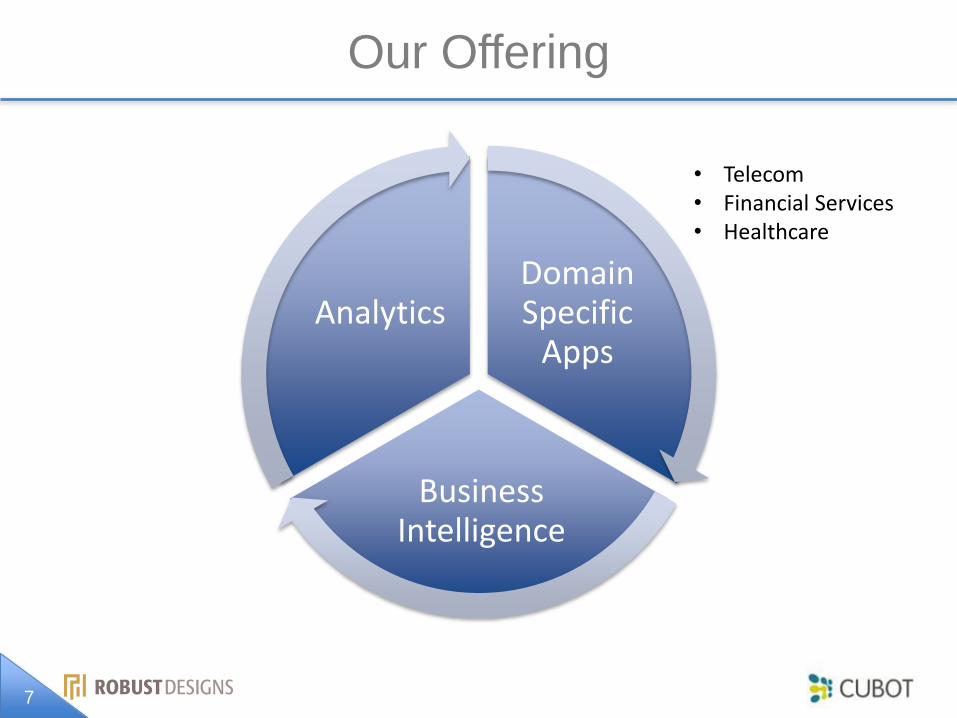
Our Offering
Domain Specific
Apps
Business Intelligence
Analytics
• Telecom• Financial Services• Healthcare

USES OF DATA
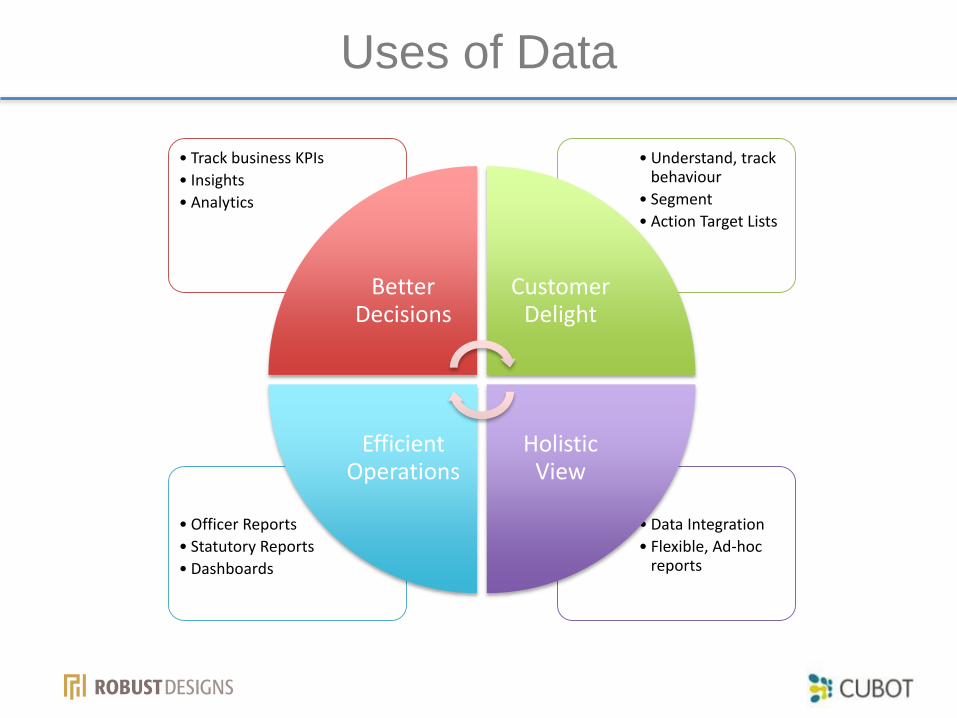
Uses of Data
• Data Integration
• Flexible, Ad-hoc reports
• Officer Reports
• Statutory Reports
• Dashboards
• Understand, track behaviour
• Segment
• Action Target Lists
• Track business KPIs
• Insights
• Analytics
Better Decisions
Customer Delight
Holistic View
Efficient Operations

10
Integration, Perspectives
Adaptors for industry
standard databases
Adaptors for enterprise
applicationsConnectors for XML, Excel, CSV,
Custom
CUBOT Data
Warehouse
Vertical ERP
Systems
SUN General
Ledger
Budgeting
SpreadsheetsExternal Data
EXTRACT, TRANSFORM, LOAD
Holistic View
Data Perspectives

Operations and StatutoryReports
CREDIT
PROCESSING
ARREARS,
PROVISION
DISBURSEMENT FOLLOW-UP
COLLECTIONLEGAL
PROCEEDING
TIME
PRODUCTSOLICITOR
BRANCHCUSTOMER
COMPANY
SALES
Top branches, Agents
OPERATIONS
Customer Services, Credit Applications Processing
FINANCE
Cash-flow, Statutory, Provisioning
COLLECTIONS
Arrears Analysis, Follow up lists and effectiveness, NPL
profile
Data Model
Reports
12
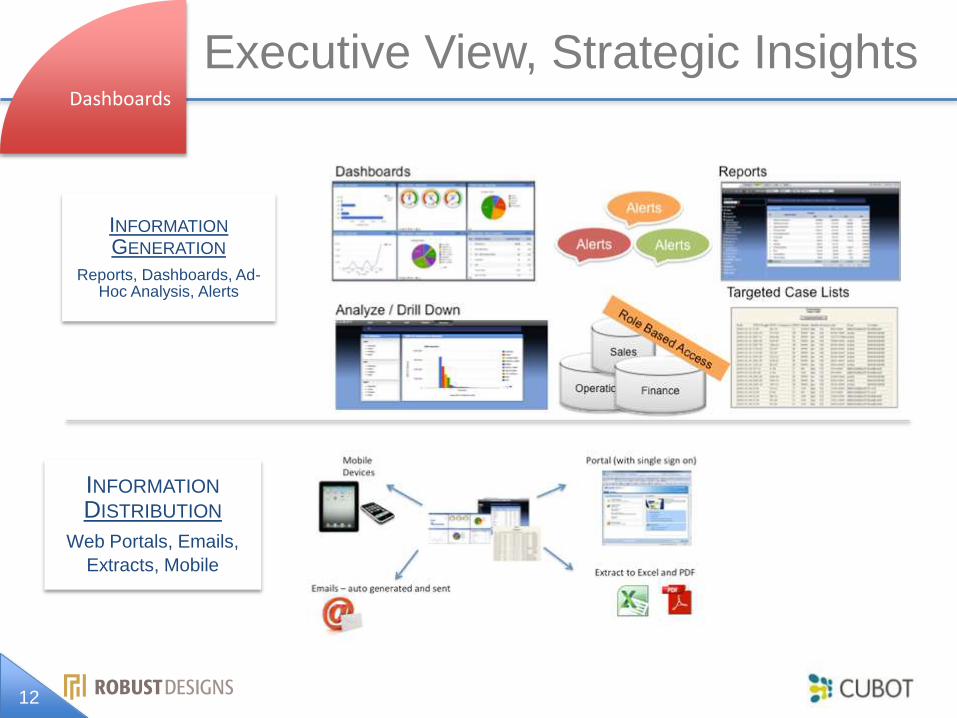
Executive View, Strategic Insights
INFORMATION
GENERATION
Reports, Dashboards, Ad-Hoc Analysis, Alerts
INFORMATION
DISTRIBUTION
Web Portals, Emails,
Extracts, Mobile
Dashboards

Segmentation, Targeted Lists
Analytics
• Popular Products
• Related Products
• By Category, Geography, Timeline
PRODUCT
ANALYTICS
• Campaigns On Demand
• Campaign Effectiveness
MARKETING
ANALYTICS
• Micro Segmented Sales
• Sales Performance Management
SALES
ANALYTICS
360O
CUSTOMER
VIEW
CU
ST
OM
ER
A
NA
LY
TIC
S
TRACKPROFILE, DISCOVER
SEGMENT
ACTION
EACH
SEGMENT
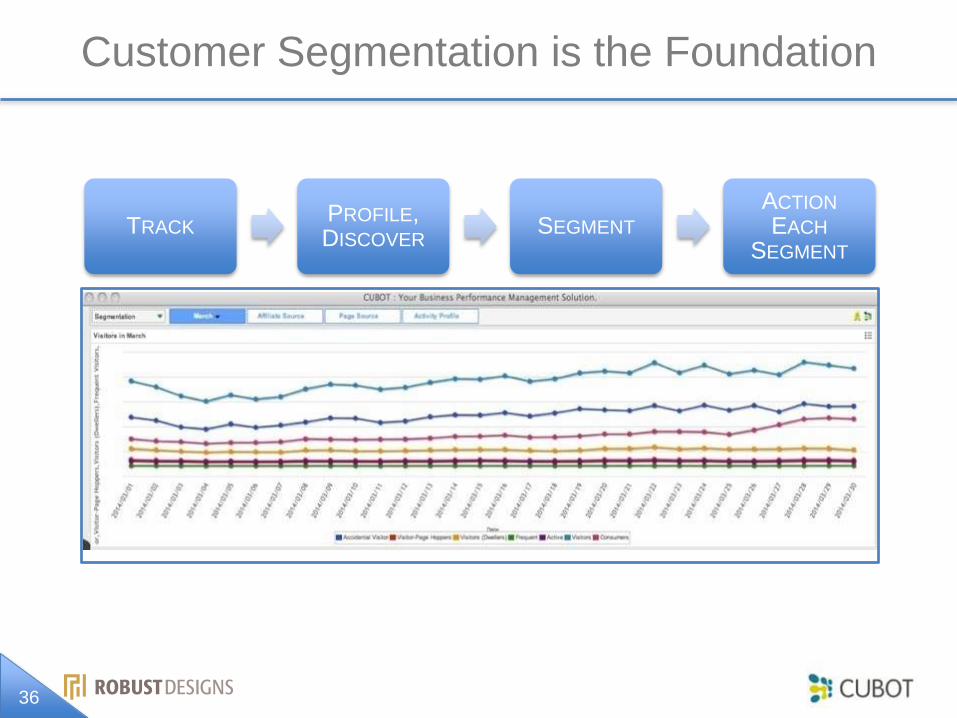
Analytics Process
Analytics Output
BI APPLICATIONS
Financial Services, Healthcare, Telecom, Tax Authority, &
Manufacturing
15
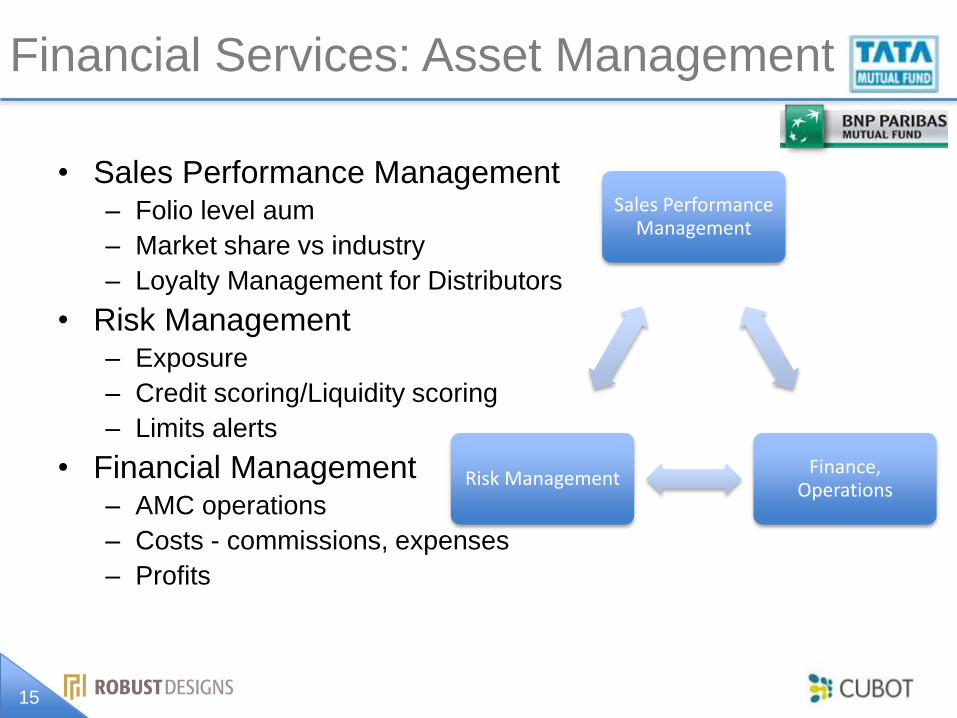
Financial Services: Asset Management
• Sales Performance Management– Folio level aum
– Market share vs industry
– Loyalty Management for Distributors
• Risk Management– Exposure
– Credit scoring/Liquidity scoring
– Limits alerts
• Financial Management– AMC operations
– Costs - commissions, expenses
– Profits
Sales Performance Management
Finance, Operations
Risk Management

Financial Services: General Insurance
OPERATIONS
CLAIMS
RISK
REINSURANCE
FINANCE
UNDERWRITING
MARKETING
SALES
PERSONAL LINES
• Personal Auto
• Health
• Home
• Travel
• Personal Accident
• Student Medical
COMMERCIAL LINES
• Commercial Auto
• Health
• Fire
• Engineering
• Marine
• Liability
• Property
• Crime

Financial Services: Microfinance
SalesTop branches, Agents
OperationsCustomer Services, Credit Applications Processing
FinanceCashflow, Statutory,Provisioning
CollectionsArrears Analysis, Follow up lists and effectiveness, NPL profile
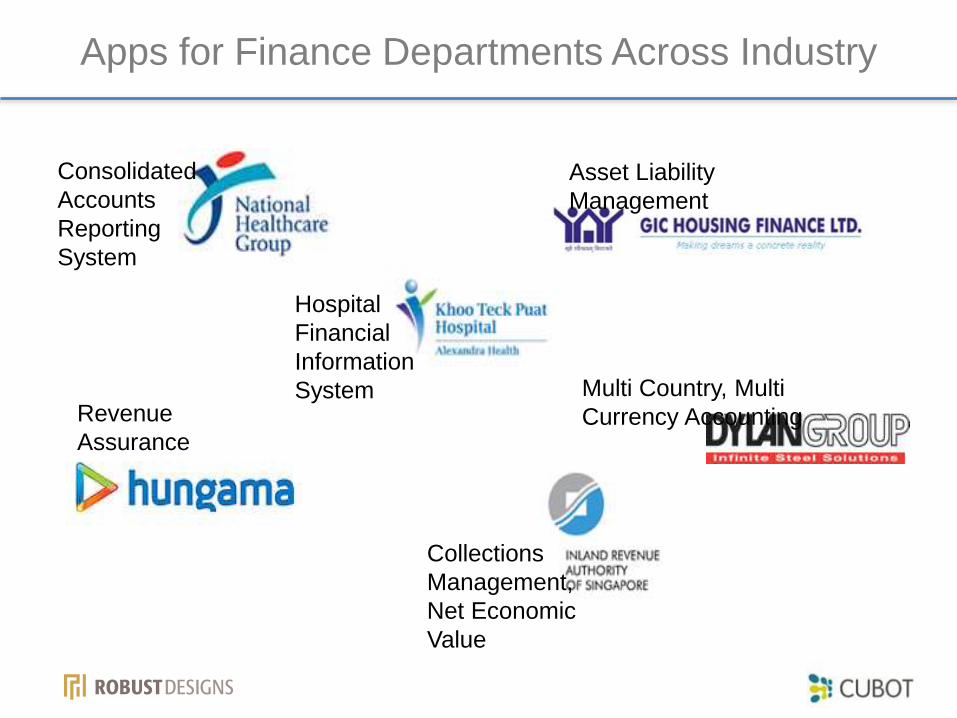
Apps for Finance Departments Across Industry
Consolidated
Accounts
Reporting
System
Hospital
Financial
Information
SystemRevenue
Assurance
Asset Liability
Management
Collections
Management,
Net Economic
Value
Multi Country, Multi
Currency Accounting

19
Healthcare: Public Hospital Bills and Costs
Business Challenge
• There is always a high demand for fast, reliable, up-to-date and affordable information. A lot of available information is not easily accessible by the business users.
• On the other hand, what is alarming is the huge amount of redundant information and reports, causing a problem of “information overload”.
Solution
• FISH – Financial Information System for Hospitals, consolidates useful information, and presents them in an easily understandable format.
• Up-to-date information such as patient bills, visits, hospital and departmental financial results, workloads, referrals are just few clicks away.
Benefits
• By assisting management to make well informed decisions, FISH enables the management to have more effective and efficient control of each patient service and its development and support processes.
• Accelerates implementation of any new service or organizational change.
• The system improves cost transparency and is being used for comparing actual performance against benchmarking cost data.
20
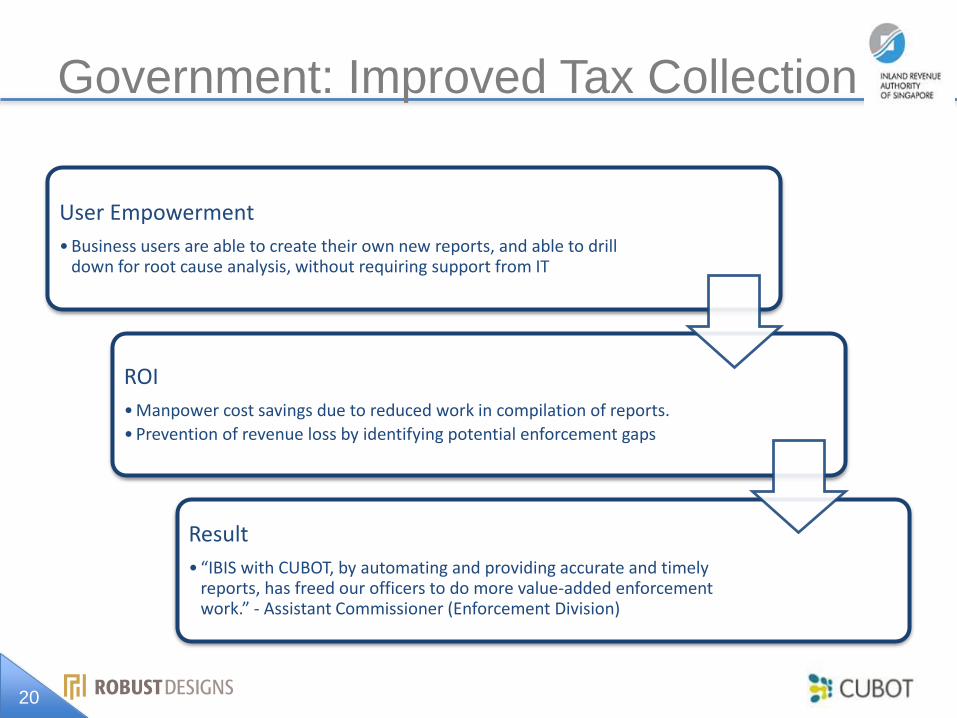
Government: Improved Tax Collection
User Empowerment
• Business users are able to create their own new reports, and able to drill down for root cause analysis, without requiring support from IT
ROI
• Manpower cost savings due to reduced work in compilation of reports.
• Prevention of revenue loss by identifying potential enforcement gaps
Result
• “IBIS with CUBOT, by automating and providing accurate and timely reports, has freed our officers to do more value-added enforcement work.” - Assistant Commissioner (Enforcement Division)
21
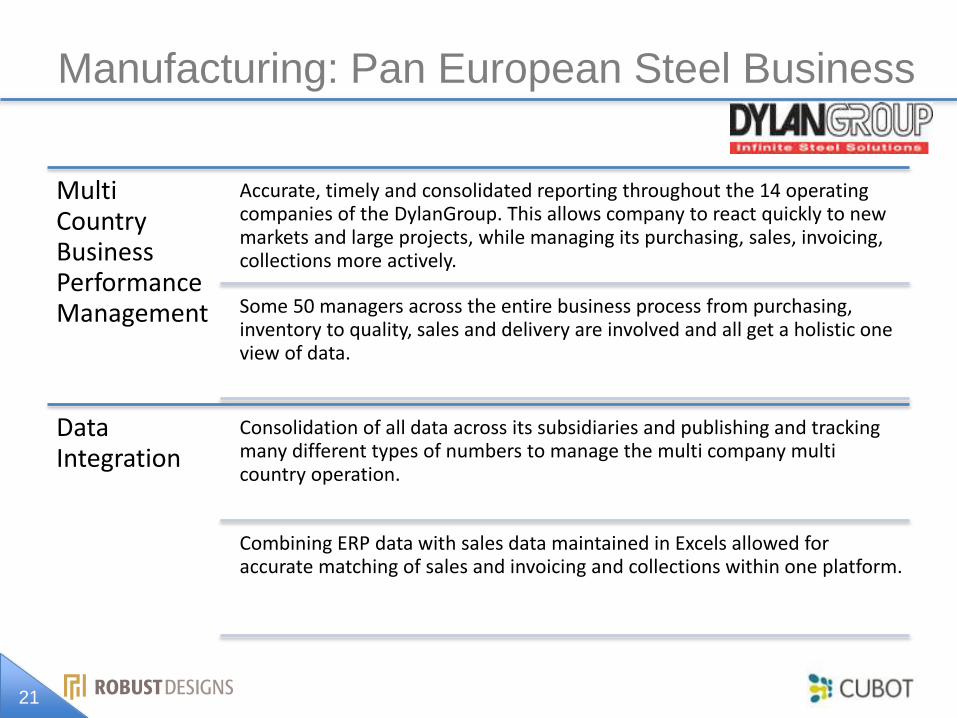
Manufacturing: Pan European Steel Business
Multi Country Business Performance Management
Accurate, timely and consolidated reporting throughout the 14 operating companies of the DylanGroup. This allows company to react quickly to new markets and large projects, while managing its purchasing, sales, invoicing, collections more actively.
Some 50 managers across the entire business process from purchasing, inventory to quality, sales and delivery are involved and all get a holistic one view of data.
Data Integration
Consolidation of all data across its subsidiaries and publishing and tracking many different types of numbers to manage the multi company multi country operation.
Combining ERP data with sales data maintained in Excels allowed for accurate matching of sales and invoicing and collections within one platform.

22
Telecom: Value Added Services
Business Process KPIs

BI PLATFORM – DATA
ACQUISITION TO ACTIONABLE
INTELLIGENCE

Covering the BI Continuum with CUBOT
•CUBOT ETL front
end with automated
processes + Perl
based data extract
from varied data
sources
•Parallel processing
DATA ACQUISITION
•CUBOT OLAP using
SQL on
•Relational (MySQL,
MS SQL) or
•Column DB
(InfiniDB,
Vectorwise)
DATA MANAGEMENT
•CUBOT Formulas
•AWK Scripts
•R based statistics
BUSINESS ANALYTICS
•SVG package with
wrapper
•CUBOT dashboard
UI with Java script
•Self Service BI
KNOWLEDGE
DELIVERY
•Customer Analytics
– Acquisition,
Retention, Renewal,
Churn Management
•Product Analytics
ACTIONABLE
INTELLIGENCE
25
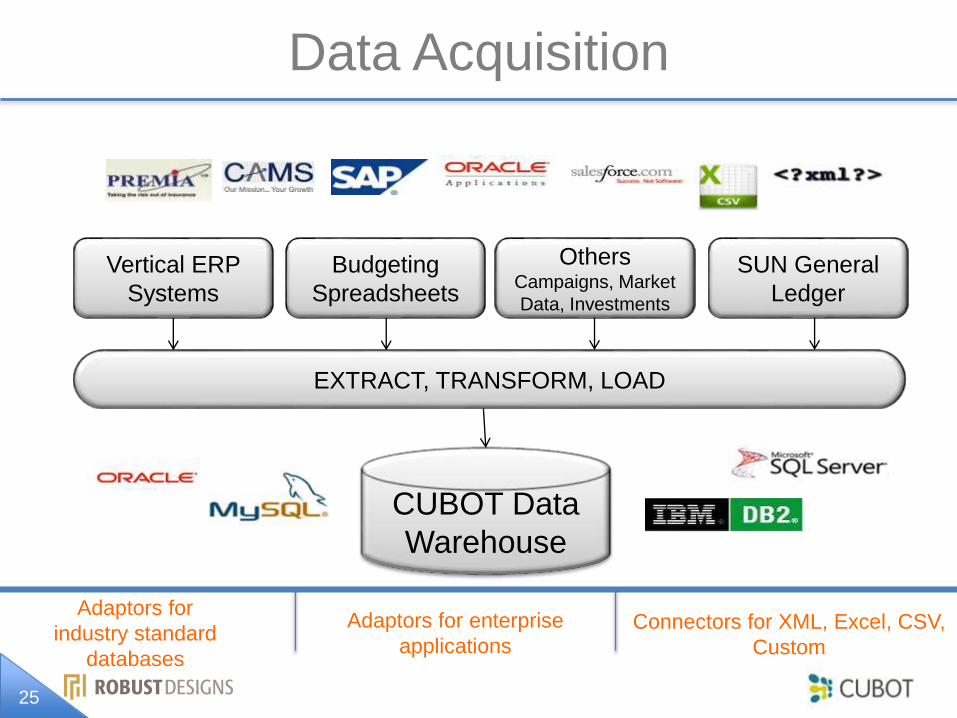
Data Acquisition
CUBOT Data
Warehouse
Vertical ERP
Systems
SUN General
Ledger
Budgeting
Spreadsheets
OthersCampaigns, Market
Data, Investments
EXTRACT, TRANSFORM, LOAD
Adaptors for
industry standard
databases
Adaptors for enterprise
applicationsConnectors for XML, Excel, CSV,
Custom
26
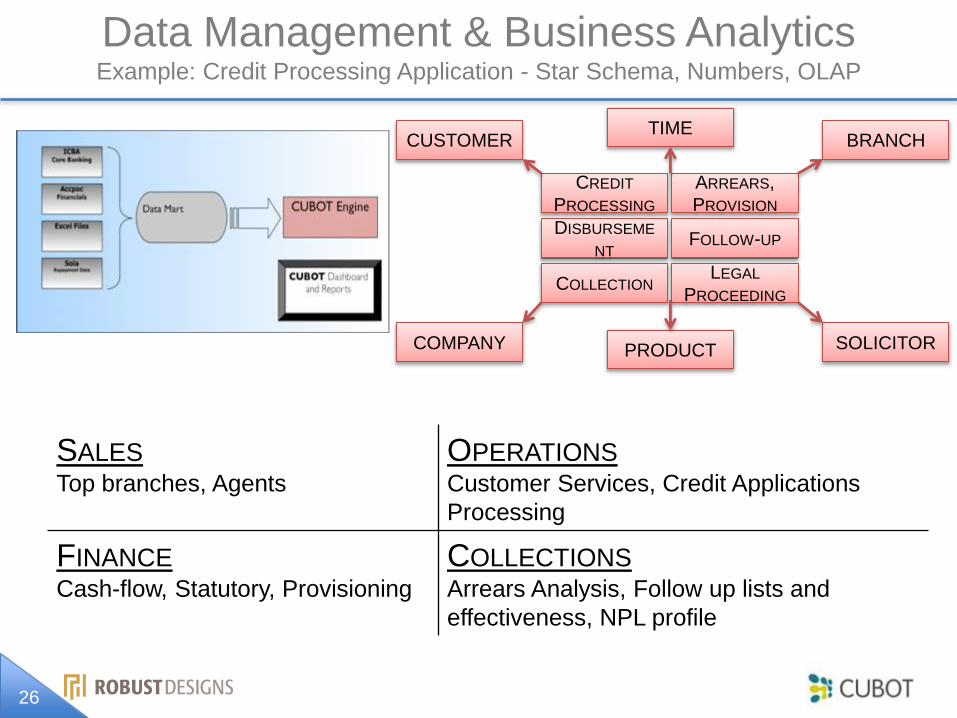
SALES
Top branches, Agents
OPERATIONS
Customer Services, Credit Applications
Processing
FINANCE
Cash-flow, Statutory, Provisioning
COLLECTIONS
Arrears Analysis, Follow up lists and
effectiveness, NPL profile
Data Management & Business AnalyticsExample: Credit Processing Application - Star Schema, Numbers, OLAP
CREDIT
PROCESSING
ARREARS,
PROVISION
DISBURSEME
NTFOLLOW-UP
COLLECTIONLEGAL
PROCEEDING
TIME
PRODUCT SOLICITOR
BRANCHCUSTOMER
COMPANY

27
Knowledge Delivery: Overview
DASHBOARDS
• For Executives
REPORTS
• For Operations and Finance
MIS
• Drill down, Filters, Enquiry, Detailed lists, Export to Excel, pdf
SECURITY
• Role based provisioning of information to different departments, geographies and seniority
WEB BASED
• Browser front-end, Server centric, cloud ready
28
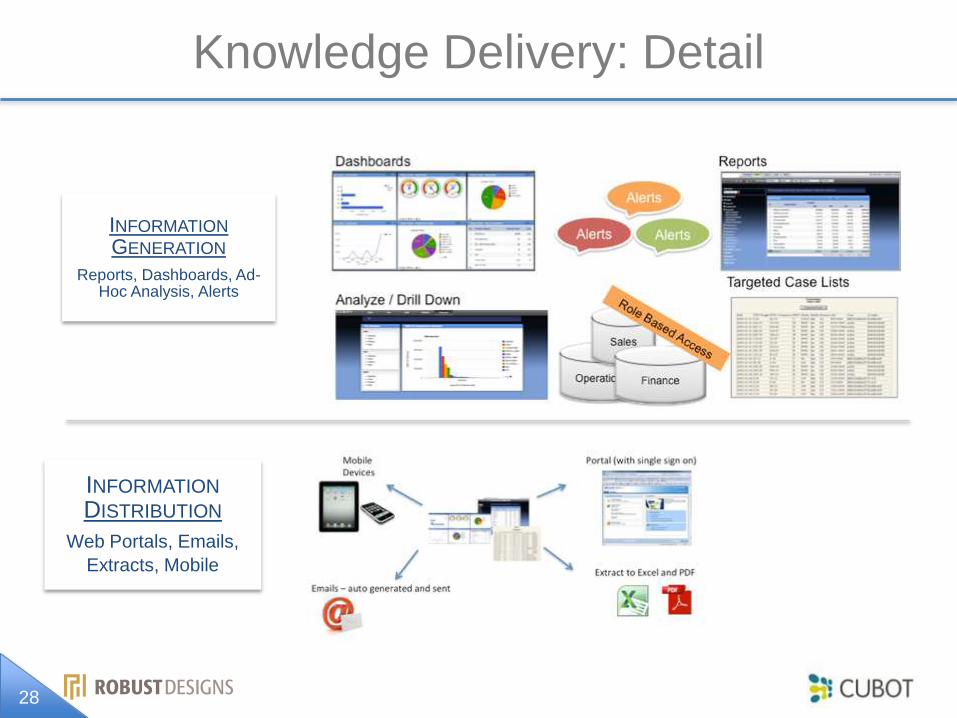
Knowledge Delivery: Detail
INFORMATION
GENERATION
Reports, Dashboards, Ad-Hoc Analysis, Alerts
INFORMATION
DISTRIBUTION
Web Portals, Emails,
Extracts, Mobile
29
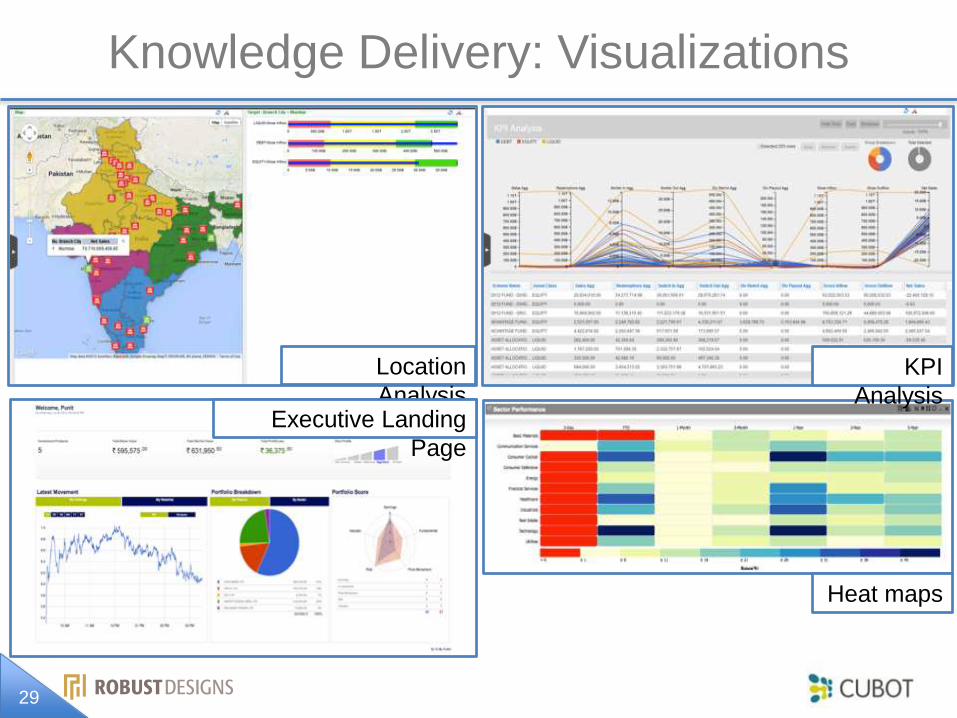
Knowledge Delivery: Visualizations
Location
Analysis
KPI
Analysis
Heat maps
Executive Landing
Page
30
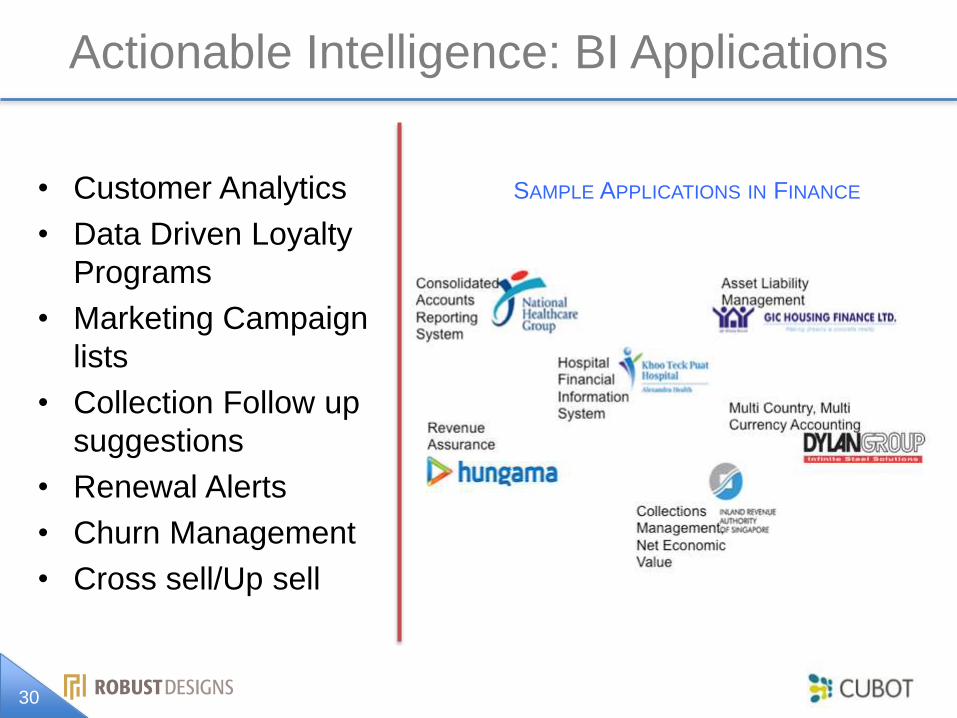
Actionable Intelligence: BI Applications
• Customer Analytics
• Data Driven Loyalty
Programs
• Marketing Campaign
lists
• Collection Follow up
suggestions
• Renewal Alerts
• Churn Management
• Cross sell/Up sell
SAMPLE APPLICATIONS IN FINANCE
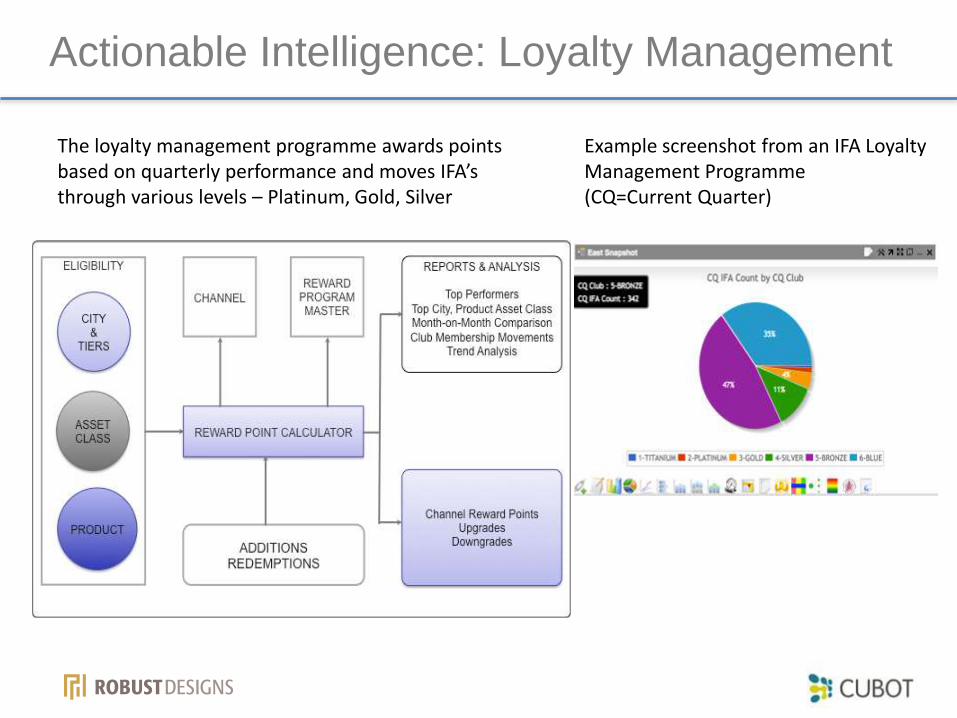
Example screenshot from an IFA Loyalty Management Programme(CQ=Current Quarter)
The loyalty management programme awards points based on quarterly performance and moves IFA’s through various levels – Platinum, Gold, Silver
Actionable Intelligence: Loyalty Management

32
Actionable Intelligence: CRM and Analytics
CRM: INTERACTION,
SENTIMENT
INVESTORS
CAMS
CAMPAIGN
360°
CUSTOMER
VIEW
Goals:
• Better customer understanding
• Improved customer interactions
• Cross-sell, and up-sell
opportunities identified
• Sentiment capture
• Integrated into the programme
to increase customer delight

CUSTOMER ANALYTICS

34
Goal: Real Time Analytics
1. Get Data, Build Data
Model
2. Create Snapshots
3. Track Movements
4. Improve Conversions
5. Act in Real Time
35
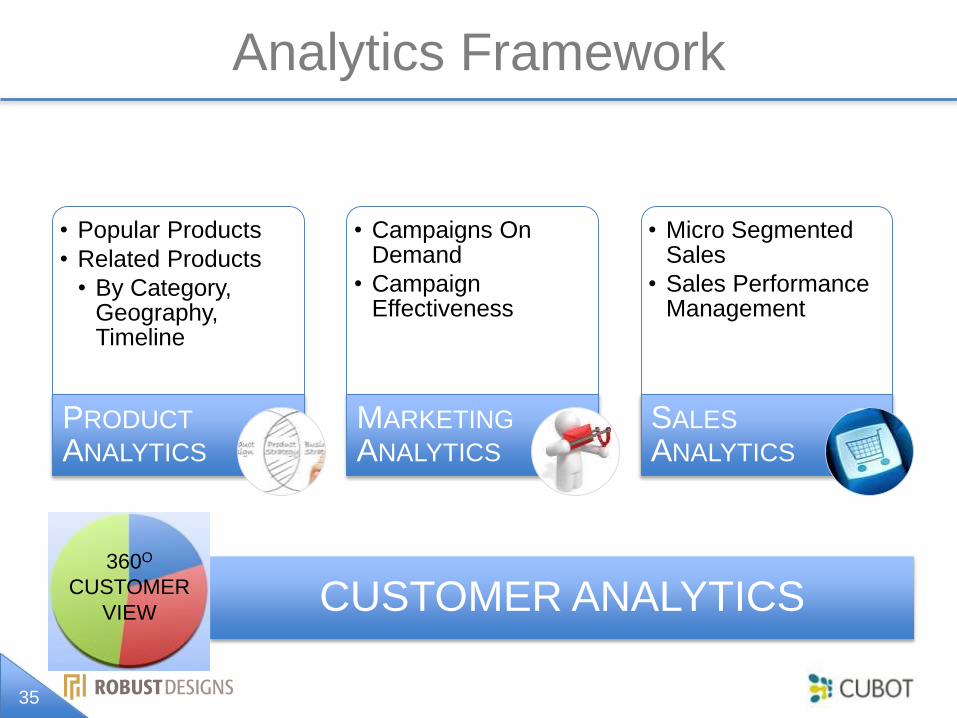
Analytics Framework
• Popular Products
• Related Products
• By Category, Geography, Timeline
PRODUCT
ANALYTICS
• Campaigns On Demand
• Campaign Effectiveness
MARKETING
ANALYTICS
• Micro Segmented Sales
• Sales Performance Management
SALES
ANALYTICS
CUSTOMER ANALYTICS360O
CUSTOMER
VIEW
36
Customer Segmentation is the Foundation
TRACKPROFILE, DISCOVER
SEGMENT
ACTION
EACH
SEGMENT

37
Data to Create a Complete Customer View
To maximize
data and get
a 360° view
of the
customer, 4
essential
types of data
should be
analyzed
Descriptive data
Customer profiles – demographics, attributes, declared info
WHO are your customers
Behaviourial data
Customer activity – transactional data
WHAT are they doing
Interaction data
Customer interaction with company – web clickstreams, e-mail, chat, call centre data
HOW are they behaving with the company
Attitudinal data
Customer opinions, needs, desires, preferences- market research data, customer surveys, social media
WHY are they behaving so
38
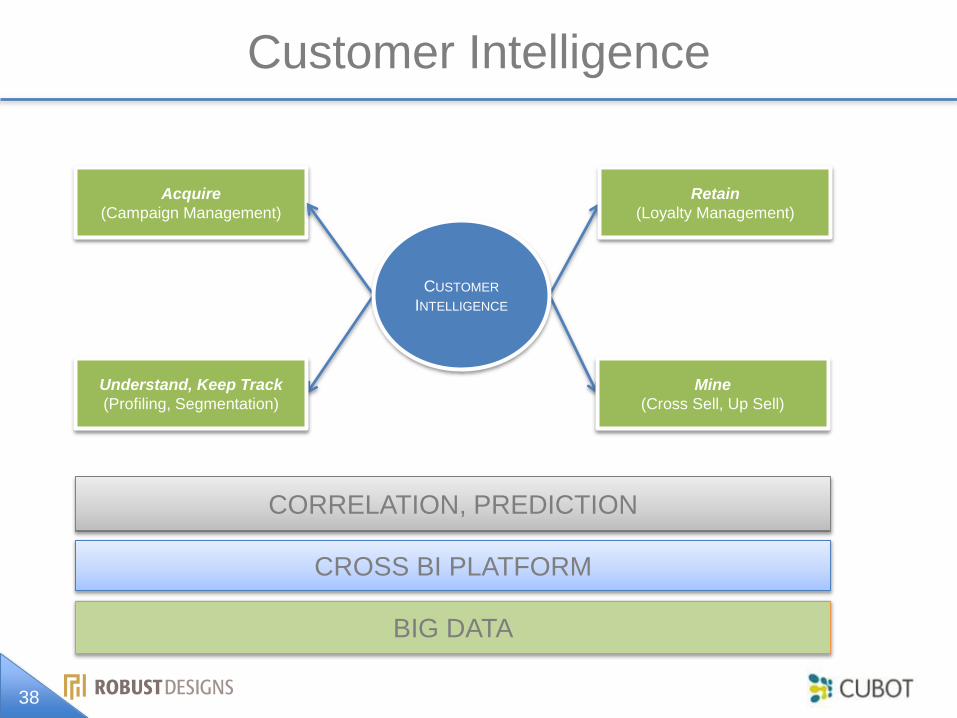
Customer Intelligence
CORRELATION, PREDICTION
BIG DATA
CROSS BI PLATFORM
Acquire
(Campaign Management)
CUSTOMER
INTELLIGENCE
Retain
(Loyalty Management)
Understand, Keep Track
(Profiling, Segmentation)
Mine
(Cross Sell, Up Sell)
39
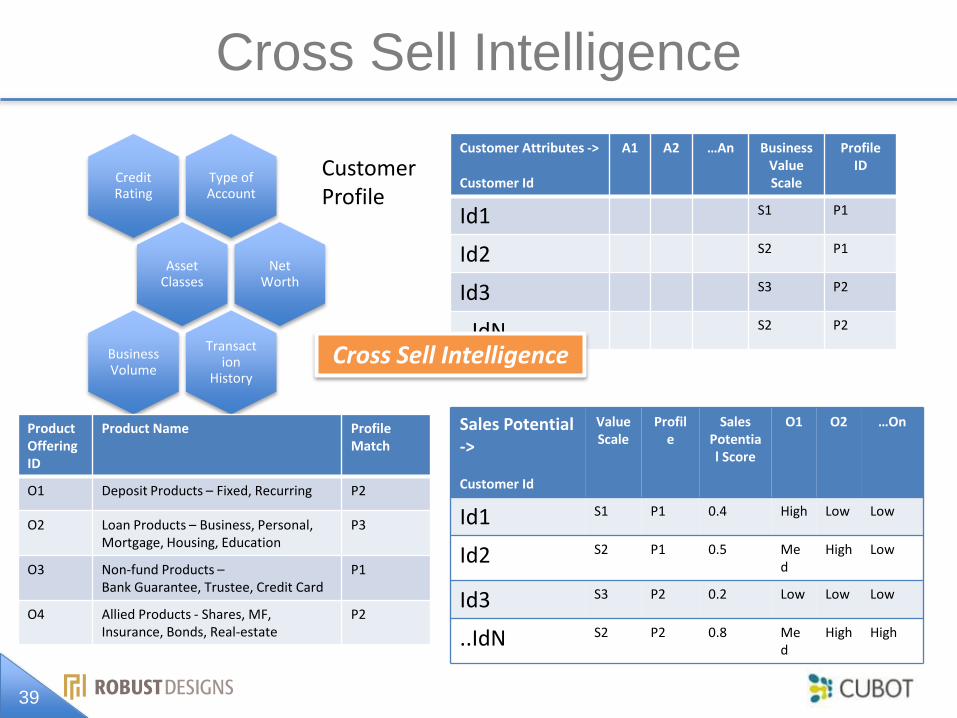
Cross Sell Intelligence
Customer Attributes ->
Customer Id
A1 A2 …An Business Value Scale
Profile ID
Id1 S1 P1
Id2 S2 P1
Id3 S3 P2
..IdN S2 P2
Type of Account
Credit Rating
Asset Classes
Net Worth
Transaction
History
Business Volume
Product Offering ID
Product Name Profile Match
O1 Deposit Products – Fixed, Recurring P2
O2 Loan Products – Business, Personal, Mortgage, Housing, Education
P3
O3 Non-fund Products –Bank Guarantee, Trustee, Credit Card
P1
O4 Allied Products - Shares, MF,Insurance, Bonds, Real-estate
P2
Sales Potential ->
Customer Id
ValueScale
Profile
Sales Potential Score
O1 O2 …On
Id1 S1 P1 0.4 High Low Low
Id2 S2 P1 0.5 Med
High Low
Id3 S3 P2 0.2 Low Low Low
..IdN S2 P2 0.8 Med
High High
Cross Sell Intelligence
Customer Profile

40
Product Analytics
PRODUCT
CATEGORIZATION
BASED ON SALES
• Top selling products
• Slow moving
PRODUCT
MATCHING WITH
CUSTOMERS
• Customer segments that bought in product categories
SIMILAR
PRODUCTS
• Products similar to each other
Product Trend

41
Marketing Analytics
TARGET
CUSTOMER
SEGMENTS
CREATE
CAMPAIGN
LISTS
ACTION
CAMPAIGN
ANALYZE
CAMPAIGN
EFFECTIVENE
SS
42
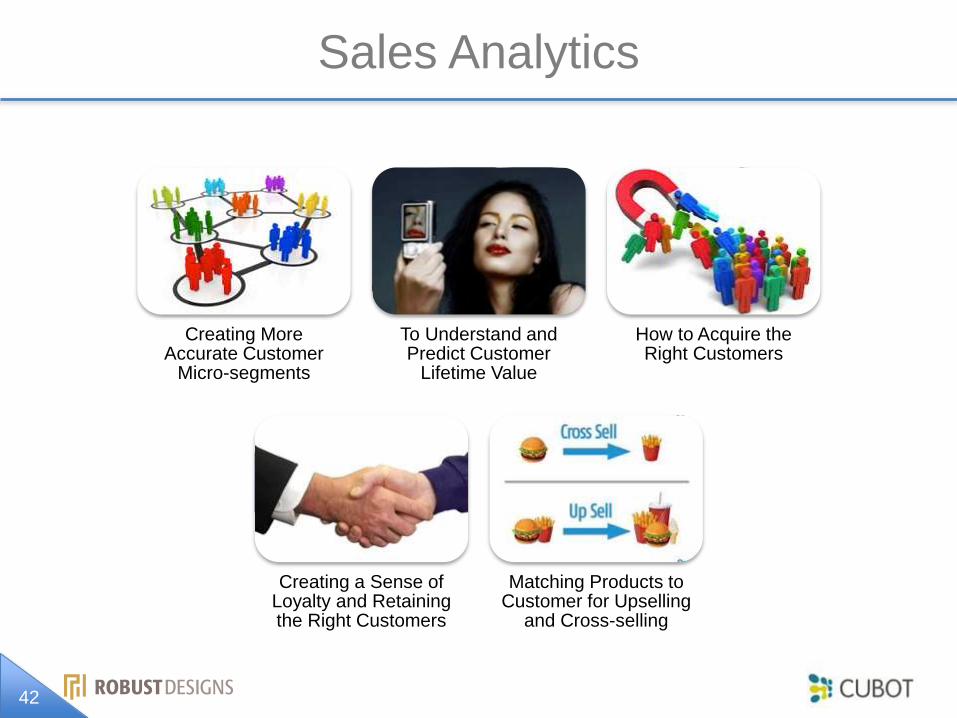
Sales Analytics
Creating More Accurate Customer
Micro-segments
To Understand and Predict Customer
Lifetime Value
How to Acquire the Right Customers
Creating a Sense of Loyalty and Retaining the Right Customers
Matching Products to Customer for Upselling
and Cross-selling

Last Slide