
Model Atmosphere Analysis of the Weakly Magnetic DZ White ...
26
arXiv:astro-ph/0608065 v1 2 Aug 2006 Model Atmosphere Analysis of the Weakly Magnetic DZ White Dwarf G165-7 P. Dufour 1 P. Bergeron 1 , G. D. Schmidt 2 James Liebert 2 , H. C. Harris 3 , G.R. Knapp 4 , S.F. Anderson 5 , and D.P. Schneider 6 ABSTRACT A reanalysis of the strongly metal-blanketed DZ white dwarf G165-7 is pre- sented. An improved grid of model atmospheres and synthetic spectra is used to analyze BV RI , JHK , and ugriz photometric observations as well as a high quality Sloan Digital Sky Survey spectrum covering the energy distribution from 3600 to 9000 ˚ A. The detection of splitting in several lines of Ca, Na, and Fe, suggesting a magnetic field of B s ∼ 650 kG, is confirmed by spectropolarimet- ric observations that reveal as much as ±7.5% circular polarization in many of the absorption lines, most notably Na, Mg, and Fe. Our combined photometric and spectroscopic fit yields T eff = 6440 K, log g =7.99, log (H/He) = -3.0 and log (Ca/He) = -8.1. The other heavy elements have solar ratios with respect to calcium, with the exception of Na and Cr that had to be reduced by a factor of two and three, respectively. A crude polarization model based upon the ob- served local spectral flux gradient yields a longitudinal field of 165 kG, consistent with the mean surface field inferred from the Zeeman splitting. The inclusion of this weak magnetic field in our synthetic spectrum calculations, even in an approximate fashion, is shown to improve our fit significantly. Subject headings: stars: abundances – stars: atmospheres – stars: magnetic field – white dwarfs – stars: individual (G165-7) 1 D´ epartement de Physique, Universit´ e de Montr´ eal, C.P. 6128, Succ. Centre-Ville, Montr´ eal, Qu´ ebec, Canada H3C 3J7; [email protected], [email protected] 2 Steward Observatory, University of Arizona, 933 North Cherry Avenue, Tucson, AZ 85721; [email protected], [email protected] 3 US Naval Observatory, P.O. Box 1149, Flagstaff, AZ 86002-1149; [email protected] 4 Princeton Univ. Obs., Peyton Hall,Princeton, NJ 08544; [email protected] 5 Department of Astronomy, University of Washington, Box 351580, Seattle, WA 98195; ander- [email protected] 6 Department of Astronomy and Astrophysics, Pennsylvania State University, 525 Davey Laboratory, University Park, PA 16802; [email protected]
Transcript of Model Atmosphere Analysis of the Weakly Magnetic DZ White ...

arX
iv:a
stro
-ph/
0608
065
v1
2 A
ug 2
006
Model Atmosphere Analysis of the Weakly Magnetic DZ White
Dwarf G165-7
P. Dufour1 P. Bergeron1, G. D. Schmidt2 James Liebert2, H. C. Harris3, G.R. Knapp4, S.F.
Anderson5, and D.P. Schneider6
ABSTRACT
A reanalysis of the strongly metal-blanketed DZ white dwarf G165-7 is pre-
sented. An improved grid of model atmospheres and synthetic spectra is used
to analyze BV RI, JHK, and ugriz photometric observations as well as a high
quality Sloan Digital Sky Survey spectrum covering the energy distribution from
3600 to 9000 A. The detection of splitting in several lines of Ca, Na, and Fe,
suggesting a magnetic field of Bs ∼ 650 kG, is confirmed by spectropolarimet-
ric observations that reveal as much as ±7.5% circular polarization in many of
the absorption lines, most notably Na, Mg, and Fe. Our combined photometric
and spectroscopic fit yields Teff = 6440 K, log g = 7.99, log (H/He) = −3.0 and
log (Ca/He) = −8.1. The other heavy elements have solar ratios with respect
to calcium, with the exception of Na and Cr that had to be reduced by a factor
of two and three, respectively. A crude polarization model based upon the ob-
served local spectral flux gradient yields a longitudinal field of 165 kG, consistent
with the mean surface field inferred from the Zeeman splitting. The inclusion
of this weak magnetic field in our synthetic spectrum calculations, even in an
approximate fashion, is shown to improve our fit significantly.
Subject headings: stars: abundances – stars: atmospheres – stars: magnetic field
– white dwarfs – stars: individual (G165-7)
1Departement de Physique, Universite de Montreal, C.P. 6128, Succ. Centre-Ville, Montreal, Quebec,
Canada H3C 3J7; [email protected], [email protected]
2Steward Observatory, University of Arizona, 933 North Cherry Avenue, Tucson, AZ 85721;
[email protected], [email protected]
3US Naval Observatory, P.O. Box 1149, Flagstaff, AZ 86002-1149; [email protected]
4Princeton Univ. Obs., Peyton Hall,Princeton, NJ 08544; [email protected]
5Department of Astronomy, University of Washington, Box 351580, Seattle, WA 98195; ander-
6Department of Astronomy and Astrophysics, Pennsylvania State University, 525 Davey Laboratory,
University Park, PA 16802; [email protected]

– 2 –
1. INTRODUCTION
White dwarf stars of the DZ spectral type are cool, helium-atmosphere objects showing
traces of heavy elements in their optical spectra. They are recognized mainly by the Ca ii
H & K doublet, while a few also show Ca i λ4226, Mg i λ3835 or Fe i λ3730 (see Sion et
al. 1990, Wesemael et al. 1993, and Harris et al. 2003 for typical spectra). Since the heavy
elements present in the atmospheric regions sink below the photosphere in a time scale much
shorter than the white dwarf cooling time (Paquette et al. 1986), the presence of these
metals in DZ stars must be supplied by an external source, the most obvious mechanism
being accretion from the interstellar medium, or, in some instances, from a circumstellar
dust disk surrounding the white dwarf (Zuckerman & Becklin 1987; Kilic et al. 2005; Becklin
et al. 2005). Accretion of comets has also been proposed as a possible origin of metals in the
atmospheres of DZ stars (Alcock et al. 1986). A precise determination of the heavy element
abundances observed in the optical or UV spectra of DZ stars can thus provide important
clues about the accretion rate and chemical composition of the interstellar or circumstellar
medium.
Atmospheric abundance analyses of DZ stars are usually based on a restricted number
of absorption lines detected in the optical portion of the spectrum (see, e.g. Liebert et al.
1987), although a more important set of lines can be used when UV spectroscopy is available
(Zeidler-K.T. et al. 1986; Koester & Wolff 2000; Wolff et al. 2002). G165-7 (WD 1328+307,
LHS 2745, V = 16.03) is a particularly unusual DZ white dwarf that has practically no flux
in the ultraviolet because of the severe blanketing by a large number of metallic lines, but
it is also characterized by a very rich optical spectrum showing hundreds of absorption lines
from various heavy elements such as Ca, Cr, Fe, Mg and Na. The first model atmosphere
analysis of this star was carried out by Wehrse & Liebert (1980) who found Teff = 7500±300
K, log g = 8.0 ± 0.3, log (H/He) < −4.0, and abundances for the heavy elements of about
1/30 of the solar value under the assumption of scaled solar abundances. Their analysis was
based on low and moderate (3−5 A) resolution spectroscopy in several segments covering
the 3350−6700 A region, as well as on the multichannel spectrophotometry of Greenstein
(1976).
Bergeron, Leggett, & Ruiz (2001, hereafter BLR) also analyzed the broad-band energy
distribution (optical BV RI & near-infrared JHK photometry) with a grid of pure helium
model atmospheres and found Teff = 7320 K and log g = 8.21 (the surface gravity in this case
is constrained by the trigonometric parallax). However, analyses of the energy distribution of
DQ white dwarfs based on pure helium models tend to overestimate the effective temperature
by 300-800 K and the surface gravity by 0.10-0.24 dex with respect to the atmospheric
parameters obtained from models that include carbon. This effect is understood in terms of

– 3 –
an increase of the He− free-free opacity resulting from the additional free electrons (Provencal
et al. 2002; Dufour et al. 2005). A similar effect is thus expected in the case of DZ stars.
We present here a reappraisal of the analysis of G165-7 based on our latest metal blan-
keted atmospheric models and a new high quality spectrum. The observations are described
in § 2 while in § 3 we describe our theoretical framework including our model atmosphere and
synthetic spectrum calculations. Our detailed analysis is presented in § 4 and our conclusions
follow in § 5.
2. OBSERVATIONS
Our analysis relies on both spectroscopic and photometric observations from various
sources. The optical spectrum secured by BLR (details of the observations are also provided
there) covers the 3500−8300 A region at a resolution of 6 A FWHM. A new spectrum has
been obtained by the Sloan Digital Sky Survey (SDSS), where the star is detected as SDSS
J133059.26+302953.2. The SDSS (York et al. 2000; Stoughton et al. 2002) obtains five-band
imaging (Gunn et al. 1998; Lupton et al. 2001; Pier et al. 2003; Gunn et al. 2006) from which
objects are selected for spectroscopic observations. The SDSS quasar survey targets point
sources with non-stellar colors (Richards et al. 2002), some of which, like G165-7, turn out to
be peculiar stars. The spectrum was observed on 7 April 2005. It covers a wavelength range
of 3800−9200 A at a resolution of ∼ 3 A FWHM. The comparison of the two spectra shown
in Figure 1 reveals that the agreement in terms of absolute fluxes is surprisingly good, apart
from the red portion of the BLR spectrum, which suffers from an obvious flux calibration
problem. Also indicated at the top of the figure are the most prominent detected absorption
features. Most interestingly, a closer examination of the SDSS spectrum reveals the presence
of splitting in several atomic lines (e.g. Fe i λλ5269−5328, Na i D and Ca ii λλ8542−8662),
suggesting the presence of a weak magnetic field (see below).
BLR also reported Cousins BV RI and CIT JHK photometry for G165-7. Also available
are SDSS photometric observations in the ugriz system (Fukugita et al. 1996; Hogg et al.
2001; Smith et al. 2002; Ivezic et al. 2004). The photometric observations that will be used to
determine the effective temperature are reported in Table 1 together with the trigonometric
parallax measurement from the Yale parallax catalog (van Altena et al. 1994). The latter
will be used to constrain the radius, and thus the surface gravity (or the mass) of the white
dwarf (see § 4). Infrared 2MASS photometry is also available for G165-7: J = 15.402 (0.044),
H = 15.282 (0.087), and KS = 15.413 (0.135); although these values are consistent with the
BLR measurements reported in Table 1, the corresponding 2MASS errors are larger for H
and KS and they will not be considered further.

– 4 –
3. THEORETICAL FRAMEWORK
Our LTE model atmosphere code is similar to that described by Dufour et al. (2005)
for the study of DQ white dwarfs. It is based on a modified version of the code described
at length by Bergeron et al. (1995), which is appropriate for pure hydrogen and pure helium
atmospheric compositions, as well as mixed hydrogen and helium compositions, while energy
transport by convection is treated within the mixing-length theory. One important modifi-
cation is that metals and molecules are now included in our equation-of-state and opacity
calculations (see Dufour et al. 2005, for details). As was the case for DQ white dwarfs, He−
free-free is found to be the dominant source of opacity in DZ stars. It is thus important
to include all possible sources of electrons in the equation-of-state, and we have included
here all elements with Z ≤ 26. The chemical abundances cannot be determined individually,
however, since most of these elements are not observed spectroscopically. We thus initially
assume that the relative abundances are consistent with solar ratios, a reasonable assump-
tion according to Wehrse & Liebert (1980, see also Wolff et al. 2002 for other DZ stars)
and our own preliminary analysis based on a chemical abundance analysis of the observable
elements.
Our model grid covers a range of atmospheric parameters from Teff = 4500 to 12000 K
in steps of 500 K, and log (Ca/He) = −7.0 to −12.0 in step of 0.5 dex, while log g is kept
fixed at 8.0, an assumption that will need to be verified a posteriori. This grid contains no
hydrogen. The relative abundances of all elements heavier than helium are set with respect
to the calcium abundance in solar ratios. Additional models described in § 4 have been
calculated with different relative abundances of metals, models including hydrogen, and in
particular models taking into account the presence of a weak magnetic field.
In the context of cool DZ stars, in addition to the increased He− free-free continuum
opacity, important ultraviolet absorption features may potentially affect the energy distri-
bution, and thus the atmospheric structure, with respect to pure helium models. Thus, over
4000 of the strongest metal lines — ∼ 2600 lines from Fe i alone — are included explic-
itly in both the model and synthetic spectrum calculations. These lines were selected by
taking all lines contributing more than one tenth of the He− free-free opacity in the range
τR = 0.1 − 1.0 from several models at log Ca/He=−7 and Teff between 5000 K and 12,000
K. We are confident that our line list includes all the important contributors to the atomic
opacity since spectra calculated by increasing the number of lines by an order of magnitude
did not have any effect on the emerging spectrum. The line absorption coefficient is cal-
culated using a Voigt profile for every line and every depth point. The line broadening is
treated within the impact approximation with van der Waals broadening by neutral helium.
Central wavelengths of the transitions, gf values, energy levels, and damping constants are

– 5 –
extracted from the GFALL line list of R. L. Kurucz1. We will show in § 4.3, however, that
magnetic broadening is the dominant broadening mechanism in the case of G165-7.
4. DETAILED ANALYSIS
4.1. Atmospheric Parameter Determination
The first step in the analysis of the observational data is to estimate the effective tem-
perature of the star. Our fitting procedure is similar to that used for our analysis of DQ
white dwarfs (Dufour et al. 2005). Briefly, we transform the magnitudes at each bandpass
into observed average fluxes fmλ using the following equation
m = −2.5 log fmλ + cm , (1)
where the values of the constants cm are taken from the latest photometric calibration of
Holberg & Bergeron (2006) based on the absolute fluxes of Vega observed by the Hubble
Space Telescope with the Space Telescope Imaging Spectrograph (Bohlin & Gilliland 2004).
The resulting energy distributions are related to the model fluxes through the relation
fmλ = 4π (R/D)2 Hm
λ , (2)
where R is the radius of the star, D its distance from Earth, and Hmλ is the Eddington flux
— which depends on Teff , log g and the chemical abundances, properly averaged over the
corresponding filter bandpass. The fitting procedure relies on the nonlinear least-squares
method of Levenberg-Marquardt based on a steepest decent method (Press et al. 1992). The
value of χ2 is taken as the sum over all bandpasses of the difference between the two sides
of equation (2), properly weighted by the corresponding observational uncertainties.
We begin by fitting the BV RI and JHK photometry to obtain an initial estimate of the
effective temperature (the ugriz photometry is not used at this stage). We assume log g = 8.0
throughout. Since the temperature obtained from the energy distribution depends on the
assumed chemical composition, we rely on the spectroscopic observations to constrain the
metal abundances. We thus assume the Teff value obtained from the energy distribution
and determine the chemical composition by fitting the SDSS spectrum with our grid of
synthetic spectra, properly convolved with a Gaussian instrumental profile at 3 A FWHM.
1see http://kurucz.harvard.edu/LINELISTS.html

– 6 –
The fitting procedure relies on the least-squares method of Levenberg-Marquardt. A new
estimate of the effective temperature is then obtained by fitting the photometric observations
with models interpolated at the metal abundances determined from the spectroscopic fit (all
metal abundances are solar with respect to calcium). The procedure is then iterated until
the atmospheric parameters have converged to a consistent photometric and spectroscopic
solution.
4.2. Adopted Atmospheric Parameters
As discussed below, the difficulties encountered in fitting the blue region of the optical
spectrum caused us to discard for the time being the B magnitude from our fitting procedure
(for the same reason, we fitted only the 5000−9000 A region of the SDSS spectrum). The long
baseline provided by the optical V RI and near-infrared JHK photometry yields a sufficiently
reliable estimate of the effective temperature. The photometric and spectroscopic fitting
technique described above yields Teff = 6440 ± 210 K and log (Ca/He) = −8.1 ± 0.15 (with
all heavy elements assumed to be solar with respect to calcium), where the uncertainties are
obtained from the covariance matrix of the fit; our photometric fit will be shown later (§ 4.3).
The stellar radius is derived from the solid angle in equation (2) combined with the distance
D obtained from the trigonometric parallax measurement. The radius is then converted
into log g (or mass) using evolutionary models similar to those described by Fontaine et
al. (2001) but with C/O cores, q(He) ≡ log MHe/M⋆ = 10−2, and q(H) = 10−10, which
are representative of helium-atmosphere white dwarfs. We find a value of log g = 7.99 ±
0.29, entirely consistent with our initial assumption of log g = 8 for our model grid. This
corresponds to a mass of 0.57 ± 0.17 M⊙, in agreement with the mean mass of white dwarf
stars (Bergeron et al. 1992; Liebert et al. 2005). Our value of the effective temperature is
significantly smaller than the value of Teff = 7320 K obtained by BLR under the assumption
of pure helium-atmosphere models. This is a direct consequence of the increased He− free-
free opacity in our model calculations. Because of their higher temperature estimate, BLR
required a smaller solid angle to match the photometric obervations, which translated into
a smaller radius and thus a higher surface gravity of log g = 8.21 (or 0.71 M⊙).
In the remainder of this analysis, we adopt the atmospheric parameters determined
above. As mentioned in the previous section, the abundances of all heavy elements are
assumed to be solar with respect to calcium, even if they are not detected in the spectrum. In
order to test the sensitivity of this assumption on our atmospheric parameter determination,
we also calculated a model with our adopted parameters, but by setting the abundances of all
non-detected elements to zero. The resulting spectrum is almost identical to that obtained

– 7 –
under the assumption of solar composition with respect to calcium. This is perhaps not
too surprising since the non-detected elements do not contribute significantly to the electron
population (see below). Hence we feel confident that our basic assumption does not affect
the atmospheric parameter determination. In what follows, we will also allow some changes
in the abundances of elements observed spectroscopically (in particular hydrogen). But at
the end, we will again measure the impact of these changes on our atmospheric parameter
determination.
Although the assumption of metallic abundances scaled with respect to solar abun-
dances is appropriate for fitting globally the 5000−9000 A region, individual lines such as
the Na λ5892 resonance doublet, the Cr λ5208 and the Fe (∼ 5200 − 5500 A) absorption
features are predicted to be stronger than observed, and the abundances of these elements
must be reduced by factors of 2, 3, and 3, respectively, to produce an acceptable fit. Our best
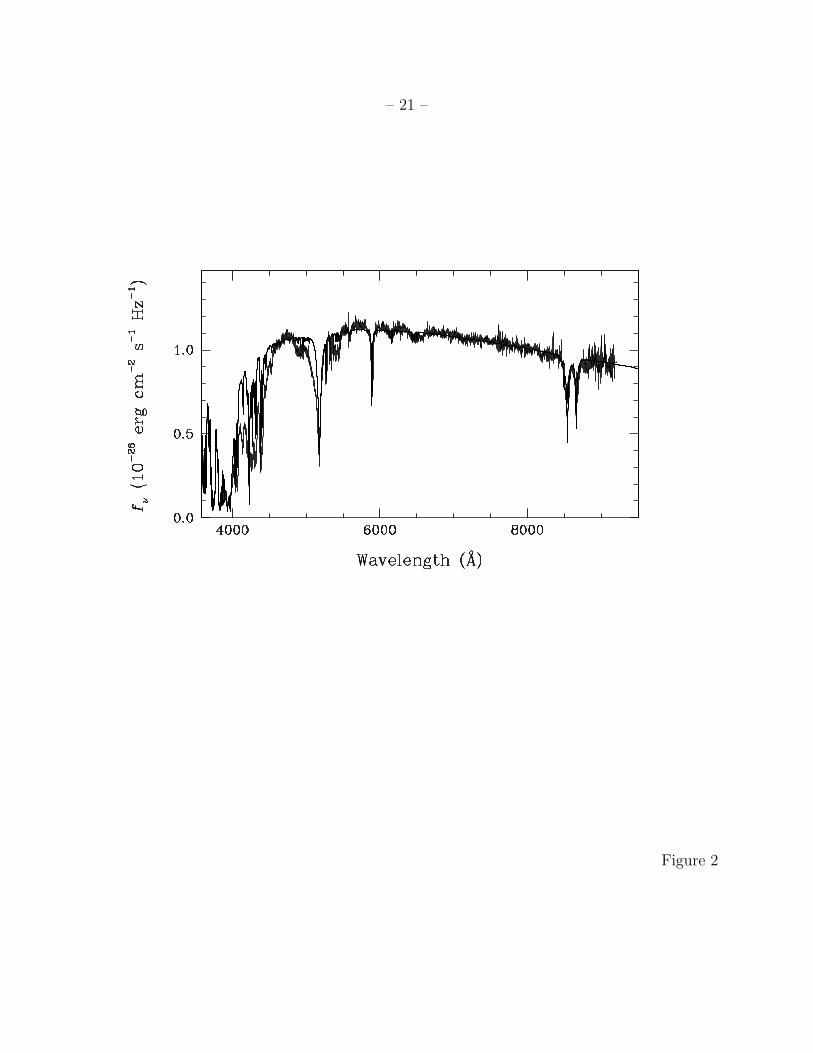
resulting fit to the SDSS spectrum is shown in Figure 2 and at a higher resolution in Figure
3. The overall spectrum in Figure 2 is generally well reproduced by our model. In particular,
the predicted continuum slope in the red part of the spectrum is entirely consistent with our
effective temperature determination, which is based on V RI and JHK photometric obser-
vations. This provides an internal consistency check between our temperature determination
and the photometric and spectroscopic observations.
A more detailed comparison of our spectroscopic fit reveals various discrepancies, how-
ever. Most noteworthy, the predicted flux in the blue region of the spectrum between 3600
and 4600 A is considerably larger than that observed. This region can be better reproduced
either by reducing the effective temperature or by increasing the iron abundance, but in both
cases, the region longward of 4500 A cannot be matched properly, including the slope of the
energy distribution as well as the iron absorption lines between 5200 and 5500 A, which are
then predicted to be much stronger than observed. The UV flux deficiency could perhaps be
explained by a missing source of opacity that would partially mask the absorption lines in
this region. We have explored adding more lines, continuous opacities from heavy elements,
the occupation probability formalism of Hummer & Mihalas (1988), as well as the Lyα wing
calculations of Koester & Wolff (2000), but none of these mechanisms were able to reduce
the UV flux significantly.
Figure 3 also reveals that most lines are predicted to be narrower and deeper than
observed. Our model even predicts some sharp Ca i features around 6160 and 6450 A that
are not observed spectroscopically. The Mg i λ5175 triplet is also not well reproduced.
This asymmetric profile has been interpreted by Wehrse & Liebert (1980) as evidence for
quasi-static van der Waals broadening; we postpone our discussion of this feature to § 4.5.
Moreover, there appears to be some missing line contribution in the region around 4380

– 8 –
and 4400 A. Even the location of some absorption lines seems out of place. For instance, a
careful examination of the region near 4050, 4150 and 4260 A indicates that the strongest
predicted features are not matched exactly. These small line shifts cannot be accounted for
by uncertainties in the SDSS wavelength calibration since the BLR and SDSS spectra agree
so perfectly (see Fig. 1). The observed discrepancies could not be improved by including
additional metallic lines in our calculations; therefore another explanation must be sought.
4.3. The Presence of a Weak Magnetic Field
The SDSS spectrum in Figure 1 suggests the presence of Zeeman splitting, and a direct
comparison of the observed spectrum with our non-magnetic synthetic spectrum in Figure
3 clearly reveals line splitting. The most obvious cases are the Fe i λλ5269 − 5328, Na i D,
and the Ca ii λλ8542 − 8662 absorption lines. The Fe i lines near 5400 A are also not well
reproduced by our model spectrum. The peculiarity of the iron features observed here is
striking when compared with the spectrum of NLTT 40607 (Kawka et al. 2004, see their Fig.
4), another rare cool DZ star similar to G165-7 which, however, does not show any evidence
of line splitting.
To our knowledge, the only polarimetric test for a magnetic field on G165-7 is the
broadband (3100−8600 A) circular polarimetry obtained by Angel et al. (1981) that yielded
V/I = +0.071±0.075%, or an estimated mean longitudinal field strength Be = 230±240 kG.
New polarimetric measurements were therefore obtained on 2005 December 30 UT and 2006
May 3 UT using the Steward Observatory 2.3m telescope and SPOL spectropolarimeter of
GDS. The instrument was configured for low spectral resolution (∆λ = 17 A) but broad
coverage (4200 − 8200 A); calibration and reduction of the 600 s observational sequences
were carried out in the usual manner (e.g., Schmidt et al. 1992b). The results for 2005
Dec., shown in Figure 4, conclusively verify the presence of a magnetic field, with sharp
undulations in circular polarization at each of the prominent lines, reaching V/I = ±7.5%
at the strongest Mg, Na, and Fe features. Shown by the bold line in Figure 4 is a synthetic
polarization spectrum computed for Be = 165 kG from a simple model based on the local
spectral flux gradient (e.g. Angel et al. 1981). The modeling technique is adequate for the
linear Zeeman effect in the wings of lines but fails in the resolved cores, and thus tends to
underestimate the peak excursions in polarization. For a centered dipole field configuration
with no limb darkening, the ratio of the mean longitudinal to mean surface field strength
Be/Bs ranges between ±0.25 for the full range of inclination angles to the dipole axis, there-
fore Be is a sensitive indicator of orientation. Analysis of the individual spectropolarimetric
observations yields values of Be = 162, 140, 156 kG, with an uncertainty of ∼15 kG for each

– 9 –
measurement. Thus, there is no evidence for rotation over the 30 min period covered by the
observations. However, a clear change occurred between the two epochs, as the amplitude of
the polarimetric features in 2006 May is reduced by more than a factor two. For comparison
with the Angel et al. (1981) measurement, the net circular polarization of the data in Figure
4 is −0.034 ± 0.030%, i.e., not significantly different from zero.
In general, detailed calculations of synthetic spectra in the presence of a magnetic field
require a special numerical and physical treatment that cannot be easily implemented in a
non-magnetic model atmosphere code. However, if we assume that the magnetic field does
not affect the atmospheric structure significantly, some simple approximations can be used
to include its effects on the emergent spectrum only. For a relatively weak field, which is
certainly the case here, we can use the approximation of the linear Zeeman effect to estimate
the splitting of the atomic lines. In this regime, the wavelength separation (in A) between
the centroids of the σ components is given by the simple formula
∆λ = 9.34 × 10⁻¹³λ2cgeffBs , (3)
where λc is the central wavelength of the line and geff is the effective Lande factor. We
estimate the mean surface field strength from an average value of the line splitting measured
for Fe i λλ5269, 5328, 4383, and Na λ5892, and by assuming geff = 1.0 for all lines. With
this very simple approximation, we find a mean surface magnetic field of Bs ∼ 650 kG, a
value consistent with the mean longitudinal field of Be = 165 kG estimated above. Fields
of this strength are not unusual among white dwarfs, but G165-7 represents a rare case
of a DZ white dwarf that exhibits sharp enough metallic features to make the magnetic
field detectable through Zeeman splitting. Only two other DZ stars are known to exhibit
such metallic line splitting: LHS 2534 with Bs = 1.92 MG (Reid et al. 2001) and SDSS
J015748.15+003315.1 at Bs = 3.7 MG (Schmidt et al. 2003).
In order to take into account, even approximately, the presence of the magnetic field
in our model calculations, we simply assume that all spectral lines are split into three com-
ponents of equal strengths separated by a value of ∆λ given by equation (3), with each
component having one third of the total line strength in the zero-field calculation (see also
Schmidt et al. 1992a). We then recalculate a synthetic spectrum at our previously determined
atmospheric parameters by using this approximate treatment.
The resulting spectroscopic fit using the same chemical abundances as above indicates
that the iron abundance no longer needs to be reduced by a factor of 3, and that a solar
abundance of iron relative to calcium now matches the 5200−5500 A lines quite well, as
shown in Figure 5. The improvement over our non-magnetic calculations can be appreciated

– 10 –
by contrasting these results with those shown in Figure 3. One important consequence
of the increased iron abundance is that the flux deficiency problem in the blue region of
the spectrum (top panels of Figs. 3 and 5) has been dramatically improved, although it
is admittedly not perfect yet. The missing line contribution in the 4380−4400 A region
discussed above is also naturally explained. There are still a few residual discrepancies,
however, particularly near the 4100 and 4350 A regions, but given the crude approximation
we used here to take into account the presence of the magnetic field, we feel our solution is
quite satisfactory.
The other panels also reveal a better match for several metallic lines, in particular Na i
D and Ca ii λλ8542− 8662. The inclusion of a weak magnetic field also solves the problems
of the sharp Ca i absorption features around 6160 and 6450 A (third panel), since the line
splitting has now broadened these features considerably. There is a small discrepancy near
6560 A that is most naturally explained by a contribution from hydrogen (Hα; see next
section).
Finally, we show in Figure 6 our best fit to the (B)V RI and JHK photometric obser-
vations using model fluxes that take into account the presence of a 650 kG magnetic field.
Also displayed are the ugriz photometric observations converted into average fluxes using
the transformation equations provided by Holberg & Bergeron (2006). The complete energy
distribution is well reproduced with our model, with the exception of the u band, which may
suffer from atmospheric extinction problems (see Holberg & Bergeron 2006).
4.4. Hydrogen Abundance Determination
Wehrse & Liebert (1980) place a limit on the hydrogen abundance of log (H/He) < −4
in G165-7 based on the absence (W < 2 A) of an Hα absorption feature. This limit is
very sensitive to the assumed effective temperature of the star. Our effective temperature
determination is ∼ 1000 K cooler than that obtained by Wehrse & Liebert (1980, Teff =
7500 K) so the limit on the hydrogen abundance needs to be increased. Furthermore, a close
inspection of the SDSS spectrum, together with our spectroscopic fit (Fig. 5), clearly reveals
the presence of a very shallow and broad Hα absorption feature. This observed width is
actually what is expected at these temperatures since van der Waals broadening by neutral
helium is the main broadening mechanism in the physical conditions encountered here. Note
also that without a good modeling of the calcium lines in the blue wing of Hα, this absorption
feature could easily be interpreted as noise. The Hα feature cannot be detected in the lower
signal-to-noise ratio spectrum displayed in Figure 3 of Wehrse & Liebert (1980).

– 11 –
We find that a model spectrum with log (H/He) = −3 reproduces almost perfectly the
Hα region (see the insert in Fig. 5). Here, the magnetic field for Hα has been included fol-
lowing the procedure outlined in Bergeron et al. (1992), although its effect on the observed
profile is found to be negligible since van der Waals broadening by neutral helium completely
dominates in this physical regime. Because of the high metallicity content determined for
G165−7, the contribution of hydrogen to the electron population is relatively small, except
perhaps in the deepest layers where the temperature is high enough to produce substantial
ionization. Actually, at the photosphere (τR ∼ 1), the principal electron donors are Mg
(27.6%), Fe (21.5%), Si (17.1%) and H (24.8%), while Ca and Na contribute 2.0% and 1.7%,
respectively. Furthermore, the contributions of the H− opacity and H2 collision induced
opacity are negligible compared to the dominant He− free-free opacity. In order to estimate
how our atmospheric parameter determination would change given (1) the presence of hy-
drogen, (2) the reduced abundances of Na and Cr, and (3) the presence of the magnetic field,
we fitted our best model spectrum shown in Figure 5 with our hydrogen-free, non-magnetic,
solar scaled models. The atmospheric parameters we obtain differ by only 100 K in Teff and
0.2 dex in log (Ca/He).
Hydrogen, being the lightest element, tends to raise to the upper layers of the pho-
tospheric regions of the star, and its abundance should thus always increase with time as
the white dwarf experiences multiple episodes of accretion from the interstellar medium.
Previous studies (e.g., Dupuis et al. 1993; Wolff et al. 2002) have shown, however, that DZ
stars have less hydrogen in their atmospheres than what is expected if the accreted material
has a solar composition. Consequently, the hydrogen accretion rate must be reduced rela-
tive to that of metals in order to account for the relatively low hydrogen abundances (with
respect to heavier elements) observed in DZ stars. One model, proposed by Wesemael &
Truran (1982) to reduce the accretion of hydrogen, is the so-called propeller mechanism. In
this model, protons are prevented from accreting onto the surface of the white dwarf by a
rotating magnetic field, while metals, most probably in the form of grains, are unaffected
by this mechanism and thus reach the surface. In addition, this model requires a relatively
strong UV radiation flux to ionize hydrogen in the immediate surroundings of the star, a
requirement that is certainly not met in the case of G165-7. Since the propeller mecha-
nism cannot prevent hydrogen from being accreted onto the surface of G165-7, we expect
the metal-to-hydrogen ratio to be much lower than the solar value, log (Ca/H)⊙ = −5.6.
However, the value we determined for G165-7, log (Ca/H) = −5.1, is slightly larger than
the solar value. G165-7 thus represents another case of a DZ star with a unexpectedly low
hydrogen abundance.

– 12 –
4.5. Asymmetric MgI Line or MgH Molecular Absorption?
Based on the absence of Hα and their relatively high effective temperature estimate,
Wehrse & Liebert (1980) rejected the possibility that the asymmetric Mg i λ5175 “b” profile
could be explained by a MgH molecular absorption band. Instead, they interpreted the
observed asymmetry as evidence that the impact theory was not valid anymore for this line.
A quasi-static profile was found to give a reasonable agreement to the shape of the blue
wing of the Mg i line if the C6 damping constant was increased by a factor 120. The lower
temperature and higher hydrogen abundance determined here allow us to reconsider this
interpretation.
In order to explore this alternative interpretation, we have explicitly included the MgH
line opacity in our calculations. Although our code takes into account the formation of
molecules in the equation-of-state, the molecular opacity for the coolest stars has not been
fully implemented yet, with the exception of the C2 molecular Swan bands required for
analysis of DQ stars (Dufour et al. 2005). Our result, shown in Figure 7, indicates that it is
indeed possible to match approximately the blue wing at ∼ 5100 A, but only by increasing
the MgH abundance by a factor of ∼ 20. We can only offer tentative explanations to explain
this inconsistency.
One possibility is that because of a missing ingredient in our model calculations — an
important source of opacity or additional electron donors for instance, our effective tem-
perature determination is still overestimated. If G165-7 is actually cooler than suggested
by our models, more hydrogen could be present and molecular formation would be favored.
For example, at Teff = 6250 K, the above factor is reduced to 10, but the overal energy
distribution predicted is not reproduced as well as with our adopted 6440 K solution. Al-
ternatively, the molecular absorption process could be affected by the magnetic field, but
detailed calculations are needed to confirm this hypothesis. We cannot rule out the possibil-
ity that we are simply dealing with the breakdown of the impact approximation, as initially
proposed by Wehrse & Liebert (1980), but until this feature is correctly fitted within a co-
herent theoretical framework, we must conclude that the nature of the Mg i asymmetric
profile remains uncertain. We note that it is unlikely that non-ideal effects in the equation-
of-state (Coulomb corrections, finite volume effect, line quenching) are important since the
pressure in our model never exceeds 1010 dynes cm−2. Based on a modified version of the
equation-of-state of Mihalas et al. (1990), Wolff et al. (2002) found only a weak influence in
van Maanen 2, another DZ star in which the atmospheric pressure is certainly higher than
that in G165-7 since it is cooler and possesses a smaller metal content. We note finally that
the sample of DZ stars displayed in Figures 10 and 11 of Harris et al. (2003) show several
objects with similar asymmetric profiles, some of them certainly too hot (∼ 8000 K) to be

– 13 –
explained by molecular absorption.
5. SUMMARY AND CONCLUSIONS
Our study of G165-7 represents the first detailed model atmosphere analysis of a mag-
netic DZ white dwarf. High quality spectroscopic observations revealed that several metallic
features were split by a surface magnetic field of approximately 650 kG. We achieved a
best fit with a model atmosphere and synthetic spectrum at Teff = 6440 K, log g = 7.99,
log (H/He) = −3, and log (Ca/He) = −8.1, with other heavy elements in solar abundances
relative to the calcium abundance (except for Na and Cr whose abundances had to be re-
duced by factors of 2 and 3, respectively). The predicted emergent spectrum provided an
excellent match to the whole energy distribution of G165-7, as well as to most spectral fea-
tures. By using the approximation of the linear Zeeman effect in our synthetic spectrum
calculations, we were able to reproduce the splitting observed in several metallic lines. We
also found that, contrary to the original analysis of G165-7 by Wehrse & Liebert (1980),
hydrogen is present with an abundance of log (H/He) ∼ −3. With an effective temperature
∼ 1000 K cooler than previously found, the molecular formation of MgH can no longer be
completely ruled out. We have shown that the so-called “asymmetric Mg I profile” might
possibly be explained by a MgH molecular feature instead of a quasi-static profile, although
we cannot be entirely certain of this interpretation until a coherent theoretical framework
becomes available. Other spectra of DZ stars with strong metallic absorption features have
been found in the SDSS (Harris et al. 2003). Analysis of them may lead to more insight into
the properties of G165-7 and whether they are repeated in other DZ stars.
We are grateful to A. Gianninas for a careful reading of this manuscript. The authors
thank P. Smith for assistance with the spectropolarimetric observations. Research into mag-
netic stars and stellar systems at Steward Observatory is supported by NSF grant AST
03-06080 to GDS. This work was supported in part by the NSERC Canada and by the
FQRNT (Quebec). P. Bergeron is a Cottrell Scholar of Research Corporation.
Funding for the SDSS and SDSS-II has been provided by the Alfred P. Sloan Foundation,
the Participating Institutions, the National Science Foundation, the U.S. Department of
Energy, the National Aeronautics and Space Administration, the Japanese Monbukagakusho,
the Max Planck Society, and the Higher Education Funding Council for England.
The SDSS is managed by the Astrophysical Research Consortium for the Participating
Institutions. The Participating Institutions are the American Museum of Natural History,
Astrophysical Institute Potsdam, University of Basel, Cambridge University, Case Western

– 14 –
Reserve University, University of Chicago, Drexel University, Fermilab, the Institute for Ad-
vanced Study, the Japan Participation Group, Johns Hopkins University, the Joint Institute
for Nuclear Astrophysics, the Kavli Institute for Particle Astrophysics and Cosmology, the
Korean Scientist Group, the Chinese Academy of Sciences (LAMOST), Los Alamos National
Laboratory, the Max-Planck-Institute for Astronomy (MPIA), the Max-Planck-Institute for
Astrophysics (MPA), New Mexico State University, Ohio State University, University of
Pittsburgh, University of Portsmouth, Princeton University, the United States Naval Obser-
vatory, and the University of Washington.
REFERENCES
Alcock, C., Fristrom, C. C., & Siegelman, R. 1986, ApJ, 302, 462
Angel, J. R. P., Borra, E. F., & Landstreet, J. D. 1981, ApJS, 45, 457
Becklin, E. E., Farihi, J., Jura, M., Song, I., Weinberger, A. J., & Zuckerman, B. 2005, ApJ,
632, L119
Bergeron, P., Leggett, S. K., & Ruiz, M. T. 2001, ApJS, 133, 413 (BLR)
Bergeron, P., Ruiz, M. T., & Leggett, S. K. 1992, ApJ, 400, 315
Bergeron, P., Saffer, R. A., & Liebert, J. 1992, ApJ, 394, 228
Bergeron, P., Saumon, D., & Wesemael, F. 1995, ApJ, 443, 764
Bohlin, R. C., & Gilliland, R. L. 2004, AJ, 127, 3508
Dufour, P., Bergeron, P., & Fontaine, G. 2005, ApJ, 627, 404
Dupuis, J., Fontaine, G., & Wesemael, F. 1993, ApJS, 87, 345
Fontaine, G., Brassard, P., & Bergeron, P. 2001, PASP, 113, 409
Greenstein, J. L. 1976, ApJ, 207, L120
Gunn, J. E., et al. 1998, AJ, 116, 3040
Gunn, J. E., et al. 2006, AJ, 131, 2332
Fukugita, M., Ichikawa, T., Gunn, J. E., Doi, M., Shimasaku, K., & Schneider, D. P. 1996,
AJ, 111, 1748
– 15 –
Harris, H. C., et al. 2003, AJ, 126, 1023
Hogg, D. W., Finkbeiner, D. P., Schlegel, D.J., & Gunn, J. E., 2001, AJ, 122, 2129
Holberg, J. B., & Bergeron, P. 2006, AJ, in press
Hummer, D. G., & Mihalas, D. 1988, ApJ, 331, 794
Ivezic, Z., et al. 2004, Astron. Nachr., 325, 583
Kawka, A., Vennes, S., & Thorstensen, J. R. 2004, AJ, 127, 1702
Kilic, M., von Hippel, T., Leggett, S. K., & Winget, D. E. 2005, ApJ, 632, L115
Koester, D., & Wolff, B. 2000, A&A, 357, 587
Liebert, J., Bergeron, P., & Holberg, J. B. 2005, ApJS, 156, 47
Liebert, J., Wehrse, R., & Green, R. F. 1987, A&A, 175, 173
Lupton, R. H., Gunn, J. E., Ivezic, Z., Knapp, G. R., Kent, S. M., & Yasuda, N. 2001, in
ASP Conf Ser 238, ADASS X, ed. F.R. Harnden Jr., F.A. Primini, & H.E. Payne
(San Francisco: ASP), p. 269
Mihalas, D., Hummer, D. G., Mihalas, B. W., & Dappen, W. 1990, ApJ, 350, 300
Paquette, C., Pelletier, C., Fontaine, G., & Michaud, G. 1986, ApJS, 61, 197
Pier, J. R., et al. 2003, AJ, 125, 1559
Press, W. H., Teukolsky, S. A., Vetterling, W. T., & Flannery, B. P. 1992, Numerical Recipes
in FORTRAN, 2nd edition (Cambridge: Cambridge University Press), 644
Provencal, J. L., Shipman, H. L., Koester, D., Wesemael, F., & Bergeron, P. 2002, ApJ, 568,
324
Reid, I. N., Liebert, J., & Schmidt, G. D. 2001, ApJ, 550, L61
Richards, G. T., et al. 2002, AJ, 123, 2945
Schmidt, G. D., Bergeron, P., Liebert, J., & Saffer, R. A. 1992a, ApJ, 394,603
Schmidt, G.D., Stockman, H.S., & Smith, P.S. 1992b, ApJ, 398, L57
Schmidt, G. D., et al. 2003, ApJ, 595, 1101
– 16 –
Sion, E. M., Kenyon, S. J., & Aannestad, P. A. 1990, ApJS, 72, 707
Smith, J. A., et al. 2002, AJ, 123, 2121
Stoughton, C., et al. 2002, AJ, 123, 485
van Altena, W. F., Lee, J. T., & Hoffleit, E. D. 1994, The General Catalogue of Trigonometric
Parallaxes (New Haven: Yale University Observatory)
Wehrse, R., & Liebert, J. 1980, A&A, 86, 139
Wesemael, F., Greenstein, J. L., Liebert, J., Lamontagne, R., Fontaine, G., Bergeron, P., &
Glaspey, J. W. 1993, PASP, 105, 761
Wesemael, F., & Truran, J. W. 1982, ApJ, 260, 807
Wolff, B., Koester, D., & Liebert, J. 2002, A&A, 385, 995
York, D. G., et al. 2000, AJ, 120, 1579
Zeidler-K.T., E.-M., Weidemann, V., & Koester, D. 1986, A&A, 155, 356
Zuckerman, B., & Becklin, E. E. 1987, Nature, 330, 138
This preprint was prepared with the AAS LATEX macros v5.2.

– 17 –
Table 1. Observational data for G165−7a
B V R I J H K u g r i z π (mas)
16.73 16.03 15.74 15.60 15.50 15.36 15.34 18.27 16.32 15.92 15.93 16.10 33.4
0.05 0.03 0.03 0.03 0.05 0.05 0.05 0.016 0.003 0.003 0.004 0.007 5.3
aUncertainties are on the second line. Cousins BV RI and CIT JHK photometry is from BLR, while
the ugriz photometry comes from SDSS.

– 18 –
Table 2. Atmospheric Parameters for G165−7
Parameter Value
Teff (K) 6440 (210)
log g 7.99 (0.29)
M/M⊙ 0.57 (0.17)
log H/He ∼−3
log Na/He −8.43 (0.15)
log Mg/He −6.88 (0.15)
log Ca/He −8.10 (0.15)
log Cr/He < −9.30
log Fe/He −6.96 (0.15)
Bs(kG) ∼650
Be(kG) ∼165

– 19 –
Fig. 1.— Comparison of absolute fluxes from two independent spectroscopic observations of
G165-7 in the optical. The thick line is the SDSS spectrum with a resolution of ∼ 3 A FWHM,
while the thin line corresponds to the BLR spectrum at a slightly lower resolution of ∼ 6
A FWHM. The latter suffers from flux calibration problems longward of 6500 A(also notice
the presence of the Earth’s atmospheric A and B absorption bands in the BLR spectrum).
The most important features are labeled at the the top. The presence of Zeeman splitting
is clearly visible in the SDSS spectrum.
Fig. 2.— Our best fit to the SDSS optical spectrum with a non-magnetic model at Teff =
6440 K, log g = 7.99, and log (Ca/He) = −8.1. All heavy elements are assumed to be
solar with respect to the calcium abundance, with the exception of Na, Cr, and Fe whose
abundances are reduced by factors of 2, 3, and 3, respectively. The hydrogen abundance is
also set to zero.
Fig. 3.— Same as Fig. 2 but at a higher resolution. Note that the BLR spectrum is used
here below 3800 A.
Fig. 4.— Top panel: Observed circular polarization (thin line) and model polarization
spectrum (thick line) for a mean longitudinal field of 165 kG. Bottom panel: Corresponding
spectrum obtained with a spectral resolution (∆λ = 17 A) inadequate to show the Zeeman
splitting of the line cores.
Fig. 5.— Same as Fig. 3 but by taking into account the presence of a weak magnetic field
with a mean surface field strength of Bs ∼ 650 kG in our model flux calculations. In this
model, the iron abundance is solar with respect to calcium. The insert in the third panel
from the top shows our prediction of a weak Hα absorption feature when a small abundance
of hydrogen with log (H/He) = −3 is included.
Fig. 6.— Our best fit to the energy distribution of G165-7 using models including metals as
well as a weak magnetic field. The observations are represented by the error bars while the
corresponding average model fluxes are shown by the filled circles (BV RIJHK, from left to
right) and by the open circles (ugriz, from left to right; here the uncertainties have been set
to 0.04 for clarity). The atmospheric parameters are given in the figure.
Fig. 7.— Comparison of the observed and synthetic spectra in the 5000 − 5300 A region.
Here, the MgH molecular opacity has been included in our calculations (solid line), although
an increase of the MgH abundance by a factor of 20 was required to match the blue wing of
Mg i. We also show our calculations without the inclusion of MgH (dashed line).

– 20 –
Figure 1
– 21 –
Figure 2

– 22 –
Figure 3

– 23 –
Figure 4

– 24 –
Figure 5

– 25 –
Figure 6

– 26 –
Figure 7


![OYDQLD /DZ 6FKRRO · 2019-06-04 · $zdugv )ulho 6fdqodq $zdug 0dufk sul]h iru ehvw 7hpsoh 8qlyhuvlw\ 6fkrro ri /dz vfkroduvkls 7hpsoh /dz 5hylhz )dfxow\ krqruhh dw 7hpsoh /dz 5hylhz](https://static.fdocuments.us/doc/165x107/5f44fe819a2d3b6295504c4b/oydqld-dz-6fkrro-2019-06-04-zdugv-ulho-6fdqodq-zdug-0dufk-sulh-iru-ehvw-7hpsoh.jpg)