MICROBIAL CONVERSION OF BIODIESEL BY-PRODUCTS TO BIOFUEL by
97
MICROBIAL CONVERSION OF BIODIESEL BY-PRODUCTS TO BIOFUEL by Kelly Frances O’Shea A thesis submitted in partial fulfillment of the requirements for the degree of Master of Science in Microbiology MONTANA STATE UNIVERSITY Bozeman, Montana August 2010
Transcript of MICROBIAL CONVERSION OF BIODIESEL BY-PRODUCTS TO BIOFUEL by

MICROBIAL CONVERSION OF BIODIESEL BY-PRODUCTS TO BIOFUEL
by
Kelly Frances O’Shea
A thesis submitted in partial fulfillment
of the requirements for the degree
of
Master of Science
in
Microbiology
MONTANA STATE UNIVERSITY
Bozeman, Montana
August 2010

©COPYRIGHT
by
Kelly Frances O’Shea
2010
All Rights Reserved

ii
APPROVAL
of a thesis submitted by
Kelly Frances O’Shea
This thesis has been read by each member of the thesis committee and has been
found to be satisfactory regarding content, English usage, format, citation, bibliographic
style, and consistency and is ready for submission to the Division of Graduate Education.
Dr. Matthew Fields, Chair of Committee
Approved for the Department of Microbiology
Dr. Mark Jutila
Approved for the Division of Graduate Education
Dr. Carl A. Fox

iii
STATEMENT OF PERMISSION TO USE
In presenting this thesis in partial fulfillment of the requirements for a
master’s degree at Montana State University, I agree that the Library shall make it
available to borrowers under rules of the Library.
If I have indicated my intention to copyright this thesis by including a
copyright notice page, copying is allowable only for scholarly purposes, consistent with
“fair use” as prescribed in the U.S. Copyright Law. Requests for permission for extended
quotation from or reproduction of this thesis in whole or in parts may be granted
only by the copyright holder.
Kelly Frances O’Shea
August 2010

iv
ACKNOWLEDGEMENTS
I am extremely grateful to my advisor Dr. Matthew Fields. Although I had very
little background in microbiology, he took me in as one of his graduate students and
showed me nothing but continuous support. Thank you for all of your guidance. I truly
appreciate the many hours you have given to help me out (especially the all nighters).
Thank you for continuing to encourage me as I move toward a new career path in
teaching. I would also like to express my gratitude to Dr. Mike Franklin and Dr. Robin
Gerlach the other two members of my committee. Thank you, not only for sharing your
expertise and advice, but for being so understanding and flexible with my new endeavors.
I sincerely appreciate all your support.
Thanks to all my past and present lab mates, Andy, Anitha, Brad, Chiachi, Erin,
Elliot, Kara, Kristen, Jake, Logan, Phil, and Melinda, for all your help inside and outside
of lab. I love all of you and really appreciate all the support and laughs. I can’t wait to
have you come present to my high school students. What great role models you all are! I
also want to thank everyone in the Microbiology Department and my coworkers at the
CBE for their willingness to share ideas and for their constant helpful attitude. I can’t
imagine a friendlier work environment. Thanks to John Neuman and Ann Willis for all
the technical support. I am extremely grateful for all the advice, guidance, and emotional
support that Stephanie Cunningham has shown me since day one of grad school. The
Molecular Bioscience Program has been a wonderful experience and I any very thankful
for the financial support. Finally, I want to thank my family and friends for their love,
guidance, humor, and all their emotional support. Thank you, Chad, for all the dinners!

v
TABLE OF CONTENTS
1. INTRODUCTION……………………………………………………………………1
Transportation Energy………………....……………………..……………………….1
Hydrocarbon Fuels……...….…………………………………………………...1
Petroleum…....…..……………………………………………………….6
Biodiesel………..………………………………………………………..8
Current Issues with Biodiesel and its By-product Crude Glycerin...…..…………….11
Alternative Transportation Energy………………….…………………………11
Crude Glycerin……………….………………………………………...12
Biogas…………….....……….…………………………………………14
Microbial Physiology…………………………………………………..…………….15
Physiology of SRB on Glycerol…….………………………………………….15
Physiology of Methanogenesis……………………….………………..17
Hydrogenotrophic Methanogenesis….………………………………...18
Methylotrophic Methanogenesis………………….……………………20
Acetoclastic Methanogenesis…….…………………………………….21
Syntrophic Growth of SRB and Methanogens……………….………..23
Experimental Microorganisms………………………………………..……………...26
Desulfovibrio alcoholvorans 6133.....................................................................26
Desulfovibrio vietnamensis………...…….……….……………………………26
Methanococcus maripaludis...............................................................................27
Methanoculleus marisnigri………….………………….……….………………27
Methanosarcina acetivorans………………………….……….………………..28
Thesis Statement and Hypothesis……………………………………...……………..28
2. MATERIALS AND METHODS……………………………………………………29
Glycerin Production and Fractionation……………………..………………………..29
Biodiesel…………….…………………………………………………………29
Fractionated Glycerin………………………………………….………………29
Growth Experiments……………………………………..…………………………..29
Strains and Culture Conditions…….……….………...………………………..29
SRB Monoculture Experiments……….…….………………………………….30
Methanogen Toxicity Tests……....……………………………………………31
Co- and Triculture Experiments……………………………………………….31
Glycerol Optimization Experiments….………………………………………..32
Growth of M. acetivorans on Different Headspace Concentrations……..........32
M. acetivorans Triculture Experiments……….……………………………….33
Supernatant Growth Experiments……………….……………………………..33
Data Analysis…………………………………………….………………………….34

vi
TABLE OF CONTENTS − CONTINUED
Glycerol Assay……………….……….…………..…………………………...34
Free Fatty Acid Assay……..…………..…...…….……………………………34
Ion Chromatography……….………………….….….….……………………..34
Gas Chromatography………..……….…………….………………………….34
3. RESULTS……………………………………………………………………………36
Monoculture Growth Experiments……...……………………………………………36
SRB Monocultures…………………………………...………...…….…….….36
Methanogen Monoculture Toxicity Experiments….…………………..……..38
Pure Glycerol and Fractionated Glycerin Optimization for Cocultures……...………42
Pure Glycerol………..………….…………………………………………….42
Fractionated Glycerin……………...…………………………………………42
Coculture and Triculture Growth Experiments…………………………...………….46
Coculture Growth on Pure Glycerol……………...…………………………..46
Coculture Growth on Fractionated Glycerin….……………...….…………….47
Coculture Growth on Crude Glycerin…………………………………………48
Triculture Growth on Pure Glycerol…………………………………………..48
Triculture Growth on Fractionated Glycerin……….………………………….48
Triculture Growth on Crude Glycerin…………………………………………49
Free Fatty Acids…………...………………………………………………….58
Methanosarcina acetivorans Growth Experiments…………………...……………...59
M. acetivorans Growth on Methanol and Crude Glycerin with
Various Headspace Concentrations..................................................................59
SRB and hydrogenotrophic Methanogen Cocultures with
M. acetivorans………...……………….………………………….……………62
Cocultures Grown on M. acetivorans Supernatant…….……....………………66
4. DISCUSSION AND CONCLUSIONS……………………………………………...68
Entire Consortia Physiology……………………………………………….......….….68
Co/tricultures on Pure Glycerol, Fractionated Glycerin, and Crude Glycerin……….69
Pure Glycerol…………...…………………………………………………….70
Fractionated Glycerin…………………………………………………………72
Crude Glycerin…………….…………………………………………………..74
Correlations between Pure Glycerol, Fractionated Glycerin, and Crude Glycerin......75
M. acetivorans Experiments……..…………..………………………………...……..77
Conclusions……………………………………………...……………………………78
LITERATURE CITED …………………………………………………………………81

vii
LIST OF TABLES
Table Page
1. SRB Growth Rates on Different Carbon Sources………………………………..38
2. Methane Production from Cocultures Grown on Different Concentrations of
Pure Glycerol…...………………………………………………………………..46
3. Methane Production from Cocultures Grown on Different Concentration of
Fractionated Glycerin…………………………………………………………….46
4. Methane Production from Growth on Pure Glycerol, Fractionated Glycerin
and Crude Glycerin………………………………………………………………58
5. Methane Production of M. acetivorans with Cocultures………………………...66
6. Methane Concentrations from Supernatant Growth……………………………..67
7. Co/tricultures on Pure Glycerol………………………………………………….70
8. Co/tricultures on Fractionated Glycerin………………………………………….72
9. Co/tricultures on Crude Glycerin………………………………………………...72
viii
LIST OF FIGURES
Figure Page
1. Global Carbon Cycle………………………………………………………………3
2. Process of Hydrocarbon Production from Organic Matter………………………..6
3. Transesterification Reaction……………………………………………………..12
4. Incomplete Oxidation of Glycerol……………………………………………….17
5. Hydrogenotrophic Metabolism…………………………………………………..19
6. Methylotrophic Pathway…………………………………………………………21
7. Acetoclastic Pathway…………………………………………………………….23
8. SRB Monoculture Growth on Different Carbon Sources………………………..37
9. M. maripaludis Toxicity Test……………………………………………………39
10. M. marisnigri Toxicity Test……………………………………………………...40
11. M. acetivorans Toxicity Test…………………………………………………….41
12. Pure Glycerol and Fractionated Glycerin Optimization for
D. alcoholvorans 6133 and M. maripaludis……………………………………...44
13. Pure Glycerol and Fractionated Glycerin Optimization for
D. vietnamensis & M. maripaludis………………………………………….……45
14. Growth Comparison on Fractionated Glycerin…………………………………..50
15. Growth Comparison on Crude Glycerin…………………………………………51
16. Growth of D. alcoholvorans 6133 and M. maripaludis on Pure Glycerol,
Fractionated Glycerin, and Crude Glycerin……………………………………...52
17. Growth of D. vietnamensis and M. maripaludis on Pure Glycerol, Fractionated
Glycerin, and Crude Glycerin……………………………………………………53

ix
LIST OF FIGURES − CONTINUED
18. Growth of D. alcoholvorans 6133 and M. marisnigri on Pure Glycerol,
Fractionated Glycerin, and Crude Glycerin……………………………………...54
19. Growth on D. vietnamensis and M. marisnigri on Pure Glycerol, Fractionated
Glycerin, and Crude Glycerin……………………………………………….……55
20. Growth on D. alcoholvorans 6133 and M. maripaludis and M. marisnigri on
Pure Glycerol, Fractionated Glycerin, and Crude Glycerin……………………...56
21. Growth of D. vietnamensis and M. maripaludis and M. marisnigri on Pure
Glycerol, Fractionated Glycerin, and Crude Glycerin…………………………...57
22. Free Fatty Acids………………………………………………………………….59
23. M. acetivorans Growth on Methanol and Crude Glycerin………………….……61
24. Growth of M. acetivorans Under Different Headspace Concentrations and
Methane Production……………………………………………………………...62
25. Tricultures: SRB and Hydrogenotrophic Methanogen Cocultures Combined
with M. acetivorans………………………………………………………………65
26. Cocultures Growth on M. acetivorans Supernatant……………………………...67
27. Complete Pathway of Co/tricultures on Pure Glycerol, Fractionated Glycerin,
and Crude Glycerin……………………………….……………………………...68
28. Growth Correlation on Pure Glycerol……………………………………………71
29. Growth Correlation on Crude Glycerin………………………………………….73
30. Growth Correlation on Crude Glycerin………………………………………….75
31. Correlations between Pure Glycerol, Fractionated Glycerin, and
Crude Glycerin…………………………………………………………………...76

x
ABSTRACT
Biodiesel is an alternative liquid transportation fuel derived from biological oils.
It is a renewable form of transportation fuel that can be easily integrated into society’s
current infrastructure. Biodiesel is cleaner burning than petroleum, emitting less carbon
pollution and harmful toxins (i.e. sulfur, benzene). One of the major by-products from
biodiesel production is crude glycerin. With the increased production of biodiesel,
glycerin production will continue to increase. Glycerin was once considered a valuable
co-product but now is considered a low-value by-product. In the following study,
different co/tricultures of sulfate reducing bacteria (SRB) and methanogens were grown
with crude glycerin as a means to convert the waste product into a renewable energy
source, methane. The SRBs, Desulfovibrio vietnamensis and Desulfovibrio
alcoholovorans 6133, were grown syntrophically, in different co/triculture combinations,
with Methanococcus maripaludis, Methanoculleus marisnigri, and Methanosarcina
acetivorans. Co/tricultures were investigated for the ability to produce methane via the
utilization of pure glycerol, fractionated glycerin, and crude glycerin as carbon and
energy sources. In order to gain insight into cellular physiology, glycerol, acetate, free
fatty acid, and methane concentrations were measured throughout growth. The
co/tricultures grew fastest on pure glycerol and experienced a lag phase in growth on
fractionated glycerin and longer lag phases when transferred to crude glycerin. However,
methane yields were similar on all three carbon sources. Methane production depended
on the carbon source and culture composition. Co/tricultures growing on pure glycerol
and fractionated glycerin displayed a decrease of methane production as growth rate
increased. The opposite was seen with growth on crude glycerin. With most cultures, the
addition of M. acetivorans increased methane concentrations significantly. M.
acetivorans displayed the capability of utilizing the by-product, acetate, from SRB
oxidation of glycerol and the methanol layer from fractionated and crude glycerin. M.
acetivorans appeared to interfere with the coculturing of D. vietnamensis and M.
marisnigri based on decreased methane production. Cocultures with M. maripaludis grew
poorly and produced little methane when grown on the supernatant of M. acetivorans.
This is the first study to characterize the utilization of crude glycerin from biodiesel
production by syntrophic cultures of SRB and methanogenic archaea.

1
INTRODUCTION
Transportation Energy.
Hydrocarbon Fuels.
Of the three types of naturally occurring hydrocarbon fuels, carbon is the main
element (based on weight) composing all of them: petroleum is 82-87% carbon, natural
gas is 75% carbon, and coal is 65-95% carbon (Schobert, 1990). It is widely accepted by
scientists that hydrocarbon fuel sources were generated by once living organisms, and
this is supported by the presence of certain biomarkers (e.g., chlorophyll and heme) that
are often associated with petroleum and coal. Optically active compounds are also
observed in petroleum; molecules that are only produced by living organisms (Schorbet,
1990; Thom, 1929). One of the more obvious signs of organic life is the presence of plant
remains that are usually found within coal (Schobert, 1990). Autotrophy is the process
that incorporates carbon into the biological systems; therefore, it is also responsible for
producing the precursors for hydrocarbon fuel. Photosynthesis (equation 1.1) is a process
that fixes CO2 into organic life. The following equation shows the reaction of
photosynthesis (Tissot & Welte, 1978):
6CO2 + 6H2O + light → C6H12O6 + 6O2 (1)
Essentially, photosynthesis converts solar energy into chemical energy. This is a non-
spontaneous reaction that requires a great amount of energy to proceed; ΔG is equal to

2
2,720 kJ at 298°K (Schorber, 1990). Approximately 470 kJ is absorbed for every gram
mole of carbon that gets fixed into biomass (Klass, 1998). The energy that goes into
making glucose (C6H12O6), a major building block of organic matter, gets stored as
chemical energy. Glucose is a metabolic precursor for many cellular components such as
amino acids, nucleotides, fatty acids, carbohydrates, etc. As glucose enters one of these
physiological pathways, its stored chemical energy gets transferred into other molecules
that contribute to the composition of organic matter. Since organic matter has such a
great amount of stored energy, and if it does not decay completely, it has the potential to
become a hydrocarbon fuel source. The trapped energy can then be harnessed through
combustion (the breaking of chemical bonds) and utilized for transportation, heating,
electricity, etc. (Schobert, 1990).
Figure 1. Global Carbon Cycle. Carbon in the atmosphere is in equilibrium with the
oceans and within rocks. Carbon in the atmosphere can also be photosynthesized by
plants and microorganisms which can then go on into animals. Eventually the organisms
will die releasing carbon back into the atmosphere completing the cycle (Schobert, 1990).

3
The flow of carbon throughout our environment can be summed up in the carbon
cycle. Figure 1, a very simplified version of the global carbon cycle, shows how
atmospheric carbon (CO2) gets fixed into biological material through photosynthesizing
plants and microorganisms. Through consumption, carbon is transferred throughout the
biological systems. When plants, microorganisms, and animals die, they decay and
release carbon back into the atmosphere. In some cases, the dead organisms will not fully
decompose, and as a result, will eventually become fossil fuels. These fossil fuels are
what we use today as hydrocarbon fuels because they still contain the energy trapped
from photosynthesis. In order to account for all carbon on Earth, Figure 1 also shows the
equilibrium of carbon in the ocean (CO2) and rocks (carbonate) with the atmospheric
carbon. However, this aspect of the carbon cycle is not relevant to hydrocarbon fuel
production (Schobert, 1990).
Photosynthesis is responsible for the production of large amounts of organic
matter. Although almost 95% of all organic carbon (from dead organisms) returns to the
atmosphere, approximately 5% will get buried and become organic sediment. As buried
organic sediment, the carbon will either get converted into petroleum or the sediment will
erode and the carbon will get oxidized back to CO2. In order for organic matter to
become hydrocarbon fuel it needs to go through at least one of the following processes:
diagenesis, catagenesis, and metagenesis (Figure 2) (Schorber, 1990; Tissot & Welte,
1978).
As organic sediments are slowly buried they become more protected from
oxidation. The first process of diagenesis is rotting which occurs around 0 to 1 meter

4
below the surface. In this zone, oxygen is still present so it is basically a competition
between the burial and oxidation of organic matter. The organic sediment that makes it
past this zone then enters the moldering zone which is located 1 to 2 meters below the
surface. The oxygen concentration is much lower at this level so oxidation of the organic
sediment does not usually occur. Instead, environmental hydrolysis of larger polymers
(i.e. cellulose, proteins) dominates. Through this process, molecules such as
carbohydrates, proteins, and glycosides get converted to humus, while lignin, lipids, and
resins remain conserved. Putrefaction occurs in the next zone which is 2 to 10 meters
below the surface. This is an anaerobic environment where microorganisms will begin to
degrade organic material that has entered this zone. Methane, carbon dioxide, and water
are common byproducts at this stage. Eventually, when putrefaction is over, the organic
sediment becomes an “organic soup” (Schorber, 1990, p. 33) of humic acids. The final
left over organic matter, or “organic soup”, gets polymerized into kerogen, a non-soluble,
high molecular weight substance. The production of kerogen is the final stage of
diagenesis, which occurs between 100 to 200 meters below the surface. The generation of
kerogen marks the start of transitioning organic material into hydrocarbon fuels
(Schobert, 1990; Tissot & Welte, 1978). It is important to note that there is also a path in
diagenesis that results in geochemical fossils. In this case, organic material is not altered;
either carbon skeletons are retained or organic material is completely unaltered (i.e.
lipids) (Tissot & Welte, 1978).
As kerogen gets buried deeper and deeper, it enters the catagenesis phase. This
process occurs within the Earth at high temperatures and pressure. Kerogen begins to

5
degrade into low to medium molecular weight hydrocarbons as the temperature and
pressure begins to increase. These smaller hydrocarbon molecules are linear, cyclic, and
branched (oil formation stage). As the depth increases so does the temperature, and when
kerogen gets to a certain depth some of the carbon-carbon bonds begin to crack. This
produces very low molecular weight products like methane and hydrogen sulfide (wet gas
formation stage). There are two types of hydrocarbons created during this process: high
hydrogen and low hydrogen molecules. The higher hydrogen forming molecules are
crude oil and methane which have H:C atomic ratios of 1.5 to 2 and 4, respectively. The
left over kerogen is losing hydrogen as the other molecules are produced, and therefore
has a H:C ratio of 0.5. When kerogen gets buried even deeper, it enters metagenesis.
During this phase, kerogen starts to become restructured to a higher ordering material and
only methane is produced (dry gas formation) (Tissot & Welte, 1978; Schobert, 1990;
Sokolov, 1972). Figure 2 summarizes the process of diagenesis, catagenesis, and
metagenesis; displaying the relative depth and products generated (Rondeel, 2002).

6
Figure 2. Process of Hydrocarbon Production from Organic Matter. As organic sediments
are buried the temperature and pressure increase producing hydrocarbons. Diagenesis,
catagenesis, and metagenesis are the different phases that organic sediments go through
to become the various molecules of hydrocarbons (Rondeel, 2002).
Petroleum. The following experiment focuses on transportation energy, a sector
that utilizes the hydrocarbon fuel, petroleum. Petroleum, or crude oil, can be used for
either harnessing energy through burning, like with transportation, or it can be used to
produce different materials, like plastics and rubber (Pauling, 1970). Petroleum is a
darkish black, viscous liquid made up of many different hydrocarbons. The mixture of
hydrocarbons is made up of four different types of components, based on organic
solubility: saturates (i.e. alkanes, cycloalkanes), aromatics, resins (aggregates with
pyridines, quinolines, carbazol, etc.) and asphaltenes (aggregates with polyaromatics,

7
naphthenic acides, sulfides, etc.) (Pauling, 1970; Sugiura, Ishihara, Shimachi, &
Harayama, 1997; Tissot & Welte, 1978). Since petroleum is composed of hundreds to
thousands of compounds, it is necessary to separate them into useful fractions. The
process of separating petroleum into different products occurs at an oil refinery
(Schobert, 1990). Distillation is a common method for crude oil fractionation which
separates compounds based on boiling points.
Gasoline (C5-C9 alkanes) generally has the lowest boiling point so it is the first
product distilled. On average, petroleum is usually only composed of 10 to 30% gasoline.
This is not a high enough percentage to meet the current demand of gasoline. There are
two processes that can increase the percentage of gasoline collected from petroleum:
thermal/catalytic cracking and molecular building. Thermal and catalytic cracking
involve breaking molecules that are greater than C9 into the carbon range of gasoline.
This method can increase the gasoline yield to 40 or 50%. The other process uses
polymerization or alkylation to combine smaller carbon molecules within the crude oil to
form C5-C9 alkanes. Another common transportation fuel is diesel. Diesel fuel comes
from the kerosene and gas oil fractions of petroleum. This is a lower quality fuel that
ranges from C15 to C17 alkanes; mostly paraffin and naphthene hydrocarbons. Diesel has a
higher density and boiling point than gasoline. Due to its longer saturated chemical
composition, it will sometimes solidify when stored. (Schobert, 1990; Babich & Moulijn,
2002; Sokolov, 1972).
Numerous problems associated with the use of petroleum exist. For one, it is
predicted that the rate of consumption will eventually exceed the world’s supply, and

8
consequently, it will become more expensive. According to Pahl, the global production of
oil will never be able to exceed 100 million barrels a day; however, by 2025 the demand
is projected to be around 121 million barrels a day. Currently, the world’s largest oil
fields are exhausting at a rate of 5% each year (Pahl, 2008). The fact is, there exists only
a finite amount of oil reservoirs on our Earth, all of which are guaranteed to run out. In
terms of the environment, petroleum is not environmentally friendly. In 1997, fossil fuels
were burned at a rate that released 4.4 x 10¹⁹
g of carbon into the atmosphere. This is
about 400 times more carbon than primary producers are capable of fixing (Dukes, 2003;
Pahl, 2008). Aside from CO2 pollution, petroleum also releases toxic chemicals into the
atmosphere such as aromatic compounds, sulfur, nitrogen oxides, and heavy metals. Oil
spills are another huge problem that cause substantial amounts of environmental damage;
ruining whole ecosystems, killing animals, polluting water, etc. (Sugiura et al., 1997). A
case in point is the 2010 British Petroleum spill in the Gulf of Mexico. As petroleum
continues to create social and environmental issues the prospect of finding alternative
fuels has become more urgent.
Biodiesel.
Rudolf Diesel is the inventor of the diesel engine. His unique idea of the
“compression engine” was patented on February 28, 1892 and was based upon ignited
fuel through the compression in the presence of air. Diesel built his first prototype in
1893 but it was short lived when the pressure gauge exploded. It was not until 1896 that
Diesel designed a working engine. Manufacturers immediately heard and were excited
about the new invention. Diesel ended up selling the manufacturing license to a rich man

9
from the U.S., named Adolphus Busch, for what would be the equivalence of five million
dollars today. Using Diesel’s patent, Busch built the first commercial diesel engine.
During a Paris Exposition in 1900, the engine was shown to run on a variety of fuels
including peanut oil. Although petroleum was beginning to dominate the fuel industry by
1911, Diesel was a large supporter for vegetable based fuels and always intended his
engine to run off of vegetable oil. Diesel also dreamed of selling his engines to smaller
businesses and he believed it could even transform the railway system. Sadly, due to the
large engine size, Diesel had a lot of trouble marketing his engine to these smaller
businesses. By 1912, Diesel had sold more than 70 thousand engines, but mostly to large
businesses. One goal he was able to accomplish was that his engine did go on to
revolutionize the railway system after World War II. Unfortunately, Diesel never lived to
see this. In fact, his death is very mysterious. In 1913, Diesel was on a ship heading to
England for a meeting with the British Diesel Company when disappeared mid-sail in the
middle of the night. No one knows what happened to him, but some believe he was
extremely depressed about financial problems and decided to end his life. He also had
heart problems, so some believe he died of a heart attack and then fell overboard. Others
wonder if perhaps, there was a political motive, and that the petroleum industry was
somehow involved with his sudden and unexpected disappearance (Pahl, 2008).
In essence, the invention of biodiesel coincided with the invention of the diesel
engine. However, by the early 1900’s, petroleum, a cheap accessible alternative, begun to
take over as the main energy source replacing natural oils. Over time, diesel engines
became more compatible with petroleum so that natural oil-fuels became too viscous for

10
utilization. Today, biodiesel is making a comeback. In order to overcome the high
viscosity problem of natural oils so they can be used in modern diesel engines, they must
go through a process called transesterification (see below) (Sheehan et al., 1998). A
variety of natural oils can be used in biodiesel production some of which come from:
palm, coconut, jatropha, rapeseed/canola, camelina, peanut, sunflower, safflower,
mustard, soybean, hemp, corn, used cooking oil, animal fat, and algae (Pahl, 2008).
Biodiesel is an environmentally friendly alternative to petroleum-based fuel that releases
41% less greenhouse gas emissions (Hill et al., 2006).
When crude oil reaches the price of $45/barrel, biodiesel becomes economically
feasible based upon current economic indicators (McGraw, 2009). In July 2008, prices
skyrocketed reaching $147/barrel, and as of July 3, 2010, the cost of crude oil was
$72.3/barrel (Oil-price.net). The infrastructure for storage and mass distribution of
biodiesel already exists, and it can be used in modern engines without any modifications.
Many countries have already implemented this alternative fuel into their transportation
system. In 2006, Europe generated 85% of the world’s biodiesel (1.7 billon gallons
produced worldwide). The EU has over 185 biodiesel plants that are capable of producing
about 3.3 billion gallons per year. After Germany, the U.S. produces the second highest
amount of biodiesel. The National Renewable Energy Lab (NREL) believes the U.S. has
the potential to produce 1 billion gallons of biodiesel each year (Pahl, 2008). The current
widespread use of biodiesel provides strong evidence for its capability as an alternative to
transportation fuel. Rudolf Diesel understood the potential of biodiesel in 1912 when he

11
wrote, “The use of vegetable oils may become in the course of time as important as
petroleum and coal tar products of the present time.” (Klass, 1998, p. 335; Phal, 2008).
Current Issues with Biodiesel and its By-product Crude Glycerin.
Alternative Transportation Energy.
Petroleum has been utilized as the main source of transportation energy in the
U.S. since the industrial revolution. In 2008, 28% of the U.S.’s total energy was
consumed by the transportation sector which exhausted 9 million barrels of gasoline per
day (U.S. Energy Information Administration, 2009). As our consumption of petroleum
has increased, we have become more petroleum-dependent, and therefore face issues
involving supply shortages, foreign governments, high costs, and environmental pollutant
emissions (Lόpez, Santos, & Pérez, 2009). In response to these concerns, the Energy
Independence and Security Act of 2007 was instated in order to significantly increase the
production of alternative fuel by 2022 to 36 billion gallons (Peralta-Yahya & Keasling,
2010). Biodiesel, derived from biological sources, is a promising renewable form of fuel
that can be easily integrated into society’s current energy infrastructure; engine,
transportation, and storage compatibility. Biodiesel emits less carbon pollution due to its
more complete combustion and contains less contaminates (i.e. sulfur, aromatic
compounds, metals, etc.) than petroleum based fuels and thus burns cleaner (Peralta-
Yahya & Keasling, 2010; Vasudevan & Briggs, 2008). As the top biodiesel producer in
the world, the European Union generated approximately 3.2 million tons in 2005. In
2008, Brazil passed a law that made it mandatory for all diesel fuel to be mixed with 2%

12
biodiesel, and by 2013 the mixture ratio will be required to move up to 5% (Silva, Mack,
& Contiero, 2009). Worldwide use of biodiesel reveals its capability of replacing
petroleum as a major source of alternative transportation fuel.
Crude Glycerin. Biodiesel can be produced from oil crops (i.e. soybean, palm,
rapeseed), cooking wastes (i.e. animal fats, grease), and more recently, microalgae
(Vasudevan & Briggs, 2008). All these sources store energy in the form of
triacylglycerols; three long chain fatty acids bound to a glycerol backbone via ester bonds
(Figure 1.3) (Silva et al., 2009). Triacylglycerols are too viscous for today’s car engines
that have been modified to run on petroleum, a much less viscous fuel (Sheehan,
Dunahay, Benemann, & Roessler, 1998). In order to overcome the high viscosity problem
of these natural oils, the fatty acids are removed from the glycerol backbone through
transesterification (Figure 3). Transesterification occurs when triacylglycerols react with
alcohol, most commonly methanol, and an acidic or alkaline catalyst (KOH, NaOH) to
form 3 moles of fatty acid ethyl esters and 1 mole of glycerol.
R1 R2 R3R1 R2 R3 R1 R2 R3R1 R2 R3
Triacylglycerol Methanol Biodiesel Glycerol
Figure 3. Transesterification Reaction. 3 moles of methanol react with 1 mole of
triacylglycerol producing 3 moles of biodiesel (alkyl esters) and one mole of glycerol.
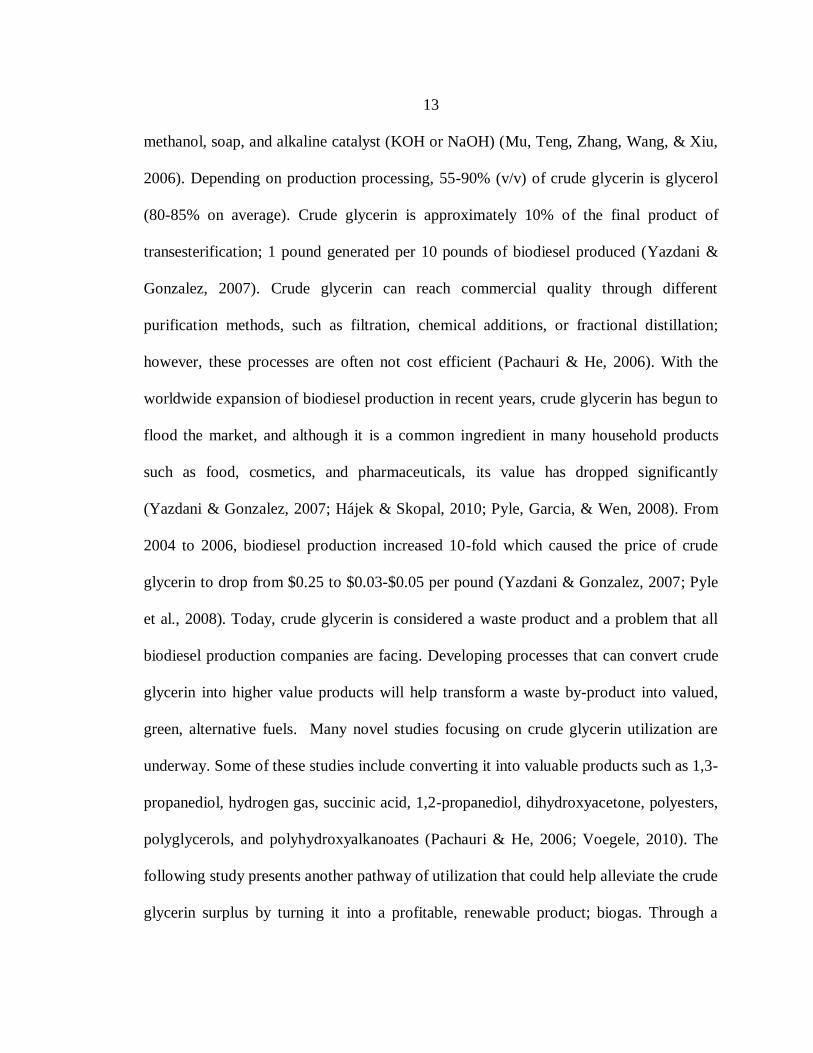
Crude glycerin is a by-product of biodiesel production and is mostly composed of
glycerol (Figure 3). Aside from glycerol, crude glycerin also contains free fatty acids,
13
methanol, soap, and alkaline catalyst (KOH or NaOH) (Mu, Teng, Zhang, Wang, & Xiu,
2006). Depending on production processing, 55-90% (v/v) of crude glycerin is glycerol
(80-85% on average). Crude glycerin is approximately 10% of the final product of
transesterification; 1 pound generated per 10 pounds of biodiesel produced (Yazdani &
Gonzalez, 2007). Crude glycerin can reach commercial quality through different
purification methods, such as filtration, chemical additions, or fractional distillation;
however, these processes are often not cost efficient (Pachauri & He, 2006). With the
worldwide expansion of biodiesel production in recent years, crude glycerin has begun to
flood the market, and although it is a common ingredient in many household products
such as food, cosmetics, and pharmaceuticals, its value has dropped significantly
(Yazdani & Gonzalez, 2007; Hájek & Skopal, 2010; Pyle, Garcia, & Wen, 2008). From
2004 to 2006, biodiesel production increased 10-fold which caused the price of crude
glycerin to drop from $0.25 to $0.03-$0.05 per pound (Yazdani & Gonzalez, 2007; Pyle
et al., 2008). Today, crude glycerin is considered a waste product and a problem that all
biodiesel production companies are facing. Developing processes that can convert crude
glycerin into higher value products will help transform a waste by-product into valued,
green, alternative fuels. Many novel studies focusing on crude glycerin utilization are
underway. Some of these studies include converting it into valuable products such as 1,3-
propanediol, hydrogen gas, succinic acid, 1,2-propanediol, dihydroxyacetone, polyesters,
polyglycerols, and polyhydroxyalkanoates (Pachauri & He, 2006; Voegele, 2010). The
following study presents another pathway of utilization that could help alleviate the crude
glycerin surplus by turning it into a profitable, renewable product; biogas. Through a

14
mixed consortium of sulfate-reducing bacteria (SRB) and methanogens, crude glycerin
was biologically converted to methane.
Biogas. Natural gas is approximately 90% methane. Methane is one of the most
energy efficient fuels because it releases more heat than other hydrocarbon fuels per
carbon. It is also cleaner since it does not produce ash or residues when burned. The
following equation represents the combustion of methane:
CH4 + 2O2 → CO2 + 2H2O (2)
The caloric value of methane combustion is 55,600 kJ/kg. This is greater than both
petroleum and coal which have calorific values of 46,000 and 35,000 kJ/kg, respectively.
The ratio of H:C bonds in methane is 4, while petroleum has a ratio of 2 and coal has one
less than 1. In general, as the H:C atomic ratio decreases so does the calorific value
(Schobert, 1990).

15
Microbial Physiology.
Physiology of SRB on Glycerol.
SRB live in anaerobic environments and produce hydrogen sulfide through the
reduction of sulfate (SO42-
) via the oxidation of hydrogen and/or organic carbon.
Different SRBs can either oxidize organics incompletely to acetate or completely to CO2.
(Muyzer & Stams 2008; Barton & Hamilton, 2007). Natural habitats of SRB include
marine or freshwater sediments, soils, hot springs, geothermal environments, oil wells
and animal gastrointestinal tracts (Pereira et al., 2008; Postgate, 1979). They have a large
impact on carbon and sulfur cycling and have recently been found useful for
biotechnological applications including heavy metal immobilization, wastewater
treatment for sulfur removal, and hydrogen production. However, SRB can also cause
economic problems that include water pollution through high sulfide production, metal
and stone work corrosion, oil spoilage, and food spoilage (Pereira et al., 2008; Muyzer &
Stams 2008).
SRB are not limited to sulfate for anaerobic respiration. Some are capable of
reducing elemental sulfur, thiosulfate, fumarate, dimethylsulfoxide, Mn(IV), Fe(III),
U(VI), Tc(VII), As(V), and Cr(VI) (Barton & Hamilton, 2007; Pereira et al., 2008).
Aside from having the capability of reducing a wide range of terminal electron acceptors,
SRB can also oxidize a variety of substrates such as lactate, hydrogen, acetate, ethanol,
propionate, pyruvate, etc. (Pereira et al., 2008). Some SRB are also able to utilize
glycerol, the main component of crude glycerin. Figure 4 represents a possible pathway
of glycerol oxidation to acetate. Glycerol enters in glycolysis as glyceraldehyde-3-

16
phosphate (Temudo, Poldermans, Kleerebezem, & Loosdrecht, 2008). Glycerol kinase
phosphorylates glycerol through the use of one molecule of ATP and then an FAD,
bound to a glycerophosphate dehydrogenase, oxidizes the glycerol-3-phosphate to
dihydroxyacetone phosphate. Triosephosphate isomerizes dihydroxyacetone phosphate to
glyceraldehyde-3-phosphate. Then glyceraldehyde-3-phosphate gets oxidized to pyruvate
generating two molecules of ATP and one molecule of NADH (White, 2007).
Anaerobically, either pyruvate-ferredoxin oxidoreductase or pyruvate-formate lyase
oxidizes pyruvate to acetyl-CoA which then gets converted by phosphotransacetylase to
acetyl phosphate (White, 2007; Temudo et al., 2008). The phosphate group of acetyl
phosphate gets transferred to ADP via acetate kinase forming acetate and ATP (White,
2007; Temudo et al., 2008). The following reaction equation summarizes the products of
incomplete glycerol oxidation with sulfate as the terminal electron acceptor (Barton &
Hamilton, 2007):
C3H8O3 (Glycerol) + SO42-
+ 3H+ → C2H4O2 (Acetate) + CO2 + HS
- + 3H2O (3)

17
Figure 4. Incomplete Oxidation of Glycerol. Anaerobic fermentation pathway for
glycerol degradation (Adapted from Temudo et al., 2008).
Physiology of Methanogenesis.
Methanogens flourish in anoxic habitats that contain low concentrations of
terminal electron acceptors like sulfate, nitrate, and Fe(III) (Liu & Whitman, 2008).
When high concentrations of these terminal electron acceptors are present, methanogens
are outcompeted. It is more thermodynamically favorable for the other microorganisms to
reduce these electron acceptors compared to methanogens reducing CO2 to methane (Liu

18
& Whitman, 2008). Methanogens are at the bottom of the food chain in terms of
metabolism of organic compounds. They reduce CO2, the final end product of organic
degradation, and produce about 1 billion tons of methane each year globally, playing a
very important role in global carbon cycling (Ferry, 1994; Goenrich, Duin, Mahlert,
Thauer, 2005). Methanogens are observed in many diverse anaerobic environments such
as marine and freshwater sediments, flooded soils and peat bogs, landfills, animal
gastrointestinal tracts, anaerobic digestors, tundra, rice fields and geothermal systems
(Liu & Whitman, 2008; Deppenmeier, 2004; Ferry, 1994). Methanogens can only utilize
three types of substrates: CO2, methylated compounds, and acetate (Liu & Whitman,
2008; Deppenmeier, 2004; Ferry, 1994). With such a limited substrate metabolism,
methanogens rely on other microorganisms to degrade larger and more complex organic
compounds, leaving them with lower energy molecules to be used for growth (Liu &
Whitman, 2008).
Hydrogenotrophic Methanogenesis. Hydrogenotrophic methanogens utilize CO2
and H2 as carbon and energy sources (see equation 4) (Liu & Whitman, 2008). Figure 5
shows the carbon pathway of hydrogenotrophic methane production.
4H2 + CO2 → CH4 + 2H2O (4)

19
Figure 5. Hydrogenotrophic Metabolism (Adapted from Liu & Whitman, 2008).
As shown in Figure 5, CO2 enters the methanogenic pathway and gets reduced to
formyl-methanofuran (CHO-MFR) via formyl-MFR dhydrogenase. Methanofuran (MFR)
is a carrier coenzyme that binds to reduced CO2. The formyl group is then transferred to
tetrahydromethanopterin (H4MPT) forming the intermediate formyl-H4MPT. The formyl
group losses a water molecule and gets reduced to methyl-H4MPT by a series of stepwise
reductions using coenzyme F420H2 as a reducing agent. Next, the methyl- H4MPT:HS-
CoM methyltransferase transfers the methyl group to CoM-SH forming methyl-SCoM
(methyl-mercaptoethanesulfonate). Coenzyme B then donates electrons so methyl
coenzyme M reductase can cleave and reduce the methyl group to methane. The
heterodisulfide, CoM-S-S-CoB, forms after the cleavage and reduction of the methyl
group and gets reduced by the heterodisulfide reductase. For every one molecule of CO2

20
and four molecules of H2 entering the pathway, one molecule of methane gets generated
(Liu & Whitman, 2008; Deppenmeier, 2004).
Methylotrophic Methanogenesis. Methylated compounds, such as methanol and
formate, are metabolized via the methylotrophic pathway producing CO2 and CH4 as end
products (see equation 5). Figure 6 shows the predicted pathway for methane production
when methanol is the main substrate (Liu & Whitman, 2008; Deppenmeier, 2004; Ferry,
1994). For every four methyl groups entering the pathway, one gets oxidized to CO2
while the remaining three get reduced to methane (Deppenmeier, 2004). In the reduction
pathway, the methyl group of methanol gets transferred via substrate-specific
methyltransferase to a corrinoid protein and then to CoM-SH forming methyl-SCoM. The
methyl group is then reduced to methane through the same pathway as hydrogenotrophic
CO2 reduction (Figures 5 and 6). In the oxidative pathway, methyl-SCoM follows the
reverse pathway of hydrogenotrophic CO2 reduction (Figures 5 and 6) so that the methyl
group eventually gets oxidized to CO2. From this oxidation pathway, reducing equivalents
for methane production are generated (Liu & Whitman, 2008; Deppenmeier, 2004; Ferry,
1994).
4CH3OH → 3CH4 + CO2 + 2H2O (5)

21
Figure 6. Methylotrophic Pathway (Adapted from Liu & Whitman, 2008).
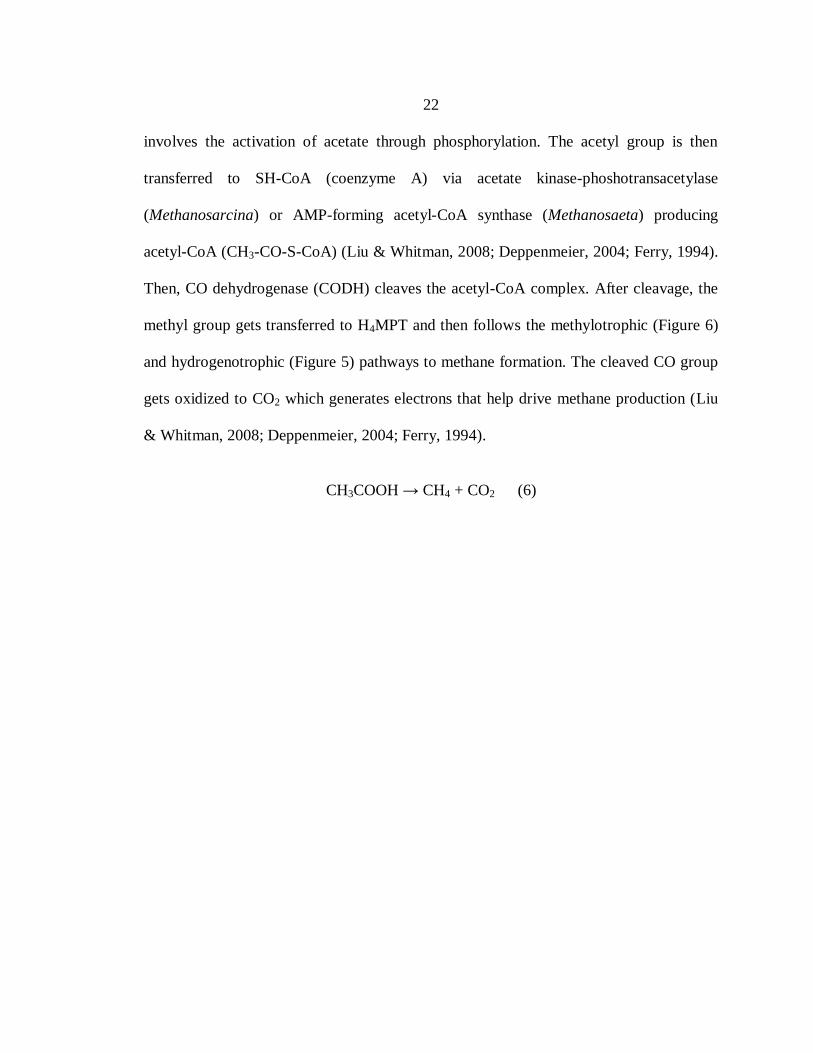
Acetoclastic Methanogenesis. The third type of substrate utilized by methanogens
is acetate. Although only Methanosarcina and Methanosaeta are capable of metabolizing
acetate, the majority of methane produced biologically comes from acetoclastic (acetate
eating) methanogens (Liu & Whitman, 2008). In this metabolism (see Figure 7), acetate
gets split into CO2, through carboxyl oxidation, and CH4, through methyl reduction (see
equation 6) (Liu & Whitman, 2008; Deppenmeier, 2004; Lovely, Dwyer, & Klug, 1982).
Methanosarcina and Methanosaeta each have different acetoclastic pathways containing
their own unique enzymes (Liu & Whitman, 2008). The first step of methanogenesis
22
involves the activation of acetate through phosphorylation. The acetyl group is then
transferred to SH-CoA (coenzyme A) via acetate kinase-phoshotransacetylase
(Methanosarcina) or AMP-forming acetyl-CoA synthase (Methanosaeta) producing
acetyl-CoA (CH3-CO-S-CoA) (Liu & Whitman, 2008; Deppenmeier, 2004; Ferry, 1994).
Then, CO dehydrogenase (CODH) cleaves the acetyl-CoA complex. After cleavage, the
methyl group gets transferred to H4MPT and then follows the methylotrophic (Figure 6)
and hydrogenotrophic (Figure 5) pathways to methane formation. The cleaved CO group
gets oxidized to CO2 which generates electrons that help drive methane production (Liu
& Whitman, 2008; Deppenmeier, 2004; Ferry, 1994).
CH3COOH → CH4 + CO2 (6)

23
Figure 7. Acetoclastic Pathway (Liu & Whitman, 2008).
Syntrophic Growth of SRB and Methanogens.
As described previously, SRB can utilize organic molecules, like lactate and
glycerol, as sole energy sources to reduce sulfate to hydrogen sulfide. However, sulfate is
not a thermodynamically favorable electron acceptor. It has to be activated to adenosine-
phosphosulphate (APS) by an ATP sulphurylase in order for oxidation to proceed (See
equation 7). In order to overcome the thermodynamically unfavorable generation of PPi,
which happens through the formation of APS, the enzyme, pyrophosphatase, must also
hydrolyze PPi to 2Pi (See equation 8). Two ATP molecules are used during the activation
of sulfate (Muyzer & Stams, 2008; Zehnder, 1988).

24
SO42-
+ ATP → APS + PPi (7)
H2O + PPi → 2Pi (8)
As substrate oxidation occurs, electrons get transferred (by an unknown carrier) to
a cytoplasm facing, membrane-bound, ferridoxin-specific, Coo hydrogenase or Ech
hydrogenase (dependant upon carbon source). Within the hydrogenase, electrons get
transferred onto protons generating H2 which then diffuses out of the cytoplasm into the
periplasm (Barton & Hamilton, 2007; White, 2007; Pereira et al., 2008). When H2 enters
the periplasm, it gets re-oxidized to 2H+
by a periplasmic cytochrome c3 hydrogenase.
The protons go to the outside of the membrane creating a transmembrane proton gradient
which can then drive ATP synthesis. The electrons move back across the membrane
reducing sulfate to sulfide. (Zenhnder, 1988; Barton & Hamilton, 2007; Pereira et al.,
2008). Hydrogen cycling is the name of this process; H2 is generated in the cytoplasm and
then oxidized in the periplasm (Barton & Hamilton, 2007; Walker et al., 2009; Caffery et
al., 2007).
When sulfate is not present hydrogen gets produced instead of hydrogen sulfide
(Barton & Hamilton, 2007):
C3H8O3 + H2O → C2H4O2 + CO2 + 3H2 (9)
Without a terminal electron acceptor, H2 increases and the Coo hydrogenase is unable to
re-oxidize the unknown electron carrier thus inhibiting SRB growth (Walker et al., 2009).
This is problematic since the electrons have nowhere to go besides H2. In order for

25
organic oxidation to continue, the H2 partial pressure needs to remain low (~10-100 Pa)
so a thermodynamically favorable environment can be maintained (Barton & Hamilton,
2007; Walker et al., 2009; Bryant, Campbell, Reddy, & Crabill, 1977; Ishii, Kosaka,
Hori, Hotta, & Watanabe, 2005). Through a process termed interspecies hydrogen
transfer, methanogens can grow syntrophically with SRB. Methanogens can utilize the H2
product built up as an energy source for growth. By doing so, they create a low H2 partial
pressure environment which is thermodynamically favorable for SRB to continue
oxidizing organic compounds (Walker et al., 2009; Valdez-Vazquez & Poggi-Varaldo,
2009; Stams & Plugge, 2009; Hamilton, 1998).
SRB and methanogens can both utilize H2 and acetate as energy sources, and in
the natural environment, they compete for these metabolic precursors (Sonne-Hansen,
Westermann, & Ahring, 1999; McCartney & Oleszkiewicz, 1993). When grown on
acetate and H2, SRB Km values are 0.2 mM and 0.001 mM, respectively. Methanogens
have higher Km values for both compounds: 3.0 mM on acetate and 0.006 mM on H2 (Isa,
Grusenmeyer, & Verstraete, 1986). Since SRB have higher affinities (lower Km values)
for these substrates they are capable of utilizing them more efficiently, keeping
concentrations too low for methanogenic growth to proceed (Sonne-Hansen et al., 1999;
Isa et al., 1986; Lovely et al., 1982; McCartney & Oleszkiewicz, 1993; Lovley &
Phillips, 1987). SRB only compete with methanogens when terminal electrons are
present. Even at millimolar concentrations of sulfate, SRB will outcompete methanogens
for H2 and acetate in the presence of SO42-
(Isa et al., 1986; Lovely et al., 1982). In
environments where terminal electron acceptors are limited or as they become exhausted,

26
syntrophic growth between SRB and methanogens will begin to take place (Vroblesky,
Bradley, & Chapelle, 1996). In the following study, different SRB and methanogen co-
and triculture combinations were developed for the utilization of glycerol and conversion
to methane.
Experimental Microorganisms.
Desulfovibrio alcoholvorans 6133.
D. alcoholvorans 6133 is an anaerobic, Gram negative, sulfate reducing
bacterium that was isolated from an industrial anaerobic fermenter containing waste
water from an alcohol distillery. D. alcoholvorans 6133 is curved, non-spore forming,
and motile (single polar flagellum). When utilizing glycerol as a carbon source, it
oxidizes it incompletely to acetate. D. alcoholvorans 6133 can also incompletely oxidize
a variety of other compounds including dihydroxyacetone, 1,3-propanediol, ethanol,
lactate, pyruvate etc. This organism is also capable of oxidizing methanol and formate to
carbon dioxide (Qatibi, Niviere, & Garcia, 1991).
Desulfovibrio vietnamensis.
D. vietnamensis is an anaerobic, Gram negative, sulfate reducing bacterium that
was isolated from a crude oil storage tank in Southern Vietnam near the town Vung Tau.
This organism is curved shaped, non-spore forming, and prefers to grow in the presence
of 5% NaCl. In the presence of sulfate, D. vietnamensis can utilize a large range of
carbon sources including, lactate, malate, formate, ethanol, and glycerol (Nga, Ha, Hien,
& Stan-Lotter, 1996; Feio et al., 2004).

27
Methanococcus maripaludis.
M. maripaludis is a strictly anaerobic organism that was isolated in the 1980s
from salt marsh sediments in Pawley’s Island, North Carolina. The name maripaludis
means “of the sea marsh”. This hydrogenotrophic methanogen is non-spore forming, has
weak motility, and has cell walls that do not contain muramic acid. M. maripaludis is a
coccoidal-rod about 1.2 by 1.6 μm in length, is mesophilic, and displays optimal growth
in the presence of 100 mM NaCl. (Walters & Chong, 2009; Jones, Paynter, & Gupta,
1983).
Methanoculleus marisnigri.
M. marisnigri was isolated in sediment from the Black Sea. This organism is an
irregular coccoid and cells are about 1 to 2 μm in diameter growing singly or as pairs. It
is capable of growing on H2/CO2, formate and some secondary alcohols. M. marisnigri
grows best at neutral pH, mesophilic temperatures, and at NaCl concentrations lower than
300 mM. Although, the organism has flagella, it has not demonstrated motiliy (ExPASy
Proteomics Server; Maestrojuán, Boone, Xun, Mah, & Zhang, 1990; Anderson et al.,
2009).
Methanosarcina acetivorans.
M. acetivorans is an acetoclastic methanogen isolated from methane-evolving
marine sediments in Scripps Canyon near La Jolla, CA. The cells are irregularly shaped
cocci and have a diameter of about 1.9 μm. When grown on acetate, M. acetivorans
grows singly during early exponential-phase, but as it reaches late stationary-phase, it

28
forms aggregates of 2 to 12 cells. This organism has a single fimbria-like appendage but
motility has not been observed. M. acetivorans is a metabolically versatile methanogens
that can utilize acetate, mono-methylamine, di-methylamine, tri-methylamine, methanol,
or carbon monoxide as sole carbon and energy sources. Cells do not display growth on
H2/CO2. The organism requires both NaCl and MgSO4 for growth, and achieves optimal
growth with NaCl concentrations between 100 and 600 mM. This is the first known
marine isolate that is capable of utilizing acetate as a carbon and energy source (Sowers,
Baron, & Ferry, 1984; Rohlin & Gunsalus, 2010; Ma, Liu, & Dong, 2006).
Thesis Statement and Hypothesis.
Glycerin is an abundant waste product from biodiesel production. Converting
glycerin into a valuable product, like methane, will help improve biodiesel economics.
The goal of this study was to characterize the syntrophic associations between SRB and
hydrogenotrophic and acetoclastic methanogens and their ability to convert crude
glycerin into methane. Converting glycerin into methane through microbial conversion is
predicted to display high yields and a promising value stream for the waste product.
29
MATERIALS AND METHODS
Glycerin Production and Fractionation.
Biodiesel.
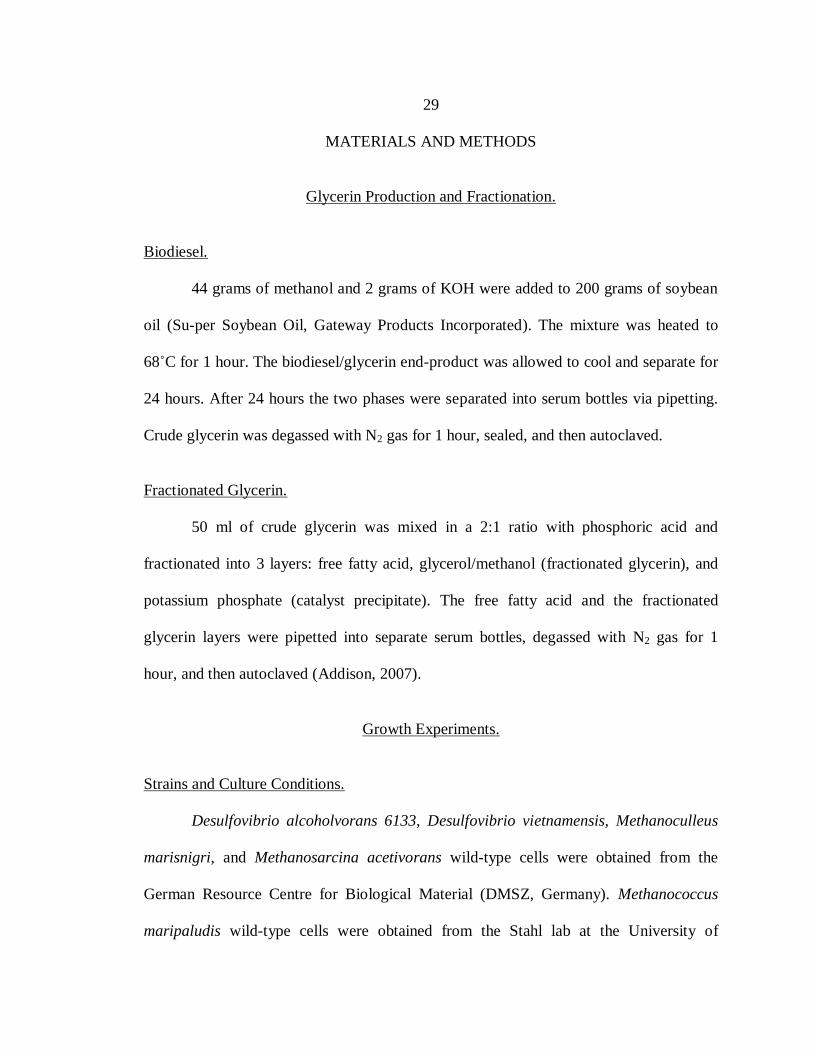
44 grams of methanol and 2 grams of KOH were added to 200 grams of soybean
oil (Su-per Soybean Oil, Gateway Products Incorporated). The mixture was heated to
68˚C for 1 hour. The biodiesel/glycerin end-product was allowed to cool and separate for
24 hours. After 24 hours the two phases were separated into serum bottles via pipetting.
Crude glycerin was degassed with N2 gas for 1 hour, sealed, and then autoclaved.
Fractionated Glycerin.
50 ml of crude glycerin was mixed in a 2:1 ratio with phosphoric acid and
fractionated into 3 layers: free fatty acid, glycerol/methanol (fractionated glycerin), and
potassium phosphate (catalyst precipitate). The free fatty acid and the fractionated
glycerin layers were pipetted into separate serum bottles, degassed with N2 gas for 1
hour, and then autoclaved (Addison, 2007).
Growth Experiments.
Strains and Culture Conditions.
Desulfovibrio alcoholvorans 6133, Desulfovibrio vietnamensis, Methanoculleus
marisnigri, and Methanosarcina acetivorans wild-type cells were obtained from the
German Resource Centre for Biological Material (DMSZ, Germany). Methanococcus
maripaludis wild-type cells were obtained from the Stahl lab at the University of

30
Washington. Batch mono-, co-, and tricultures of each strain were grown anaerobically in
serum bottles containing coculture medium (CCM). All cultures were grown under 20%
CO2 and 80% N2 headspace with the exception of M. marisnigri and M. maripaludis
monocultures, which were given 20% H2 and 80% CO2 headspace. Cultures were grown
in anaerobic tubes (10 ml liquid volume with 15 ml headspace; 5 ml liquid volume with
20 ml headspace) or serum bottles (50 ml liquid volume with 75 ml headspace). CCM is
a defined medium containing approximately 37mM NaCl, 27 mM MgCl2 x 6H2O, 0.95
mM CaCl2 x 2H2O, 1.1mM K2HPO4, 3.98μM Resazurine, 9.3 mM NH4Cl, 4.5 mM KCl,
1 mM L-cysteine x HCl, 59.5 mM NaHCO3, 1 mM trace minerals (Widdel et al. 1983), 1
mM Thauer’s vitamins (Clark et al., 2007), 1mM Selenite-tungstate solution (Widdel &
Banks, 1992), 1 mM Na2S x 9H2O, and 50 mM Na2SO4 (Desulfovibrio alcoholvorans
6133 and Desulfovibrio vietnamensis monocultures only) (pH 7.2). Unless otherwise
stated, CCM serum bottles were inoculated with a 10% (vol/vol) inoculum of mid-log
phase batch cultures. All cultures were grown in duplicate and incubated at 30° C.
SRB Monoculture Experiments.
Monocultures (10 ml final volume) of D. alcoholvorans 6133 and D. vietnamensis
were grown on 60 mM sodium lactate, 36 mM pure glycerol, 57 mM fractionated
glycerin (based on glycerol concentration), and 37 mM crude glycerin (based on glycerol
concentration). Growth was measured at various time points using a spectrophotometer
(Spectronic 20D+, Thermo Electron Corporation, Waltham, MA) at a wavelength of 600
nm. Uninoculated CCM was used as a blank.

31
Monocultures of D. alcoholvorans 6133 and D. vietnamensis were grown in 50 ml
of CCM with 37 mM crude glycerin (based on glycerol concentration). 1 ml samples
were collected aseptically via septum throughout growth. Growth was measured by UV-
Vis spectrometer (Shimadzu UV-1700 PharmaSpec, Kyoto, Japan) at a wavelength of
600 nm. Samples were centrifuged (Beckman Coulter Microfuge® 16 Microcentrifuge,
Brea, CA) at 14,500 RPM for 5 min at room temperature and the supernatant was stored
at -20°C until analysis. The acetate concentration of the supernatant was determined for
each sample collected.
Methanogen Toxicity Tests.
Cultures of M. marisnigri, M. maripaludis, and M. acetivorans were grown in
approximately 5 ml of CCM. M. marisnigri and M. maripaludis were grown on 20% H2
and 80% CO2. M. acetivorans was grown on 150 mM methanol (normal conditions).
Cultures were grown in the presence of increasing concentrations of crude glycerin: 0
mM, 13.7 mM, 22.8 mM, 37 mM (based on glycerol concentration) to measure toxicity.
Methane concentration was determined at the end of growth.
Co- and Triculture Experiments.
Co- and tricultures were grown in sodium sulfate free CCM. Mid-log phase
monocultures of D. alcoholvorans 6133, D. vietnamensis, M. marisnigri, and M.
maripaludis were combined into six different culture combinations: D. alcoholvorans
6133 and M. maripaludis; D. vietnamensis and M. maripaludis; D. alcoholvorans 6133
and M. marisnigri; D. vietnamensis and M. marisnigri; D. alcoholvorans 6133, M.

32
maripaludis, and M. marisnigri; D. vietnamensis, M. maripaludis, and M. marisnigri.
Each culture was grown in 10 and 50 ml of CCM. Cultures were given the same
concentrations of pure glycerol, fractionated glycerin, and crude glycerin as described
previously. Growth was measured and samples were collected as described previously.
Optical density was measured from both 10 and 50 ml cultures. Methane was determined
for the 10 ml cultures. Glycerol, sodium acetate, and free fatty acid concentrations were
determined for the 50 ml cultures.
Glycerol Optimization Experiments.
10 ml cocultures of D. alcoholvorans 6133 & M. maripaludis and D. vietnamensis
& M. maripaludis were grown on 14, 36, 50, and 71 mM pure glycerol and 16, 41, 57,
and 83 mM fractionated glycerin (based on glycerol concentration). Growth was
measured via optical density. Methane and glycerol concentrations were measured at the
end of growth.
Growth of M. acetivorans on Different Headspace Concentrations.
M. acetivorans was grown on 120 mM sodium acetate under the following
N2%:CO2% headspaces: 100:0, 67:33, 50:50, 33:67. For a control, M. acetivorans was
grown on 150 mM methanol under normal headspace (80:20) and under 100 % N2
headspace. Growth was measured via optical density and methane concentrations were
determined at late-stationary phase.
33
M. acetivorans Triculture Experiments.
M. acetivorans was combined at two different concentrations (initial ODs at
approximately 0.04-0.05 and 0.08-0.1) with the following four cocultures: D.
alcoholvorans 6133 & M. maripaludis; D. vietnamensis & M. maripaludis; D.
alcoholvorans 6133 & M. marisnigri; D. vietnamensis & M. marisnigri (initial OD of
approximately 0.08-0.1). Tricultures were grown on 37 mM crude glycerin and 33 mM
methanol (based on glycerol concentrations, methanol from crude glycerin). Growth was
measured via optical density and methane concentrations were determined at late-
stationary phase.
Supernatant Growth Experiments.
M. acetivorans was grown on 150 mM methanol and 37 mM crude glycerin
(based on glycerol concentration; 33 mM methanol present in this concentration of crude
glycerin). Growth was measured via optical density and methane concentration was
measured at late-stationary phase. Cultures were centrifuged (Hermle Z300K Labnet,
Edison, NJ) for 10 minutes at 4,500 RPM. Supernatant was filtered using a 25 mm 0.2
μm syringe filter and transferred into anaerobic tubes via septum. D. alcoholvorans 6133
& M. maripaludis, D. vietnamensis & M. maripaludis, D. alcoholvorans 6133 & M.
marisnigri, and D. vietnamensis & M. marisnigri were inoculated into filtered
supernatant. Growth was measured via optical density and methane concentration was
determined at late-stationary phase.

34
Data Analysis.
Glycerol Assay.
Glycerol concentrations were determined enzymatically using a Megazyme kit for
glycerol (Megazyme International Ireland Ltd.).
Free Fatty Acid Assay.
Free Fatty Acid Quantification Kit (BioVision Research Products, Mountain
View, CA) was used to determine the initial and final concentrations of free fatty acids
from the 50 ml co- and tricultures grown on fractionated and crude glycerin.
Ion Chromatography.
Acetate concentrations were determined by ion chromatography (Dionex) with a
4mm IonPac® AS10A hydroxide-selective anion-exchange column.
Gas Chromatography .
Methane concentrations were determined by gas chromatography (Hewlett
Packard Series II gas chromograph) using a CarboxenTM
1000 column length, N2 carrier
gas (33-34 psi), and a thermal conductivity detector (TCD). The GC injection, oven, and
detector temperatures were 200°C, 170°C, and 250°C, respectively.
Methanol concentrations of fractionated and crude glycerin were determine by gas
chromatography (Hewlett Packard 5890 Series II Gas Chromotography) using a Tenax®-
TA column (Alltech Associates, Inc., Deerfield, IL), at 190°C and 220°C using He as the

35
carrier gas (30, 40, 50 psi, respectively), and H2 and air was used for the flame ionization
detector (FID).

36
RESULTS
Monoculture Growth Experiments.
SRB Monocultures.
Both SRB monocultures, D. vietnamensis and D. alcoholvorans 6133, were
capable of growing on lactate, pure glycerol, fractionated glycerin, and crude glycerin
under sulfate-reducing conditions (Figure 8A-D, Table 1). D. vietnamensis grew faster
than D. alcoholvorans 6133 on all 4 carbon sources and both displayed the highest
growth rate on lactate (0.0530.004 and 0.0310.004 h-1
, respectively). D. vietnamensis
grew the slowest on crude glycerin (0.029 0.001 h-1
) while D. alcoholvorans 6133 grew
the slowest on pure glycerol and fractionated glycerin (0.0140.001h-1
and 0.0140.004h-
1, respectively). D. alcoholvorans 6133 displayed a 43 hour lag when grown on
fractionated glycerin D. vietnamensis grew faster on pure glycerol (0.0280.002 h-1
) than
fractionated glycerin (0.0230.001 h-1
). Although D. vietnamensis grew faster on all
carbon sources, D. alcoholvorans 6133 reached a higher optical density when growing on
lactate and crude glycerin. Since crude glycerin particulates can interfere with optical
density readings, acetate production was also measured to track growth (Figure 8C-D). D.
vietnamensis and D. alcoholvorans 6133 produced approximately 39.781.812 and
19.630.755 mM of acetate, when grown on 37 mM crude glycerin. The results
indicated that both Desulfovibrio species utilized glycerol at a slower rate than lactate, D.
vietnamensis grew faster, but D. alcoholvorans obtained higher biomass numbers.

37
Figure 8. SRB Monoculture Growth on Different Carbon Sources. (A) D. alcoholvorans
6133 and (B) D. vietnamensis. Cultures grown on 60 mM sodium lactate, 36 mM pure
glycerol, or 57 mM (0.07 ml) fractionated glycerin (based on glycerol concentration) in
the presence of 50 mM sodium sulfate. (C) D. alcoholvorans 6133 and (D) D.
vietnamensis cultures grown on 37 mM (0.08 ml) of crude glycerin (based on glycerol
concentration) in the presence of 50 mM sodium sulfate. Data points are averages of two
independent biological experiments (n=2).

38
Table 1. SRB Growth Rates on Different Carbon Sources.
Culture
Growth Rates (h-1
)
Lactate Pure Glycerol Fractionated
Glycerin
Crude
Glycerin
D. alcoholvorans
6133 0.0310.004 0.0140.001 0.0140.004 0.0150.001
D. vietnamensis 0.0530.004 0.0280.002 0.0230.001 0.0290.001
Methanogen Monoculture Toxicity Experiments.
Because known methanogens cannot utilize glycerol, all methanogenic cultures
required the presence of a non-methanogen glycerol-oxidizer (i.e., SRB). Therefore, the
production of methane in the presence of increasing amounts of crude glycerin was
determined because methanogen growth could be inhibited by glycerol and/or
contaminants present in crude glycerin (Figures 9-11). M. maripaludis, M. marisnigri,
and M. acetivorans could produce methane in the presence of increasing levels of crude
glycerin. M. maripaludis produced approximately 11.40.5 mM CH4 when grown in the
presence of 0, 14, 23, and 37 mM crude glycerin (based on glycerol concentration) with
CO2 and H2 as carbon and energy sources. M. marisnigri produced an average
concentration of 18.5 1.0 mM CH4 under the same conditions in the presence of 0, 14,
and 23 mM crude glycerin. However, the methane production rate of M. marisnigri
declined when the glycerin levels were above 23 mM and methane was not produced in
the presence of 37 mM crude glycerin. When grown on 150 mM methanol in the
presence of the same concentrations of crude glycerin, M. acetivorans produced

39
approximately 9922 mM CH4. These results indicated that methane production was not
inhibited by the presence of potential contaminants in glycerin for the tested methanogens
when grown as monocultures with respective preferred substrates.
Figure 9. M. maripaludis Toxicity Test. (A) M. maripaludis grown on 20% H2: 80% CO2
(no glycerin present). (B) M. marisnigri grown on 20% H2: 80% CO2 in the presence of
different concentrations of crude glycerin (based on glycerol concentration). Methane
concentrations were determined when the M. maripaludis culture in the absence of crude
glycerin reached stationary phase. Data points and experimental values are averages of
two independent biological experiments (n=2).
40
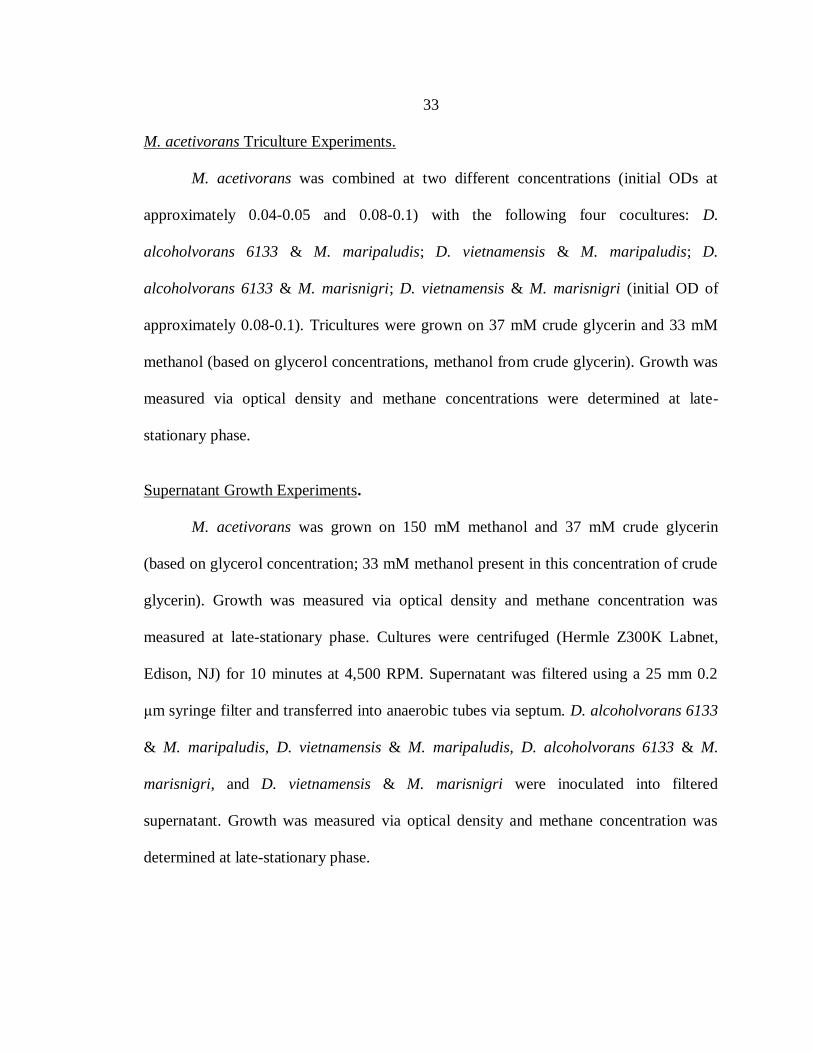
Figure 10. M. marisnigri Toxicity Test. (A) Growth of M. marisnigri on 20% H2: 80%
CO2 (no glycerin present). (B) M. marisnigri grown on 20% H2: 80% CO2 in the presence
of different concentrations of crude glycerin (based on glycerol concentrations). X
methane concentration at stationary phase, Y methane concentration 2 weeks after
stationary-phase. Data points and experimental values are averages of two independent
biological experiments (n=2).
41
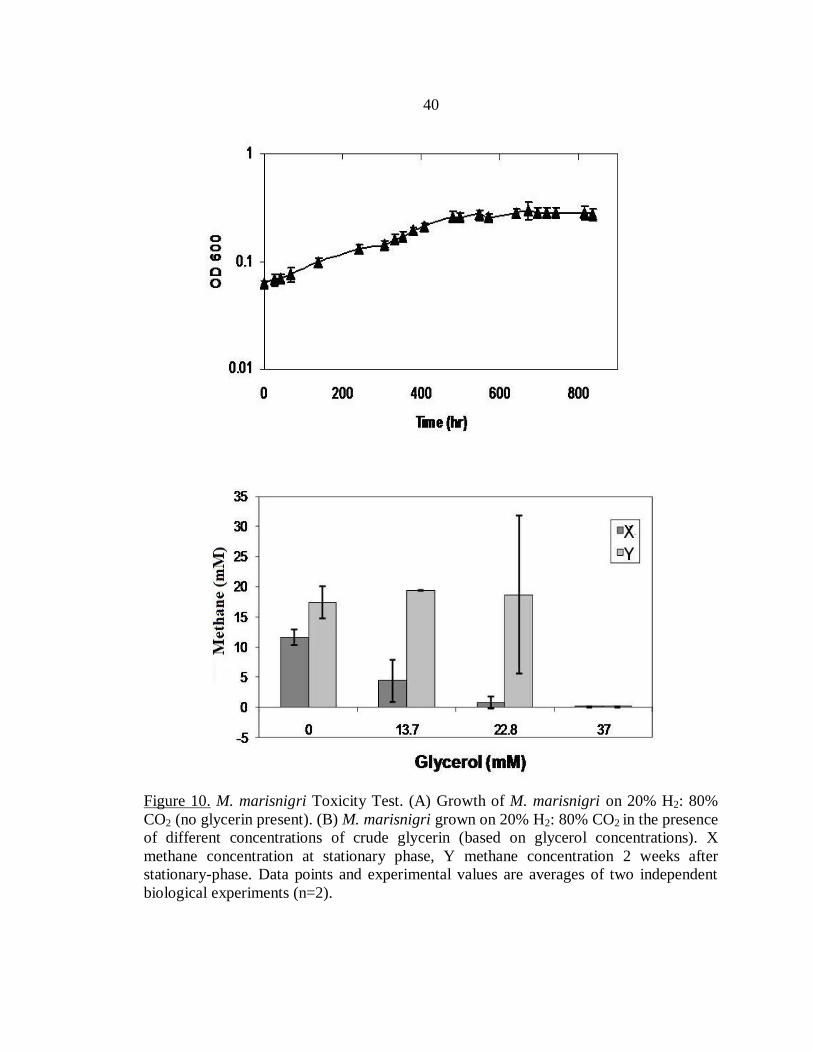
Figure 11. M. acetivorans Toxicity Test. (A) Growth of M. acetivorans on 150 mM
methanol under 20% CO2: 80% N2 headspace (no glycerin present). (B) M. acetivorans
grown on 150 mM methanol in the presence of different concentrations of crude glycerin
(based on glycerol concentrations). Data points and experimental values are averages of
two independent biological experiments (n=2).

42
Pure Glycerol and Fractionated Glycerin Optimization for Cocultures.
Pure Glycerol.
Cocultures of D. vietnamensis and M. maripaludis or D. alcoholvorans 6133 and
M. maripaludis were capable of growing with 14, 37, 50 and 71 mM of pure glycerol and
16, 41, 57, and 82 mM of fractionated glycerin (based on glycerol concentration) (Figures
12 & 13). When the concentration of pure glycerol was varied, the growth rates or final
biomass yields were not affected for either coculture. The D. vietnamensis and M.
maripaludis cocultures consumed approximately 30 mM of pure glycerol and produced
approximately 20 mM of methane (Figure 13, Table 2). For the D. alcoholvorans 6133
and M. maripaludis cocultures, glycerol remained for the three highest glycerol levels at
the end of growth (Figure 12, Table 2). D. alcoholvorans 6133 and M. maripaludis
utilized a maximum of 41 mM glycerol and produced about 16.5 mM CH4. For both
cocultures, glycerol utilization increased as glycerol concentration increased, but methane
production was not directly related to the amount utilized. Although D. vietnamensis and
M. maripaludis consumed higher concentrations of glycerol when grown on 50 and 71
mM, D. alcoholvorans 6133 and M. maripaludis produced more methane (Table 2)
(17.06.0 and 16.51.3 mM CH4, respectively versus 12.04.5 and 12.94.3 mM CH4,
respectively).
Fractionated Glycerin.
In contrast to pure glycerol, varying the concentration of fractionated glycerin
affected growth rates. When grown on 82 mM fractionated glycerin D. alcoholvorans

43
6133 and M. maripaludis experienced a lag phase of approximately 100 hours and slower
growth compared to growth on the other three lower concentrations of fractionated
glycerin (Figure 12). Although growth rate did not decline, D. vietnamensis and M.
maripaludis displayed a lag phase of approximately 70 to 100 hours on all concentrations
of fractionated glycerin with the exception of the 16 mM culture (Figure 13). Cocultures
of D. vietnamensis and M. maripaludis utilized approximately 30 mM fractionated
glycerin; however, the coculture grew faster with 16 mM fractionized glycerin versus the
higher concentrations of crude glycerin. Similar amounts of methane were produced
(approximately 8.5 mM) by D. vietnamensis and M. maripaludis when grown on 16 and
41 mM fractionated glycerin. Although the growth of D. alcoholvorans 6133 and M.
maripaludis was slower on fractionated glycerin, the coculture of D. alcoholvorans and
M. maripaludis was not as sensitive compared to coculture with D. vietnamensis. D.
alcoholvorans and M. maripaludis utilized approximately 30 mM fractionated glycerin
producing approximately 17 mM methane (Table 3).

44
Figure 12. Pure Glycerol and Fractionated Glycerin Optimization for D. alcoholvorans
6133 and M. maripaludis. (A) Growth on different concentrations of pure glycerol. (B)
Growth on different concentrations of fractionated glycerin. Data points and experimental
values are averages of two independent biological experiments (n=2).

45
Figure 13. Pure Glycerol and Fractionated Glycerin Optimization for D. vietnamensis &
M. maripaludis. (A) Growth on different concentrations of pure glycerol. (B) Growth on
different concentrations of fractionated glycerin. Data points and experimental values are
averages of two independent biological experiments (n=2).

46
Table 2. Methane Production from Cocultures Grown on Different Concentrations of
Pure Glycerol.
Pure Glycerol D. alcoholvorans 6133 & M.
maripaludis
D. vietnamensis & M.
maripaludis
Initial
Glycerol (mM)
Final Glycerol
(mM)
Methane (mM) Final Glycerol
(mM)
Methane (mM)
14 00 11.82.38 00 10.60.78
36 1910.1 11.21.53 00 19.81.24
50 186.3 176.04 110.08 124.53
71 305.0 16.51.28 145.27 12.94.30
Table 3. Methane Production from Cocultures Grown on Different Concentrations of
Fractionated Glycerin.
Fractionated
Glycerin
D. alcoholvorans 6133 & M.
maripaludis
D. vietnamensis & M.
maripaludis
Initial
Glycerol (mM)
Final Glycerol
(mM)
Methane (mM) Final Glycerol
(mM)
Methane (mM)
16 00 13.41.90 00 8 9.98
41 43.96 13.59.03 0 0 85.4
57 1310.2 17.14.00 131.44 6 4.60
82 230.049 16.910.5 264.40 42.58
Coculture and Triculture Growth Experiments.
Coculture Growth on Pure Glycerol.
Growth rates and methane production varied for each coculture on pure glycerol,
fractionated glycerin, and crude glycerin (Figures 16-21A-C). Cultures on pure glycerol
displayed a small range of growth rates (0.003 h-1
). D. vietnamensis and M. maripaludis
displayed the fastest growth rate with glycerol (0.01±0 h-1
) but one of the lower methane
yields (0.4 mM CH4/mM glycerol) (Figure 17A, Table 4). The highest methane yield (0.6
mM CH4/mM glycerol) was produced by D. vietnamensis and M. marisnigri which also

47
experienced the slowest growth rate (0.007 0.001 h-1
) and was the only culture that
utilized almost 40 mM glycerol under the tested batch conditions (Figure 19, Table 4).
D. alcoholvorans and M. marisnigri had the lowest methane yield (0.3 mM CH4/mM
glycerol) and the second fastest growth rate (0.009 0.0003 h-1
) (Figure 18A, Table 4)
while D. alcoholvorans and M. maripaludis had the second highest methane yield (0.5
mM CH4/mM glycerol) and a slower growth rate (0.0080 h-1
) (Figure 16A, Table 4). D.
alcoholvorans and M. maripaludis utilized the least amount of glycerol at the end of
growth.
Coculture Growth on Fractionated Glycerin.
Fractionated glycerin resulted in slower growth of each coculture compared to
growth on pure glycerol (Figures 16-21B). D. alcoholvorans 6133 and M. marisnigri
displayed the slowest growth (0.0040.001 h-1
) but produced the highest methane yield
(0.5 mM/mM glycerol) which increased from growth on pure glycerol (Figure 18B, Table
4). D. vietnamensis and M. maripaludis was the only other culture that increased in
methane production when grown on fractionated glycerin which also had the highest
growth rate (0.0070.004 h-1
) (Figure 17B, Table 4). Similar to results with glycerol,
final acetate concentrations were in close agreement to the initial glycerol concentrations
that each culture was provided.

48
Coculture Growth on Crude Glycerin.
With the exception of D. alcoholvorans 6133 and M. marisnigri, every growth
rate was lower on crude glycerin compared to growth on pure glycerol and fractionated
glycerin (Figures 16-21C, Table 4). The growth rate for D. alcoholvorans 6133 and M.
marisnigri was the same as on fractionated glycerin; however, a lag of approximately 500
hours was experienced prior to exponential-phase growth (Figure 18C). D. vietnamensis
and M. marisnigri also displayed a long lag-phase that lasted approximately 1,000 hours
(Figure 19C), and the lag-phase was dependent upon the ratio of the inoculum size to
initial glycerin level (data not shown). Both D. alcoholvorans 6133 and M. maripaludis
and D. alcoholvorans 6133 and M. marisnigri methane yields increased, compared to
growth on pure glycerol and fractionated glycerin, and were the highest on crude glycerin
(0.6 CH4 mM/mM glycerol).
Triculture Growth on Pure Glycerol.
Both tricultures grew at similar rates (0.0080.0004 h-1
) with similar methane
yields (Figures 20 & 21A, Table 4). The triculture, D. vietnamensis and M. maripaludis
and M. marisnigri did not have any glycerol that remained after growth while the other
had approximately 5-5.5 mM of unconsumed glycerol.
Triculture Growth on Fractionated Glycerin.
Both tricultures grew slower on fractionated glycerin compared to pure glycerol
Figures 20 & 21B, Table 4). D. vietnamensis and M. maripaludis, and M. marisnigri was
the only culture to utilize all 57 mM fractionated glycerin. This triculture also displayed

49
the longest lag phase of 1,000 hours. The triculture, D. alcoholvorans 6133 and M.
maripaludis and M. marisnigri, was one of the fastest growing cultures on fractionated
glycerin (0.0060.001 h-1
). This triculture also produced the highest amount of methane
(12.40.08 mM) on fractionated glycerin compared to pure glycerol and crude glycerin.
Both tricultures produced similar amounts of methane concentration on fractionated
glycerin.
Triculture Growth on Crude Glycerin.
Both tricultures grew slower on crude glycerin compared to fractionated glycerin
Figures 20 & 21C, Table 4). D. vietnamensis and M. maripaludis, and M. marisnigri
produced less methane on crude glycerin (6.53.0 mM) than on pure glycerol and crude
glycerin. D. alcoholvorans 6133 and M. maripaludis and M. marisnigri produced
comparable concentrations of methane on crude glycerin as on pure glycerol (10.70.3
mM). Both tricultures had final acetate concentrations that were higher than initial crude
glycerin concentrations.

50
Figure 14. Growth Comparison on Fractionated Glycerin. AM: D. alcoholvorans 6133
and M. maripaludis, VM: D. vietnamensis and M. maripaludis, AMAR: D. alcoholvorans
6133 and M. marisnigri, VMAR: D. vietnamensis and M. marisnigri, AMM: D.
alcoholvorans 6133 and M. maripaludis and M. marisnigri, VMM: D. vietnamensis and
M. maripaludis and M. marisnigri. Data points are averages of two independent
biological experiments (n=2).

51
Figure 15. Growth Comparison on Crude Glycerin. AM: D. alcoholvorans 6133 and M.
maripaludis, VM: D. vietnamensis and M. maripaludis, AMAR: D. alcoholvorans 6133
and M. marisnigri, VMAR: D. vietnamensis and M. marisnigri, AMM: D. alcoholvorans
6133 and M. maripaludis and M. marisnigri, VMM: D. vietnamensis and M. maripaludis
and M. marisnigri. Data points and are averages of two independent biological
experiments (n=2).

52
Figure 16. Growth of D. alcoholvorans 6133 and M. maripaludis on Pure Glycerol,
Fractionated Glycerin, and Crude Glycerin. (A) Growth on 36 mM pure glycerol. (B)
Growth on 57 mM fractionated glycerin (based on glycerol concentration). (C) Growth
on 37 mM crude glycerin (based on glycerol concentration). Data points are averages of
two independent biological experiments (n=2).

53
Figure 17. Growth of D. vietnamensis and M. maripaludis on Pure Glycerol, Fractionated
Glycerin, and Crude Glycerin. (A) Growth on 36 mM pure glycerol. (B) Growth on 57
mM fractionated glycerin (based on glycerol concentration). (C) Growth on 37 mM crude
glycerin (based on glycerol concentration). Data points are averages of two independent
biological experiments (n=2).

54
Figure 18. Growth of D. alcoholvorans 6133 and M. marisnigri on Pure Glycerol,
Fractionated Glycerin, and Crude Glycerin. (A) Growth on 36 mM pure glycerol. (B)
Growth on 57 mM fractionated glycerin (based on glycerol concentration). (C) Growth
on 37 mM crude glycerin (based on glycerol concentration). Data points are averages of
two independent biological experiments (n=2).

55
Figure 19. Growth on D. vietnamensis and M. marisnigri on Pure Glycerol, Fractionated
Glycerin, and Crude Glycerin. (A) Growth on 36 mM pure glycerol. (B) Growth on 57
mM fractionated glycerin (based on glycerol concentration). (C) Growth on 37 mM crude
glycerin (based on glycerol concentration). Data points are averages of two independent
biological experiments (n=2).

56
Figure 20. Growth on D. alcoholvorans 6133 and M. maripaludis and M. marisnigri on
Pure Glycerol, Fractionated Glycerin, and Crude Glycerin. (A) Growth on 36 mM pure
glycerol. (B) Growth on 57 mM fractionated glycerin (based on glycerol concentration).
(C) Growth on 37 mM crude glycerin (based on glycerol concentration). Data points are
averages of two independent biological experiments (n=2).

57
Figure 21. Growth of D. vietnamensis and M. maripaludis and M. marisnigri on Pure
Glycerol, Fractionated Glycerin, and Crude Glycerin. (A) Growth on 36 mM pure
glycerol. (B) Growth on 57 mM fractionated glycerin (based on glycerol concentration).
(C) Growth on 37 mM crude glycerin (based on glycerol concentration). Data points are
averages of two independent biological experiments (n=2).

58
Table 4. Methane Production from Growth on Pure Glycerol, Fractionated Glycerin, and
Crude Glycerin.
Methane (mM)
Co/Triculture Pure Glycerol Fractionated
Glycerin
Crude Glycerin
D. alcoholvorans
6133 & M.
maripaludis
11.55.4 11.70.431 12.93.81
D. vietnamensis &
M. maripaludis 11.95.41 15.20.359 9.64.57
D. alcoholvorans
6133 & M.
marisnigri
9.66.60 15.56.26 8.91.19
D. vietnamensis &
M. marisnigri 15.30 11.30.063 7.23.35
D. alcoholvorans
6133 & M.
maripaludis & M.
marisnigri
10.34.68 12.40.078 10.70.34
D. vietnamensis &
M. maripaludis &
M. marisnigri
12.50.99 13.62.12 6.52.99
Free Fatty Acids.
Free fatty acid concentrations were also measured at the beginning and end of
growth on fractionized and crude glycerin (Figure 22). For each culture, the free fatty
acid concentration was only slightly increased (by approximately 0.02-0.03 mM) at the
end of growth compared to initial levels.

59
Figure 22. Free Fatty Acids. (A) D. alcoholvorans 6133 and M. maripaludis. (B) D.
vietnamensis and M. maripaludis. (C) D. alcoholvorans 6133 and M. marisnigri. (D) D.
vietnamensis and M. marisnigri. (E) D. alcoholvorans 6133 and M. maripaludis and M.
marisnigri. (F) D. vietnamensis and M. maripaludis and M. marisnigri. Free fatty acid
concentrations were measured at the beginning and end of growth. Experimental values
are averages of two independent biological experiments (n=2).
Methanosarcina acetivorans Growth Experiments.
M. acetivorans Growth on Methanol and Crude Glycerin with Various Headspace
Concentrations.
M. acetivorans produced 7913.01 mM CH4 and reached an optical density of
0.98 when grown under 20% CO2: 80% N2 headspace on 150 mM methanol (Figure

60
23A). When grown on crude glycerin (37 mM) under 20% CO2: 80% N2 headspace, M.
acetivorans utilized the methanol fraction (33 mM) as the carbon and energy source and
produced 18.24.42 mM CH4 reaching an optical density of approximately 0.2 (Figure
23B). M. acetivorans did not grow with sodium acetate compared to methanol in the
coculture media without considerable lag-phases (>450 h). Cultures of M. acetivorans
were grown on different CO2 and N2 headspaces in order to test if higher CO2
concentrations in the headspace affected growth with acetate, and results indicated that
methanol was the preferred substrate in the tested growth medium regardless of CO2
levels (Figure 24A&B). When the M. acetivorans cultures grown on sodium acetate were
transferred to the same media and given sodium acetate, the lag-phase decreased to 18.5
hours and 862.7 mM CH4 was produced.

61
Figure 23. M. acetivorans Growth on Methanol and Crude Glycerin. (A) Growth on 150
mM methanol. (B) Cultures grown on 33 mM methanol fraction of 37 mM crude
glycerin. Both cultures grown under 20% CO2 and 80% N2 headspace. Data points are
averages of two independent biological experiments (n=2).

62
Figure 24. Growth of M. acetivorans Under Different Headspace Concentrations and
Methane Production. (A) ♦ (control) grown on 150 mM methanol under 100% N2
headspace. (B) x Growth on 120 mM sodium acetate under 100% N2 headspace. (C) □
Growth on 120 mM sodium acetate under 67% N2 and 33% CO2. (D) Δ Growth on 120
mM sodium acetate under 50% N2 and CO2 headspace. (E) ○ Growth on 120 mM sodium
acetate under 33% N2 and 67% CO2. Data points are from one independent biological
experiment (n=1).
SRB and Hydrogenotrophic Methanogen Cocultures with M. acetivorans.
Cultures with M. acetivorans were established in two ways: either cocultures
were combined with half the concentration of M. acetivorans (Triculture A) or equal
concentrations of coculture and M. acetivorans were combined (Triculture B) (Figure

63
25A-D, Table 5). For example, Triculture A was established for D. vietnamensis, M.
maripaludis, and M. acetivorans by inoculating a serum bottle with a late-exponential
phase coculture of D. vietnamensis and M. maripaludis to an optical density of
approximately 0.07-1.0. Then, a culture of M. acetivorans grown to late-exponential
phase was inoculated into the same serum bottle with an initial optical density of 0.04-
0.05. Triculture B was established the same way, but M. acetivorans was inoculated with
the same starting optical density as the coculture (0.07-1.0).
For the most part, methane concentrations were much higher with the addition of
M. acetivorans. M. acetivorans displayed the capability of utilizing the acetate by-
product of SRB glycerol oxidation (data not shown). For B Tricultures, methane
concentrations increased considerably when M. acetivorans was added to the cocultures:
D. vietnamensis and M. maripaludis (from 9.5 to 75.2 mM CH4), D. alcoholvorans 6133
and M. maripaludis (from 12.9 to 58.3 mM CH4), and D. alcoholvorans 6133 and M.
marisnigri (from 8.9 to 69.9 mM CH4) (Figure 25A-C, Table 5). The only culture that
decreased in methane production with the addition of M. acetivorans was the D.
vietnamensis and M. marisnigri which lowered to 3.4 from 7.2 mM CH4 (Figure 25D,
Table 5).
Methane increased in all A Tricultures compared to coculture growth on crude
glycerin without M. acetivorans. Aside from D. vietnamensis and M. marisnigri, all
Triculture A methane values were lower than Triculture B values. The methane values
from A Tricultures were: 30.5 mM CH4 from D. vietnamensis and M. maripaludis, 47.1
mM CH4 from D. alcoholvorans 6133 and M. maripaludis, 50.32 mM CH4 from D.

64
alcoholvorans 6133 and M. marisnigri, and 21.1 mM CH4 from D. vietnamensis and M.
marisnigri.
D. vietnamensis and M. maripaludis Triculture A and B grew at similar rates but
Triculture B reached the highest optical density. Both Triculture A and B grew faster and
to a higher optical density than D. vietnamensis and M. maripaludis grown as cocultures.
The triculture B with D. alcoholvorans 6133 and M. maripaludis grew the fastest.
Triculture A and coculture growth grew at the same rate and eventually reached the same
optical density as Triculture B. D. alcoholvorans 6133 and M. marisnigri was the only
culture to grow fastesr as Triculture A, however Triculture B reached the highest optical
density. Both Triculture A and B grew faster and to a higher optical density than D.
alcoholvorans 6133 and M. marisnigri grown as a coculture. Triculture B with D.
vietnamensis and M. marisnigri reached the highest optical density with the shortest lag
period (217 hours). Both Triculture A and coculture growth had long lag times (550 and
865 hours, respectively). Triculture A grew faster than D. vietnamensis and M. marisnigri
as a coculture but the coculture grew to a higher optical density (Figure 25A-D, Table 5).

65
Figure 25. Tricultures: SRB and Hydrogenotrophic Methanogen Cocultures Combined
with M. acetivorans. (A) D. alcoholvorans 6133 and M. maripaludis (B) D.
alcoholvorans 6133 and M. marisnigri (C) D. vietnamensis and M. maripaludis (D) D.
vietnamensis and M. marisnigri. Cultures were grown on 37 mM crude glycerin (33 mM
methanol). Starting optical densities for Triculture A were approximately 0.04-0.05 and
0.07-0.1 for M. acetivorans and cocultures, respectively. For Triculture B, starting optical
densities were approximately 0.08-0.1 for both M. acetivorans and cocultures. Controls
are cocultures grown in the same conditions without M. acetivorans. Data points are from
one independent biological experiment (n=1).

66
Table 5. Methane Production of M. acetivorans with Cocultures. Methane measured
when cultures reached late-stationary phase.
M. acetivorans with Cocultures Only
(mM CH4)
Triculture A
(mM CH4)
Triculture B
(mM CH4)
D. alcoholvorans
6133 & M.
maripaludis
12.5 47.1 58.3
D. vietnamensis &
M. maripaludis
9.5 30.5 75.2
D. alcoholvorans
6133 & M.
marisnigri
8.9 50.3 69.9
D. vietnamensis &
M. marisnigri
7.2 21.1 3.4
Cocultures Grown on M. acetivorans Supernatant.
D. alcoholvorans 6133 and M. marisnigri and D. vietnamensis and M. marisnigri
grew much faster and produced more methane (16.7 and 11.3 mM CH4, respectively) on
the supernatant of M. acetivorans growing on the methanol fraction (33 mM) of crude
glycerin (37 mM) (Figure 23A) than when directly grown as cocultures on crude glycerin
(Figures 18&19D). D. alcoholvorans 6133 and M. marisnigri did not experience a lag
period, reached a higher optical density, and the D. vietnamensis and M. marisnigri lag-
phase was approximately seven times shorter (124 hours) when grown on M. acetivorans
supernatant. Both cocultures with M. maripaludis produced a lower concentration of
methane (7.2 and 6.3 mM CH4 from D. vietnamensis or D. alcoholvorans 6133,
respectively). Both, D. vietnamensis and M. maripaludis and D. alcoholvorans 6133 and
M. maripaludis, grew to a much lower optical density when grown on the supernatant of
M. acetivorans (Figure 26A-D, Table 6) (0.177 and 0.291, respectively).

67
Figure 26. Cocultures Growth on M. acetivorans Supernatant. (A) D. alcoholvorans 6133
and M. maripaludis (B) D. alcoholvorans 6133 and M. marisnigri (C). D. vietnamensis
and M. maripaludis (D) D. vietnamensis and M. marisnigri. M. acetivorans was grown on
33 mM methanol from 37 mM crude glycerin (Figure 23B). After methane was
measured, cells were spun down and filtered out. Cocultures were inoculated into the
supernatant and utilized the crude glycerin as a carbon and energy source. Controls are
cocultures grown on 37 mM crude glycerin. Data points are averages of two independent
biological experiments (n=2).
Table 6. Methane Concentrations from Supernatant Growth.
Cocultures Control
(mM CH4)
Growth on Supernatant
(mM CH4)
D. alcoholvorans 6133 &
M. maripaludis 12.93.81 6.32.90
D. vietnamensis & M.
maripaludis 9.54.57 7.20.025
D. alcoholvorans 6133 &
M. marisnigri 8.91.19 16.71.86
D. vietnamensis & M.
marisnigri 7.23.35 11.30.007

68
DISCUSSION AND CONCLUSIONS
Entire Consortia Physiology
Figure 27. Complete Pathway of Co/Tricultures on Pure Glycerol, Fractionated Glycerin,
and Crude Glycerin.

69
Co/tricultures on Pure Glycerol, Fractionated Glycerin, and Crude Glycerin.
To gain deeper insight on the physiology of co/tricultures on pure glycerol,
fractionated glycerin, and crude glycerin, growth rates, methane yields, and percent
electron equivalents were calculated (Tables 7-9). Methane yields (YCH4) were
determined by calculating the ratio of methane produced (mM CH4) to the glycerol
consumed (mM glycerol) after incomplete oxidation to acetate by the chosen SRBs (final
mM CH4)/(Δ mM glycerol). Percent electron equivalent determines the percentage of
electrons that were transferred from glycerol to form methane. Glycerol has 14 electrons
while methane has 8. When glycerol is partially oxidized to acetate, 8 electrons remain on
the acetate molecule. This leaves 6 electrons that each have the potential of going into
producing methane. Electron equivalent can then be calculated by taking the ratio of the
total number of electrons in methane produced to the total number of electrons oxidized
from glycerol that did not end up in acetate; (total mM CH4 x 8 electrons)/( Δ mM
glycerol x 6 electrons). Methane yield and percent electron equivalent are directly
proportional.

70
Pure Glycerol.
Table 7. Co/tricultures on Pure Glycerol.
Co/Tricultures Growth Rate
(h-1
)
YCH4
(mM/mM)
Percent Electron
Equivalent
D. alcoholvorans
6133 & M.
maripaludis
0.008±0 0.507±0.070 67.6%
D. vietnamensis &
M. maripaludis
0.010±0 0.377±0.037 50.3%
D. alcoholvorans
6133 & M.
marisnigri
0.009±0.0003 0.309±0.005 41.2%
D. vietnamensis &
M. marisnigri
0.007±0.0007 0.565 75.4%
D. alcoholvorans
6133 & M.
maripaludis & M.
marisnigri
0.008±0.0004 0.379±0.852 50.5%
D. vietnamensis &
M. maripaludis &
M. marisnigri
0.008±0.0004 0.427±0.091 56.9%
In order to understand trends between growth rates and methane yields (percent
electron equivalents can be assumed to follow the same trend as methane yields since
they are directly proportional), co/tricultures were ranked 1 to 6, with 1 being the lowest
growth rate or methane yield and 6 being the highest of both. Co/tricultures were plotted
based on their 2 rankings (Figure 28). In general, as growth rate increased on pure
glycerol, methane yield decreased. The fastest growing cultures were D. alcoholvorans
6133 and M. marisnigri and D. vietnamensis and M. maripaludis which were also the
lowest methane producing cultures (Figures 17&18, Table 4). On the other hand, D.
vietnamensis and M. marisnigri and D. alcoholvorans 6133 and M. maripaludis grew the

71
slowest and produced the highest amount of methane (Figures 28, 16 & 19, Tables 4 &
7). Relative to the other cultures, both tricultures had moderate growth rates and methane
yields. This is interesting because it suggests that the presence of both methanogens
creates some type of middle ground for growth rate and methane yield. A trend was not
observed between microorganism combinations, growth rates, or methane yields,
although it appeared that with glycerol D. vietnamensis did better with M. marisnigri
while D. alcoholvorans did better with M. maripaludis.
Figure 28. Growth Correlation on Pure Glycerol. Higher numbers represent faster growth
and higher methane yields and higher percent electron equivalents. AM: D.
alcoholvorans 6133 and M. maripaludis, VM: D. vietnamensis and M. maripaludis,
AMAR: D. alcoholvorans 6133 and M. marisnigri, VMAR: D. vietnamensis and M.
marisnigri, AMM: D. alcoholvorans 6133 and M. maripaludis and M. marisnigri, VMM:
D. vietnamensis and M. maripaludis and M. marisnigri.

72
Fractionated Glycerin.
Table 8. Co/tricultures on Fractionated Glycerin.
Co/Tricultures Growth Rate
(h-1
)
YCH4
(mM/mM)
Percent Electron
Equivalent
D. alcoholvorans
6133 & M.
maripaludis
0.005±0.0003 0.328±0.0323 43.7%
D. vietnamensis &
M. maripaludis
0.007±0.0039 0.474±0.0724 63.2%
D. alcoholvorans
6133 & M.
marisnigri
0.004±0.0008 0.486±0.3090 64.8%
D. vietnamensis &
M. marisnigri
0.006 ± 0.0025 0.360±0.0073 48.0%
D. alcoholvorans
6133 & M.
maripaludis & M.
marisnigri
0.006±0.0010 0.280±0.1253 37.4%
D. vietnamensis &
M. maripaludis &
M. marisnigri
0.005±0.0011 0.385±0.0003 51.4%
With the exception of D. vietnamensis and M. maripaludis, cultures followed a
similar trend where faster growth resulted in lower methane yields with fractionated
glycerin (Figure 29, Table 8). As cocultures, both SRB grew faster when paired with M.
maripaludis than with M. marisnigri, and this also corresponded to slower glycerol
consumption rates with M. marisnigri. D. vietnamensis and M. maripaludis produced the
second highest methane yield with the highest growth rate. These results suggested that
M. marisnigri might be more susceptible to contaminants in the fractionated glycerin.
Interestingly, tricultures with D. alcoholvorans 6133 produced less methane than
cocultures with D. alcoholvorans 6133. The methanogens produced more methane when
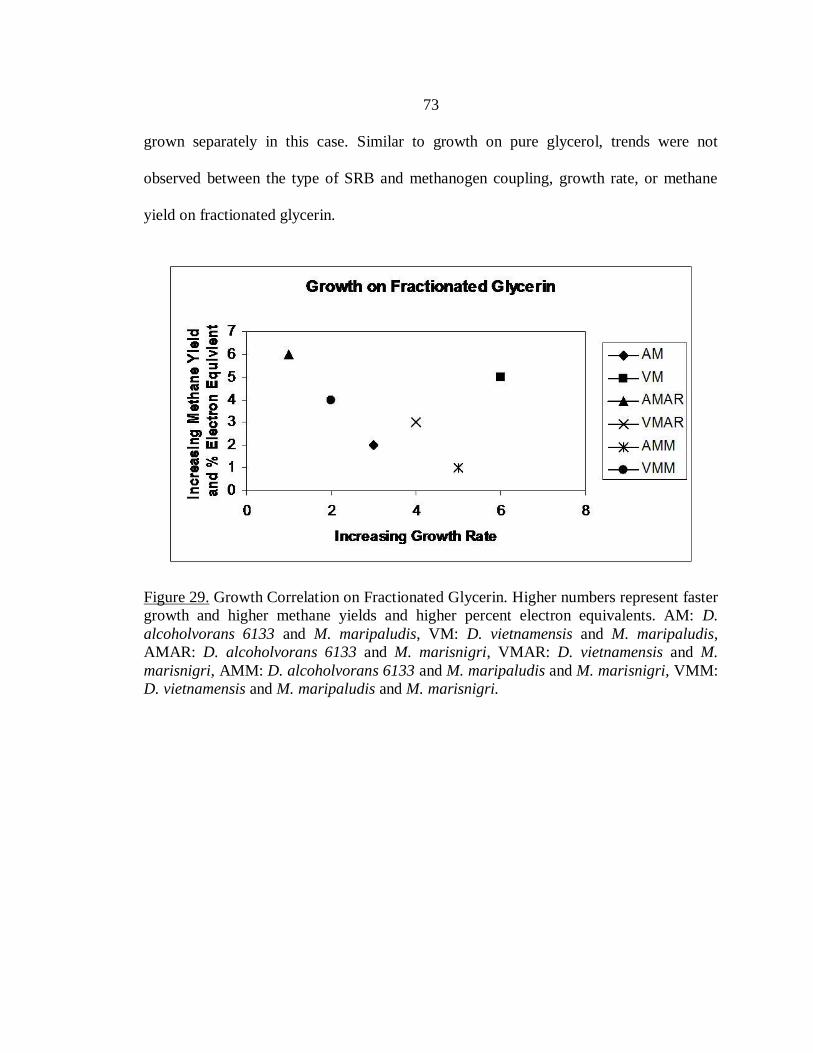
73
grown separately in this case. Similar to growth on pure glycerol, trends were not
observed between the type of SRB and methanogen coupling, growth rate, or methane
yield on fractionated glycerin.
Figure 29. Growth Correlation on Fractionated Glycerin. Higher numbers represent faster
growth and higher methane yields and higher percent electron equivalents. AM: D.
alcoholvorans 6133 and M. maripaludis, VM: D. vietnamensis and M. maripaludis,
AMAR: D. alcoholvorans 6133 and M. marisnigri, VMAR: D. vietnamensis and M.
marisnigri, AMM: D. alcoholvorans 6133 and M. maripaludis and M. marisnigri, VMM:
D. vietnamensis and M. maripaludis and M. marisnigri.

74
Crude Glycerin.
Table 9. Co/tricultures on Crude Glycerin.
Co/Tricultures Growth Rate
(h-1
)
YCH4
(mM/mM)
Percent Electron
Equivalent
D. alcoholvorans
6133 & M.
maripaludis
0.003±0.0001 0.559±0.1877 74.5%
D. vietnamensis &
M. maripaludis
0.003±0.0002 0.401±0.0599 53.3%
D. alcoholvorans
6133 & M.
marisnigri
0.004±0.0008 0.552±0.8444 73.6%
D. vietnamensis &
M. marisnigri
0.003±0.0005 0.343±0.1029 45.7%
D. alcoholvorans
6133 & M.
maripaludis & M.
marisnigri
0.002± 0.0006 0.280±0.0274 37.4%
D. vietnamensis &
M. maripaludis &
M. marisnigri
0.004±0.0027 0.273±0.0558 36.4%
With the exception of D. vietnamensis and M. maripaludis and M. marisnigri,
cultures appear to follow the opposite trend when grown on crude glycerin; methane
yield increases with growth rate (Figure 30, Table 9). Both tricultures had the lowest
methane yields, perhaps competition exists between the two hydrogenotrophic
methanogens under these conditions. Again with crude glycerin, trends were not seen
between type of SRB and methanogen coupling, growth rate, and methane yield.

75
Figure 30. Growth Correlation on Crude Glycerin. Higher numbers represent faster
growth and higher methane yields and higher percent electron equivalents. AM: D.
alcoholvorans 6133 and M. maripaludis, VM: D. vietnamensis and M. maripaludis,
AMAR: D. alcoholvorans 6133 and M. marisnigri, VMAR: D. vietnamensis and M.
marisnigri, AMM: D. alcoholvorans 6133 and M. maripaludis and M. marisnigri, VMM:
D. vietnamensis and M. maripaludis and M. marisnigri.
Correlations Between Pure Glycerol, Fractionated Glycerin, and Crude Glycerin.
Figure 31 is a graph plotting every culture’s growth rate and methane yield. The
only trend that existed was between growth rate and carbon source. Cultures grown on
crude glycerin displayed the lowest growth rates, while the growth rates for glycerol-
grown cultures had the highest growth rates. There is not an overall trend between growth
rate and methane yield. The trend only seems to exist within each individual carbon
source. Methane yield was lowest when the growth rate was greater than 0.004 h-1
and
slower than 0.007 h-1
. Again, there was no trend between culture combination, growth
rate, and methane yield. Different culture combinations had improved methane
conversions and increased growth rates dependent upon which carbon and energy source

76
was used. Overall, glycerol-grown cultures had the highest combination for both growth
rate and methane yield. Cultures grown with crude glycerin, namely D. alcoholvorans
with M. maripaludis or M. marisnigri had comparable methane yields to glycerol-grown
cultures but the growth rates were approximately 2-fold lower.
Figure 31. Correlations Between Pure Glycerol, Fractionated Glycerin, and Crude
Glycerin. PG: pure glycerol, FG: fractionated glycerin, CG: crude glycerin, AM: D.
alcoholvorans 6133 and M. maripaludis, VM: D. vietnamensis and M. maripaludis,
AMAR: D. alcoholvorans 6133 and M. marisnigri, VMAR: D. vietnamensis and M.
marisnigri, AMM: D. alcoholvorans 6133 and M. maripaludis and M. marisnigri, VMM:
D. vietnamensis and M. maripaludis and M. marisnigri.

77
M. acetivorans Experiments.
An interesting peak was seen at approximately 300 hours when M. acetivorans
was grown with each of the cocultures on 37 mM crude glycerin. The peak occurred at
about the same time that M. acetivorans reached stationary phase when grown as a
monoculture on the methanol fraction (33 mM) of 37 mM crude glycerin. Therefore, the
peak most likely represents M. acetivorans utilizing the methanol fraction from crude
glycerin as the coculture is just entering exponential phase. Once the methanol was used
up, M. acetivorans probably slowly started to consume acetate being produced by the
SRB, which could account for the higher methane production. Although, M. acetivorans
did not reach a high optical density when grown on acetate, it still produced a significant
amount of methane.
With the exception of D. vietnamensis and M. marisnigri, increasing
concentrations of M. acetivorans with cocultures (SRB and hydrogenotrophic
methanogen) resulted in an increase of methane production. This is most likely due to the
fact that M. acetivorans could utilize the methanol layer of crude glycerin and the acetate
by-product of SRB oxidation of glycerol. In the case of D. vietnamensis and M.
marisnigri, a smaller concentration of M. acetivorans increased methane production, but
higher concentrations had the reverse effect. However, when D. vietnamensis and M.
marisnigri was grown on the supernatant of M. acetivorans the coculture grew faster and
produced more methane than when grown under normal conditions (fresh media). The
same was true for growth of D. alcoholvorans 6133 and M. marisnigri on the
supernatant. This suggests that the presence of M. acetivorans cells somehow affects the

78
coculturing between D. vietnamensis and M. marisnigri. Although, D. alcoholvorans
6133 and M. maripaludis and D. vietnamensis and M. maripaludis grew fine and
produced much more methane in the presence of M. acetivorans, neither culture grew
very well on the M. acetivorans supernatant. Both cultures produced less methane and
grew to a much lower optical density compared to growth under normal conditions (fresh
media) on crude glycerin. Perhaps M. acetivorans produced a high concentration of
toxins that inhibited the coculturing of the SRB with M. maripaludis. M. acetivorans
could have also used up an important nutrient within the media that is essential for M.
maripaludis. It appears that something is affecting the coculturing process and not
necessarily the SRB or hydrogenotrophic methanogens since they have all shown to be
capable of growing either in the presence or on the supernatant of M. acetivorans. The
results suggested that the use of M. acetivorans for methanol and acetate utilization was
feasible, but M. maripaludis and M. marisnigri responded differently.
Conclusions.
Experimentally, SRB and methanogen cocultures have displayed the capability of
converting the waste product, crude glycerin, into a promising alternative energy. Future
studies should involve gaining a deeper understanding of the complex nature of the
microbial interactions between the SRB, hydrogenotrophic methanogens, and the
acetoclastic methanogen, M. acetivorans. In order to overcome the slightly toxic nature
of crude glycerin and to increase methane yield, a mixed consortium should be grown in
a reactor as a biofilm and tested for increased tolerance and production.

79
Overall, D. alcoholvorans 6133 and M. maripaludis produced more methane on
crude glycerin than all other co/triculture combinations. D. vietnamensis and M.
maripaludis and D. alcoholvorans 6133 and M. marisnigri produced more methane than
all other co/tricultures on fractionated glycerin. In general, methane production did not
correlate with high growth rates. The coculture, D. alcoholvorans 6133 and M.
marisnigri, and triculture, D. vietnamensis, M. maripaludis, and M. marisnigri, grew the
fastest of all co/tricultures on crude glycerin. D. vietnamensis and M. maripaludis grew
the fastest on fractionated glycerin. The best crude glycerin conversion was seen when
high concentrations of M. acetivorans were combined with: D. vietnamensis and M.
maripaludis, D. alcoholvorans 6133 and M. marisnigri, and D. alcoholvorans 6133 and
M. maripaludis. Approximately eight times more methane was produced when M.
acetivorans was added to the cocultures, D. vietnamensis and M. maripaludis and D.
alcoholvorans 6133 and M. marisnigri, compared to growth without the acetoclastic
methanogen.
Based upon both theoretical and observed yields, biological conversion of
glycerin to methane is a feasible, safe, and a transformative mechanism to provide
different uses for a biodiesel by-product that can improve overall economics and create
an additional biofuel. A single approach will not satisfy all requirements when
considering raw materials, region, or volatile energy and chemical markets; therefore,
multiple strategies should be pursued to provide private and commercial entities options
when selecting processing options in the biofuel industry. The described work has
identified and performed initial characterization of microbial consortia that can tolerate
80
and convert glycerin to biogas without the need for glycerin purification. The ability to
utilize glycerin as a feedstock for microbial conversions will circumvent industrial
purification processes and will possibly alleviate price constraints for the biodiesel
market.

81
LITERATURE CITED
Addison, K. 2007. Separating glycerine/FFAs. Visited January 2008.
http://www.journeytoforever.org/biodiesel_glycsep.html.
Anderson, I.J., M. Sieprawska-Lupa, A. Lapidus, M. Nolan, A. Copel, T.G. Rio, H.
Tice, E. Dalin, K. Barry, E. Saunders, C. Han, T. Brettin, J.C. Detter, D. Bruce, N.
Mikhailova, S. Pitluck, L. Hauser, M. Land, S. Lucas, P. Richardson, W.B. Whitman,
and N.C. Kyrpides. 2009. Complete genome sequence of Methanoculleus marisnigri
Romesser et al. 1981 type strain JR1. Standards in Genomic Sciences. 1:189-196.
Babich, I.V. and J.A. Moulijn. 2003. Science and technology of novel processes for
deep desulfurization of oil refiner streams: a review. Fuel. 82:607-631.
Barton, L.L. and W.A. Hamilton. Sulphate-reducing bacteria: environmental and
engineered systems. New York, NY: Cambridge University Press, 2007.
Bryant, M.P., L.L. Campbell, C.A. Reddy, and M.R. Crabill. 1977. Growth of
Desulfovibrio in lactate or ethanol media low in sulfate in association with H2-
utilizing Methanogenic bacteria. Applied and Environmental Micro. 33(5):1162-
1169.
Caffery, S.M., H. Park, J.K. Voordouw, Z. He, J. Zhou, and G. Voordouw. 2007.
Function of periplasmic hydrogenases in the sulfate-reducing bacterium Desulfovibrio
vulgaris Hildenborough. Journal of Bacteriology. 189(17):6159-6167.
Clark, M.E., R.E Edelmann, M.L. Duley, J.D. Wall, and M.W Fields. 2007. Biofilm
formation in Desulfovibrio vulgaris Hildenborough is dependent upon protein
filaments. Env. Micro. 9(11):2844-2854.
Crude oil and commodity prices. Visited 3 July 2010. http://www.oil-price.net/.
Deppenmeier, U. 2004. The membrane-bound electron transport system of
Methanosarcina species. Journal of Bioenergetics and Biomembranes. 36(1):55-64.
Dukes, J.S. 2003. Buried sunshine: human consumption of ancient solar energy.
Climatic Change. 61:31-44.

82
ExPASy Proteomics Server. HAMAP: Methanoculleus marisnigri (strain ATCC
35101/DSM 1498/JR1) complete proteome. Visited on March 2010.
http://www.expasy.ch/sprot/hamap/METMJ.html.
Feio, M.J., V. Zinkevich, I.B. Beech, E. Llobet-Brossa, P. Eaton, J. Schmitt, and J.
Guezennec. 2004. Desulfovibrio alaskensis sp. nov., a sulphate-reducing bacterium
from a soured oil reservoir. International Journal of Systematic and Evolutionary
Micro. 54:1747-1752.
Ferry, J.G. Methanogenesis: ecology, physiology, biochemistry & genetics. Springer,
1994.
Goenrich, M., Duin, E.C., Mahlert, F., and Thauer, R.K. 2005. Temperature
dependence of methyl-coenzyme M reductase activity and of the formation of the
methyl-coenzyme M reductase red2 state induced by coenzyme B. J. Biol. Chem.
10:333-342.
Hájek, M. and F. Skopal. 2010. Treatment of glycerol phase formed by biodiesel
production. Bioresource Technology. 101:3242-3245.
Hamilton, W.A. 1998. Bioenergetics of sulphate-reducing bacteria in relation to their
environment impact. Biodegradation. 9:201-212.
Hill, J., E. Nelson, D. Tilman, S. Polasky, and D. Tiffany. 2006. Environmental,
economic, and energetic costs and benefits of biodiesel and ethanol biofuels. Proc.
Natl. Acad. Sci. USA. 103:11206-11210.
Isa, Z., S. Grusenmeyer, and W. Verstraete. 1986. Sulfate reduction relative to
methane production in high-rate anaerobic digestion: microbial aspects. Applied and
Environmental Micro. 51(3):580-587.
Ishii, S., T. Kosaka, K. Hori, Y. Hotta, and K. Watanabe. 2005. Coaggregation
facilitates interspecies hydrogen transfer between Pelotomaculum thermopropionicum
and Methanothermobacter thermautotrophicus. Applied and Environmental Micro.
71(12):7838-7845.
Jones, W.J., M.J.B Paynter, and R. Gupta. 1983. Characterization of Methanococcus
maripaludis sp. nov., a new methanogen isolated from the salt marsh sediment. Arch.
Microbiol. 135:91-97.
Klass, D.L. Biomass renewable energy, fuels, and chemicals. San Diego, CA:
Academic Press, 1998.

83
Liu, Y. and W.B. Whitman. 2008. Metabolic, phylogenetic, and ecological diversity
of the Methanogenic archaea. Ann. N.Y. Acad. Sci. 1125:171-189.
Lόpez, J.A.S., M.A.M. Santos, and A.F.C. Pérez. 2009. Anaerobic digestion of
glycerol derived from biodiesel manufacturing. Bioresource Tech. 100:5609-5615.
Lovely, D.R., D.F. Dwyer, and M.J. Klug. 1982. Kinetic analysis of competition
between sulfate reducers and methanogens for hydrogen in sediments. Applied and
Environmental Micro. 43(6):1373-1379.
Lovley, D.R. and E.J.P. Phillips. 1987. Competitive mechanisms for inhibition of
sulfate reduction and methane production in the zone of ferric iron reduction in
sediments. Applied and Environmental Micro. 53(11):2636-2641.
Ma, K., X. Liu, and X. Dong. 2006. Methanosaeta harundinacea sp. nov., a novel
acetate-scavenging methanogen isolated from a UASB reactor. International Journal
of Systematic and Evolutionary Micro. 56:127-131.
Maestrojuán, G.M., D.R. Boone, L. Xun, R.A. Mah, and L. Zhang. 1990. Transfer of
Methanogenium bourgense, Methanogenium marisnigri, Methanogenium olentangyi,
and Methanogenium thermophilicum to the Genus Methanoculleus gen. nov.,
Emendation of Methanoculleus marisnigri and Methanogenium, and Description of
New Strains of Methanoculleus bourgense and Methanocul1eus marisnigri.
International Journal of Systematic Bacteriology. 40(2):117-122.
McCartney, D.M. and J.A. Oleszkiewicz. 1993. Competition between methanogens
and sulfate reducers: effect of COD:sulfate ratio and acclimation. Water Environment
Research. 65(5):655-664.
McGraw, L. 2009. The ethics of adoption and development of algae-based biofuels.
Ethics of Climate Change in Asia and the Pacific (ECCAP) Project, RUSHSAP,
UNESCO, Bangkok.
Mu, Y., H. Teng, D. Zhang, W. Wang, and Z. Xiu. 2006. Microbial production of 1,3-
propanediol by Klebsiella pneumoniae using crude glycerol from biodiesel
preparations. Biotechnol. Lett. 28:1755-1759.
Muyzer, G. and A.J.M. Stams. 2008. The ecology and biotechnology of sulphate-
reductin bacteria. Nature Reviews Micro. 6:441-454.
Nga, D.P., D.T.C. Ha, L.T. Hien, H. Stan-Lotter. 1996. Desulfovibrio vietnamensis
sp. nov., a halophilic sulfate-reducing bacterium from Vietnamese oil fields.
Anaerobe. 3:385-392.

84
Pachauri, N. and B. He. 2006. Value-added utilization of crude glycerol from
biodiesel production: a survey of current research activities. American Society of
Agricultural and Biological Engineers.
Pauling, L. General Chemistry. New York, NY: Dover Publications, Inc., 1970.
Peralta-Yahya, P.P. and J.D. Keasling. 2010. Advanced biofuel production in
microbes. Biotechnol. J. 5:147-162.
Pereira, P.M., Q. He, F.M.A. Valente, A.V. Xavier, J. Zhou, I.A.C. Pereira, and R. O.
Louro. 2008. Antonie van Leeuwenhoek. 93:347-362.
Pahl, G. Biodiesel: Growing a new energy economy 2nd
edition. White River
Junction, VT: Chelsea Green Publishing Company, 2008.
Postgate, J.R. The Sulphate-reducing bacteria. New York: Cambridge University
Press, 1979.
Pyle, D.J., R.A. Garcia, and Z. Wen. 2008. Producing docosahexaenoic acid (DHA)-
rich algae from biodiesel-derived crude glycerol: effects of impurities on DHA
production and algal biomass composition. J. Agric. Food Chem. 56(1):3933-3939.
Qatibi, A.I., R. Bennisse, M. Jana, J. Garcia. 1998. Anaerobic degradation of glycerol
by Desulfovibrio frutosovorans and D. carbinolicus and evidence for glycerol-
dependent utilization of 1,2-propanediol. Current Micro. 36:283-290.
Qatibi, A.I., V. Niviere, and J.L. Garcia. 1991. Desulfovibrio alcoholovorans sp. nov.,
a sulfate-reducing bacterium able to grow on glycerol, 1,2- and 1,3-propanediol.
Arch. Microbiol. 155:143-148.
Rohlin, L. and R.P. Gunsalus. 2010. Carbon-dependent control of electron transfer
and central carbon pathway genes for methane biosynthesis in the Archaean,
Methanosarcina acetivorans strain C2A. BMC Microbiol. 10(62):1-15.
Rondeel, H.E. 2002. Hydrocarbons. Visited on 3 July 2010.
http://www.falw.vu/~rondeel/grondstof/oil/Image10.gif
Schobert, H.H. The chemistry of hydrocarbon fuels. Great Britain: Billing & Sons
Ltd, Worcester, 1990.
Sheehan, J., Dunahay, T., Benemann, J., and P. Roessler. 1998. A Look Back at the
U.S. Department of Energy’s Aquatic Species Program—Biodiesel from Algae.
NREL: Golden, CO, 1-22.

85
Silva, G. P., M. Mack, and J. Contiero. 2009. Glycerol: a promising and abundant
carbon source for industrial microbiology. Biotechnology Advances. 27:30-39.
Sonne-Hansen, J., P. Westermann, and B.K. Ahring. 1999. Kinetics of sulfate and
hydrogen uptake by the thermophilic sulfate-reducing bacteria
Thermodesulfobacterium sp. Strain JSP and Thermodesulfovibrio sp. Strain R1Ha3.
Applied and Environmental Micro. 65(3):1304-1307.
Sokolov, V. Petroleum. Moscow: MIR Publishers, 1972.
Sowers, K.R, S.F. Baron, J.G. Ferry. 1984. Methanoscarcina acetivorans sp. nov., an
acetotrophic methane producing bacterium isolated from marine sediments. Applied
and Env. Micro. 47(5):971-978.
Stams, A.J.M. and C.M. Plugge. 2009. Electron transfer in syntrophic communities of
anaerobic bacteria and archaea. Nature Reviews Micro. 7:568-577.
Sugiura, K., M. Ishihara, T. Shimauchi, and S. Harayama. 1997. Physicochemical
properties and biodegradability of crude oil. Environ. Sci. Technol. 31:45-51.
Temudo, M.F., R. Poldermans, R. Kleerebezem, M.C.M. Loosdrecht. 2008. Glycerol
fermentation by (open) cultures: a chemostat study. Biotechnology and
Bioengineering. 100(6):1088-1098.
Tissot, B.P. & D.H. Welte. Petroleum formation and occurrence: a new approach to
oil and gas exploration. New York: Spring-Verlag Berlin Heidelberg, 1978.
Thom, W.T. Petroleum and Coal. Princeton, NJ: Oxford University Press, 1929.
U.S. Energy Information Administration. 2009. Use of Energy in the United States
Explained: Energy Use for Transportation. Visited on March 2010.
http://tonto.eia.doe.gov/energyexplained/index.cfm?page=us_energy_transportation#t
ab2.
Valdez-Vazquez, I. and H.M. Poggi-Varaldo. 2009. Hydrogen production by
fermentative consortia. Renewable and Sustainable Energy Reviews. 13:1000-1013.
Vasudevan, P.T. and M. Briggs. 2008. Biodiesel production- current state of the art
and challenges. J. Ind. Microbiol Biotechnol. 35:421-430.
Voegele, E. “Glycerin: research turns up new uses.” Biodiesel Magazine. March
2009: 48-51.
86
Vroblesky, D.A, P.M. Bradley, and F.H. Chapelle. 1996. Influence of electron donor
on the minimum sulfate concentration required for sulfate reduction in a petroleum
hydrocarbon-contaminated aquifer. Environ. Sci. Technol. 30:1377-1381.
Walker, C.B., Z. He, Z.K. Yang, J.A. Ringbauer, Q. He, J. Zhou, G. Voordouw, J.D.
Wall, A.P. Arkin, T.C. Hazen, S. Stolyar, and D.A. Stahl. 2009. Journal of
Bacteriology. 191(18):5793-5801.
Walters, A.D. and J.P.J. Chong. 2009. Methanococcus maripaludis: an archaeon with
multiple functional MCM proteins? Biochem. Soc. Trans. 37:1-6.
Weddel, F. & F. Banks. 1992. Gram negative sulfate-reducing bacteria, p. 3352-3378.
In Balows, A., H.G Truper, M. Dowordin, W. Harder, and K.H. Schleifer (ed.). The
prokaryotes: a handbook on the biology of bacteria. Ecophysiology, isolation,
identification, and applications, 2nd
ed. Springer-Verlag, New York, NY.
White, D. The physiology and biochemistry of prokaryotes 3rd
edition. New York:
Oxford University Press, 2007.
Yazdani, S.S. and R. Gonzalez. 2007. Anaerobic fermentation of glycerol: a path to
economic viability for the biofuels industry. Current Opinion in Biotechnology.
18:213-219.
Zehnder, A.J.B. Biology of anaerobic microorganisms. New York, NY: John Wiley
& Sons, Inc., 1988.