Materials developed by K. Watkins, J. LaMondia and C. Brakewood Communicating with Travelers Unit 8:...
38
Materials developed by K. Watkins, J. LaMondia and C. Brakewood Communicating with Travelers Unit 8: Improving Transit Quality
-
Upload
brice-banks -
Category
Documents
-
view
215 -
download
2
Transcript of Materials developed by K. Watkins, J. LaMondia and C. Brakewood Communicating with Travelers Unit 8:...
Materials developed by K. Watkins, J. LaMondia and C. Brakewood
Communicating with Travelers
Unit 8: Improving Transit Quality
Materials developed by K. Watkins, J. LaMondia and C. Brakewood
Outline
• Ways of communicating with travelers
• Impact of real-time information
• Service alerts
• New transit info tools
Materials developed by K. Watkins, J. LaMondia and C. Brakewood
DISCUSSION QUESTIONS
• As a transit user, what information is important for you to know?
• How should this information be shared?
Materials developed by K. Watkins, J. LaMondia and C. Brakewood
TCQSM – Basic Information
• Passengers need to know– How to use transit service?– Where to go to access it?– How to pay fare and how much?– Where to get off near their destination?– Any transfers required?– When services are scheduled to depart and
arrive?• Service Alerts

Materials developed by K. Watkins, J. LaMondia and C. Brakewood
TCQSM – Means of Info
• Printed - timetables, maps, service change notices• Posted - system maps or notices• Audible announcements - stops, train directions, fare
zone • Visual displays - on-board or in stations• Transit agency staff - station agents or tourist info staff• Telephone information - info lines, automated
menus, SMS• Online information• Smartphone apps - trip planning, fare info, real-time• Transit infrastructure - shelters, signage
Materials developed by K. Watkins, J. LaMondia and C. Brakewood
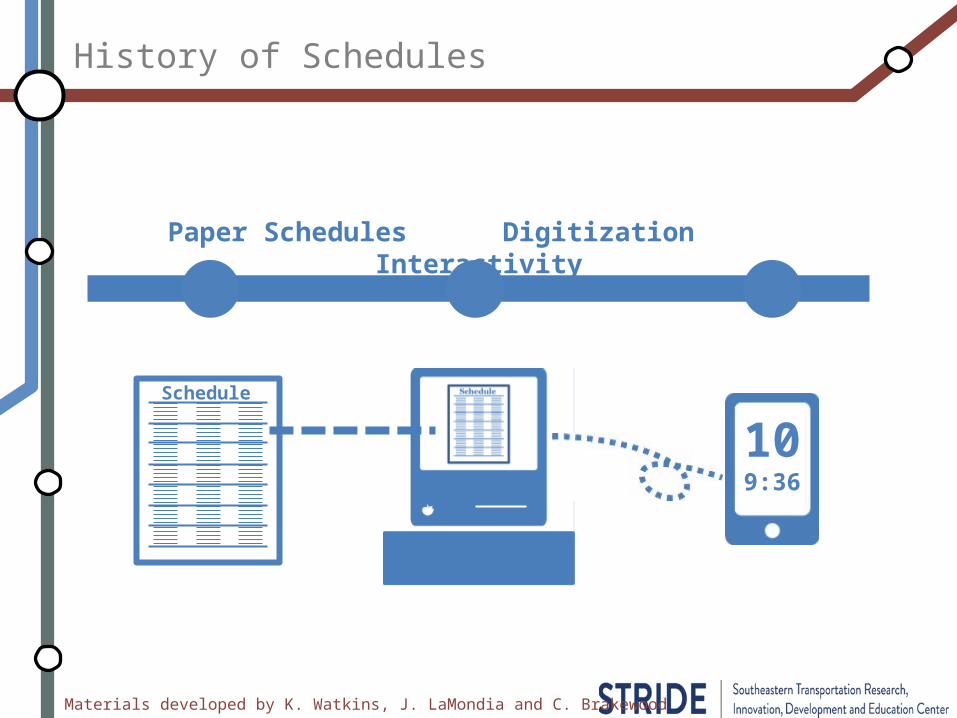
History of Schedules
Schedule
Paper Schedules Digitization Interactivity
109:36
Materials developed by K. Watkins, J. LaMondia and C. Brakewood
Moving toward real-time
• Schedule information is no longer enough• Customers need to know when the vehicle is
coming to trust the service• More passengers have mobile devices to
access information
Materials developed by K. Watkins, J. LaMondia and C. Brakewood
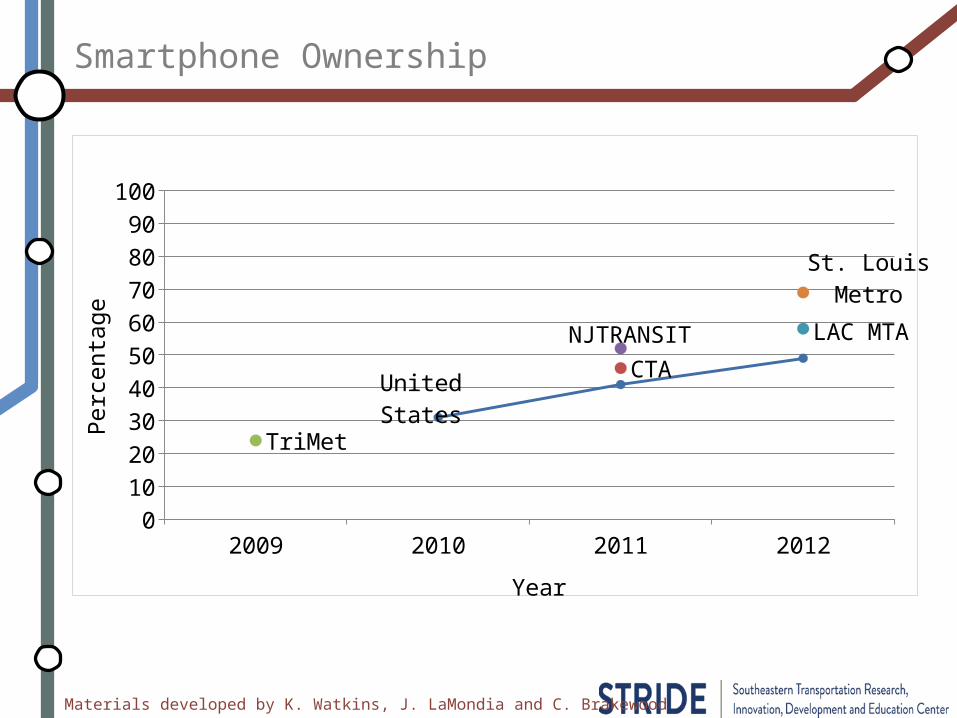
Smartphone Ownership
2009 2010 2011 20120
102030405060708090
100
United StatesCTA
TriMet
NJTRANSIT LAC MTA
St. Louis Metro
Year
Perc
enta
ge
Materials developed by K. Watkins, J. LaMondia and C. Brakewood
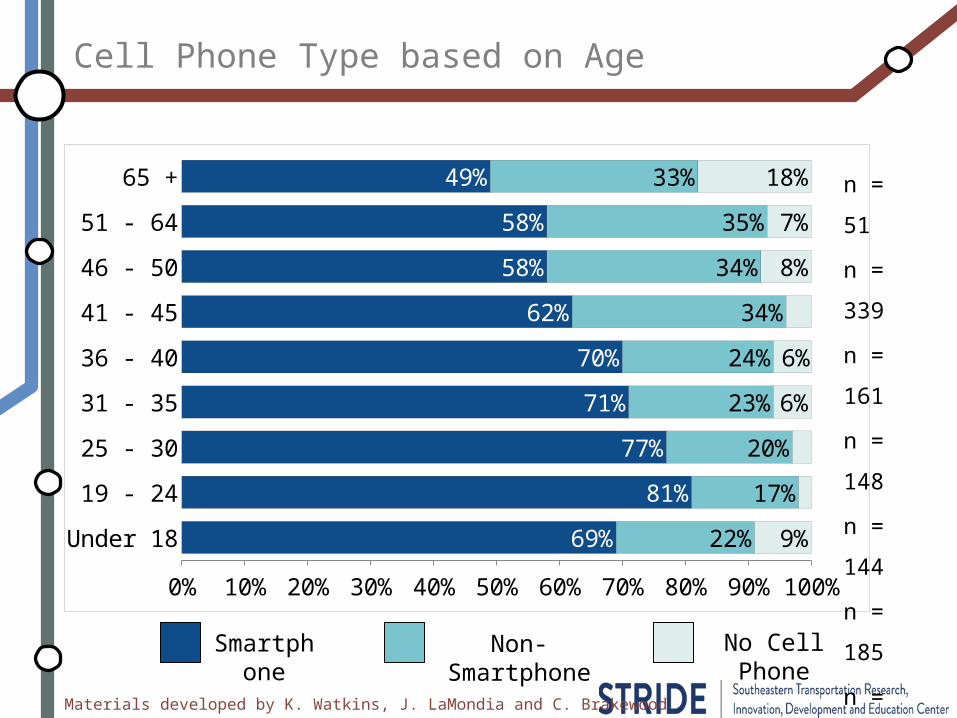
Smartphone Non-Smartphone No Cell Phone
65 +
51 - 64
46 - 50
41 - 45
36 - 40
31 - 35
25 - 30
19 - 24Under
180% 10% 20% 30% 40% 50% 60% 70% 80% 90% 100%
49%
58%
58%
62%
70%
71%
77%
81%
69%
33%
35%
34%
34%
24%
23%
20%
17%
22%
18%
7%
8%
6%
6%
9%
n = 51
n = 339
n = 161
n = 148
n = 144
n = 185
n = 249
n = 303
n = 58
Cell Phone Type based on Age
Materials developed by K. Watkins, J. LaMondia and C. Brakewood
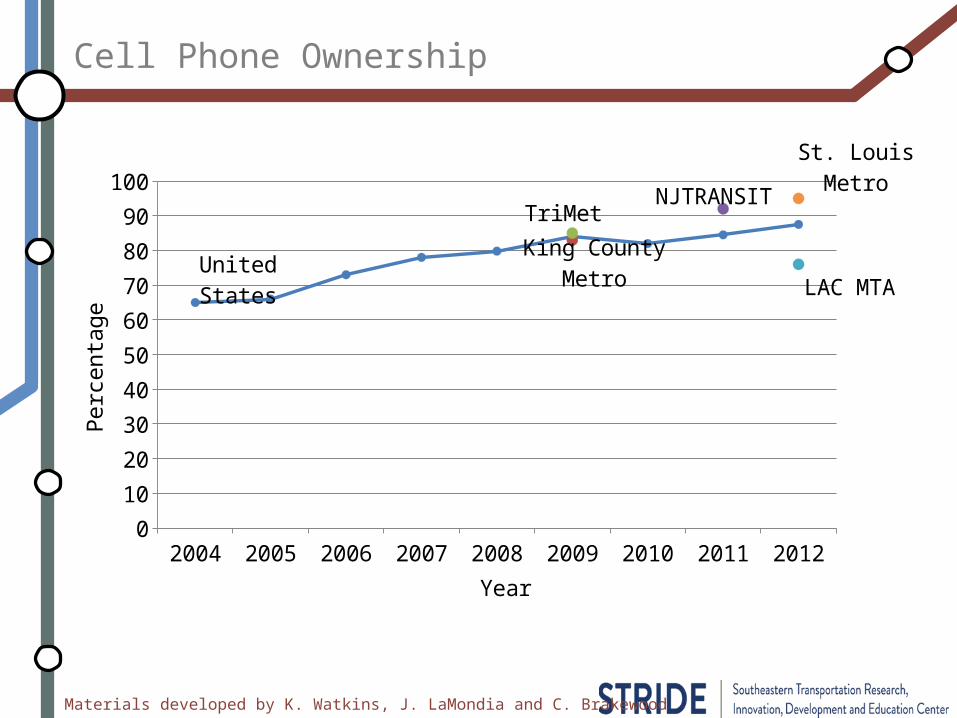
Cell Phone Ownership
2004 2005 2006 2007 2008 2009 2010 2011 20120
10
20
30
40
50
60
70
80
90
100
United StatesKing County
Metro
TriMetNJTRANSIT
LAC MTA
St. Louis Metro
Year
Perc
enta
ge
Materials developed by K. Watkins, J. LaMondia and C. Brakewood
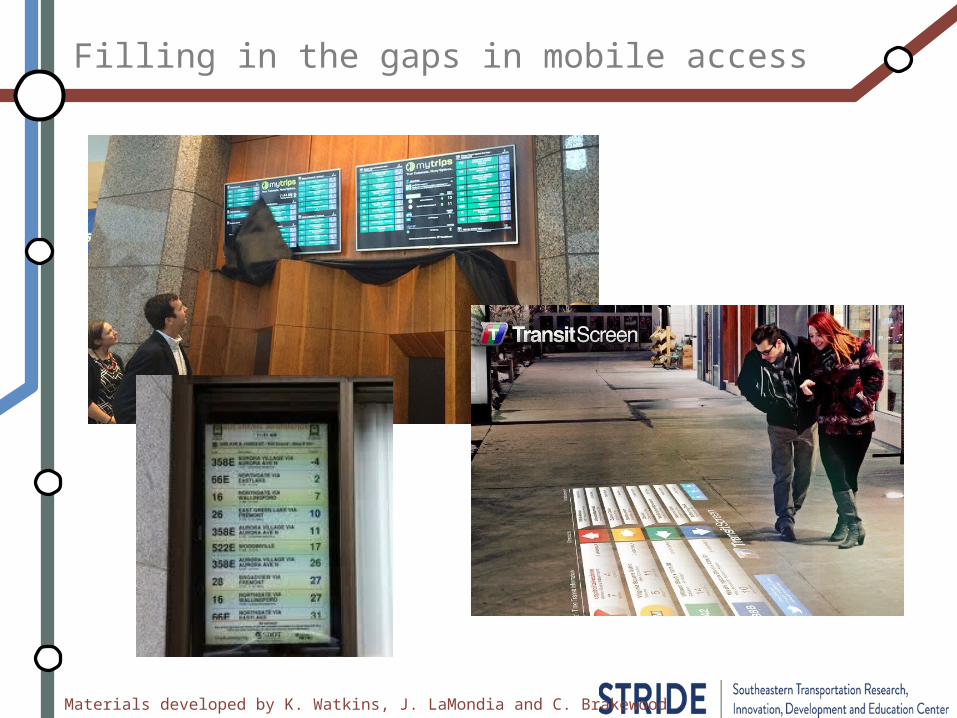
Filling in the gaps in mobile access

Materials developed by K. Watkins, J. LaMondia and C. Brakewood
How does real time information change user perceptions and behavior?
IMPACTS OF REAL-TIME
Materials developed by K. Watkins, J. LaMondia and C. Brakewood
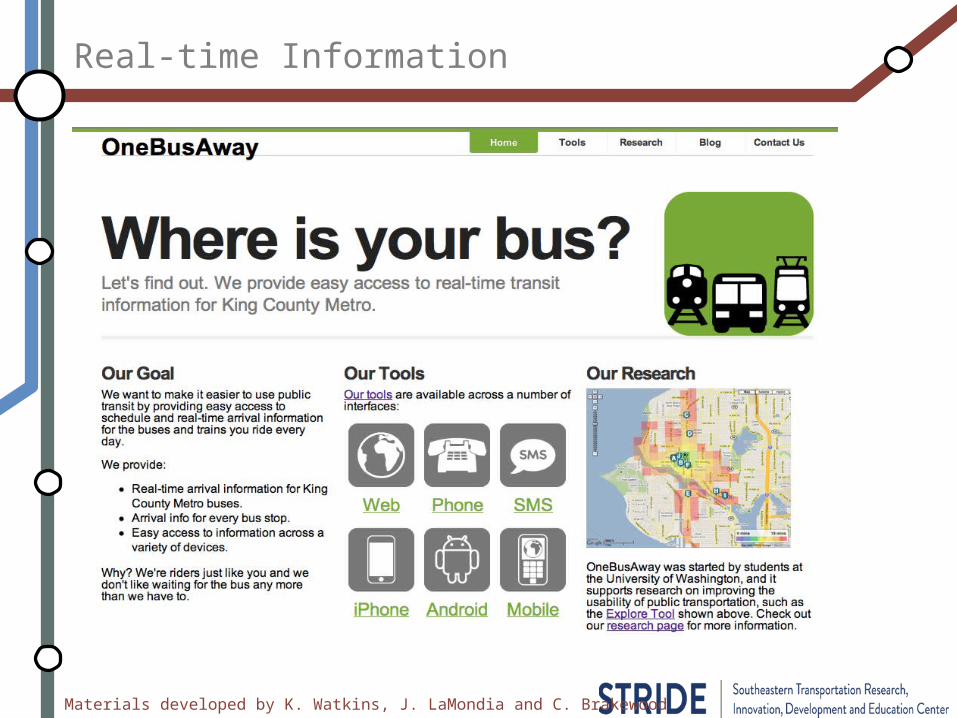
Real-time Information
Materials developed by K. Watkins, J. LaMondia and C. Brakewood
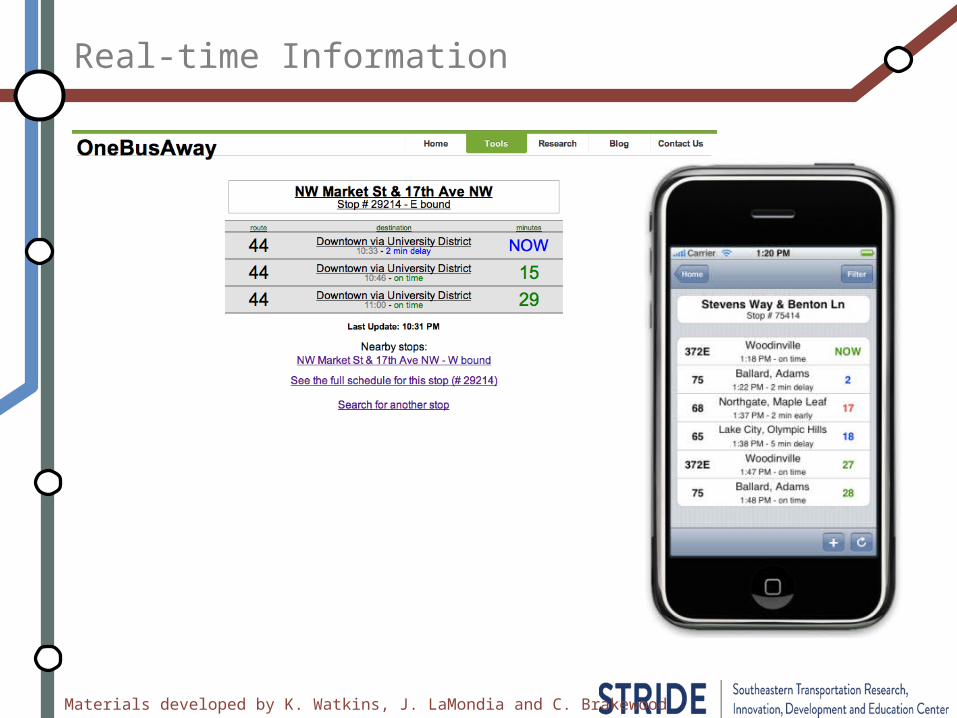
Real-time Information
Materials developed by K. Watkins, J. LaMondia and C. Brakewood
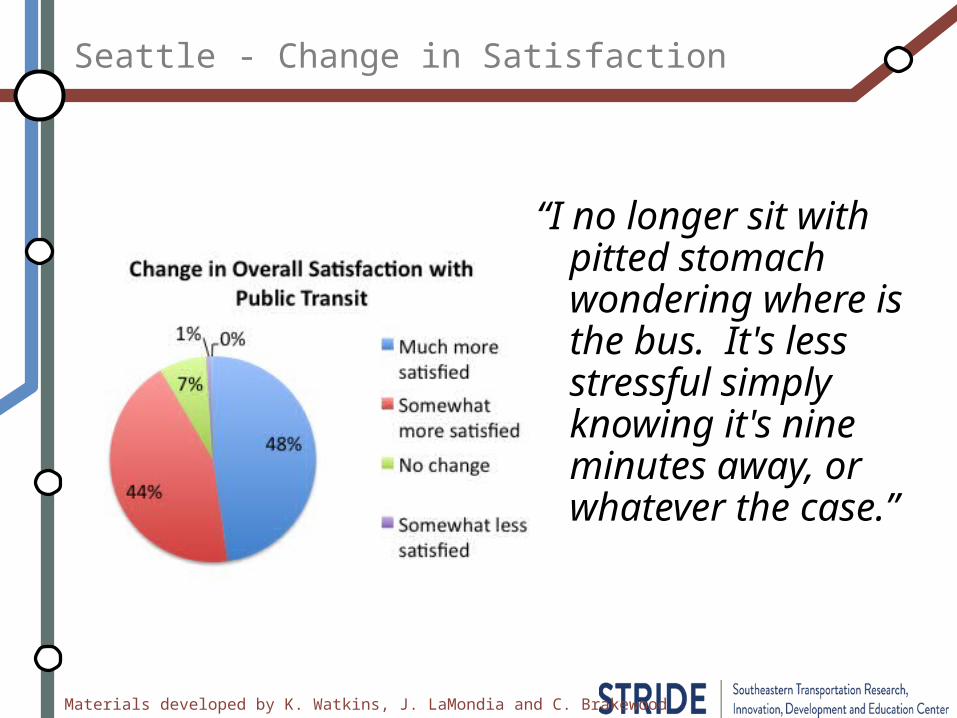
Seattle - Change in Satisfaction
“I no longer sit with pitted stomach wondering where is the bus. It's less stressful simply knowing it's nine minutes away, or whatever the case.”
Materials developed by K. Watkins, J. LaMondia and C. Brakewood
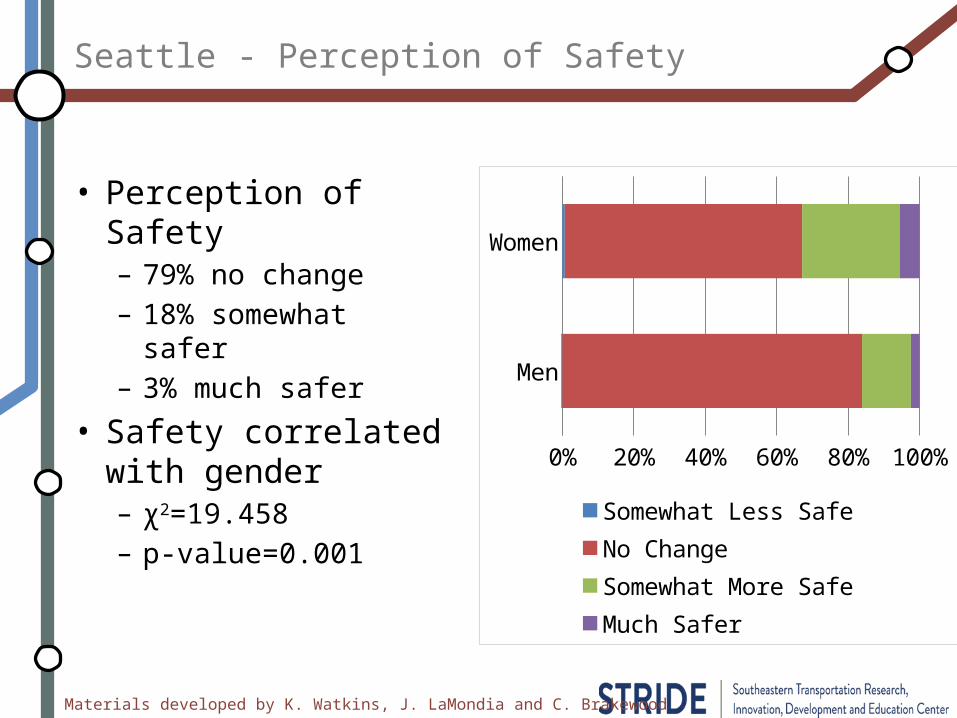
Seattle - Perception of Safety
• Perception of Safety– 79% no change– 18% somewhat safer– 3% much safer
• Safety correlated with gender– χ2=19.458– p-value=0.001
Men
Women
0% 20% 40% 60% 80% 100%
Somewhat Less SafeNo ChangeSomewhat More SafeMuch Safer
Materials developed by K. Watkins, J. LaMondia and C. Brakewood
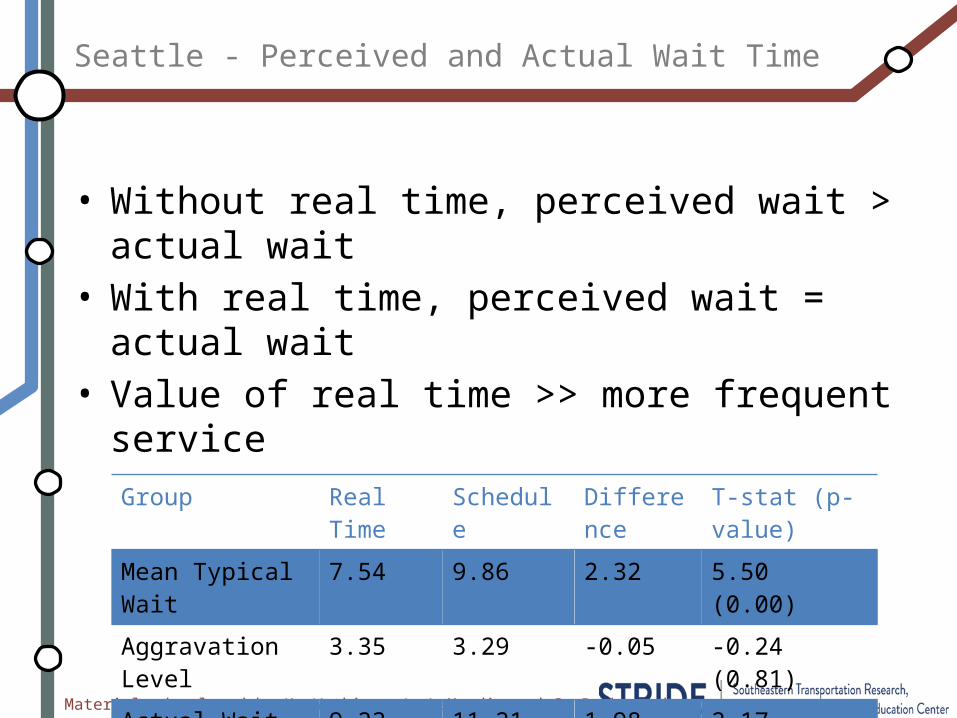
Seattle - Perceived and Actual Wait Time
• Without real time, perceived wait > actual wait• With real time, perceived wait = actual wait• Value of real time >> more frequent service
Group Real Time Schedule Difference T-stat (p-value)
Mean Typical Wait 7.54 9.86 2.32 5.50 (0.00)
Aggravation Level 3.35 3.29 -0.05 -0.24 (0.81)
Actual Wait Time 9.23 11.21 1.98 2.17 (0.03)
Materials developed by K. Watkins, J. LaMondia and C. Brakewood18
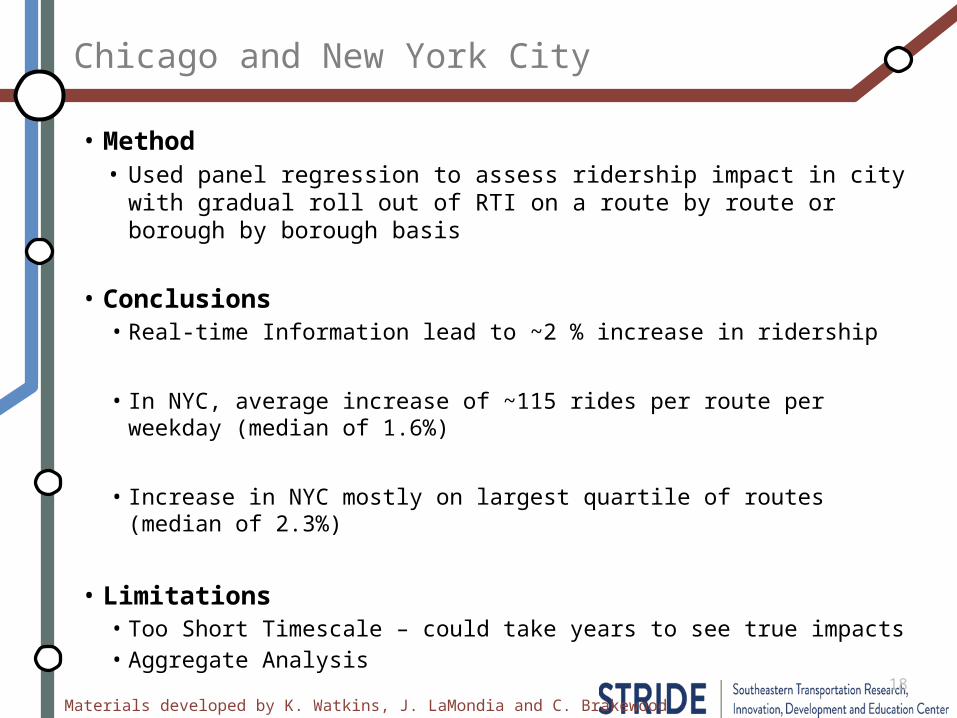
• Method• Used panel regression to assess ridership impact in city with gradual
roll out of RTI on a route by route or borough by borough basis
• Conclusions• Real-time Information lead to ~2 % increase in ridership
• In NYC, average increase of ~115 rides per route per weekday (median of 1.6%)
• Increase in NYC mostly on largest quartile of routes (median of 2.3%)
• Limitations• Too Short Timescale – could take years to see true impacts• Aggregate Analysis
Chicago and New York City
Materials developed by K. Watkins, J. LaMondia and C. Brakewood19
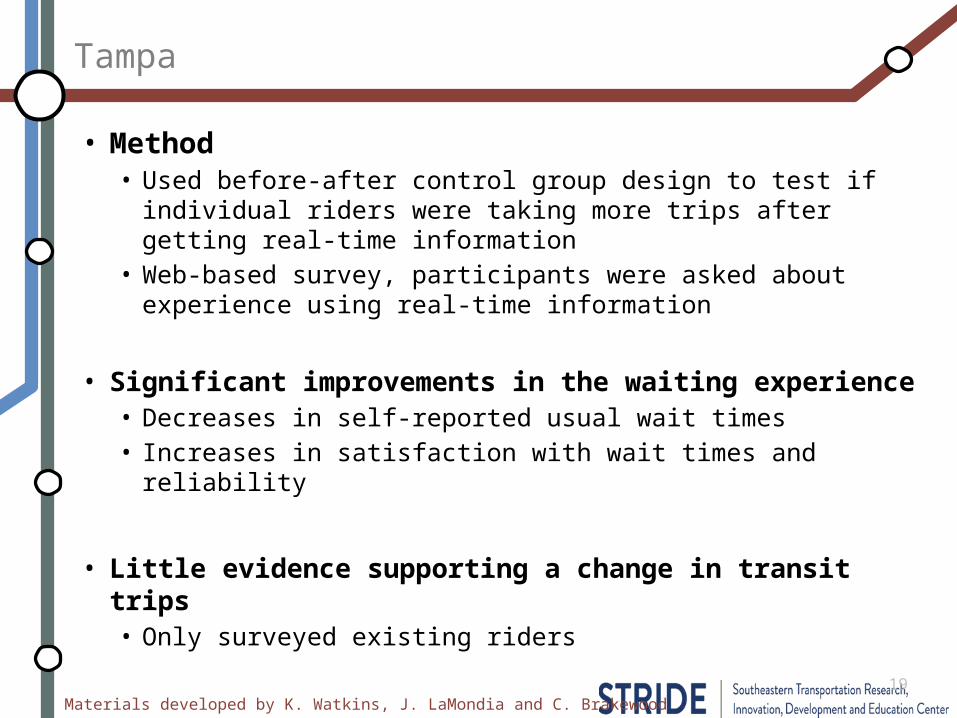
Tampa
• Method• Used before-after control group design to test if individual
riders were taking more trips after getting real-time information
• Web-based survey, participants were asked about experience using real-time information
• Significant improvements in the waiting experience• Decreases in self-reported usual wait times• Increases in satisfaction with wait times and reliability
• Little evidence supporting a change in transit trips• Only surveyed existing riders
Materials developed by K. Watkins, J. LaMondia and C. Brakewood
SERVICE ALERTSTelling riders if something goes wrong with service
Materials developed by K. Watkins, J. LaMondia and C. Brakewood
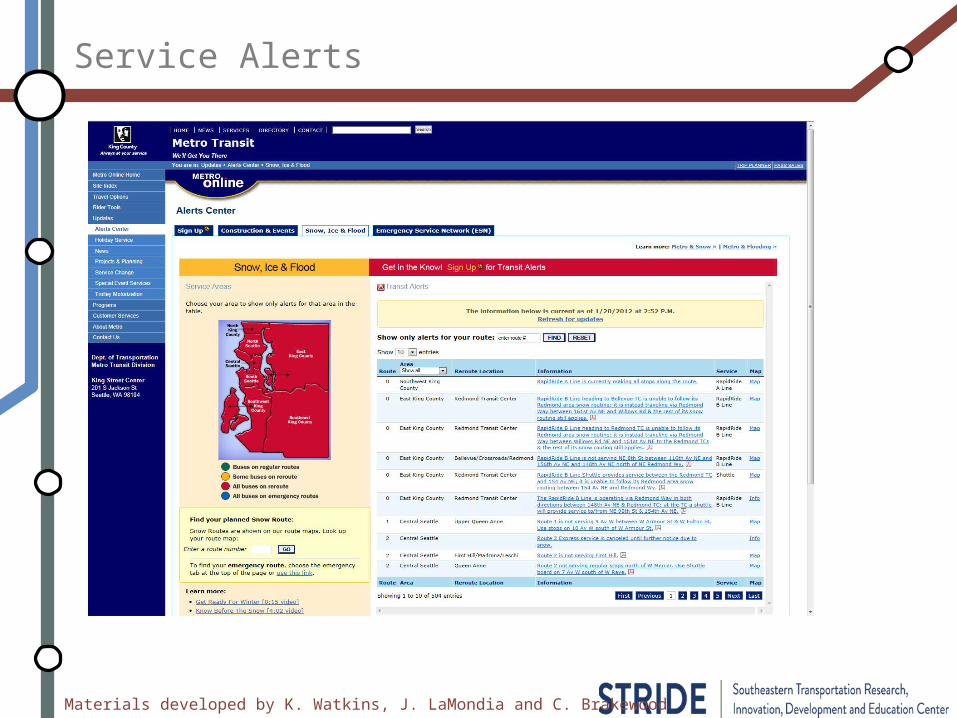
Service Alerts
Materials developed by K. Watkins, J. LaMondia and C. Brakewood
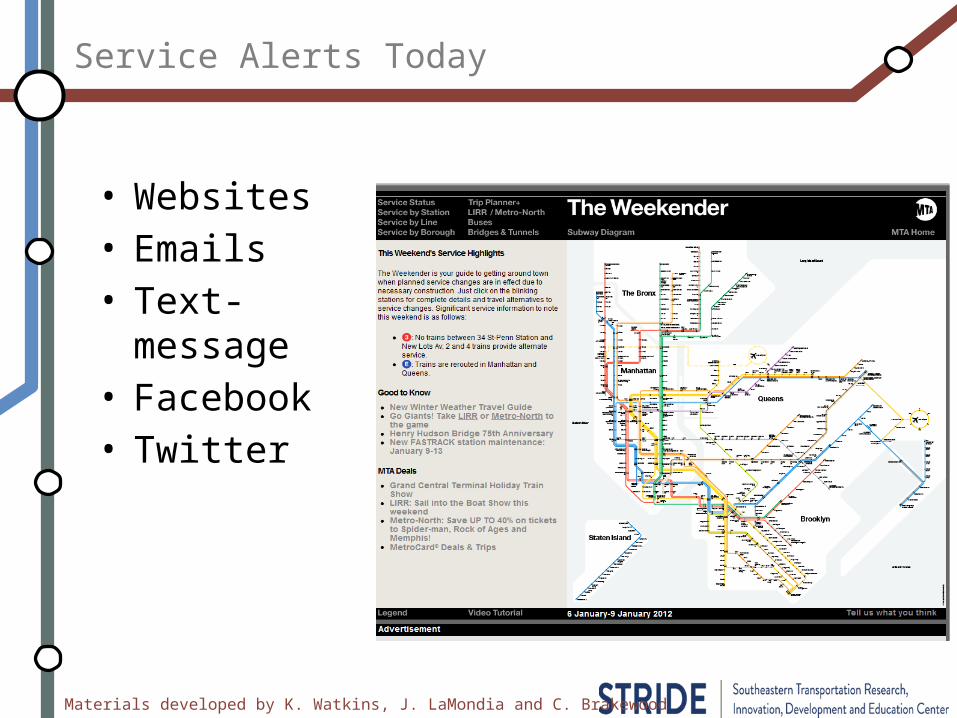
Service Alerts Today
• Websites• Emails• Text-
message• Facebook• Twitter
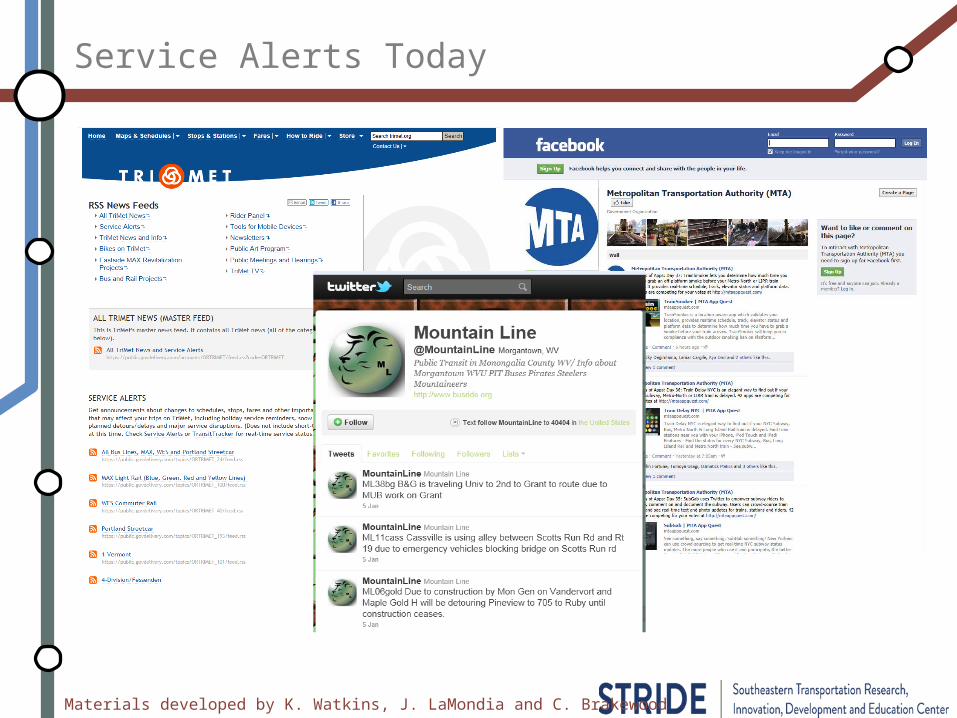
Materials developed by K. Watkins, J. LaMondia and C. Brakewood
Service Alerts Today
Materials developed by K. Watkins, J. LaMondia and C. Brakewood
Ideal Service Alerts
• Ideally Inform riders about alerts– Real-time– Individually
• Barriers– Data in standard format– Easy input without human chain of information
Materials developed by K. Watkins, J. LaMondia and C. Brakewood
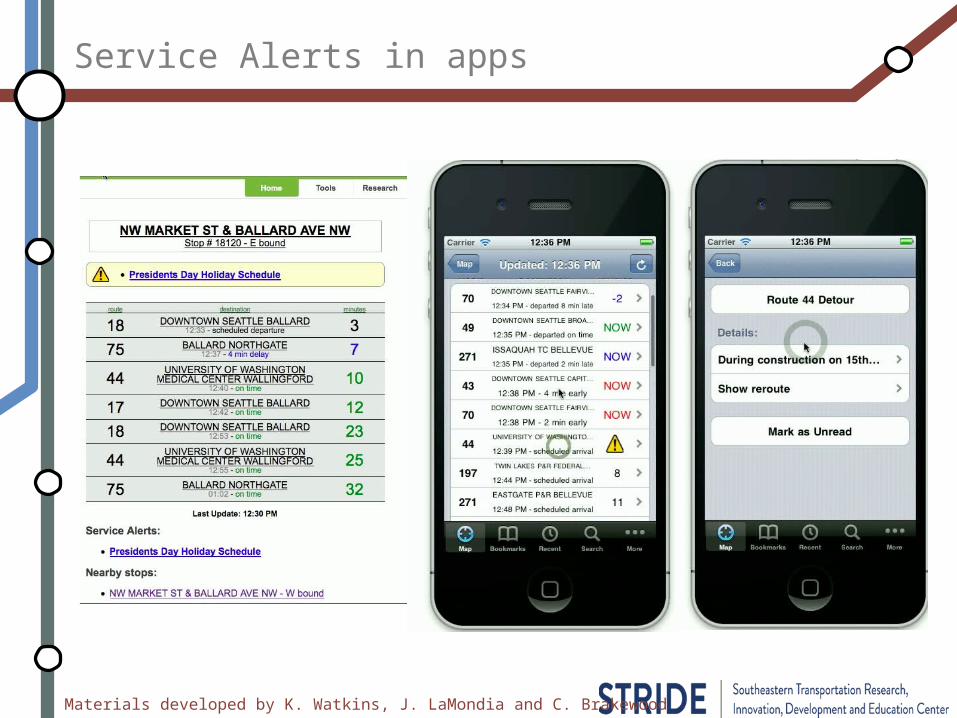
Service Alerts in apps
Materials developed by K. Watkins, J. LaMondia and C. Brakewood
What should the next transit info tools be?
NEW TRANSIT INFO TOOLS
Materials developed by K. Watkins, J. LaMondia and C. Brakewood
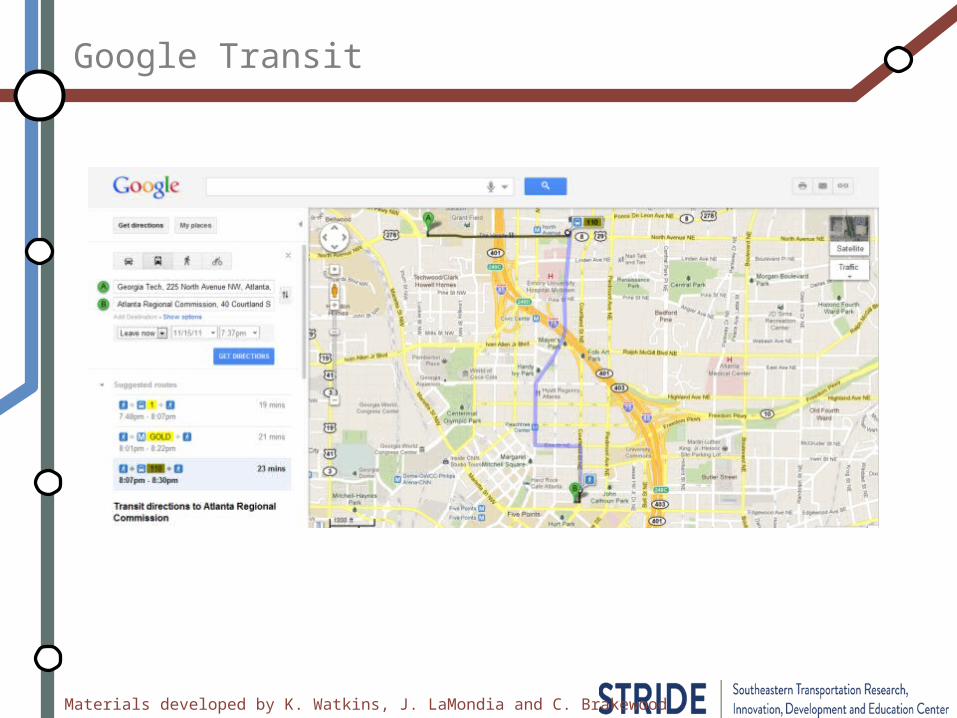
Google Transit
Materials developed by K. Watkins, J. LaMondia and C. Brakewood
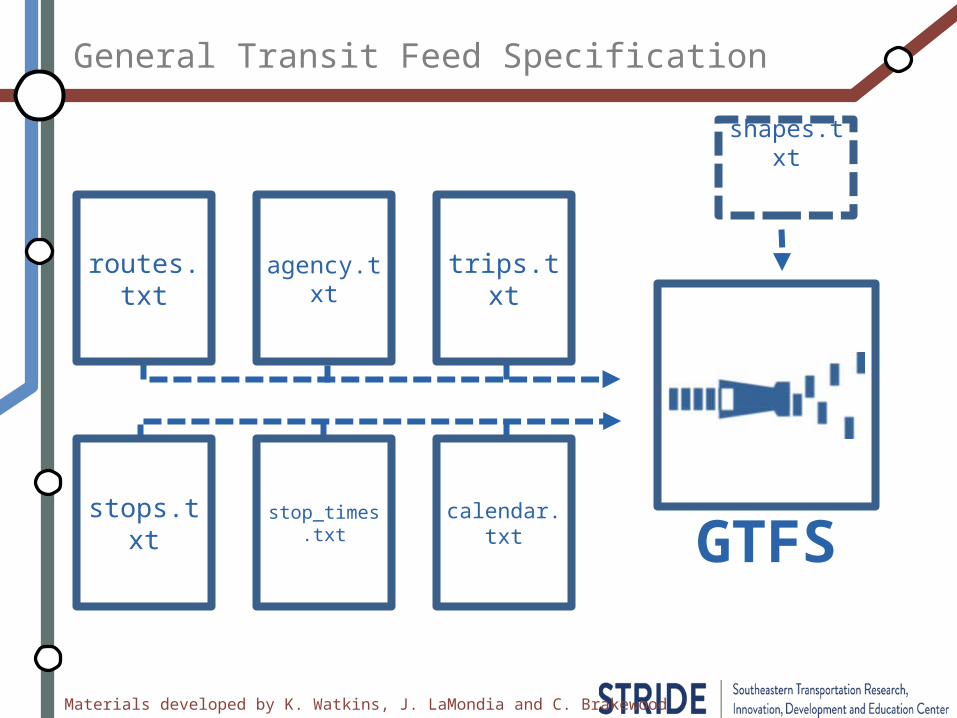
GTFS
General Transit Feed Specification
routes.txt
stops.txt
trips.txt
stop_times.txt calendar.txt
agency.txt
shapes.txt
Materials developed by K. Watkins, J. LaMondia and C. Brakewood
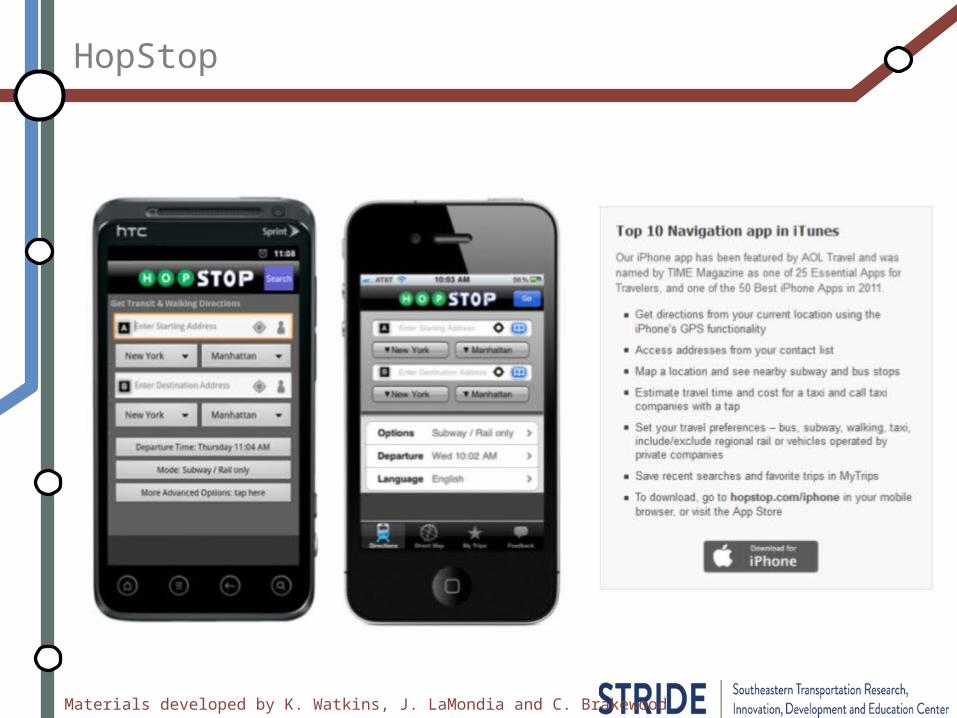
HopStop
Materials developed by K. Watkins, J. LaMondia and C. Brakewood
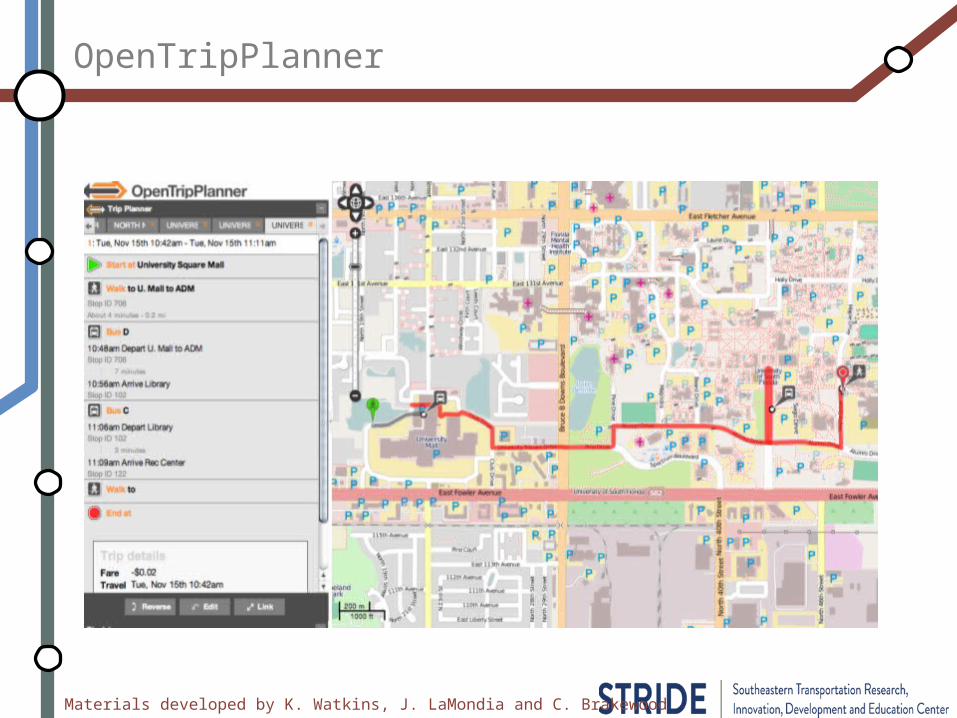
OpenTripPlanner
Materials developed by K. Watkins, J. LaMondia and C. Brakewood
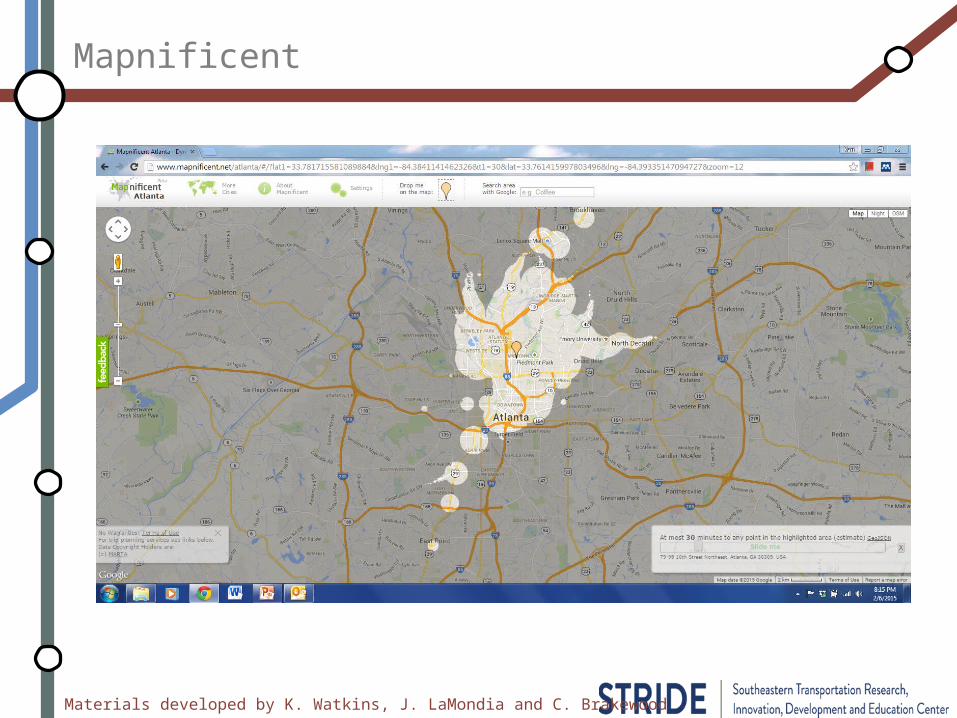
Mapnificent
Materials developed by K. Watkins, J. LaMondia and C. Brakewood
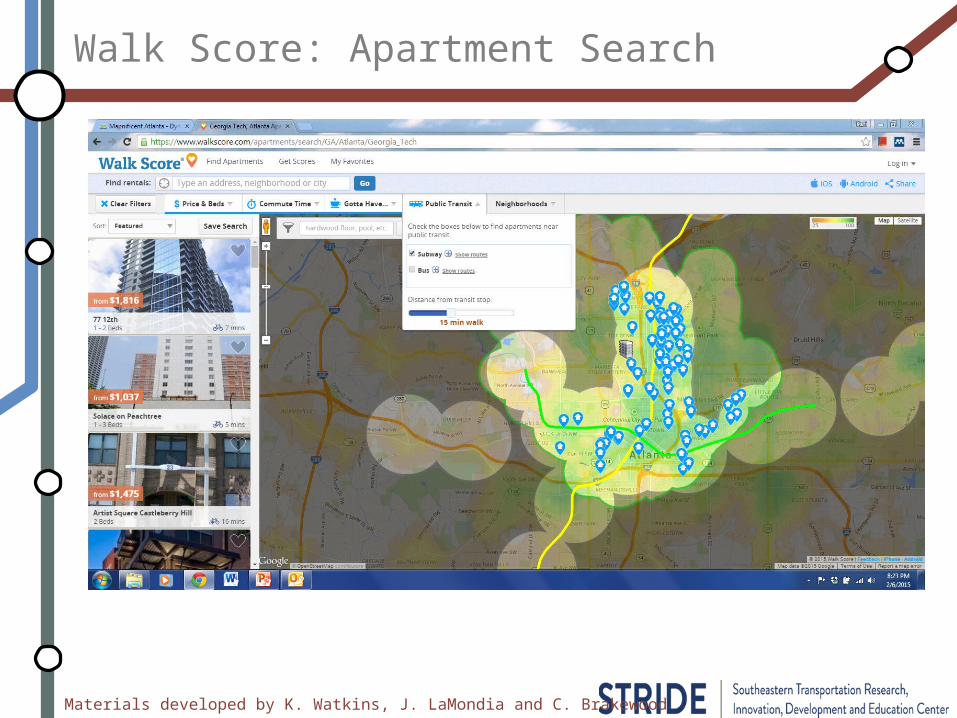
Walk Score: Apartment Search
Materials developed by K. Watkins, J. LaMondia and C. Brakewood
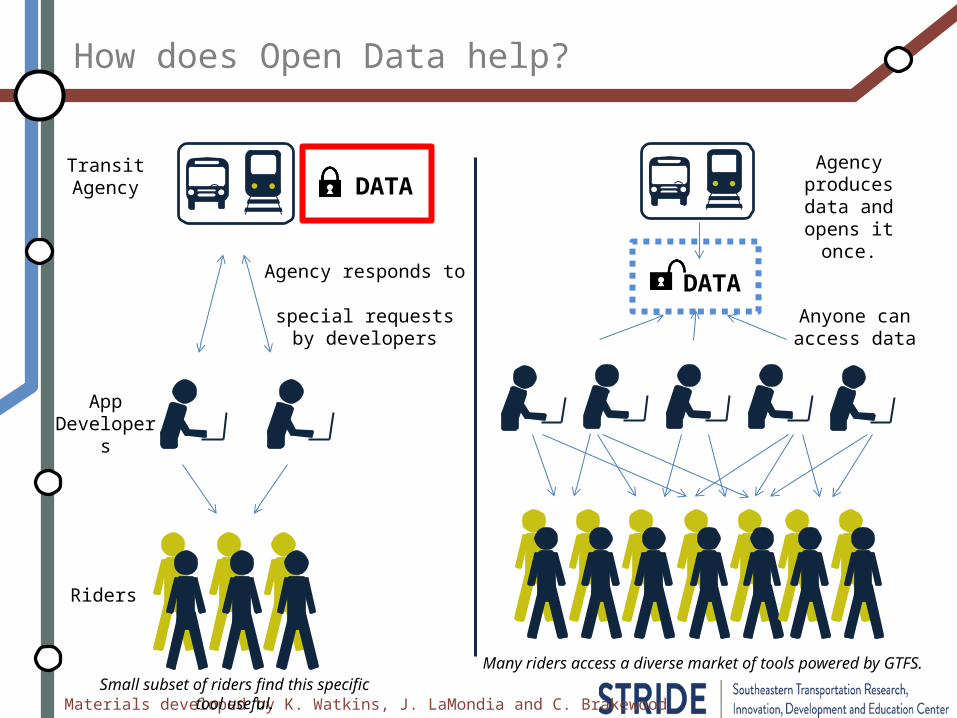
How does Open Data help?
Agency responds to special requests by
developers
Small subset of riders find this specific tool useful.
Transit Agency
App Developers
Riders
DATA
DATAAnyone can access data
Many riders access a diverse market of tools powered by GTFS.
Agency produces data and opens it
once.
Materials developed by K. Watkins, J. LaMondia and C. Brakewood
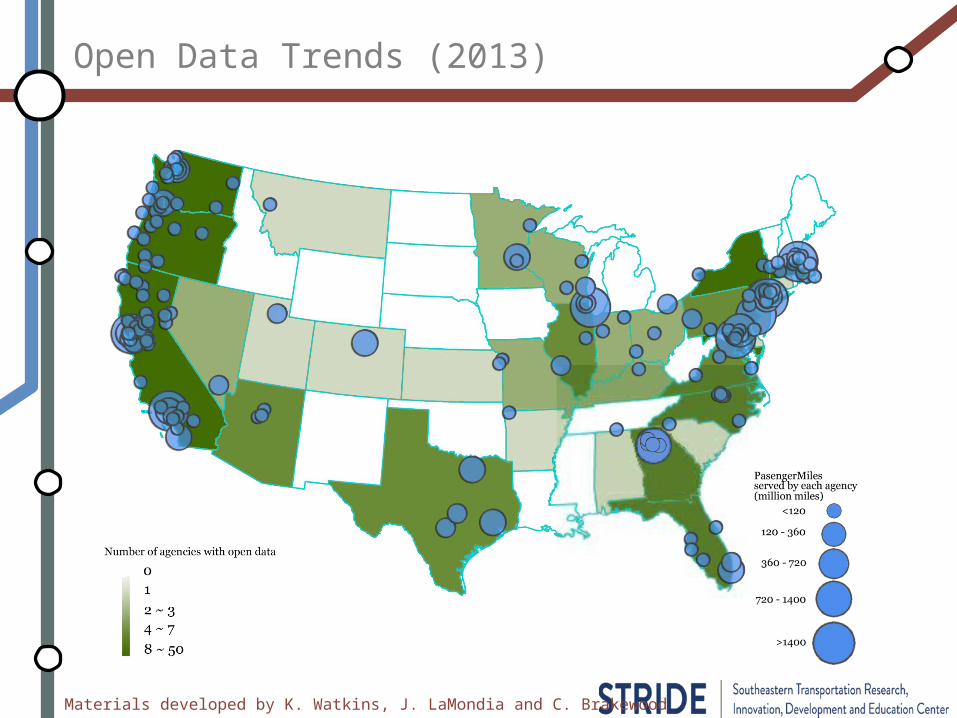
Open Data Trends (2013)

Materials developed by K. Watkins, J. LaMondia and C. Brakewood
Major points from the TCRP Synthesis reading
• What else did you learn from the TCRP Synthesis on real-time transit information?
Materials developed by K. Watkins, J. LaMondia and C. Brakewood
Major points from the TCRP Synthesis reading
• Critical consideration is agency’s ability to develop, manage, and maintain mobile applications in-house or manage third-party application development and services.
• Strong relationship between open-data approach and resources to create useful and accurate real-time mobile applications.
• Real-time transit information on mobile devices more prevalent than use of other traditional media (signs, interactive voice response)
• Not all existing and potential customers will have mobile devices, and not all applications will satisfy the needs of all customers.
• Personalization of information is critical to the success of providing information on mobile devices.
Materials developed by K. Watkins, J. LaMondia and C. Brakewood
Conclusion
• Real-time information increases the perceived safety and decreases perceived wait time.
• Service alerts allow agencies to communicate issues and delays to passengers.
• With the opening of transit data, a plethora of applications have sprung.
Materials developed by K. Watkins, J. LaMondia and C. Brakewood
Reference
The materials in this lecture were taken from:• TCRP Report 165, “Transit Capacity and Quality of Service
Manual, 3rd edition”, 2013.• Ferris, B., Watkins, K., and Borning, A. (2010) “OneBusAway:
Results from Providing Real-Time Arrival Information for Public Transit.” Proceedings of CHI.
• Various papers from K. Watkins research group at Georgia Tech• Wong, James, et al. "Open Transit Data: State of the practice and
experiences from participating agencies in the United States." Transportation Research Board 92nd Annual Meeting. No. 13-0186. 2013.
• TCRP Synthesis 91, Use and Deployment of Mobile Device Technology for Real-time Transit Information, http://onlinepubs.trb.org/onlinepubs/tcrp/tcrp_syn_91.pdf