Market Perspectives - Apr 2014.pdf
71
Market Perspectives Apr. 2014 April 3 rd , 2014 www.finlightresearch.com Caveat emptor…
-
Upload
tingitingi -
Category
Documents
-
view
222 -
download
3
Transcript of Market Perspectives - Apr 2014.pdf
Market PerspectivesApr. 2014
April 3rd, 2014
www.finlightresearch.com
Caveat emptor…
“Markets crash all the time. You should, at minimum,expect stocks to fall at least 10% once a year, 20%once every few years, 30% or more once or twice adecade, and 50% or more once or twice during yourlifetime. Those who don't understand this willeventually learn it the hard way. ” - Morgan Housel
2FinLight Research | www.finlightresearch.com
Executive Summary: Global Asset Allocation
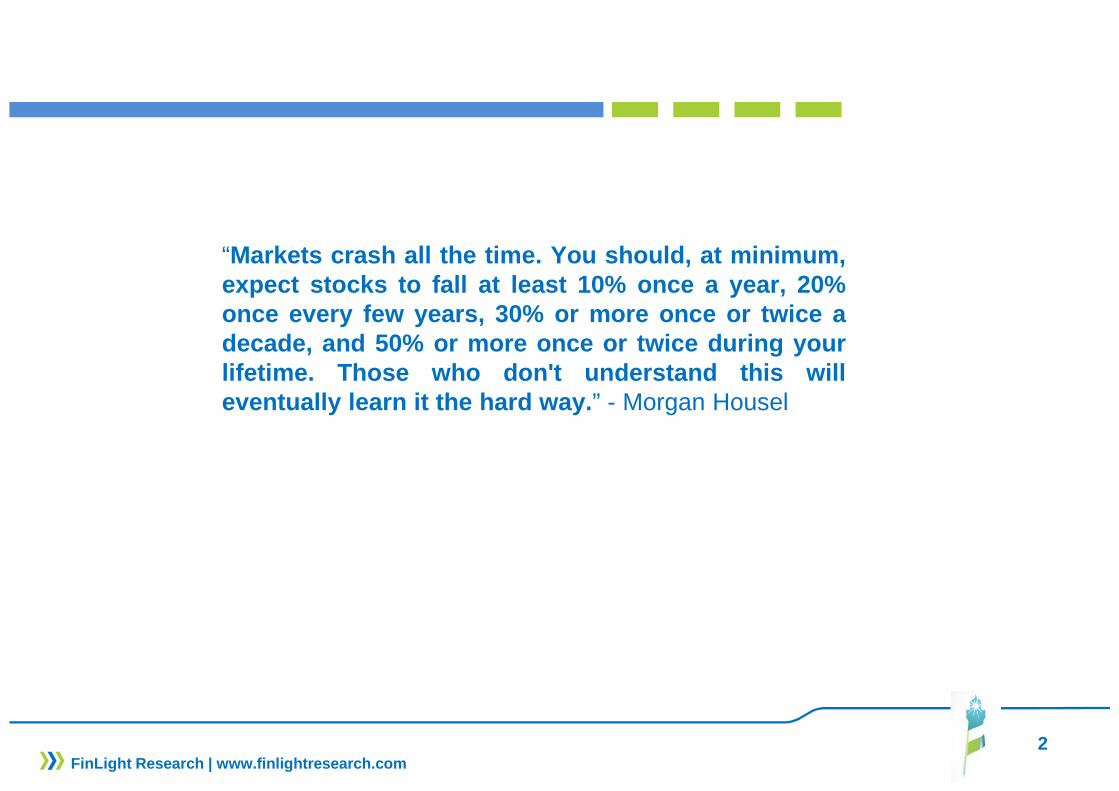
� Macro matters : While we are no longer in a recession, the economy is still far from ideal. The market is becoming more vulnerable as the Federal Reserve begins to adjust the monetary policy
� Many signs point to a global slowdown: China's sudden decline in exports, downward revision to their economy's growth rate, stalling of Europe's recovery
� We continue to see the main systemic risk coming fr om China .
� We expect market volatility to rise over the 1-month and 3-month time horizons.
� We summarize our views as follows �
3FinLight Research | www.finlightresearch.com

MACRO VIEW
� The Good� Fed Chairman Yellen's remarks that the Fed remains short of its employment and inflation targets
created a feeling that the Fed might taper a bit more slowly� Auto sales are strong� ISM manufacturing and service are in expansion territory� The market expects Beijing to launch a series of policy measures to stabilize growth and stop the
loss of momentum in its economy.
� The Bad� Earnings warnings are at record highs� Inflation in Eurozone lowest since November 2009� Junk bond issuance is reaching record highs, while both the yields and the quality of the debt issued
have never been lower. � China's growth is slowing� Delaying the rebalancing process in China, thanks to countercyclical policy of support to growth,
increases hard landing risks in years to come� Ukraine situation remains a big concern
� The Ugly � Continued weakness in China's economic numbers could offset economic gains in the U.S. and
elsewhere
4FinLight Research | www.finlightresearch.com
5FinLight Research | www.finlightresearch.com
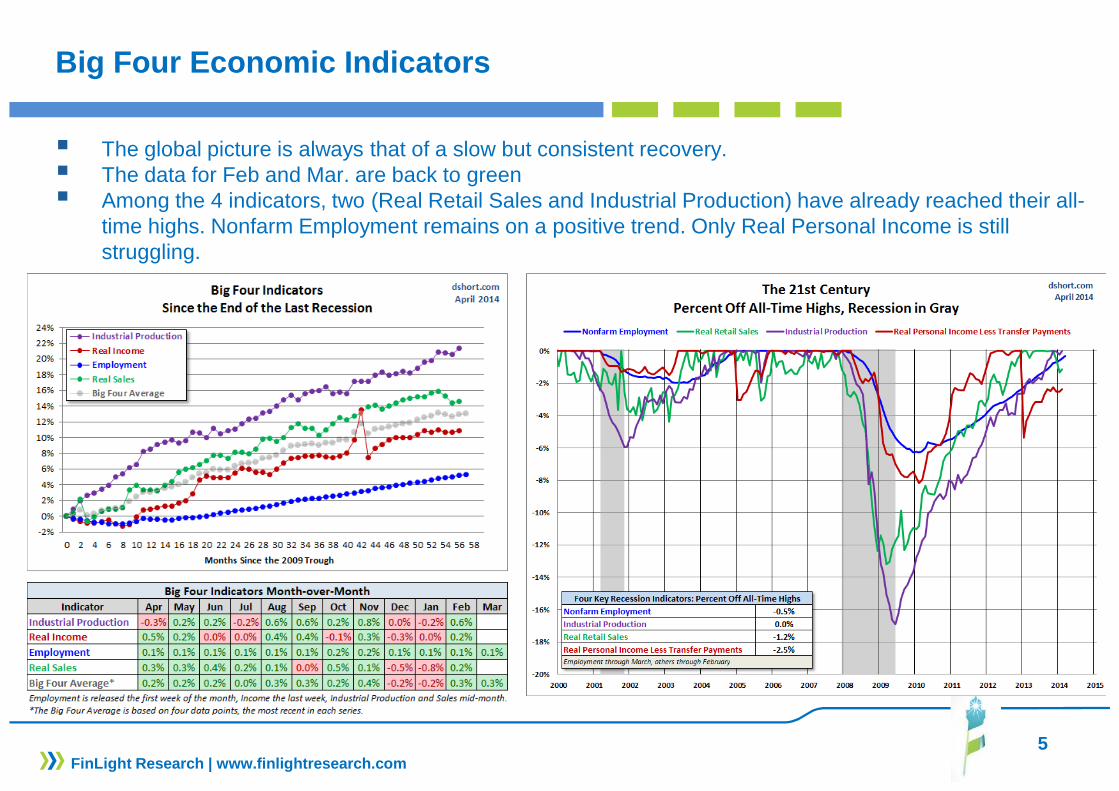
Big Four Economic Indicators
� The global picture is always that of a slow but consistent recovery. � The data for Feb and Mar. are back to green� Among the 4 indicators, two (Real Retail Sales and Industrial Production) have already reached their all-
time highs. Nonfarm Employment remains on a positive trend. Only Real Personal Income is still struggling.
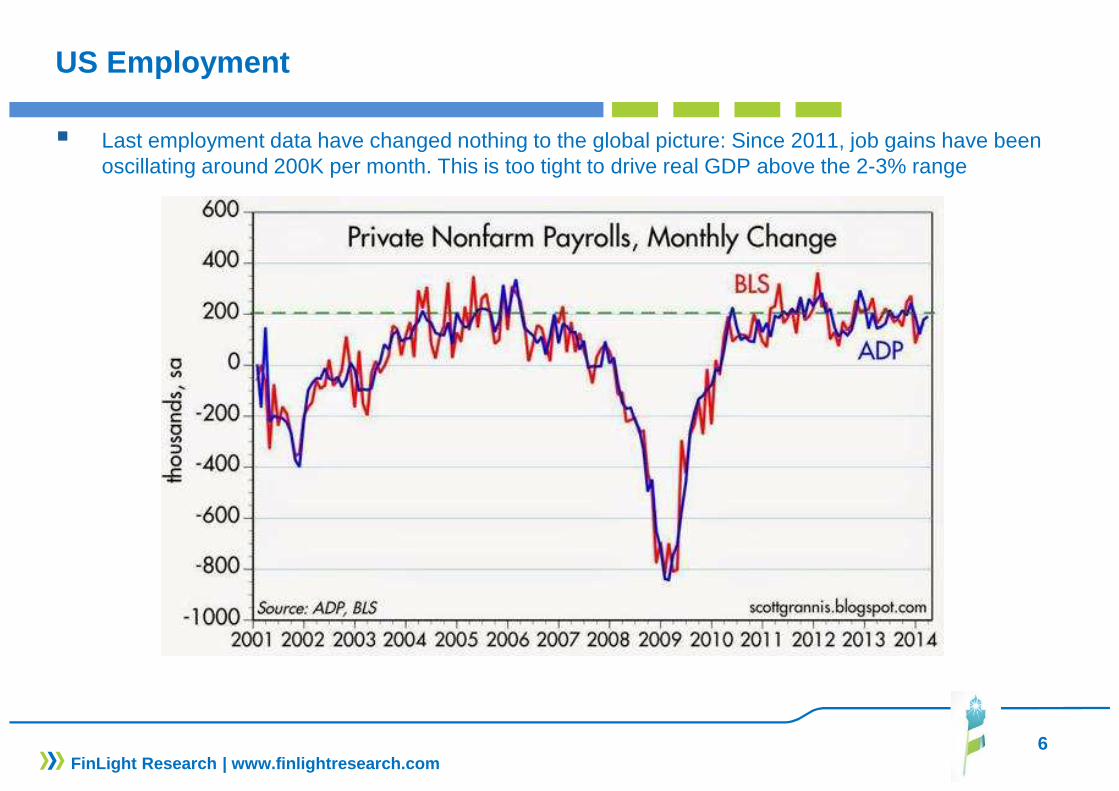
US Employment
� Last employment data have changed nothing to the global picture: Since 2011, job gains have been oscillating around 200K per month. This is too tight to drive real GDP above the 2-3% range
6FinLight Research | www.finlightresearch.com
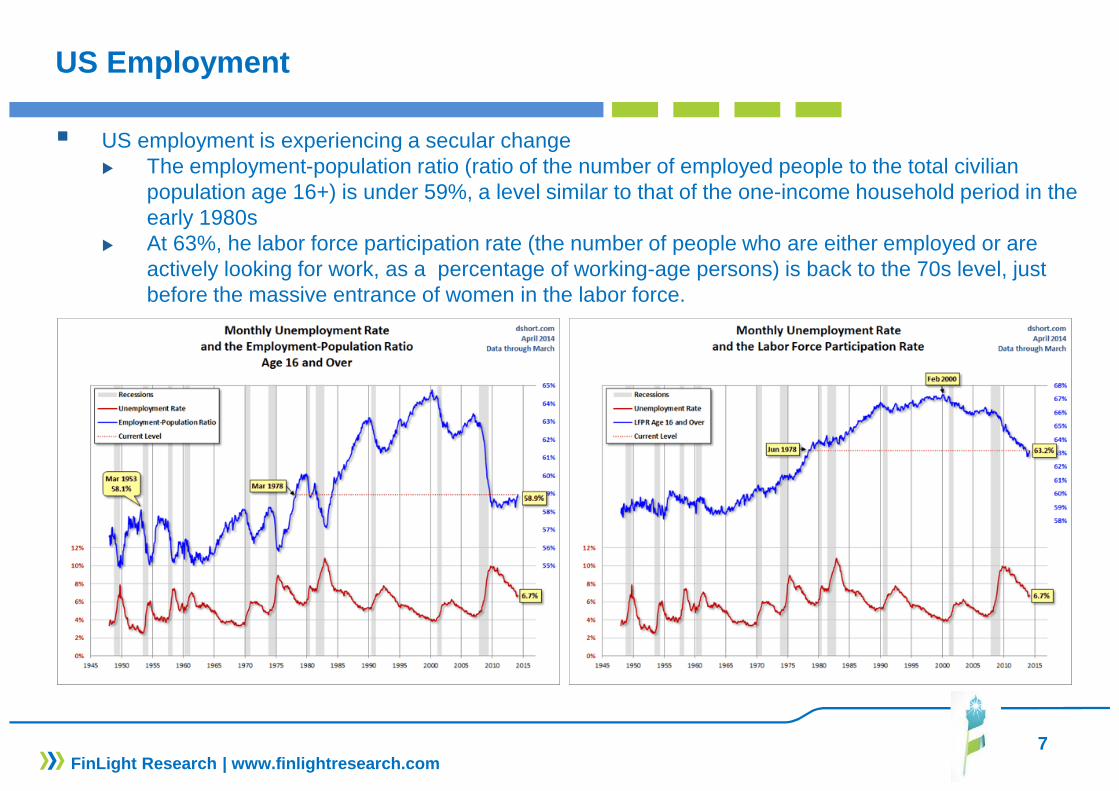
US Employment
� US employment is experiencing a secular change � The employment-population ratio (ratio of the number of employed people to the total civilian
population age 16+) is under 59%, a level similar to that of the one-income household period in the early 1980s
� At 63%, he labor force participation rate (the number of people who are either employed or are actively looking for work, as a percentage of working-age persons) is back to the 70s level, just before the massive entrance of women in the labor force.
7FinLight Research | www.finlightresearch.com
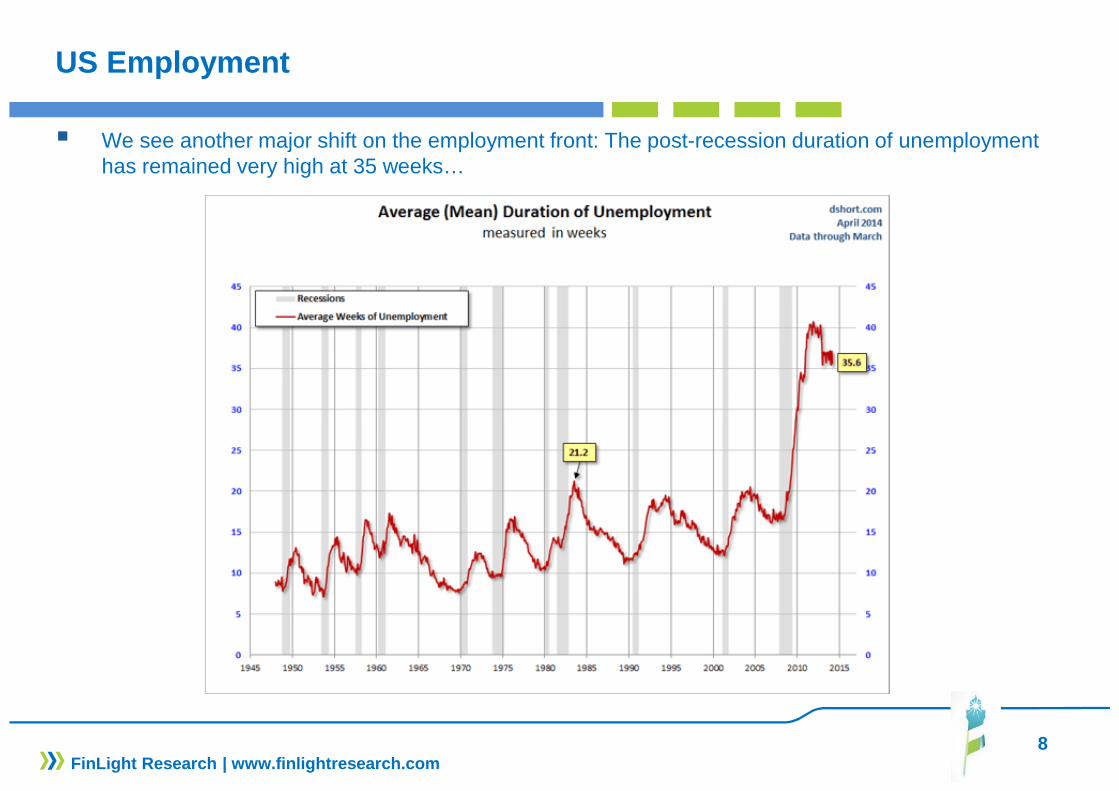
US Employment
� We see another major shift on the employment front: The post-recession duration of unemployment has remained very high at 35 weeks…
8FinLight Research | www.finlightresearch.com

PCE & DPI
� The trend in disposable personal income (DPI) and personal consumption expenditures (PCE) has remained positive so far this year, without being particularly impressive in real terms.
9FinLight Research | www.finlightresearch.com
10
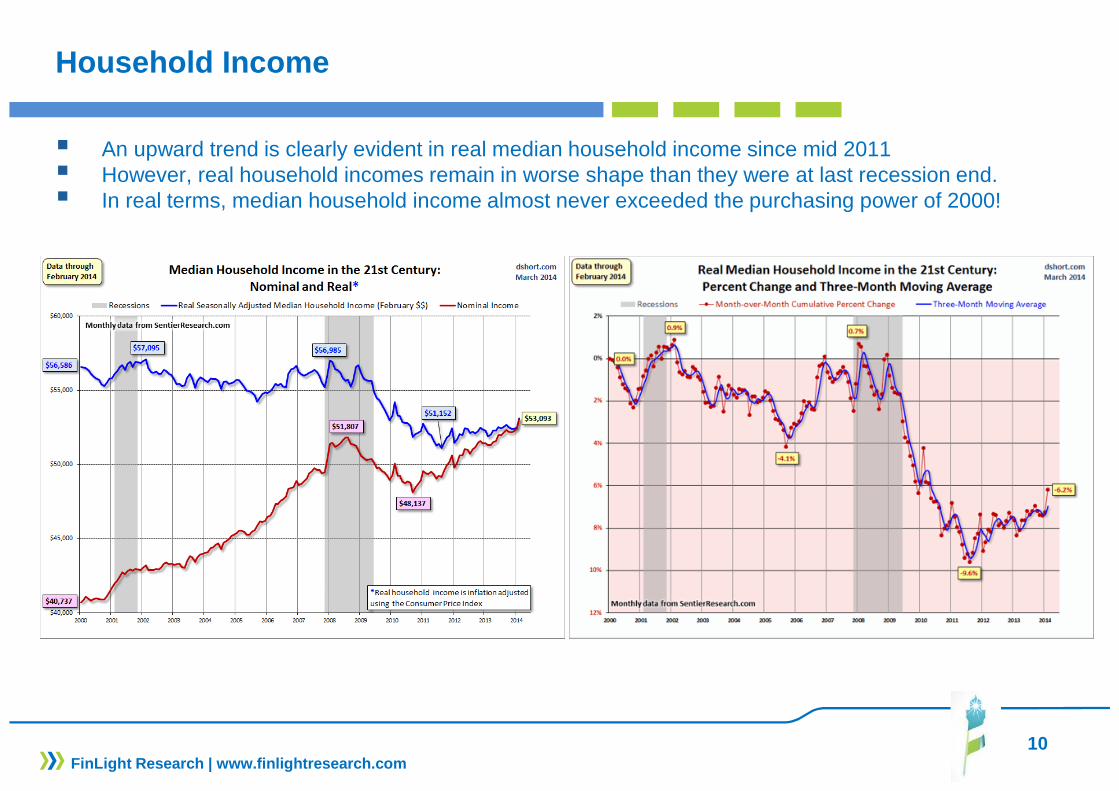
Household Income
� An upward trend is clearly evident in real median household income since mid 2011 � However, real household incomes remain in worse shape than they were at last recession end.� In real terms, median household income almost never exceeded the purchasing power of 2000!
FinLight Research | www.finlightresearch.com
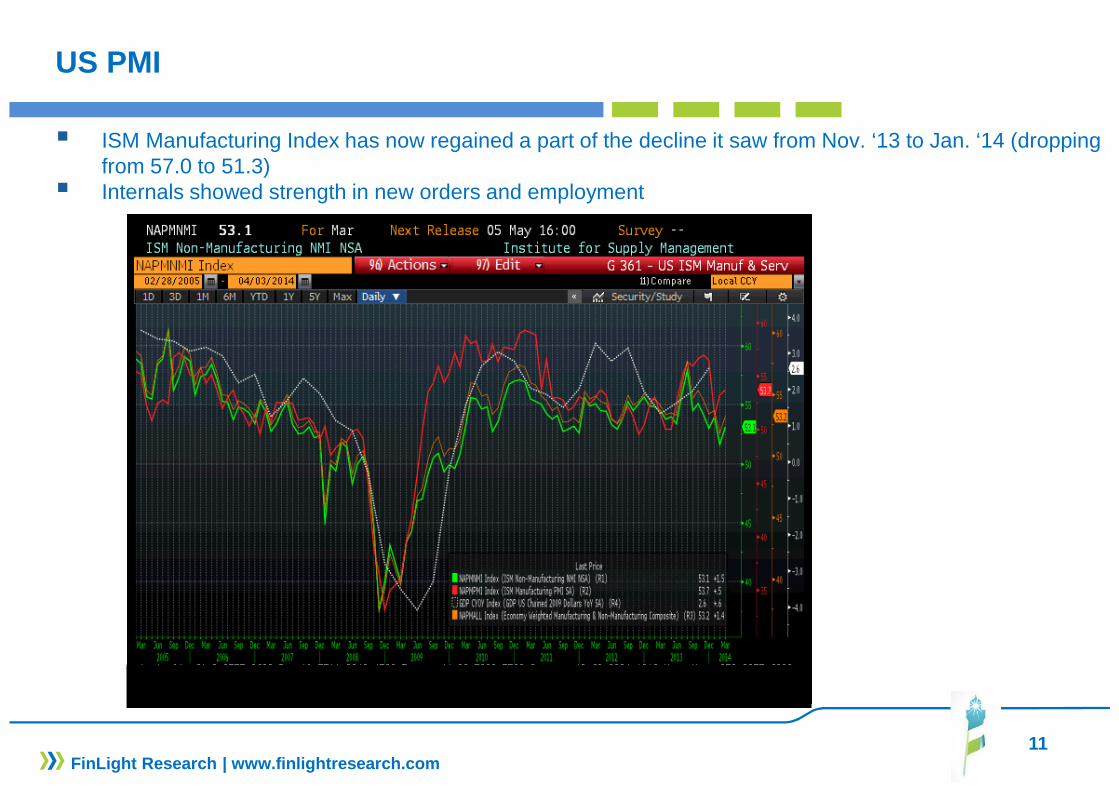
US PMI
� ISM Manufacturing Index has now regained a part of the decline it saw from Nov. ‘13 to Jan. ‘14 (dropping from 57.0 to 51.3)
� Internals showed strength in new orders and employment
11FinLight Research | www.finlightresearch.com
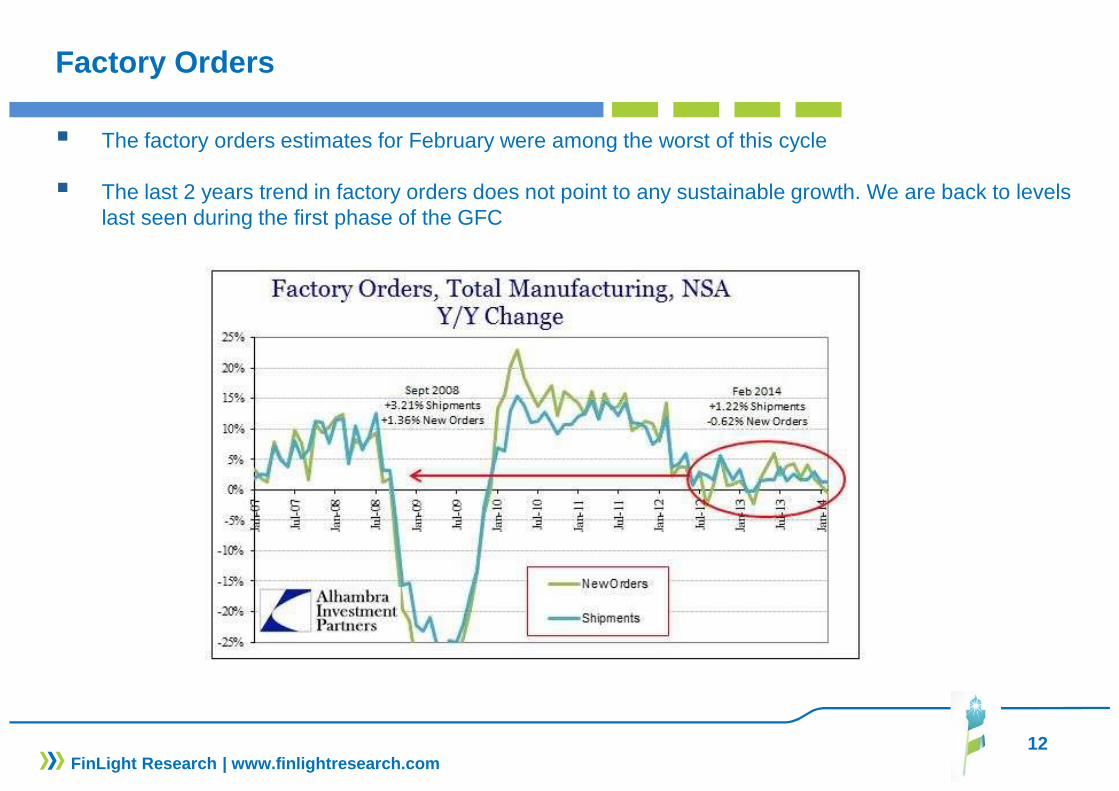
Factory Orders
� The factory orders estimates for February were among the worst of this cycle
� The last 2 years trend in factory orders does not point to any sustainable growth. We are back to levels last seen during the first phase of the GFC
12FinLight Research | www.finlightresearch.com
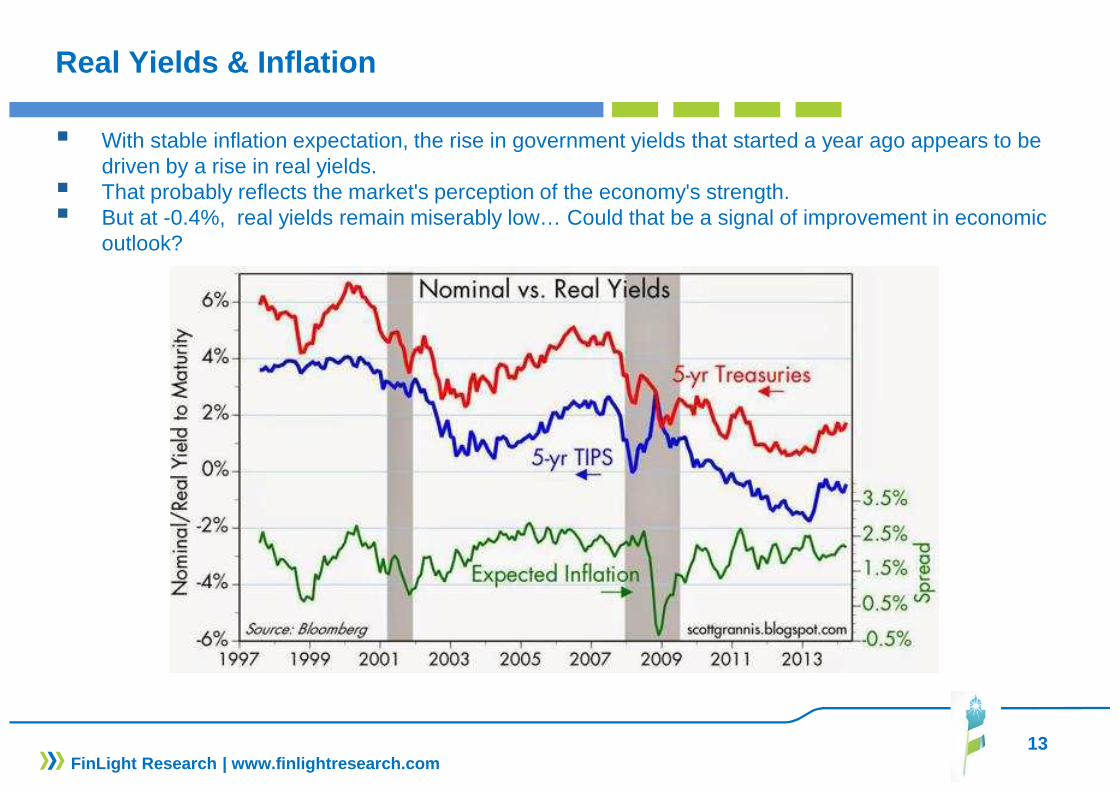
Real Yields & Inflation
� With stable inflation expectation, the rise in government yields that started a year ago appears to be driven by a rise in real yields.
� That probably reflects the market's perception of the economy's strength.� But at -0.4%, real yields remain miserably low… Could that be a signal of improvement in economic
outlook?
13FinLight Research | www.finlightresearch.com
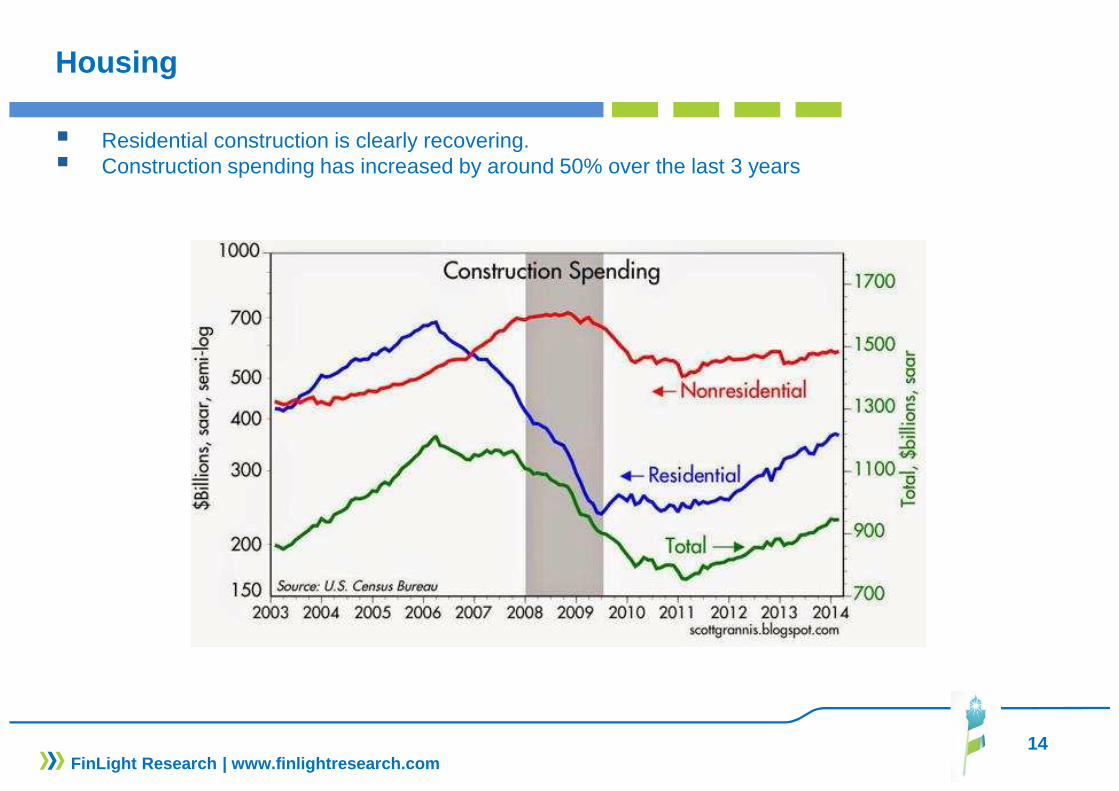
Housing
� Residential construction is clearly recovering. � Construction spending has increased by around 50% over the last 3 years
14FinLight Research | www.finlightresearch.com
15FinLight Research | www.finlightresearch.com
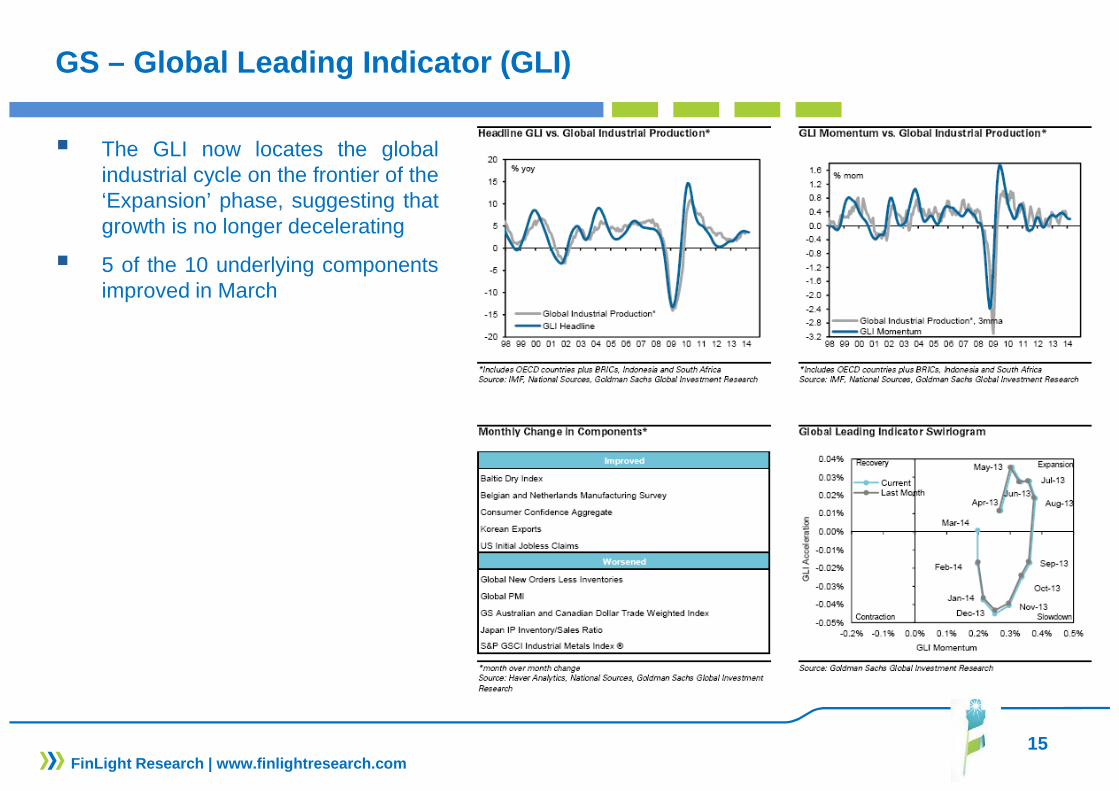
GS – Global Leading Indicator (GLI)
� The GLI now locates the globalindustrial cycle on the frontier of the‘Expansion’ phase, suggesting thatgrowth is no longer decelerating
� 5 of the 10 underlying componentsimproved in March
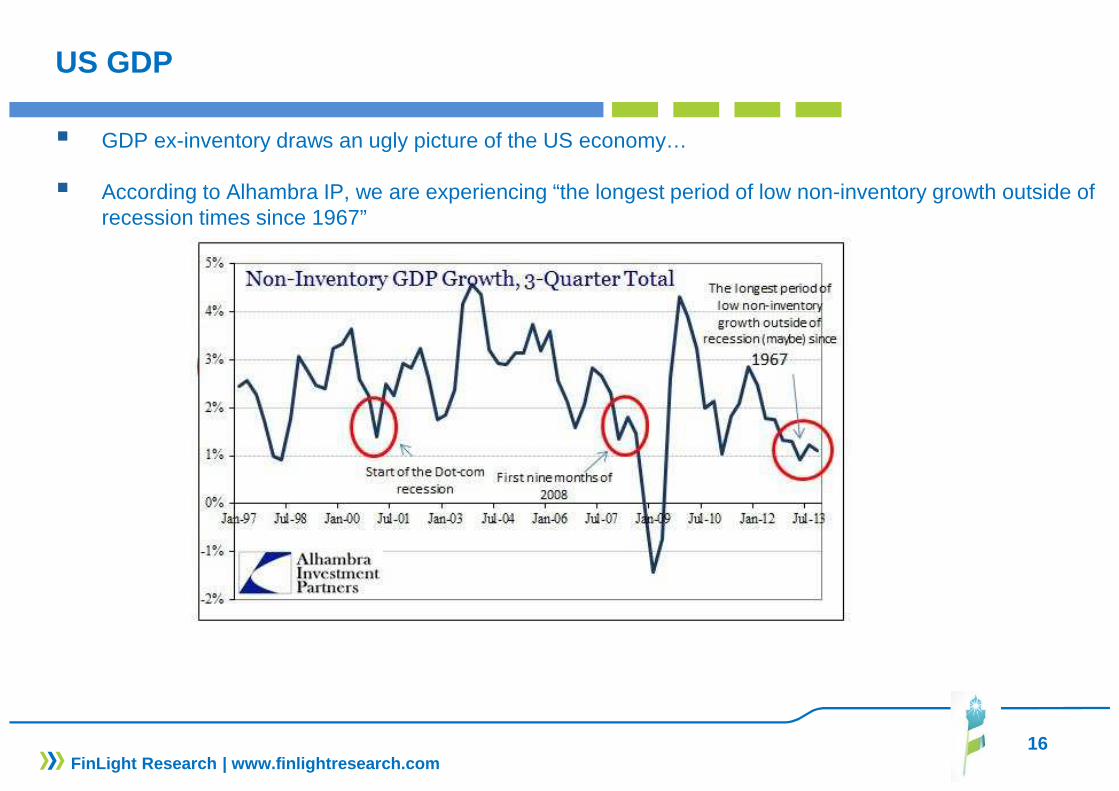
US GDP
� GDP ex-inventory draws an ugly picture of the US economy…
� According to Alhambra IP, we are experiencing “the longest period of low non-inventory growth outside of recession times since 1967”
16FinLight Research | www.finlightresearch.com
17FinLight Research | www.finlightresearch.com
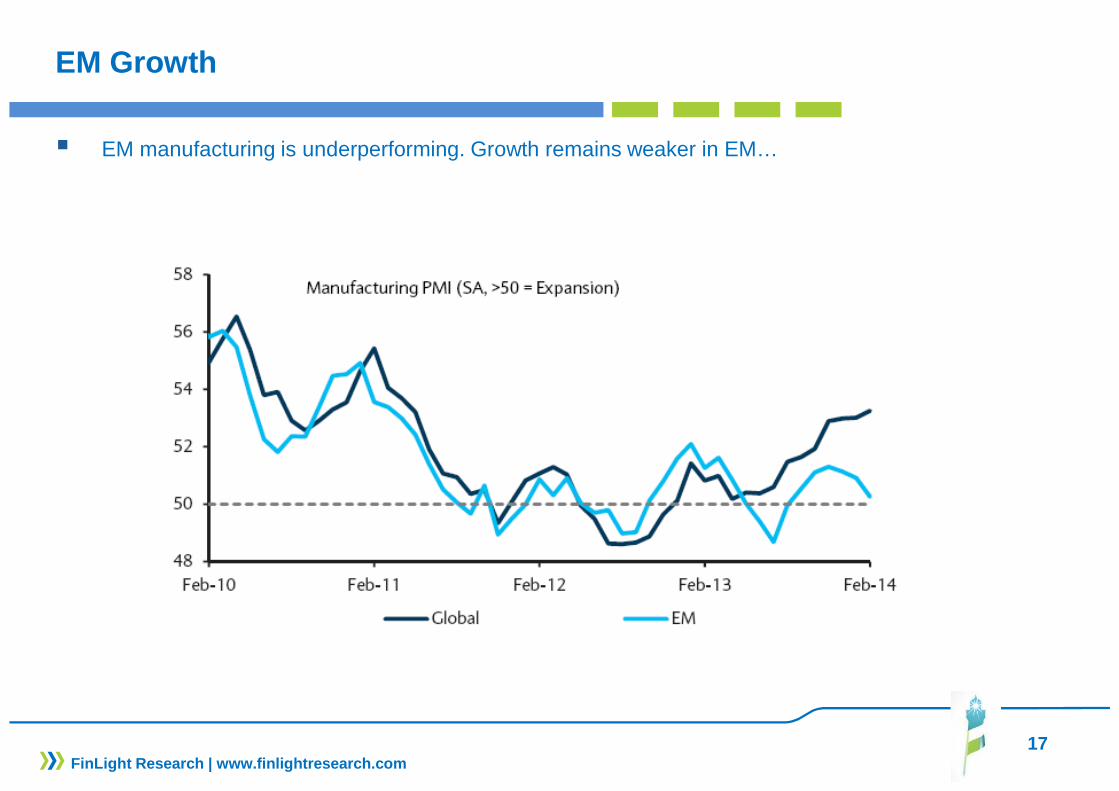
EM Growth
� EM manufacturing is underperforming. Growth remains weaker in EM…
18FinLight Research | www.finlightresearch.com
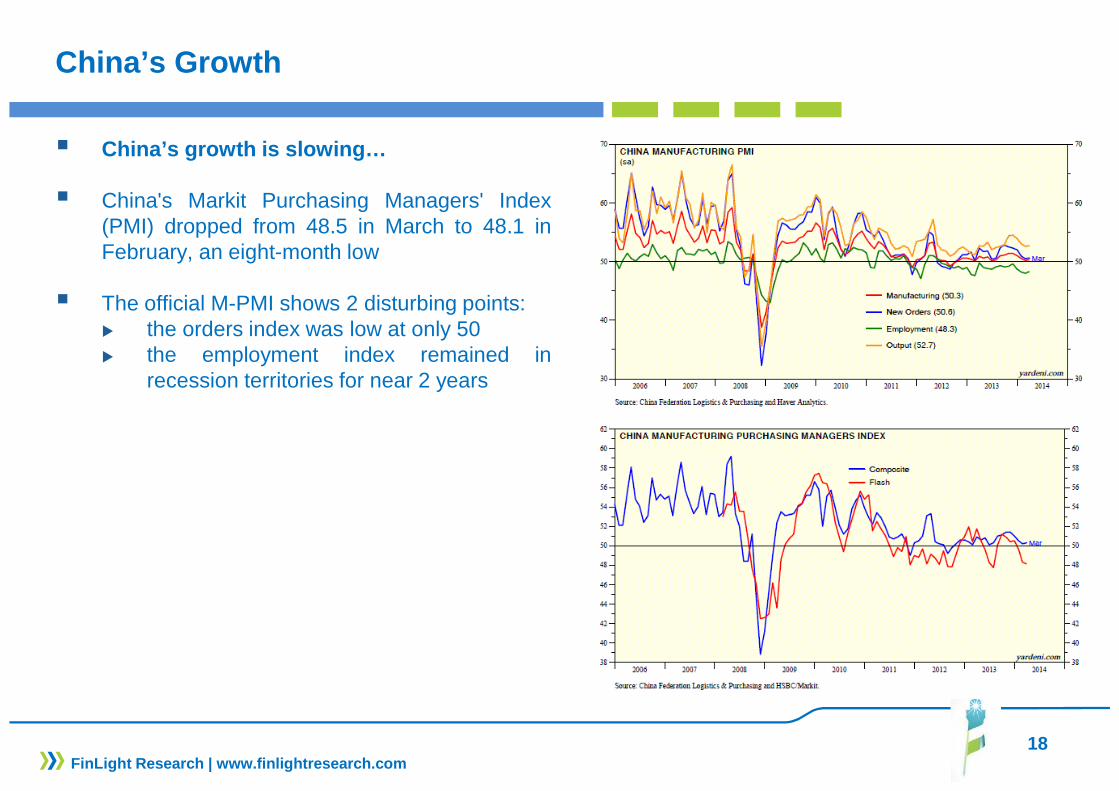
China’s Growth
� China’s growth is slowing…
� China's Markit Purchasing Managers' Index(PMI) dropped from 48.5 in March to 48.1 inFebruary, an eight-month low
� The official M-PMI shows 2 disturbing points:� the orders index was low at only 50� the employment index remained in
recession territories for near 2 years
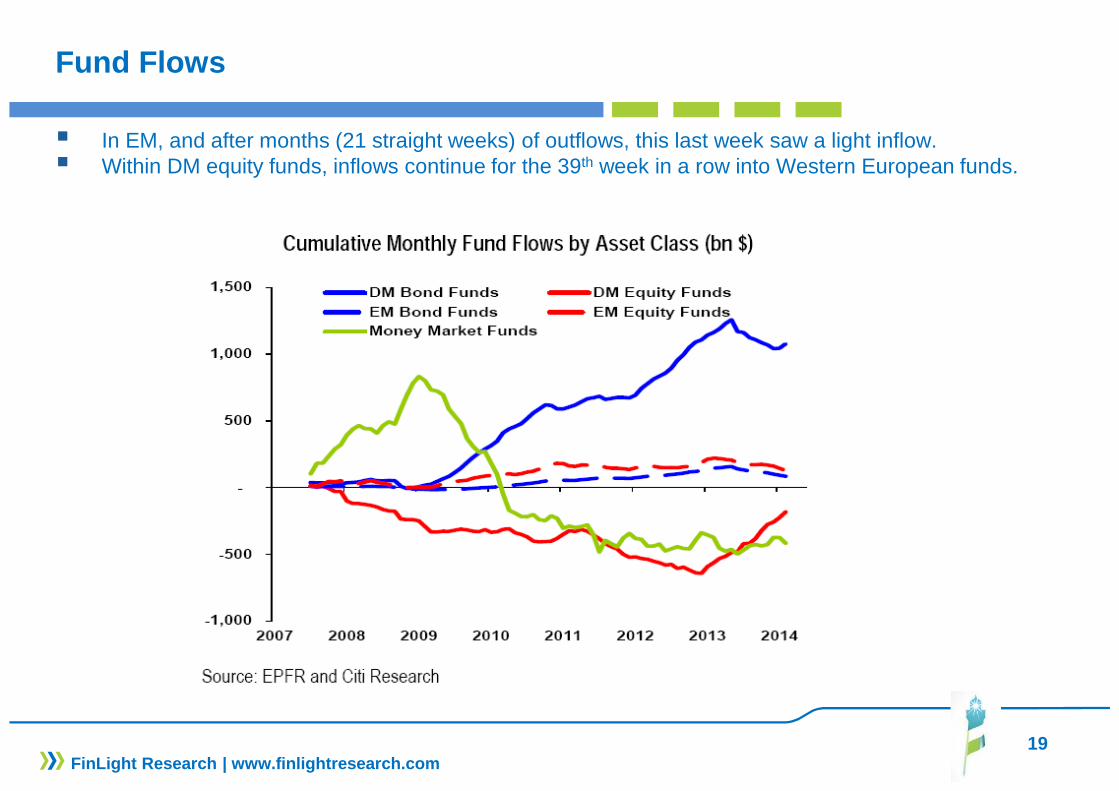
Fund Flows
� In EM, and after months (21 straight weeks) of outflows, this last week saw a light inflow.� Within DM equity funds, inflows continue for the 39th week in a row into Western European funds.
19FinLight Research | www.finlightresearch.com

20FinLight Research | www.finlightresearch.com
EQUITY
� Nothing new since our last update. Markets are back to their highs…The LT structure for the S&P500 still looks very bullish.
� Stocks are seen as the only asset class offering significant returns. But, market’s defensive attitude points to a possible correction
� Stocks are already discounting a benign environment and should go through a consolidation phase , unless a true growth surprise emerges
� Poor earnings revisions and rising bond yields are the headwinds we should care about.
� In our March report, we have been for a replay of the Jul/Aug 2013 episode with a pull back to the Jan. 15th high at 1,851 and even a break of this resistance. But the S&P500 stopped its downside around 1850. A clear break below 1850 would change the picture…
� We continue to think that any further upside on the S&P 500 should be driven by profit growth rather than P/E expansion
� Bottom line :
� We remain Neutral equities.
� We keep our UW on (deflationary) Europe and EM vs. US and Japan
� We keep our bias to defensive high-yielding stocks. A severe unwind appears to be underway in high-beta areas like Biotech and Social Media.

21FinLight Research | www.finlightresearch.com
Market Action / Breadth
� Large-cap stocks closed the month marginally higher, but US small-caps have had a hard month.� A severe unwind appears to be underway in high-beta areas like Biotech and Social Media. � On the other hand, defensive stocks remain well-bid, like USTs (despite all the talk about the end of
QE)
� Market’s defensive attitude points to a possible co rrection
� Stock market breadth is declining…� Markets appears to be driven higher by fewer and fewer stocks. Usually, this is the signature of a
major market top.� Unlike the previous rallies where participation approached 90%, less than 75% of stocks are above
their 200 day MA.
� Stocks are on the high side of fair value at this p oint but not into bubble territory yet.
22FinLight Research | www.finlightresearch.com
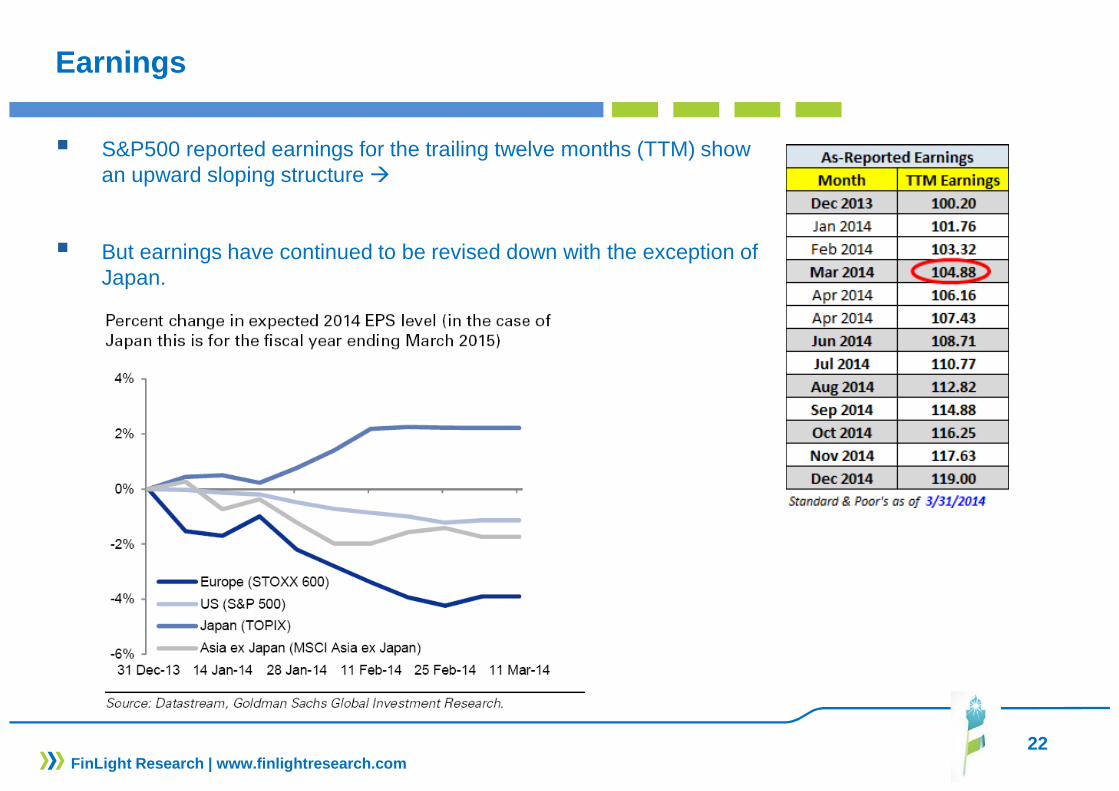
Earnings
� S&P500 reported earnings for the trailing twelve months (TTM) show an upward sloping structure �
� But earnings have continued to be revised down with the exception of Japan.

23FinLight Research | www.finlightresearch.com
Earnings
� According to John Butters, senior earnings analyst at FactSet, 93 out of the 111 companies in the S&P 500 that have issued an earnings outlook for the first quarter have guided below consensus estimate.
� This is the second highest level of negative guidance ever recorded (since 2006)
24FinLight Research | www.finlightresearch.com
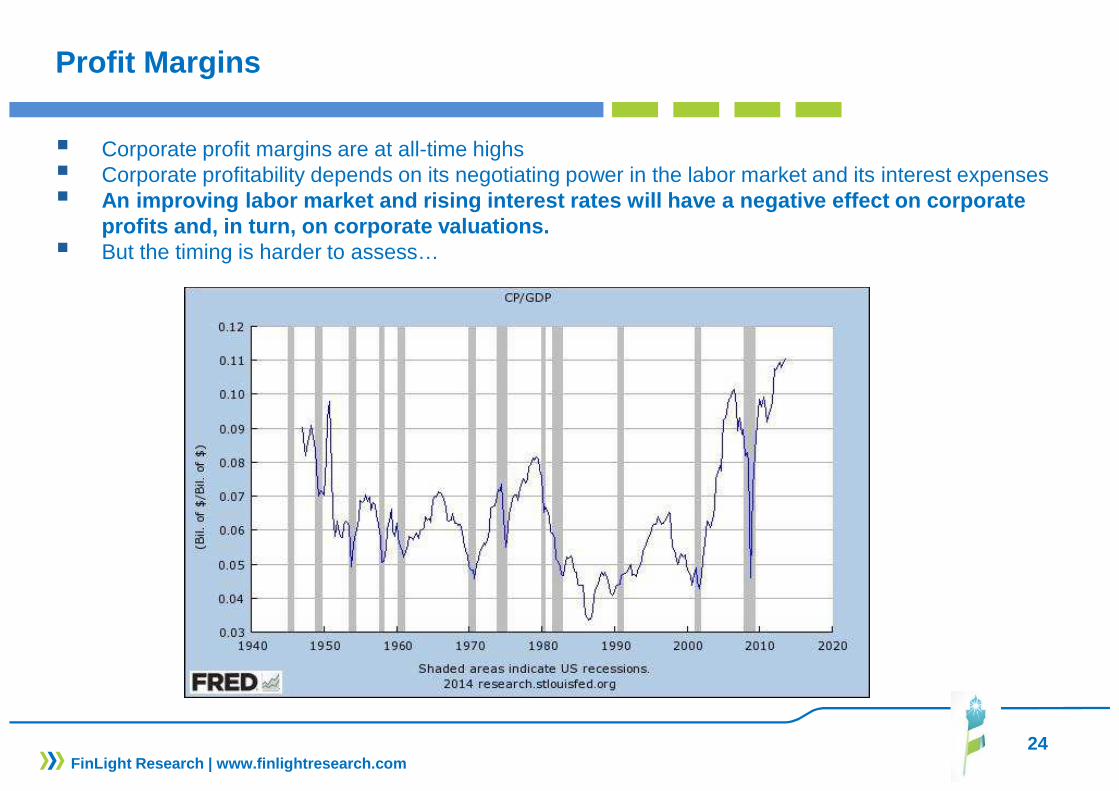
Profit Margins
� Corporate profit margins are at all-time highs � Corporate profitability depends on its negotiating power in the labor market and its interest expenses� An improving labor market and rising interest rates will have a negative effect on corporate
profits and, in turn, on corporate valuations.� But the timing is harder to assess…
25FinLight Research | www.finlightresearch.com
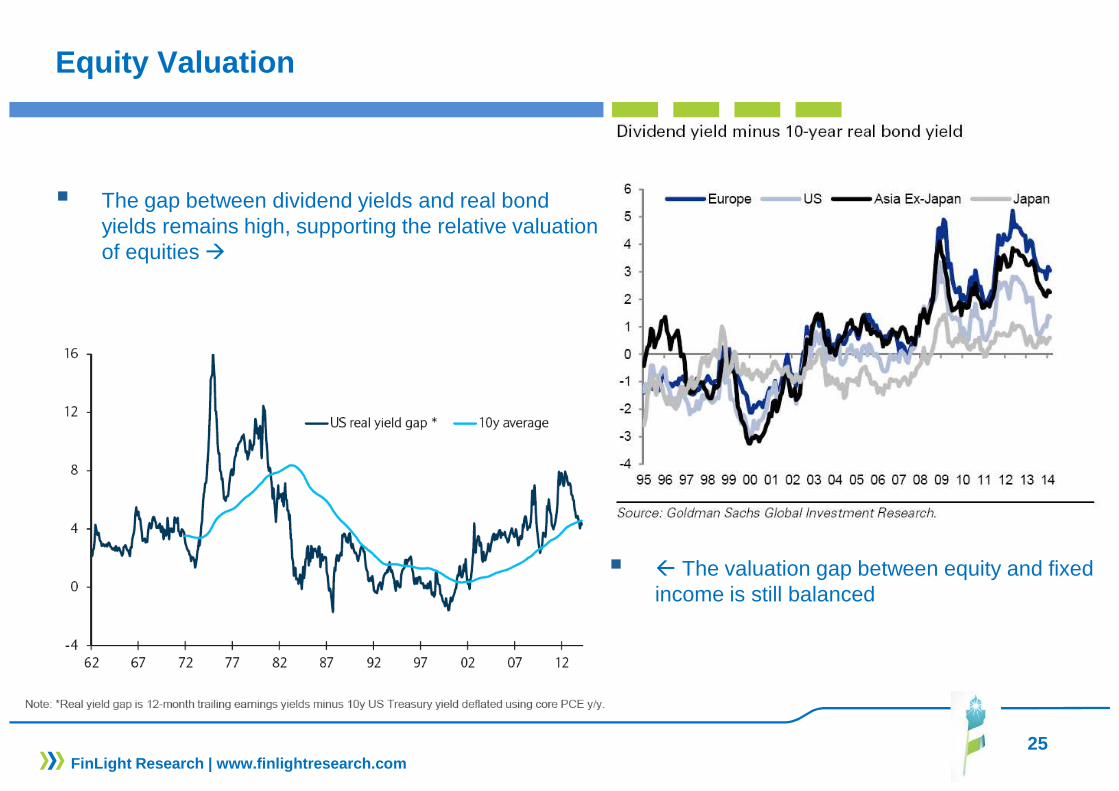
Equity Valuation
� The gap between dividend yields and real bond yields remains high, supporting the relative valuation of equities �
� � The valuation gap between equity and fixed income is still balanced
26FinLight Research | www.finlightresearch.com
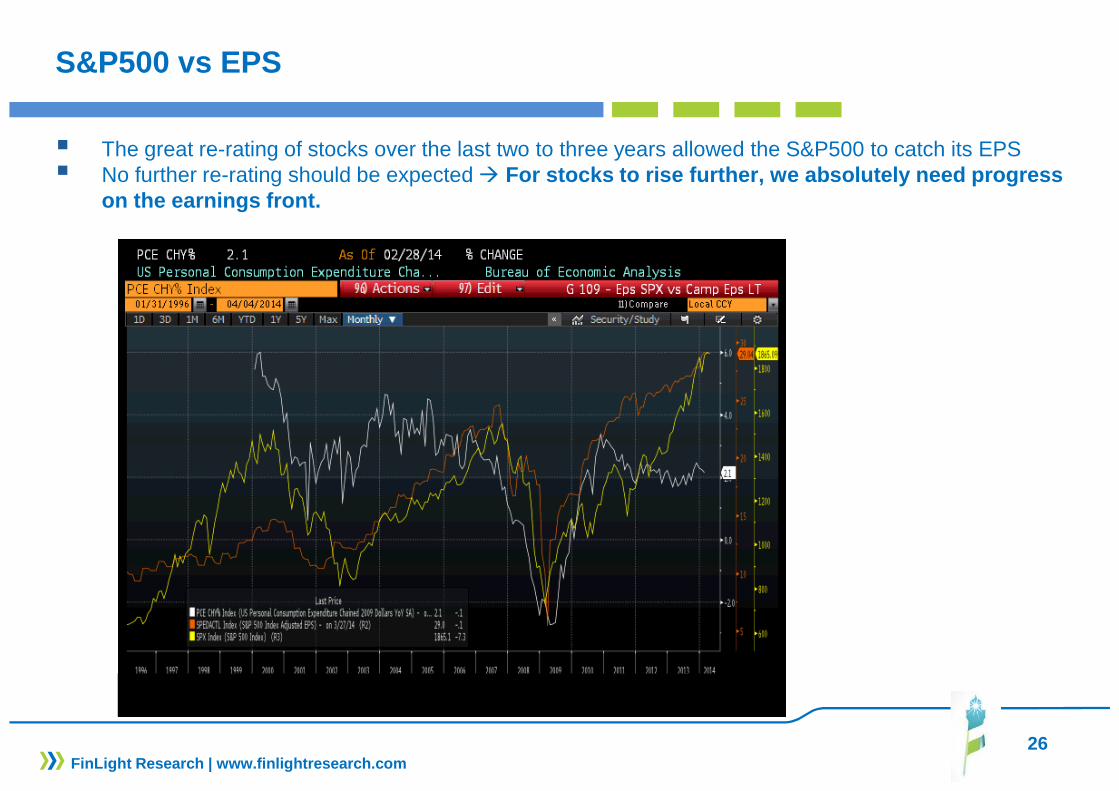
S&P500 vs EPS
� The great re-rating of stocks over the last two to three years allowed the S&P500 to catch its EPS� No further re-rating should be expected � For stocks to rise further, we absolutely need progr ess
on the earnings front.
27FinLight Research | www.finlightresearch.com
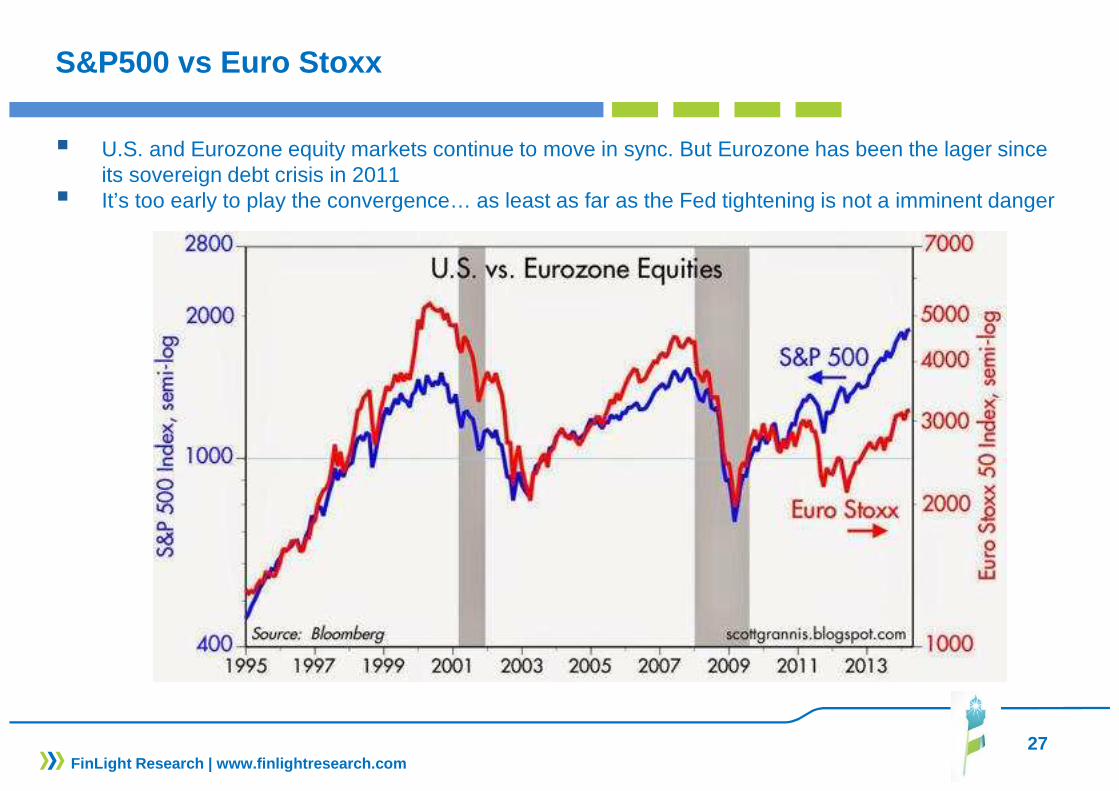
S&P500 vs Euro Stoxx
� U.S. and Eurozone equity markets continue to move in sync. But Eurozone has been the lager since its sovereign debt crisis in 2011
� It’s too early to play the convergence… as least as far as the Fed tightening is not a imminent danger
28FinLight Research | www.finlightresearch.com
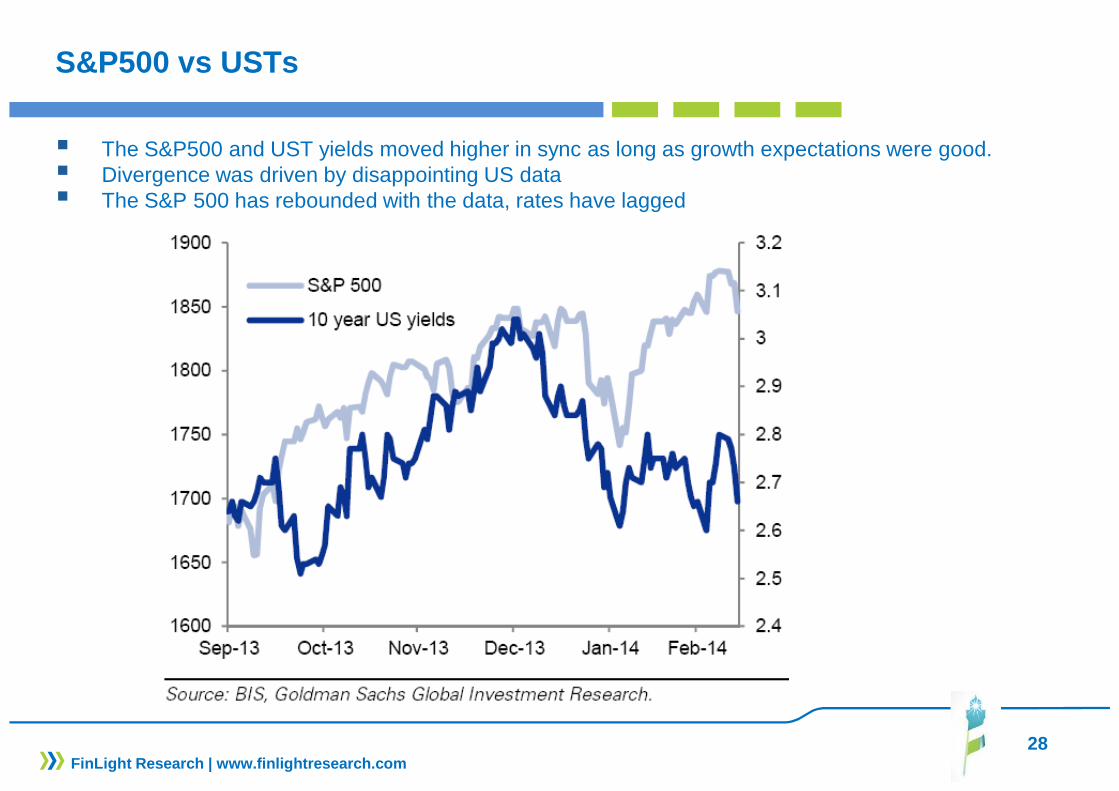
S&P500 vs USTs
� The S&P500 and UST yields moved higher in sync as long as growth expectations were good.� Divergence was driven by disappointing US data� The S&P 500 has rebounded with the data, rates have lagged
29FinLight Research | www.finlightresearch.com
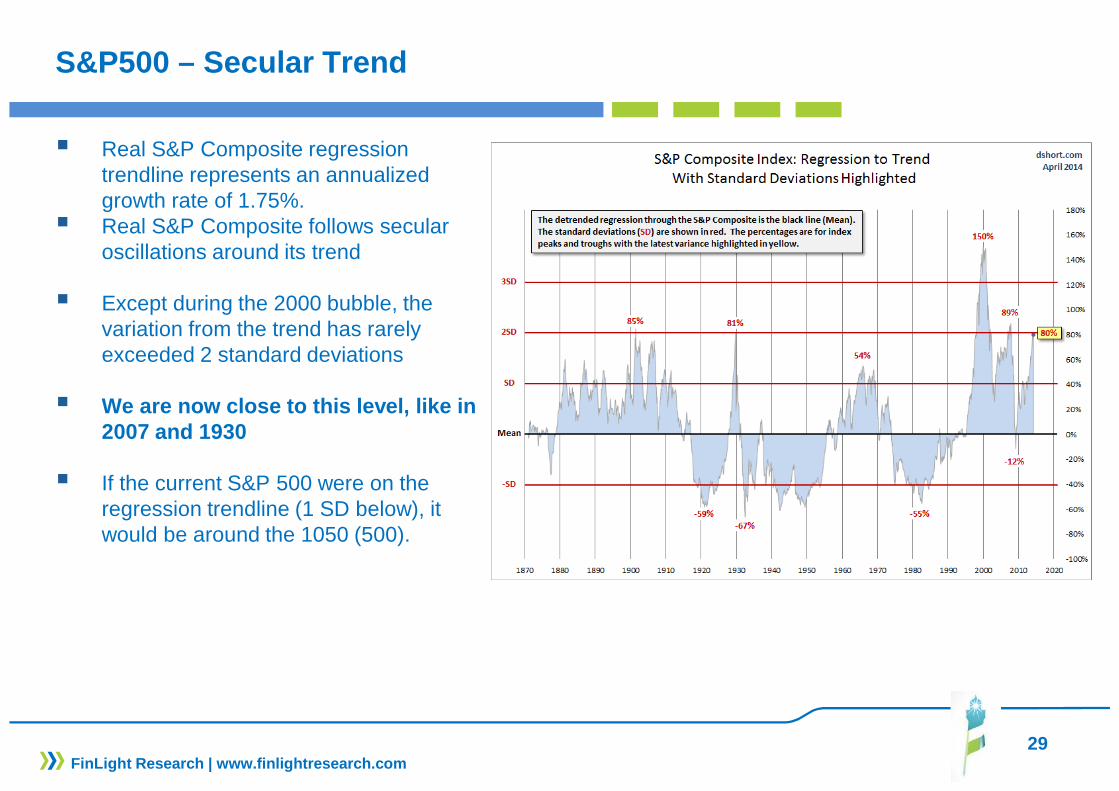
S&P500 – Secular Trend
� Real S&P Composite regression trendline represents an annualized growth rate of 1.75%.
� Real S&P Composite follows secular oscillations around its trend
� Except during the 2000 bubble, the variation from the trend has rarely exceeded 2 standard deviations
� We are now close to this level, like in 2007 and 1930
� If the current S&P 500 were on the regression trendline (1 SD below), it would be around the 1050 (500).

30FinLight Research | www.finlightresearch.com
S&P500 – Secular Trend
� At 25, P/E10 ratio is at the highest level since Dec. 2007.� P/E10 ratio stands above the 90th percentile of the time series since 1880!
31FinLight Research | www.finlightresearch.com
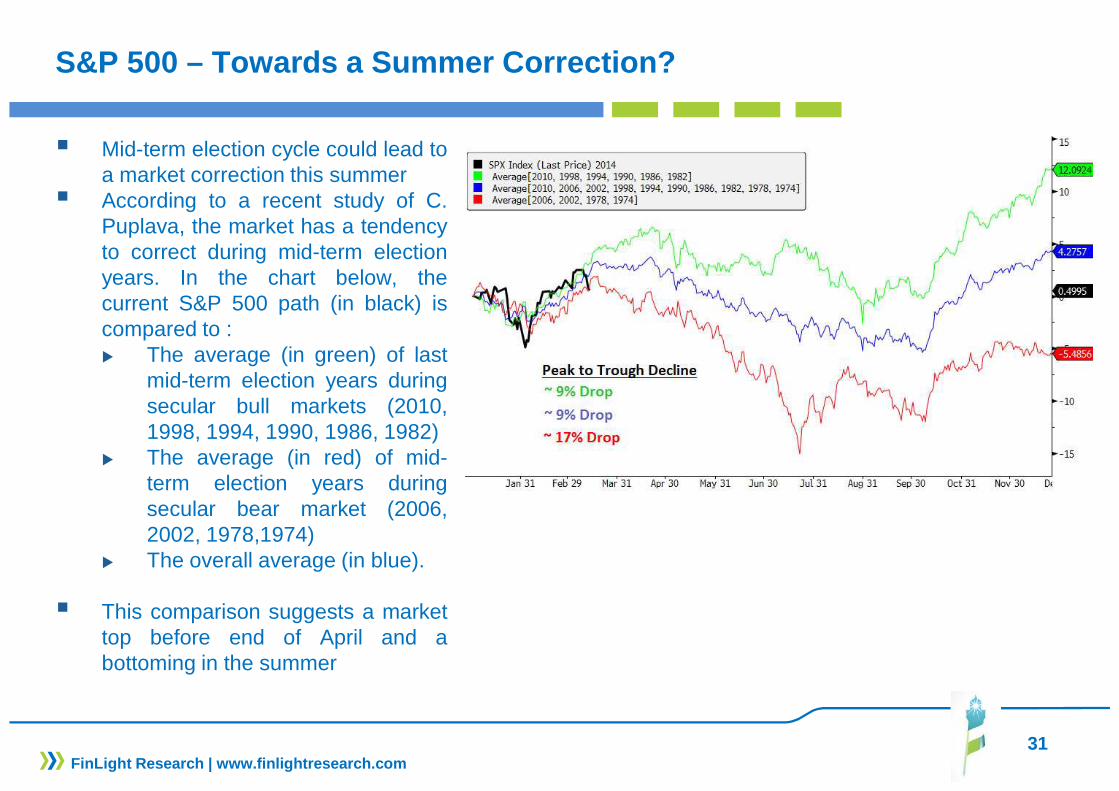
S&P 500 – Towards a Summer Correction?
� Mid-term election cycle could lead toa market correction this summer
� According to a recent study of C.Puplava, the market has a tendencyto correct during mid-term electionyears. In the chart below, thecurrent S&P 500 path (in black) iscompared to :� The average (in green) of last
mid-term election years duringsecular bull markets (2010,1998, 1994, 1990, 1986, 1982)
� The average (in red) of mid-term election years duringsecular bear market (2006,2002, 1978,1974)
� The overall average (in blue).
� This comparison suggests a markettop before end of April and abottoming in the summer
32FinLight Research | www.finlightresearch.com
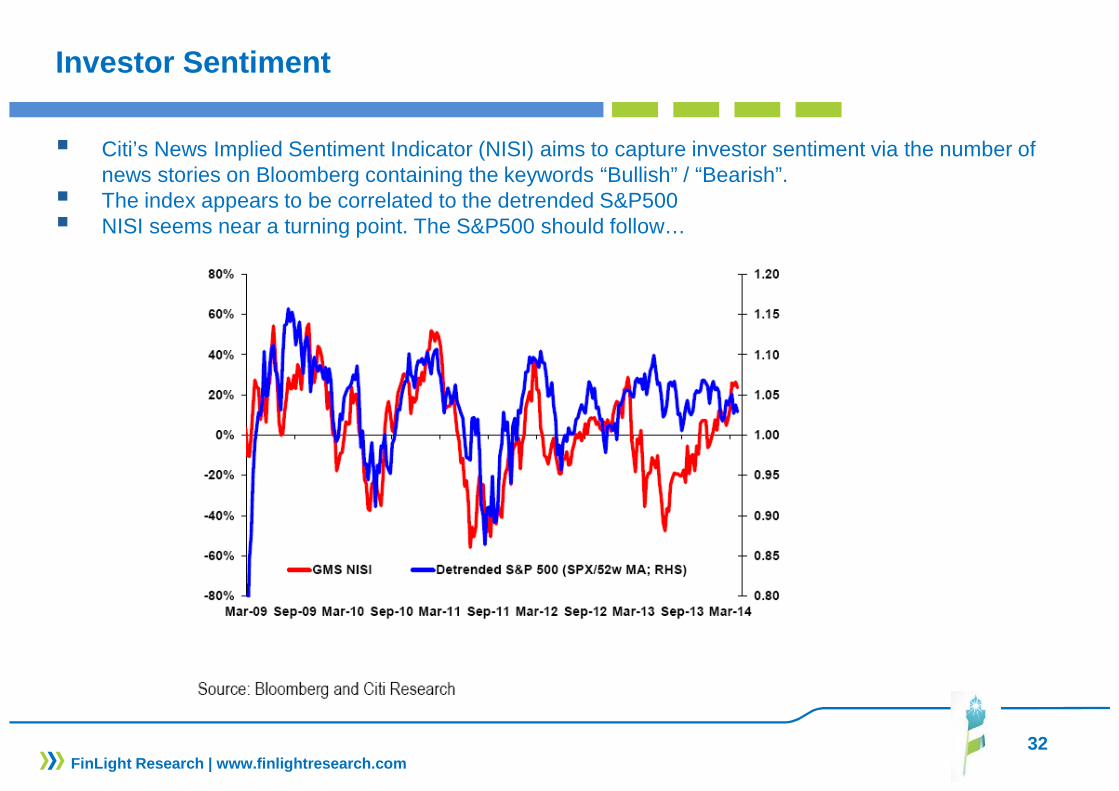
Investor Sentiment
� Citi’s News Implied Sentiment Indicator (NISI) aims to capture investor sentiment via the number of news stories on Bloomberg containing the keywords “Bullish” / “Bearish”.
� The index appears to be correlated to the detrended S&P500� NISI seems near a turning point. The S&P500 should follow…
33FinLight Research | www.finlightresearch.com
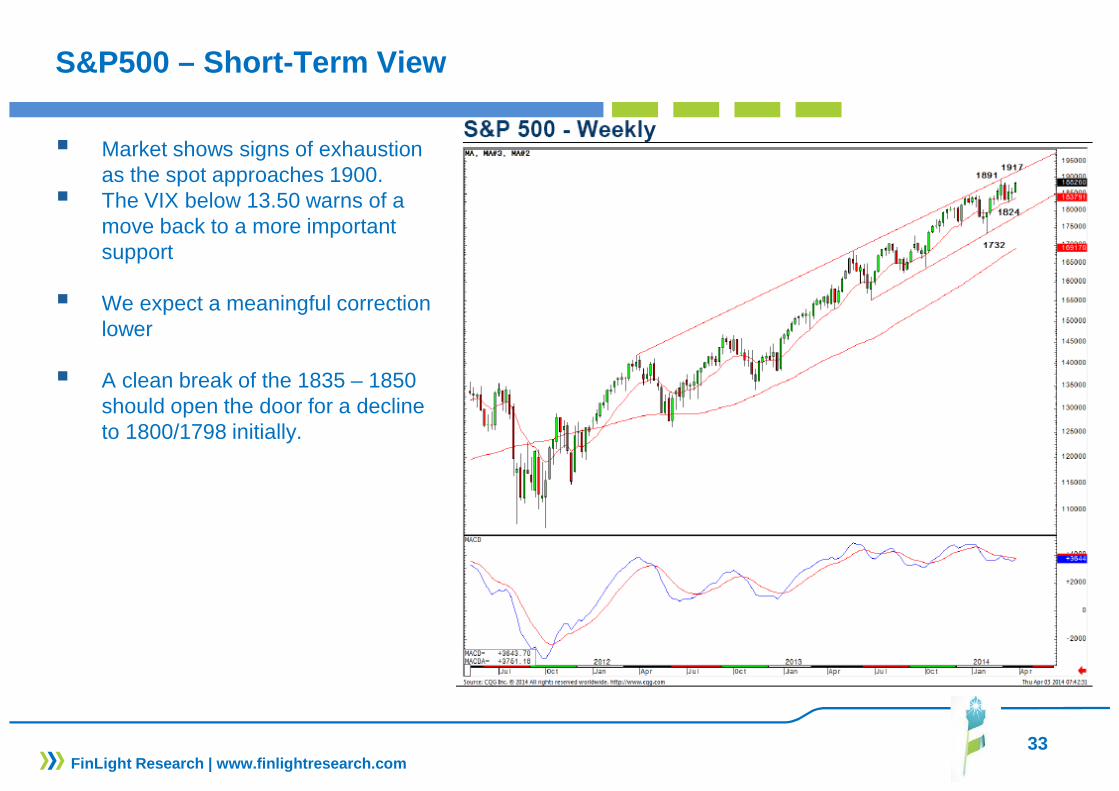
S&P500 – Short-Term View
� Market shows signs of exhaustion as the spot approaches 1900.
� The VIX below 13.50 warns of a move back to a more important support
� We expect a meaningful correction lower
� A clean break of the 1835 – 1850 should open the door for a decline to 1800/1798 initially.
34FinLight Research | www.finlightresearch.com
S&P 500 – The Donchian Channel
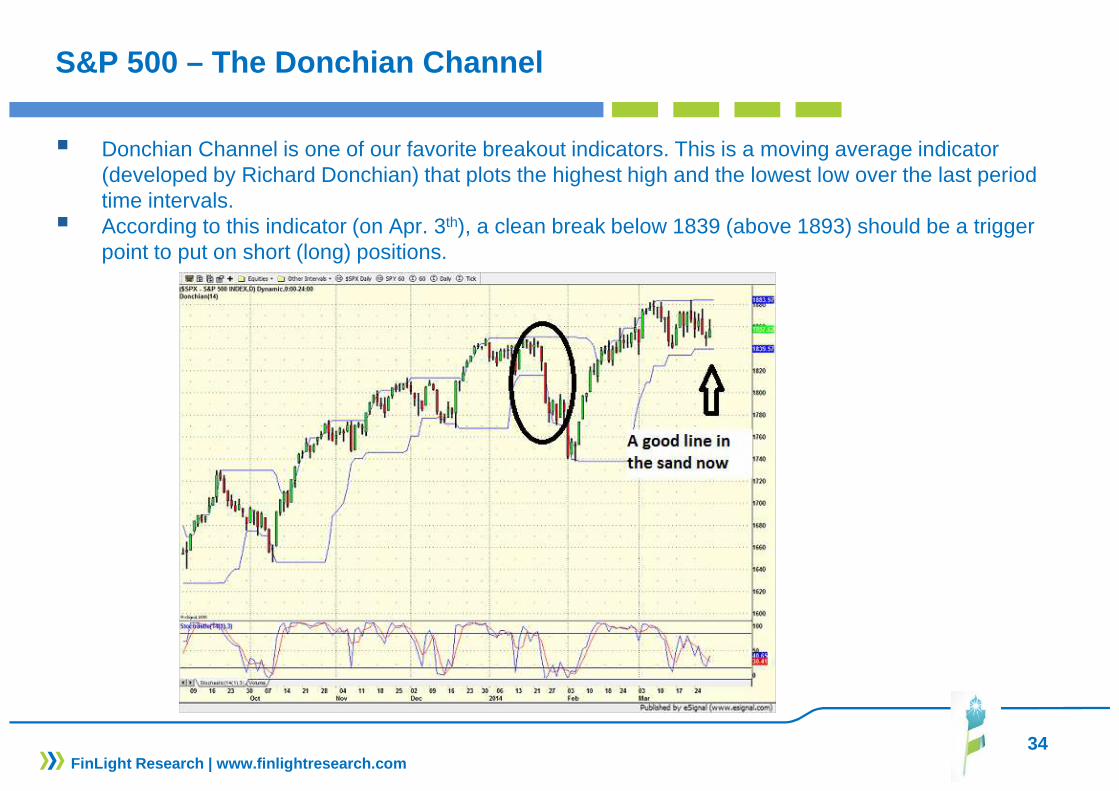
� Donchian Channel is one of our favorite breakout indicators. This is a moving average indicator (developed by Richard Donchian) that plots the highest high and the lowest low over the last period time intervals.
� According to this indicator (on Apr. 3th), a clean break below 1839 (above 1893) should be a trigger point to put on short (long) positions.

35FinLight Research | www.finlightresearch.com
EM Equities
� EM stocks look linked to growth stabilization / rebound in China, and should benefit from the countercyclical policy of Chinese authorities.
� So far, EM equities are priced for weak Chinese growth
36FinLight Research | www.finlightresearch.com
EM Equities
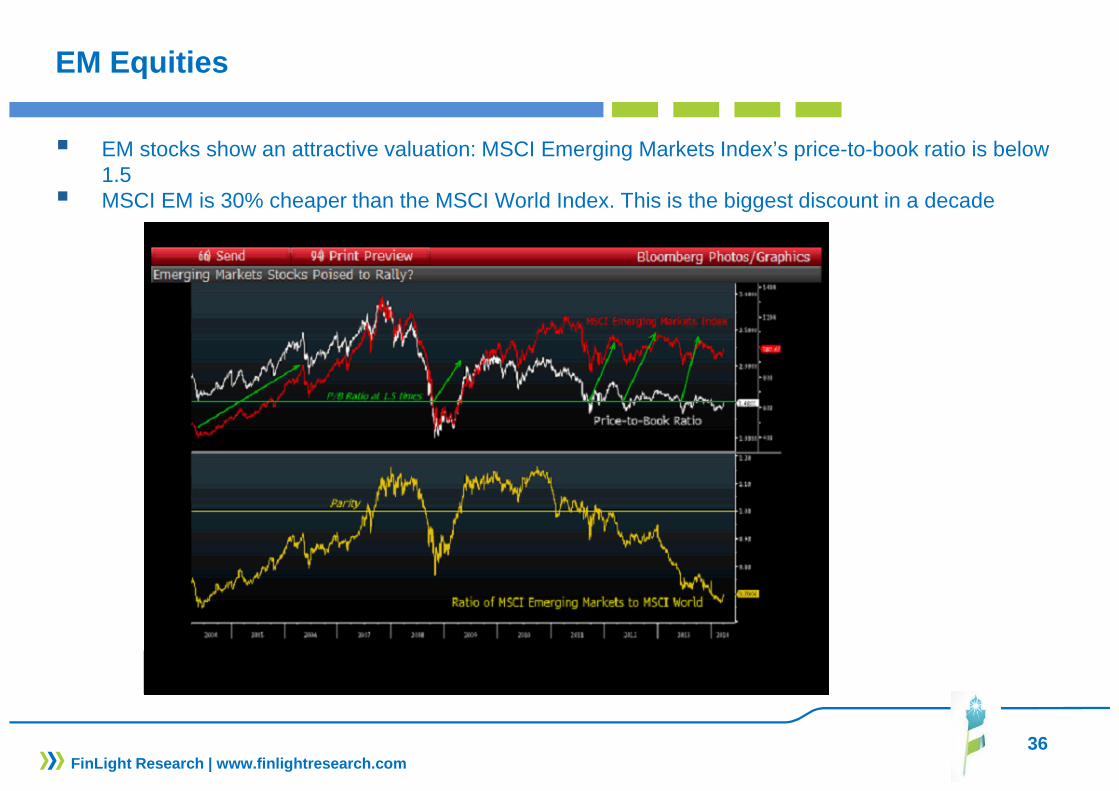
� EM stocks show an attractive valuation: MSCI Emerging Markets Index’s price-to-book ratio is below 1.5
� MSCI EM is 30% cheaper than the MSCI World Index. This is the biggest discount in a decade
37FinLight Research
Risk Aversion
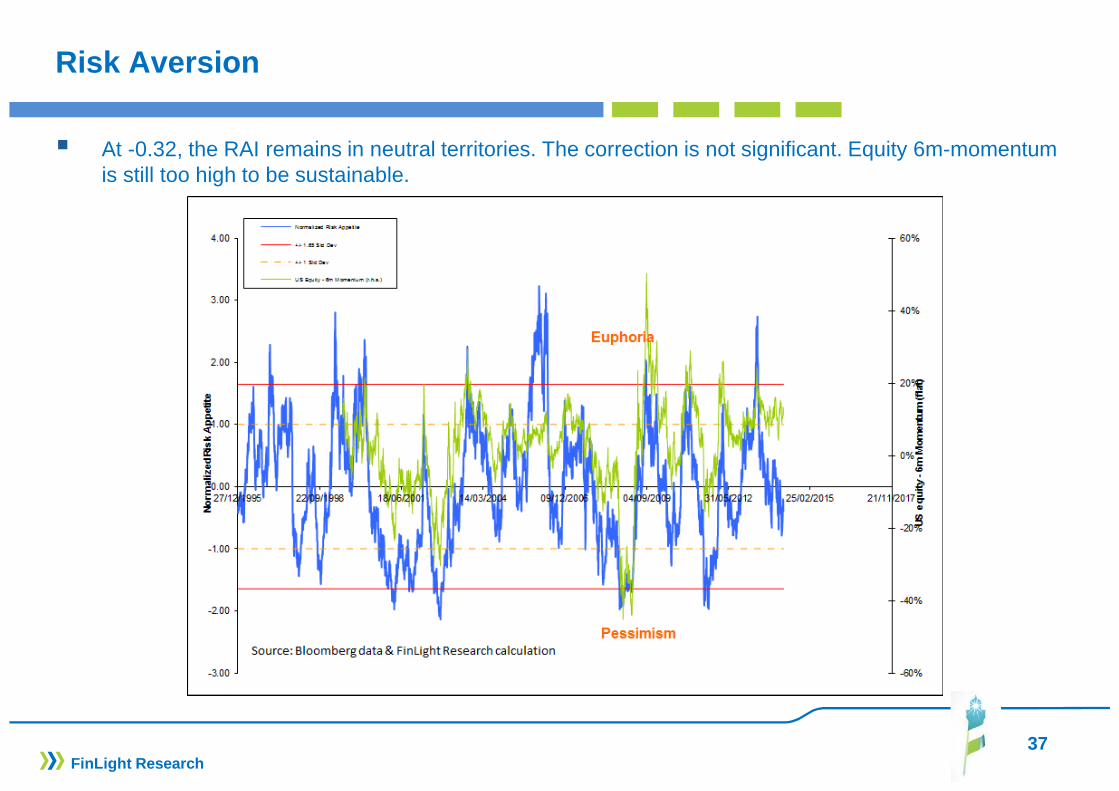
� At -0.32, the RAI remains in neutral territories. The correction is not significant. Equity 6m-momentum is still too high to be sustainable.
38
FIXED INCOME & CREDIT
� In Govies, we keep our core strategic view for high er long-end yields going forward, especially in US and UK .
� Turmoil in Emerging Markets and geopolitical risks continued to provide support for DM fixed income through flight to quality flows. But, we expect the selloff on Treasuries to resume very soon.
� We keep our short positioning on UST
� We continue to OW Eurozone vs. US and UK given disinflationary risks in Europe.
� Within the Eurozone, we stay neutral Peripheral vs Core as we see lasting spread compression to be very limited if any.
� We stay neutral on TIPS but go short 5yx5y Eurozone inflation as a hedge against the risk of Eurozone deflation.
� As a tail hedge, we keep our 10y bund swap spread receiver swap
FinLight Research | www.finlightresearch.com

39
FIXED INCOME & CREDIT
� In corporate credit, we think that investors become less risk averse and more prone to seeking out risk on the margin. Investors continue to move down in quality in search for higher returns.
� The search-for-yield is likely to remain strong and may push spreads a bit tighter over the rest of the year. But the risk of a liquidity shock is significant.
� Given the rising government bond yields, we choose to stay Neutral (but may move to UW very soon) on credit as a whole .
� Regionally, we are Neutral between the US and Europ e. European credit has a much stronger potential for returns but this is mainly due to its much higher exposure to banks and peripheral credit.
� Main change in our views: On a risk-adjusted basis, we now prefer IG over HY. According to our Fair Value Spread Model, the compensation for risk looks now more attractive for IG (versus HY) where spreads are considerably wider than pre-GFC.
� We see value in EM external debt compared to US cor porate credit, especially on some single names (Brazil, Indonesia…) that should benefit from improving macro and rotation out of Russia.
� Bottom line : Still UW Govies, Neutral credit, neutral TIPS, become UW High Yield vs High Grade
FinLight Research | www.finlightresearch.com

40
Peripheral Europe FI
� Peripheral Europe sovereign debt is outperforming BBB EM sovereigns.� Yield on Spanish debt is at parity with USTs for the first time, the least since October 2007.
FinLight Research | www.finlightresearch.com
41
UST Speculative Positioning
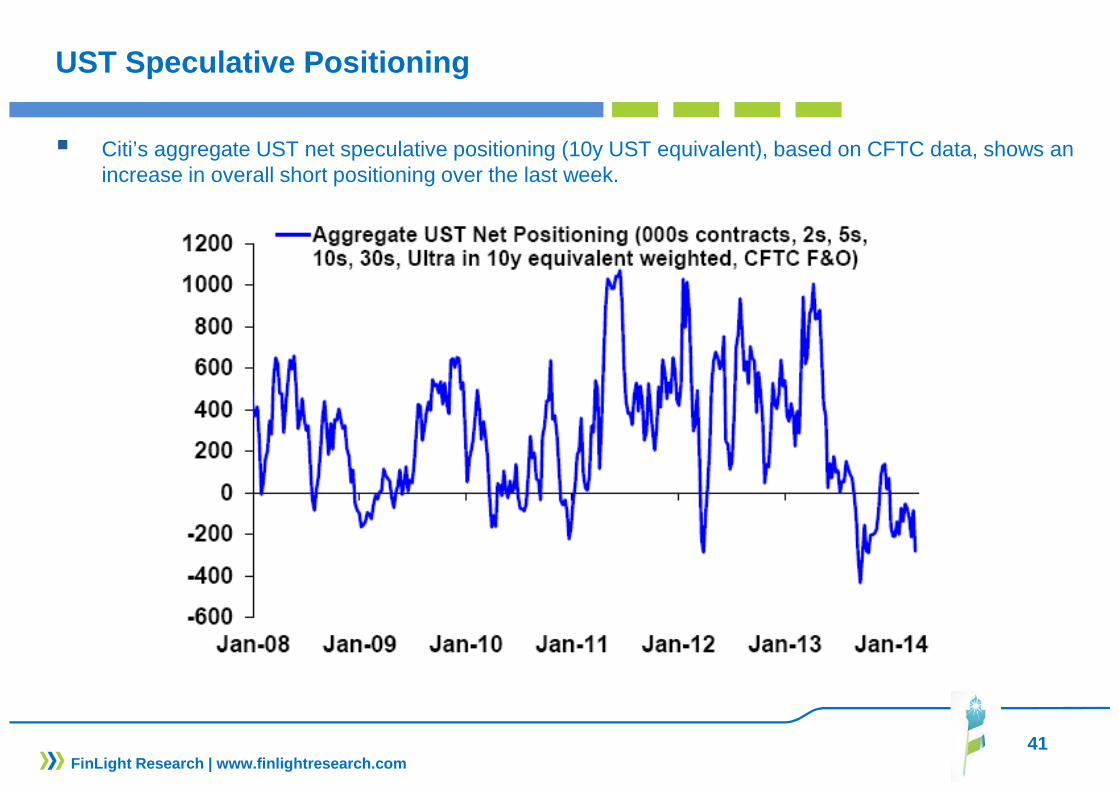
� Citi’s aggregate UST net speculative positioning (10y UST equivalent), based on CFTC data, shows an increase in overall short positioning over the last week.
FinLight Research | www.finlightresearch.com
42
Eurozone Inflation
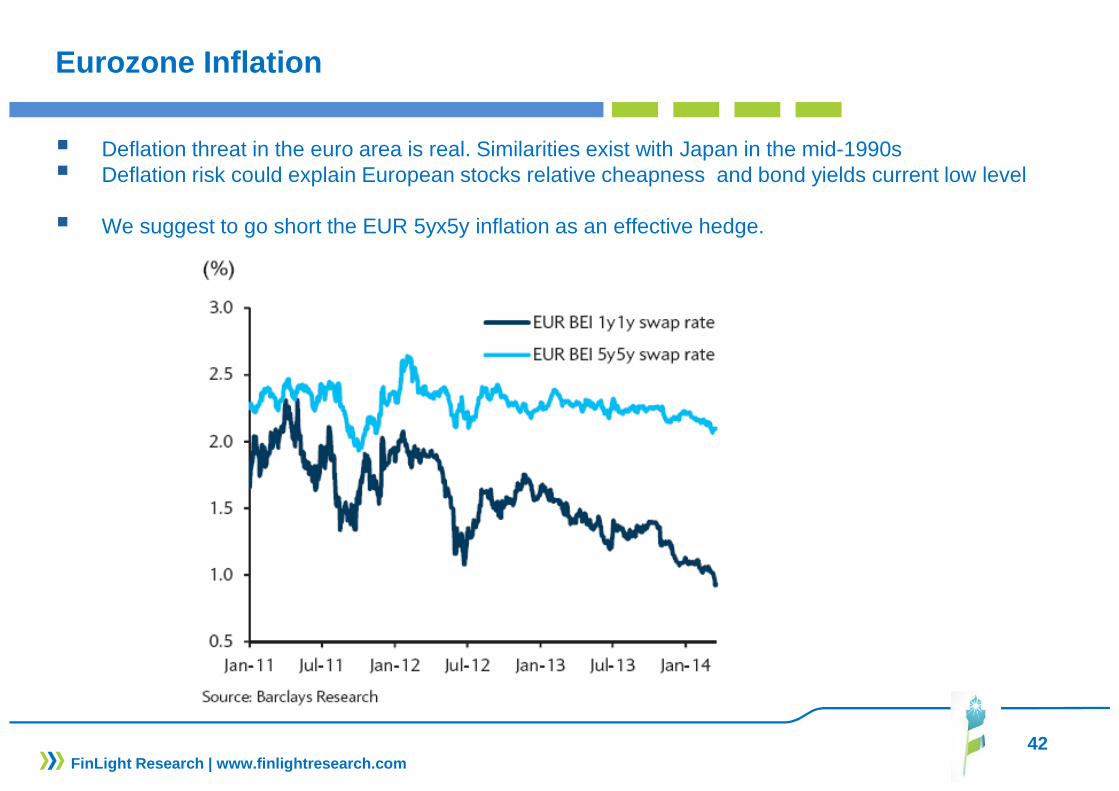
� Deflation threat in the euro area is real. Similarities exist with Japan in the mid-1990s� Deflation risk could explain European stocks relative cheapness and bond yields current low level
� We suggest to go short the EUR 5yx5y inflation as an effective hedge.
FinLight Research | www.finlightresearch.com
43
Corporate Credit
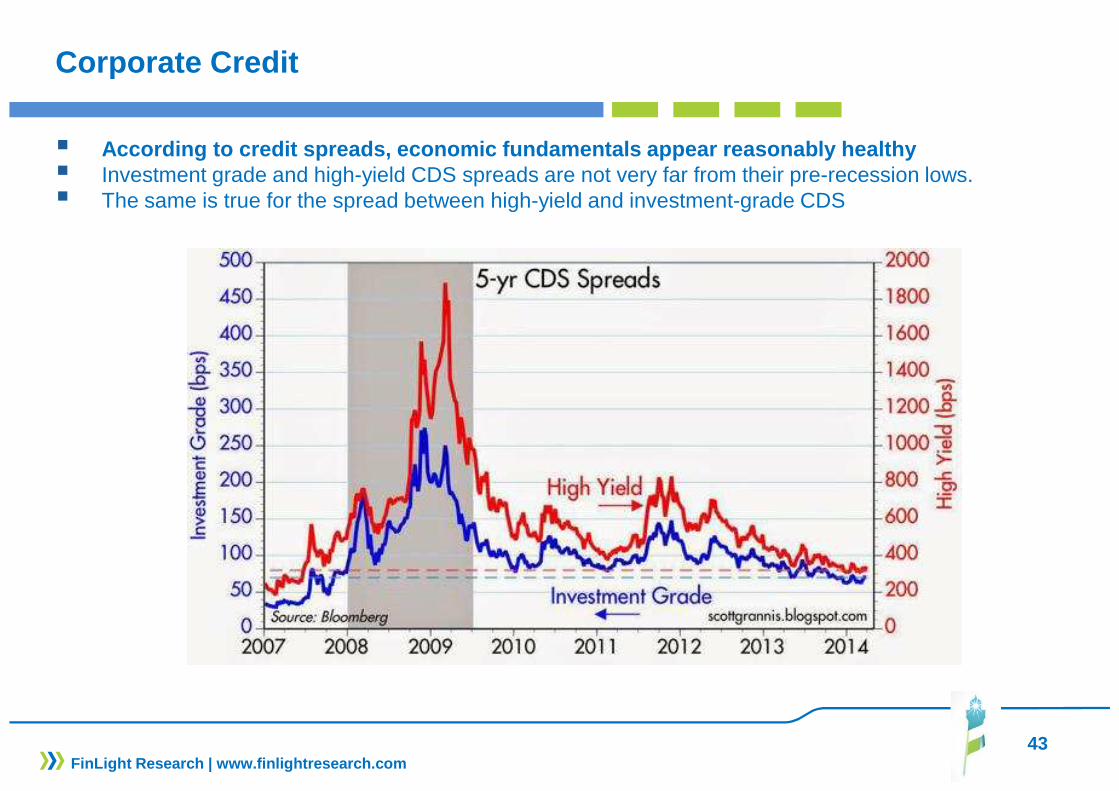
� According to credit spreads, economic fundamentals appear reasonably healthy� Investment grade and high-yield CDS spreads are not very far from their pre-recession lows.� The same is true for the spread between high-yield and investment-grade CDS
FinLight Research | www.finlightresearch.com
44
Financials Credit
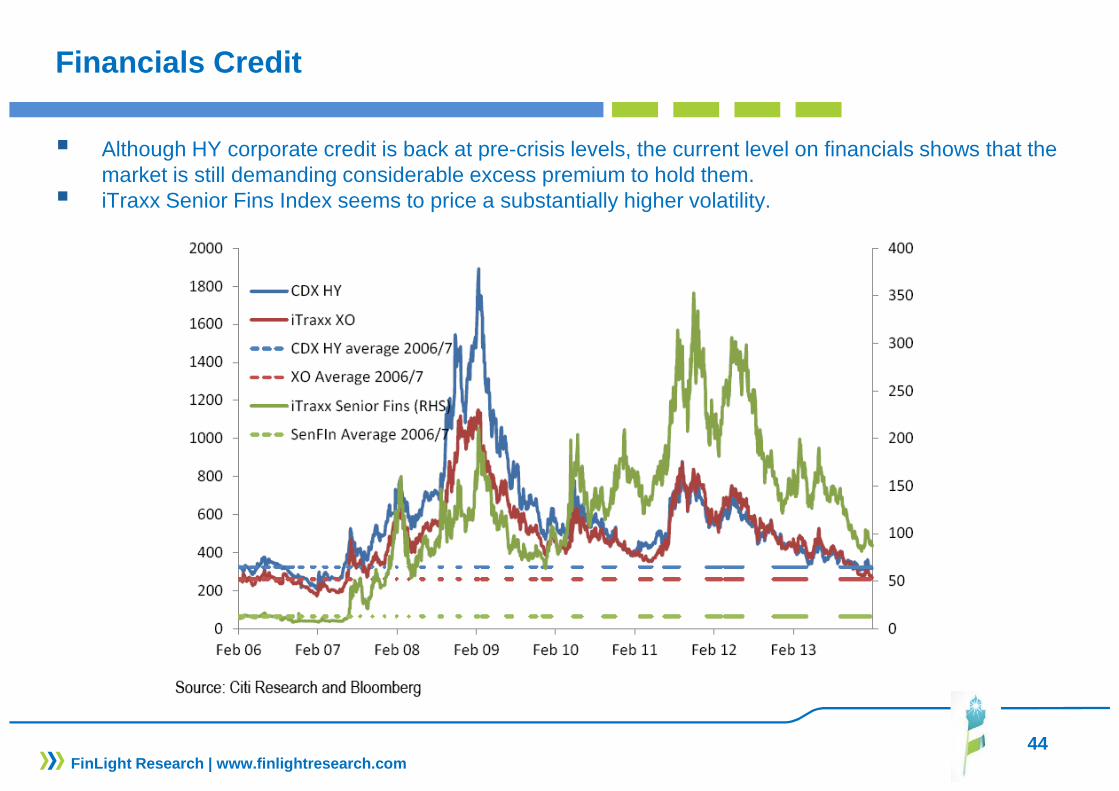
� Although HY corporate credit is back at pre-crisis levels, the current level on financials shows that the market is still demanding considerable excess premium to hold them.
� iTraxx Senior Fins Index seems to price a substantially higher volatility.
FinLight Research | www.finlightresearch.com
45
Trend in High Yield Issuance
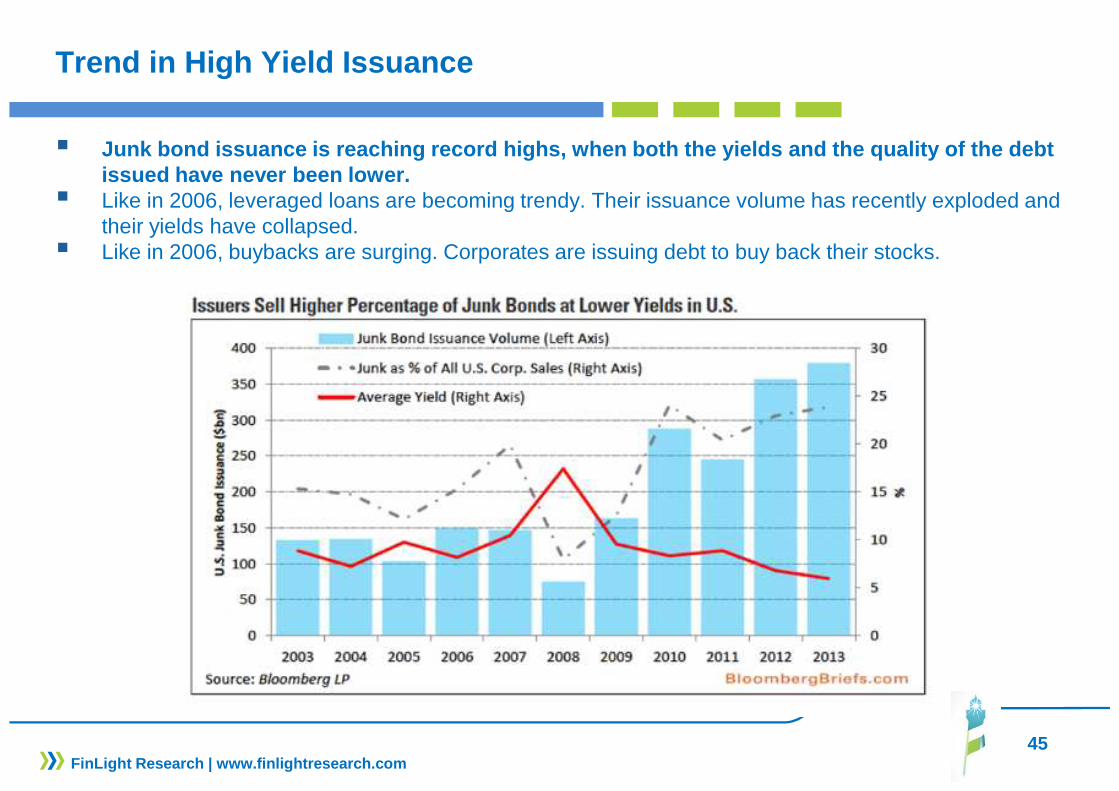
� Junk bond issuance is reaching record highs, when b oth the yields and the quality of the debt issued have never been lower.
� Like in 2006, leveraged loans are becoming trendy. Their issuance volume has recently exploded and their yields have collapsed.
� Like in 2006, buybacks are surging. Corporates are issuing debt to buy back their stocks.
FinLight Research | www.finlightresearch.com
46
Corporate Balance Sheet
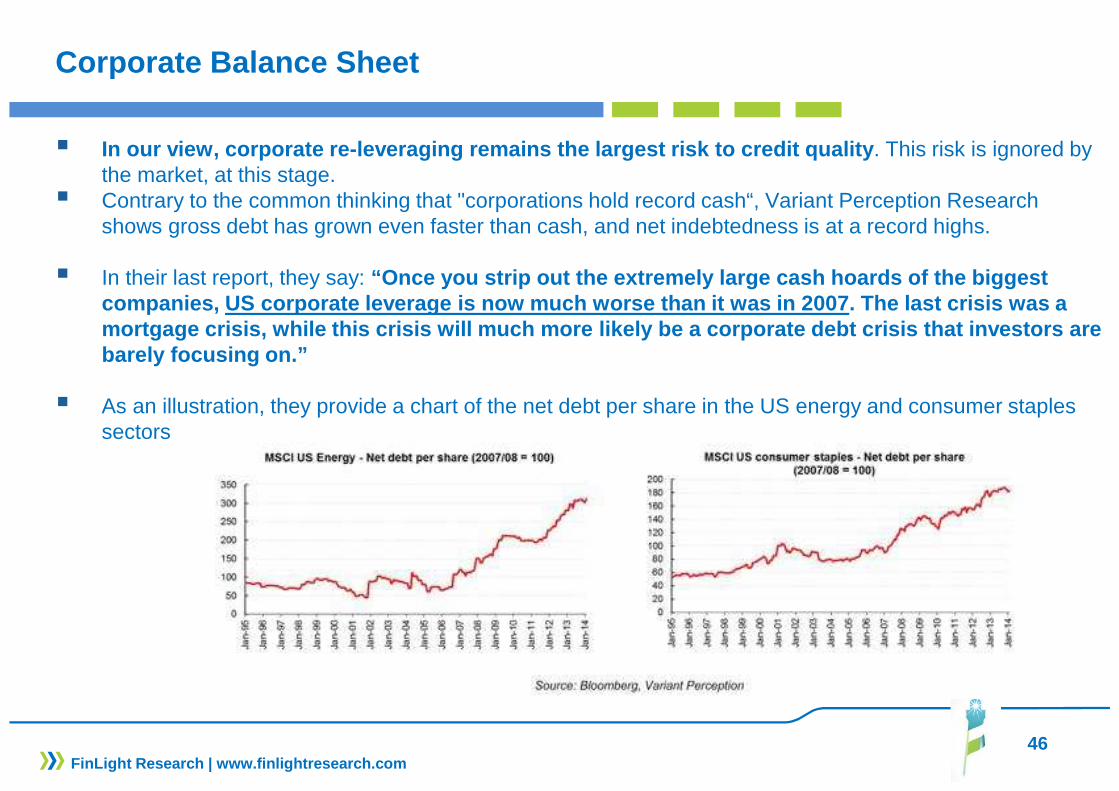
� In our view, corporate re-leveraging remains the la rgest risk to credit quality . This risk is ignored by the market, at this stage.
� Contrary to the common thinking that "corporations hold record cash“, Variant Perception Research shows gross debt has grown even faster than cash, and net indebtedness is at a record highs.
� In their last report, they say: “Once you strip out the extremely large cash hoards of the biggest companies, US corporate leverage is now much worse than it was in 2007. The last crisis was a mortgage crisis, while this crisis will much more l ikely be a corporate debt crisis that investors are barely focusing on.”
� As an illustration, they provide a chart of the net debt per share in the US energy and consumer staples sectors
FinLight Research | www.finlightresearch.com
47
CDS Positioning
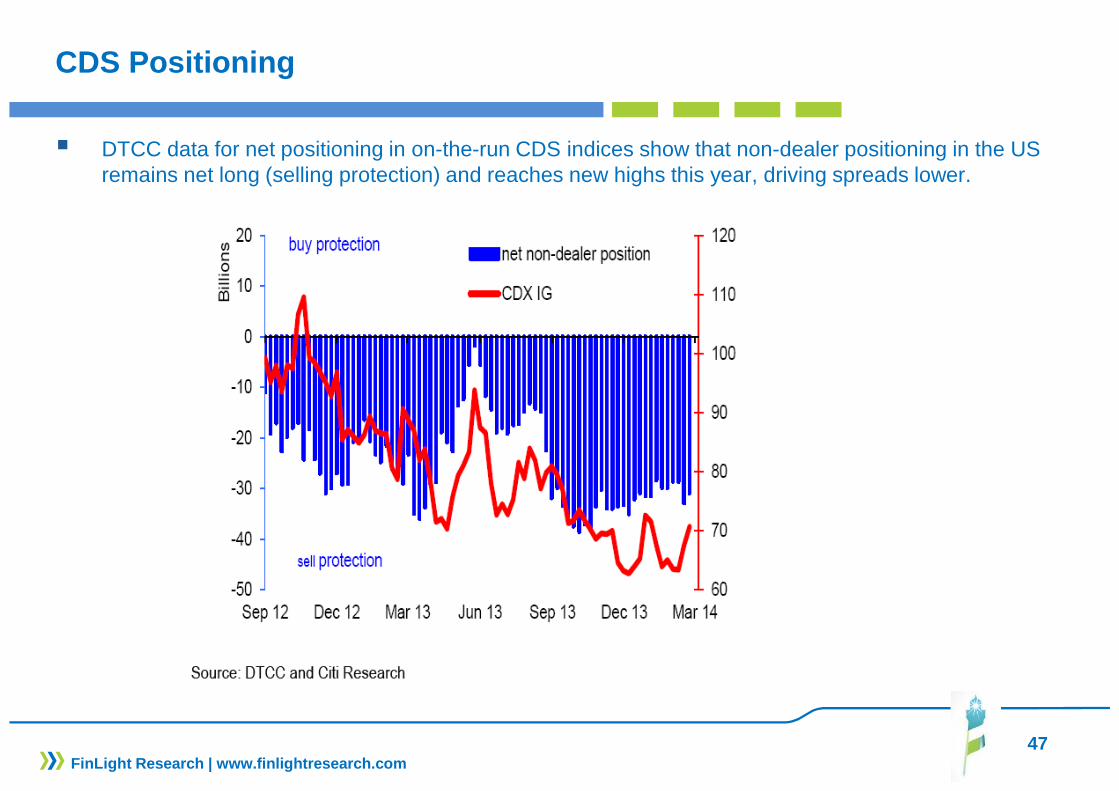
� DTCC data for net positioning in on-the-run CDS indices show that non-dealer positioning in the US remains net long (selling protection) and reaches new highs this year, driving spreads lower.
FinLight Research | www.finlightresearch.com
48
EM External Debt
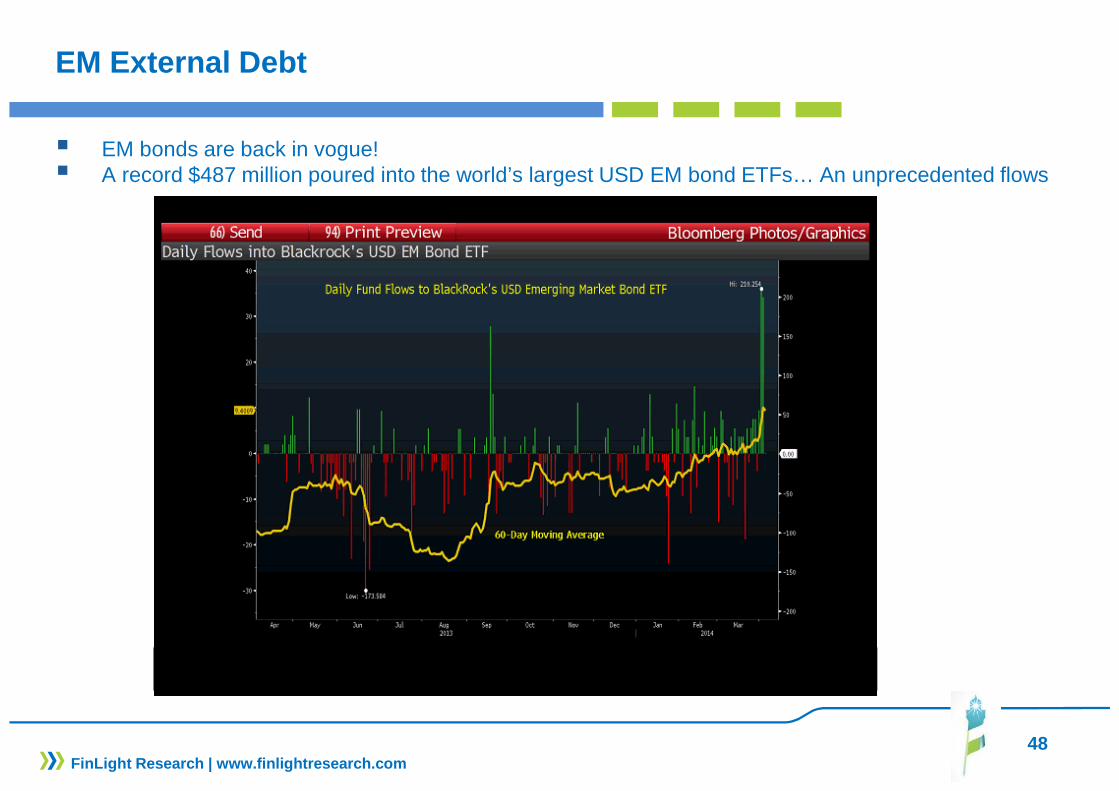
� EM bonds are back in vogue!� A record $487 million poured into the world’s largest USD EM bond ETFs… An unprecedented flows
FinLight Research | www.finlightresearch.com
49
EM External Debt
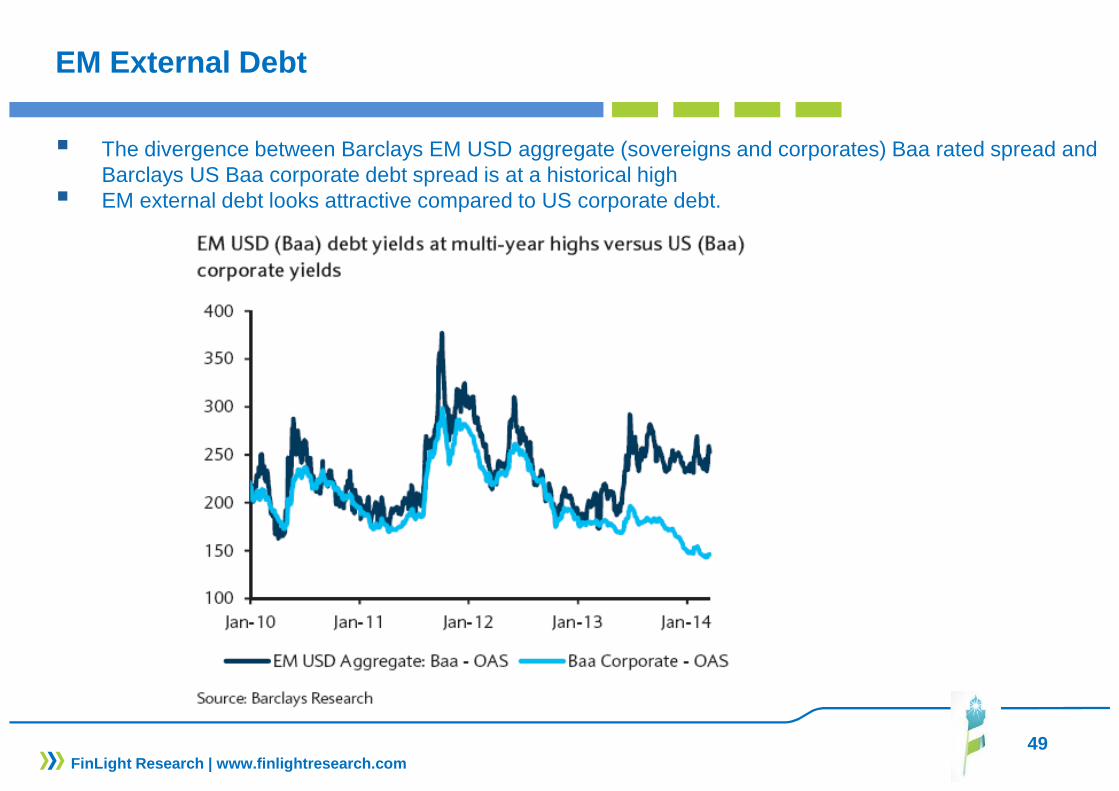
� The divergence between Barclays EM USD aggregate (sovereigns and corporates) Baa rated spread and Barclays US Baa corporate debt spread is at a historical high
� EM external debt looks attractive compared to US corporate debt.
FinLight Research | www.finlightresearch.com
50
EXCHANGE RATES
� We keep our view for a stronger USD index in 2014 b ased on higher US rates and non-US fundamental weakness
� On the EUR-USD, the pull back to 1.31-1.25 we were waiting for has not materialized. We expect EUR-USD to trade sideways in Q2. EUR depreciation requires higher relative real rates abroad. We stay Neutral and wait for a clean break below 1.3688/1.3602 to become UW and target 1.31 - 1.28.
� On the USD-JPY, we stay Neutral , watching for signs of a clean break above the area 103.93-104.34 tobecome OW (and target 105.60 and 106.10)
� Given fundamental trends, we stay short EM currencies (on countries with the largest current accountdeficit) vs USD
FinLight Research | www.finlightresearch.com
51
Dollar Index
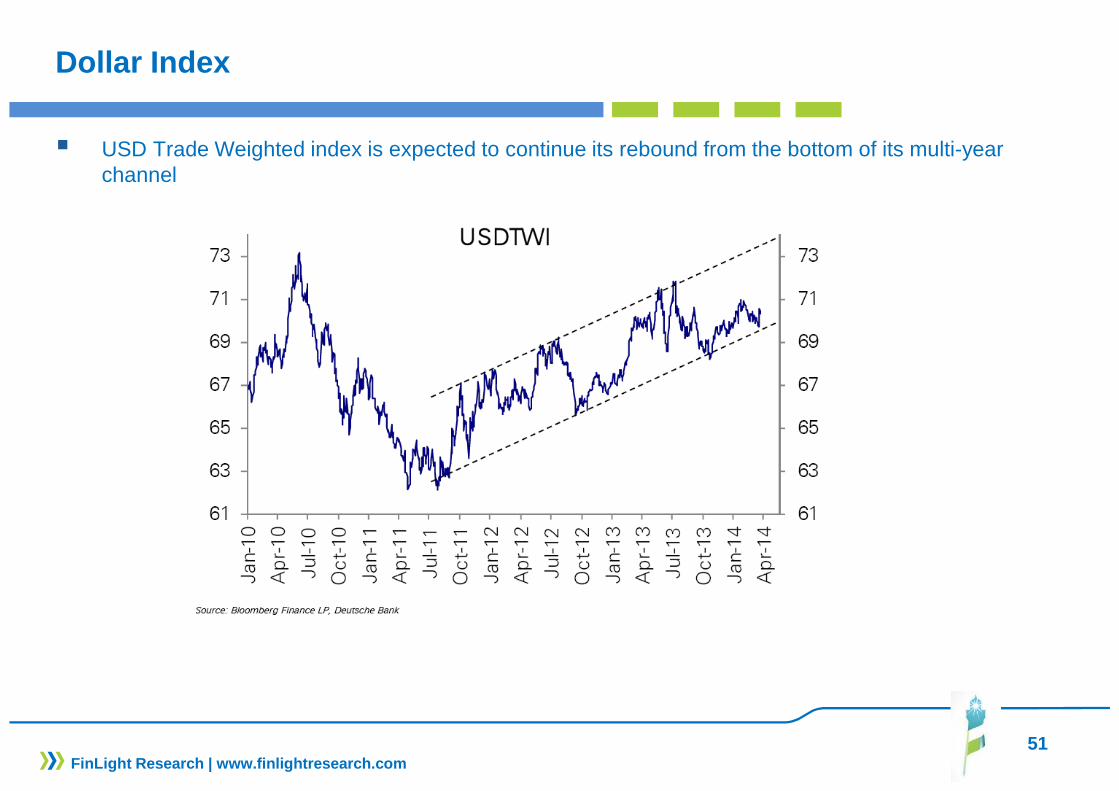
� USD Trade Weighted index is expected to continue its rebound from the bottom of its multi-year channel
FinLight Research | www.finlightresearch.com
52
Dollar Index
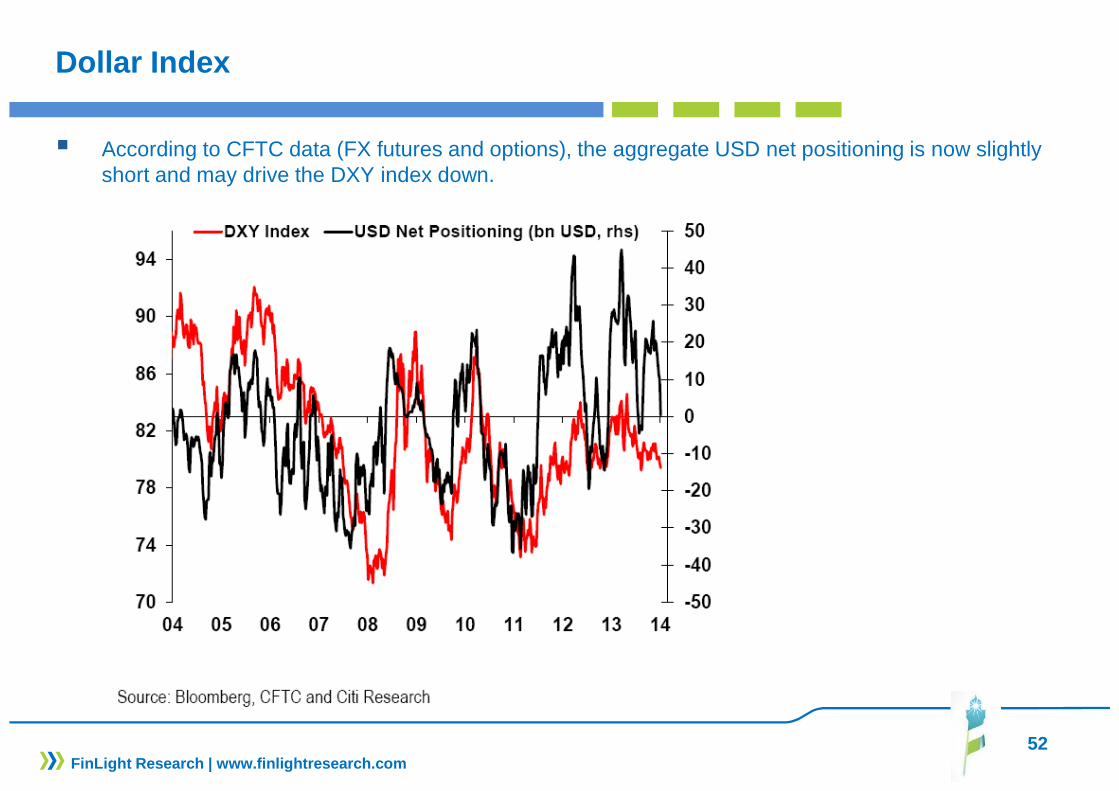
� According to CFTC data (FX futures and options), the aggregate USD net positioning is now slightly short and may drive the DXY index down.
FinLight Research | www.finlightresearch.com
53FinLight Research | www.finlightresearch.com
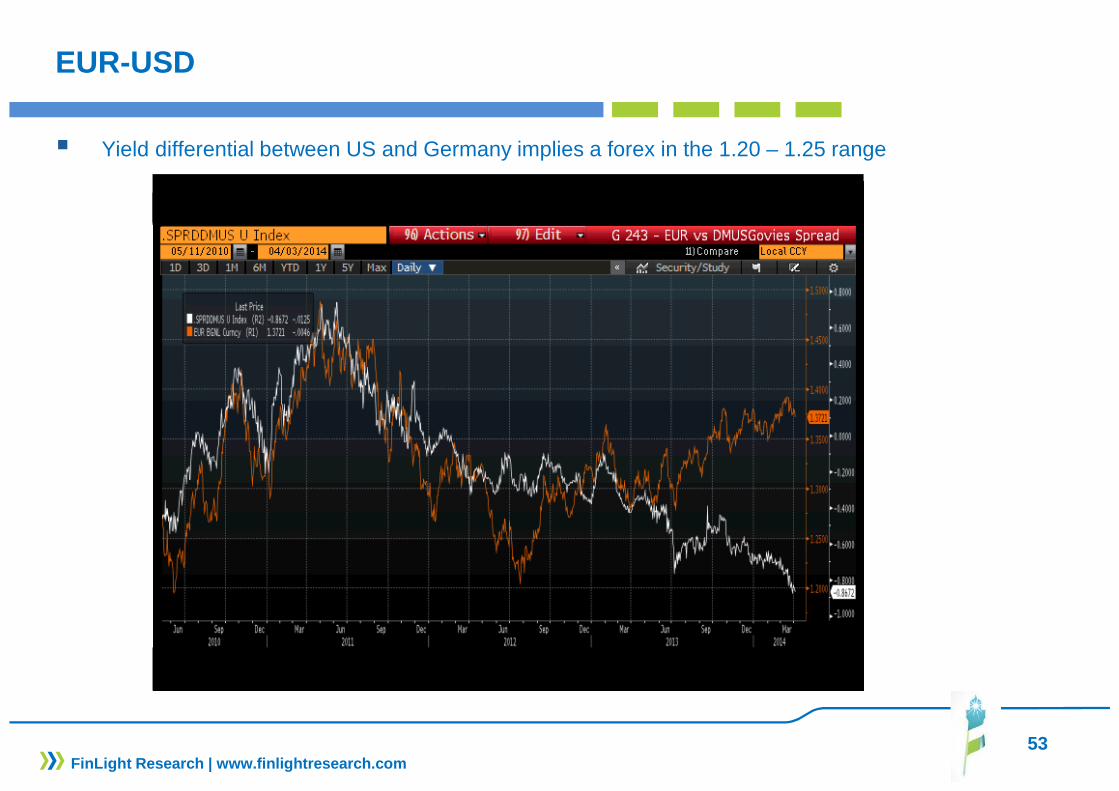
EUR-USD
� Yield differential between US and Germany implies a forex in the 1.20 – 1.25 range
54
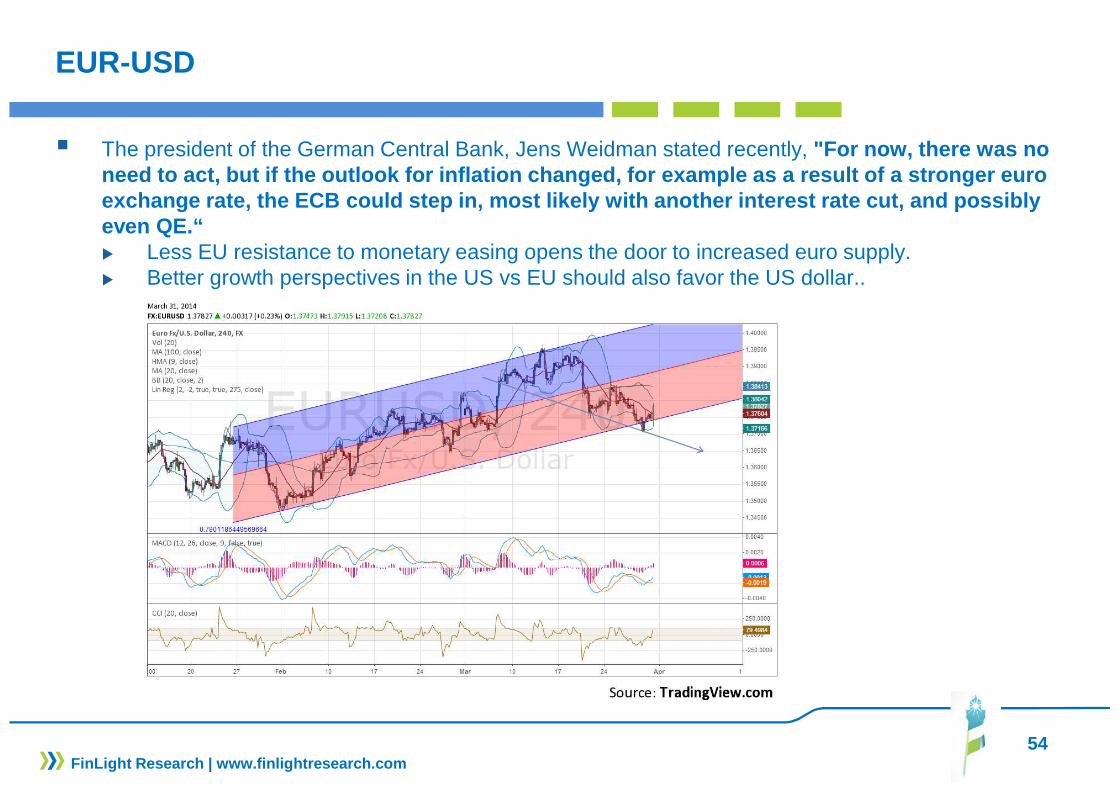
EUR-USD
� The president of the German Central Bank, Jens Weidman stated recently, "For now, there was no need to act, but if the outlook for inflation chang ed, for example as a result of a stronger euro exchange rate, the ECB could step in, most likely w ith another interest rate cut, and possibly even QE.“� Less EU resistance to monetary easing opens the door to increased euro supply.� Better growth perspectives in the US vs EU should also favor the US dollar..
FinLight Research | www.finlightresearch.com
55
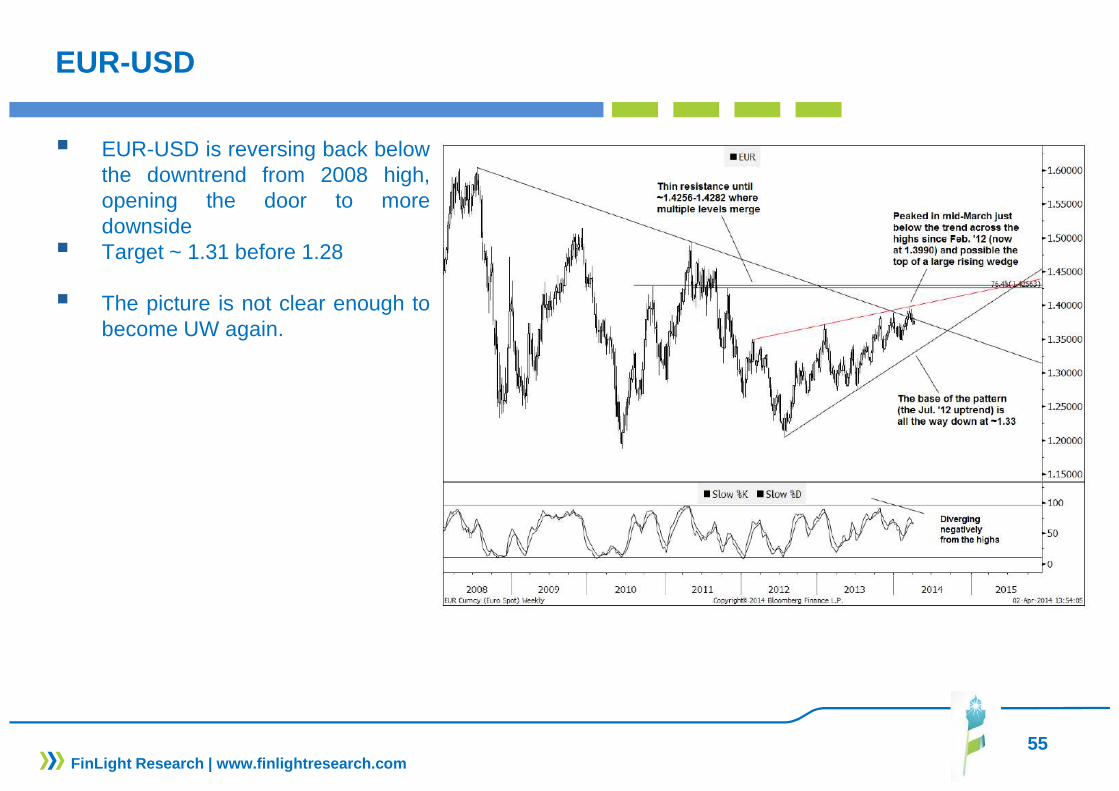
EUR-USD
� EUR-USD is reversing back belowthe downtrend from 2008 high,opening the door to moredownside
� Target ~ 1.31 before 1.28
� The picture is not clear enough tobecome UW again.
FinLight Research | www.finlightresearch.com
56
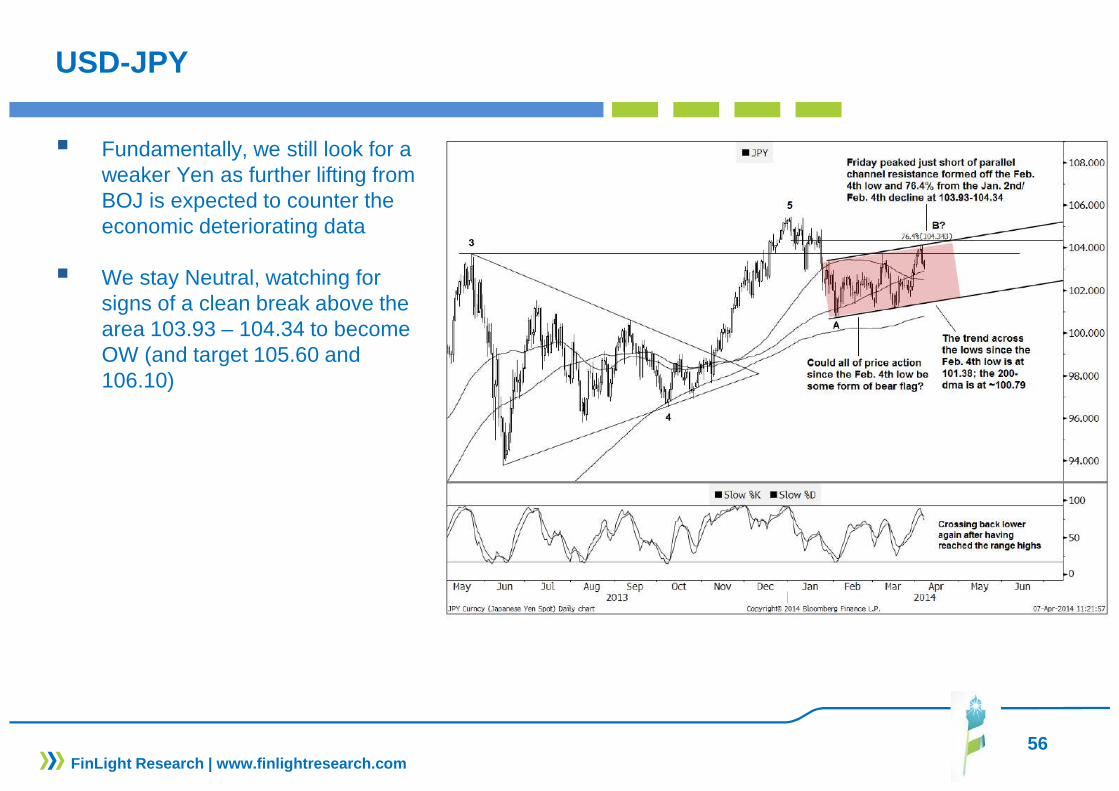
USD-JPY
� Fundamentally, we still look for a weaker Yen as further lifting from BOJ is expected to counter the economic deteriorating data
� We stay Neutral, watching for signs of a clean break above the area 103.93 – 104.34 to become OW (and target 105.60 and 106.10)
FinLight Research | www.finlightresearch.com

57
EM Forex
� After the significant adjustment experienced in 2013, EM FX are now very attractive on a valuation basis.
� Fed’s tapering effect is already priced in EM currencies.
FinLight Research | www.finlightresearch.com
Source: Barclays* “Vulnerable 5” are TRY, ZAR, INR, IDR and BRL; FXvalue is calculated using Barclay’s real effective FXrates; the overall score is the average of the z-scores forall 5 currencies from 2004 to present
58
COMMODITY
� Last month, we’ve decided to move commodities from OW to UW on the short run. W e keep this view.
� We still see significant downside potential for gold (due to rising real interest rates), copper and iron ore (due to increasing supply), and upside potential for soft commodities (coffee and cocoa)
� Over the short run , � We remain Neutral on Energy. Crude oil prices remain well supported by tight supply in the near term � We are Neutral to moderately UW on Agriculture (because of higher supply) except premium coffee
and cocoa (where we are OW)
� We are UW on base metals because of overabundance of supply, especially for copper
� We stay UW precious metals (targeting 1180-1150 on gold and 17 and then 12.50 on silver) because of rising real interest rates and strengthening of the dollar.
� Reaching a base will give a buying signal not only on physical gold but also on gold miners.
� Over the MT, we stay UW copper, despite the strong sell off in copper last week . The downside risk due to increasing supply is too significant to be ignored. We target 6600, and ultimately 6000.
FinLight Research | www.finlightresearch.com
59
Commos
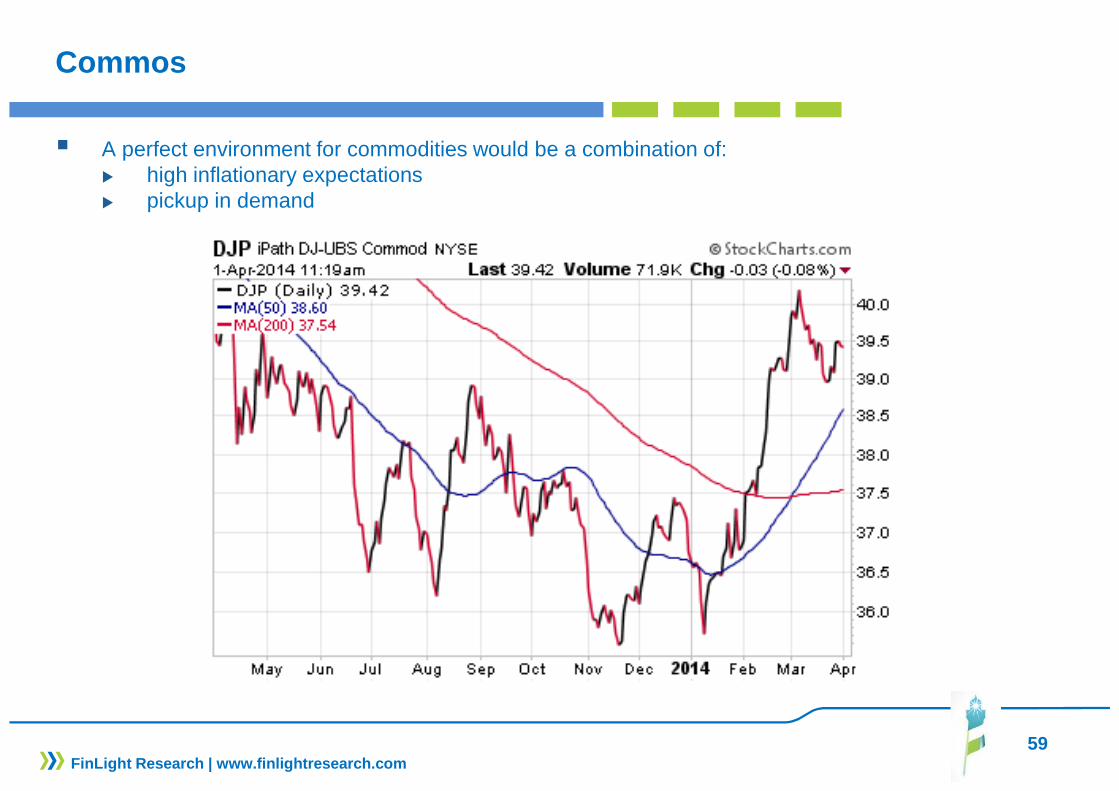
� A perfect environment for commodities would be a combination of:� high inflationary expectations � pickup in demand
FinLight Research | www.finlightresearch.com
60
Crude Oil
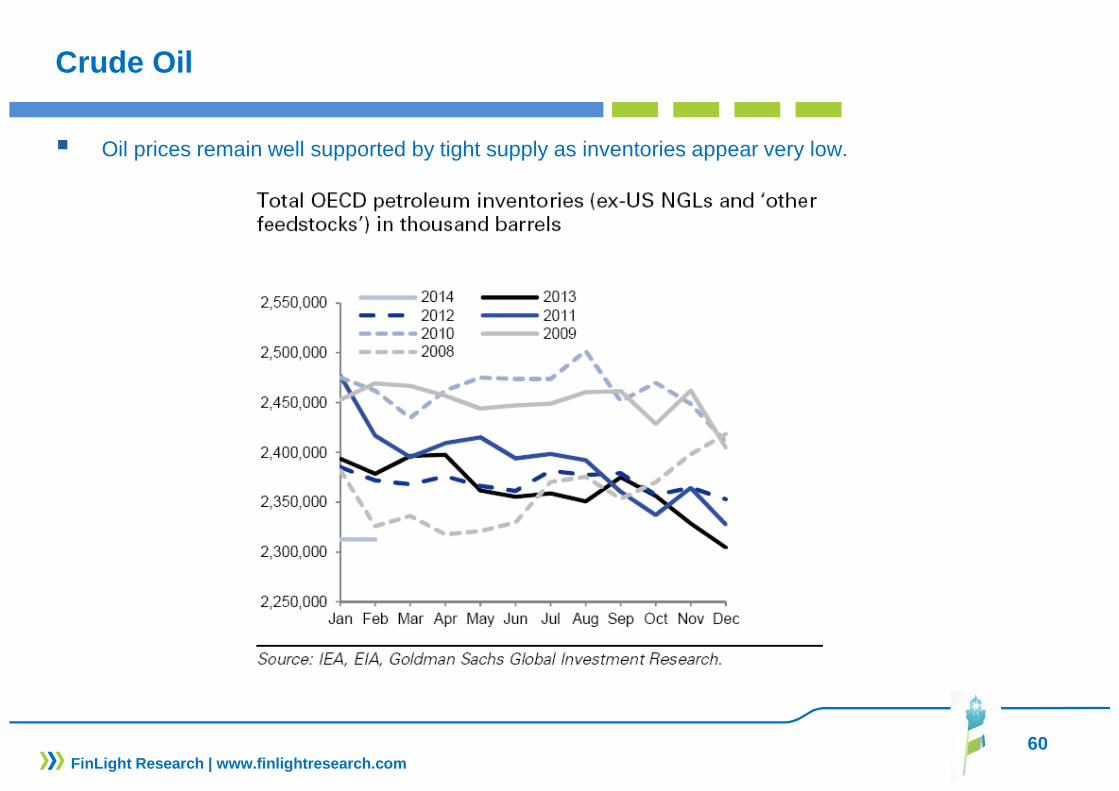
� Oil prices remain well supported by tight supply as inventories appear very low.
FinLight Research | www.finlightresearch.com
61
Gold
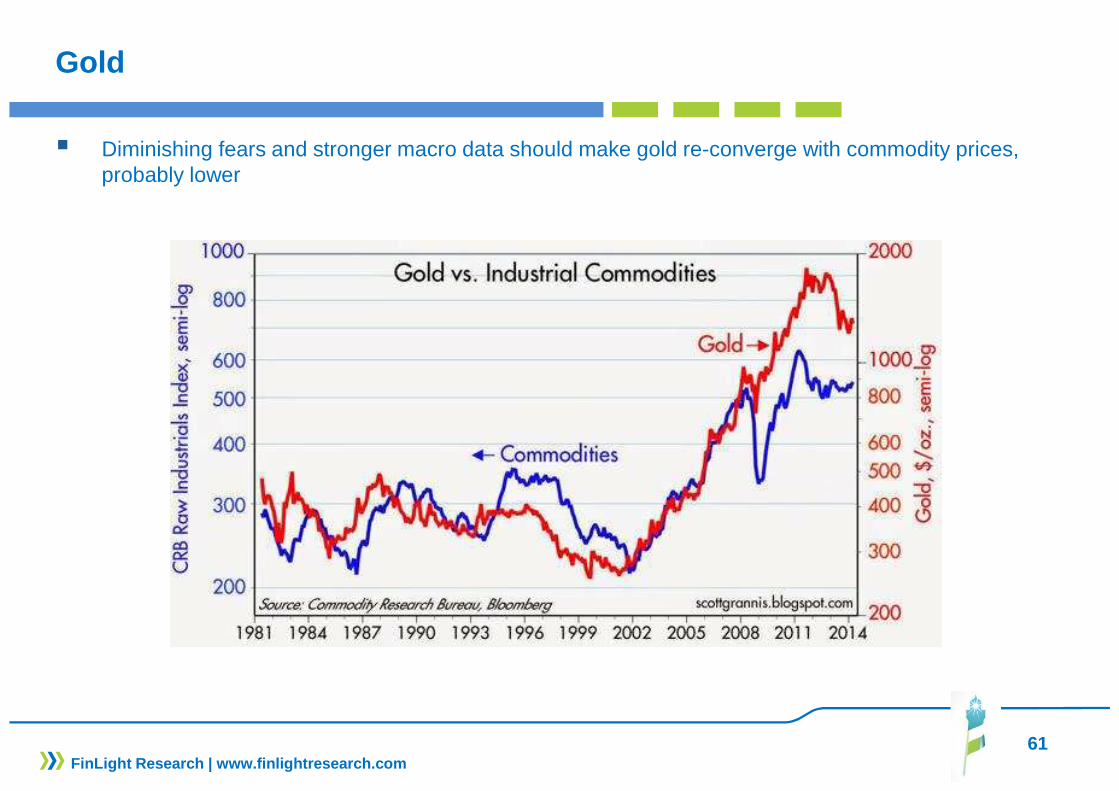
� Diminishing fears and stronger macro data should make gold re-converge with commodity prices, probably lower
FinLight Research | www.finlightresearch.com

62
Gold – Short-Term View
� Gold is now stuck in between 1297-1312and 1272-1262
� Price action over the last year held belowthe 38.2% of the decline from Nov 2012,implying a bias to the downside.
� We should keep an eye on 1262 level. Aclean break of that level should drive thegold back to 1180.
� The market appears ready for its final legdown.
FinLight Research | www.finlightresearch.com

63
Silver – Short-Term View
� Silver is now contained in a triangle pattern� Breaking through the bottom of this pattern
would drive the spot down to 12.5!
� Any gains will be corrective and limited to20.75 resistance. From there we expect thelong term bear trend to resume, with longterm targets seen to 12.50.
FinLight Research | www.finlightresearch.com
64FinLight Research | www.finlightresearch.com
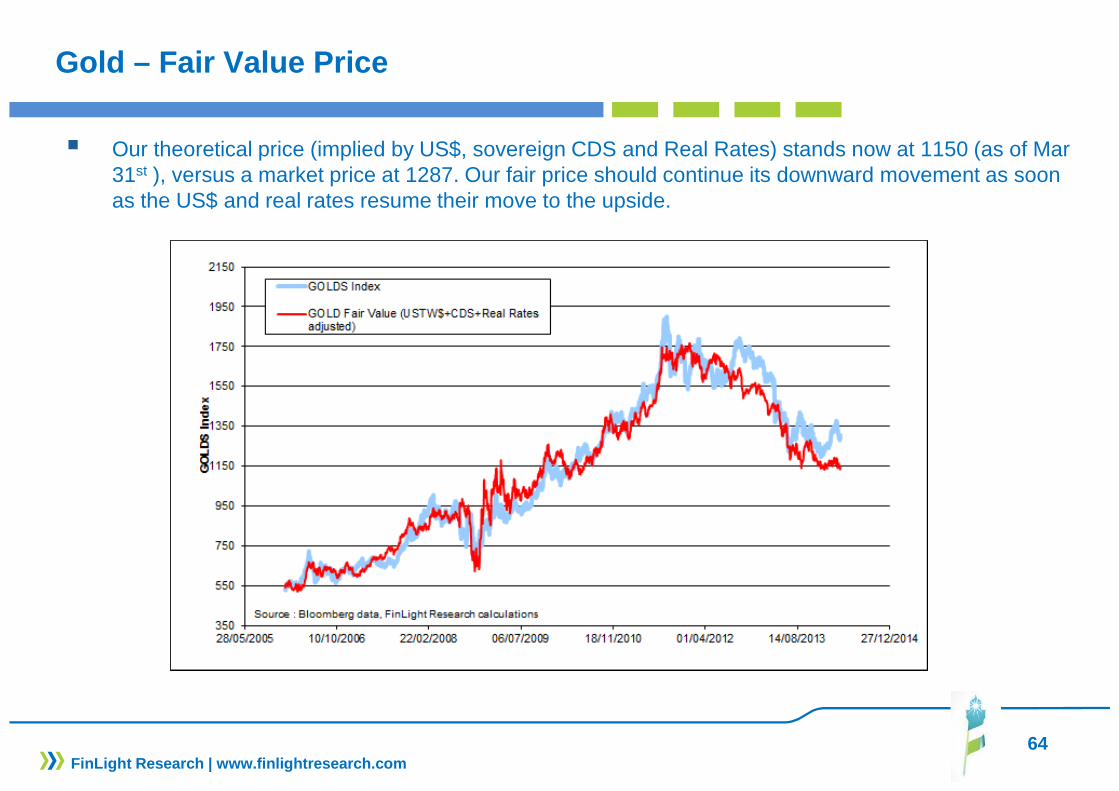
Gold – Fair Value Price
� Our theoretical price (implied by US$, sovereign CDS and Real Rates) stands now at 1150 (as of Mar 31st ), versus a market price at 1287. Our fair price should continue its downward movement as soon as the US$ and real rates resume their move to the upside.

65
CFTC Data
� According to CFTC data, WTI longs reached new local highs.� On gold, last week data showed some unwinding of the long positions
FinLight Research | www.finlightresearch.com
66
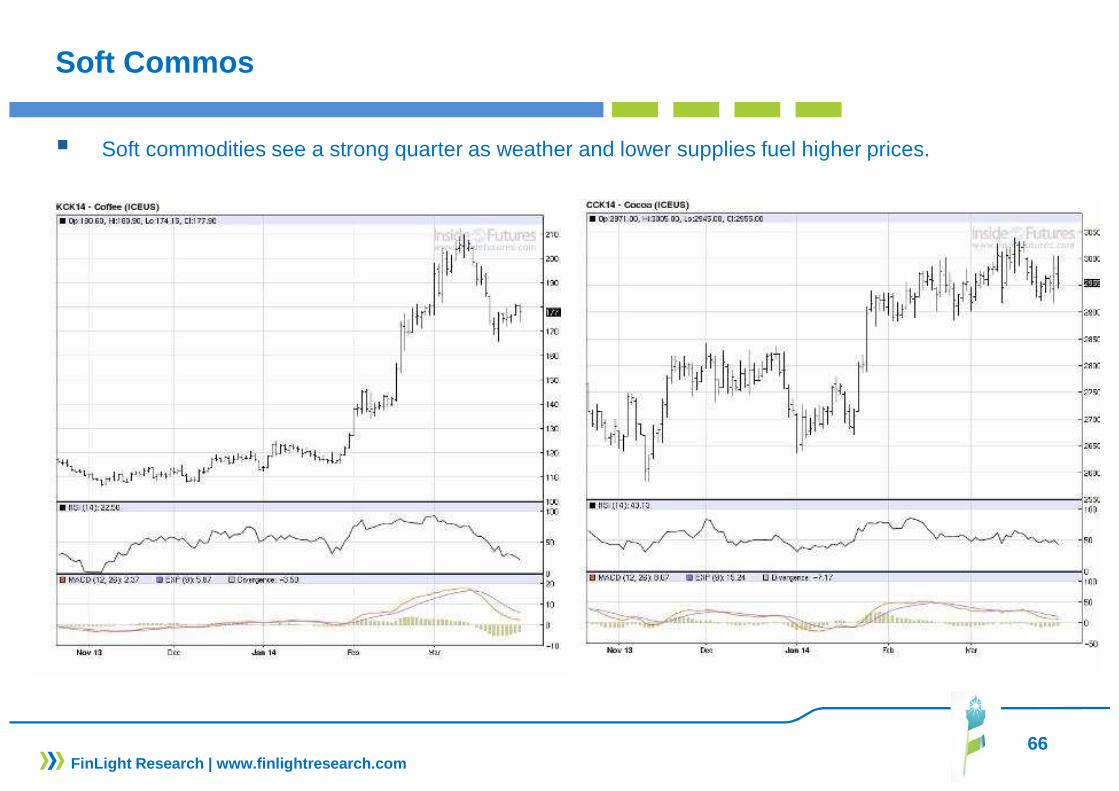
Soft Commos
� Soft commodities see a strong quarter as weather and lower supplies fuel higher prices.
FinLight Research | www.finlightresearch.com
67
ALTERNATIVE INVESTMENTS
� We are always OW on AI as we expect a 10% return in the coming year versus 5% on a traditional balanced portfolio (stocks + bonds+ cash).
� Our remain OW on Commercial Real Estate � We are still OW Equity long-short market-neutral, Convertible arbitrage. � In spite of their poor performance YTD, we keep our OW on CTA’s and Global Macro as a diversifier and
tail hedge
FinLight Research | www.finlightresearch.com
68
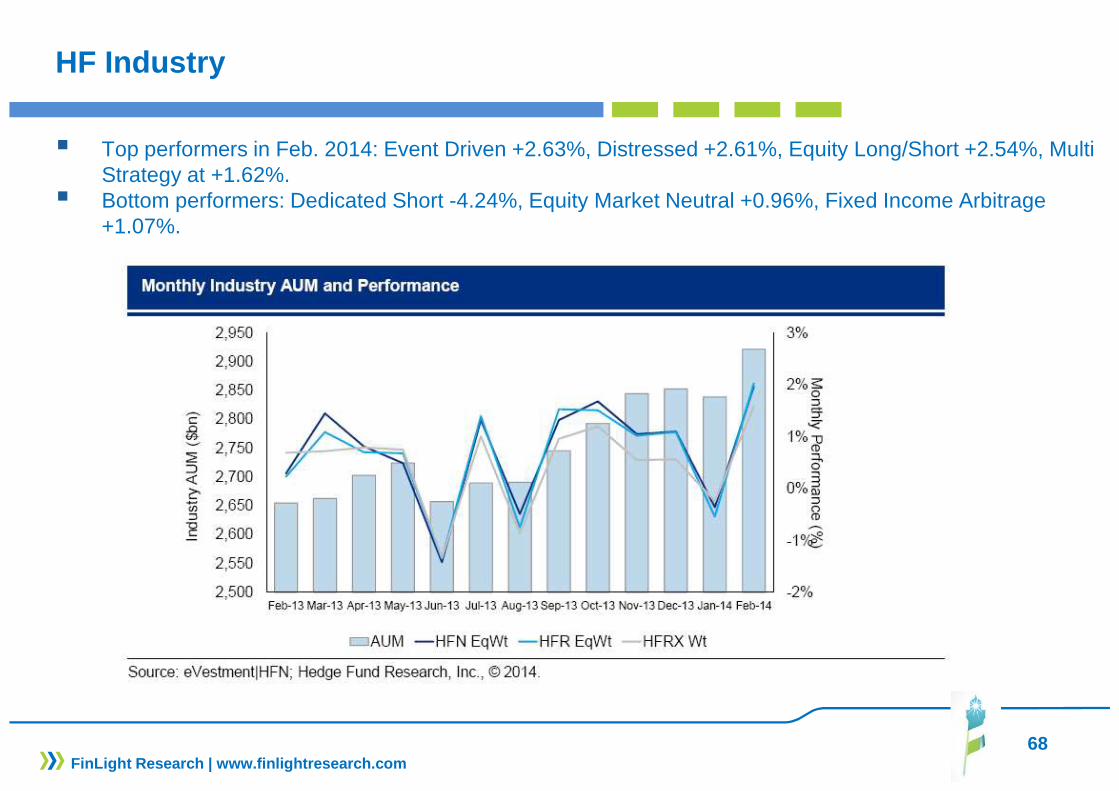
HF Industry
� Top performers in Feb. 2014: Event Driven +2.63%, Distressed +2.61%, Equity Long/Short +2.54%, Multi Strategy at +1.62%.
� Bottom performers: Dedicated Short -4.24%, Equity Market Neutral +0.96%, Fixed Income Arbitrage +1.07%.
FinLight Research | www.finlightresearch.com
69
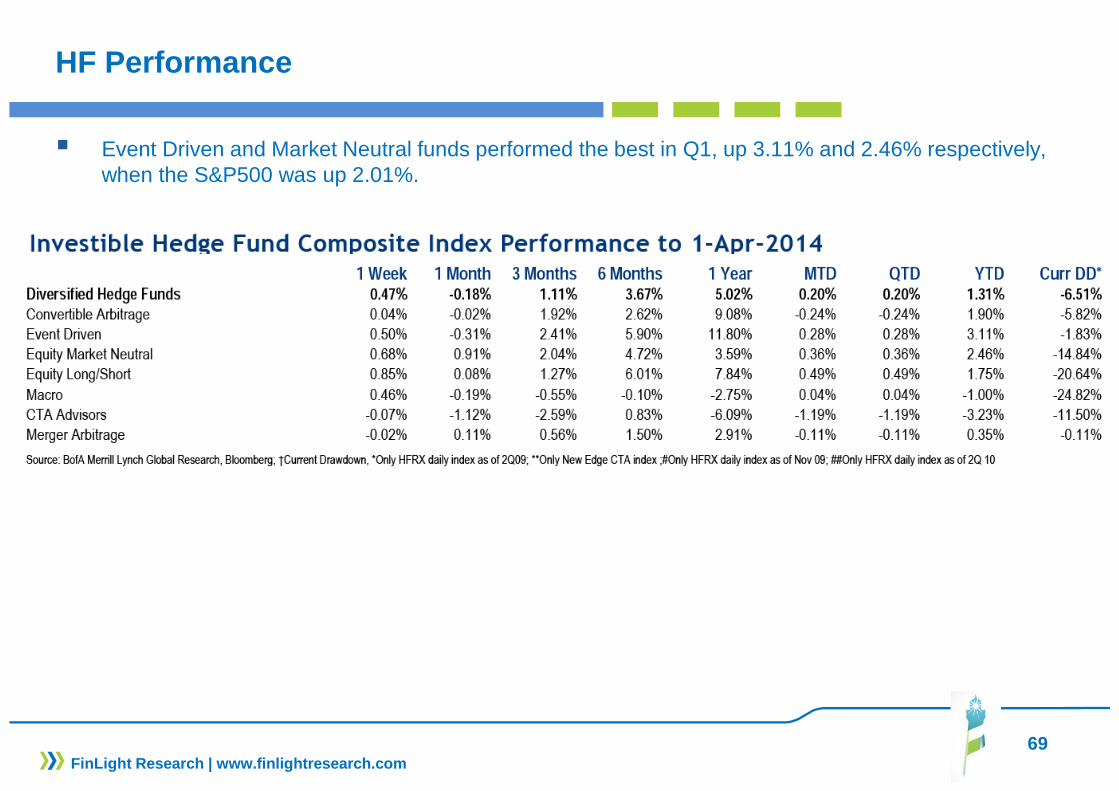
HF Performance
� Event Driven and Market Neutral funds performed the best in Q1, up 3.11% and 2.46% respectively, when the S&P500 was up 2.01%.
FinLight Research | www.finlightresearch.com
70
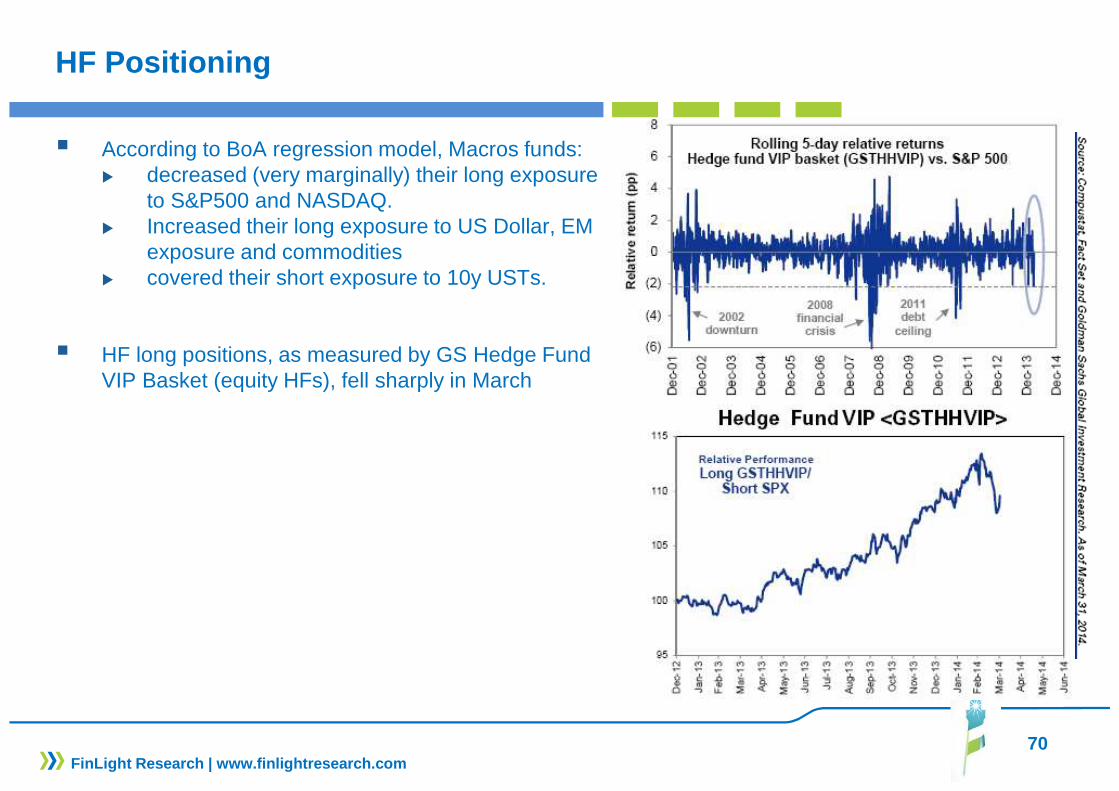
HF Positioning
� According to BoA regression model, Macros funds:� decreased (very marginally) their long exposure
to S&P500 and NASDAQ.� Increased their long exposure to US Dollar, EM
exposure and commodities � covered their short exposure to 10y USTs.
� HF long positions, as measured by GS Hedge Fund VIP Basket (equity HFs), fell sharply in March
FinLight Research | www.finlightresearch.com
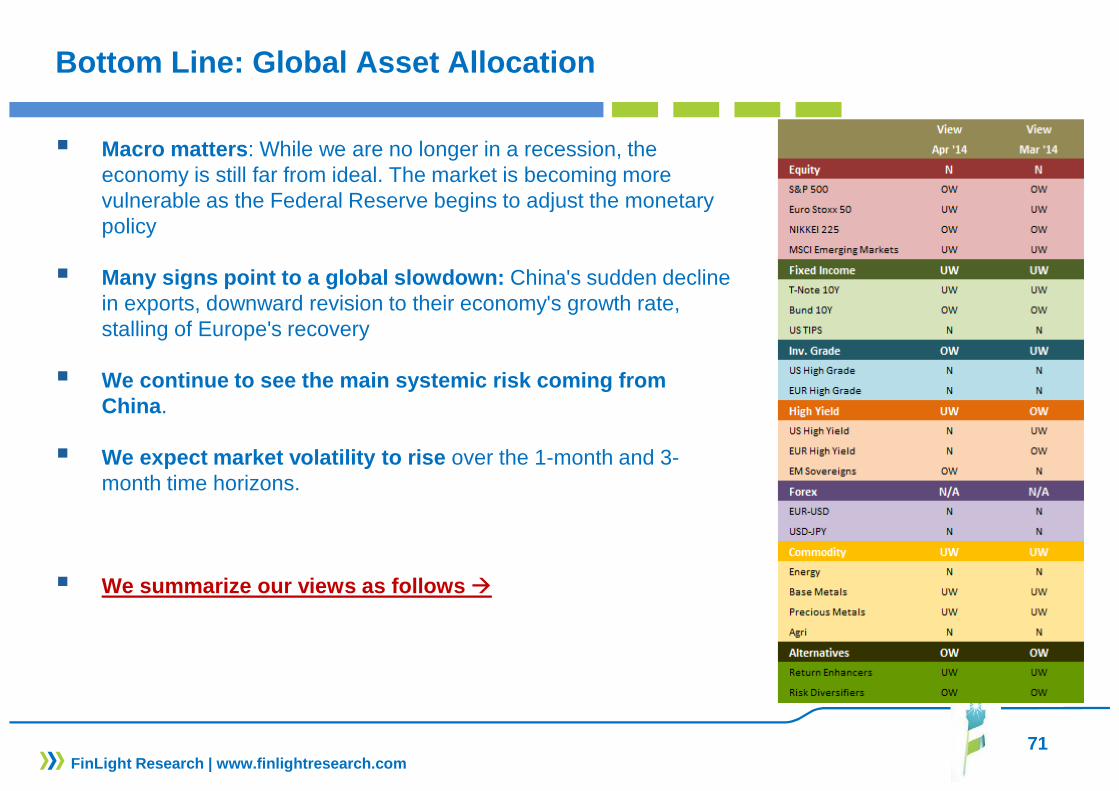
Bottom Line: Global Asset Allocation
� Macro matters : While we are no longer in a recession, the economy is still far from ideal. The market is becoming more vulnerable as the Federal Reserve begins to adjust the monetary policy
� Many signs point to a global slowdown: China's sudden decline in exports, downward revision to their economy's growth rate, stalling of Europe's recovery
� We continue to see the main systemic risk coming fr om China .
� We expect market volatility to rise over the 1-month and 3-month time horizons.
� We summarize our views as follows �
71FinLight Research | www.finlightresearch.com