MARKET GPS FIXED INCOME PERSPECTIVES
22
MARKET GPS FIXED INCOME PERSPECTIVES SEPTEMBER 2021 FEATURING THE LATEST QUARTERLY INSIGHTS FROM OUR INVESTMENT TEAMS: Global Bonds: Blink and you’ll miss it US Fixed Income: Looking to sustainability for opportunity Structured Debt: Tapering without the tantrum Corporate Credit: Truffle hunting in credit
Transcript of MARKET GPS FIXED INCOME PERSPECTIVES

MARKET GPS
FIXED INCOME PERSPECTIVESSEPTEMBER 2021
FEATURING THE LATEST QUARTERLY INSIGHTS FROM OUR INVESTMENT TEAMS: � Global Bonds: Blink and you’ll miss it
� US Fixed Income: Looking to sustainability for opportunity
� Structured Debt: Tapering without the tantrum
� Corporate Credit: Truffle hunting in credit

FIXED INCOME PERSPECTIVES SEPTEMBER 2021
FIXED INCOME CAPABILITIES Janus Henderson Fixed Income provides active asset management solutions to help clients meet their investment objectives. Over the past four decades, our global investment teams have developed a wide range of product solutions to address clients’ varied and evolving needs. From core and multi-sector investing to more focused mandates, we offer innovative and differentiated techniques expressly designed to support our clients as they navigate each unique economic cycle. The capabilities of these teams are available through individual strategies or combined in custom-blended solutions.
While shared knowledge across teams and regions encourages collaboration and the debate of investment ideas, each team retains a defined level of flexibility within a disciplined construct. Environmental, Social and Governance (ESG) considerations, for example, are a key element of our credit research process and integrated within each team’s investment approach. Our portfolio construction processes are governed by a rigorous risk management framework with the intent of delivering stronger risk-adjusted returns. Further, we believe transparency is the foundation of true client partnerships; we seek to earn and maintain our clients’ confidence by delivering robust and repeatable investment processes and by providing firsthand insights from our investment professionals.
The Janus Henderson Fixed Income platform comprises 106 investment professionals situated in the UK, US and Australia. The teams are responsible for US$80.5bn* in client assets.
GLOBAL BONDSAndrew Mulliner
CORPORATE CREDITJim Cielinski
US FIXED INCOMEGreg Wilensky
STRATEGIC FIXED INCOMEJohn Pattullo
Jenna Barnard
STRUCTURED DEBTColin Fleury
John Kerschner
AUSTRALIA FIXED INCOMEJay Sivapalan
GLOBAL HEAD OF FIXED INCOME
Jim Cielinski
EMERGING MARKETS DEBTJennifer James
ABSOLUTE RETURNSteve Goldman
(Kapstream)
Jason England
*As of 30 June 2021

FIXED INCOME PERSPECTIVES SEPTEMBER 2021
Key takeaways The fastest and deepest recession on record was met with unprecedented easing policies that supported the end consumer, which is why this economic cycle has the potential to be much shorter relative to recent history.
We believe we are either in, or beginning to enter, the ‘excess’ stage of the economic cycle – credit and wage growth indicators are looking strong and inflation expectations are still for an overshoot of target, at least in the US, in 2022.
With a solid economic backdrop in core developed markets, we expect both real and nominal yields to move modestly higher over the next year.
After experiencing some of the longest cycles in history over the last three decades, are we now setting up for one of the shortest cycles that most investors have ever experienced? And what is the implication of this for our view of nominal and real interest rates? Global Bonds Portfolio Manager Helen Anthony examines the facts.
GLOBAL BONDS:
BLINK AND YOU’LL MISS IT
Helen Anthony, CFAPortfolio Manager

2020 brought with it the fastest and deepest recession on record as shutdowns swept the globe. However, unprecedented amounts of monetary and fiscal policy supporting businesses and consumers has meant that post recessionary balance sheets look much healthier now than would otherwise have been expected at this stage of the cycle. Much of this is thanks to the ballooning government debt helping to support the end consumer. This is the major difference to the aftermath of the Global Financial Crisis and is the starting point as to why this cycle has the potential to be much quicker relative to recent history (Figure 1).
The four stages of the economic/business cycleThe economy and the markets tend to move in a cyclical fashion. Knowing which part of the cycle we are in and adapting to the current phase is a key component to managing risk. The four stages of an economic or business cycle are depicted in Figure 2.
So, how does this relate to the current environment?
In early 2020, we were in the ‘early recession’ part of the wave. The move to ‘late recession’ came in the second
FIXED INCOME PERSPECTIVES SEPTEMBER 2021
Figure 1: Historical business cycle lengths in the US
Source: NBER (National Bureau of Economic Research - US), Janus Henderson Investors, as at September 2021.
Pea
k fr
om p
revi
ous
peak
(m
onth
s)
19 monthssince thepeak inFeb 20
0
20
40
60
80
100
120
140
160
2021
2020
200
7
200
1
199
0
198
1
198
0
1973
196
9
196
0
1957
1953
1948
1945
1937
1929
1926
1923
1920
1918
1913
1910
190
7
190
2
189
9
189
5
189
3
189
0
188
7
188
2
1873
186
9
186
5
186
0
Figure 2: Economic cycle phases and market reactions
Source: Janus Henderson Investors.
Business expansion
Business contraction
Late recession
Recovery(growth)
Excess Early recession(downturn)
Sentiment: Capitulation Hope Euphoria Anxiety
Rates: Lower Higher Mixed Lower
Curve: Steep Steep Flattening Steepening
Currency: Mixed Weak Dollar Weak Dollar Strong Dollar
Spreads: Widening Narrowing Stable Vacillating
Portfolio Strategy:Exploit and
provide liquidityRisk-taking Trim and trade
Sell riskier assets and maximize diversification
Risk appetite: Medium Highest Medium Lowest

quarter and ‘recovery’ began in the third quarter of 2020, continuing into the first quarter of 2021. As Figure 2 shows, the next stage is the ‘excess’ phase, which arguably could be the stage we are in – or are entering – now.
Interpreting signals from the fixed income marketsLooking across at what is happening in different asset classes, credit (corporate bond) spreads are now at their tights (lowest levels compared to history) but relatively stable, given defaults rates are low and the search for income or carry is the main game in town.
Government yield curves have been generally flattening in the developed markets since March. March saw longer term nominal bond yields spike on higher inflation and a rapid recovery in growth – further helped by a rush to sell, given that the majority of investors were long (holding) bonds. This caused the rates (government bond) markets to move towards fair value, if not above. However, in July and August, investors were increasingly concerned about longer-term expectations on growth and inflation – coupled with a system that is awash with liquidity, helping to supress yields.
So, what is the outlook from here?First, credit growth. Here, indicators are looking strong, which should be a good forward-looking signal for gross domestic product (GDP) growth. Bank lending standards have loosened – pleasingly, European bank lending has been strong, though in the US commercial and industrial (C&I) loan growth looks to have bottomed after being uncharacteristically strong during the crisis where banks were forced to lend. While the manufacturing indicators
in Purchasing Managers’ Indices (PMIs) maybe rolling over and heading lower from their recovery peak, there is room for service PMI indicators to pick up the slack.
Second, wage growth. Employment patterns are increasingly strong with multiple surveys such as the National Federation of Independent Business (NFIB) in the US and jobs hard to fill surveys in the UK suggesting that there is a lack of labour supply. Hiring data are strong, which one would expect given the number of people coming back into the labour force as countries reopened, but alongside this, quits rates are holding up well and have surpassed pre COVID levels. The longer this mismatch in labour persists, with job openings indicators at record levels (particularly in the US) the more likely it is for wage growth to persist.
Finally, inflation expectations. This is the third key pillar when thinking about the cycle. Is inflation really as ‘transitory’ as the US Federal Reserve (Fed) would lead us to believe? If we use the median forecast on Bloomberg for core personal consumption expenditures (PCE) – the Fed’s preferred inflation measure – it is forecast to be above 2% by the end of 2022 (Figure 3). Our expectation is that at some point over the next year, the market should start to push back on this transitory theme. Yes, inflation is likely to come down but it is still at high levels and if the median forecast is correct, it is set to remain here.
This could partly be due to bottlenecks in supply chains. However, unless there is a belief that the COVID 19 virus is endemic (which becomes hard to believe with a cocktail of mixed vaccination rates around the globe and the Delta virus spreading at different rates in different countries), bottlenecks in supply chains are unlikely to disappear.
The risk to this view is that although forecasters have been constantly increasing their inflationary projections to
FIXED INCOME PERSPECTIVES SEPTEMBER 2021
Figure 3: Core PCE, the Fed’s preferred inflation measure (actual and forecast)
Bloomberg, Janus Henderson Investors, as at 6 September 2021. Note: core PCE: excluding volatile items such as food and energy.
actual median forecast
1.0
1.5
2.0
2.5
3.0
3.5
4.0
4.5
Q1 23Q4 22Q3 22Q2 22Q1 22Q4 21Q3 21Q2 21Q1 21Q4 20Q3 20
US
Cor
e P
CE
yoy
%
the upside over the last year, we could see the reverse on the way down and inflation potentially undershoot expectations. After all, participation rates in labour markets, especially the US, are still at subdued levels and could put downward pressure on wage growth as more people enter the labour force over time. Yet, it is hard to deny the pace of the recovery and indicators that have headed back to pre crisis levels or have reached levels where previously the Fed started their hiking cycle.
What does it all mean for interest rates?There are plenty of signs that many developed economies are still in a good place, so, why are rates markets not pricing in higher levels?
July saw some interesting movements in the price of US Treasuries. China’s slowing growth coupled with noises around regulations and the underperformance of some property companies caused Asian investors to grab safe haven assets such as US Treasuries, and we saw pronounced movements lower in yields, more in the Asian trading hours. Other market participants cited the Delta variant being more prevalent in the US as the reason for falling yields. However, the summer months are typically strong through July and August due to the strong summer seasonal effect, which is essentially driven by a lack of supply in government bond markets (especially prominent in Europe). More recently we have seen the start of a repricing in government bonds off the back of a more hawkish Fed and the Bank of England.
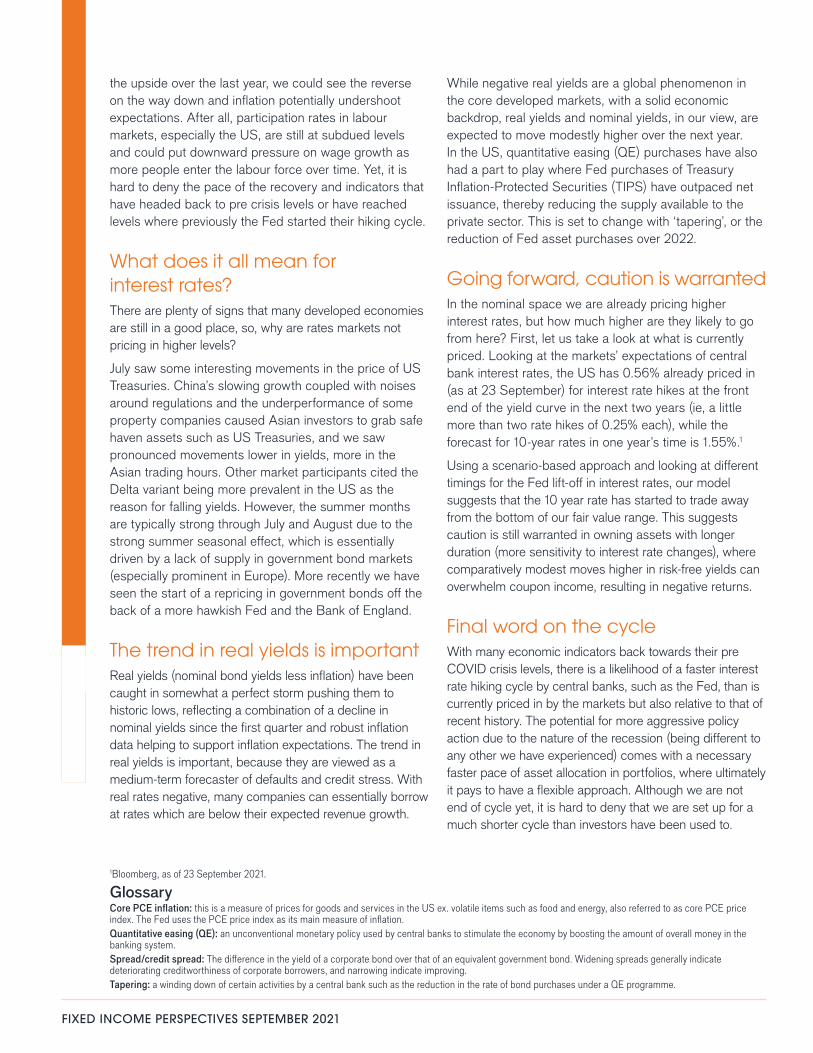
The trend in real yields is importantReal yields (nominal bond yields less inflation) have been caught in somewhat a perfect storm pushing them to historic lows, reflecting a combination of a decline in nominal yields since the first quarter and robust inflation data helping to support inflation expectations. The trend in real yields is important, because they are viewed as a medium-term forecaster of defaults and credit stress. With real rates negative, many companies can essentially borrow at rates which are below their expected revenue growth.
While negative real yields are a global phenomenon in the core developed markets, with a solid economic backdrop, real yields and nominal yields, in our view, are expected to move modestly higher over the next year. In the US, quantitative easing (QE) purchases have also had a part to play where Fed purchases of Treasury Inflation-Protected Securities (TIPS) have outpaced net issuance, thereby reducing the supply available to the private sector. This is set to change with ‘tapering’, or the reduction of Fed asset purchases over 2022.
Going forward, caution is warrantedIn the nominal space we are already pricing higher interest rates, but how much higher are they likely to go from here? First, let us take a look at what is currently priced. Looking at the markets’ expectations of central bank interest rates, the US has 0.56% already priced in (as at 23 September) for interest rate hikes at the front end of the yield curve in the next two years (ie, a little more than two rate hikes of 0.25% each), while the forecast for 10-year rates in one year’s time is 1.55%.1
Using a scenario-based approach and looking at different timings for the Fed lift-off in interest rates, our model suggests that the 10 year rate has started to trade away from the bottom of our fair value range. This suggests caution is still warranted in owning assets with longer duration (more sensitivity to interest rate changes), where comparatively modest moves higher in risk-free yields can overwhelm coupon income, resulting in negative returns.
Final word on the cycleWith many economic indicators back towards their pre COVID crisis levels, there is a likelihood of a faster interest rate hiking cycle by central banks, such as the Fed, than is currently priced in by the markets but also relative to that of recent history. The potential for more aggressive policy action due to the nature of the recession (being different to any other we have experienced) comes with a necessary faster pace of asset allocation in portfolios, where ultimately it pays to have a flexible approach. Although we are not end of cycle yet, it is hard to deny that we are set up for a much shorter cycle than investors have been used to.
FIXED INCOME PERSPECTIVES SEPTEMBER 2021
1Bloomberg, as of 23 September 2021.
GlossaryCore PCE inflation: this is a measure of prices for goods and services in the US ex. volatile items such as food and energy, also referred to as core PCE price index. The Fed uses the PCE price index as its main measure of inflation.Quantitative easing (QE): an unconventional monetary policy used by central banks to stimulate the economy by boosting the amount of overall money in the banking system.Spread/credit spread: The difference in the yield of a corporate bond over that of an equivalent government bond. Widening spreads generally indicate deteriorating creditworthiness of corporate borrowers, and narrowing indicate improving.Tapering: a winding down of certain activities by a central bank such as the reduction in the rate of bond purchases under a QE programme.

FIXED INCOME PERSPECTIVES SEPTEMBER 2021
Portfolio Managers Michael Keough and Brad Smith discuss why investors could benefit from taking an active approach to sustainable investments in the current investment environment for corporate bonds.
US FIXED INCOME:
LOOKING TO SUSTAINABILITY FOR OPPORTUNITY
Brad SmithPortfolio Manager
Michael KeoughPortfolio Manager
Key takeaways We believe the transition to sustainability will be a driving force of economic change and thus an ongoing opportunity to identify winners on the right side of social and environmental disruption.
In our view, an active approach to sustainable investment can benefit investors navigating the current environment by helping to balance the opportunities against the risks.
We expect the bond market to play a critical role in positively influencing E, S and G issues, but it is active management and proactive engagement with investee companies that we think are best suited to make a difference.

The world, and the world economy with it, is changing. Investors know this and have increasingly sought out sustainable investments. But, in our view, investing in sustainability is not only about helping to realize our values but also an opportunity for active managers to add value through their understanding of the economic disruption underway, their in-depth knowledge of industries and companies, and their experience in risk management. With subdued government bond yields and corporate bond spreads close to their historic lows, investors and investment managers should be taking advantage of all the tools and opportunities available to meet their return and risk targets, including the opportunities a transition to a sustainable global economy may provide.
Benefiting from disruptionThroughout history, significant investment opportunities have arisen during times of transformational change. As recently as last year we saw the sudden changes wrought by COVID-19 and the transformational effect they had on everything from technology companies to oil prices to the housing market. In our view, the shift to a sustainable economy is a generational transformation that will create significant long-term investment opportunities.
This is not to suggest that the business cycle is no longer important, or that investors should ignore the current uncertainties around fiscal and monetary policy, or the challenges of meeting their income goals in a low-yield world. But these are largely cyclical issues while the move toward a more sustainable economy is a structural one.
We anticipate the transition to sustainability will be a driving force of economic change for years, and thus an ongoing opportunity to identify winners on the right side of disruption. Because the goal of active managers is to be proactive and extract the maximum benefit from change, they should be well positioned to find the opportunities these changes provide, while also identifying companies at risk of not keeping pace.
Sustainability is a door to opportunityPassive investing, whether in corporate bonds or sustainable corporate bonds, does have its advantages. The corporate bond benchmark has well-known risk and reward characteristics, making it a comfortable solution for broad asset allocation decisions. But benchmarks are slow to reflect change. They are not designed to direct investors to where social and environmental change may take us.
Much like corporate bond benchmarks are more reflective of the past than predictive of the future, so are conventional measures of environmental, social and governance (ESG) factors. Many of the ESG ratings given to companies by third-party providers are based on past behavior, not expectations for future change. Active managers should be, and usually are, more forward looking. Regardless of their past performance, which companies are planning for change? How successful are they likely to be?
For us, the heart of sustainable investing is the simple idea that companies are more likely to succeed and deliver strong returns over the long term if they create value for all of their stakeholders, including customers, employees and society more widely. Active managers, particularly those with extensive research capabilities, can consider third-party ESG ratings as one input in a robust proprietary analysis that views a company not only within the context of broader disruption themes, but also within the context of the change in a company’s particular industry, even its related supply chains. These tools are integral to identifying those companies that have or are working toward a “future proofed,” sustainable business model. Conversely, analysis informed by sustainable considerations can uncover companies that cannot or will not change and therefore perhaps avoid the consequential underperformance.
Managing through engagementFundamental, bottom-up, active management necessarily engages with corporate leaders. Regular interaction with companies is crucial to better understand not only the
FIXED INCOME PERSPECTIVES SEPTEMBER 2021
Themes of disruption
Source: Janus Henderson
We see four driving themes in the transition to a sustainable economy.
TRANSITION TO A GREEN
ECONOMY
Climate Change & Clean Energy | Responsible Consumption & Production | Sustainable Cities & Transportation | Natural Resource Efficiency | Water
ECONOMIC & COMMUNITY
DEVELOPMENT, INCLUSION
Financial Services & Inclusion | Community Development | Infrastructure | Diversity, Equality, Inclusion
KNOWLEDGE & TECHNOLOGY,
INNOVATION
Sustainable Technology & Innovation | Quality Education
HEALTH & WELLNESS
Health Care Innovation | Health Care Affordability, Access & Services | Quality of Life

extent of their current deficiencies, but also their ability and willingness to transition to a more sustainable business model. This engagement helps promote transparency and can encourage the company to transition to more sustainable business practices. Ideally, engagement creates a virtuous circle where the influence results in better sustainability practices, that lower the cost of capital, encouraging the company’s competition to do the same and accelerating the overall transformation to sustainability.
Engagement with companies can also help distinguish between those committed to change and those that may be greenwashing, or seeking to portray their products and services as more sustainable than they really are. To be fair, achieving sustainability is a complex process that takes time. And investing in sustainable companies is equally complex, precisely because it is challenging to meaningfully measure sustainability.
The consideration of ESG factors is not simply an evaluation of a company’s products or services, but also its behavior, conduct, supply chain and general business operations. In addition to understanding a company’s past behavior, how it deals with controversies and its latest ESG disclosure, analyzing the company’s strategy and evaluating whether it is executing on it is essential. Forward-looking proprietary analysis and active engagement are critical steps in making sound investments and promoting transparency and honesty. Companies have and will greenwash to save time, money, or both. Benchmark indices may even include companies that manage to meet a minimum ESG requirement, regardless of the company’s intentions or future plans. It is the job of an active manager to identify companies that may only look sustainable, and to avoid them.
Risks can, and should be, managedPrudent active asset managers have traditionally viewed it as their responsibility to identify, quantify and mitigate risk. In this respect, sustainable investing is no different than traditional investing. And, in our view, analyzing a company through a sustainable lens helps not only to improve a portfolio’s returns but also to mitigate its risks, thus maximizing risk-adjusted returns.
Active corporate bond managers have long known that investing in a company experiencing distress can result in losses that are a multiple of the reward earned for picking companies that are doing “well.” For this reason, it has traditionally been more critical that active managers “avoid the losers” than “pick the winners,” but in sustainable investing, active management can help change this dynamic. It has the potential to reveal material issues in a
company’s transition early on through consistent engagement practices and mitigate related losses. And, because disruption creates opportunities, there may be more opportunities for companies on the leading edge of sustainability to rapidly gain market share, improve their credit profiles and ratings and generate outsized returns.
An active approach to sustainable investment also has the potential to help reduce a portfolio’s overall risk profile by allowing for greater diversity of risk factors. Insofar as passive investing requires the replication of an established benchmark, it has the potential to create concentrations in company, industry or sector exposures that may be undesirable or unable to keep pace with change. This may or may not be advantageous at various times, but it mathematically decreases a portfolio’s diversity. In some industries or sectors this could be significant, whether due to a dearth of sustainable investment options, or a concentration in a handful of names.
Investing sustainably, and proactively, can make a differenceWe believe corporate bonds have and will play a critical role in a diversified bond portfolio, whether passively held or actively managed. But we think a process founded in robust research and proprietary ESG analysis that includes an active evaluation of a company’s path to sustainability should create the potential to both capture the upside in transformational change and help avoid downside risk as ESG laggards languish.
While we believe the challenges of the current environment require an active approach to managing risks and identifying opportunities, it is also our belief that investing with a sustainable lens is an opportunity to influence positive change. We expect the bond market, given its breadth, to play a critical role in financing the transition to a sustainable global economy and progressing various E, S and G issues. But it is active management and proactive engagement with investee companies that we think are best suited to make a difference. The engagement that active managers provide can help investors as well as consumers by demanding greater accountability and transparency from companies. In our view, an active sustainability analysis of corporate bonds does not just present the potential for returns that beat a benchmark or more active risk management, but the opportunity to focus investments in a way that can help the world transition toward a better future.
FIXED INCOME PERSPECTIVES SEPTEMBER 2021

FIXED INCOME PERSPECTIVES SEPTEMBER 2021
GlossaryESG: Environmental, social and governance are three key criteria used to evaluate a company’s ethical impact and sustainable practices.Fiscal policy: Government policy relating to setting tax rates and spending levels. It is separate from monetary policy, which is typically set by a central bank. Fiscal austerity refers to raising taxes and/or cutting spending in an attempt to reduce government debt. Fiscal expansion (or ‘stimulus’) refers to an increase in government spending and/or a reduction in taxesMonetary policy: The policies of a central bank, aimed at influencing the level of inflation and growth in an economy. It includes controlling interest rates and the supply of money. Monetary stimulus refers to a central bank increasing the supply of money and lowering borrowing costs. Monetary tightening refers to central bank activity aimed at curbing inflation and slowing down growth in the economy by raising interest rates and reducing the supply of money.Spread/credit spread: The difference in yield between securities with similar maturity but different credit quality. Widening spreads generally indicate deteriorating creditworthiness of corporate borrowers, and narrowing indicate improving.

FIXED INCOME PERSPECTIVES SEPTEMBER 2021
John Kerschner, Head of U.S. Securitized Products, Nick Childs Portfolio Manager and Thomas Polus Fixed-Income Trader discuss the outlook for mortgage-backed securities as the U.S. Federal Reserve prepares to “taper” its purchases.
STRUCTURED DEBT:
TAPERING WITHOUT THE TANTRUM
Thomas Polus, CFAFixed Income Trader
Nick Childs, CFAPortfolio Manager | Securitized Products Analyst
John Kerschner, CFAHead of US Securitized Products | Portfolio Manager
Key takeaways The Fed will soon begin to taper its purchases of U.S. Treasuries and mortgage-backed securities.
We think the Fed learned from the 2013-2014 “taper tantrum.” While bouts of volatility may arise, the Fed’s efforts to better communicate intentions should help to mitigate volatility overall.
MBS may actually benefit from tapering if they are favored over “risk assets,” including corporate bonds, as the tapering process unfolds.

The amount of fiscal and monetary support provided to the U.S. economy in 2020 broke records and, in our view, set new precedents for intervention in the financial markets by the U.S. Federal Reserve (Fed). But a lot has changed in a year. Both macro and microeconomic fundamentals have improved, corporate bond markets have rallied toward historical spread lows, and securitized products have recovered broadly. As a sustained economic recovery appears to be the market’s base case, it is now contemplating when and how fast the Fed’s monetary stimulus will be withdrawn. We have written much about our expectations for interest rate policy, but what effect will reducing the current pace of quantitative easing (that is, the direct purchase of securities in the open market) have on credit markets generally, and the mortgage market specifically?
The Fed was aggressive in 2020Before COVID-19 struck, the Fed owned about 23% of the outstanding agency mortgage-backed securities (MBS). As COVID spread, the Fed started buying agency MBS1 and Treasuries in the open market to provide liquidity to financial institutions, and to help lower mortgage rates. While the liquidity provided short-term medicine, lowering mortgage rates was a longer-term strategy to provide consumers the opportunity to refinance their mortgages at cheaper rates, thereby putting more disposable income in their pockets. The strategy worked. Mortgage rates plummeted as Treasury yields fell, refinancing spiked2, and the Fed aggressively bought the new mortgages.
As of late September, the Fed owned over 30% of the outstanding agency MBS market, or approximately $2.5 trillion3. And the Fed is still buying. Estimates vary, but it seems likely the Fed will end up owning around 40% of the market before reaching the point where the volume they are buying is lower than the rate at which their holdings mature – that is, paid off or “pre-paid” as homeowners refinance or move. Regardless of where that point is, whether it is somewhat higher or lower than 40%, it is less of a concern to the market then how the Fed plans to ultimately reduce their exposure.
The market remembers 2013-2014The Fed instituted a similar, but smaller scale, MBS and Treasury purchasing program during the Global Financial Crisis (GFC). Unfortunately, their attempt to unwind that program, or “taper” their purchasing, was something of a debacle. When the markets caught wind that Treasury purchases would slow, 10-year yields spiked around 1.0% in just a few months. The period came to be known as the “taper tantrum.”
But, in our view, the volatility in bond markets did not happen because the Fed pivoted to a more restrictive policy, but because they failed to give the markets time to digest their plan. Volatility is, almost by definition, dependent on there being a surprise. In 2013, the market leapt to a worst-case conclusion because the Fed failed to communicate, in advance, their intentions. Just as raising official policy rates can have dramatic market implications if it comes as a surprise but can result in orderly market moves if expected, a successful tapering needs successful communication.
FIXED INCOME PERSPECTIVES SEPTEMBER 2021
Figure 1: Fed holdings of agency MBS
Source: Bloomberg, as of 31 August 2021.
1.0
1.2
1.4
1.6
1.8
2.0
2.2
2.4
2.6
20%
25%
30%
35%
40%
Jul-21May-21Mar-2Jan-21Nov-20Sep-20Jul-20May-20Mar-20Jan-20
U.S
. $ (t
rillio
ns)
% o
f Ous
tand
ing
Age
ncy
MB
SAs a Percentage of the Outstanding Agency MBS Market (rhs)
Value of Agency MBS owned by the Fed (lhs)

FIXED INCOME PERSPECTIVES SEPTEMBER 2021
We think the Fed learned their lesson from 2013-14 and has thus been much more intentional about telegraphing their thinking in advance. Chairman Jerome Powell said, now somewhat famously, as long ago as June that “you can think of this meeting as the talking-about-talking-about meeting4.” While he was referencing the Federal Open Market Committee meeting that had just taken place, where interest rate policy is set, his point was clear: Before the Fed will even talk about tightening monetary policy, they will first talk about talking about it. Put differently, they will take this process in steps, will keep the market informed, and the market (starting from June) should consider just the first step taken. The result was that the 10-year bond yields rose very briefly, only to fall over the next month.
The Fed’s intentions for tapering MBS purchases have followed a similar path. As such, the market’s estimates for when it will begin, and at what rate, have progressively narrowed. Simply put, the Fed does not want to surprise the market because the consequences of doing so are too well understood. And, thus, should the market be wrong in its expectations, we expect the Fed would (gently) nudge the market in the right direction.
Expectations are for a late 2021 start, and a modest paceOur view is that the Fed will most likely announce the date they will start tapering their MBS purchases after their November meeting. We expect them to say they will begin soon after that meeting and will start by reducing purchases of MBS by an additional $5 billion each month. This view is a fairly consensus position insofar as most market participants believe the start date will quickly follow the announcement date and the estimates of the dollar amount are similarly narrow.
Given the volume of bonds currently owned and being purchased, we expect the Fed’s tapering will last less than a year, but getting the size of their MBS portfolio to their target could take a few years to complete. We think the Fed would like to get back to owning closer to 20% of the market, near the level they held pre-COVID. To be clear, we do not expect the Fed will ever outright sell MBS in the open market – which could raise supply concerns – rather, they will buy fewer bonds over time while letting the ones they do hold mature or prepay.
How quickly they will get back to 20% depends, in part, on the outlook for the economy, but also on the outlook for interest rates, given how sensitive prepayment rates are to government bond yields. If Treasury yields see a sustained rise on either fears of inflation or a recovery in real rates,
mortgage rates will follow, which could dampen the speed at which they prepay. Equally, if Treasury rates stay in a more stable range, many homeowners who should or could refinance are more likely to have already done so, also dampening the prepay speed. Given our base case estimates that the U.S. economy will continue to recover, returning to trend growth in the next couple of years, and that interest rates will rise but largely in an orderly fashion, we do not expect dramatic changes in prepayment rates. As such, we expect a relatively modest decline in the Fed’s MBS holdings over the coming years.
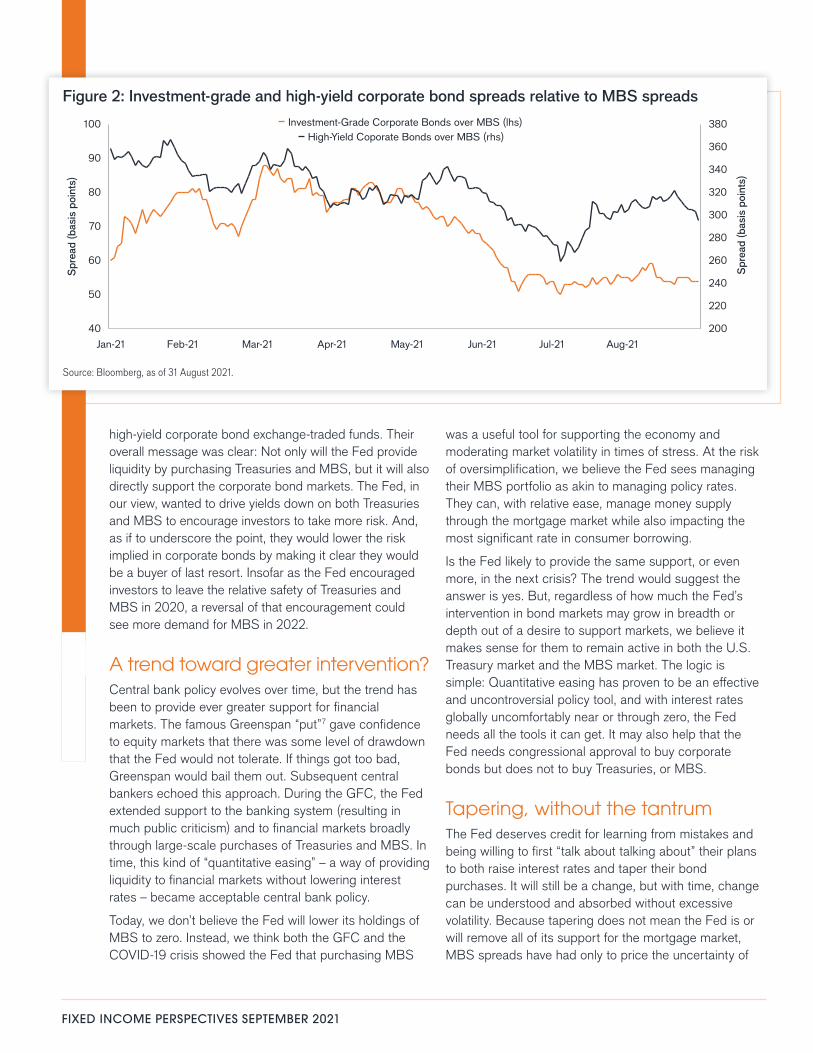
MBS, perhaps counterintuitively, could benefit from taperingAs markets first began to digest the Fed’s intentions to taper purchases, MBS struggled. While total returns of mortgage indices were supported by declining Treasury yields in recent months, spreads did widen as expectations for tapering grew5. That they have stabilized in the third quarter suggests the market has reached a consensus on its expectations for the pace of Fed tapering, and their comfort level with it.
It is hard to price a “fair” value for the effect tapering will have on the MBS market given the uncertainty around the direction of interest rates and other factors such as the demand from banks. U.S. banks are one of the largest purchasers of MBS and their demand is highly correlated to the level of their deposits as MBS are generally seen as relatively secure assets to invest in over shorter time periods. However, our internal modeling suggests that MBS spreads at current levels are attractive relative to other credit markets, particularly investment-grade corporate bonds.
In our view, withdrawing liquidity from the MBS and Treasury markets is more likely to have a greater impact on corporate bonds and other “risk assets” broadly. MBS, in contrast, are still widely seen as “safe-haven” assets with relatively low correlations to corporate bond returns. If riskier assets do see spread widening as the Fed withdraws liquidity, we think investors may find MBS’ approximately 0.9% yield advantage over U.S. Treasuries (while carrying the same credit rating) attractive6. Conversely, if a reduction in the Fed’s purchasing of Treasury securities cause their yields to rise (even if orderly), this would raise mortgage rates commensurately, thereby lowering the speed at which they would prepay – another positive for MBS.
Finally, we should remember that in addition to buying MBS and Treasuries, the Fed bought corporate bonds and – for the first time – signaled its willingness to buy
FIXED INCOME PERSPECTIVES SEPTEMBER 2021
high-yield corporate bond exchange-traded funds. Their overall message was clear: Not only will the Fed provide liquidity by purchasing Treasuries and MBS, but it will also directly support the corporate bond markets. The Fed, in our view, wanted to drive yields down on both Treasuries and MBS to encourage investors to take more risk. And, as if to underscore the point, they would lower the risk implied in corporate bonds by making it clear they would be a buyer of last resort. Insofar as the Fed encouraged investors to leave the relative safety of Treasuries and MBS in 2020, a reversal of that encouragement could see more demand for MBS in 2022.
A trend toward greater intervention?Central bank policy evolves over time, but the trend has been to provide ever greater support for financial markets. The famous Greenspan “put”7 gave confidence to equity markets that there was some level of drawdown that the Fed would not tolerate. If things got too bad, Greenspan would bail them out. Subsequent central bankers echoed this approach. During the GFC, the Fed extended support to the banking system (resulting in much public criticism) and to financial markets broadly through large-scale purchases of Treasuries and MBS. In time, this kind of “quantitative easing” – a way of providing liquidity to financial markets without lowering interest rates – became acceptable central bank policy.
Today, we don’t believe the Fed will lower its holdings of MBS to zero. Instead, we think both the GFC and the COVID-19 crisis showed the Fed that purchasing MBS
was a useful tool for supporting the economy and moderating market volatility in times of stress. At the risk of oversimplification, we believe the Fed sees managing their MBS portfolio as akin to managing policy rates. They can, with relative ease, manage money supply through the mortgage market while also impacting the most significant rate in consumer borrowing.
Is the Fed likely to provide the same support, or even more, in the next crisis? The trend would suggest the answer is yes. But, regardless of how much the Fed’s intervention in bond markets may grow in breadth or depth out of a desire to support markets, we believe it makes sense for them to remain active in both the U.S. Treasury market and the MBS market. The logic is simple: Quantitative easing has proven to be an effective and uncontroversial policy tool, and with interest rates globally uncomfortably near or through zero, the Fed needs all the tools it can get. It may also help that the Fed needs congressional approval to buy corporate bonds but does not to buy Treasuries, or MBS.
Tapering, without the tantrumThe Fed deserves credit for learning from mistakes and being willing to first “talk about talking about” their plans to both raise interest rates and taper their bond purchases. It will still be a change, but with time, change can be understood and absorbed without excessive volatility. Because tapering does not mean the Fed is or will remove all of its support for the mortgage market, MBS spreads have had only to price the uncertainty of
Figure 2: Investment-grade and high-yield corporate bond spreads relative to MBS spreads
Source: Bloomberg, as of 31 August 2021.
40
50
60
70
80
90
100
200
220
240
260
280
300
320
340
360
380
Aug-21Jul-21Jun-21May-21Apr-21Mar-21Feb-21Jan-21
Spr
ead
(bas
is p
oint
s)
Spr
ead
(bas
is p
oint
s)
High-Yield Coporate Bonds over MBS (rhs)Investment-Grade Corporate Bonds over MBS (lhs)

FIXED INCOME PERSPECTIVES SEPTEMBER 2021
how, not the cost of what. As there is now consensus about the how, in our view most of the potential widening in MBS spreads due to tapering has already taken place.
Meanwhile, we expect a rise in demand for MBS from other participants, including U.S. banks and asset managers broadly. In our estimates, many asset managers have favored corporate credit over mortgages (demonstrated in their relative outperformance) in recent quarters, and thus are more likely to add back mortgages to their portfolios as tapering slowly drains liquidity from the bond markets. In
our view, “risk assets,” including investment-grade and high-yield corporate bonds, have potentially greater exposure to the risk of wider spreads or lower returns as the tapering process unfolds. And, with interest rates more likely to rise, or at least be stable, than to fall again, we think the wave of prepayments that swept the mortgage market in 2020 has seen its peak for this cycle. Because falling prepayments are generally supportive for MBS, our forecast suggests yet another reason MBS should remain supported through the coming tapering.
1 Bloomberg, as of 31 August 2021.2 Between 21 February 2020 and 6 March 2020 the U.S. Refinancing Index rose more than 200%.3 Bloomberg, as of 23 September 2021.4 As reported by Pension & Investments, 16 June 2021.5 Bloomberg, as of 31 August 2021.6 Bloomberg, as of 31 August 2021. Represents the Bloomberg U.S. MBS Index versus the duration-equivalent U.S. Treasury note.7 The term Greenspan Put is a reference to policies put in place by Federal Reserve Chair Alan Greenspan to help halt excessive stock market declines. It is derived from a put option, which is a kind of product sold in the options market that allows an investor to sell a security at a pre-agreed price. A put option can be used to protect its holder from a fall in a securities value, because they have the right to sell it at the pre-agreed value, regardless how low its price may fall.
GlossaryBasis point: A basis point is 1/100th of 1%Fiscal stimulus: Fiscal policy is government policy relating to setting tax rates and spending levels. It is separate from monetary policy, which is typically set by a central bank. Fiscal expansion (or ‘stimulus’) refers to an increase in government spending and/or a reduction in taxes.High yield: A bond that has a lower credit rating than an investment grade bond. Sometimes known as a sub-investment grade bond. These bonds carry a higher risk of the issuer defaulting on their payments, so they are typically issued with a higher coupon to compensate for the additional risk.Monetary stimulus: Monetary stimulus refers to a central bank increasing the supply of money and lowering borrowing costs.Quantitative easing (QE): A monetary policy used by central banks to stimulate the economy by boosting the amount of overall money in the banking system.Spread: The difference in the yield of a corporate bond over that of an equivalent government bond.Volatility: The rate and extent at which the price of a portfolio, security or index, moves up and down. If the price swings up and down with large movements, it has high volatility. If the price moves more slowly and to a lesser extent, it has lower volatility. It is used as a measure of the riskiness of an investment.Yield: The level of income on a security, typically expressed as a percentage rate.Yield spread: A measure of how much additional yield an issuer offers over comparable “risk-free” U.S. Treasuries. In general, widening spreads indicate deteriorating creditworthiness of corporate borrowers, tightening spreads are a sign of improving creditworthiness.

FIXED INCOME PERSPECTIVES SEPTEMBER 2021
Key takeaways Valuations are expensive but reflect the fact that the economic and policy environments are supportive for credit.
Vaccination programmes and re-opened economies mean COVID no longer dominates every news bulletin; other factors are beginning to influence markets and idiosyncratic risks are likely to grow.
Higher inflation need not be bad for credit – but the gradual removal of monetary accommodation is likely to see more policy divergence and create higher volatility.
Jim Cielinski, Global Head of Fixed Income, argues that the easy returns from corporate bonds since the COVID recovery are largely over but opportunities can still be unearthed through a selective approach.
CORPORATE CREDIT:
TRUFFLE HUNTING IN CREDIT
Jim Cielinski, CFAGlobal Head of Fixed Income

FIXED INCOME PERSPECTIVES SEPTEMBER 2021
Autumn in the Northern Hemisphere brings a supportive environment for mushrooms to sprout. Yet the most coveted of all fungi – the white truffle revered for its flavour – remains stubbornly underground. Its aromatic marvel is only revealed to those prepared to undertake a serious search effort. This may involve a combination of years of experience, a canine companion’s strong sense of smell, as well as an understanding of topography and biology.
Where we see commonalities with the truffle hunters is the increasing effort required to unearth opportunities in the credit markets. Partly, this is a consequence of full valuations and partly a recognition that some of the economic tailwinds are receding. Volatility may rise and idiosyncratic risks are ubiquitous. Value is present but is often lurking beneath the surface.
Debt levels and valuationsMost of 2021 has been characterised by broadening vaccination efforts, albeit led by richer, developed countries. The prospect and reality of economies re-opening has provided fertile conditions for earnings to
soar and cash flows to recover. As expected of forward-looking markets, risk assets have rallied as investors foresaw this improvement. In early September, US equities, as represented by the S&P 500® Index, reached an all-time high. Spreads on US high yield bonds, while still above their historical lows, have retraced all the COVID-induced widening. Similar stories have played out in Europe, although Asia Pacific and emerging markets have faced a rockier 2021.
Debt has soared in the pandemic but is being supported by well-behaved debt servicing costs. Coupled with easy money, liquidity has further fuelled the appetite for risk assets. The debate about whether easy financing conditions is a positive backdrop or a recipe for excess will be with us throughout the next year. The stock of debt – from both sovereign and corporate borrowers – is at record highs as depicted in Figure 1a. On the other hand, Figure 1b shows that debt as a proportion of equity is near all-time lows. This may say more about the high valuations of equity markets than it necessarily does about corporate debt levels.
Figure 1b: US corporate debt to equity at record lowUS non-financial corporate debt as a % of the market value of equities
Source: FRED, Federal Reserve of St Louis, US non-financial corporate debt as a percentage of market value of equities, Q1 1961 tp Q1 2021.
0%
20%
40%
60%
80%
100%
2021201120011991198119711961
preceding 1973 oil crisis
precedingdot-com crash
preceding GlobalFinancial Crisis
Figure 1a: Total stock of debt at record highs
Source: Janus Henderson Sovereign Debt Index, April 2021, (comprises government debt of countries that make up 88% of global gross domestic product); Janus Henderson Corporate Debt Index, July 2021, (comprises debt from 900 largest non-financial companies around the world). For full methodology, please visit janushenderson.com.
2020201920182017201620152014
Corporate Sovereign (rhs)
6,000
8,000
10,000
12,000
14,000
Cor
pora
te d
ebt (
US
D b
illio
n)
Sov
erei
gn d
ebt (
US
D b
illio
n)
30,000
35,000
40,000
45,000
50,000
55,000
60,000
65,000

FIXED INCOME PERSPECTIVES SEPTEMBER 2021
How much debt is too much? Both indicators tell us little about the answer. High levels of debt mean little without understanding the ability to service that debt or the likelihood of losing access to fresh capital. Equally, debt-to-equity ratios may suggest an environment where a high degree of equity capital offers a buffer against capital losses for bondholders. In reality, it often portends excessive equity valuations and a harbinger of a cyclical turn. Previous lows have taken place ahead of the 1973 oil crisis, the 2000 dot-com crash and the 2007-09 Global Financial Crisis, where deep corrections in equity markets caused debt levels as a percentage of equity to spike higher.
Credit spreads typically exhibit a positive correlation to equity markets, and stretched valuations in either or both markets suggests caution. Economic fundamentals remain strong, however, and with the last crisis so recent, we would anticipate any sell-off in equities to be shallow and short-lived and likewise any spread widening episode in credit to be modest. Liquidity trends are likely to be the principal driver of these markets in the absence of faltering fundamentals.
Default rates are low and falling. Moody’s European and US speculative 12-month trailing default rates having tumbled from highs of 5.1% and 8.9% respectively in the past year to 3.7% and 3.1% by the end of July 2021.1 Leverage ratios (measured by gross debt divided by earnings before interest, tax, depreciation and amortisation) have reduced. Morgan Stanley noted that average gross leverage (debt to
earnings) among US investment grade corporate bonds has fallen to 2.4 times earnings from closer to 3 times earnings back in 2020, while in US high yield gross leverage has fallen from 4.8 times earnings in 2020 to below 3.9 times earnings by end of Q2 2021.2 We believe momentum is likely to have persisted through Q3.
A great deal of this improvement is already reflected in spreads, which are trading towards the tighter end of their long-term ranges. For example, in early September 2021, global high yield spreads, as measured by the ICE BofA Global High Yield Index, were around 50 basis points (bps) above the five-year low of 311 bps recorded in 2018 and around 130 bps above the 233 bps historical low recorded in 2007.3 While this still offers some room for further tightening, the risk-to-reward ratio is becoming more finely balanced.
Such an environment demands a more concerted effort in terms of credit analysis. An area of focus for us is seeking to identify rising stars (issuers that are likely to see their credit rating upgraded from high yield to investment grade). The passage to a higher rating is usually accompanied by a tightening of spreads over time. Currently, a healthy spread differential exists between BB rated high yield bonds and BBB rated investment grade bonds, as illustrated in Figure 2. In fact, the ratio of credit spreads on BB high yield bonds compared with BBB investment grade bonds is towards the top of the 10-year range.
Figure 2: US BB-BBB relative valuation remains wide
Source: Bloomberg, ICE BofA 1-10 Year BBB US Corporate Index, ICE BofA 1-10 year BB US High Yield Index, Govt OAS (option adjusted spread), USD, 2 September 2011 to 3 September 2021.
0
50
100
150
200
250
300
350
400
20212020201920182017201620152014201320122011
1.5
1.7
1.9
2.1
2.3
2.5
2.7
2.9BB minus BBB spread differential BB/BBB spread ratio (rhs)
Spr
ead
(bas
is p
oint
s)
Rat
io
FIXED INCOME PERSPECTIVES SEPTEMBER 2021
Return of multiplicityAbsent a new variant, COVID is becoming less of an obstacle to the economy. So, what can intrude on the reasonably peaceful credit markets?
Politics is always an unknown quantity. There has been a notable shift in tone in China as the Communist Party cracks down on what it sees as anti-competitive areas and seeks to improve social equality. This has reverberated through sectors as investors seek to recalibrate the earnings potential of companies.
Tax increases are moving into mainstream political thinking, whether to finance structural demographic change – witness the 1.25% social care levy announced in the UK to help pay for social care for an ageing population – or the Organisation for Economic Co-operation and Development (OECD) shift on digital taxes. Arguments around raising the US debt ceiling limit, a regular event, are likely to animate the US Congress and bring a sharp focus onto debt levels more generally. These issues will likely fade, but risks exist.
The UN Climate Change Conference of the Parties (COP 26) taking place in Glasgow, Scotland, in November also highlights the growing importance of climate change and broader sustainability issues. From carbon pricing to potential methane taxes there is plenty to both raise costs for companies as externalities are priced and to create opportunities for companies that are embracing change. We see winners and losers from this and other environmental, social and governance factors.
The area most likely to challenge markets in coming months, however, is how they respond to inflation data and central bank policy. Ongoing disruption in supply
chains is complicating central bank assessments of the inflation outlook. We have already seen central banks in Eastern Europe and Latin America raise interest rates this year as policy globally begins to diverge. With yields at low levels, interest rate risk becomes a greater concern within credit, even among areas where it has traditionally been less important. Deutsche Bank noted in early September that 85% of US high yield bonds had a yield below the rate of US CPI inflation.4 Markets are betting big that inflation is transitory.
Inflation – the concern that will not go awayThe lazy assumption is that inflation is bad for bonds. It is certainly true that those bonds with a fixed coupon will see the real value of that coupon decline. Whether that translates to positive or negative total returns for the investor depends on other factors. What is the current yield? What is the duration of the bond? What income returns are other investment substitutes offering? Most importantly, inflation becomes a concern when it forces central bankers to become overly concerned. Tighter policy will be the most likely factor behind the cycle’s demise.
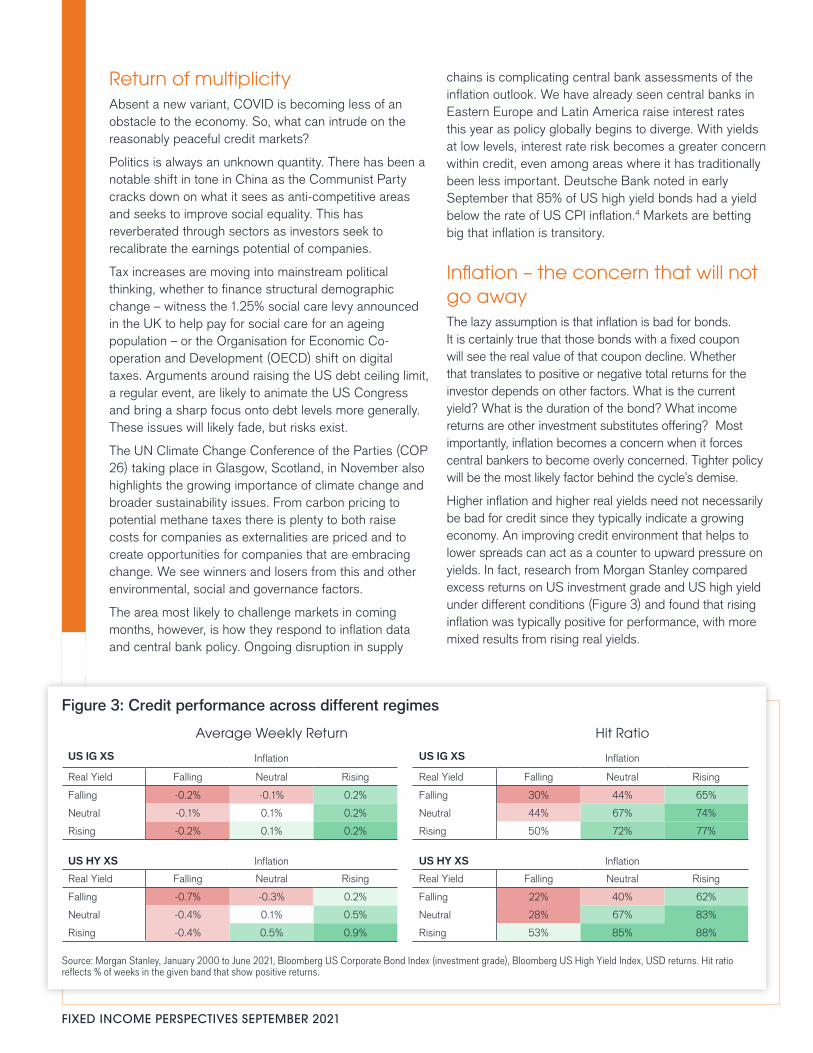
Higher inflation and higher real yields need not necessarily be bad for credit since they typically indicate a growing economy. An improving credit environment that helps to lower spreads can act as a counter to upward pressure on yields. In fact, research from Morgan Stanley compared excess returns on US investment grade and US high yield under different conditions (Figure 3) and found that rising inflation was typically positive for performance, with more mixed results from rising real yields.
Figure 3: Credit performance across different regimes
Source: Morgan Stanley, January 2000 to June 2021, Bloomberg US Corporate Bond Index (investment grade), Bloomberg US High Yield Index, USD returns. Hit ratio reflects % of weeks in the given band that show positive returns.
Average Weekly Return Hit Ratio
US IG XS Inflation US IG XS Inflation
Real Yield Falling Neutral Rising Real Yield Falling Neutral Rising
Falling -0.2% -0.1% 0.2% Falling 30% 44% 65%
Neutral -0.1% 0.1% 0.2% Neutral 44% 67% 74%
Rising -0.2% 0.1% 0.2% Rising 50% 72% 77%
US HY XS Inflation US HY XS Inflation
Real Yield Falling Neutral Rising Real Yield Falling Neutral Rising
Falling -0.7% -0.3% 0.2% Falling 22% 40% 62%
Neutral -0.4% 0.1% 0.5% Neutral 28% 67% 83%
Rising -0.4% 0.5% 0.9% Rising 53% 85% 88%
FIXED INCOME PERSPECTIVES SEPTEMBER 2021
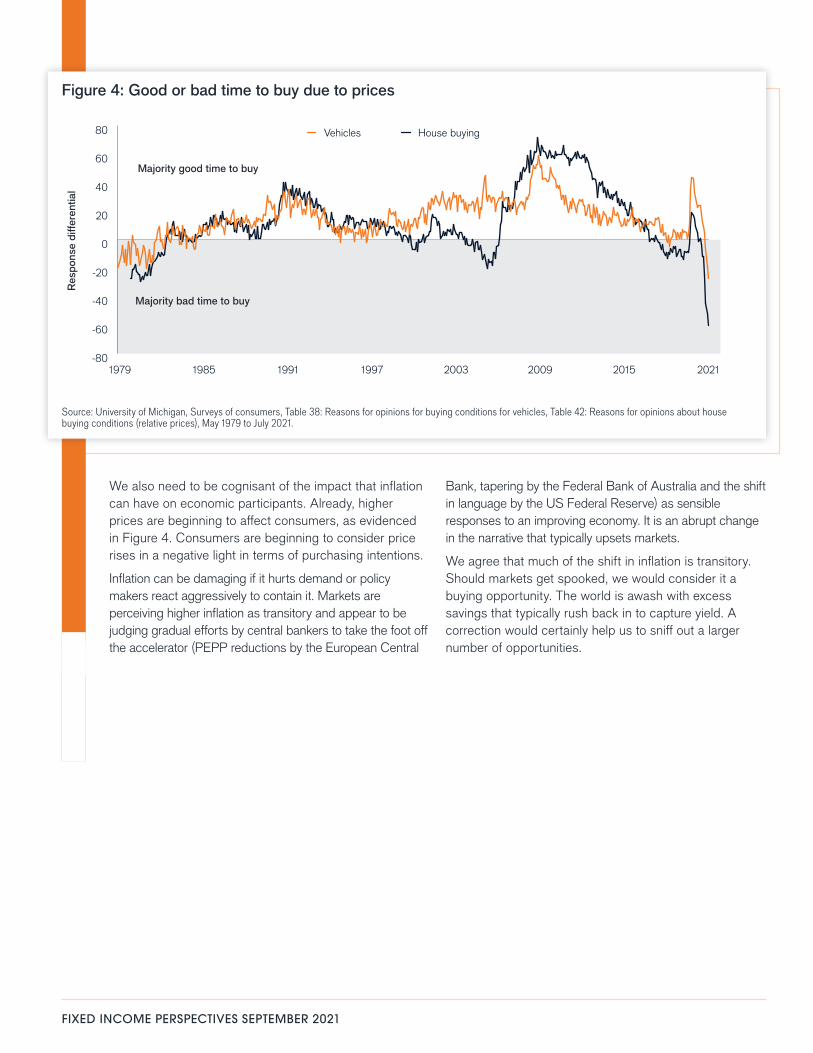
We also need to be cognisant of the impact that inflation can have on economic participants. Already, higher prices are beginning to affect consumers, as evidenced in Figure 4. Consumers are beginning to consider price rises in a negative light in terms of purchasing intentions.
Inflation can be damaging if it hurts demand or policy makers react aggressively to contain it. Markets are perceiving higher inflation as transitory and appear to be judging gradual efforts by central bankers to take the foot off the accelerator (PEPP reductions by the European Central
Bank, tapering by the Federal Bank of Australia and the shift in language by the US Federal Reserve) as sensible responses to an improving economy. It is an abrupt change in the narrative that typically upsets markets.
We agree that much of the shift in inflation is transitory. Should markets get spooked, we would consider it a buying opportunity. The world is awash with excess savings that typically rush back in to capture yield. A correction would certainly help us to sniff out a larger number of opportunities.
Figure 4: Good or bad time to buy due to prices
Source: University of Michigan, Surveys of consumers, Table 38: Reasons for opinions for buying conditions for vehicles, Table 42: Reasons for opinions about house buying conditions (relative prices), May 1979 to July 2021.
-80
-60
-40
-20
0
20
40
60
80
20212015200920031997199119851979
Vehicles House buying
Res
pons
e di
ffere
ntia
l
Majority good time to buy
Majority bad time to buy

FIXED INCOME PERSPECTIVES SEPTEMBER 2021
1Source: Moody’s, 10 August 2021.2Morgan Stanley, 27 September 2021. Gross leverage is debt/earnings before interest, tax, depreciation and amortisation.3Source: Bloomberg, ICE BofA Global High Yield Index, 9 September 2021.4Source: Deutsche Bank, Chart of the Day, 7 September 2021.
GlossaryBasis point (bp): 1/100 of a percentage point. 1 bp = 0.01%, 100 bps = 1%.Correlation: The relationship between two variables. A positive correlation suggests two assets that move in the same direction, albeit potentially at different magnitudes.Default: The failure of a debtor (such as a bond issuer) to pay interest or to return an original amount loaned when due.Duration: measurement of a bond price’s sensitivity to changes in interest rates. The longer a bond’s duration, the higher its sensitivity to changes in interest rates and vice versa.Easy money: Accommodative central bank policy such as low interest rates and asset purchases – the opposite is tighter central bank policy.Gross domestic product: A measure of economic activity.High yield: A bond that has a lower credit rating than an investment-grade bond. These bonds carry a higher risk of the issuer defaulting on their payment, so are typically issued with a higher coupon (interest payment).ICE BofA Global High Yield Index: The index tracks the performance of USD, CAD, GBP and EUR denominated below investment grade corporate debt publicly issued in the major domestic or eurobond markets.Idiosyncratic risks: These are risks that are specific to the borrowing company rather than caused by broader economic factors.Inflation: The rate at which the prices of goods and services are rising in an economy.Investment grade bond: A bond typically issued by governments or companies perceived to have a relatively low risk of defaulting on their payments.Liquidity: The ease with which assets can be traded and/or the flow of money around the economy.Monetary policy/central bank policy: The policies of a central bank, aimed at influencing the level of inflation and growth in an economy. It includes controlling interest rates and the supply of money. Monetary stimulus refers to a central bank increasing the supply of money and lowering borrowing costs. Monetary tightening refers to central bank activity aimed at curbing inflation and slowing down growth in the economy by raising interest rates and reducing the supply of money.Option-Adjusted Spread (OAS): measures the spread between a fixed-income security rate and the risk-free rate of return, which is adjusted to take into account an embedded option.PEPP: Pandemic Emergency Purchases Programme – a scheme by the European Central Bank to purchase assets such as government and corporate bonds to help reduce financing costs and stimulate the Eurozone economy to counter the negative economic effects of COVID.Real yield: The nominal yield of a bond minus the rate of inflation.Risk assets: Financial securities that can have significant price movements (hence carry a greater degree of risk). Examples include equities, commodities, property and lower-rated bonds.Spread/credit spread: The difference in yield between securities with similar maturity but different credit quality. Widening spreads generally indicate deteriorating creditworthiness of corporate borrowers, and narrowing indicate improving.Total return: The overall return taking into account income and any change in capital value.Volatility: Movement up and down in asset prices.

FOR MORE INFORMATION, PLEASE VISIT JANUSHENDERSON.COM
The views presented are as of the date published. They are for information purposes only and should not be used or construed as investment, legal or tax advice or as an offer to sell, a solicitation of an offer to buy, or a recommendation to buy, sell or hold any security, investment strategy or market sector. Nothing in this material shall be deemed to be a direct or indirect provision of investment management services specific to any client requirements. Opinions and examples are meant as an illustration of broader themes, are not an indication of trading intent, are subject to change and may not reflect the views of others in the organization. It is not intended to indicate or imply that any illustration/example mentioned is now or was ever held in any portfolio. No forecasts can be guaranteed and there is no guarantee that the information supplied is complete or timely, nor are there any warranties with regard to the results obtained from its use. Janus Henderson Investors is the source of data unless otherwise indicated, and has reasonable belief to rely on information and data sourced from third parties. Past performance is no guarantee of future results. Investing involves risk, including the possible loss of principal and fluctuation of value. Not all products or services are available in all jurisdictions. This material or information contained in it may be restricted by law, may not be reproduced or referred to without express written permission or used in any jurisdiction or circumstance in which its use would be unlawful. Janus Henderson is not responsible for any unlawful distribution of this material to any third parties, in whole or in part. The contents of this material have not been approved or endorsed by any regulatory agency.Janus Henderson Investors is the name under which investment products and services are provided by the entities identified in the following jurisdictions: (a) Europe by Janus Capital International Limited (reg no. 3594615), Henderson Global Investors Limited (reg. no. 906355), Henderson Investment Funds Limited (reg. no. 2678531), Henderson Equity Partners Limited (reg. no.2606646), (each registered in England and Wales at 201 Bishopsgate, London EC2M 3AE and regulated by the Financial Conduct Authority) and Henderson Management S.A. (reg no. B22848 at 2 Rue de Bitbourg, L-1273, Luxembourg and regulated by the Commission de Surveillance du Secteur
Financier); (b) the U.S. by SEC registered investment advisers that are subsidiaries of Janus Henderson Group plc; (c) Canada through Janus Capital Management LLC only to institutional investors in certain jurisdictions; (d) Singapore by Janus Henderson Investors (Singapore) Limited (Co. registration no. 199700782N). This advertisement or publication has not been reviewed by Monetary Authority of Singapore; (e) Hong Kong by Janus Henderson Investors Hong Kong Limited. This material has not been reviewed by the Securities and Futures Commission of Hong Kong; (f) Taiwan R.O.C by Janus Henderson Investors Taiwan Limited (independently operated), Suite 45 A-1, Taipei 101 Tower, No. 7, Sec. 5, Xin Yi Road, Taipei (110). Tel: (02) 8101-1001. Approved SICE licence number 023, issued in 2018 by Financial Supervisory Commission; (g) South Korea by Janus Henderson Investors (Singapore) Limited only to Qualified Professional Investors (as defined in the Financial Investment Services and Capital Market Act and its sub-regulations); (h) Japan by Janus Henderson Investors (Japan) Limited, regulated by Financial Services Agency and registered as a Financial Instruments Firm conducting Investment Management Business, Investment Advisory and Agency Business and Type II Financial Instruments Business; (i) Australia and New Zealand by Janus Henderson Investors (Australia) Limited (ABN 47 124 279 518) and its related bodies corporate including Janus Henderson Investors (Australia) Institutional Funds Management Limited (ABN 16 165 119 531, AFSL 444266) and Janus Henderson Investors (Australia) Funds Management Limited (ABN 43 164 177 244, AFSL 444268); (j) the Middle East by Janus Capital International Limited, regulated by the Dubai Financial Services Authority as a Representative Office. No transactions will be concluded in the Middle East and any enquiries should be made to Janus Henderson. We may record telephone calls for our mutual protection, to improve customer service and for regulatory record keeping purposes.Janus Henderson, Janus, Henderson, Perkins, Intech, Knowledge Shared and Knowledge Labs are trademarks of Janus Henderson Group plc or one of its subsidiaries. © Janus Henderson Group plc.
C-1021-40193 10-15-22 TL 666-10-440193 10-21