
Private Bank Market Perspectives - privatebank.barclays.com
23
Market Perspectives October 2021 Private Bank
Transcript of Private Bank Market Perspectives - privatebank.barclays.com

Market PerspectivesOctober 2021
Private Bank

Market Perspectives October 2021 | 1
Foreword
After a relatively quiet summer, financial markets finished September worried about the difficulties facing China’s second-largest real estate developer, Evergrande, and its potential impact on both the country’s growth and international markets. That said, for all the uncertainty, many equity markets remain relatively close to all-time highs.
In equities, the outcome of Democrat proposals to link tax rises with planned large-scale infrastructure seem likely to dampen S&P 500 earnings expectations. However, the net effect on company bottom lines of the proposals is unclear. Analysts are unlikely to adjust their earnings estimates until the law is passed, as occurred with Republican tax cut in 2017. It is a case of wait and see.
Turning to fixed income, corporate bond spreads have narrowed considerably since last year, aided by a splurge in central bank liquidity in response to the pandemic. That said, positive signs on the economic front point to persisting tight high yield spreads, and so to their potential return prospects. Avoiding the highest beta bonds offering the highest spread, in a disciplined investment manner, seems a prudent approach in current circumstances.
As for commodities, surging metals and energy prices are attracting the attention of investors and central bankers alike, as inflationary pressures may threaten the economic recovery. Supply outages, extreme weather and the green energy revolution are among culprits driving up prices. Whatever the future holds, commodities can play a role in hedging inflationary pressures.
Indeed, the future for green energy may be affected by November’s COP26 global gathering to tackle climate change. To ensure the successful transition to low-carbon fuels, the use of private capital will be necessary. Direct investments may particularly appeal for some as a way to target once-in-a-generation growth opportunities and influence climate change solutions. At the same time, exposure to green investments can provide diversification benefits to portfolios.
Jean-Damien Marie and Andre Portelli, Co-Heads of Investment, Private Bank


ContributorsJai Lakhani, CFA, London UK, Investment StrategistJulien Lafargue, CFA, London UK, Chief Market StrategistMichel Vernier, CFA, London UK, Head of Fixed Income StrategyNikola Vasiljevic, Zurich Switzerland Head of Quantitative StrategyLukas Gehrig, Zurich Switzerland Quantitative StrategistAlexander Joshi, London UK, Behavioural Finance SpecialistDamian Payiatakis, London UK, Head of Sustainable & Impact InvestingOlivia Nyikos, London UK, Responsible Investment Strategist
Contents4 Are taxing times ahead for
US equities?
6 The credit cycle: what next for corporate bonds?
9 How much longer might commodities drive inflationary pressures?
11 How to diversify investments whatever the macro weather
14 How investors can take their first steps to finding climate-change solutions
16 The danger of fearing market corrections too much
19 Multi-asset portfolio allocation
Market Perspectives October 2021 | 3
Julien Lafargue, CFA, London UK, Chief Market Strategist
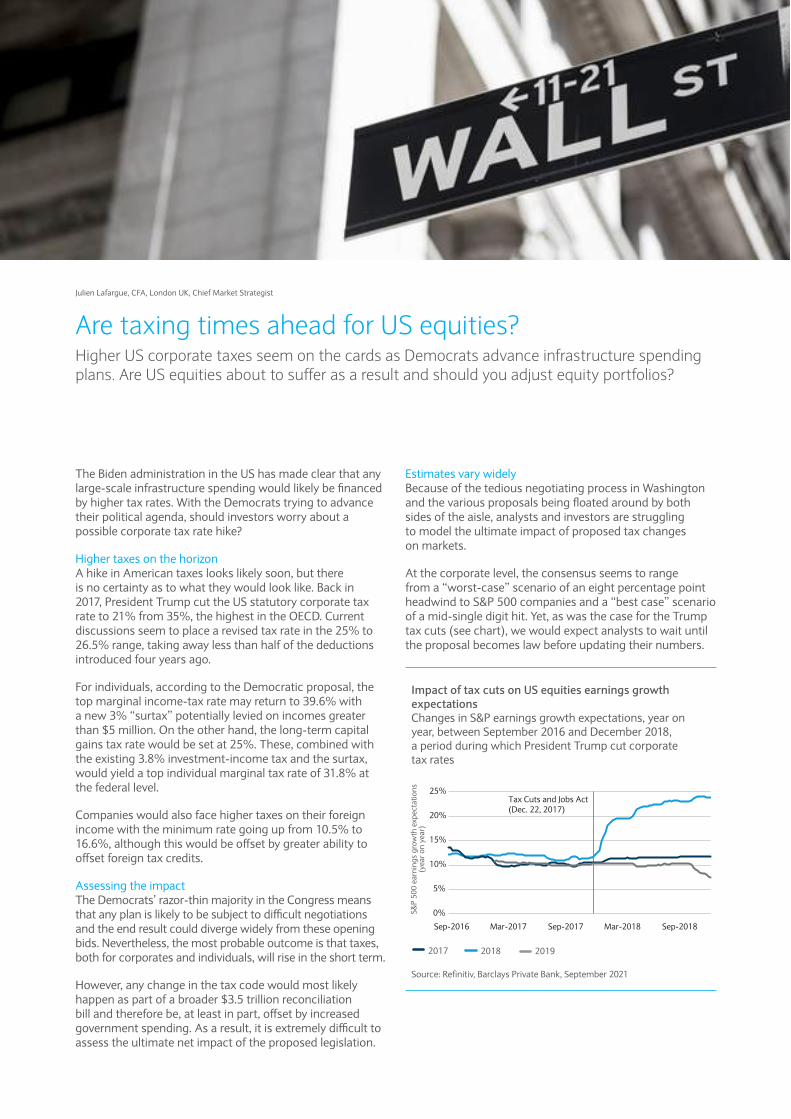
The Biden administration in the US has made clear that any large-scale infrastructure spending would likely be financed by higher tax rates. With the Democrats trying to advance their political agenda, should investors worry about a possible corporate tax rate hike?
Higher taxes on the horizonA hike in American taxes looks likely soon, but there is no certainty as to what they would look like. Back in 2017, President Trump cut the US statutory corporate tax rate to 21% from 35%, the highest in the OECD. Current discussions seem to place a revised tax rate in the 25% to 26.5% range, taking away less than half of the deductions introduced four years ago.
For individuals, according to the Democratic proposal, the top marginal income-tax rate may return to 39.6% with a new 3% “surtax” potentially levied on incomes greater than $5 million. On the other hand, the long-term capital gains tax rate would be set at 25%. These, combined with the existing 3.8% investment-income tax and the surtax, would yield a top individual marginal tax rate of 31.8% at the federal level.
Companies would also face higher taxes on their foreign income with the minimum rate going up from 10.5% to 16.6%, although this would be offset by greater ability to offset foreign tax credits.
Assessing the impactThe Democrats’ razor-thin majority in the Congress means that any plan is likely to be subject to difficult negotiations and the end result could diverge widely from these opening bids. Nevertheless, the most probable outcome is that taxes, both for corporates and individuals, will rise in the short term.
However, any change in the tax code would most likely happen as part of a broader $3.5 trillion reconciliation bill and therefore be, at least in part, offset by increased government spending. As a result, it is extremely difficult to assess the ultimate net impact of the proposed legislation.
Estimates vary widelyBecause of the tedious negotiating process in Washington and the various proposals being floated around by both sides of the aisle, analysts and investors are struggling to model the ultimate impact of proposed tax changes on markets.
At the corporate level, the consensus seems to range from a “worst-case” scenario of an eight percentage point headwind to S&P 500 companies and a “best case” scenario of a mid-single digit hit. Yet, as was the case for the Trump tax cuts (see chart), we would expect analysts to wait until the proposal becomes law before updating their numbers.
Source: Refinitiv, Barclays Private Bank, September 2021
Impact of tax cuts on US equities earnings growth expectationsChanges in S&P earnings growth expectations, year on year, between September 2016 and December 2018, a period during which President Trump cut corporate tax rates
2017 20192018
0%
5%
10%
15%
20%
25%
Sep-2016 Mar-2017 Sep-2017 Mar-2018 Sep-2018
Tax Cuts and Jobs Act(Dec. 22, 2017)
S&P
500
earn
ings
gro
wth
exp
ecta
tions
(yea
r on
year
)
Are taxing times ahead for US equities?Higher US corporate taxes seem on the cards as Democrats advance infrastructure spending plans. Are US equities about to suffer as a result and should you adjust equity portfolios?

Statutory versus effectiveOne other reason why modelling the impact of changes in the tax code is so difficult is the number of tax breaks that allow companies to lower their effective tax rate.
In fact, the majority of S&P 500 companies’ most recently reported effective tax rates were below the 21% statutory federal rate. As such, a 5% increase in the tax rate is unlikely to translate into a 5% downgrade in earnings. Similarly, the impact would vary sector by sector and company by company.
“A 5% increase in the tax rate is unlikely to translate into a 5% downgrade in earnings. Similarly, the impact would vary sector by sector”
Second round effectsLast but not least, in order to properly assess the impact of higher taxes, the second round effects must be considered. As mentioned previously, the Biden administration’s plan is challenging in that it combines a change in both corporate and individuals tax rates while increasing government spending. This may create offsetting factors, all with different timeframes.
For example, higher capital gains taxes could discourage some investors and weigh on stocks’ valuations while infrastructure spending may boost long-term growth prospects. Similarly, improved paid family leave and childcare might boost productivity, though this would be negated if lower corporate profits reduced companies’ ability to boost capital investments.
Wait and see With all this uncertainty, the prudent approach is to wait and see rather than shifting portfolio allocation in anticipation of any potential tax changes. While we can establish that tax rates are likely to rise in the US and market participants haven’t seemed too worried about this until recently, the rest remains speculation at this point. In addition, the macroeconomic landscape (the outlook for inflation, COVID-19 and central bank policy) is likely to have a much larger influence on markets.
As such, we maintain our view that US earnings growth will slow and that valuations will struggle to expand over the rest of the year. This should translate into more modest upside at the index level and higher volatility overall.
“We maintain our view that US earnings growth will slow and that valuations will struggle to expand”
Market Perspectives October 2021 | 5
Equities

Michel Vernier, CFA, London UK, Head of Fixed Income Strategy
The credit cycle: what next for corporate bonds? Much attention seems to be being paid to the outlook for the rate market and the US Federal Reserve’s game plan when it comes to bond purchases. The outlook for corporate bonds seems equally important. A glimpse through the lens of the credit cycle analysis may provide more insights.
Corporate bonds seem to be one of the last resorts for yield in the bond market. US investment grade bonds have returned over 2.5% in the last twelve months, while US 10-year rates surged from 0.65% to 1.35%. The positive performance may be achieved through the excess return of over 5.3%.
As the name suggests, it is the return more (or less) than that of equivalent government bonds within a given period. This consists of the carry (corporate bond yield premium or spread) and the return resulting from spread compression. Indeed, euro corporate bond investors have been able to lock in a small positive return in the last twelve months despite negative yields, helped by an excess return of almost 3%.
Spreads and the credit cycleYield spreads have compressed substantially since the peak of the crisis on the back of early extraordinary monetary support and government guaranty schemes. But are corporate bonds still worth taking the extra risk at current tighter levels? In order to examine the future direction for spreads and corporate bond returns, the following section looks underneath the headline spread levels along with some input factors applied when analysing the credit cycle.
Since spreads of US investment grade and US high yield reached lows in June this year, at 80 basis points (bp) and 270bp respectively, the tightening trend appears to have ended. A deeper look into the European corporate bond market reveals that while the tightening was mostly supported by sectors less exposed to COVID-19 at first, high beta and COVID-19-punished sectors like airlines, autos, energy, lodging and aerospace produced the largest excess return in the last 12 months.
The same can be witnessed through the lens of rating buckets. In the US, high yield CCC-rated bonds have returned roughly 18% in the last year, almost double the
performance of BB-rated bonds. Investors seem to be putting less focus on selection amid the hunt for yield, a typical phenomenon during mid-cycle phases.
Relative attractiveness supports spreadsPast cycles have shown high yield bond spreads, for example, tightening even when the outperformance of riskiest bonds (CCC) starts to reverse. And this time, the continuation of the “grinding tighter period” is mainly led by flows from dedicated bond investors that compare spreads to the next best alternative, being benchmark yields.
Spreads in relation to the very low yield levels suddenly appear more attractive again, as seen in many past crises. This time, US high yield spreads are three-times as high (270bp) as the 5-year US yield (90bp). In 2018 that ratio was one while in 2007 high yield spreads were only half that seen for US 5-year sovereign bond yields. This relative attractiveness of the spreads seems like an important factor keeping them at a relatively tight level during this period.
Spread and yield comparison, as described above, only consider one side of corporate bond markets. In a typical credit cycle analysis, various factors are considered. The following section highlights a few, potentially important, factors in assessing where we are in the credit cycle.
Anatomy of a credit cycle A credit cycle describes the level of access to credit or funding for households and companies which varies over time and consists of four phases: expansion, downturn, repair and recovery. During the expansion phase there is easy access to funds and companies and households have cash to invest or spend. Asset prices generally surge until reaching peak levels.
With elevated leverage and credit in the system, credit costs can become too high and the asset base is not sufficient to serve these credit costs anymore. This may lead to the often

quoted “Minsky moment” named after the US economist Hyman Minsky (the Lehman banking crisis in 2008 and the current property crisis in China are good examples of such moments). Thereafter, balance sheets are restored and leverage is reduced leading to a recovery.
Is the credit cycle different this time?It can be argued that the peak of this crisis has passed and that the cycle may transition from the repair to the recovery phase. However, the pandemic-related crisis was triggered by an external factor and may not represent a typical cycle as described above. In any case, examining the contributing factors to the credit cycle may point to what might lie ahead for spreads and corporate bonds.
Credit cycle factors can typically be categorised into three segments: economy, asset quality and liquidity. Factors include default rates, level of bond issuance and use of proceeds, lending surveys, money supply and balance sheet quality.
Liquidity seems the main driver for spreads, though don’t forget about the economy Liquidity can be measured in various ways. For now, it is grabbing much attention among investors. Central banks responded very quickly to the pandemic by providing extraordinary levels of liquidity through balance sheet expansion and increased money supply.
At almost $8 trillion, the US Federal Reserve’s (Fed) balance sheet grew by the highest level ever while growth in money supply ballooned to record levels. The expansion of the Fed’s balance sheet led to a prolonged period of spread tightening in the years after 2009 and following 2016 for example. At the same time, a reduction of the balance sheet in 2013 and 2018 led to greater volatility in spreads.
The anticipated tapering of asset purchases by the Fed would potentially withdraw an important support for spreads.
Encouraging recovery signsAnother factor is the state and prospects for the economy. The global economy continues to recover from the crisis. High yield spreads in particular tightened in response to increasing purchasing manager confidence levels.
Levels over 60 measured by the US ISM service survey have corresponded with spreads trading close to record tights in the past. For instance, in 2003 the US ISM services oscillated
at levels around 60 for almost 2.5 years keeping spreads at tight levels. In 2014 this period of high ISM readings and tight spreads lasted one year and in 2017 2.5 years (see chart).
Only in a period when both ISM surveys and monetary support declined have spreads started to widen substantially. The ISM survey has been over 60 for only the last six months, potentially leaving room for a period of tighter spreads.
Source: Bloomberg, September 2021
Link between US high yield spreads and US ISM services index The spread on the US high yield bond index compared with the US services purchasing managers' index since 1997
US high yield bond index spread
US ISM purchasing manager index services (invested) RHS
US
ISM
ser
vice
s PM
I (in
vert
ed)
(%)
US
high
yie
ld s
prea
d (%
)
35
40
45
50
55
60
650%
2%
4%
6%
8%
10%
12%
14%
16%
18%
20%
Jun-
97A
pr-9
8Fe
b-99
Dec
-99
Oct
-00
Aug
-01
Jun-
02A
pr-0
3Fe
b-04
Dec
-04
Oct
-05
Aug
-06
Jun-
07A
pr-0
8Fe
b-09
Dec
-09
Oct
-10
Aug
-11
Jun-
12A
pr-1
3Fe
b-14
Dec
-14
Oct
-15
Aug
-16
Jun-
17A
pr-1
8Fe
b-19
Dec
-19
Oct
-20
Aug
-21
Market Perspectives October 2021 | 7
Fixed income

Debt: the new medication The third input factor which seems key is the level of leverage. This section focuses on leverage in the corporate sector in particular. The amount of debt outstanding among US investment grade issuers has doubled over the last decade to over $7 trillion. At the same time the leverage ratio, which compares debt to operating profit, surged from 1.7-times earnings to around 2.7-times earnings. A quarter of the issuers have leverage of more than four-times their respective earnings.
Meanwhile, leverage among high yield issuers declined in the US to 4-times earnings, below the 2008/2019 levels. The decline in leverage within the high yield market in recent months is partly a result of highly leveraged issuers dropping out of the universe as they defaulted during the crisis. Indeed, some larger former investment grade issuers have joined the high yield segment after being downgraded to high yield status (known as fallen angels).
Despite the earnings recovery of late, leverage remains comparatively high. The classical repair phase of the credit cycle, in which leverage after a crisis is reduced substantially, does not seem to have kicked in this time: taking on more cheap debt seems to have been the way out of the crisis for many.
Debt is affordable It seems to have been affordable and efficient for many corporate issuers to operate on higher debt levels. The average coupon for US high yield issuers, for example, is 5.8%. Investment grade companies can be quick to point to the improved interest cover as earnings are roughly ten times as big as the interest cost. However, a brief look over the longer term reveals that this supposedly high interest cover has deteriorated over the last five years. The question remains how much debt is still affordable?
Positive backdrop supports spreads For now, the outlook for corporate bonds has improved significantly since the peak of the crisis eighteen months ago, and spreads should still enjoy support from improving economic backdrop and monetary support. Default rates are declining at a fast pace with the trailing 12 months’ rate for global speculative issuers 3.3%, from a peak of 6.8%, and is expected to decline further this year according to rating agency Moody’s. At the same time, rating upgrades appear to dominate again.
Don’t splash the cashCorporate behaviour is likely to become key. Should companies start to exploit low interest levels by taking on more debt to fund M&A deals and commencing large-scale shareholder distribution via share buybacks or dividends, then the next cycle may start without having gone through the repair phase in this one.
Tight spreads in combination with an overall higher level of leverage warrant a disciplined approach as there is higher risk for volatility. It may involve avoiding the highest beta bonds offering the highest spread. Investment grade bonds, especially with higher duration, look expensive in this context while lower quality high yield bonds seem the most exposed to corrections.
“Should companies start to exploit low interest levels by taking on more debt to fund M&A deals...then the next cycle may start without having gone through the repair phase in this one”

Jai Lakhani, CFA, London UK, Investment Strategist
How much longer might commodities drive inflationary pressures?Calls for a supercycle emerging in the first quarter of the year, and commodities staging a comeback in the third quarter, keep many investors evaluating the effects of mounting price pressures. Can investors help to hedge portfolio return by investing in commodities?
Charging inflation and factory gate prices have dominated the headlines of late. Although the pace at which prices are rising is slowing, commodities continued to appreciate in the third quarter. This pushed producer prices to a nine-year high in China despite Beijing’s best efforts to cool them.
As discussed in previous Market Perspectives, commodities are a big part of the inflation basket for many countries. As such, the recent rally needs to be evaluated against longer term inflationary implications. This helps to better understand whether its impact on inflation might catch investors and central banks off guard and how best investors might be positioned. To answer these questions, we must analyse the drivers behind commodity prices.
A combination of strong demand, climate change concerns, increased regulation, adverse weather conditions and supply shortages seem to be driving the hike in commodity prices in the last six months (see chart).
Industrial metals lead a multi-year hike in commodity pricesBase metals such as aluminium, nickel and lithium have touched thirteen, seven and three-year highs respectively. The headline grabber, aluminium, has had to face supply-side hurdles such as rising freight costs, shortages in Europe and the US. Meanwhile, production of aluminium ore bauxite has been affected by political disruption in Guinea, the world’s second largest producer, as well as a fire forcing a shutdown in a large bauxite refinery in Jamaica.
Source: Bloomberg, Barclays Private Bank, September 2021
Metals lead the charge in commodities this year The performance of the Bloomberg commodity index since 2016, along with precious metals, industrial metals, energy and agriculture subindexes
Bloomberg energy subindex
Bloomberg industrial metals subindex
Bloomberg commodity index
Bloomberg precious metals subindex
Bloomberg agriculture subindex
507090
110130150170190
Mar-2016 Mar-2017 Mar-2018 Mar-2019 Mar-2020 Mar-2021
Tota
l ret
urn
inde
x va
lue
(inde
xed
to10
0 in
Mar
ch 2
016)
At the same time, there’s also the impact of regulation in China. Authorities are restricting output in the Yunnan province (which accounts for 10% of China’s aluminium capacity) from September to December due to electricity supply shortages.
Furthermore, it is worth pointing out that producing aluminium emits a lot of carbon, equivalent to 2% of global emissions. China’s focus on reducing its carbon footprint is restricting output further.
Commodities
Market Perspectives October 2021 | 9

The impact of green initiatives Somewhat paradoxically, although producing aluminium is not climate friendly, the metal itself is used in technologies such as electric vehicles and solar panels. With green demand therefore rising at the same time as supply is declining, it’s unsurprising the metal is soaring past the $3,000 ton mark.
Green demand has also accounted for a lot of the rise in nickel and lithium, largely down to electric vehicle batteries, with demand particularly rising in China. Simultaneously, depleting stocks of lithium battery materials in China and nickel supply falling short despite a 300,000 ton increase of Indonesian nickel supply this year, have supported both metals.
Energy plays its part On the energy front, oil is recovering strongly this year, natural gas has hit seven-year highs and coal also set a new record.
While the transition to cleaner energy is underway and regulation makes using all three energy sources less favourable, demand remains strong. This even applies to coal, with China and India accounting for 65% of coal use.
Both oil and natural gas supply have been affected by Hurricane Ida in the US. The International Energy Agency estimates that once losses are fully tallied, the events may have cut 30 million barrels of US offshore oil output. Three quarters of natural gas production in the Gulf of Mexico has also been lost.
Natural gas prices already had a boost from weather conditions and technical supply shortages in Russia. A warmer than anticipated summer increased demand through air conditioning. Going into the hurricane, supplies were already stretched in the US, and the prospect of limited additional supply from Russia has led to significantly higher gas prices in Europe.
Oil has also seen support as a result of OPEC+ standing strong against pressures to increase production at its September meeting, in addition to regulatory pressure and increased demand with the vaccination helping economies to reopen.
Soft commodity sectorsIn the softs sector, weather has dominated the narrative and resulted in shortages and lower crop yields. Extreme weather conditions in Canada, Europe and Russia have driven wheat and corn futures higher, feeding through
to soybean prices breaking record highs. Hurricane IDA restricted production in 118,000 acres of sugarcane crops in Louisiana, with sugar reaching a four-year high.
Has the rally got more legs and what does this mean for inflation?Commodity price rises are likely to keep translating into inflationary pressures for some time. Historically, commodities have illustrated their effectiveness as an inflation hedge and could be used to dampen inflationary pressures in a portfolio context.
Our cross asset article shows each commodity subsector positively correlated to rising inflation and positive inflation surprises. However, longer term, there are some drawbacks to the whole commodity complex seeing further uplift.
Output cuts and supply shortagesRestrictions in Chinese output of aluminium will encourage new capacity in other parts of the world. Countries such as Russia, Malaysia and India, along with the Middle East region investing in new capacity, might alleviate price pressures. Also, the production of aluminium can be made greener, which would limit the regulatory constrained output of the metal.
Supply shortages arising from adverse weather conditions tend to be temporary as opposed to a permanent phenomenon. We have seen this historically, especially in the softs sector.
Effect on economic recoveryThe potential impact of commodity prices on the health of the economic recovery is a clear risk. That said, further oil price rises seem limited in the short term due to the likely dent in the economic recovery it would cause. Also, higher oil prices may incentivise both members of the wider Organisation of the Petroleum Exporting Countries grouping (OPEC+) like Russia to deviate from the production agreement with other members of the group. Non-OPEC producers such as the US may come back online too.
The knock-on effect of more COVID-19 cases sparking further economic restrictions also hovers in the background.
We anticipate that price pressures may remain, and demand is unlikely to fade for commodities that will be essential for the green revolution and renewable energy. Metals such as lithium, nickel and copper fall into this category.

Lukas Gehrig, Zurich Switzerland, Quantitative Strategist; Nikola Vasiljevic, Zurich, Switzerland, Head of Quantitative Strategy
How to diversify investments whatever the macro weatherFinancial markets are far more correlated than they were in the 2000s. This poses challenges for diversification that needs an additional lens to analyse dependencies. General macroeconomic indicators can inform macro-dependent investment decisions.
The best advice for building a robust portfolio has always been to diversify across different asset classes rather than putting all your eggs into one basket.
As we have argued several times in previous Market Perspectives, diversification has become even more important with the increased globalisation of financial markets. It is well known that diversifying investments beyond a simple mix of equities and bonds offers both opportunities and risks that can strengthen the robustness of a portfolio.
Global financial crisis made its markA less well-known fact is that the correlation between asset classes has increased considerably since the early 2000s. Looking at three distinct periods this century, before the global financial crisis (GFC), between then and the pandemic onset and then since, shows the different correlations between the returns on one-out-of-eight key asset classes against the others (see chart). We have chosen the broad asset classes that would be represented in a typical US dollar.
The blue bars represent the years 2000 until the onset of the GFC. Asset classes like government or investment grade bonds and commodities exhibited only benign correlation to the returns of the other asset classes. This implies that they are good diversifiers for riskier assets, such as high yield credit or equities.
Source: Bloomberg, Barclays Private Bank, September 2021
Post COVID-19GFC-COVID-19Pre GFC
Correlations between asset classes have increasedEach bar represents the median correlation of the risk-adjusted excess return over cash (sharpe ratio) to the remaining asset classes. Time spans: Pre GFC (2000-2007), GFC-COVID-19 (2008-2019), Post COVID-19 (January 2020-August 2021)
Cro
ss-a
sset
cor
rela
tion
-0.4
-0.2
0
0.2
0.4
0.6
0.8
1
Dev
elop
ed g
over
nmen
t bon
ds
Com
mod
ities
Hed
ge fu
nds
Real
est
ate
Emer
ging
mar
ket e
quiti
es
Dev
elop
ed m
arke
t equ
ities
US
high
yie
ld
Inve
stm
ent g
rade
bon
ds
Market Perspectives October 2021 | 11
Cross-asset

Market interventions increased cross-correlationsThe green bars, on the chart on p11, for the inter-crises period show a significant increase in correlation across asset classes. And, while still very short in history, the dark blue bars for the post-COVID-19 period suggest that cross-correlations have risen even more since the outbreak of COVID-19 and the policy responses to it.
This change in correlations, brought about by quantitative easing intended for asset price stabilisation and unprecedented government spending programmes, has undoubtedly made diversification more difficult to achieve.
Macroeconomic regimes can explain asset co-movement While there are sources of uncorrelated opportunities that can be tapped in private markets, these are tailored solutions, which would be difficult to replicate for many investors. Another popular solution to the above-mentioned diversification problem does not actually introduce new, uncorrelated risks, but seeks to better understand the drivers of the co-movement.
Traditionally, growth and inflation are used as macroeconomic indicators, driving returns in financial markets. Indeed, growth (or surprises therein) can explain a large share of the co-movement of risky assets, while inflation can be cited for outperformance of real assets such as commodities. But there is a third driver: monetary policy (see chart).
Source: Bloomberg, Barclays Private Bank, August 2021
The economy in three macroeconomic indicatorsNormalised and aggregated changes in macroeconomic time series on industrial production (growth); Consumer price index and Citi Inflation surprise index (inflation); and fed funds rate and US monetary aggregate M2 (monetary policy)
Growth
Inflation
Monetary policy
z-sc
ores
-5
-4
-3
-2
-1
0
1
2
3
4
5
2000 2003 2006 2009 2012 2015 2018 2021
A question of design In building these macroeconomic indicators, we made a host of assumptions that can influence any subsequent analysis. We selected well-known US indicators, transformed them to year-on-year change basis (where necessary) and normalised the indicators to a mean of zero and comparable variance.
These indicators work well in explaining co-movement in our key asset classes at a medium-term horizon (say six months), where many single event-shocks not captured by the indicators are smoothed out. A much more reactive set of macroeconomic indicators would be needed to explain co-movement on a monthly, weekly or even daily basis.

The real, the cyclical or the risky The chart below visualises the partial correlations between the returns of each asset class and the three macroeconomic indicators. The highlighted black circle marks the zero-line. Points outside of this circle mean positive correlation and vice-versa.
It should come as no surprise that inflation is most negatively correlated with fixed income assets, while being positively correlated with commodities. Growth is most positively related with equities, cyclical commodities and real estate while weighing on returns of gold. Easy monetary policy created an environment where riskier fixed income and equities thrive, while returns on developed government bonds falter.
Source: Bloomberg, Barclays Private Bank, September 2021
The macro-sensitivities of asset classesPartial correlations of six-month returns for each asset class to the three identified macro drivers between January 2000 and August 2021. Partial correlations extract correlation to one factor while removing the influence of the remaining factors.
Growth
Inflation
Monetary policy
0.3
-0.3
-0.2
0.10.2
0.4
0-0.1
Energy
Precious metals
Industrial metals
Investment grade bonds
US high yield
Developed market equities
Emerging market equities
Developed government bonds
Commodities Hedge funds
Real estate
Agriculture
Patterns to be exploited with a tactical tilt The prior analysis shows that asset classes have become more correlated over time and that groups of asset classes (perhaps risky, cyclical or real assets) are associated with specific macro “weather”. We can use this information to help devise a tactical overlay to any given portfolio, overweighting assets that benefit from the current environment.
But there’s more to it The above macroeconomic indicators have become more correlated over time: especially inflation, which has been more correlated to growth and monetary policy in the last decade. Clearly, when everything is correlated, including the underlying macroeconomic drivers, one would be tempted to focus on the high-returning assets.
However, this correlation of macro indicators may reverse. If so, it may be worth making diversification decisions in a portfolio context dependent on both the prevalence and co-movement of macro indicators. But this is something for a later article in this series.
Market Perspectives October 2021 | 13

Damian Payiatakis, London UK, Head of Sustainable & Impact Investing; Olivia Nyikos, London UK, Responsible Investment Strategist
How investors can take their first steps to finding climate-change solutionsAs the COP26 gathering of world leaders approaches to tackle climate change, how can investors can not just avoid climate risk, but start to play their role by investing in climate-change solutions?
As we enter the final weeks before the United Nations COP26 starts in Glasgow on 1 November, media coverage and conversations will intensify around governmental actions to address climate change, and efforts to prevent its breakdown.
Many topics may feel distant to observers – how to price carbon emissions, mobilising an already committed $100 billion per year from developed nations to help less developed countries transition, or improving collaboration between governments and non-state actors.
Global warming: code redHowever, the potential implications of these COP26 discussions are enormous. As the UN released the latest Intergovernmental Panel on Climate Change (IPCC) report in August, the Secretary General stated simply that it is “a code red for humanity”1.
But as the vast majority (86%) of global private wealth holders in our Investing for Global Impact 2021 research confirmed, we can’t rely solely on governments, or charities and corporations, but well-invested private capital will be essential to address climate change2.
Investors, either personally moved or financially astute, may wonder what specific actions they can take in their family portfolios to promote positive change to address climate change.
Setting the framework for action In April, the Institutional Investor Group for Climate Change published a “Net Zero Investment Framework Implementation Guide”3 to support institutional firms seeking to align their or their clients’ portfolios, with the goals of the Paris Agreement. Like other similar industry initiatives, it is not focused on, nor wholly applicable to, private individuals and family portfolios.
However, many aspects remain relevant and useful. Notably, they all broadly propose a net zero investment strategy should focus on achieving two objectives:
1. Decarbonise investment portfolios through use of science-based assessment and pathways that align with achieving global net zero greenhouse gas (GHG) emissions by 2050.
2. Increase investment in the range of “climate solutions” that will support the Paris goals.
For private wealth holders these objectives remain valuable to structure thinking and take action. Decarbonising existing portfolios is a critical element for investors to prepare for the implications of both transition and physical risks on existing and future holdings.
Given both a need and desire to drive change with capital, we focus here on the latter, so opportunities to increase capital allocations to companies providing climate solutions as a more proactive and catalytic approach. Notably, this aligns with the foremost approach of the leading sustainable investors from our research, where 50% said they were “targeting investments to support the transition to a low-carbon economy” (see chart).
Source: Barclays analysis, Investing for Global Impact 2021, September 2021
How do you factor climate change into your investments?Common reasons cited by private wealth holders globally as to how they approach investing for climate change
0% 10% 20% 30% 40% 50% 60%
We/our managers actively engagecompanies and vote about
climate change
We assess risks arising from climatechange in our investments
We void companies we feel are majorcontributors to climate change
We target investments to support thetransition to a low-carbon economy
1 UN, The secretary general’s statement on the IPCC Working Group 1 Report on the physical science basis of the sixth assessment, 9 August 2021 https://www.un.org/sg/en/content/ secretary-generals-statement-the-ipcc-working-group-1-report-the-physical-science-basis-of-the-sixth-assessment
2 Barclays Private Bank, Investing for global impact 2021, September 2021 https://privatebank.barclays.com/campaign0/investing-for-global-impact-2021/
3 Institutional Investor Group for Climate Change, Net zero investment Framework Implementation Guide, 13 April 2021 https://www.iigcc.org/resource/net-zero-investment-framework-implementation-guide/

Deploying capital to innovative opportunities The International Energy Agency notes that of the technologies that are needed to achieve net zero by 2050, almost half are currently only at demonstration or prototype phase. This means that most of the companies generating solutions to climate change will be seeking early- and growth-stage capital.
As ever, investing in early-stage and growth companies presents particular risks, so is not appropriate for all investors. However, looking again to the research, 70% believe the transition to net zero economy presents “the greatest commercial opportunity of our time”, in agreement with Mark Carney’s view as expressed at the launch of the COP26 Private Finance Agenda on 27 February 20204.
Don’t let scale of options overwhelm As a systemic problem, many investors may be overwhelmed when trying to decide where best to start deploying capital. But, climate change is not a single issue that will be addressed through a single sector or single investment.
Today there are a range of sectors, geographies and asset classes where climate investments have the potential to generate attractive returns and catalyse solutions. To help investors’ frame the landscape, we previously provided a structure around three broad outcomes in Greening the Economy in our Outlook 2021.
Direct investments have a particular appeal where an investor has strong conviction or time and appetite to support the growth of a company. However, sometimes not having a specific focus may be better for investors at the earlier stage of their journey.
Both funds, and baskets of companies, provide investors with an opportunity to access fast-growing, climate-related companies, and benefit from the selection expertise of the manager, as well as the diversification benefits of holding many companies. In addition, they often provide familiarity with a range of sectors to allow learned experience to dictate further interest and deeper knowledge.
Leverage your own family’s expertise and role Many investors have existing family businesses that also require “green” technologies to mitigate their emissions or adapt to the physical effects of climate change. Here existing family and business knowledge can be used to identify issues and potential winners in the businesses with leading solutions.
For example, hoteliers will be looking at improving the energy efficiency of their stock or resilience to extreme weather. Those in the auto industry may bring knowledge of where manufacturers are headed with battery technology or charging infrastructure. Agricultural families may be considering precision or regenerative agriculture.
By linking investment opportunities to family interests both the process and, hopefully, the result of the investment will have positive benefits.
“Considering the alternative of inaction both on portfolio and planet level, acting to catalyse solutions can be a way not simply to invest for tomorrow, but influence it”
Taking action As we know from our behavioural expert, taking investment decisions can be challenging when facing considerable uncertainty, especially when the options are both numerous and complex. However, considering the alternative of inaction both on a portfolio and planet level, acting to catalyse solutions can be a way not simply to invest for tomorrow, but to influence it.
For those interested to learn more about how the leading investors referenced in this article are repositioning their portfolios for climate change, a copy of the Investing for Global Impact report is available to download.
4 Bank of England, The Road to Glasgow, 27 February 2020 https://www.bankofengland.co.uk/-/media/boe/files/speech/2020/the-road-to-glasgow-speech-by-mark-carney.pdf?la=en&hash=DCA8689207770DCBBB179CBADBE3296F7982FDF5
Market Perspectives October 2021 | 15
Investing sustainably

Alexander Joshi, London UK, Behavioural Finance Specialist
The danger of fearing market corrections too muchPeriods of continued positive financial market returns can make investors uneasy and expect a correction to be imminent. But duration of time isn’t the driver of the market cycle, and history shows that this shouldn’t be a primary concern for investors.
The outlook for the world economy and financial markets looks far more positive than it did at the outset of the pandemic, if not as strong as it did a few months ago. Global vaccination efforts have led to an opening in those clouds that cast a shadow across the world last year and markets remain relatively close to their highs.
While the calmer markets seen in recent months may be appreciated far more by investors than previous periods of turbulence, others may fear that crosswinds are due.
It can be uncomfortable to be invested when markets are in a period of sustained positive returns, unhindered by substantial drawdowns and hitting record highs. A correction can feel imminent. Why?
The gambler’s fallacyThe gambler’s fallacy is a situation when we believe the likelihood of an event occurring is influenced by previous event outcomes. The market might feel due a correction because it has been rallying for long enough.
In the same way that a roulette wheel doesn’t have to land on red on the next spin because the last few have all been black, the market doesn’t have to correct simply because of a long rally.
What governs the market cycle?Talking about a market cycle implies a cyclicality in the market; that the market will go through periods of expansion and contraction with regularity. The predictable cyclicality of the market can apply well at certain times, such as when a speculative bubble gives way to a crash.
However, expecting the market to correct simply because it has rallied beyond its historical average is the gambler’s fallacy.
“Expecting the market to correct simply because it has rallied beyond its historical average is the gambler’s fallacy”
It is important to reflect on what drives economic growth, expectations of which in turn drive financial market growth. The engines of economic growth and strong market performance will not stop functioning simply because they have been running smoothly and without interruption for an extended period.
Growth is the normWhile past performance is no indicator of future performance, the historical performance of US equities provides a guide for nervous investors.
1. Growth is the norm and not the exception (see chart): Examining US equity market levels shows a steady upward trend since 1990.
Source: Bloomberg, Barclays Private Bank, September 2021
Growth is the norm for US equitiesThe performance of the MSCI USA Total Return index since 1990 at market prices, the rolling 12-month average and long-term growth rates
Market prices (Monthly)
Cyclical growth (Rolling 12M Average)
Long-term (Exponential) growth
0
2000
4000
6000
8000
10000
12000
14000
1990
1992
1994
1996
1998
2000
2002
2004
2006
2008
2010
2012
2014
2016
2018
2020
Mon
htly
US
equi
ty p
rice
leve
l

2. Periods of positive returns are more frequent and lastlonger (see chart below): Examining monthly performancesince 1990, we see positive monthly returns occur two-thirds of the time and that the average duration of monthsof consecutively positive returns are longer than those ofnegative ones (approximately twice as long).
Furthermore, the maximum length of a string of consecutive up markets is three-times as long as that of down markets. Up markets tend to trend month on month. As we’ve discussed before, history shows us that the longer the investor’s holding period, the higher the probability of a gain.
Up markets outperform down markets in terms of frequency and durationComparing monthly returns for the MSCI USA Total Return index by their average, largest, duration length and consecutive monthly runs for up and down markets
US EquitiesUp Market
Down Market
Total count 252 127
Percentage 66.5% 33.5%
Average return 3.1% -3.8%
Largest return 12.3% -18.8%
Average duration 3.13 1.61
Max duration 15 5
Average consecutive return 9.5% -6.1%
Max consecutive return 37.1% -36.2%
Source: Bloomberg, Barclays Private Bank. US Equities represented by MSCI USA Total Return index. All figures expressed on monthly frequency September 2021
3. Markets have continually reached at all-time highs(see chart on right): The chart shows that it is not uncommon for markets to reach all-time highs, which theyhave done once every three months on average between1990 to 2021.
Observed all-time highs for US equities The number of times that a month has ended at an all-time high on the MSCI USA Total Return index since 1990 shows that a high occurred 34.7% of the time
All-time high
Market Price (Monthly)
Source: Bloomberg, Barclays Private Bank September 2021
0
2020
2018
2016
2014
2012
2010
2008
2006
2004
2002
2000
1998
1996
1994
1992
1990
2000
4000
6000
8000
10000
12000
14000
Mon
htly
US
equi
ties
pric
e le
vel
But there are developments I’m worried aboutThe previous charts may give investors useful historical context, though this may not be enough to soothe concerns about the current market. While there are risks that could affect market performance, it may be worth taking a broader view around the impact of events.
As we have discussed previously, a diversified portfolio can protect an investor from the impact of events in different parts of the market. Additionally, in investing, as with life in general, too much weight can be placed on potential negative risks that never actually materialise. In the absence of a crystal ball, investors may be better served by taking cues from history.
There is never a perfect time to invest The risk of events occurring when least expected that might affect the success of your investments always looms on the horizon.
A first step to addressing the fear of such outcomes is to rationally assess them with an advisor and assign likelihoods to them and their likely impact on your portfolio. This may quickly rule out concerns that are unlikely to be material enough to stop you from reaching your goals. By identifying scenarios that may require more attention, portfolios can be adequately positioned to protect yourself in the case that those risks do materialise.
Market Perspectives October 2021 | 17
Behavioural finance

The best way to do that is to adequately diversify a portfolio. It is not a requirement for long-term investment success for an investor to have high conviction views about all market events. By diversifying a portfolio, you don’t have to. A portfolio that is well diversified will at times have assets which are performing less well than others, however it is when bad times occur that the value of these assets is realised.
One cannot rule out an event which takes down the entire market, like the pandemic, but financial markets are resilient and it takes an event of serious proportions to do so. An investor of course will not want to invest when such an event is imminent, but their realisation and their timing can be very difficult to predict. With this in mind, it is our belief that getting and staying invested remains the best option for investors looking to reach their goals over the long term.
“It is our belief that getting and staying invested remains the best option for investors looking to reach their goals over the long term”

Julien Lafargue, London UK, Chief Market Strategist
Multi-asset portfolio allocationBarclays Private Bank discusses asset allocation views within the context of a multi-asset class portfolio. Our views elsewhere in the publication are absolute and within the context of each asset class.
Cash and short duration bonds: high conviction • Given the significant impact of recurring waves of the
COVID-19 virus globally, a preference for higher quality and liquid opportunities – which translates into our positioning in short duration bonds – is maintained
• Although real interest rates remain negative in most jurisdictions, a high conviction in the asset class seems to make sense from a risk management perspective.
Fixed income: low conviction Only modest opportunities are likely in fixed income given market dynamics. Although sovereign rates appear less attractive in the context of low yields, they offer protection in very weak economic environments. For this reason, a small overweight is maintained in developed market government bonds.
In credit, the higher quality segment most appeals. But as spreads have recovered remarkably from their highs during the peak of the crisis, our risk budget is allocated towards the equity space. In high yield, selection is key, and our exposure is low given the tightness of spreads. We prefer high yield and emerging market (EM) hard currency debt over EM local currency debt considering the risk facing their economies and currencies.
Developed market government bonds: high conviction• Developed market government bonds have been under
pressure in recent months as investors reprice inflation and interest rate expectations for a strong economic recovery this year. We continue to see the asset class as an important diversifier however, and maintain our holding at a small overweight
• Although US dollar real rates remain at historically low levels, they are still marginally more attractive relative to the other developed market bond markets. Amid the COVID-19 outbreak and more active central bank behaviour, UK and European bonds have somewhat synchronised with US rates. However, depressed yields make it difficult to find both markets attractive, apart from in respect of managing portfolio risk.
Investment grade bonds: neutral • Significant central bank intervention during 2020
helped to offset a large contraction in the economy and allowed markets to digest a substantial increase in leverage ratios and a higher risk of downgrades
• As spreads are now back to tight levels, selection will be key
• With a potential recovery over the course of 2021 there is still room for spread compression within more cyclical sectors
• Conviction towards the asset class was reduced recently, with proceeds moved into cash.
High yield bonds: low conviction • Amid the market turmoil of a year ago, spreads
widened to historically elevated levels before retracing
• We had previously sought to take advantage of higher spreads in high yield bonds during last year’s sell-off, however the impressive recovery since means that spreads over Treasuries are close to their pre-pandemic levels and well below the long-term average
• Consequently, we have reduced our exposure to the asset class to reflect the lower returns on offer.
Emerging market bonds: low conviction • Emerging market hard currency debt is preferred to
local currency debt considering the risk facing the respective economies and currencies
• Many EM economies run high debt deficits, low currency reserves and potentially lack capacity to deal with the COVID-19 crisis. The recovery from the pandemic differs in EM and is mostly linked to the infection rates, with Latin America, South Africa, Israel, the Philippines and India under pressure
Market Perspectives October 2021 | 19
Multi-asset portfolio allocation

• However, the US Federal Reserve’s dovish stance should continue to provide some relief to the largely dollar-denominated emerging market debt market
• Although corporate fundamentals are less robust and default rates are gradually rising, the majority of EM central banks have helped issuers by maintaining policy rates at very accommodative levels by historical standards. With rising COVID-19 infections starting to affect EM economies and forex, we are more cautious on local currency debt
• Given downside risks from geopolitical issues, we maintain low conviction to the asset class as margin pressure may increase in the current volatile environment.
Equities: high convictionPortfolios have been positioned in high quality, conservatively capitalised businesses for the longer term. Valuations remain elevated by historical standards but unlikely to revert back to their mean until central banks’ support is dialled down. With a blue-sky scenario (from an earnings’ perspective) largely priced in already, we believe investors will need to be selective.
Regionally, we see compelling opportunities in both developed market equities and emerging market equities from a risk budgeting perspective. However, not all emerging markets are created equally and so warrant selectivity. Asia appears to provide a broader opportunity set than elsewhere.
Developed market equities: high conviction• Equity markets have rallied significantly, and are still
optimistic but remain cautious of rising Delta variant cases globally
• Further out, market events have created an opportunity for those willing to take a longer term view and be selective
• The rapid and sizeable response of central banks and governments to events means that policy should be favourable when a recovery takes hold
• Most importantly, active management and selective stock picking of companies with strong balance sheets is favoured. We focus on businesses with high cash returns on capital, with conservative capital structures and ideally an ability to reinvest cash in future growth at equally high rates of return. The US tends to offer us more opportunities to invest in such businesses, meaning that North America remains the largest geographical weighting within the equity allocation.
Emerging market equities: high conviction • Emerging markets have suffered from country specific
risks and slowdown in the region, particularly after the impact of COVID-19
• China imposing lockdowns due to the Delta variant and Beijing reigning in sectors such as technology is resulting in short-term volatility
• While the region may suffer significantly for the pandemic in the short term (especially in Latin America), a secular shift from investment to consumption should support growth over the medium term
• Furthermore, the region should benefit from the benign rate environment
• Asia seems a more attractive prospect for growth than Latin America
• While markets appear increasingly cautious, emerging market equities should benefit from attractive valuations. Our position in the asset class was increased in January.
Other assets: low conviction Alternative asset classes will continue to diversify our portfolio, but are not expected to be the main drivers of returns. Gold’s record as a safe-haven asset remains attractive in the context of a diversified portfolio, and for this reason we are neutral on the asset class. Conversely, real estate and alternative trading strategies are underpinned by a weak investment case.
Commodities: neutral• The sole exposure within commodities continues to be
our position in gold
• Despite a weaker gold price in the past few months, value persists in gold compared to other commodities. This allocation is seen as complementary to the other risk-mitigating assets in the portfolio
• The asset class has little appeal outside of precious metals and our risk budget can be better deployed elsewhere.
Real estate: low conviction • Real estate should continue to provide mild
diversification benefits, helped by loose monetary policy. That said, we maintain a low conviction due to structural headwinds, such as the shift to online retailing, as well as to the higher leverage in the sector.
Alternative trading strategies: low conviction • The low conviction in alternatives reflects their high
expense and a lack of investment opportunities in the space. However, strategies that have low correlations to equities, such as merger arbitrage, appear preferable
• Nonetheless, sudden spikes in volatility, which are likely to materialise more often in a volatile environment, may lift the asset class at least in the short term.

privatebank.barclays.com
Investments can fall as well as rise in value. Your capital or the income generated from your investment may be at risk.
This communication:
(i) Has been issued by the Investments division at Barclays Private Bank (Barclays) and is provided for information purposes only and is subject to change. It is indicative only and not binding. References to Barclays means any entity within the Barclays Group of companies, where “Barclays Group” means Barclays and its affiliates, subsidiaries and undertakings.
(ii) Is not research nor a product of the Barclays Research department. Any views expressed in this communication may differ from those of the Barclays Research department. All opinions and estimates are given as of the date of this communication and are subject to change. Barclays is not obliged to inform recipients of this communication of any change to such opinions or estimates.
(iii) Is general in nature and does not take into account any specific investment objectives, financial situation or particular needs of any particular person.
(iv) Does not constitute an offer, an invitation or a recommendation to enter into any product or service and does not constitute investment advice, solicitation to buy or sell securities and/or a personal recommendation. Any entry into any product or service requires Barclays’ subsequent formal agreement which will be subject to internal approvals and execution of binding documents.
(v) Is confidential and is for the benefit of the recipient. No part of it may be reproduced, distributed or transmitted without the prior written permission of Barclays.
(vi) Has not been reviewed or approved by any regulatory authority.
Any past or simulated past performance including back-testing, modelling or scenario analysis, or future projections contained in this communication is no indication as to future performance. No representation is made as to the accuracy of the assumptions made in this communication, or completeness of, any modelling, scenario analysis or back-testing. The value of any investment may also fluctuate as a result of market changes.
Where information in this communication has been obtained from third party sources, we believe those sources to be reliable but we do not guarantee the information’s accuracy and you should note that it may be incomplete or condensed.
Neither Barclays nor any of its directors, officers, employees, representatives or agents, accepts any liability whatsoever for any direct, indirect or consequential losses (in contract, tort or otherwise) arising from the use of this communication or its contents or reliance on the information contained herein, except to the extent this would be prohibited by law or regulation. Law or regulation in certain countries may restrict the manner of distribution of this communication and the availability of the products and services, and persons who come into possession of this publication are required to inform themselves of and observe such restrictions.
You have sole responsibility for the management of your tax and legal affairs including making any applicable filings and payments and complying with any applicable laws and regulations. We have not and will not provide you with tax or legal advice and recommend that you obtain independent tax and legal advice tailored to your individual circumstances.
Barclays Bank PLC is authorised by the Prudential Regulation Authority and regulated by the Financial Conduct Authority and the Prudential Regulation Authority (Financial Services Register No.122702) and is a member of the London Stock Exchange and NEX. Registered in England. Registered No. 1026167. Registered Office: 1 Churchill Place, London E14 5HP.
Barclays Bank Ireland PLC, trading as Barclays Private Bank, is regulated by the Central Bank of Ireland. Registered in Ireland. Registered Office: One Molesworth Street, Dublin 2, Ireland, D02 RF29. Registered Number: 396330. VAT Number: IE4524196D. Calls are recorded in line with our legal and regulatory obligations, and for quality and monitoring purposes.
Barclays offers private and overseas banking, credit and investment solutions to its clients through Barclays Bank PLC and its subsidiary companies. Barclays Bank PLC is authorised by the Prudential Regulation Authority and regulated by the Financial Conduct Authority and the Prudential Regulation Authority (Financial Services Register No. 122702) and is a member of the London Stock Exchange and NEX. Registered in England. Registered No. 1026167. Registered Office: 1 Churchill Place, London E14 5HP. Barclays Bank PLC, Jersey Branch is regulated by the Jersey Financial Services Commission. Barclays Bank PLC, Jersey Branch is regulated by the Guernsey Financial Services Commission under the Protection of Investors (Bailiwick of Guernsey) Law 1987, as amended. Barclays Bank PLC, Jersey Branch has its principal business address in Jersey at 13 Library Place, St Helier, Jersey JE4 8NE, Channel Islands. Barclays Bank PLC, Isle of Man Branch is licensed by the Isle of Man Financial Services Authority. Barclays Bank PLC, Isle of Man Branch has its principal business address in the Isle of Man at Barclays House, Victoria Street, Douglas, Isle of Man, IM99 1AJ. Barclays Bank PLC, Guernsey Branch is licensed by the Guernsey Financial Services Commission under the Banking Supervision (Bailiwick of Guernsey) Law 1994, as amended, and the Protection of Investors (Bailiwick of Guernsey) Law 1987, as amended. Barclays Bank PLC, Guernsey Branch has its principal place of business at Le Marchant House, St Peter Port, Guernsey, GY1 3BE.
Barclays Bank PLC Monaco is licensed to operate its activities in Monaco and falls under the dual supervision of the Monegasque regulator ‘Commission de Contrôle des Activités Financières’ (with regards to investment services) and the French regulator ‘Autorité de Contrôle Prudentiel et de Résolution’ (in respect of banking services). The registered office of Barclays Bank PLC Monaco is located at 31 avenue de La Costa, MC98000 Monaco – Tel. +377 93 153535. Barclays Bank PLC Monaco is also registered with the Monaco Trade and Industry Registry under No. 68 S 01191. VAT N° FR40 00002674 9.
Barclays Bank PLC Monaco is a branch of Barclays Bank PLC which is registered in England under No. 1026167, authorised by the Prudential Regulation Authority and regulated by the Financial Conduct Authority and the Prudential Regulation Authority. The registered offices of Barclays Bank PLC are located at 1 Churchill Place, London E14 5HP.
Barclays Private Asset Management (Monaco) SAM – 31 Avenue de la Costa, B.P. 4 – MC 98001 Monaco Cedex is registered in Monaco. Tel. +377 93 10 51 51. S.S.E.E. N° 671C06692 –R.C.I. N° 94 S 03039 – Registered VAT No° FR 00 00003617 7.
Barclays Bank (Suisse) SA is a Bank registered in Switzerland and regulated and supervised by FINMA. Registered No. CH-660.0.118.986-6. Registered Office: Chemin de Grange-Canal 18-20, P.O. Box 3941, 1211 Geneva 3, Switzerland. Registered branch: Beethovenstrasse 19, P.O. Box, 8027 Zurich. Registered VAT No. CHE-106.002.386. Barclays Bank (Suisse) SA is a subsidiary of Barclays Bank PLC registered in England, authorised by the Prudential Regulation Authority and regulated by the Financial Conduct Authority and the Prudential Regulation Authority. It is registered under No. 1026167 and its registered office is 1 Churchill Place, London E14 5HP.
Barclays Bank PLC (DIFC Branch) (Registered No. 0060) is regulated by the Dubai Financial Services Authority. Barclays Bank PLC (DIFC Branch) may only undertake the financial services activities that fall within the scope of its existing DFSA licence. Principal place of business: Private Bank, Dubai International Financial Centre, The Gate Village Building No. 10, Level 6, PO Box 506674, Dubai, UAE. This information has been distributed by Barclays Bank PLC (DIFC Branch). Certain products and services are only available to Professional Clients as defined by the DFSA.
Barclays Bank PLC Singapore Branch is a licenced bank in Singapore and is regulated by the Monetary Authority of Singapore. Registered in Singapore. Registered No. S73FC2302A. Registered Office: 10 Marina Boulevard, #25-01, Marina Bay Financial Centre Tower 2, Singapore 018983.
Barclays Bank PLC. Registered in England. Registered No: 1026167. Registered Office: 1 Churchill Place, London, E14 5HP. Registered Office in India: 801/808 Ceejay House, Shivsagar Estate, Dr Annie Besant Road, Worli Mumbai 400 018. Barclays Bank PLC is a member of Banking Codes and Standards Board of India.
IBIM10730_PB

Go further, Reach higher, See beyond.