Potential yields and yield gaps in wheat: the bases of wheat yield progress

Haiying Tao
Aaron Esser
Department of Crop and Soil Sciences
509-335-4389
Managing Nitrogen for Yield and
Protein in Winter Wheat
Wheat Academy 2015

Outline
• N Cycle in the soil-plant-atmosphere system
• Fate of N fertilizers
• Management Practices that affect N Use Efficiency
• Tools and Technologies for N Management
• WSU N management tools
o Dryland Wheat N Fertilizer Calculator
o Post-Harvest N Efficiency Calculator

Inorganic N compounds 2-5% of the total of soil N
Ammonium N (NH4+), nitrate N (NO3
-), nitrite N (NO2-), ammonia
(NH3), nitrous (N2O) and nitric (NO) oxides
Organic N 95-98% of the total soil N
Among the total organic N:
• Bound amino acids, 20-40%
• Amino sugars, 5-10%;
• Purine and pyrimidine derivatives, <1%;
• Unknown, 50%.

N cycle in the soil-plant-atmosphere system
Havlin et al.

N cycle in the soil-plant-atmosphere systemN transformations
Mineralization = organic N to mineral N (NH4+)
Immobilization = mineral N to organic N by microbes
Nitrification = NH4+ to NO3
-
Denitrification = nitrate to gaseous NO, N2O, or N2
Volatilization = Gaseous NH3 loss to the atmosphere (NH4+ to NH3 at high pH
>7.6 and urea to NH3)
NH4+ Fixation = movement of ammonium into clays
Nitrate leaching = movement of nitrate in water below root zone

N Cycling Effects on Soil N Content
N Gains N Losses No Net Change
(Cycling)
N2 Fixation
(natural)
Plant uptake Immobilization
Fertilizer (N2 fixation by human)
Denitrification Mineralization
Animal manure
Sewage sludge
Volatilization Nitrification
Crop residue Leaching NH4+ Fixation
Optimize Minimize Control NUE

• C:N Ratio less than 20:1 = mineralization
greater than = immobilization
• Moisture Level Optimum at 50-70% of field capacity
• Temperature Maximum: 40 - 50° C (104 - 140° F)
Optimum: 25 - 35° C (77 - 95 ° F)
Minimum: 5 - 10° C (40 - 50° F)
• Aeration Most mineralizing bacteria are aerobic.
• pH Microbes can be sensitive to pH
In general, conditions are good for root growth good for N mineralization
C: NSoil Microorganisms 8:1Soil 10:1Grain Straw 80:1

• Soil organic matter (SOM) contains about 5% N.
• During a single growing season 1 - 4% of the SOM is mineralized to inorganic N.
4% SOM @ 2% mineralization 80 lbs N/acre
4% SOM @ 4% mineralization 160 lbs N/acre
• This is one reason it is very difficult to accurately predict the N fertilizer requirement of a crop.
• The amount of N a crop will remove or uptake is fairly uniform from year to year, but the amount of N available to the crop from the soil changes from year to year.
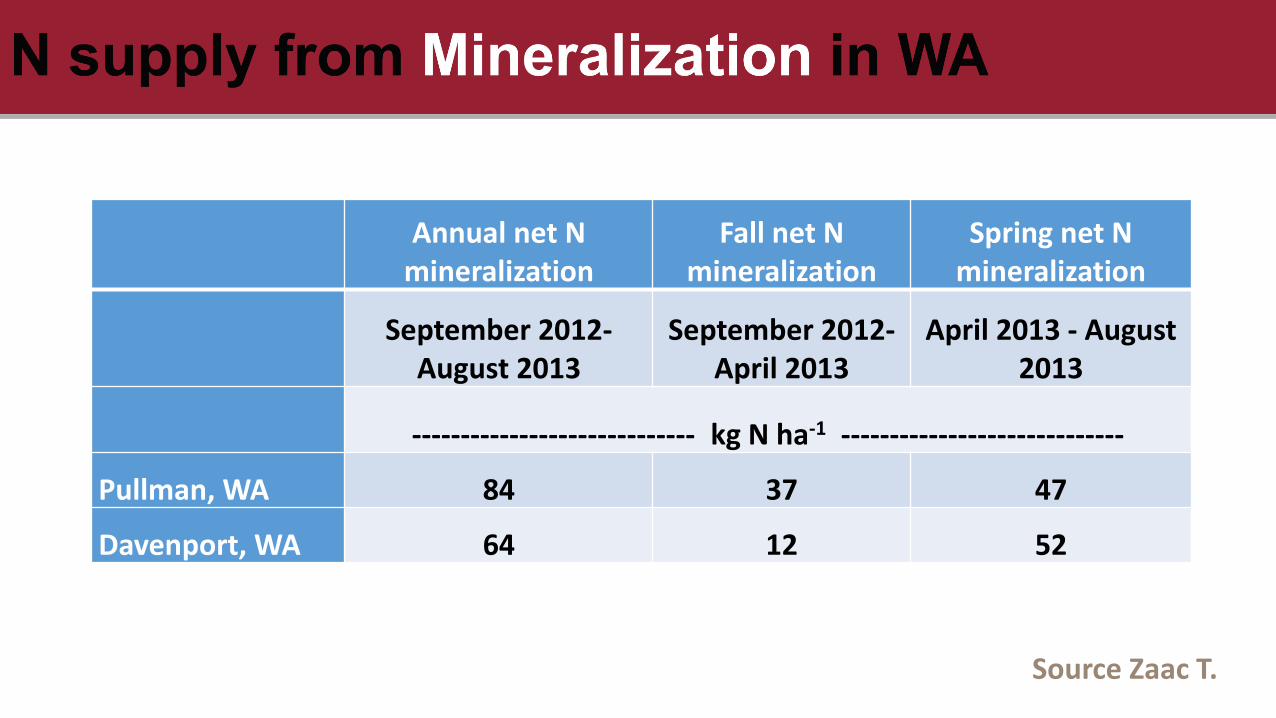
Annual net N mineralization
Fall net N mineralization
Spring net N mineralization
September 2012-August 2013
September 2012-April 2013
April 2013 - August 2013
----------------------------- kg N ha-1 -----------------------------
Pullman, WA 84 37 47
Davenport, WA 64 12 52
Source Zaac T.

April May June July Aug. Sept. Oct
N U
pta
ke a
nd M
inera
lization (
kg/h
a)
Wheat N
Uptake
Corn N
Uptake
N
Mineralization40
80
120
160
Synchrony of soil N mineralization VS
Crop N uptake in corn and winter wheat
Havlin et al.

Fate of Anhydrous Ammonia
(AA) in Soils

Reactions of Anhydrous Ammonia in Soil
NH3 NH3 NH3 NH4+
NH3 NH4+ NH3
Retention zone
FixationLeaching
ImmobilizationNO3-
NitrificationDenitrification
N2O NO N2
Runoff
Absorbed on CEC
NH3

Volatilization
Soil pH effects on percentages of N present as NH3 and NH4+
Ammoniacal N
Soil pH Ammonia Ammonium
---------------% --------------
6 0.058 99.94
7 0.57 99.43
8 5.4 94.6
9 36.5 63.5
Volatilization - Gaseous NH3 loss to the atmosphere.
NH4+ + OH- → NH3↑ + H2O
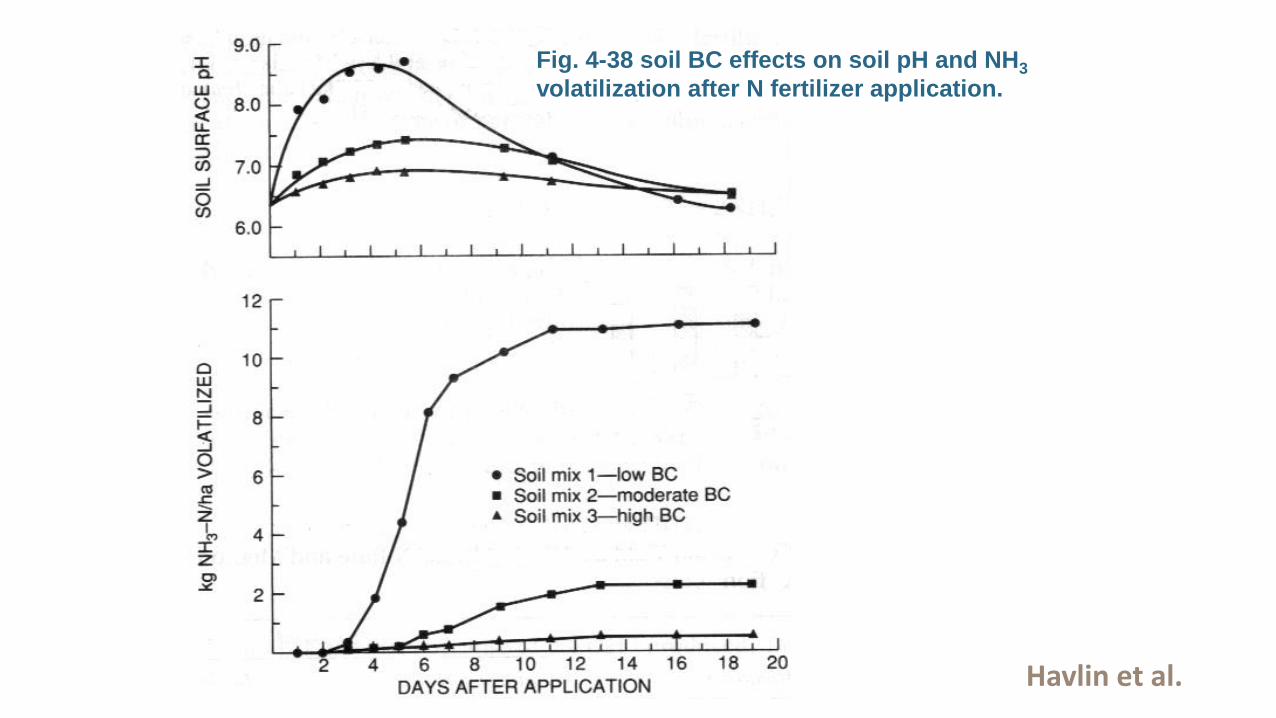
Fig. 4-38 soil BC effects on soil pH and NH3
volatilization after N fertilizer application.
Havlin et al.

Factors Favoring Volatilization
Initially moist soil followed by drying
No rain or irrigation after application
High crop residue on the soil surface
High temperatures
High wind
High soil pH, >7.8
Low clay & organic matter (low CEC)

NH3 Volatilization Losses
• Injection or tillage
• Rain 2-3 days control loss
• Maximum loss of N through volatilization = 20-30% of N
• Up to 50% loss of N through volatilization on calcareous soils

Nitrification
Nitrification --- Conversion of NH4+ NO3
-
• Exclusively carried out by aerobic autotrophs
• Nitrification is fairly rapid under favorable
conditions

Processes of Nitrification
• Step 1: Nitrosommonas
2NH4+ + 3O2 → 2NO2
- + 4H+ + 2H2ONitrite
• Step 2: Nitrobacter
2NO2- + O2 → 2NO3
-
Nitrate Soil
pH
2NH4+ + 4O2 → 2NO3
- + 4H+ + H2O
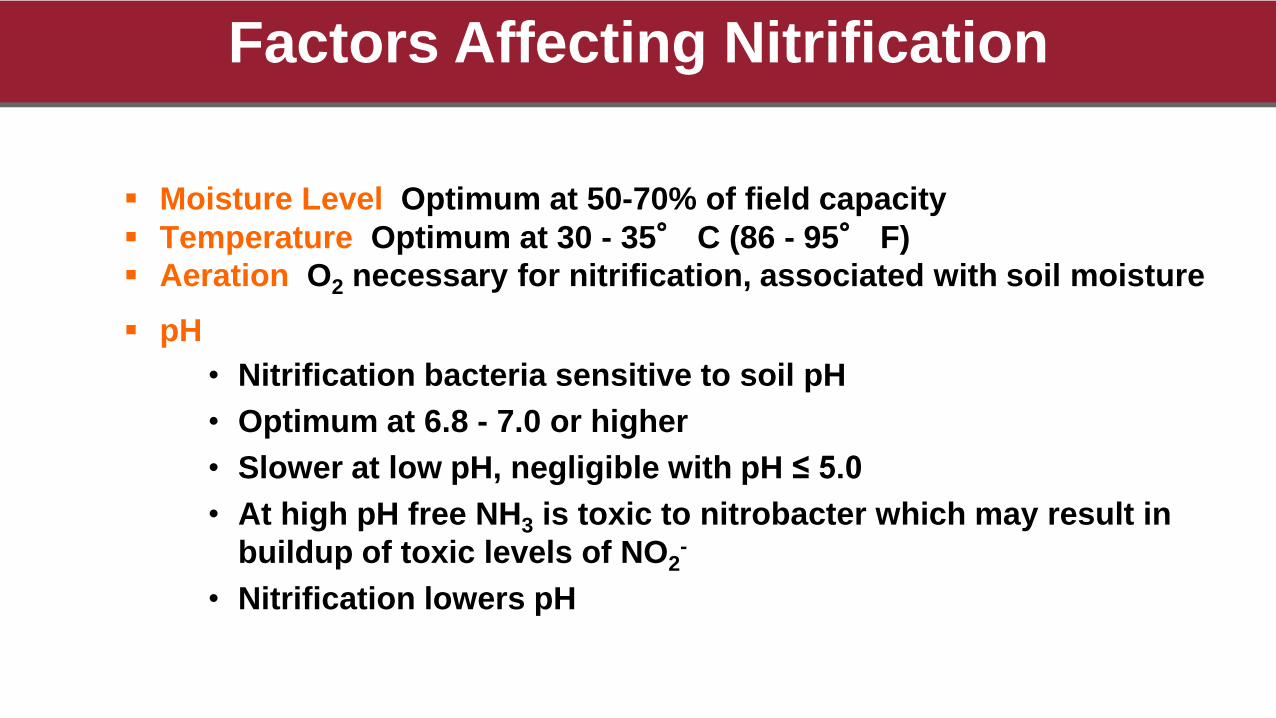
Moisture Level Optimum at 50-70% of field capacity
Temperature Optimum at 30 - 35° C (86 - 95° F)
Aeration O2 necessary for nitrification, associated with soil moisture
pH
• Nitrification bacteria sensitive to soil pH
• Optimum at 6.8 - 7.0 or higher
• Slower at low pH, negligible with pH ≤ 5.0
• At high pH free NH3 is toxic to nitrobacter which may result in
buildup of toxic levels of NO2-
• Nitrification lowers pH
Factors Affecting Nitrification
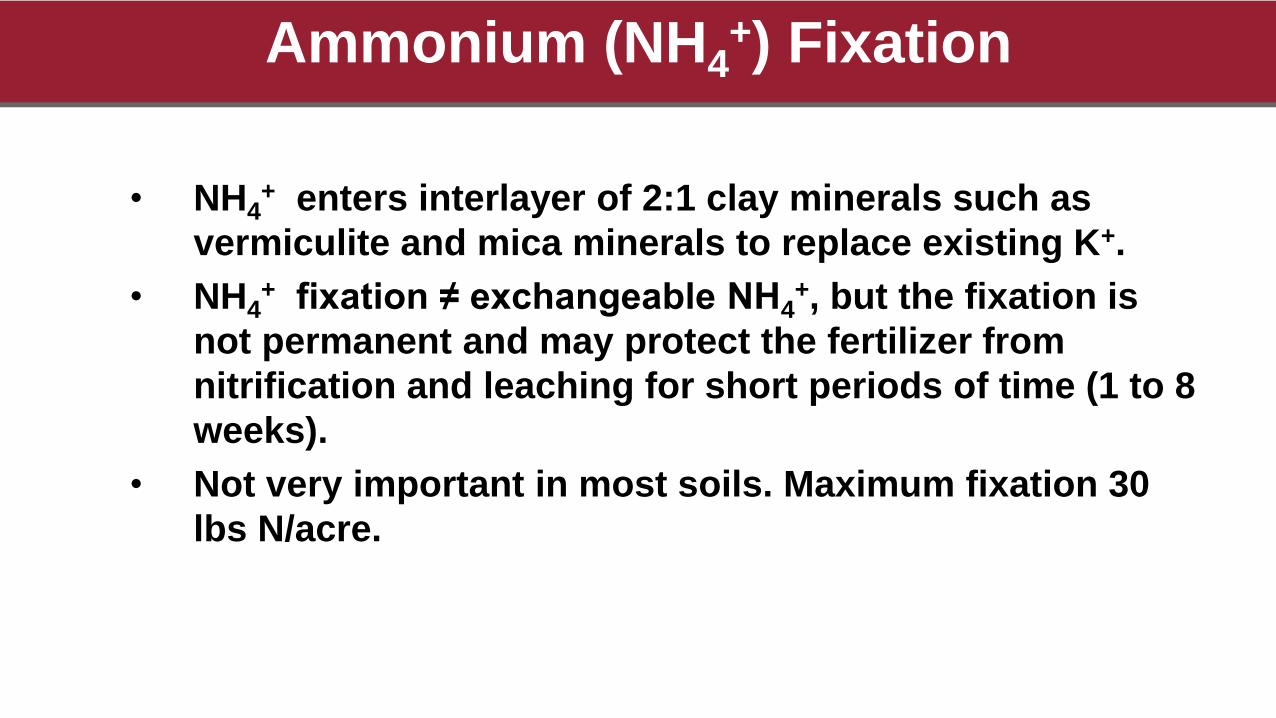
Ammonium (NH4+) Fixation
• NH4+ enters interlayer of 2:1 clay minerals such as
vermiculite and mica minerals to replace existing K+.
• NH4+ fixation ≠ exchangeable NH4
+, but the fixation is
not permanent and may protect the fertilizer from
nitrification and leaching for short periods of time (1 to 8
weeks).
• Not very important in most soils. Maximum fixation 30
lbs N/acre.

Diagram of an expanding clay mineral capable of fixing
native or applied NH4+
NH4+ Fixation
Havlin et al.

• Organisms that decompose organic matter as an
energy source require nitrogen.
• Organic materials with a low N content cannot
supply the needs of these organisms, thus they use
soil N and compete with the crop.
• Freshly immobilized N = 5-15% of soil N.
Immobilization --- Conversion of mineral N to organic N by microbes
Immobilization
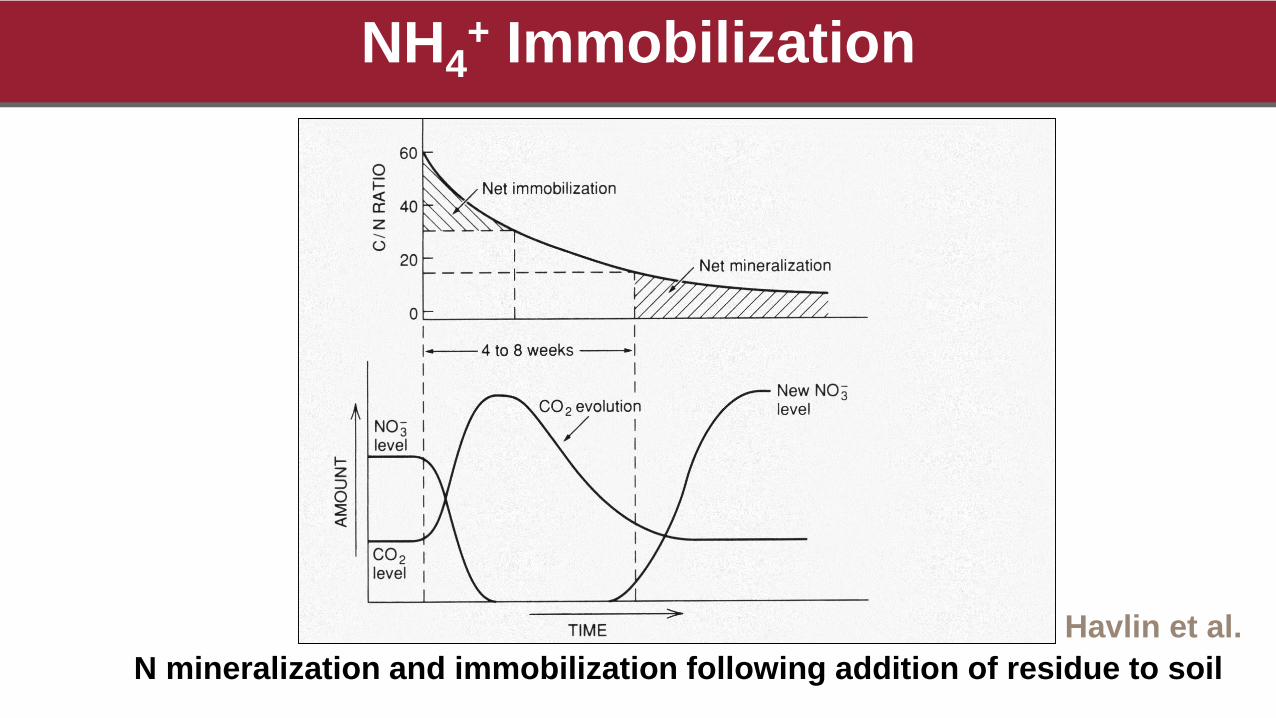
N mineralization and immobilization following addition of residue to soil
NH4+ Immobilization
Havlin et al.

Fate of Urea-Ammonium Nitrate
(UAN) Fertilizers
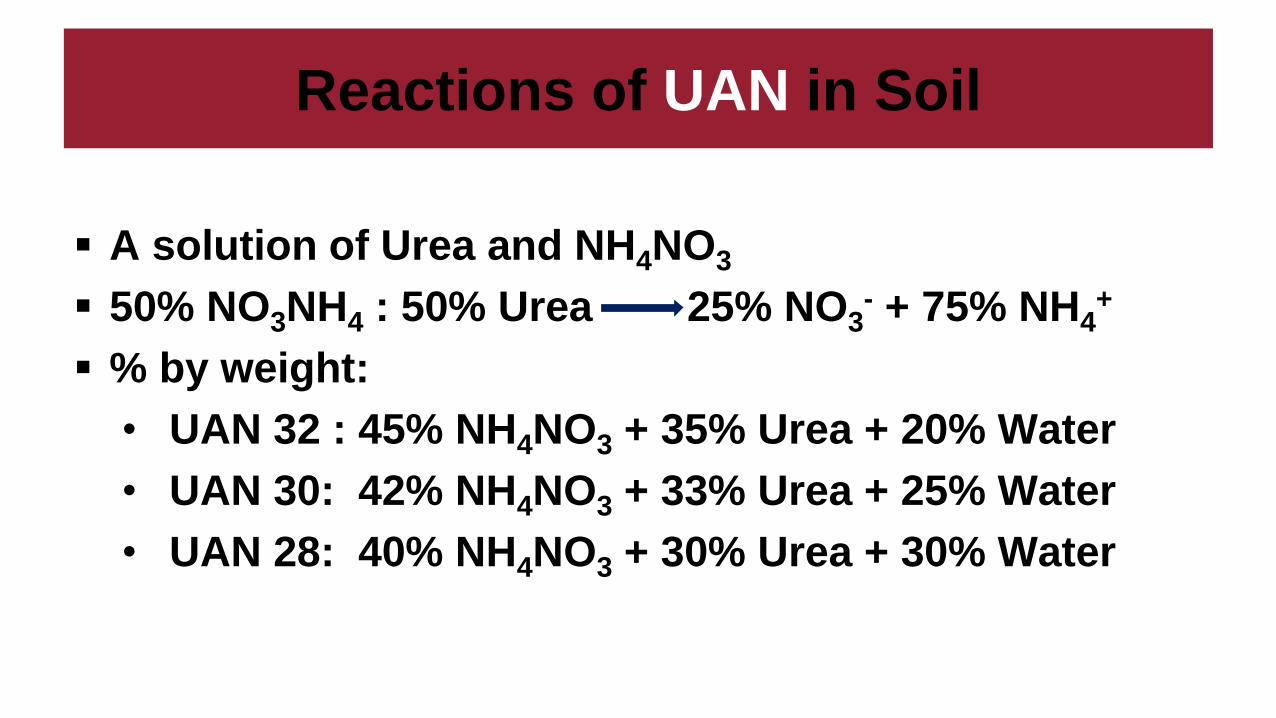
Reactions of UAN in Soil
A solution of Urea and NH4NO3
50% NO3NH4 : 50% Urea 25% NO3- + 75% NH4
+
% by weight:
• UAN 32 : 45% NH4NO3 + 35% Urea + 20% Water
• UAN 30: 42% NH4NO3 + 33% Urea + 25% Water
• UAN 28: 40% NH4NO3 + 30% Urea + 30% Water
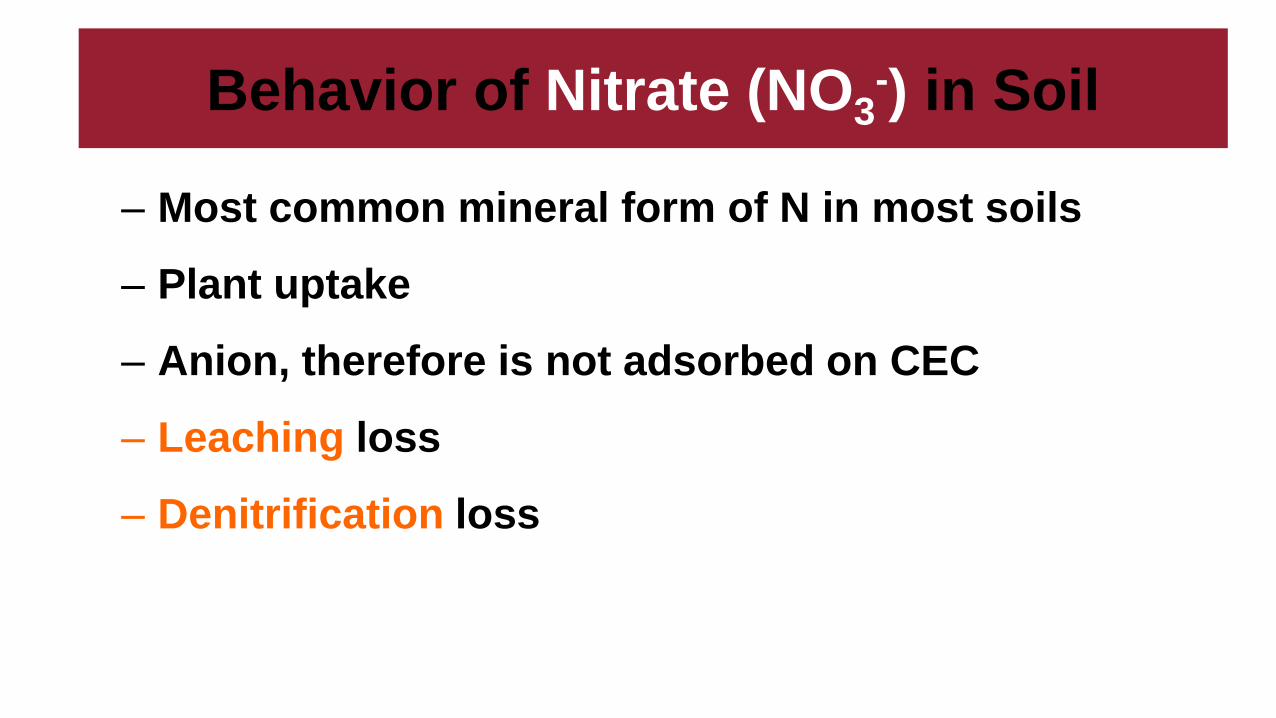
Behavior of Nitrate (NO3-) in Soil
– Most common mineral form of N in most soils
– Plant uptake
– Anion, therefore is not adsorbed on CEC
– Leaching loss
– Denitrification loss

Denitrification --- Conversion of NO3--N to gaseous NO, N2O, or N2
Denitrification
Most denitrifying bacteria are chemoheterotrophic (aerobic) bacteria (e- acceptor = O2) that are capable of anaerobic growth only in the presence of N oxides (nitrate).
Under anaerobic conditions these bacteria use NO3- as the e-
acceptor and carbon (OM) as the e- donor.
NO3- → NO2
- → NO → N2O → N2
Nitrate Nitrite Nitric acid Nitrous oxide Dinitrogen

Conditions needed for denitrification to occur:
– Lack of oxygen (or extremely low oxygen levels)
– A source of carbon (OM)
– A source of nitrate
Denitrification

• Poor soil structure.
• Soil alternately wet and dry.
• Recent additions of easily decomposed carbon such as an alfalfa crop plowed down.
• Flooding.
• pH greater than 5.0, and the higher the pH the quicker the denitrification.
– pH < 5.5 = NO favored
– pH < 5.5-6.0 = N2O favored
– pH > 6.0 = N2 favored
Factors that Favor Denitrification

Factors that Favor Denitrification
Effect of soil water content (% of water-holding
capacity) on denitrification in soil (Havlin et al., 2005)

Factors that Favor Denitrification
Effect of soil pH on denitrification
in soil (Havlin et al., 2005)
Relationship between denitrification capacity and water-
soluble organic C (Burford & Bremner, 1975)Havelin et al.

Reactions of Urea in Soil
(NH2)2CO (Urea) + 2H2O (NH4)2CO3 Urea Hydrolysis
(NH4)2CO3 + 2H+ 2NH4+ + CO2 + H2O
Urease
⁞

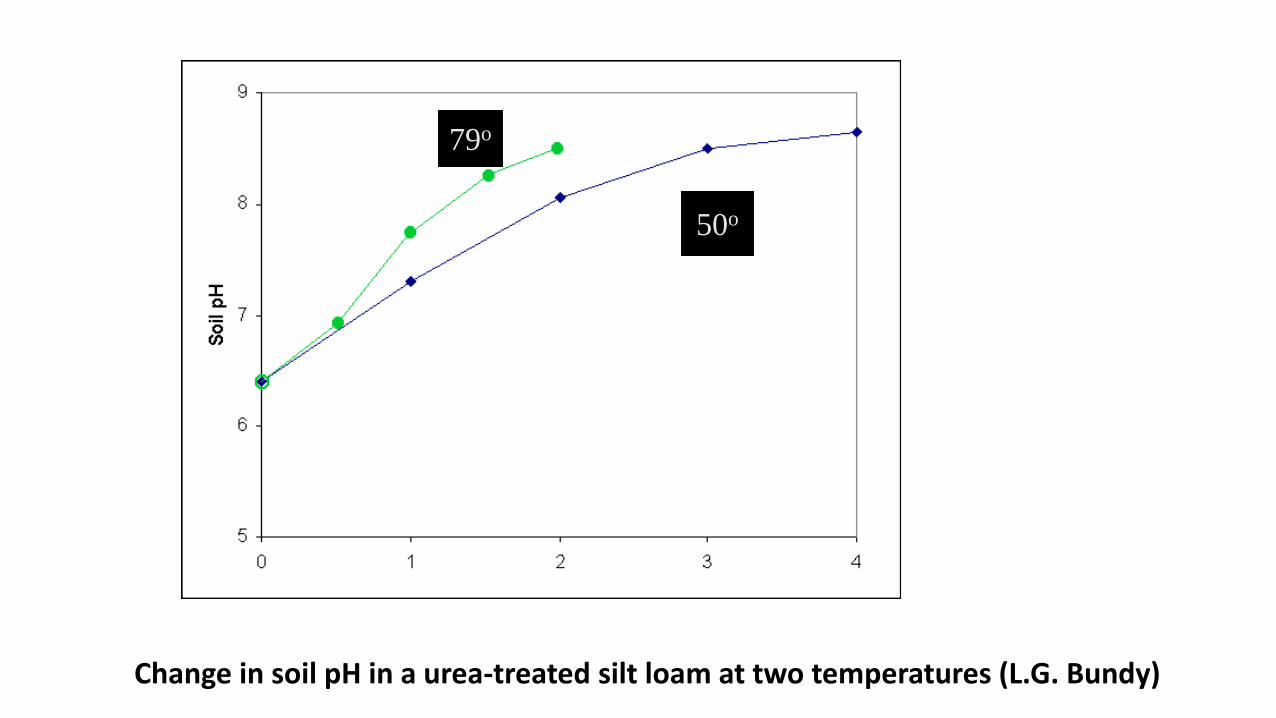
Rates of urea hydrolysis in a silt loam soil at three temperatures (L.G. Bundy)
0
10
20
30
40
50
60
70
80
90
100
0 1 2 3 4
Ure
a h
yd
roly
zed
(%
) 79o
62o
50o
50o
79o
Change in soil pH in a urea-treated silt loam at two temperatures (L.G. Bundy)

N fertilization and soil quality
Application of large amounts of ammonium fertilizers can cause a decrease
of soil pH, can be a problem in no-till system.
• anhydrous ammonia NH3 + 2O2 NO3- + H2O + H+
• urea (NH2)2CO + 4O2 2NO3- + 2 H+ + CO2 + H2O
• ammonium nitrate NH4NO3 + 2O2 2NO3- + 2 H+ + H2O
• ammonium sulfate (NH4)2SO4 + 4O2 2NO3- + 2SO4
-2 + 4 H+ + H2O • monoammonium phosphate
NH4H2O4 + O2 2NO3- + 2 H+ + H2PO4
- + H2O • diammonium phosphate
(NH4)2HPO4 + O2 2NO3- + 3 H+ + H2PO4
- + H2O• elemental S 2S + 3O2 + H2O 2SO4
-2 + 4 H+
• ammonium thiosulfate(NH4)2S2O3 + 6O2 2SO4
-2 + 2NO3- + 6 H+ + H2O

N fertilization and soil quality
• Long-term excessive application of fertilizer N have negative effect
on soil C sequestration. – found by numerous studies
• A research studying effect of N fertilization on soil C sequestration
for different crop rotation grown on Mollisols: net decline in soil C
despite increasingly massive residue C incorporation.
• Fertilizer N applications increase biomass production, but have little benefit to soil C sequestration. – found by numerous studies

Management Practices and NUE
• Climate: rainfall, temperature• 4Rs of nutrient stewardship: Rate, Form, Timing, Placement;
5th R – right data• Variety• Soil: type, drainage, microbiology, soil pH, etc.• Tillage • Crop rotation• Residue management• Fungicides• Herbicides

When are yield components “set”?
Head/acre set
Kernels/head set
Weight/kernelset
Source:R. Koenig

Nitrogen earlyNumber of tillers and kernels/head
Grain protein fromremobilized N
Nitrogen lateWeight/kernel
Higher grain protein
Impacts of nitrogen
Source:R. Koenig

What makes yield?
Heads/area x Kernels/heads x Weight/kernel Source:
R. Koenig

What makes high grain protein?
• Nitrogen taken up during vegetative growth (before flowering)
• Used to grow the plant and make yield, but also stored
• Later, remobilized to grain during grain filling period
• Nitrogen taken up during grain filling
Source:R. Koenig

Rainfall & Crop Rotation vs N Uptake
Source: Zaac T.

Rainfall & Crop Rotation vs N Uptake
Source: Zaac T.

Nitrogen (N) availability
Yie
ld a
nd
pro
tein
Grain yield
Grain protein
Low Moderate Adequate Excessive
Right RateYield-Protein basics: Hard Wheats
Source:W. Pan & R. Koenig
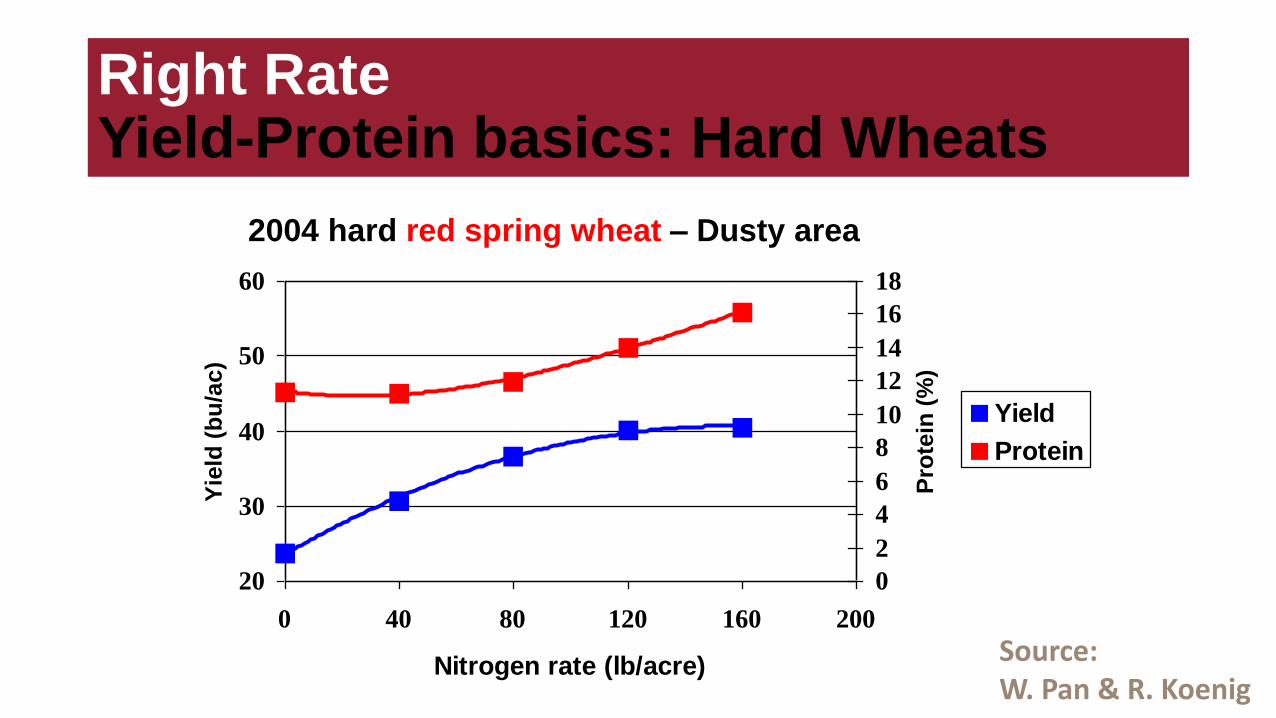
2004 hard red spring wheat – Dusty area
20
30
40
50
60
0 40 80 120 160 200
Nitrogen rate (lb/acre)
Yie
ld (
bu
/ac)
0
2
4
6
8
10
12
14
16
18
Pro
tein
(%
)
Yield
Protein
Right RateYield-Protein basics: Hard Wheats
Source:W. Pan & R. Koenig
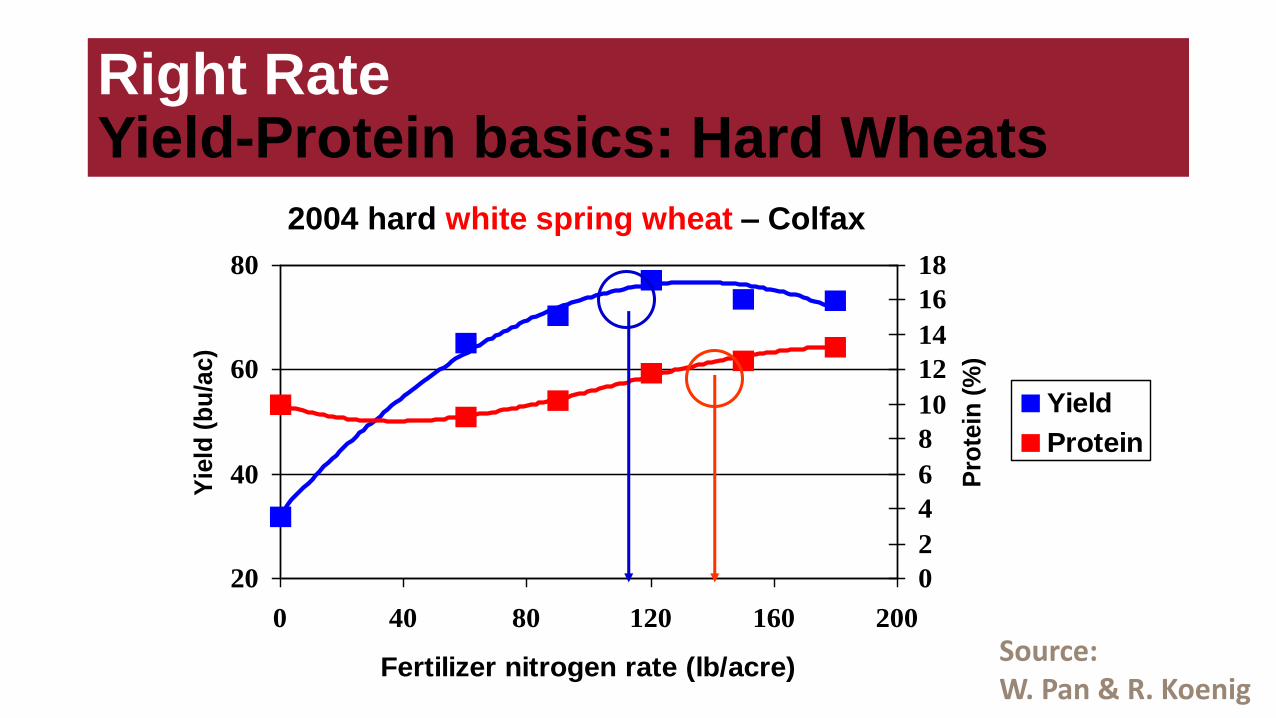
2004 hard white spring wheat – Colfax
20
40
60
80
0 40 80 120 160 200
Fertilizer nitrogen rate (lb/acre)
Yie
ld (
bu
/ac)
0
2
4
6
8
10
12
14
16
18
Pro
tein
(%
)
Yield
Protein
Right RateYield-Protein basics: Hard Wheats
Source:W. Pan & R. Koenig
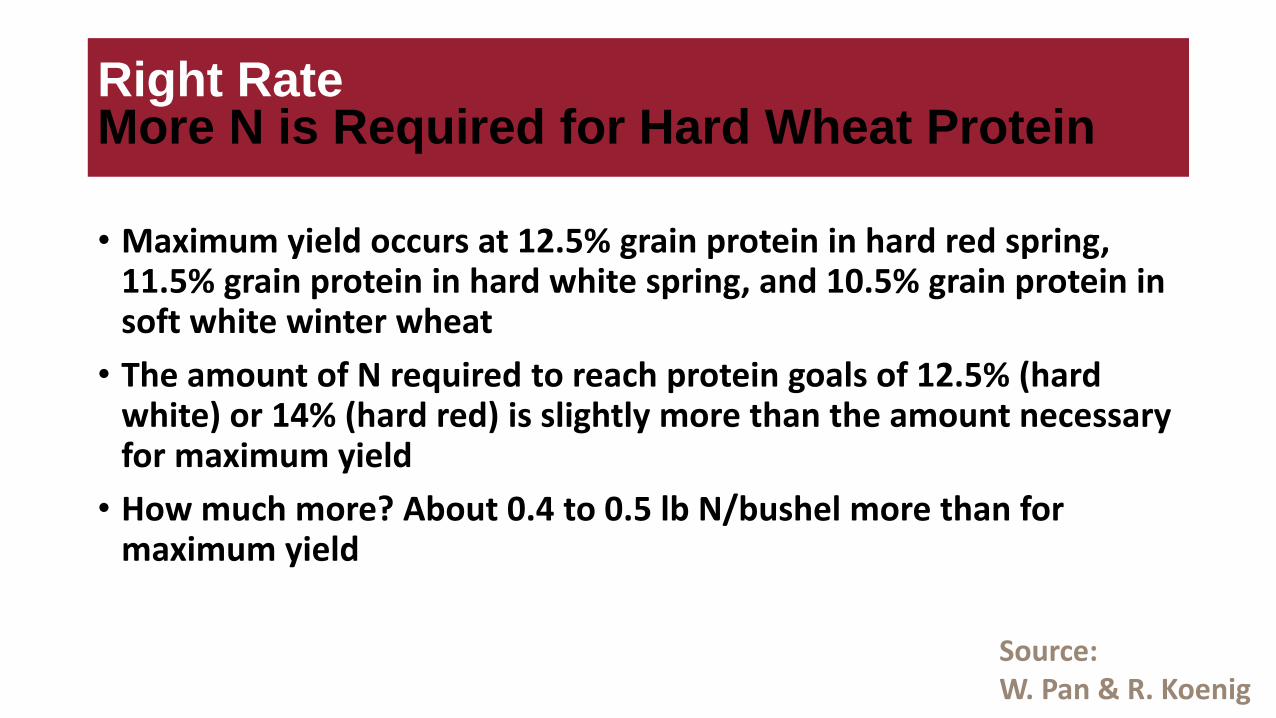
• Maximum yield occurs at 12.5% grain protein in hard red spring, 11.5% grain protein in hard white spring, and 10.5% grain protein in soft white winter wheat
• The amount of N required to reach protein goals of 12.5% (hard white) or 14% (hard red) is slightly more than the amount necessary for maximum yield
• How much more? About 0.4 to 0.5 lb N/bushel more than for maximum yield
Right RateMore N is Required for Hard Wheat Protein
Source:W. Pan & R. Koenig

Right RateN supply - yield and protein trends
20
40
60
80
0 50 100 150 200 250 300
Total nitrogen supply (lb/acre)
Yie
ld (
bu
/ac)
0
2
4
6
8
10
12
14
16
18
Pro
tein
(%
)
Yield
Protein
3.2 lb N/bu
2.6 lb N/bu
Source:W. Pan & R. Koenig

Right RateIt’s not the N applied but the total N supply
• The total amount of N available to wheat is the most important factor in achieving yield and protein goals, not the N fertilizer rate
• Soil residual N, mineralized N, and immobilized N must be accounted for before determining how much fertilizer N is needed
• Soil testing is the only way to quantify soil N contributions• Soil testing will be required (CSP program)
Source:W. Pan & R. Koenig

Right TimingEarly and late N availability are critical
• N taken up during vegetative growth (before flowering) is used primarily to set the yield potential (tillers heads/plant and kernels/head)
• Vegetative N is later remobilized to the kernels to make grain protein
• N taken up after flowering is used to increase size of kernels and grain protein
• This is critical to reach protein goals in hard wheats
Source:W. Pan & R. Koenig

Right TimingSoil N and application timing scenarios (dryland spring sampling)
-6
-5
-4
-3
-2
-1
0
0 5 10 15 20 25 30 35 40 45
Soil residual N (lb/acre)
Dep
th b
elo
w s
urf
ace (
feet)
Fall Spring Fall-springTotal 90 lb N/ac for all timings
N available early in season
N available later in season
}}
Source:R. Koenig
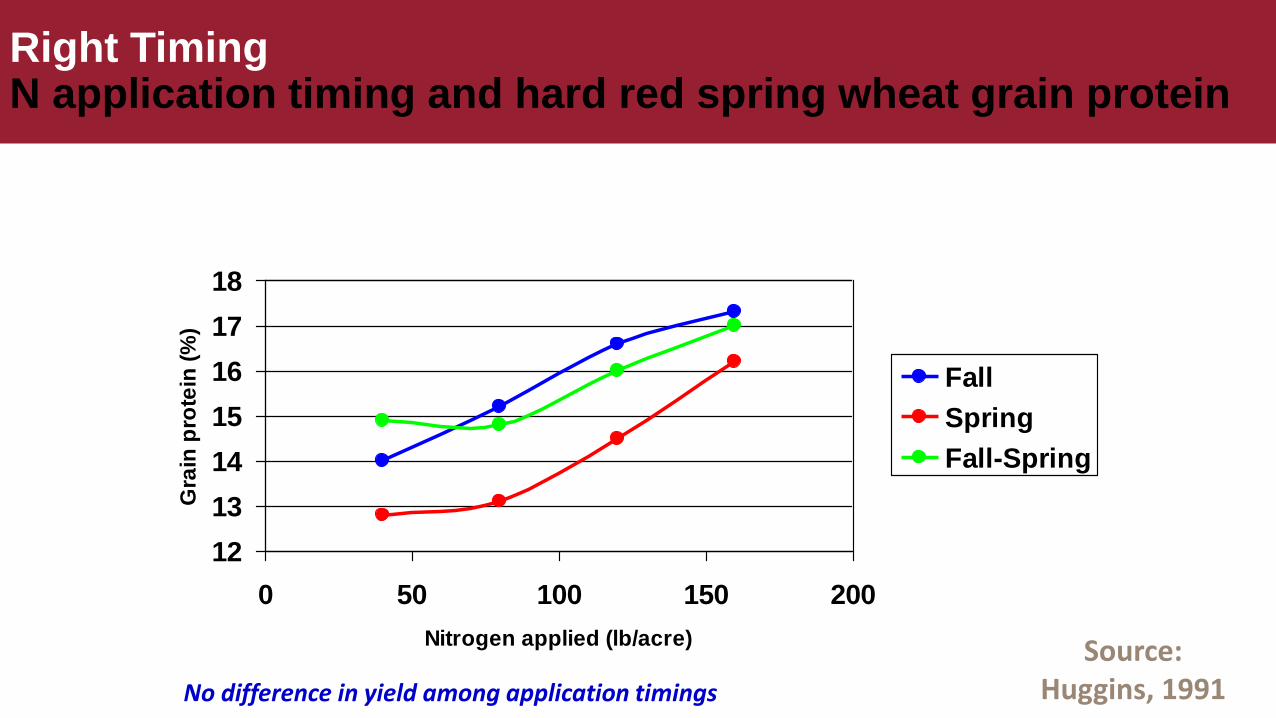
Right TimingN application timing and hard red spring wheat grain protein
12
13
14
15
16
17
18
0 50 100 150 200
Nitrogen applied (lb/acre)
Gra
in p
rote
in (
%)
Fall
Spring
Fall-Spring
No difference in yield among application timings
Source:Huggins, 1991

Right LocationPositional availability of N is importantSpatial variability of N within- and across-field
Availability of N at key times is critical
• Shallow N available early in the season establishes yield potential
• N = tillers heads and kernels per head
• Some protein later
• Subsoil availability of N is critical late in the season when precipitation is limited
• Helps kernels fill, but is also critical to make higher protein in hard wheat
Source W. Pan & R. Koenig
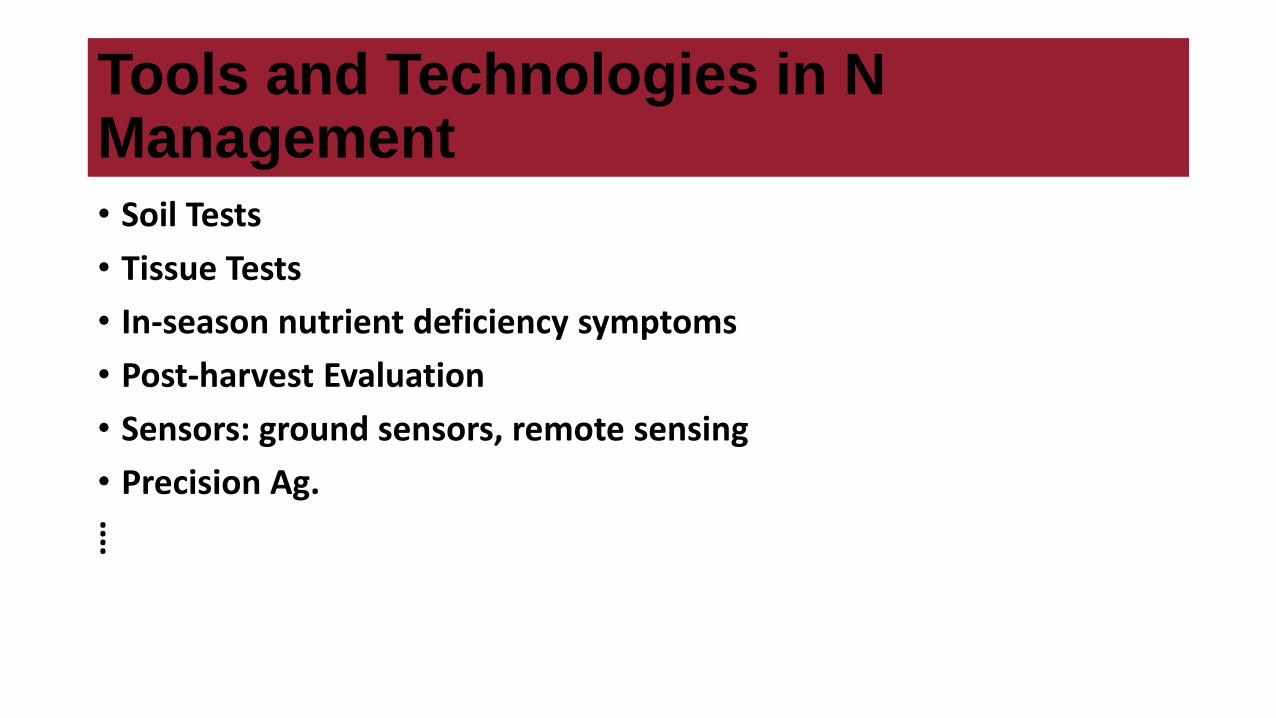
Tools and Technologies in N Management
• Soil Tests
• Tissue Tests
• In-season nutrient deficiency symptoms
• Post-harvest Evaluation
• Sensors: ground sensors, remote sensing
• Precision Ag.
⁞

Some Thoughts
• Optimize N Form × Timing × Rate for target protein
• Right N rate for different varieties
• Variable N rate for spatial variation
• Benchmark best management practices for N in WA
• Post-harvest evaluation for N management
• Continuous improvement of N management : Adaptive nutrient Management

Your input
Soil fertility and residue research and extension/information needs
Immediate Extension Needs
Some issues can be resolved with existing knowledge and resources
• Current issues & Long-term issues• Cooperative projects and joint efforts
Haiying Tao, Department of Crop and Soil [email protected] 509-335-4389

N Recommendation for Winter Wheat
N management for hard wheat protein enhancement:
http://plantbreeding.wsu.edu/pnw0578.pdf
Eastern Washington Nutrient Management Guide:
http://cru.cahe.wsu.edu/CEPublications/EB1987E/EB1987E.pdf
Yield, Protein, N use efficiency of spring wheat: evaluating field-scale
performance:
http://csanr.wsu.edu/publications/researchreports/CFF%20Report/CSANR
2010-001.Ch17.pdf

N Recommendation for Winter Wheat
Wheat and Small Grains: www.smallgrains.wsu.edu
Nitrogen Calculator:
http://wheattools.wsu.edu/Applications/Fertilizer%20Use%20Calc
ulator/
Post Harvest Calculator:
http://wheattools.wsu.edu/Applications/Fertilizer%20Use%20Calc
ulator/

Acknowledgement
Rich KoenigAaron EsserWilliam PanTai Zaac

N Calculator Post Harvest Calculator
Aaron EsserArea Extension Agronomist
Lincoln/Adams CountyWashington State University


![DAGRICULTURAL BIOPHYSICAL PARAMETERS AND THE …RSAD96]-paper.pdfzones related to yield and wheat quality parameters. Key words: Tassled Cap; RapidEye, chlorophyll, nitrogen, senescent](https://static.fdocuments.us/doc/165x107/5e73399ddebf020df318cffb/dagricultural-biophysical-parameters-and-the-rsad96-paperpdf-zones-related-to.jpg)