MANAGEM D ANALYSIS
28
MANAGEMENT’S DISCUSSION AND ANALYSIS 9 Interim Report 2012 BOC Hong Kong (Holdings) Limited FINANCIAL PERFORMANCE AND CONDITION IN BRIEF The following table is a summary of the Group’s key financial results for the first half of 2012 in comparison with the previous two half-yearly periods. Key Performance Trends Profit Attributable to the Equity Holders Return on Average Shareholders’ Equity 1 (“ROE”) and Return on Average Total Assets 2 (“ROA”) Earnings Per Share (“EPS”) and Dividend Per Share (“DPS”) HK$’m 1H2011 1H2012 11,993 8,437 11,243 2H2011 1.33 0.95 1.35 13.19 16.63 19.88 1H2011 1H2012 2H2011 ROA ROE % HK$ 0.6300 0.5580 0.5450 0.7980 1.0634 1.1343 1H2011 1H2012 2H2011 DPS EPS Profit attributable to the equity holders • Profit attributable to the equity holders decreased by 6.3% to HK$11,243 million year-on-year. The decrease was largely due to the net recovery from the underlying collateral of the Lehman Brother Minibonds 3 in the first half of 2011. Should this factor be excluded, it would have increased by 16.2% year-on-year. Solid return with sustainable growth • ROE was 16.63%, down 3.25 percentage points year-on-year. Excluding the impact of the Lehman Brothers-related products in the first half of 2011, ROE would have risen by 0.74 percentage point. • ROA was 1.35%, up 0.02 percentage point year-on-year. Excluding the impact of the Lehman Brothers-related products in the first half of 2011, ROA would have increased by 0.28 percentage point. Consistent return to shareholders • EPS was HK$1.0634. Interim dividend per share was HK$0.545. Financial Position Loan-to-Deposit Ratio 4 Capital Adequacy Ratio 5 Average Liquidity Ratio 6 60.95 61.00 63.00 2011.06.30 2012.06.30 2011.12.31 % 12.87 12.51 12.96 16.90 17.43 17.62 Core Capital Ratio Capital Adequacy Ratio 2011.06.30 2012.06.30 2011.12.31 % % 36.38 35.96 39.87 1H2011 1H2012 2H2011 Loan-to-deposit ratio at a healthy level • Advances to customers increased by 6.8% while deposits from customers grew by 3.4% from the end of 2011. Loan-to-deposit ratio was 63.00%. Solid capital position to support business growth • CAR improved to 17.43%, while core capital ratio stood at 12.96%. Sound liquidity position • Average liquidity ratio improved to 39.87%.
Transcript of MANAGEM D ANALYSIS

ManageMent’s Discussion anD analysis
9Interim Report 2012 BOC Hong Kong (Holdings) Limited
FINANCIAL PERFORMANCE AND CONDITION IN BRIEFThe following table is a summary of the Group’s key financial results for the first half of 2012 in comparison with the
previous two half-yearly periods.
Key Performance Trends
Profit Attributable to the Equity Holders
Return on Average Shareholders’ Equity1 (“ROE”) and Return on Average Total Assets2 (“ROA”)
Earnings Per Share (“EPS”) and Dividend Per Share (“DPS”)
HK$’m
1H2011 1H2012
11,993
8,437
11,243
2H2011
1.330.95
1.3513.19
16.6319.88
1H2011 1H20122H2011
ROA ROE
% HK$
0.6300 0.5580 0.5450
0.7980
1.06341.1343
1H2011 1H20122H2011
DPS EPS
Profit attributable to the equity holders• Profitattributabletotheequityholdersdecreasedby6.3%toHK$11,243millionyear-on-year.Thedecreasewas
largely due to the net recovery from the underlying collateral of the Lehman Brother Minibonds3 in the first half of
2011. Should this factor be excluded, it would have increased by 16.2% year-on-year.
Solid return with sustainable growth• ROEwas16.63%,down3.25percentagepointsyear-on-year.ExcludingtheimpactoftheLehmanBrothers-related
products in the first half of 2011, ROE would have risen by 0.74 percentage point.
• ROAwas 1.35%, up 0.02 percentage point year-on-year. Excluding the impact of the Lehman Brothers-related
products in the first half of 2011, ROA would have increased by 0.28 percentage point.
Consistent return to shareholders• EPSwasHK$1.0634.InterimdividendpersharewasHK$0.545.
Financial Position
Loan-to-Deposit Ratio4 Capital Adequacy Ratio5 Average Liquidity Ratio6
60.95 61.0063.00
2011.06.30 2012.06.302011.12.31
%
12.87 12.51 12.96
16.90 17.4317.62
Core Capital Ratio Capital Adequacy Ratio
2011.06.30 2012.06.302011.12.31
% %
36.38 35.96
39.87
1H2011 1H20122H2011
Loan-to-deposit ratio at a healthy level• Advances tocustomers increasedby6.8%whiledeposits fromcustomersgrewby3.4%fromtheendof2011.
Loan-to-deposit ratio was 63.00%.
Solid capital position to support business growth• CARimprovedto17.43%,whilecorecapitalratiostoodat12.96%.
Sound liquidity position• Averageliquidityratioimprovedto39.87%.

ManageMent’s Discussion anD analysis
10 BOC Hong Kong (Holdings) Limited Interim Report 2012
Key Operating Ratios
Net Interest Margin (“NIM”) Cost-to-Income Ratio Classified or Impaired Loan Ratio7
%
1.211.44
1.64
1H2011 1H20122H2011
%
13.18
37.33
29.68
1H2011 1H20122H2011
0.10 0.10 0.10
2011.06.30 2012.06.302011.12.31
%
Further improvement in NIM in the first half of 2012• NIMwas1.64%,up43basispointsyear-on-year.Duringtheperiod,thereturnonRMBbusinessimprovedandthe
diluting effect of the Group’s RMB clearing bank8 business eased. NIM on non-local RMB business improved slightly
year-on-year.
Stringent cost control• Cost-to-incomeratiowas29.68%.ExcludingtheimpactoftheLehmanBrothers-relatedproductsinthefirsthalf
of 2011, it would have fallen 2.24 percentage points year-on-year.
Solid loan quality• Classifiedorimpairedloanratioremainedlowat0.10%.Formationofnewclassifiedloansremainedatalowlevel.
1. Return on Average Shareholders’ Equity as defined in “Financial Highlights”.
2. Return on Average Total Assets as defined in “Financial Highlights”.
3. The final resolution of certain series of Lehman Brothers Minibonds was announced on 15 June 2011. The net amount of HK$2,854 million recovered by
the Group from the underlying collateral of the Lehman Brothers Minibonds, after deducting the ex gratia payments and provision for trustee expenses,
was credited to operating expenses in the first half of 2011. The net recovery together with the expenses of Lehman Brothers-related products is referred
to as “impact of Lehman Brothers-related products” in the Management’s Discussion and Analysis.
4. The deposit base also includes structured deposits reported as “Financial liabilities at fair value through profit or loss”.
5. Capital adequacy ratio is computed on the consolidated basis that comprises the positions of BOCHK and certain subsidiaries specified by the HKMA for
its regulatory purposes and in accordance with the Banking (Capital) Rules. The bases of regulatory capital calculation for credit risk, market risk and
operational risk are described in Note 3.5 to the Interim Financial Information.
6. The average liquidity ratio is calculated as the simple average of each calendar month’s average liquidity ratio of BOCHK for the period.
7. Classified or impaired loans follow the definitions set out in the Banking (Disclosure) Rules under the Banking Ordinance and represent advances which
are either classified as “substandard”, “doubtful” or “loss” under the Group’s classification of loan quality, or individually assessed to be impaired.
8. Since December 2003, the Bank has been appointed as the clearing bank to provide RMB clearing services in Hong Kong.
11Interim Report 2012 BOC Hong Kong (Holdings) Limited
ManageMent’s DIscussIon anD analysIs
ECONOMIC BACKGROUND AND OPERATING ENVIRONMENTIn the first half of 2012, the state of the global economy
remained volatile. Economic growth indicators in general
appeared lacklustre. The sovereign debt crisis in the
Eurozone continued to pose a serious risk to the global
financial market. The recovery of the US economy also
assumed a slower pace as a result of uncertainties
emanating from its own fiscal policies and the Euro
crisis. In the Mainland, slower economic growth for the
whole year was generally expected as the GDP growth
moderated from 9.2% in the year 2011 to 7.8% in the
first half of 2012.
In Hong Kong, the economic growth showed signs
of losing steam. In the first half of 2012, the GDP
grew by 0.9% over a year earlier. Inflationary pressure
moderated somewhat, with the year-on-year Composite
CPI increasing by 3.7% in June 2012.
After a rather quiet second half of 2011, the local
residential property market revived since March 2012.
The average price of private domestic properties rose by
10.5% in the first half of 2012. However, investment
sentiments in the local stock market turned weak largely
because of the threat of the lingering European debt crisis
and the expectation of a slower economic growth in the
Mainland. As a result, the market turnover in the first half
of 2012 declined by 22.3% year-on-year.
Loan demand slowed down in the first half of 2012
compared to that of 2011. Meanwhile, banks’ funding
pressure for the HKD and USD eased somewhat. Market
interest rates remained low. Average 1-month HIBOR was
0.32% in the first half of 2012, up 0.14 percentage point
year-on-year. The market competition for RMB deposits
intensified as the deployment channels of RMB funds
broadened remarkably, thus fuelling the rise in related
deposit costs.
During the first half of 2012, the liquidity of the offshore
RMB market in Hong Kong has been enhanced under the
new regulations announced by the HKMA. These include
the broadening of the definition of RMB liquid assets for
the purpose of calculating the RMB risk management
limit and the raising of the RMB net open position limit.
The RMB risk management limit has been subsequently
replaced with a RMB liquidity ratio. These changes allow
banks more flexibility and liquidity to facilitate offshore
RMB transactions and lending.
In short, owing to various external uncertainties, the
operating environment for the banking industry remained
highly challenging in the first half of 2012. Banks were
faced with intensifying competition while low interest
spreads continued to constrain the improvement of banks’
net interest margin. At the same time, the slowdown of
certain economic activities meant that there was lower
credit demand. On a positive note, the further expansion
of the offshore RMB market has been presenting the
banking sector with new business opportunities.
The outlook for the second half of 2012 is expected to
consist of a combination of challenges and opportunities.
On the one hand, the global economy would remain
highly uncertain. The Hong Kong economy would
still be subject to risks coming from the unresolved
European debt crisis and the likely slower growth of the
Mainland economy. On the other hand, the Mainland’s
growth stabilising policies would probably give rise to
more business opportunities in Hong Kong. The further
development of the RMB would give impetus to the
expansion of the offshore RMB banking business.

ManageMent’s Discussion anD analysis
12 BOC Hong Kong (Holdings) Limited Interim Report 2012
CONSOLIDATED FINANCIAL REVIEWFinancial Highlights
HK$’m
Half-year ended 30 June 2012
Half-year ended
31 December 2011
Half-year ended
30 June 2011
Net operating income before impairment allowances 18,165 15,720 15,126
Operating expenses (5,391) (5,869) (1,993)
Operating profit before impairment allowances 12,774 9,851 13,133
Operating profit after impairment allowances 12,666 9,375 13,103
Profit before taxation 13,825 10,093 14,587
Profit attributable to the equity holders
of the Company 11,243 8,437 11,993
The Group recorded encouraging financial results in the
first half of 2012. This was made possible by the solid
growth of its traditional businesses, increased contribution
from its RMB businesses as well as prudent cost control.
The Group fully capitalised on its core competencies,
enhanced its service capabilities and captured new
business opportunities, particularly from offshore RMB
businesses. At the same time, it maintained stringent
risk management in view of the more challenging
environment.
In the first half of 2012, the Group’s net operating income
before impairment allowances increased by HK$3,039
million or 20.1% year-on-year to HK$18,165 million. The
increase in income was broad-based. Net interest income
was the major driver, the growth of which was primarily
attributable to loan growth with improved yield and the
better deployment of RMB funds. Net fee and commission
income, net trading gain from foreign exchange as well as
income of the Group’s insurance segment also registered
growth. Operating expenses increased sharply, largely
due to the net recovery from the underlying collateral of
the Lehman Brothers Minibonds in the first half of 2011.
Operating profit before impairment allowances decreased
by 2.7%. Excluding the impact of the Lehman Brothers-
related products, it would have increased by 24.0%.
The Group recorded a modest amount of net charge
of impairment allowances. The net gain on property
revaluation fell year-on-year. Profit attributable to the
equity holders decreased by HK$750 million, or 6.3%, to
HK$11,243 million. Excluding the impact of the Lehman
Brothers-related products, profit attributable to the equity
holders would have increased by 16.2%.
As compared to the second half of 2011, the Group’s net
operating income before impairment allowances rose by
HK$2,445 million, or 15.6%. The growth in income was
again broad-based. Net gain on other financial assets also
rose. Meanwhile, net charge of impairment allowances
decreased while net gain on property revaluation
increased. As a result, profit attributable to the equity
holders increased by HK$2,806 million, or 33.3%.

13Interim Report 2012 BOC Hong Kong (Holdings) Limited
ManageMent’s DIscussIon anD analysIs
INCOME STATEMENT ANALYSISAnalyses of the Group’s financial performance and business operations are set out in the following sections.
Net Interest Income and Margin
HK$’m, except percentage amounts
Half-year ended 30 June 2012
Half-year ended
31 December 2011
Half-year ended
30 June 2011
Interest income 17,772 16,775 15,156
Interest expense (5,153) (5,001) (4,951)
Net interest income 12,619 11,774 10,205
Average interest-earning assets 1,544,663 1,626,293 1,698,704
Net interest spread 1.53% 1.36% 1.14%
Net interest margin* 1.64% 1.44% 1.21%
* Net interest margin is calculated by dividing net interest income by average interest-earning assets.
Compared to the first half of 2011, the Group’s net
interest income increased by HK$2,414 million or 23.7%.
The increase was mainly driven by the widening of net
interest margin. Average interest-earning assets dropped
by HK$154,041 million or 9.1% year-on-year, mainly due
to the decrease in participating banks’ RMB deposits with
the clearing bank. Net interest margin was 1.64%, up 43
basis points. The increase was mainly attributable to the
improved return on the offshore RMB business and the
eased dilution by the Group’s RMB clearing bank business
while NIM on non-local RMB business improved slightly
year-on-year. The return on the offshore RMB business
improved with the increased deployment of RMB funds
in RMB loans and advances, interbank placements and
bonds. In addition, the improved loan pricing and the
higher average balance of loans also contributed to the
NIM improvement. However, this was partly offset by the
higher deposit costs amid keen market competition.
The Group’s RMB clearing bank business had a lower
average spread than other businesses, which dragged
the overall net interest margin in previous periods. In
line with the new developments in offshore RMB market,
coupled with the introduction of the Fiduciary Account
scheme, participating banks reduced their RMB deposits
with the clearing bank. As a result, the diluting effect of
the Group’s RMB clearing bank business on net interest
margin became insignificant in the first half of 2012.

ManageMent’s Discussion anD analysis
14 BOC Hong Kong (Holdings) Limited Interim Report 2012
The summary below shows the average balances and average interest rates of individual categories of assets and liabilities:
Half-year ended 30 June 2012
Half-year ended
31 December 2011
Half-year ended
30 June 2011
ASSETS
Average balance HK$’m
Average yield
%
Average
balance
HK$’m
Average
yield
%
Average
balance
HK$’m
Average
yield
%
Balances and placements with banks
and other financial institutions 388,424 2.42 515,745 1.81 628,593 1.21
Debt securities investments 444,859 2.18 417,015 2.33 423,344 2.36
Loans and advances to customers 696,697 2.34 678,863 2.07 630,343 2.02
Other interest-earning assets 14,683 1.55 14,670 1.23 16,424 1.74
Total interest-earning assets 1,544,663 2.31 1,626,293 2.05 1,698,704 1.80
Non interest-earning assets 184,455 – 162,734 – 160,827 –
Total assets 1,729,118 2.06 1,789,027 1.86 1,859,531 1.64
LIABILITIES
Average balance HK$’m
Average rate
%
Average
balance
HK$’m
Average
rate
%
Average
balance
HK$’m
Average
rate
%
Deposits and balances from banks and
other financial institutions 190,083 0.71 317,392 0.60 441,309 0.89
Current, savings and fixed deposits 1,066,697 0.77 1,045,822 0.69 1,000,360 0.53
Subordinated liabilities 28,640 1.29 28,494 1.94 27,094 2.11
Other interest-bearing liabilities 42,953 0.95 36,937 0.62 41,910 0.40
Total interest-bearing liabilities 1,328,373 0.78 1,428,645 0.69 1,510,673 0.66
Non interest-bearing deposits 87,466 – 71,943 – 67,777 –
Shareholders’ funds* and
non interest-bearing liabilities 313,279 – 288,439 – 281,081 –
Total liabilities 1,729,118 0.60 1,789,027 0.55 1,859,531 0.54
* Shareholders’ funds represent capital and reserves attributable to the equity holders of the Company.
Compared to the second half of 2011, net interest income
increased by HK$845 million or 7.2% primarily due to the
growth in net interest margin. Net interest margin was
1.64%, up 20 basis points. The increase in net interest
margin was mainly due to the improvement in the return
of the offshore RMB business. The diluting effect of the
Group’s clearing bank business eased further as RMB
funds from participating banks continued to decline while
NIM on non-local RMB business also improved. There was
also an improvement in loan pricing while rising deposit
costs continued to put pressure on the net interest spread.

15Interim Report 2012 BOC Hong Kong (Holdings) Limited
ManageMent’s DIscussIon anD analysIs
Net Fee and Commission Income
HK$’m
Half-year ended 30 June 2012
Half-year ended
31 December 2011
Half-year ended
30 June 2011
Credit cards 1,542 1,550 1,337
Securities brokerage 1,054 1,297 1,485
Loan commissions 909 572 588
Insurance 596 487 610
Bills commissions 370 436 418
Payment services 325 334 303
Funds distribution 232 161 176
Trust and custody services 179 225 154
Safe deposit box 118 104 107
Currency exchange 69 80 76
Others 214 180 178
Fee and commission income 5,608 5,426 5,432
Fee and commission expenses (1,506) (1,579) (1,446)
Net fee and commission income 4,102 3,847 3,986
Net fee and commission income grew by HK$116 million,
or 2.9%, year-on-year to HK$4,102 million, primarily due
to the growth of fee and commission income from loans,
credit card business and funds distribution. There was a
decrease of 29.0% in commission income from securities
brokerage in a more sluggish local stock market. Loan
commissions grew strongly by 54.6%. Fee income from
the credit card business grew by 15.3%, driven by the
increase of 10.8% and 16.8% respectively in cardholder
spending and merchant acquiring volume. Commission
from funds distribution rose substantially by 31.8% with
the Group’s strong performance in the distribution of
RMB Qualified Foreign Institutional Investors (“RQFII”)
funds and its continuous effort in enriching its product
shelf to meet customers’ needs. Commission income from
trust and custody services as well as payment services
also registered satisfactory growth. Fee and commission
expenses increased by HK$60 million, or 4.1%, mainly due
to the increase in credit card-related expenses.
Compared to the second half of 2011, net fee and
commission income grew by HK$255 million or 6.6%.
There was growth in the commission income from loans,
insurance and funds distribution. Fee and commission
income from securities brokerage, bills and trust and
custody services declined.

ManageMent’s Discussion anD analysis
16 BOC Hong Kong (Holdings) Limited Interim Report 2012
Net trading gain was HK$1,408 million, increasing by
HK$647 million, or 85.0%, from the first half of 2011.
The growth in foreign exchange and foreign exchange
products was mainly due to the lower foreign exchange
loss on foreign exchange swap contracts*. This was partly
offset by the lower gain from currency exchange activities.
There was a net gain from interest rate instruments and
items under fair value hedge versus a net loss in the same
period in 2011. The improvement was mainly attributable
to the mark-to-market changes of certain interest rate
instruments of both the banking business and BOC Life,
caused by market interest rate movements. The growth
in equity instruments was mainly attributable to the
investment gain of BOC Life’s equity portfolio.
Compared to the second half of 2011, net trading gain
was up HK$459 million or 48.4%. The growth was
mainly due to the lower foreign exchange loss on foreign
exchange swap contracts. It was also due to the mark-to-
market changes of certain interest rate instruments and
foreign exchange products.
* Foreign exchange swap contracts are usually used for the Group’s liquidity management and funding activities. Under the foreign exchange swap contracts,
the Group exchanges one currency (original currency) for another (swapped currency) at the spot exchange rate (spot transaction) and commits to reverse
the spot transaction by exchanging the same currency pair at a future maturity at a predetermined rate (forward transaction). In this way, surplus funds
in original currency are swapped into another currency for liquidity and funding purposes without any foreign exchange risk. The exchange difference
between the spot and forward contracts is recognised as foreign exchange gain or loss (as included in “net trading gain/(loss)”), while the corresponding
interest differential between the surplus funds in original currency and swapped currency is reflected in net interest income.
Net Gain/(Loss) on Financial Instruments Designated at Fair Value through Profit or Loss (“FVTPL”)
HK$’m
Half-year ended 30 June 2012
Half-year ended
31 December 2011
Half-year ended
30 June 2011
Banking business of the Group* 27 (19) 18
BOC Life 159 (719) 380
Net gain/(loss) on financial instruments designated
at fair value through profit or loss 186 (738) 398
* Amounts were after group consolidation elimination.
The Group recorded a net gain of HK$186 million on
financial instruments designated at FVTPL in the first half
of 2012. This gain was mainly attributable to the mark-
to-market changes of certain debt securities of BOC Life,
caused by market interest rate movements. The changes
in market value of its securities portfolio were substantially
offset by the corresponding changes in policy reserves,
as reflected in the changes in net insurance benefits
and claims which were attributable to the movement of
market interest rates.
The net loss in the second half of 2011 was mainly
attributable to the loss from the investment portfolio of
BOC Life amid the weak financial market.
Net Trading Gain/(Loss)
HK$’m
Half-year ended 30 June 2012
Half-year ended
31 December 2011
Half-year ended
30 June 2011
Foreign exchange and foreign exchange products 936 768 662
Interest rate instruments and items under
fair value hedge 305 16 (4)
Equity instruments 104 50 32
Commodities 63 115 71
Net trading gain 1,408 949 761

17Interim Report 2012 BOC Hong Kong (Holdings) Limited
ManageMent’s DIscussIon anD analysIs
Operating Expenses
HK$’m
Half-year ended 30 June 2012
Half-year ended
31 December 2011
Half-year ended
30 June 2011
Staff costs 3,028 3,298 2,740
Premises and equipment expenses
(excluding depreciation) 681 780 610
Depreciation on owned fixed assets 722 663 614
Other operating expenses 960 1,090 864
Core operating expenses 5,391 5,831 4,828
Impact of Lehman Brothers-related products* – 38 (2,835)
Total operating expenses 5,391 5,869 1,993
At 30 June 2012
At 31 December
2011
At 30 June
2011
Staff headcount measured in full-time equivalents 14,534 14,475 14,104
* Refer to note 3 to the section of “Financial Performance and Condition in Brief” for details.
Total operating expenses increased by HK$3,398 million,
or 170.5%, to HK$5,391 million year-on-year, as there
was a net recovery of HK$2,854 million from the
underlying collateral of the Lehman Brothers Minibonds
in the first half of 2011. Core operating expenses rose
by HK$563 million, or 11.7%, reflecting the Group’s
continued investment to support long-term business
growth while maintaining disciplined cost control and
operational efficiency.
Staff costs increased by 10.5%, mainly due to higher
salaries as a result of annual salary increment, increase in
headcount and performance-related remuneration.
Premises and equipment expenses rose by 11.6% with
higher rental for branches, in particular those in the
Mainland, as well as higher IT costs. Depreciation rose by
17.6%. It was largely attributable to larger depreciation
charge on premises following the upward property
revaluation in Hong Kong and on IT equipment as the
Group continued to invest in its IT infrastructure.
Other operating expenses were up by 11.1% mainly due
to higher marketing and promotion expenses as well as
expenses connected with the increasing business volume.
Compared to the second half of 2011, operating expenses
declined by HK$478 million or 8.1%. The decrease was
due to lower staff costs, promotion, IT and maintenance
expenses in the first half of 2012.

ManageMent’s Discussion anD analysis
18 BOC Hong Kong (Holdings) Limited Interim Report 2012
Net (Charge)/Reversal of Loan Impairment Allowances
HK$’m
Half-year ended 30 June 2012
Half-year ended
31 December 2011
Half-year ended
30 June 2011
Net (charge)/reversal of allowances before recoveries
– individual assessment (5) (54) 42
– collective assessment (238) (425) (295)
Recoveries 156 137 216
Net charge of loan impairment allowance (87) (342) (37)
The Group’s loan quality remained solid with a modest
net charge of loan impairment allowances of HK$87
million in the first half of 2012. There was a small net
charge of HK$5 million in individually assessed impairment
allowances. The lower net charge of collectively assessed
impairment allowances was primarily due to the periodic
review of the parameter values in the assessment model in
the first half of 2011 as well as the stronger loan growth
in the first half of 2011 relative to that in the same period
of 2012. Both of these factors have led to a higher net
charge of collectively assessed impairment allowances in
the first half of 2011. Meanwhile, recoveries during the
period totaled HK$156 million.
Compared to the second half of 2011, net charge of loan
impairment allowances decreased by HK$255 million.
The decline was mainly due to the lower net charge of
collectively assessed impairment allowances as a result
of the periodic review of the parameter values in the
assessment model conducted in the second half of 2011
which led to a higher net charge for the corresponding
period.
BALANCE SHEET ANALYSISAsset Deployment
At 30 June 2012 At 31 December 2011
HK$’m, except percentage amounts Amount % of total Amount % of total
Cash and balances with banks and
other financial institutions 153,042 9.1% 278,795 16.0%
Placements with banks and other
financial institutions maturing
between one and twelve months 114,548 6.8% 107,910 6.2%
Hong Kong SAR Government
certificates of indebtedness 72,160 4.3% 65,890 3.8%
Securities investments1 439,835 26.1% 425,600 24.5%
Advances and other accounts 785,932 46.6% 755,229 43.5%
Fixed assets and investment properties 57,194 3.4% 52,091 3.0%
Other assets2 62,011 3.7% 52,995 3.0%
Total assets 1,684,722 100.0% 1,738,510 100.0%
1. Securities investments comprise investment in securities and financial assets at fair value through profit or loss.
2. Interests in associates, deferred tax assets and derivative financial instruments are included in other assets.
19Interim Report 2012 BOC Hong Kong (Holdings) Limited
ManageMent’s DIscussIon anD analysIs
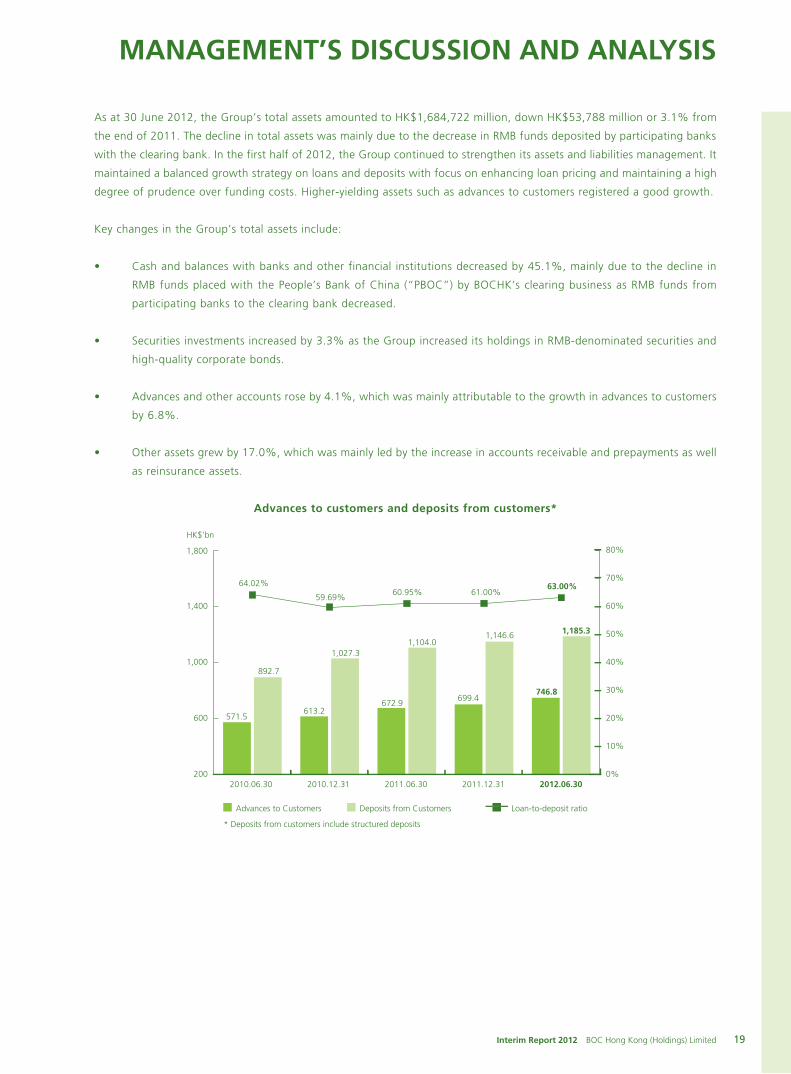
As at 30 June 2012, the Group’s total assets amounted to HK$1,684,722 million, down HK$53,788 million or 3.1% from
the end of 2011. The decline in total assets was mainly due to the decrease in RMB funds deposited by participating banks
with the clearing bank. In the first half of 2012, the Group continued to strengthen its assets and liabilities management. It
maintained a balanced growth strategy on loans and deposits with focus on enhancing loan pricing and maintaining a high
degree of prudence over funding costs. Higher-yielding assets such as advances to customers registered a good growth.
Key changes in the Group’s total assets include:
• Cashandbalanceswithbanksandotherfinancial institutionsdecreasedby45.1%,mainlyduetothedecline in
RMB funds placed with the People’s Bank of China (“PBOC”) by BOCHK’s clearing business as RMB funds from
participating banks to the clearing bank decreased.
• Securitiesinvestmentsincreasedby3.3%astheGroupincreaseditsholdingsinRMB-denominatedsecuritiesand
high-quality corporate bonds.
• Advancesandotheraccountsroseby4.1%,whichwasmainlyattributabletothegrowthinadvancestocustomers
by 6.8%.
• Otherassetsgrewby17.0%,whichwasmainlyledbytheincreaseinaccountsreceivableandprepaymentsaswell
as reinsurance assets.
Advances to customers and deposits from customers*
200
600
1,000
1,400
1,800
2010.06.30
64.02%
HK$’bn
571.5
892.7
613.2
1,027.3
672.9
1,104.0
699.4
1,146.6
746.8
1,185.3
59.69%60.95% 61.00%
63.00%
Advances to Customers
* Deposits from customers include structured deposits
2010.12.31 2011.06.30 2011.12.31 2012.06.30
Deposits from Customers Loan-to-deposit ratio
0%
10%
20%
30%
40%
50%
60%
80%
70%

ManageMent’s Discussion anD analysis
20 BOC Hong Kong (Holdings) Limited Interim Report 2012
Advances to Customers
At 30 June 2012 At 31 December 2011
HK$’m, except percentage amounts Amount % of total Amount % of total
Loans for use in Hong Kong 460,593 61.7% 444,540 63.6%
Industrial, commercial and financial 245,527 32.9% 237,557 34.0%
Individuals 215,066 28.8% 206,983 29.6%
Trade finance 67,828 9.1% 59,508 8.5%
Loans for use outside Hong Kong 218,331 29.2% 195,331 27.9%
Total advances to customers 746,752 100.0% 699,379 100.0%
In view of the volatile global economic environment, the Group adhered to stringent risk control and customer selection to
achieve quality and sustainable growth. Advances to customers increased by HK$47,373 million or 6.8% to HK$746,752
million in the first half of 2012 with improved pricing on new corporate and residential mortgage loans.
Loans for use in Hong Kong grew moderately by HK$16,053 million or 3.6%.
• Lendingtotheindustrial,commercialandfinancialsectorsincreasedbyHK$7,970million,or3.4%,toHK$245,527
million. The increase covered a wide range of industries. Loans to the manufacturing, property investment, transport
and transport equipment as well as information technology sectors grew by 11.8%, 3.4%, 5.6% and 6.6%
respectively.
• LendingtoindividualsincreasedbyHK$8,083million,or3.9%.Residentialmortgageloans(excludingthoseunder
the Government-sponsored Home Ownership Scheme) were up 4.6%. The Group has been capturing the growth
opportunities arising from the revival of the local residential property market since March 2012 when the transaction
volume started to increase.
Trade finance rose by HK$8,320 million, or 14.0% while loans for use outside Hong Kong grew by HK$23,000 million or
11.8%.
21Interim Report 2012 BOC Hong Kong (Holdings) Limited
ManageMent’s DIscussIon anD analysIs
Loan Quality
HK$’m, except percentage amounts
At 30 June 2012
At 31 December
2011
Advances to customers 746,752 699,379
Classified or impaired loan ratio1 0.10% 0.10%
Impairment allowances 2,968 2,830
Regulatory reserve for general banking risks 7,230 6,967
Total allowances and regulatory reserve 10,198 9,797
Total allowances as a percentage of advances to customers 0.40% 0.40%
Impairment allowances2 on classified or impaired loan ratio 38.58% 39.86%
Residential mortgage loans3 – delinquency and rescheduled loan ratio4 0.01% 0.01%
Card advances – delinquency ratio4 0.19% 0.16%
Half-year ended 30 June 2012
Half-year ended
30 June 2011
Card advances – charge-off ratio5 1.23% 1.07%
1. Classified or impaired loans follow the definitions set out in the Banking (Disclosure) Rules under the Banking Ordinance and represent advances which
are either classified as “substandard”, “doubtful” or “loss” under the Group’s classification of loan quality, or individually assessed to be impaired.
2. Referring to impairment allowances on loans classified as “substandard”, “doubtful” or “loss” under the Group’s classification of loan quality, or individually
assessed to be impaired.
3. Residential mortgage loans exclude those under the Home Ownership Scheme and other government-sponsored home purchasing schemes.
4. Delinquency ratio is measured by a ratio of total amount of overdue loans (more than three months) to total outstanding loans.
5. Charge-off ratio is measured by a ratio of total write-offs made during the period to average card receivables during the period.
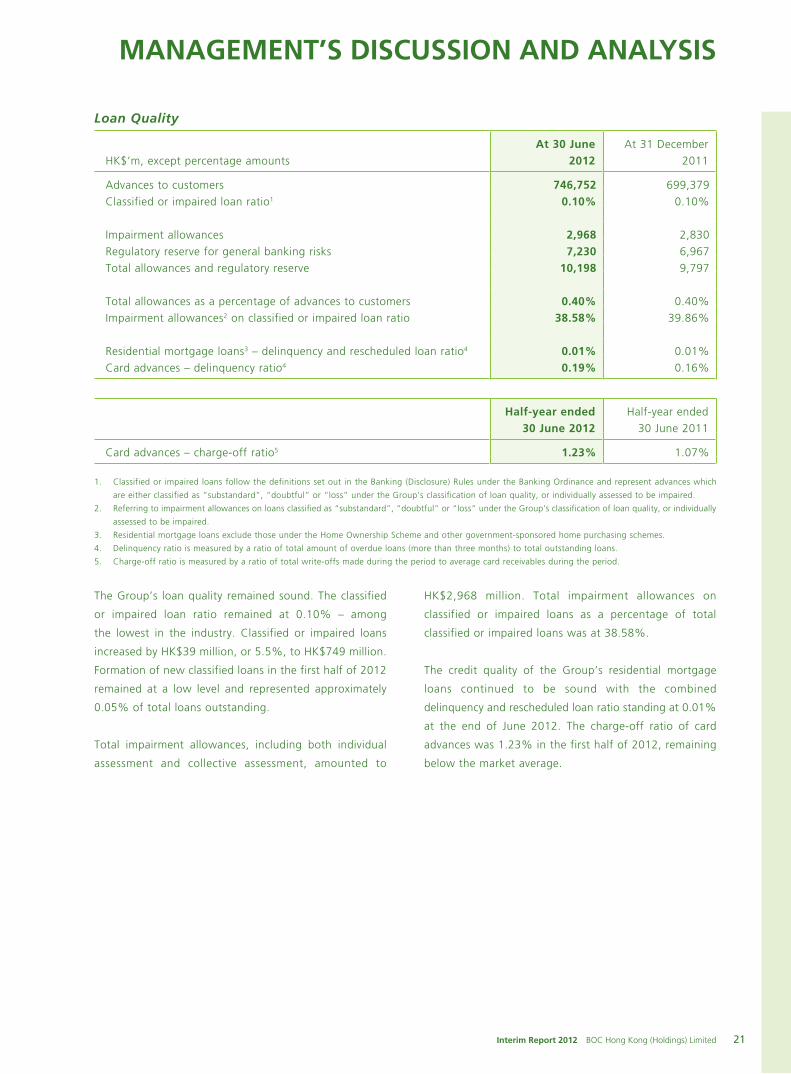
The Group’s loan quality remained sound. The classified
or impaired loan ratio remained at 0.10% – among
the lowest in the industry. Classified or impaired loans
increased by HK$39 million, or 5.5%, to HK$749 million.
Formation of new classified loans in the first half of 2012
remained at a low level and represented approximately
0.05% of total loans outstanding.
Total impairment allowances, including both individual
assessment and collective assessment, amounted to
HK$2,968 million. Total impairment allowances on
classified or impaired loans as a percentage of total
classified or impaired loans was at 38.58%.
The credit quality of the Group’s residential mortgage
loans continued to be sound with the combined
delinquency and rescheduled loan ratio standing at 0.01%
at the end of June 2012. The charge-off ratio of card
advances was 1.23% in the first half of 2012, remaining
below the market average.

ManageMent’s Discussion anD analysis
22 BOC Hong Kong (Holdings) Limited Interim Report 2012
Deposits from Customers*
At 30 June 2012 At 31 December 2011
HK$’m, except percentage amounts Amount % of total Amount % of total
Demand deposits and current accounts 73,966 6.2% 77,440 6.7%
Savings deposits 524,722 44.3% 504,868 44.0%
Time, call and notice deposits 584,169 49.3% 563,643 49.2%
1,182,857 99.8% 1,145,951 99.9%
Structured deposits 2,424 0.2% 639 0.1%
Deposits from customers 1,185,281 100.0% 1,146,590 100.0%
* Including structured deposits.
The Group’s deposit base grew by HK$38,691 million, or
3.4%, in the first half of 2012. Savings deposits grew by
3.9% while time, call and notice deposits increased by
3.6%. Demand deposits and current accounts decreased
by 4.5%. The Group’s loan-to-deposit ratio was 63.00%
at the end of June 2012, up 2.00 percentage points from
the end of 2011.
While banks’ funding pressure on HKD and USD eased
in the first half of 2012, market competition for RMB
deposits intensified. The Group adhered to a flexible
deposit strategy to support business growth while
maintaining a cautious control on funding costs.
Capital and Reserves Attributable to the Equity Holders of the Company
HK$’m
At 30 June 2012
At 31 December
2011
Share capital 52,864 52,864
Premises revaluation reserve 27,045 23,150
Reserve for fair value changes of available-for-sale securities 3,565 1,787
Regulatory reserve 7,230 6,967
Translation reserve 598 674
Retained earnings 49,412 44,323
Reserves 87,850 76,901
Capital and reserves attributable to the Equity Holders of the Company 140,714 129,765
Capital and reserves attributable to the equity holders
increased by HK$10,949 million, or 8.4% to HK$140,714
million at 30 June 2012. Retained earnings rose by
11.5%, reflecting the profit for the first half of 2012
after the appropriation of final dividend of 2011. Premises
revaluation reserve increased by 16.8%, which was
attributable to the increase in property prices in the first
half of 2012. Regulatory reserve rose by 3.8% due to loan
growth. Reserve for fair value changes of available-for-sale
securities was up 99.5%, reflecting the rise in fair value
of available-for-sale debt securities, mainly due to the
changes in market interest rates.

23Interim Report 2012 BOC Hong Kong (Holdings) Limited
ManageMent’s DIscussIon anD analysIs
Capital and Liquidity Ratio
HK$’m, except percentage amounts
At 30 June 2012
At 31 December
2011
Core capital after deductions 89,152 84,600
Supplementary capital after deductions 30,726 29,654
Total capital base after deductions 119,878 114,254
Total risk-weighted assets 687,774 676,024
Capital adequacy ratios (consolidated basis)*
Core capital ratio 12.96% 12.51%
Capital adequacy ratio 17.43% 16.90%
Half-year ended 30 June 2012
Half-year ended
30 June 2011
Average liquidity ratio 39.87% 36.38%
Consolidated capital adequacy ratio at 30 June 2012 was 17.43%, 0.53 percentage point above that at the end of 2011.
Total capital base expanded by 4.9% to HK$119,878 million, mainly due to the increase in retained earnings. Total risk-
weighted assets increased by 1.7% to HK$687,774 million. The increase was mainly due to the growth of credit risk-
weighted assets in light of the loan growth in the first half of 2012. Market risk-weighted assets also increased following
the introduction of stressed VAR for the calculation of market risk capital charges after the Banking (Capital) (Amendment)
Rules 2011 became effective on 1 January 2012. These increases were counterbalanced by the effect of no additional
risk-weighted amount required for the capital floor adjustment as the Group’s capital charges for the period exceeded
the required capital floor amount#.
The average liquidity ratio in the first half of 2012 remained strong at 39.87%.
* Capital adequacy ratio is computed on the consolidated basis that comprises the positions of BOCHK and certain subsidiaries specified by the HKMA for
its regulatory purposes and in accordance with the Banking (Capital) Rules. The bases of regulatory capital calculation for credit risk, market risk and
operational risk are described in Note 3.5 to the Interim Financial Information.
# The HKMA requires that all reporting institutions using the IRB approach (whether foundation or advanced) for capital adequacy purposes are subject
to a capital floor for the first three years of the adoption of the IRB approach. The use of the capital floor is to prevent a sudden fall in capital charges
solely as a result of the changes in how the risk-weighted amount for credit risk is measured. The capital floor is derived by applying an adjustment factor
to the capital charge calculated under the STC approach where the adjustment factors are 90%/80%/70% for the respective 1st/2nd/3rd year of the
implementation of IRB approach. As at 30 June 2012 and in its second year of the implementation of FIRB approach, the Group’s capital charges exceeded
the capital floor amount as required by the HKMA and therefore no additional risk-weighted amount was required for the period.

ManageMent’s Discussion anD analysis
24 BOC Hong Kong (Holdings) Limited Interim Report 2012
BUSINESS REVIEWBusiness Segment Performance
HK$’m, except percentage amounts
Personal Banking
Corporate Banking Treasury Insurance Others1 Consolidated
Half-year ended 30 June 2012Profit before taxation 2,763 5,142 4,702 451 767 13,825% of total 20.0% 37.2% 34.0% 3.3% 5.5% 100.0%
Half-year ended 30 June 2011
Profit before taxation 2,723 4,453 2,865 291 4,255 14,587
% of total 18.7% 30.5% 19.6% 2.0% 29.2% 100.0%
1. Profit before taxation of Others in the first half of 2011 included the net recovery from the underlying collateral of the Lehman Brothers Minibonds.
2. For additional segmental information, see Note 41 to the Interim Financial Information.
PERSONAL BANKINGFinancial Results
Personal Banking recorded a profit before taxation of
HK$2,763 million.
Net interest income increased by 11.8%, mainly driven
by the growth in average loans and deposits coupled
with the improvement in deposit spread. The increase
was largely offset by the decrease of 10.9% in net fee
and commission. Commission income from securities
brokerage was lower amid adverse investment sentiments.
Meanwhile, there was growth in fee income from funds
distribution and credit cards. Personal loans and customer
deposits increased by 4.2% and 3.2% respectively from
last year end.
Business operation
The Group’s Personal Banking business continued to
make good progress in the first half of 2012. There
was satisfactory growth in both deposit and lending
businesses. Funds and bonds distribution businesses also
performed strongly. In addition to investing in service
enhancement and branding with regard to the wealth
management platform, a new private banking business
platform has been set up to provide unique and tailor-
made services to targeted affluent customers.
Residential mortgages – outgrowing the market
With its all-round service and expertise in residential
mortgages, the Group succeeded in growing its market
share and was the market leader in the underwriting of
new mortgages during the period. The Group continued to
work in close partnership with major property developers.
Various joint promotional activities were conducted with
developers to deliver enhanced services to customers from
both the Hong Kong and Mainland markets. The Group
also continued to lead the market with a wide range of
mortgage products and mobile applications. At the end
of June 2012, the Group’s mortgage book grew by 4.6%
versus the end of last year.
Investment and insurance businesses – strong growth
in the sales of funds and bonds
In the first half of 2012, sentiments of the local
stock market were adversely affected by the external
environment. Nevertheless, the Group continued to
expand its stock brokerage service spectrum to reinforce
its strong position in the personal securities business. New
services were introduced to enable customers to trade
with a higher degree of ease.
As regards the funds distribution business, the Group
rolled out new products to both high-end and mass retail
customers. A private fund, the BOCHK Asian Dynamic
Income Fund, and a retail fund, the BOCHK-World
Bank Emerging Markets Bond Fund, were introduced
to customers. During the period, the Group distributed
14 RQFII funds, making it the largest distributor of RQFII
funds in Hong Kong. As a result, commission income
from funds distribution surged by 31.8% year-on-year.
The Group also actively engaged in the bonds distribution
business. The Group’s private placement services for
bonds in the secondary market were launched in January
this year, offering bonds to targeted high-end customers.
In addition, the Group led the iBond market in terms
of over-the-counter turnover. Meanwhile, the Group’s

25Interim Report 2012 BOC Hong Kong (Holdings) Limited
ManageMent’s DIscussIon anD analysIs
Investment Product Specialist Team was further expanded
to provide customers with comprehensive professional
service in connection with investment products.
Regarding its Bancassurance business, the Group
strengthened its position as a prominent life insurance
provider and maintained its lead in the RMB insurance
market. It continued to roll out new products to meet
customers’ needs. The RMB-denominated “IncomeGrowth
Annuity Insurance Plan” was introduced to offer life
protection with guaranteed annuity payments. The Group
also further enhanced its financial planning model and
cross-selling capabilities with encouraging results.
Credit card business – recording double-digit volume
growth
The Group’s credit card business sustained its growth
momentum in the first half of 2012. It maintained its
leadership in the China UnionPay merchant acquiring
business and card issuing business. The Group also
continued to exploit its competitive edge to extend
appealing merchant offer programmes to customers
through its comprehensive merchant network in Hong
Kong, Macau and the Mainland. The total number of
cards issued grew by 5.0% from the end of last year.
Cardholder spending and merchant acquiring volumes
grew by 10.8% and 16.8% respectively.
Wealth management service – enhancing brand
awareness
The Group continued to offer differentiated services and
customised wealth management solutions to foster long-
term relationship with wealth management customers.
In the first half of 2012, the Group completed the
unification of its wealth management service platform,
thus strengthening its brand awareness and position
in the market. In addition, a new private banking
business platform has been set up to cater to the more
sophisticated needs of the affluent customers. The Group
also continued to work more closely with BOC branches
to provide banking services to high net-worth customers
from the Mainland.
Distribution channels – e-channels with enhanced
security features
The Group kept optimising its distribution channels to
meet the needs of both local and cross-border customers.
At the end of June 2012, the Group’s service network in
Hong Kong comprised 267 branches, including 137 wealth
management centres.
The Group further invested in automated banking
channels. In April, it launched Hong Kong’s first chip-
based ATM card with enhanced security and new
banking service functions. With the new chip-based
BOC Card, customers can enjoy the BOC Card services
in Hong Kong, the Mainland and overseas, including the
settlement of purchases and HKD/RMB notes withdrawal
at “JETCO” ATMs in Hong Kong. Fund transfer and bill
payment can also be made through the ATM and point-
of-sale networks. The functions of the Group’s e-Banking
platform were expanded, including the use of a new
security device for two-factor authentication. At the same
time, the Group also introduced more mobile banking
services.
In recognition of their outstanding salesmanship, four
of the Group’s sales personnel were honoured with the
“Distinguished Salesperson” awards 2012 organised by
the Hong Kong Management Association.
CORPORATE BANKINGFinancial Results
Corporate Banking recorded a satisfactory growth of
HK$689 million, or 15.5%, in profit before taxation. This
was mainly attributable to the increase in net interest
income as well as net fee and commission income.
Net interest income rose by 13.2%, mainly driven by an
expansion in loans. The growth in net interest income
was also attributable to the increase in deposits with
improvement in the average deposit spread. Corporate
loans and customer deposits grew by 7.9% and 3.6%
respectively from the end of 2011.
Net fee and commission income increased by 21.0%,
largely led by the growth in loan commissions. Meanwhile,
bills commissions declined along with the slowdown of
economic activities.
Business operation
Despite a slowdown of the economy, the Group’s
Corporate Banking business recorded satisfactory loan
growth with better loan pricing in the first six months of

ManageMent’s Discussion anD analysis
26 BOC Hong Kong (Holdings) Limited Interim Report 2012
2012. It remained the top mandated arranger in the Hong
Kong syndicated loan market and continued to provide
strong support to its corporate customers. In view of
the fast expansion of the offshore RMB business, more
innovative trade-related products were introduced to
corporate clients. The Group also made good progress in
the custody and cash management businesses. As regards
the custody business, the Group was the largest service
provider for RQFII funds in the market. Cross-border cash
management capabilities were further enhanced with the
linkage of the Group’s e-Banking platform with those of
BOC and its overseas branches.
Corporate lending business – 7.9% growth of
corporate loans
The Group continued to implement “Total Solution” for
core customers and enhanced the management of its
clientele in different industries through better customer
segmentation. Tailor-made services were provided to
large corporates and public sector entities with the aim
to become their main banker. At the end of June, the
Group’s balance of corporate loans grew by 7.9% from
the end of 2011. In the first half of 2012, the Group
successfully arranged the first 100% RMB syndicated loan
in Hong Kong and it was also the largest of its kind in the
market by the end of June 2012. The Group remained the
top mandated arranger in the Hong Kong syndicated loan
market in the first half of 2012.
SME business – providing full-fledged services to
customers
The Group stepped up its service capabilities for SME
customers. It optimised the business model of “Integrated
Branches for Commercial Business” by establishing
exclusive counters in selected branches and launched
the “Business Integrated Account” to provide one-stop
financial solutions, including consultation services on
credit facilities, cash management and insurance, as well
as personal financial solutions for SME companies and
their proprietors, partners or shareholders. The Group
also actively participated in the “SME Financing Guarantee
Scheme” launched by the Hong Kong Mortgage
Corporation Limited. In recognition of its long-standing
support for SMEs in Hong Kong, the Group received for
the fifth consecutive year the “SME’s Best Partner Award”
presented by the Hong Kong Chamber of Small and
Medium Business Limited.
Trade finance – product innovation and promotion
to drive growth
Taking advantage of its strong cross-border service
capabilities and the continuous expansion of the offshore
RMB business, the Group was able to capture more
business opportunities in trade finance. In collaboration
with BOC and NCB (China), it actively promoted the
factoring business. Through product innovation, especially
in RMB financing and RMB settlement, the Group further
enhanced its competitiveness in the trade finance
business. A new product, “Acceptance L/C Discounting”
was launched during the period. At the end of June 2012,
the Group’s balance of trade finance grew by 14.0% from
the end of 2011.
Custody service – becoming the largest service
provider for RQFII fund products
The custody business continued to expand in the first half
of 2012. The Group successfully secured mandates for
a number of RMB fund products during the period, and
became the largest service provider for RQFII funds in the
market. At the same time, the Group continued to provide
high-quality global custody services to Qualified Domestic
Institutional Investors and various types of fund clients.
During the period, the Group completed several deals in
providing escrow services to large corporate entities and
financial institutions. At the end of June 2012, excluding the
RMB fiduciary account for participating banks, total assets
under the Group’s custody were valued at HK$536 billion.
Cash management service – making solid progress in
cross-border servicing capabilities
In line with the extension of the operating hours of
the RMB Real Time Gross Settlement (“RMB RTGS”)
system in Hong Kong, the Group extended the service
hours for same-day RMB telegraphic transfer and express
transfer instructions made through internet banking. The
intra-day cash pooling service was launched to enable
corporate customers to build up a cash pool, allowing
better internal cash flow management. The linkage of
the Group’s e-Banking platform with those of BOC and
its overseas branches has been completed, enabling the
Group’s corporate customers to operate their overseas
BOC accounts via Corporate Internet Banking and BOC
customers to operate their BOCHK accounts via BOC
Online Banking (“BOCNET”). This has greatly enhanced the
cross-border cash management capabilities of the Group.
27Interim Report 2012 BOC Hong Kong (Holdings) Limited
ManageMent’s DIscussIon anD analysIs
Risk management – proactive measures in place
The Group remained highly focused on safeguarding its
asset quality by adhering strictly to its risk management
policy. It performed close credit monitoring on corporate
customers who could be adversely affected by the
volatile economic environment, including the slowdown
of the Mainland’s export growth which may pose an
adverse impact on the investments of manufacturing
establishments. The Group also stays alert to the latest
development of the Eurozone debt crisis and the impact
of the Central Government’s stimulation measures on the
Chinese economy.
MAINLAND BUSINESSFinancial performance – maintaining healthy growth
The Group’s Mainland business maintained healthy growth
in the first half of 2012. It strengthened its deposit base
by growing customer deposits by 9.8% from the end of
last year. During the period, it focused on optimising the
loan structure and improving loan pricing. Advances to
customers grew by 1.2% with the overall loan quality
remaining sound. Total operating income increased by
32.7% year-on-year, mainly driven by the strong growth
in net interest income.
Distribution channels – building up branch network
and channel sharing with BOC
In view of the slower economic growth and lower domestic
demand in the Mainland, the Group proactively adjusted
its product and business strategy. It stepped up its
marketing effort and deepened its business collaboration
with the BOC group. The “Channel Sharing” model,
which allows promotional activities to be conducted
on-site and via e-channels with BOC’s branches, has
been effective in serving its purpose. During the interim
period, the model not only boosted deposit growth but
also generated more retail banking business. Meanwhile,
the upgrade of the Group’s e-Banking platforms in 2011
proved to be extremely successful as the number of new
accounts and transaction volume increased significantly.
The range of wealth management products was further
expanded, resulting in a complete series of “Yi Da”
products. All wealth management products could be
acquired via the e-Banking platform. The Group has been
actively preparing for the issuance of credit cards in the
Mainland. The SME business platform was instrumental
to the completion of the “SME Business Win” product
series, leading to a satisfactory growth in SME lending
in the interim period. During the first half of 2012, four
new NCB (China) sub-branches, including the Shanghai
Huangpu Sub-branch, Guangdong Foshan Sub-branch,
Chengdu Chuangye Road Sub-branch and Dongguan Sub-
branch, commenced operation. The Group’s total number
of branches and sub-branches in the Mainland increased
to 31 by the end of June 2012.
TREASURYFinancial Results
Treasury recorded a strong year-on-year increase of 64.1%
in profit before taxation.
Net interest income grew by 71.2% with the improved
yield on interbank placements coupled with the increase
in the related balance.
Net trading gain was up 111.4%. The growth was caused
by the lower foreign exchange loss on foreign exchange
swap contracts and the increase in mark-to-market gain
of certain interest rate instruments.
Business Operation
Proactive investment strategy – maintaining a
balance on safety, liquidity and yield enhancement
The Group continued with a proactive but prudent
approach in managing its banking book investments. In
the first half of the year, the Group closely monitored
market changes and acted swiftly to adjust its investment
portfolio in response to the deterioration of the European
debt crisis. During the period, the Group increased its
holdings in RMB-denominated securities and high-quality
corporate bonds.
Product innovation – responding to customers’ needs
In line with its customer-centric approach, the Group
continued with product innovation to meet customers’
needs. In the first half of 2012, the RMB exchange
business was adversely affected by the slower economic
growth of the Mainland and the lower expectation for the
appreciation of the RMB. The Group responded quickly to
these market changes by rolling out new product packages
that bundled offshore RMB exchange rate-related and
interest rate-related products with deposits, loans and
trade finance, thus lowering customers’ exchange rate
risk and financing costs.

ManageMent’s Discussion anD analysis
28 BOC Hong Kong (Holdings) Limited Interim Report 2012
As part of its ongoing endeavour to facilitate the
development of the offshore RMB bond market, the Group
launched three new offshore RMB bond sub-indices. These
were the BOCHK Offshore RMB Chinese Sovereign Bond
Index, the BOCHK Offshore RMB Investment Grade Bond
Index and the BOCHK Offshore RMB 1 to 3 Years Central
Government Bond Index, which serve as performance
benchmarks for the offshore RMB bond market.
Meanwhile, the Group remained an active participant in
the offshore RMB bond underwriting business.
RMB-clearing bank service – extending service hours
to offshore markets
The Group maintained strong support for its clearing
services. The operating hours of the RMB RTGS were
extended to cover the working hours in other major
financial centres, including London and New York.
This not only facilitated participating banks and their
customers in conducting RMB cross-border settlement and
payment, but also enhanced BOCHK’s brand awareness
at the global level.
Banknotes business – building up a global network
The Group continued to cooperate with BOC’s overseas
branches in extending the overseas RMB banknotes
business. The transaction turnover rose significantly from
the same period in 2011. Meanwhile, the Group has
established business relationships with banks and financial
institutions in different countries and regions, and has
also penetrated the non-RMB banknotes business in these
markets.
INSURANCEFinancial Results
The Group’s Insurance segment recorded a strong growth
in its profit before taxation by 55.0% to HK$451 million in
the first half of 2012. The growth was mainly attributable
to the better investment performance comparing to the
same period last year.
The increase in realised gain from equity investments as
well as mark-to-market gain of debt securities contributed
to the improvement of investment income.
Business Operation
Driving growth through service enhancement
Through the constant optimisation of product features and
service enhancement, the Group continued to improve its
services for customers. A series of training programmes
were conducted to enhance the professionalism and
capabilities of the sales team. To reinforce its brand and
promote its product offerings, BOC Life also launched
major promotion campaigns. The sale of investment-linked
products also registered a satisfactory growth.
RMB insurance products – a prominent provider
The Group maintained its leading position in the RMB
insurance market. Popular RMB insurance products such
as the “Target 5 Years Insurance Plan Series”, “Multi-Plus
Savings Insurance Plan” and “RMB Universal Life Insurance
Plan” continued to be well received by customers. To
meet customers’ needs, the Group launched the RMB-
denominated “IncomeGrowth Annuity Insurance Plan”,
a RMB income insurance plan providing life protection
with guaranteed annuity payments. During the first half of
2012, BOC Life was granted the approval to invest directly
in the Mainland’s interbank bond market, thus facilitating
the expansion of RMB assets and the further development
of its RMB insurance products.
RISK MANAGEMENTBanking GroupOverview
The Group believes that sound risk management is crucial
to the success of any organisation. In its daily operation,
the Group attaches a high degree of importance to risk
management and emphasises that a balance must be
struck between risk control and business growth and
development. The principal types of risk inherent in
the Group’s businesses are credit risk, interest rate risk,
market risk, liquidity risk, operational risk, reputation risk,
legal and compliance risk, and strategic risk. The Group’s
risk management objective is to enhance shareholder
value by maintaining risk exposures within acceptable
limits. The Group has a defined risk appetite statement
approved by the Board, which is an expression of the
types and level of risk that the Group is willing to take
in order to achieve its business goals and to meet the
expectations of its stakeholders under a controllable risk
level.
Risk Management Governance Structure
The Group’s risk management governance structure is
designed to cover all business processes and ensure
various risks are properly managed and controlled in
the course of conducting business. The Group has a

29Interim Report 2012 BOC Hong Kong (Holdings) Limited
ManageMent’s DIscussIon anD analysIs
robust risk management organisational structure with a
comprehensive set of policies and procedures to identify,
measure, monitor and control various risks that may
arise. These risk management policies and procedures
are regularly reviewed and modified to reflect changes
in markets and business strategies. Various groups of
risk takers assume their respective responsibilities for risk
management.
The Board of Directors, representing the interests of
shareholders, is the highest decision-making authority
of the Group and has the ultimate responsibility for
risk management. The Board, with the assistance of
its committees, has the primary responsibility for the
formulation of risk management strategies and for
ensuring that the Group has an effective risk management
system to implement these strategies.
The Risk Committee (“RC”), a standing committee
established by the Board of Directors, is responsible for
overseeing the Group’s various types of risks, reviewing
and approving high-level risk-related policies and
overseeing their implementation, reviewing significant
or high risk exposures or transactions and exercising its
power of veto if it considers that any transaction should
not proceed. The Audit Committee assists the Board in
fulfilling its role in overseeing the internal control system.
The Chief Executive (“CE”) is responsible for managing
the Group’s various types of risks, approving detailed
risk management policies, and approving material risk
exposures or transactions within his authority delegated
by the Board of Directors. The Chief Risk Officer (“CRO”)
assists the CE in fulfilling his responsibilities for the day-
to-day management of risks. The CRO is responsible for
initiating new risk management strategies, projects and
measures that will enable the Group to better monitor and
manage new risk issues or areas that may arise from time
to time from new businesses, products and changes in
the operating environment. He may also take appropriate
initiatives in response to regulatory changes. The CRO is
also responsible for reviewing material risk exposures or
transactions within his delegated authority and exercising
his power of veto if he believes that any transaction
should not proceed.
Various units of the Group have their respective risk
management responsibilities. Business units act as the
first line of defence while risk management units, which
are independent from the business units, are responsible
for the day-to-day management of different kinds of risks.
Risk management units have the primary responsibilities
for drafting, reviewing and updating various risk
management policies and procedures.
The Group’s principal banking subsidiaries, Nanyang, NCB
(China) and Chiyu, are subject to risk policies that are
consistent with those of the Group. Moreover, the Group’s
non-banking subsidiaries, such as BOC Life, are subject
to the Group’s risk management requirements. These
subsidiaries are required to formulate their respective
risk management policies based on the characteristics
of their own industries, perform daily risk management
responsibilities and report to BOCHK on a regular basis.
Risk management units of BOCHK monitor the risk
management status of these subsidiaries respectively.
Credit Risk Management
Credit risk is the risk of loss arising from that a customer
or counterparty will be unable to or unwilling to meet
its contractual obligations. Credit risk exists in the
trading book and banking book, on- and off-balance
sheet exposures of a bank. It arises principally from
the lending, trade finance and treasury businesses, and
covers inter-bank transactions, foreign exchange and
derivative transactions as well as investments in bonds and
securities. The Chief Credit Officer, who reports directly
to the CRO, takes charge of credit risk management and
is also responsible for the control of credit risk exposure
of subsidiaries in line with the credit risk management
principles and requirements set by the Group. The Chief
Analytics Officer, who also reports directly to the CRO,
is responsible for the development and maintenance of
internal rating models, internal rating criteria, internal
rating platforms and the risk-weighted asset calculation
for credit risk. For loans and advances to customers,
different credit approval and control procedures are
adopted according to the level of risk associated with the
customer, counterparty or transaction. The Credit Risk
Assessment Committee comprising credit experts and
other functions is responsible for making an independent
assessment of all credit facilities which require the
approval of Deputy Chief Executives (“DCE”) or above.
Corporate and financial institution credit applications
are independently reviewed and objectively assessed
by risk management units. Obligor ratings and facility

ManageMent’s Discussion anD analysis
30 BOC Hong Kong (Holdings) Limited Interim Report 2012
grades are assigned to these portfolios. Retail internal
rating systems are deployed in the risk assessment of
retail credit transactions, including small business retail
exposures, residential mortgage loans, personal loans
and credit cards. Loan grades, obligor ratings as well as
loss estimates (if applicable) are used to support credit
approval.
The Group identifies credit concentration risk by industry,
geography, customer and counterparty risk. The Group
monitors changes to counterparties credit risk, the quality
of the credit portfolio and risk concentrations, and reports
regularly to the Group’s management.
The Group uses loan grades, obligor ratings and loss
estimates (if applicable) to support credit monitoring,
analysis and reporting. For corporate and financial
institution, more frequent rating review and closer
monitoring are required for higher-risk customers. For
retail exposures, monthly updated ratings and loss
estimates are used for credit monitoring on a portfolio
basis. More comprehensive review is required for obligors
being identified under high-risk pools. The Group has
established credit risk master scale for internal rating
purpose, which is in compliance with the Banking
(Capital) Rules under the Hong Kong Banking Ordinance
on rating structure, and can be mapped to Standard &
Poor’s external ratings. In addition to obligor ratings,
the Group adopts a facility rating system (in the case of
corporate and bank exposure) and expected loss (in the
case of retail exposure) to assess the risk in the facility
structure during credit approval. This two-dimensional
rating approach to evaluate credit risk complies with the
HKMA’s requirements on IRB.
In the first half of 2012, the Group has continued to
adopt loan grading criteria which divide credit assets
into 5 categories with reference to HKMA’s guidelines.
The Risk Management Department (“RMD”) provides
regular credit management information reports and ad
hoc reports to the Management Committee (“MC”),
RC and Board of Directors to facilitate their continuous
monitoring of credit risk.
For investments in debt securities and securitisation assets,
the obligor ratings or external credit ratings, assessment
of the underlying assets and credit limits setting on
customer/security issuer basis are used for managing
credit risk associated with the investment. For derivatives,
the Group sets customer limits to manage the credit
risk involved and follows the same approval and control
processes as applied for loans and advances. On-going
monitoring and stop-loss procedures are established.
The methodology and assumptions used for impairment
assessments are reviewed regularly. In evaluating
impairment of asset backed securities (“ABS”) and
mortgage backed securities (“MBS”), the Group continued
to use a significant decline in market price and credit
deterioration of the underlying assets to be the key
indicators of impairment. The Group also considered other
objective evidences of impairment, taking into account the
impact of liquidity on market prices and the movement
in loss coverage ratios of individual ABS and MBS held
by the Group.
Interest Rate Risk Management
Interest rate risk means the risks to a bank’s earnings
and economic value arising from adverse movements in
interest rate and term structures of the bank’s asset and
liability positions. The Group’s interest rate risk exposures
are mainly structural. The major types of interest rate risk
from structural positions are:
• Repricing risk: mismatches in the maturity or
repricing periods of assets and liabilities that may
affect net interest income;
• Basis risk: different pricing basis for different
transactions so that the yield on assets and cost of
liabilities may change by different amounts within
the same repricing period;
• Yield curve risk: non-parallel shifts in the yield
curve that may have an adverse impact on net
interest income or economic value;
• Optionrisk:exerciseoftheoptionsembeddedin
assets, liabilities or off-balance sheet items that
can cause a change in the cashflows of assets and
liabilities.
The Group’s risk management framework applies
also to interest rate risk management. The Assets and
Liabilities Management Committee (“ALCO”) exercises
its oversight of interest rate risk in accordance with the
31Interim Report 2012 BOC Hong Kong (Holdings) Limited
ManageMent’s DIscussIon anD analysIs
“BOCHK Group Interest Rate Risk Management Policy”
approved by RC. The Market Risk Management Division
of the RMD is the unit responsible for interest rate risk
management. With the cooperation of the Financial
Management Department (Asset & Liability Management)
and Investment Management, the RMD assists the ALCO
to manage day-to-day interest rate risk positions. Its
roles include, but are not limited to, the formulation of
management policies, selection of methodologies, setting
of risk indicators and limits, assessment of target balance
sheet, monitoring of the compliance with policies and
limits, and submission of interest rate risk management
reports to the RC and senior management, etc.
The Group sets out interest rate risk indicators and limits
to identify, measure, monitor and control interest rate
risk. The indicators and limits include, but are not limited
to, re-pricing gap limits, basis risk, duration, price value
of a basis point (PVBP), Greeks, net interest income
sensitivity ratio, economic value sensitivity ratio (including
sub-limit for AFS securities), etc. The indicators and limits
are classified into three levels, which are approved by the
RC, ALCO and CRO respectively. Risk-taking business units
are required to conduct their business within the boundary
of the interest rate risk limits. Before launching a new
product or business in the banking book, the relevant
departments are required to go through a risk assessment
process, which includes the assessment of underlying
interest rate risk and consideration of the adequacy of
current risk monitoring mechanism. Any material impact
on interest rate risk noted during the risk assessment
process will be submitted to the RC for approval.
Net interest income sensitivity ratio (NII) and economic
value sensitivity ratio (EV) assess the impact of interest rate
movement on the Group’s net interest income and capital
base. They are the Group’s key interest rate risk indicators.
The former assesses the impact of interest rate movement
on net interest income as a percentage to projected net
interest income for the year. The latter assesses the impact
of interest rate movement on economic value (i.e. the
present value of cash-flows of assets, liabilities and off-
balance-sheet items discounted using market interest rate)
as a percentage to the latest capital base. Limits are set
by the RC on these two indicators to monitor and control
the Group’s banking book interest rate risk.
The Group uses scenario analyses and stress tests to assess
the banking book interest rate risk that the Group would
face under adverse circumstances. Scenario analyses and
stress tests are also devised to assess the impact on net
interest income and economic value as well as capital
base arising from the optionality of demand and savings
deposits, the prepayment of mortgage loans and the
prepayment of debt securities with embedded options.
Market Risk Management
Market risk refers to the risk of losses arising from
adverse movements in the value of foreign exchange and
commodity positions and the trading book interest rate
and equity positions held by the Group due to the volatility
of financial market price (debt security price/interest rate,
foreign exchange rate, equity price, commodity price). The
Group adopts a robust market risk appetite to achieve
balance between risk and return. The Group’s objective
in managing market risk is to secure healthy growth
of the treasury business by effective management of
potential market risk in the Group’s business according
to the Group’s overall risk appetite and strategy of the
treasury business on the basis of a well-established risk
management regime and related measures.
In accordance with the Group’s corporate governance
principles in respect of risk management, the Board and
RC, senior management and functional departments/
units perform their duties and responsibilities to manage
the Group’s market risk. The Market Risk Management
Division of the RMD is mainly responsible for managing
market risk, assisting senior management to perform
their day-to-day duties, independently monitoring the
market risk profile and compliance of management
policies and limits of the Group and BOCHK, ensuring
that the aggregate and individual market risks are within
acceptable level.
The Group’s market risk management covers BOCHK
and its subsidiaries. The Group establishes consistent
market risk management policies to regulate BOCHK’s and
subsidiaries’ market risk management work; meanwhile,
the Group sets up the Group VAR and stress test limits,
which are allocated and monitored across the Group,
according to the subsidiaries’ business requirements and
risk tolerance levels. In line with the requirements set in
the Group policy, the subsidiaries may, subject to prior
consent by BOCHK, formulate the detailed policies and

ManageMent’s Discussion anD analysis
32 BOC Hong Kong (Holdings) Limited Interim Report 2012
procedures and must bear the responsibility for managing
daily market risk that they may face. The subsidiaries set
up independent risk monitoring teams to monitor daily
market risk and limit compliance, and submit management
information and reports to BOCHK on a regular basis.
The Group sets up market risk indicators and limits to
identify, measure, monitor and control market risk. Major
risk indicators and limits include but are not limited
to VAR, Stop Loss, Open Position, Stress Testing and
Sensitivity Analysis (Basis Point Value, Greeks), etc. To
meet management requirements, major risk indicators
and limits are classified into four levels, and approved by
the RC, MC, CRO and the DCE in charge of the treasury
business or the head of the respective business unit.
Treasury business units of BOCHK and other subsidiaries
(as for Group Limit) are required to conduct their business
within approved market risk indicators and limits.
The Group uses the VAR technique to measure potential
losses and general market risks of its trading book for
reporting to the RC and senior management on a periodic
basis. The Group adopts a uniformed VAR calculation
model, using the historical simulation approach and
2-year historical data to calculate the VAR of the Group
and subsidiaries over a 1-day holding period with 99%
confidence level, and to set up the VAR limit of the Group
and subsidiaries.
The predictive power of the VAR measure is monitored by
back-testing, which compares the calculated VAR figure
of trading positions of each business day with the actual
and hypothetical revenues arising from those positions on
the next business day. Generally speaking, the number
of back-testing exceptions in a rolling 12-month period
will not exceed four times, given a 99% confidence level.
BOCHK conducts back-testing on a monthly basis.
Liquidity Risk Management
Liquidity risk is the risk that banks fail to provide sufficient
funds to grow assets or pay due obligations, and so
need to bear an unacceptable loss. The Group follows
a sound liquidity risk appetite to provide stable, reliable
and adequate sources of cash to meet liquidity needs
under normal circumstances or stressed scenarios; and to
survive with net positive cumulative cash flow in extreme
scenarios without requesting HKMA to act as the lender
of last resort.
The Group’s liquidity risk management objective is to
effectively manage the liquidity of on-balance sheet and
off-balance sheet items with reasonable cost based on
the liquidity risk appetite to achieve sound operation
and sustainable profitability. Customer deposits are the
Group’s primary source of funds. To ensure that a stable
and sufficient source of funds is in place, the Group
actively attracts new deposits, keeps the core deposits and
obtains supplementary funding from the interbank market
or by issuing bills in the capital market. According to
different term maturities and the results of funding needs
estimated from stressed scenarios, the Group adjusts
its asset structure (including loans, bond investments,
interbank placements, etc.) to maintain sufficient liquid
assets in support of normal business needs and ensure
its ability to raise enough funds at reasonable costs to
serve external claims in case of emergency. The Group
is committed to diversifying the source of funds and the
use of funds to avoid excessive concentration of assets
and liabilities, and to prevent triggering liquidity risk due
to the break of funding strand when problems occur in
one concentrated funding source. The Group also pays
attention to liquidity risk created by off-balance sheet
activities, such as loan commitments, derivatives, options
and other complex structured products. The Group has
an overall liquidity risk management strategy to cover
the liquidity management of foreign currency assets
and liabilities, intraday liquidity, intra-group liquidity,
the liquidity risk arising from others’ risk, etc., and has
formulated a corresponding funding contingency plan.
The RC is the decision-making authority of liquidity risk
management, and assumes the ultimate responsibility of
liquidity risk management. As authorised by the RC, the
ALCO exercises its oversight of liquidity risk and ensures
the daily operations of the Group are in accordance with
risk appetite and policies as set by the RC. The Market Risk
Management Division of the RMD is the unit responsible
for overseeing the Group’s liquidity risk. It cooperates
with the Financial Management Department (Assets and
Liabilities Management), Investment Management, etc.
to assist the ALCO in performing liquidity management
functions according to their specific responsibilities.
The Group has established liquidity risk management
indicators and limits to identify, measure, monitor and
control liquidity risk. Such indicators and limits include
(but are not limited to) the liquidity ratio, deposit stability
33Interim Report 2012 BOC Hong Kong (Holdings) Limited
ManageMent’s DIscussIon anD analysIs
ratio, loan-to-deposit ratio, Maximum Cumulative Outflow
(“MCO”) and liquidity buffer asset portfolio. The Group
applies cash flow analysis (under normal and stress
conditions) and liquidity stress test (including institution-
specific and worldwide crisis) to assess the Group’s
capability to withstand various severe liquidity crises.
Also, the Assets and Liabilities Management System is
developed to provide data support for facilitating the
liquidity risk management duties.
The Group’s liquidity risk management also covers new
product or business development. Before launching
a new product or business, the relevant departments
are required to go through a risk assessment process,
which includes the assessment of underlying liquidity
risk and consideration of the adequacy of the current
risk management mechanism. Any material impact on
liquidity risk noted during the risk assessment process will
be reported to the RC for approval.
The Group has established a set of uniform liquidity
risk management policies which serve as standards and
guidance to all the Group’s members for liquidity risk
management. On the basis of the Group’s uniform policy,
each of the subsidiaries formulates its own liquidity
management policies according to its own characteristics
(subject to approval by BOCHK), and assumes its own
liquidity risk management responsibility. Subsidiaries are
required to report their respective liquidity positions on a
regular basis to the Market Risk Management Division of
the RMD of BOCHK which consolidates such information
and evaluates group-wide liquidity risk.
Operational Risk Management
Operational risk is the risk of loss resulting from inadequate
or failed internal process, staff and information technology
system, or from external events. The risk is inherent in
every aspect of business operations and confronted by the
Group in its day-to-day operational activities.
The Group has implemented the “Three Lines of Defence”
for its operational risk management. All departments or
functional units as the first line of defence are the first
parties responsible for operational risk management, and
carry out the duties and functions of self risk control in
the process of business operation through self assessment,
self checking, self correction and self development. The
Operational Risk and Compliance Department (“OR&CD”)
together with certain specialist functional units in relation
to operational risk management within the Group,
including the Human Resources Department, Information
Technology Department, Corporate Services Department,
Financial Management Department and General
Accounting & Accounting Policy Department (collectively
known as “Specialist functional units”), are the second
line of defence, which is responsible for assessing and
monitoring the operational risk conditions in the first
line of defence, and providing them with guidance. The
OR&CD, being independent from the business units, is
responsible for assisting the Management in managing
the Group’s operational risk, including the establishment
and review of the operational risk management policy and
framework, designing the operational risk management
tools and reporting mechanism, and assessing and
reporting the overall operational risk position to the
Management and RC. Specialist functional units are
required to carry out their managerial duties of the
second line defence with respect to some specific aspects
of operational risk and its related issues. Besides taking
charge of operational risk management in their own
units, these units are also required to provide other units
with professional advice/training in respect of certain
operational risk categories and to lead the Group-wide
operational risk management. Group Audit is the third
line of defence which provides independent assessment
to the robustness and adequacy of the operational risk
management framework and is required to conduct
periodic audit of the operational risk management
activities of various departments or functional units within
the Group regarding their compliance and effectiveness
and to put forward recommendations for remedial actions.
The Group has put in place an effective internal control
process which requires the establishment of policies and
control procedures for all the key activities. The Group
adheres to the fundamental principle of proper segregation
of duties and authorisation. The Group adopts various
operational risk management tools or methodologies such
as key risk indicators, self-assessment, operational risk events
reporting and review to identify, assess, monitor and control
the risks inherent in business activities and products, as
well as purchase of insurance to mitigate unforeseeable
operational risks. Business continuity plans are established
to support business operations in the event of an emergency
or disaster. Adequate backup facilities are maintained and
periodic drills are conducted.

ManageMent’s Discussion anD analysis
34 BOC Hong Kong (Holdings) Limited Interim Report 2012
Reputation Risk Management
Reputation risk is the risk that negative publicity about
the Group’s business practices, whether genuine or not,
will cause a potential decline in the customer base, or
lead to costly litigation or revenue erosion. Reputation
risk is inherent in other types of risk and every aspect of
business operation and covers a wide spectrum of issues.
In order to mitigate reputation risk, the Group has
formulated and duly followed its Reputation Risk
Management Policy. The policy aims to prevent and
manage reputation risk proactively at an early stage
when an incident occurs. Since reputation risk is often
caused by various types of operational and strategic
issues that negatively impact the trust and perception
of the company, all operational and key risks identified
are assessed through the established Key Control Self-
Assessment framework, including risk assessment tools,
to evaluate the severity of their impact on the Group,
including the damage to reputation. In addition, the
Group has put in place a framework, including system
support, to achieve continuous monitoring of external
reputation risk incidents and published failures of risk
incidents in the financial industry.
Legal and Compliance Risk Management
Legal risk is the risk that unenforceable contracts, lawsuits
or adverse judgments may disrupt or otherwise negatively
affect the operations or financial conditions of the Group.
Compliance risk is the risk of legal or regulatory sanctions,
financial losses or losses in reputation a bank may suffer
as a result of its failure to comply with all applicable laws
and regulations. Legal and compliance risks are managed
by the OR&CD, which reports directly to the CRO. All legal
matters are handled by the Legal Services Centre (“LSC”),
which reports to the Chief Operating Officer. The OR&CD
is responsible for legal risk management of the Group with
support rendered by the LSC. As part of the Group’s corporate
governance framework, the policy for the management of
legal and compliance risk is approved by the RC.
Strategic Risk Management
Strategic risk generally refers to the risks that may induce
immediate or future negative impact on the financial and
market positions of the Group because of poor strategic
decisions, improper implementation of strategies and
lack of response to the market. The Board reviews and
approves the policy for the management of strategic
risks. Key strategic issues have to be fully evaluated and
properly endorsed by the senior management and the
Board.
The Group will regularly review its business strategies to
cope with the latest market situation and developments.
Capital Management
The major objective of the Group’s capital management is
to maximise total shareholders’ return while maintaining
a capital adequacy position in relation to the Group’s
overall risk profile. The ALCO periodically reviews the
Group’s capital structure and adjusts the capital mix where
appropriate to maintain an optimal balance between risk,
return and capital adequacy.
To comply with the HKMA’s requirements as stated
in the Supervisory Policy Manual “Supervisory Review
Process”, the Group adopts the Internal Capital Adequacy
Assessment Process (“ICAAP”) and reviews it annually.
Using the statutory minimum capital adequacy ratio
(“CAR”), 8%, as a starting point, extra capital (capital
add-on) needed to cover the material risks not captured
under Pillar I is assessed. A Scorecard approach based on
the HKMA’s compliance guidance on Pillar II has been
used to evaluate the Group’s risk profile in order to assess
the add-on capital to determine the minimum common
equity CAR, minimum core CAR and the minimum CAR.
In the process, an Operating CAR Range has also been
established which incorporates the need for future
business growth and efficiency of capital utilisation.

35Interim Report 2012 BOC Hong Kong (Holdings) Limited
ManageMent’s DIscussIon anD analysIs
The HKMA has issued a consultation paper on capital
standards in January 2012 for the implementation of Basel
III in Hong Kong. The Group has conducted a detailed
impact analysis of it and has prepared for the future
implementation of new capital requirements.
Stress Testing
The Group supplements the analysis of various types
of risks with stress testing. Stress testing is a risk
management tool for estimating risk exposures under
stressed conditions arising from extreme but plausible
market or macroeconomic movements. These tests are
conducted on a regular basis by the Group’s various
risk management units in accordance with the principles
stated in the Supervisory Policy Manual “Stress-testing”
published by the HKMA and the ALCO monitors the
results against the key risk limit approved by the RC. The
Financial Management Department reports the combined
stress test results of the Group to the Board and RC
regularly.
BOC Life InsuranceBOC Life’s principal business activity is the underwriting
of long-term insurance business in life and annuity,
unit-linked long-term business and retirement scheme
management in Hong Kong. Major types of risk arising
from the BOC Life’s insurance business are insurance
risk, interest rate risk, liquidity risk and credit risk. BOC
Life closely monitors these risks and reports to its RC on
a regular basis. The key risks of its insurance business and
related risk control process are as follows:
Insurance Risk Management
BOC Life is in the business of insuring against the risk of
mortality, morbidity, disability, critical illness, accidents
and related risks. These risks are managed through the
application of underwriting policies and reinsurance
arrangement.
The underwriting strategy is intended to set premium
pricing at an appropriate level that corresponds with the
underlying exposure of the risks underwritten. Screening
processes, such as the review of health condition and
family medical history, are also included in BOC Life’s
underwriting procedures.
The reinsurance arrangement does not, however,
discharge BOC Life’s liability as the primary insurer. If a
reinsurer fails to pay a claim for any reasons, BOC Life
remains liable for the payment to the policyholder. The
creditworthiness of reinsurers is considered by reviewing
the reinsurers’ financial strength prior to finalisation of
any contract. BOC life directs its reinsurance placement
policy and assesses the creditworthiness of all reinsurers
and intermediaries by reviewing credit grades provided
by rating agencies and other publicly available financial
information. BOC Life also monitors the recoverability of
its reinsurance assets on an ongoing basis. It maintains
records of the payment history for significant contract
holders with whom it conducts regular business.
For details of the Group’s Insurance Risk Management,
please refer to Note 3.4 to the Interim Financial
Information.
Interest Rate Risk Management
An increase in interest rates may result in the depreciation
of the value of BOC Life’s bond portfolio. It may also
result in customers accelerating surrenders. A decrease
in interest rates may result in an increase in insurance
liability and an inability to adequately match guarantees
or lower returns leading to customer dissatisfaction. BOC
Life manages the asset liability matching of its portfolios
within an asset liability management framework that has
been developed to achieve investment returns that match
its obligations under insurance contracts.

ManageMent’s Discussion anD analysis
36 BOC Hong Kong (Holdings) Limited Interim Report 2012
Liquidity Risk Management
Liquidity risk is the risk of not being able to fund increases
in assets or meet obligations as they fall due without
incurring unacceptable loss. BOC Life’s asset liability
matching framework includes cash flow management to
preserve liquidity to match policy payout from time to
time. In the normal course of BOC Life’s business, new
business premiums generate constant cash inflows and, as
a result, the portfolios also grow gradually to meet future
liquidity requirement.
Credit Risk Management
BOC Life has exposure to credit risk, which is the risk that
a customer or counterparty will be unable to or unwilling
to meet a commitment that they have entered into. Key
areas to which BOC Life’s insurance business is exposed
include:
• Defaultriskofbondissuersorthecounterparties
of structured products
• Credit spread widening as a result of credit
migration (downgrade)
• Re-insurers’shareofinsuranceunpaidliabilities
• Amountsduefromre-insurersinrespectofclaims
already paid
• Amountduefrominsurancecontractholders
• Amountduefrominsuranceintermediaries
BOC Life manages credit risk by placing limits on its
exposure to each investment counterparty or group of
counterparties. Such limits are subject to annual or more
frequent review by the Management.
In order to enhance its credit risk management, BOC Life
has strengthened its communication with the Investment
Management of the Group while closely monitoring
and updating the established Bonds Issuers Disposal
and Watch Lists to ensure consistency with the Group’s
credit risk management and investment strategy. For the
management of reinsurers’ credit risk, please refer to the
Insurance Risk Management above.