Mahindra & Mahindra Financial Services Limited Meet/132720_20130118.pdf · Mahindra & Mahindra...
42
Mahindra & Mahindra Financial Services Limited Quarter Result Update DECEMBER - 2012 1
Transcript of Mahindra & Mahindra Financial Services Limited Meet/132720_20130118.pdf · Mahindra & Mahindra...

Mahindra & Mahindra FinancialServices Limited
Quarter Result UpdateDECEMBER - 2012
1
Company overview
2
Company overview
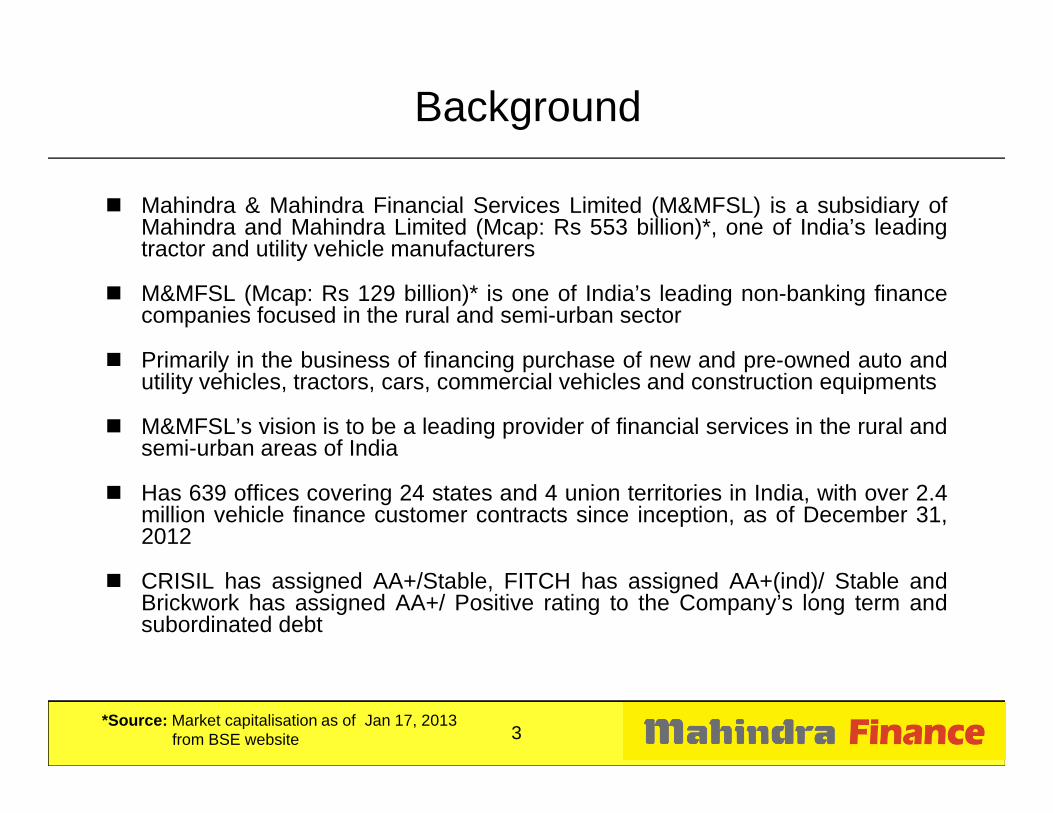
� Mahindra & Mahindra Financial Services Limited (M&MFSL) is a subsidiary ofMahindra and Mahindra Limited (Mcap: Rs 553 billion)*, one of India’s leadingtractor and utility vehicle manufacturers
� M&MFSL (Mcap: Rs 129 billion)* is one of India’s leading non-banking financecompanies focused in the rural and semi-urban sector
� Primarily in the business of financing purchase of new and pre-owned auto andutility vehicles, tractors, cars, commercial vehicles and construction equipments
Background
3
� M&MFSL’s vision is to be a leading provider of financial services in the rural andsemi-urban areas of India
� Has 639 offices covering 24 states and 4 union territories in India, with over 2.4million vehicle finance customer contracts since inception, as of December 31,2012
� CRISIL has assigned AA+/Stable, FITCH has assigned AA+(ind)/ Stable andBrickwork has assigned AA+/ Positive rating to the Company’s long term andsubordinated debt
*Source: Market capitalisation as of Jan 17, 2013 from BSE website

M&MFSL Group structure
Mahindra and Mahindra Limited
M&MFSL
51.2%
4
Mahindra RuralHousing
Finance Limited(“MRHFL”)
Mahindra Insurance Brokers Limited
(“MIBL”)
Mahindra Business &Consulting Services
Private Limited
100%*87.5% , balance
12.5% with NationalHousing Bank
100%49%
Mahindra FinanceUSA LLC
(Joint venturewith Rabobank
Group subsidiary)
* The company on Sep 20, 2012 has approved the proposal for sale of 12.37% stake in “MIBL” to Inclusion resources pvt. Ltd., a subsidiary of Leapfrog Financial Inclusion Fund, incorporated in Singapore, for an amount of Rs.643.3 millions, subject to receipt of regulatory approvals.

Shareholding pattern(as on December 31, 2012)
5
� The Company came out with its IPO in February 2006
� The Company issued 6.13 million shares to Qualified Institutional Buyers (QIBs) under QIP inFebruary 2011, all at a cash price of Rs. 695/Share
� The Company issued 9.75 million shares to Qualified Institutional Buyers (QIBs) under QIP inNovember 2012, all at a cash price of Rs. 889/Share
� Shareholders include Morgan Stanley Asia (Singapore) Pte., Eastspring Investments, JP MorganFunds, Fidelity Investment Trust, Wasatch Emerging Markets and Cartica Capital Ltd.

Industry overviewIndustry overview
6
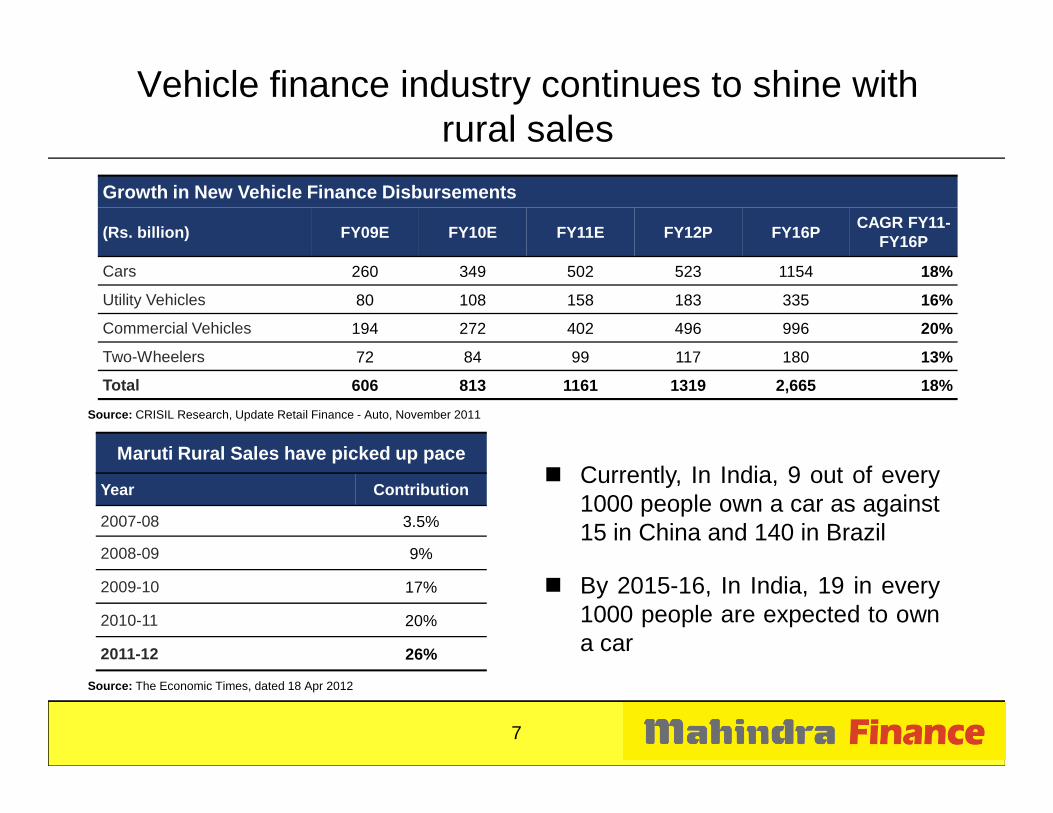
Growth in New Vehicle Finance Disbursements
(Rs. billion) FY09E FY10E FY11E FY12P FY16PCAGR FY11-
FY16P
Cars 260 349 502 523 1154 18%
Utility Vehicles 80 108 158 183 335 16%
Commercial Vehicles 194 272 402 496 996 20%
Two-Wheelers 72 84 99 117 180 13%
Total 606 813 1161 1319 2,665 18%
Vehicle finance industry continues to shine with rural sales
Source: CRISIL Research, Update Retail Finance - Auto, November 2011
Maruti Rural Sales have picked up pace
Year Contribution
2007-08 3.5%
2008-09 9%
2009-10 17%
2010-11 20%
2011-12 26%
Source: The Economic Times, dated 18 Apr 2012
� Currently, In India, 9 out of every1000 people own a car as against15 in China and 140 in Brazil
� By 2015-16, In India, 19 in every1000 people are expected to owna car
7
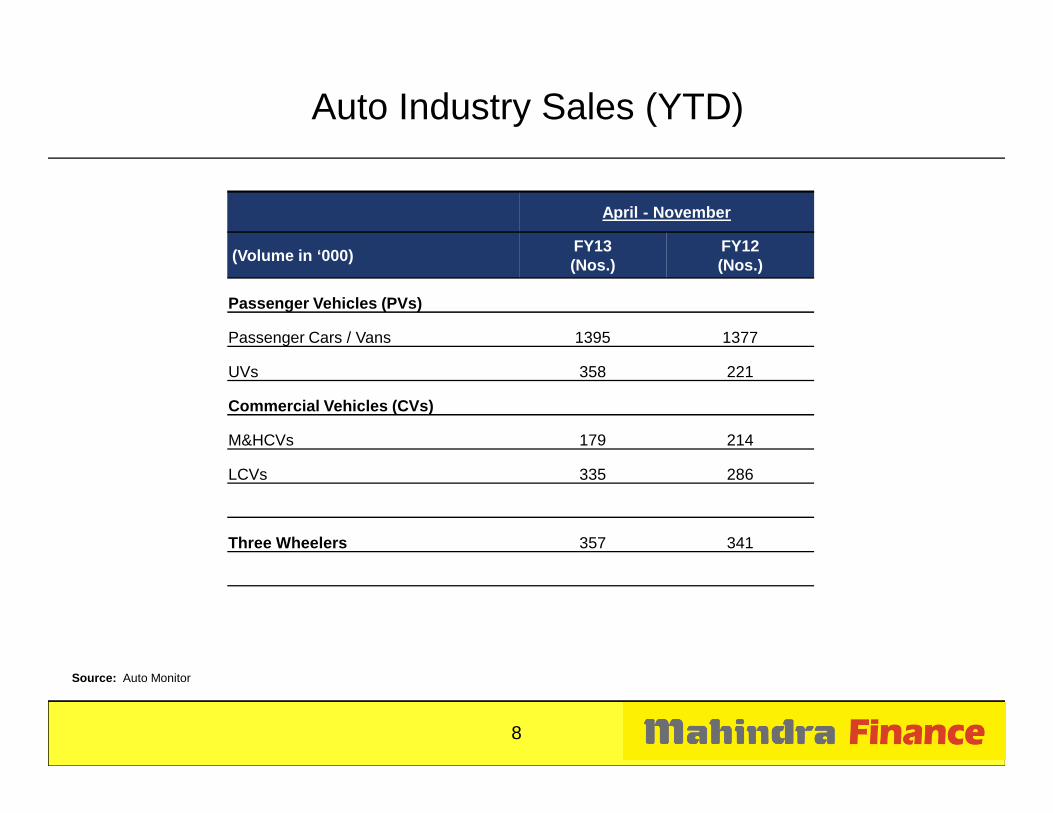
Auto Industry Sales (YTD)
April - November
(Volume in ‘000)FY13 (Nos.)
FY12 (Nos.)
Passenger Vehicles (PVs)
Passenger Cars / Vans 1395 1377
UVs 358 221
Commercial Vehicles (CVs)
Source: Auto Monitor
8
Commercial Vehicles (CVs)
M&HCVs 179 214
LCVs 335 286
Three Wheelers 357 341
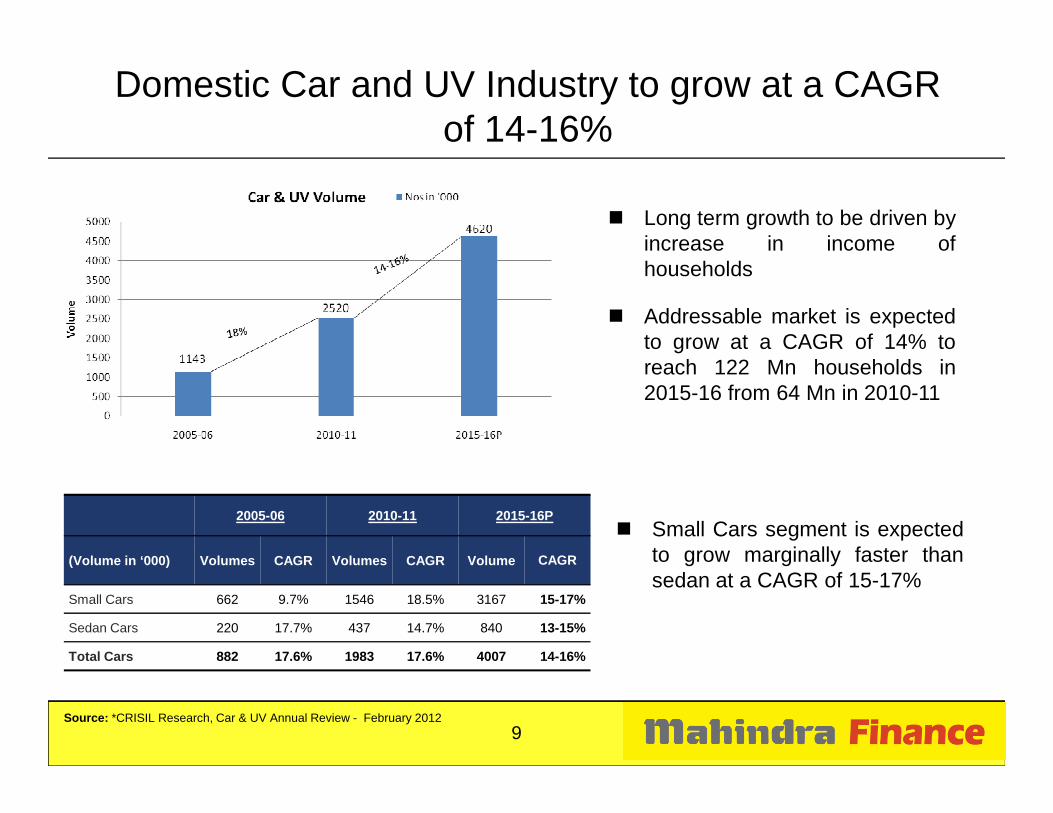
Domestic Car and UV Industry to grow at a CAGR of 14-16%
� Long term growth to be driven byincrease in income ofhouseholds
� Addressable market is expectedto grow at a CAGR of 14% toreach 122 Mn households in2015-16 from 64 Mn in 2010-11
Source: *CRISIL Research, Car & UV Annual Review - February 2012
2005-06 2010-11 2015-16P
(Volume in ‘000) Volumes CAGR Volumes CAGR Volume CAGR
Small Cars 662 9.7% 1546 18.5% 3167 15-17%
Sedan Cars 220 17.7% 437 14.7% 840 13-15%
Total Cars 882 17.6% 1983 17.6% 4007 14-16%
� Small Cars segment is expectedto grow marginally faster thansedan at a CAGR of 15-17%
9

Overall Demand Drivers
� Increase in affordability
� Growth in Addressable Market
� New Launches
� Increase in dealerships and access to Finance
� Reduction in holding period, which increases the demand for secondvehicles
� Growth in Economic Activity
� Infrastructure development, structural changes and governmentinitiatives
10

Business Strategies
11
Business Strategies
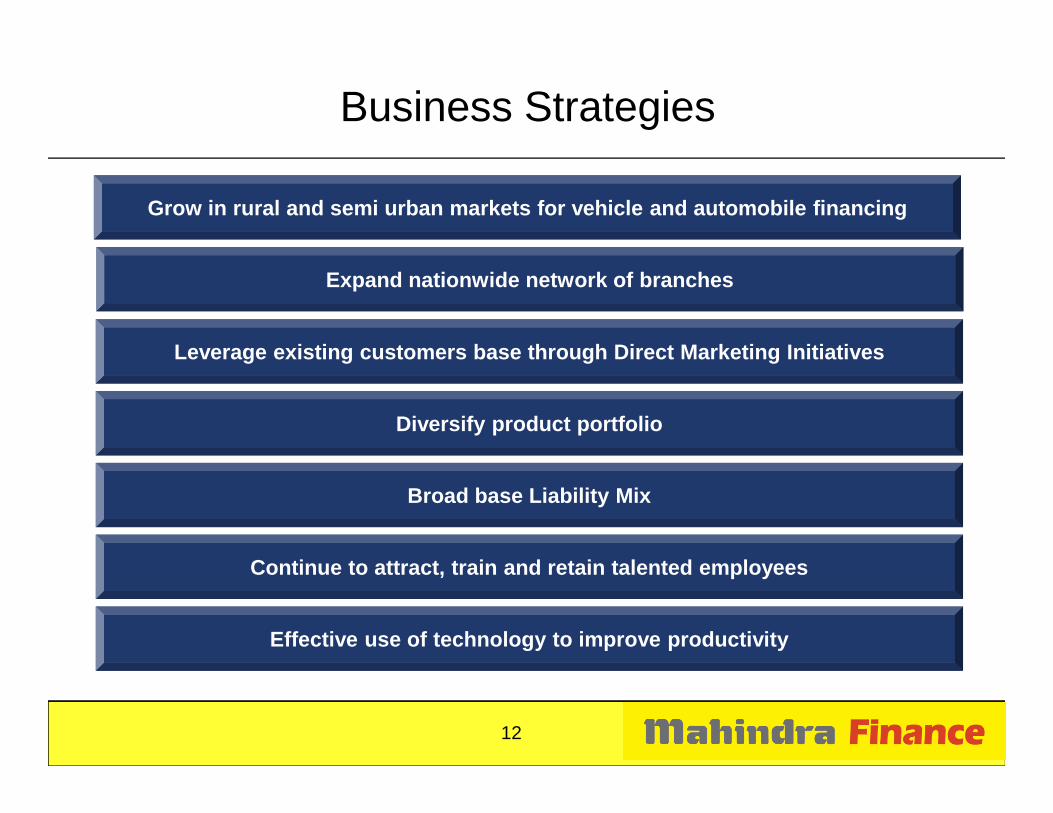
Grow in rural and semi urban markets for vehicle an d automobile financingGrow in rural and semi urban markets for vehicle an d automobile financing
Expand nationwide network of branchesExpand nationwide network of branches
Business Strategies
Leverage existing customers base through Direct Mar keting InitiativesLeverage existing customers base through Direct Mar keting Initiatives
12
Broad base Liability MixBroad base Liability Mix
Diversify product portfolioDiversify product portfolio
Effective use of technology to improve productivityEffective use of technology to improve productivity
Continue to attract, train and retain talented empl oyees Continue to attract, train and retain talented empl oyees

Diversified Product Portfolio
� Loans for auto and utility vehicles, tractors, cars, commercial vehicles and construction equipmentsVehicle Financing
Pre-Owned Vehicles
� Loans for pre-owned cars, multi-utility vehicles, tractors and commercial vehicles
SME Financing� Loans for varied purposes like project finance, equipment finance
and working capital finance
� Offers personal loans typically for weddings, children’s education,
13
Mutual Fund Distribution
� Advises clients on investing money through AMFI certified professionals under the brand “MAHINDRA FINANCE FINSMART”
Personal Loans� Offers personal loans typically for weddings, children’s education,
medical treatment and working capital
Insurance Broking
Housing Finance
� Insurance solutions to retail customers as well as corporations through our subsidiary MIBL
� Loans for buying, renovating, extending and improving homes in rural and semi-urban India through our subsidiary MRHFL

� M&MFSL has an extensive branch network with presence in 24 states and 4 unionterritories in India through 639 offices as of December 31, 2012
– Branches have authority to approve loans within prescribed guidelines
Coverage Branch Network as of
Extensive branch network
12
5
57
21
18
7
2
46
22
11
10
38
47
56
59
2
14
4062
28
8
1
18
4
11
45
16
14
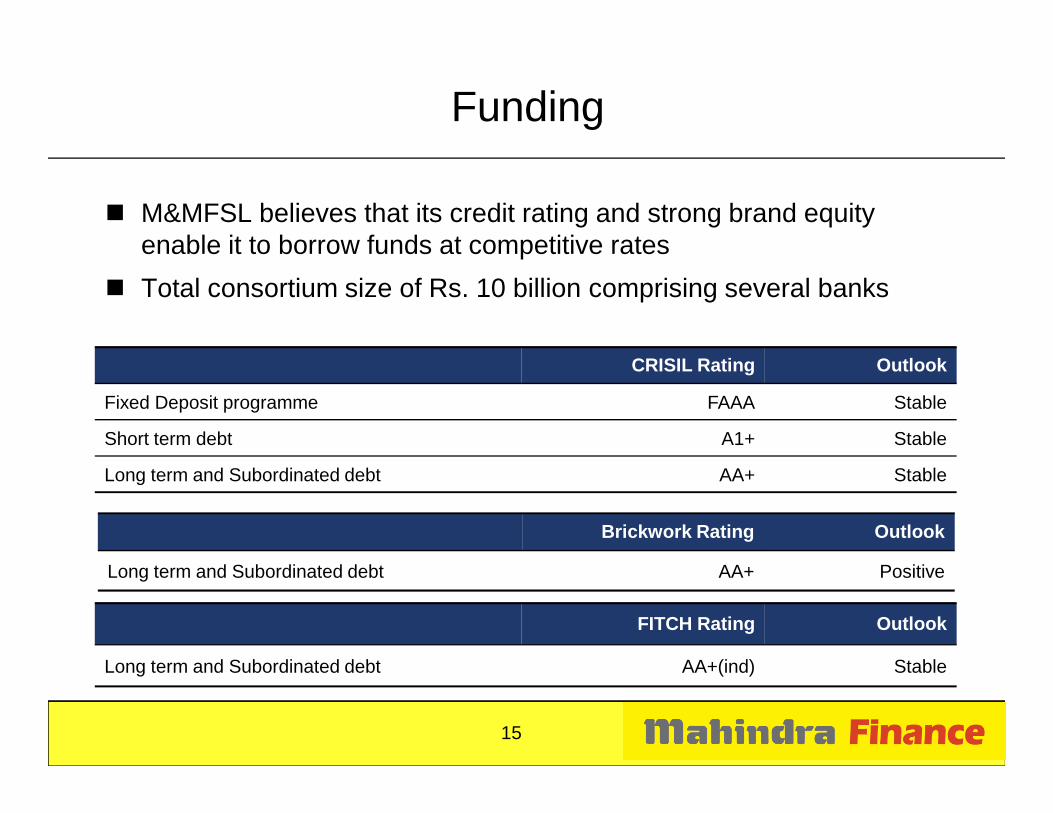
Funding
� M&MFSL believes that its credit rating and strong brand equity enable it to borrow funds at competitive rates
� Total consortium size of Rs. 10 billion comprising several banks
CRISIL Rating Outlook
Fixed Deposit programme FAAA Stable
15
Fixed Deposit programme FAAA Stable
Short term debt A1+ Stable
Long term and Subordinated debt AA+ Stable
Brickwork Rating Outlook
Long term and Subordinated debt AA+ Positive
FITCH Rating Outlook
Long term and Subordinated debt AA+(ind) Stable
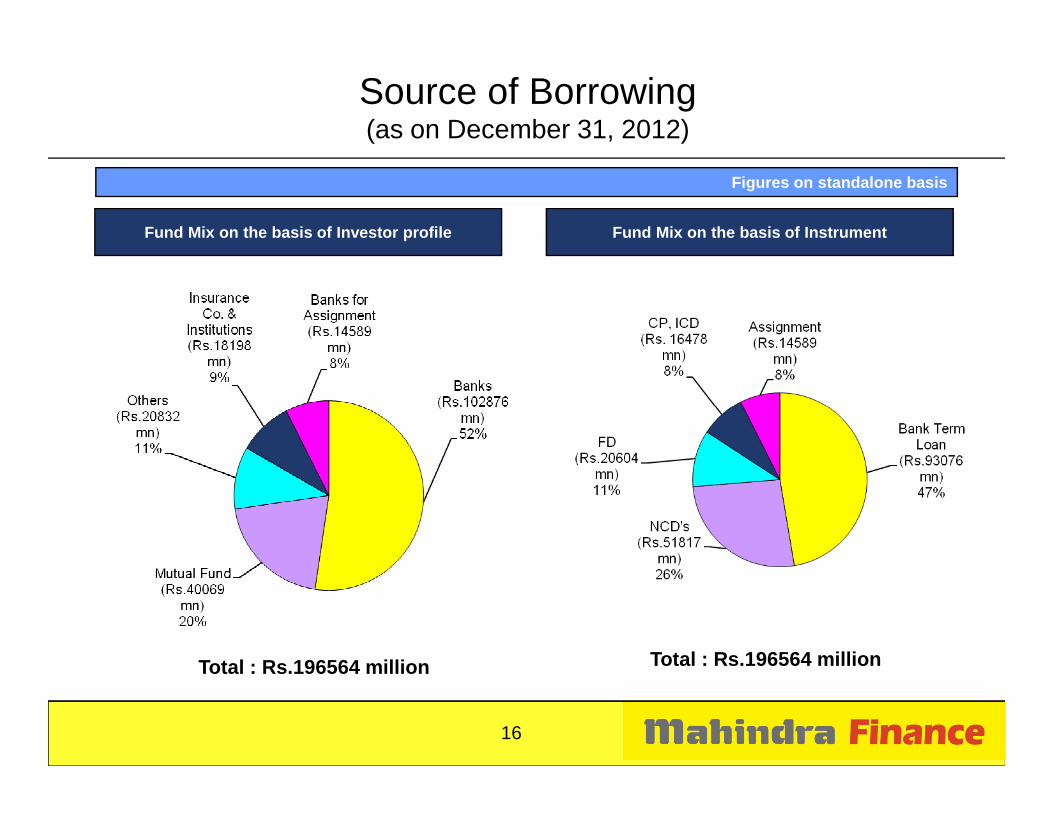
Source of Borrowing(as on December 31, 2012)
Figures on standalone basis
Fund Mix on the basis of Investor profile Fund Mix on the basis of Instrument
16
Total : Rs.196564 million Total : Rs.196564 million

Financial Information
17
Financial Information

Highlights for Q3- FY13 Vs Q3- FY12
35%
Rs.10,009 mn Rs.2,002 mn Rs.68,001 mn
29% 16%
Figures on standalone basis
18
Total Income
Rs.7,414 mn Rs.1,547 mn Rs.58,857 mn
Profit After Tax Value of Assets Financed
� Assets under Management have increased from Rs.194,581 Mn to Rs.256,451 Mn year-on-year basis.
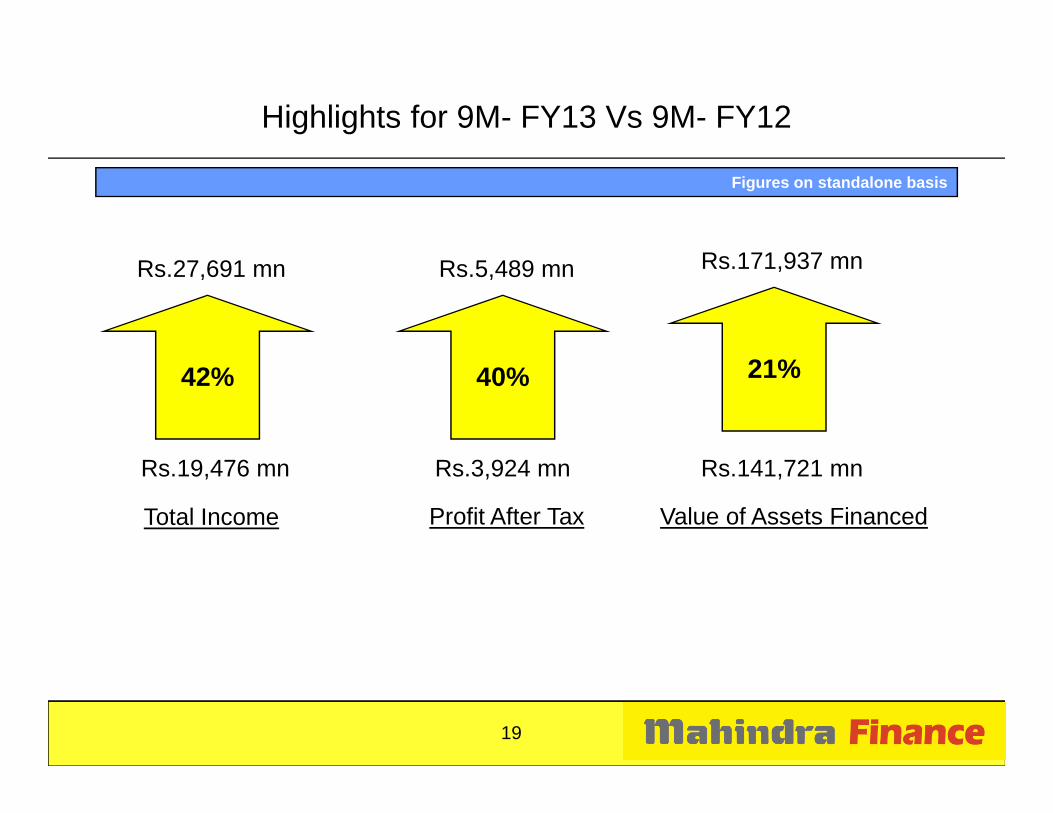
Highlights for 9M- FY13 Vs 9M- FY12
42%
Rs.27,691 mn Rs.5,489 mn Rs.171,937 mn
40% 21%
Figures on standalone basis
19
Total Income
Rs.19,476 mn Rs.3,924 mn Rs.141,721 mn
Profit After Tax Value of Assets Financed

Particulars (Rs. million)Nine Months ended
December – 12Nine Months ended
December – 11Year ended March – 12
Revenue from operations 27,464 19,288 27,681
Other income 227 188 265
Total income 27,691 19,476 27,946
Interest cost 11,716 7,899 11,203
Standalone Profit & Loss Statement
Administrative cost 7,515 5,496 7,173
Provision on Standard Assets 134 102 121
Depreciation 164 148 196
Total expenditure 19,529 13,645 18,693
PBT 8,162 5,831 9,253
PAT 5,489 3,924 6,201
20
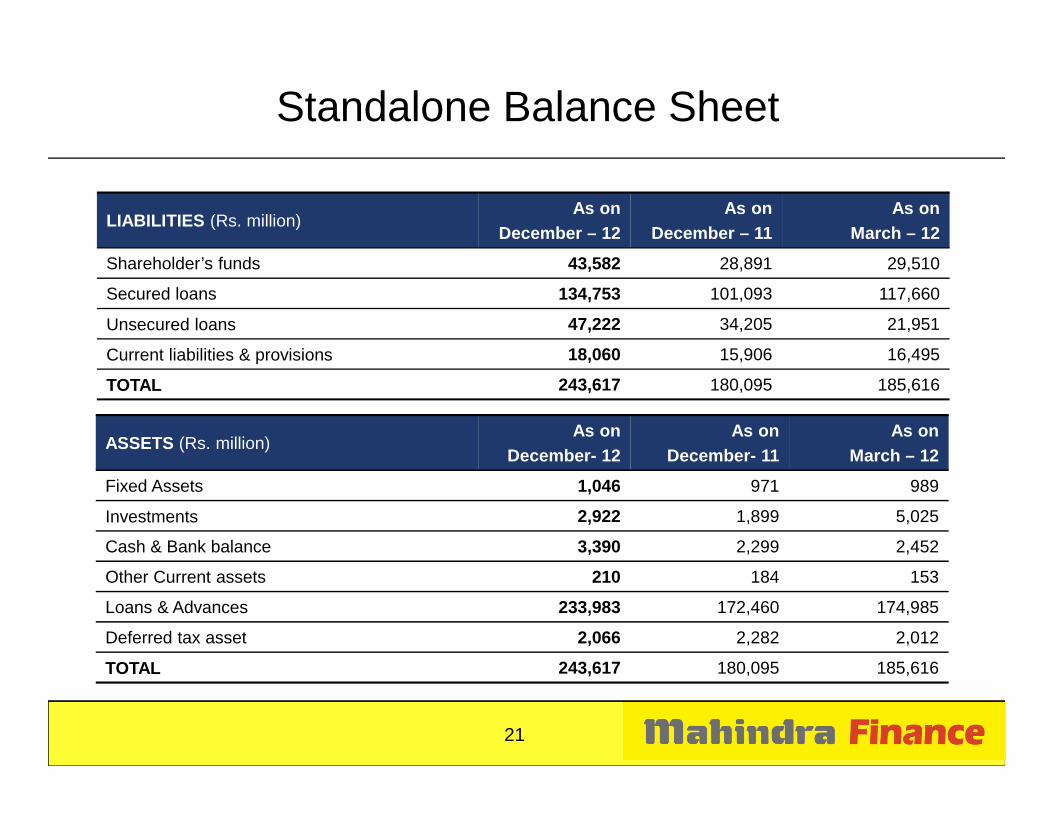
LIABILITIES (Rs. million)As on
December – 12As on
December – 11As on
March – 12
Shareholder’s funds 43,582 28,891 29,510
Secured loans 134,753 101,093 117,660
Unsecured loans 47,222 34,205 21,951
Current liabilities & provisions 18,060 15,906 16,495
TOTAL 243,617 180,095 185,616
Standalone Balance Sheet
ASSETS (Rs. million)As on
December- 12As on
December- 11As on
March – 12
Fixed Assets 1,046 971 989
Investments 2,922 1,899 5,025
Cash & Bank balance 3,390 2,299 2,452
Other Current assets 210 184 153
Loans & Advances 233,983 172,460 174,985
Deferred tax asset 2,066 2,282 2,012
TOTAL 243,617 180,095 185,616
21

Mahindra Rural Housing Finance Limited
Particulars (Rs. million) Nine Months ended December – 12
Nine Months ended December – 11
Year ended March – 12
Loans disbursed 2,812 1,808 2,668
No. of Customer Contracts (Nos) 37,913 19,762 33,172
Outstanding loan book 7,562 4,642 5,352
Total income 970 595 857
� Shareholding pattern: M&MFSL- 87.5%, NHB- 12.5%
� Currently operating in 9 States
Total income 970 595 857
PBT 155 89 161
PAT 116 67 119
22

Particulars (Rs. million) Nine Months ended December – 12
Nine Months ended December – 11
Year ended March – 12
Total income 606 259 465
Net premium 3,727 2,786 4,138
Mahindra Insurance Brokers Limited
PBT 351 69 201
PAT 237 46 135
No. of Policies for the Period (nos.) 588,745 502,841 703,730
No. of employees (nos.) 451 428 451
23

Consolidated Profit & Loss Statement
Particulars (Rs. million)Nine Months ended
December – 12Nine Months ended
December – 11Year ended March – 12
Income from operations 29,098 20,042 28,853
Other income 138 143 251
Total Income 29,236 20,185 29,104
Interest cost 12,066 8,008 11,399
Administrative cost 8,182 5,936 7,755
Provision on Standard Assets 142 112 134
Depreciation 175 152 203
Total Expenditure 20,565 14,208 19,491
PBT 8,671 5,977 9,613
PAT 5,807 4,011 6,435
24

LIABILITIES (Rs. million)As on
December – 12As on
December – 11As on
March – 12
Shareholder’s funds 44,726 29,571 30,311
Minority Interest 92 75 77
Secured loans 146,475 105,691 124,650
Unsecured loans 46,995 34,012 21,814
Current liabilities & provisions 18,689 16,370 17,356
TOTAL 256,977 185,719 194,208
Consolidated Balance Sheet
TOTAL 256,977 185,719 194,208
ASSETS (Rs. million)As on
December – 12As on
December – 11As on
March – 12
Fixed Assets 1,101 1,006 1,028
Investments 1,986 1,266 4,366
Cash & Bank balance 3,645 2,456 2,717
Other Current assets 282 189 186
Loans & Advances 247,856 178,501 183,878
Deferred tax asset 2,107 2,301 2,033
TOTAL 256,977 185,719 194,208
25

Break up of estimated value of Assets Financed
SegmentsNine Months ended
December–12Nine Months ended
December–11Full year ended
March–12
Auto/ Utility vehicles 34% 31% 31%
Tractors 19% 21% 20%
26
Cars 25% 26% 27%
Commercial vehicles and Construction equipments
10% 12% 12%
Pre-owned vehicles and others 12% 10% 10%
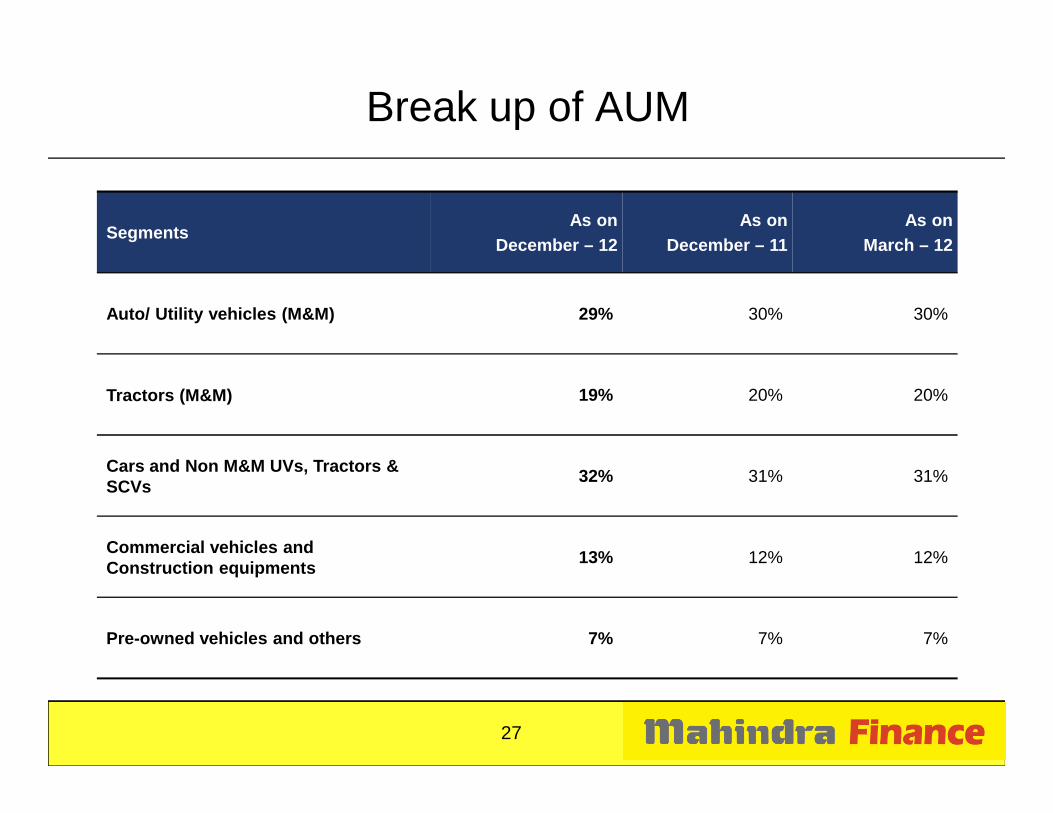
Break up of AUM
SegmentsAs on
December – 12As on
December – 11As on
March – 12
Auto/ Utility vehicles (M&M) 29% 30% 30%
Tractors (M&M) 19% 20% 20%
27
Cars and Non M&M UVs, Tractors & SCVs
32% 31% 31%
Commercial vehicles and Construction equipments
13% 12% 12%
Pre-owned vehicles and others 7% 7% 7%
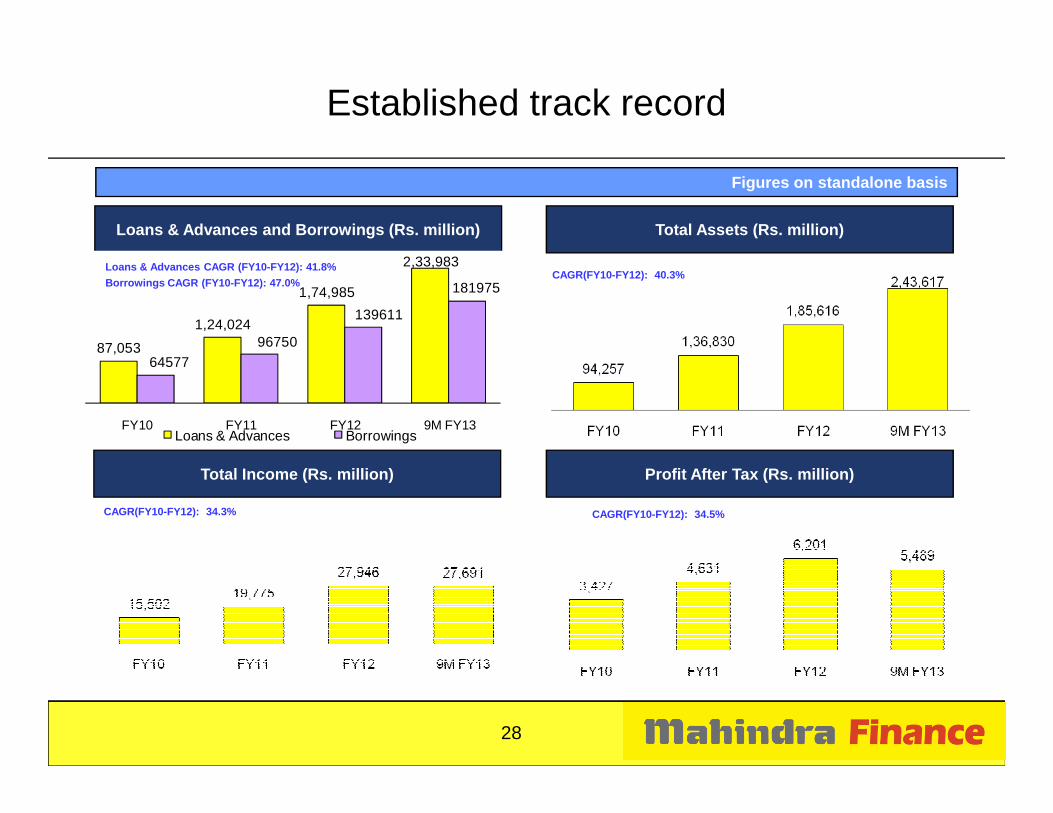
Established track record
Loans & Advances and Borrowings (Rs. million) Total Assets (Rs. million)
87,053
1,24,024
1,74,985
2,33,983
6457796750
139611
181975
Loans & Advances CAGR (FY10-FY12): 41.8%
Borrowings CAGR (FY10-FY12): 47.0%CAGR(FY10-FY12): 40.3%
Figures on standalone basis
28
FY10 FY11 FY12 9M FY13Loans & Advances Borrowings
Profit After Tax (Rs. million)
CAGR(FY10-FY12): 34.5%
Total Income (Rs. million)
CAGR(FY10-FY12): 34.3%
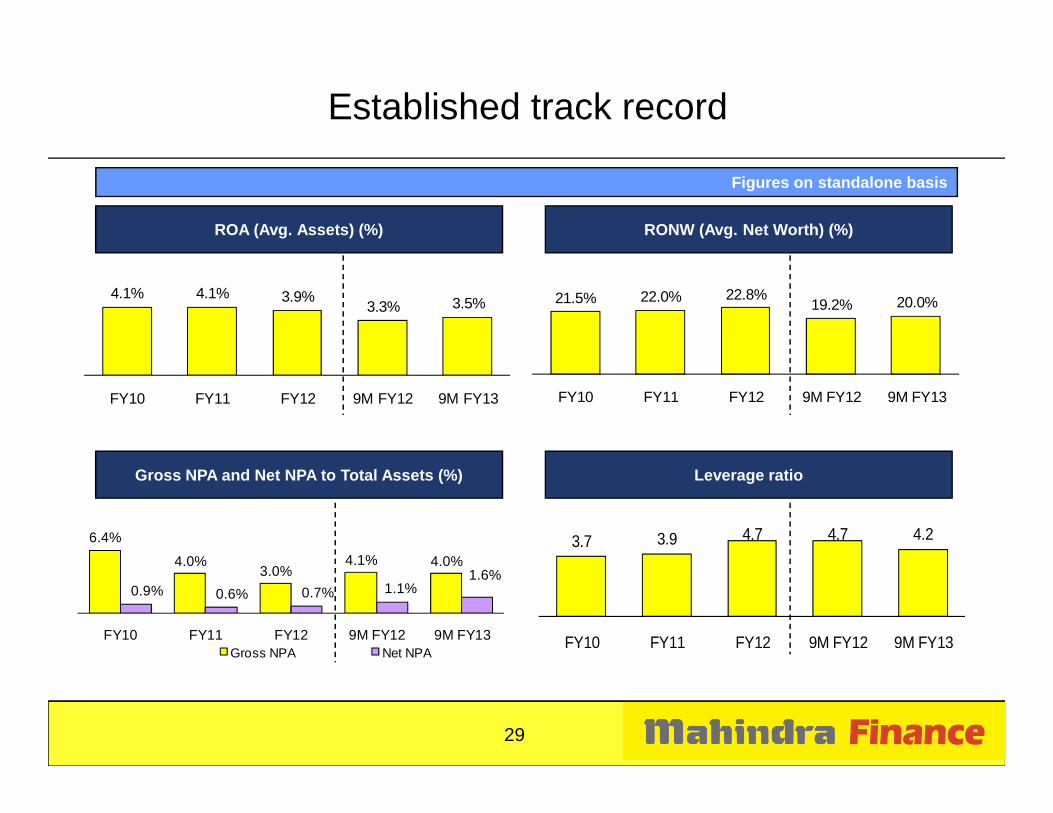
Established track record
ROA (Avg. Assets) (%)
4.1% 4.1% 3.9%3.3% 3.5%
FY10 FY11 FY12 9M FY12 9M FY13
21.5% 22.0% 22.8%19.2% 20.0%
FY10 FY11 FY12 9M FY12 9M FY13
RONW (Avg. Net Worth) (%)
Figures on standalone basis
3.7 3.9 4.7 4.7 4.2
FY10 FY11 FY12 9M FY12 9M FY13
6.4%
4.0%3.0%
4.1% 4.0%
0.9% 0.6% 0.7% 1.1%1.6%
FY10 FY11 FY12 9M FY12 9M FY13Gross NPA Net NPA
Leverage ratioGross NPA and Net NPA to Total Assets (%)
29

Summary of Results
Particulars (Rs. million)Nine Months ended
December – 12Nine Months ended
December – 11Year endedMarch – 12
Total Income 27,691 19,476 27,946
Profit before tax 8,162 5,831 9,253
Profit after tax 5,489 3,924 6,201
Dividend (%) -- -- 140
Net Worth 43,486 28,818 29,440
Figures on standalone basis
30
Net Worth 43,486 28,818 29,440
EPS (Basic) 52.59 38.28 60.46
Market Capitalisation 116,039 63,468 69,723
Value of Assets Financed 171,937 141,721 195,043
No. of Branches 639 592 607
New Contracts During the period (Nos) 388,562 346,337 466,416
No. of employees (on rolls) 4,272 4,275 4,258
No. of employees (outsourced from MBSCPL) 6,492 5,185 5,457

Ratio Analysis
Nine Months ended December – 12
Nine Months ended December – 11
Year ended March – 12
PBT/Total Income 29.5% 29.9% 33.1%
PBT/Total Assets 4.5% 4.4% 5.1%
RONW (Avg. Net Worth) 20.0% 19.2% 22.8%
Figures on standalone basis
31
RONW (Avg. Net Worth) 20.0% 19.2% 22.8%
Overheads/Total Assets 2.9% 3.2% 3.2%
Debt / Equity 4.18:1 4.69:1 4.74:1
Capital Adequacy 19.8% 17.5% 18.0%
Tier I 17.3% 14.6% 15.1%
Tier II 2.5% 2.9% 2.9%
Book Value (Rs.) 386.4 280.9 286.7
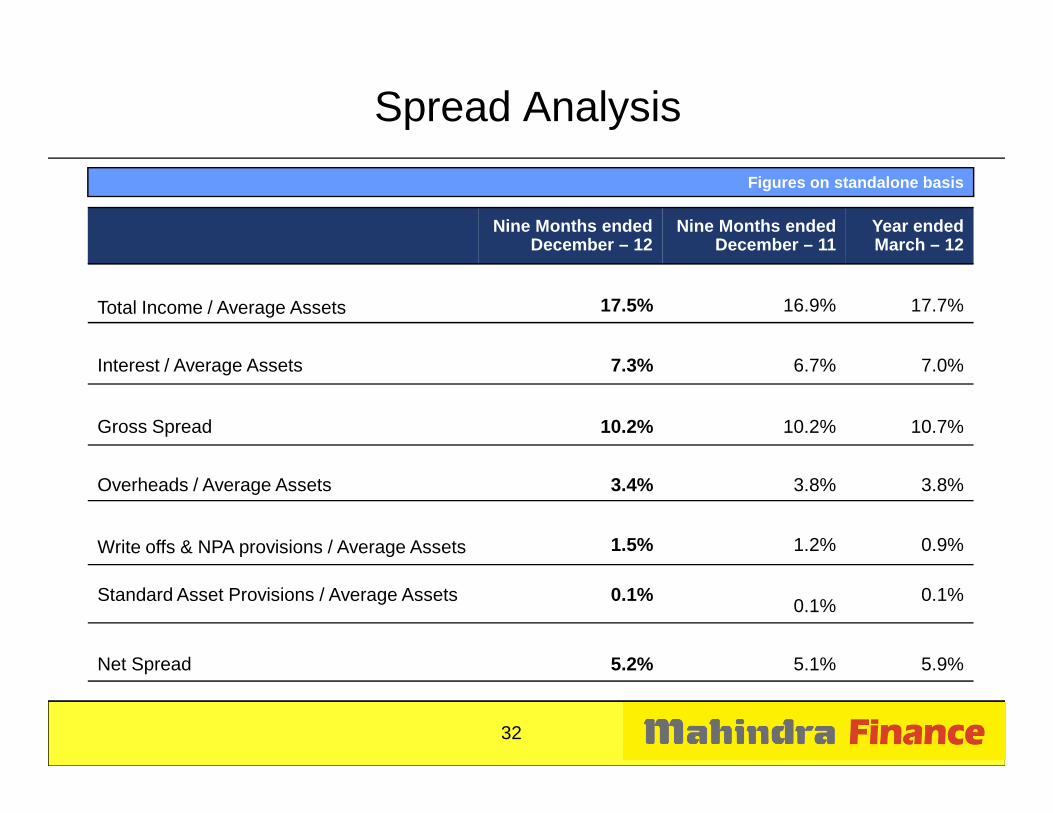
Spread Analysis
Nine Months ended December – 12
Nine Months ended December – 11
Year ended March – 12
Total Income / Average Assets 17.5% 16.9% 17.7%
Interest / Average Assets 7.3% 6.7% 7.0%
Figures on standalone basis
32
Gross Spread 10.2% 10.2% 10.7%
Overheads / Average Assets 3.4% 3.8% 3.8%
Write offs & NPA provisions / Average Assets 1.5% 1.2% 0.9%
Standard Asset Provisions / Average Assets 0.1%0.1%
0.1%
Net Spread 5.2% 5.1% 5.9%

Particulars (Rs. million) December – 12 December – 11 March – 12
Gross Non - Performing Assets 9,893 7,382 5,543
Less: NPA Provisions 6,160* 5,494 4,324
Net Non – Performing Assets 3,742 1,888 1,219
NPA
Figures on standalone basis
33
Net Non – Performing Assets 3,742 1,888 1,219
Total Assets (Incl. NPA Provision) 245,049 181,368 186,633
Gross NPA to Total Assets(%) 4.0% 4.1% 3.0%
Net NPA to Total Assets(%) 1.6% 1.1% 0.7%
Coverage Ratio(%) 62.3% 74.4% 78.0%
Note: Above workings are excluding securitised/assigned portfolio
* NPA Provisions includes additional provisioning made on Two wheeler & Personal Loans

Duration (months) RBI Norms Duration (months) M&MFS L
> 5 and <= 18 10% > 5 and <= 11 10%
> 18 and <= 30 20% > 11 and <= 24 50%
Provisioning Norms
34
> 30 and <= 54 30% > 24 months 100%
> 54 months 50%
At M&MFSL NPA provisioning norms are more stringent than RBInorms
Technology initiatives and Employee management
35
Technology initiatives and Employee management
Technology initiatives
� Approximately 96% of our 639 offices are connected to the centralised data centre in Mumbai
� Through hand held devices connected by GPRS to the central server, we transfer data which provides
– Prompt intimation by SMS to customers
36
– Complete information to handle customer queries with transaction security
– On-line collection of MIS on management’s dashboard
– Recording customer commitments
– Enables better internal checks & controls

� Training programs for employees on continuous basis.
� 5 days induction program on product knowledge, business processes and aptitude training.
� Mahindra Finance Academy for training prospective and present employees at 5 locations.
Employee engagement & training
37
� Assessment & Development Centre for critical employees.
� Employee recognition programs such as – Dhruv Tara, Annual Convention Award and Achievement Box.
� Participation in Mahindra Group’s Talent Management and Retention program.
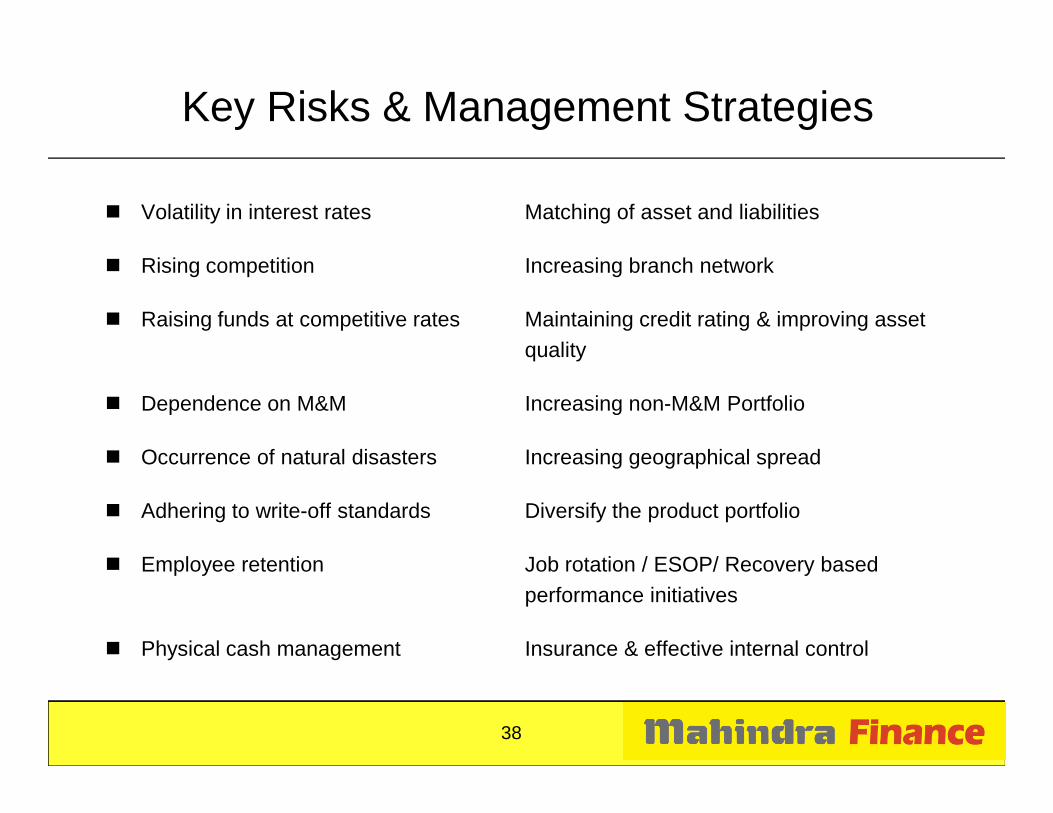
� Volatility in interest rates Matching of asset and liabilities
� Rising competition Increasing branch network
� Raising funds at competitive rates Maintaining credit rating & improving asset quality
� Dependence on M&M Increasing non-M&M Portfolio
Key Risks & Management Strategies
38
� Dependence on M&M Increasing non-M&M Portfolio
� Occurrence of natural disasters Increasing geographical spread
� Adhering to write-off standards Diversify the product portfolio
� Employee retention Job rotation / ESOP/ Recovery based performance initiatives
� Physical cash management Insurance & effective internal control

Regulatory Changes
� RBI finalized its much awaited guidelines on securitization &assignment transaction of standard assets and issued finalguidelines on 07th May 2012
please visit http://www.rbi.org.in/scripts/NotificationUser.aspx?Id=7184&Mode=0
� RBI released revised guidelines on Priority Sector Lending-Targetsand Classification, incorporating recommendations of MV Nairand Classification, incorporating recommendations of MV Naircommittee on 20th July 2012
Please visit http://www.rbi.org.in/scripts/BS_PressReleaseDisplay.aspx?prid=26882
� RBI placed draft guidelines based on Usha Thorat committee reporton the Issues and Concerns in the NBFC Sector on 12th December2012 (final guidelines awaited)
Please visit http://www.rbi.org.in/scripts/BS_PressReleaseDisplay.aspx?prid=27757
39
New Securitisation/ Assignment Guidelines
� As per new guidelines, securitisation route will be preferred overassignment route
� Base rate is not applicable to securitisation deals
� Final guidelines on Priority sector classification based on MV Naircommittee recommendation released on 20th July 2012committee recommendation released on 20 July 2012
- Interest spread cap of 8% is higher than original recommendation of 6%
- No cap on the amount which banks can buy through this route
- Similarly there is no restriction on NBFCs on amount of securitisation/assignment
� Pool buyout interest continues from investors as assets qualifies forPSL
40

Disclaimer
This presentation does not constitute or form part of any offer or invitation or inducement to sell or issue, or any solicitation of any offer topurchase or subscribe for, any securities of Mahindra & Mahindra Financial Services Limited (the “Company”), nor shall it or any part of it or thefact of its distribution form the basis of, or be relied on in connection with, any contract or commitment there for.
This presentation contains statements that constitute forward-looking statements. These statements include descriptions regarding the intent,belief or current expectations of the Company or its directors and officers with respect to the results of operations and financial condition of theCompany. These statements can be recognized by the use of words such as “expects,” “plans,” “will,” “estimates,” “projects,” or other words ofsimilar meaning. Such forward-looking statements are not guarantees of future performance and involve risks and uncertainties, and actualresults may differ from those in such forward-looking statements as a result of various factors and assumptions which the Company believes tobe reasonable in light of its operating experience in recent years. The Company does not undertake to revise any forward-looking statementthat may be made from time to time by or on behalf of the Company.
No representation, warranty, guarantee or undertaking, express or implied, is or will be made as to, and no reliance should be placed on, theaccuracy, completeness or fairness of the information, estimates, projections and opinions contained in this presentation. Potential investorsmust make their own assessment of the relevance, accuracy and adequacy of the information contained in this presentation and must make
41
must make their own assessment of the relevance, accuracy and adequacy of the information contained in this presentation and must makesuch independent investigation as they may consider necessary or appropriate for such purpose. Any opinions expressed in this presentationare subject to change without notice. None of the Company, the placement agents, promoters or any other persons that may participate in theoffering of any securities of the Company shall have any responsibility or liability whatsoever for any loss howsoever arising from thispresentation or its contents or otherwise arising in connection therewith.
This presentation and its contents are confidential and should not be distributed, published or reproduced, in whole or part, or disclosed byrecipients directly or indirectly to any other person. In particular, this presentation is not for publication or distribution or release in the UnitedStates, Australia, Canada or Japan or in any other country where such distribution may lead to a breach of any law or regulatory requirement.The information contained herein does not constitute or form part of an offer or solicitation of an offer to purchase or subscribe for securities forsale in the United States, Australia, Canada or Japan or any other jurisdiction. The securities referred to herein have not been and will not beregistered under the United States Securities Act of 1933, as amended, and may not be offered or sold in the United States or to or for thebenefit of US persons absent registration or an applicable exemption from registration.
CRISIL DISCLAIMER: CRISIL limited has used due care and caution in preparing this report. Information has been obtained by CRISIL fromsources which it considers reliable. However, CRISIL does not guarantee the accuracy, adequacy or completeness of any information and is notresponsible for any errors or omissions or for the results obtained from the use of such information. No part of this report may bepublished/reproduced in any form without CRISIL’s prior written approval. CRISIL is not liable for investment decisions which may be based onthe views expressed in this report. CRISIL Research operates independently of, and does not have access to information obtained by CRISIL’sRating Division, which may, in its regular operations, obtain information of a confidential nature that is not available to CRISIL Research.

Thank you Thank you
42