Mahindra & Mahindra Financial Services Limited
45
Mahindra & Mahindra Financial Services Limited Quarter Result Update June - 2016 Regd. Office: Gateway Building, Apollo Bunder, Mumbai 400 001 India Tel: +91 22 2289 5500 Fax: +91 22 2287 5485 www.mahindrafinance.com CIN - L65921MH1991PLC059642 1 Corporate Office: Mahindra Towers, 4 th Floor, Dr. G. M. Bhosale Marg, Worli, Mumbai 400 018 India Tel: +91 22 66526000 Fax: +91 22 24953608 Email: [email protected]
Transcript of Mahindra & Mahindra Financial Services Limited

Mahindra & Mahindra Financial
Services Limited
Quarter Result Update
June - 2016
Regd. Office: Gateway Building, Apollo Bunder, Mumbai 400 001 India Tel: +91 22 2289 5500 Fax: +91 22 2287 5485 www.mahindrafinance.com CIN - L65921MH1991PLC059642
1
Corporate Office: Mahindra Towers, 4th Floor, Dr. G. M. Bhosale Marg, Worli, Mumbai 400 018 India Tel: +91 22 66526000 Fax: +91 22 24953608 Email: [email protected]
2 2
Transforming rural lives across the country
Company Overview
Industry Overview
Business Strategy
Financial Information
Key Subsidiaries
Awards & Accolades
Risk Management Policies
3 3
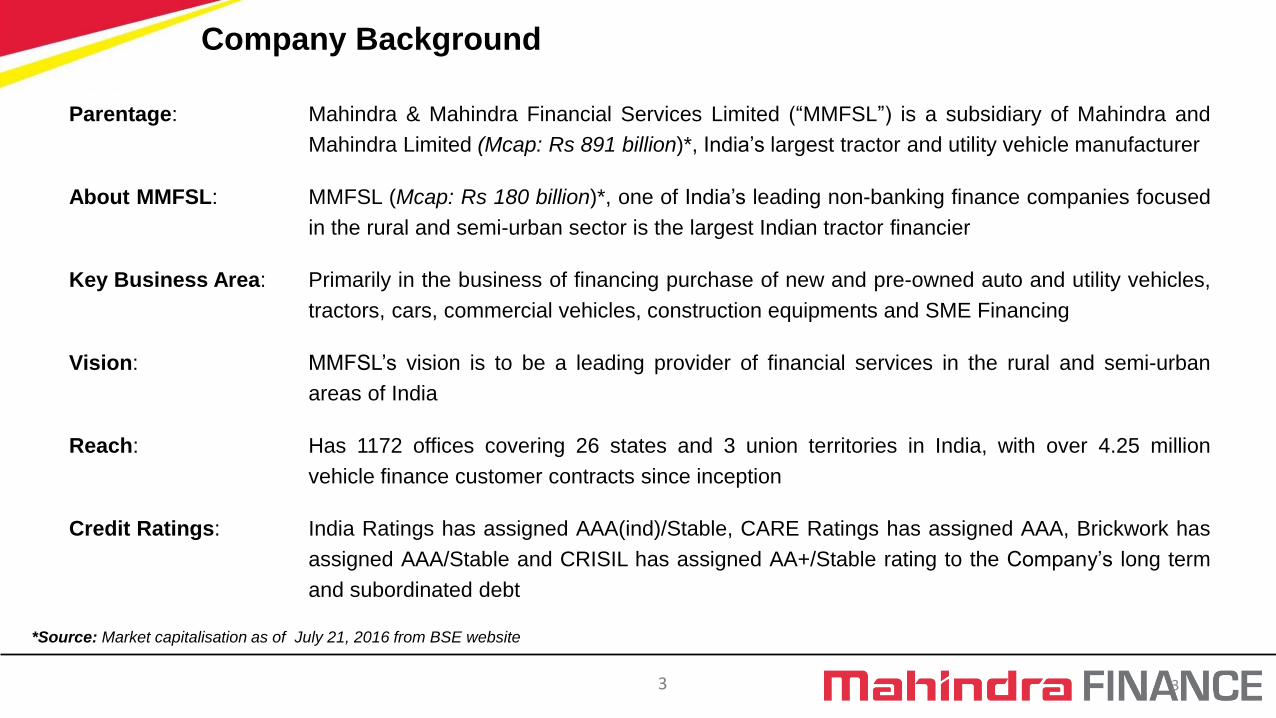
Company Background
Parentage: Mahindra & Mahindra Financial Services Limited (“MMFSL”) is a subsidiary of Mahindra and
Mahindra Limited (Mcap: Rs 891 billion)*, India‟s largest tractor and utility vehicle manufacturer
About MMFSL: MMFSL (Mcap: Rs 180 billion)*, one of India‟s leading non-banking finance companies focused
in the rural and semi-urban sector is the largest Indian tractor financier
Key Business Area: Primarily in the business of financing purchase of new and pre-owned auto and utility vehicles,
tractors, cars, commercial vehicles, construction equipments and SME Financing
Vision: MMFSL‟s vision is to be a leading provider of financial services in the rural and semi-urban
areas of India
Reach: Has 1172 offices covering 26 states and 3 union territories in India, with over 4.25 million
vehicle finance customer contracts since inception
Credit Ratings: India Ratings has assigned AAA(ind)/Stable, CARE Ratings has assigned AAA, Brickwork has
assigned AAA/Stable and CRISIL has assigned AA+/Stable rating to the Company‟s long term
and subordinated debt
*Source: Market capitalisation as of July 21, 2016 from BSE website

4 4
MMFSL Group structure
85%(1)
87.5%(2)
100%
51.20%
49%
Mahindra Insurance Brokers Limited (“MIBL”)
Mahindra Rural Housing Finance Limited
(“MRHFL”)
Mahindra Finance USA LLC
(Joint venture with Rabobank group subsidiary)
Mahindra & Mahindra
Financial Services Limited Mahindra Asset Management Company Pvt.
Ltd
100%
Mahindra Trustee Company Pvt. Ltd
Mahindra & Mahindra Limited
Note:
1. Balance 15% with Inclusion Resources Pvt. Ltd.,a subsidiary of Leapfrog Financial Inclusion Fund, incorporated in Singapore.
2. Balance 12.5% with National Housing Bank (NHB)

5 5
Our Journey
FY 06 FY 16 FY 15 FY 13 FY 11 FY 09 FY 08
IPO Over-Subscribed ~
27 times
Commenced housing finance
business through MRHFL
Raised Rs. 4.14 bn. through
Private Equity
Equity participation of
12.5%by NHB in MRHFL
Recommenced Fixed
Deposit Program
Maiden QIP Issue of Rs.4.26 bn.
JV with Rabobank subsidiary
for tractor financing in USA
Stake sale in MIBL to
Inclusion Resources
Pvt. Ltd.
QIP Issue of Rs. 8.67 bn.
Long term debt rating
upgraded to AAA by
India Ratings and
Brickwork.
CARE Ratings assigned
AAA rating to long term
debt
Reach extended to over
1100 offices
Crossed 4 million
cumulative customer
contracts
Certificate of
Registration received
from SEBI by Mahindra
Mutual Fund
FY 10
Crossed 1 million
cumulative customer
contracts
FY 17
Maiden Retail NCD issue
of Rs. 1000 crores.
Oversubscribed over 7
times over base issue
size of Rs. 250 crores

6 6
Shareholding Pattern (as on 30th June 2016)
Top 10 Public Shareholders
Amansa Holdings Private Limited
Aranda Investments (Mauritius) Pte Ltd
Franklin Templeton Investment Funds
Life Insurance Corporation Of India
Government Of Singapore
Bank Muscat S A O G A/C Bankmuscat India Fund
Stichting Depositary Apg Emerging Markets Equity
UTI - Mid Cap Fund
Morgan Stanley Mauritius Company Limited
Vanguard Emerging Markets Stock Index Fund, Aserie
Shareholding Pattern Chart
51.9%
33.6%
9.7%
4.8%
Promoters* FIIs
Mutual Funds and DIIs Non Institutions
* Mahindra & Mahindra Limited holds a stake of 51.2% in the Company. ESOP trust holds the balance 0.7%

7 7
Transforming rural lives across the country
Company Overview
Industry Overview
Business Strategy
Financial Information
Key Subsidiaries
Awards & Accolades
Risk Management Policies

8
Auto Industry: Long term growth potential
With 17 cars per 1000 people, India has strong long term growth prospects
Growth to be driven by increase in income of households and higher passenger vehicle penetration, rising rural penetration to
increase small car sales
Source: *CRISIL Research Note : (1) All numbers except India are for CY 2012. India's figures are for 2013-14.
17 39
93
147 196
270 294
385
476 500
526
588
Ind
ia
Ch
ina
Th
aila
nd
Bra
zil
Me
xic
o
Ru
ss
ia
S. K
ore
a
US
A
Jap
an
UK
Ge
rma
ny
Ita
ly
Global Comparison in terms of PV per thousand people (1) Addressable HHs to increase over the next 5 years
238 267
285
31
71
115
12 23
37
0
50
100
150
200
250
300
2009-10 E 2014-15 E 2019-20 P
Total HHs (mn) Addressable HHs (mn) Total PV Population (mn)
2015-16 E

9
Passenger Vehicles Industry: Overall Demand Drivers
Source: CRISIL Research, Cars & UV – June 2016
Small Cars to drive growth in the long term due
to higher aspiration levels led by economy
recovery and lower cost of ownership
FY 06 – FY11 FY 11 – FY 16 FY 16 – FY 20
Small Cars 14% 2% 11% - 13%
Sedans 10% -9% 8% - 10%
UV + Vans 12% 5% 12% - 14%
Total (Cars + UVs) 13% 1% 11% - 13%
FY 2015 FY 2016 FY 2017 (E)
Volume Growth Volume Growth Growth
Small Cars 1,854,882 5% 2,008,010 8% 9% - 10%
Sedans 22,279 5% 17,429 -22% 5% - 7%
UV + Vans 722,848 1% 764,208 6% 9% - 11%
Total (Cars + UVs) 2,600,009 4% 2,789,969 7% 8% - 10%
Low single digit growth expected in larger vehicles - Impact of infrastructure cess and ban on diesel vehicles (over 2000 cc) in Delhi
Implementation of 7th pay commission to support sale of small cars

10
Commercial Vehicles Industry: Overall Demand Drivers
Source: CRISIL Research, Cars & UV – April 2016
FY 11 – FY 16 FY 16 – FY 20
LCV (goods) 6% 11% - 14%
MHCV (goods) 0% 10% - 12%
Buses 1% 8% - 10%
Total (CV) 3% 10% - 13%
FY 2015 FY 2016 FY 2017 (E)
Volume Growth Volume Growth Growth
HCV 231,838 16% 302,373 30% 16% - 18%
LCV 382,265 -12% 383,331 0.3% 7% - 9%
Total (CV) 614,103 -3% 685,704 12% 10% - 12%
MHCV goods vehicle sales supported by growth in economic activity,
export-import and freight traffic, construction activities etc.
Demand for LCVs fuelled by increase of hub-and-spoke model,
growth of organised retail, rising consumption expenditure and
improvement in rural road infrastructure
Rate of growth in CV vehicles has seen some slowdown.
LCV industry poised to see improved growth in FY 17 after 2 consecutive years of negative/ poor growth

11
Tractors Industry: Overall Demand Drivers
Source: Tractor Industry: CRISIL Research, April 2016; Rainfall Statistics: IMD (as of 19th July 2016)
Industry - Tractors FY 2015 FY 2016 FY 2017 (E) FY 16 – FY 20 (P)
Volume Growth Volume Growth Growth Growth
Tractors 551,463 -13% 493,764 -11% 10% - 12% 8% - 10%
Accumulated Rainfall Period: 01-06-2016 - 19-07-2016
MET Regions (Sub-divisions) Actual (mm) Normal (mm) % Dep.
East & North East (7) 520 627 -17%
North West (9) 214 196 10%
Central India (10) 411 360 14%
South Peninsula (10) 302 291 4%
India (36) 346 338 2%
Tractor Financing Market has improved significantly on the back of expectation of good monsoon and improvement of farmers sentiment
Strong growth of upwards of 10% expected in the
current year, after 2 years of below – average
rainfall
East & North-East is still below their normal rainfall
levels.
Out of the total of 36 sub-divisions, no sub-division
is suffering from scanty or no-rainfall (6 sub-
divisions still has deficient rainfall).
12
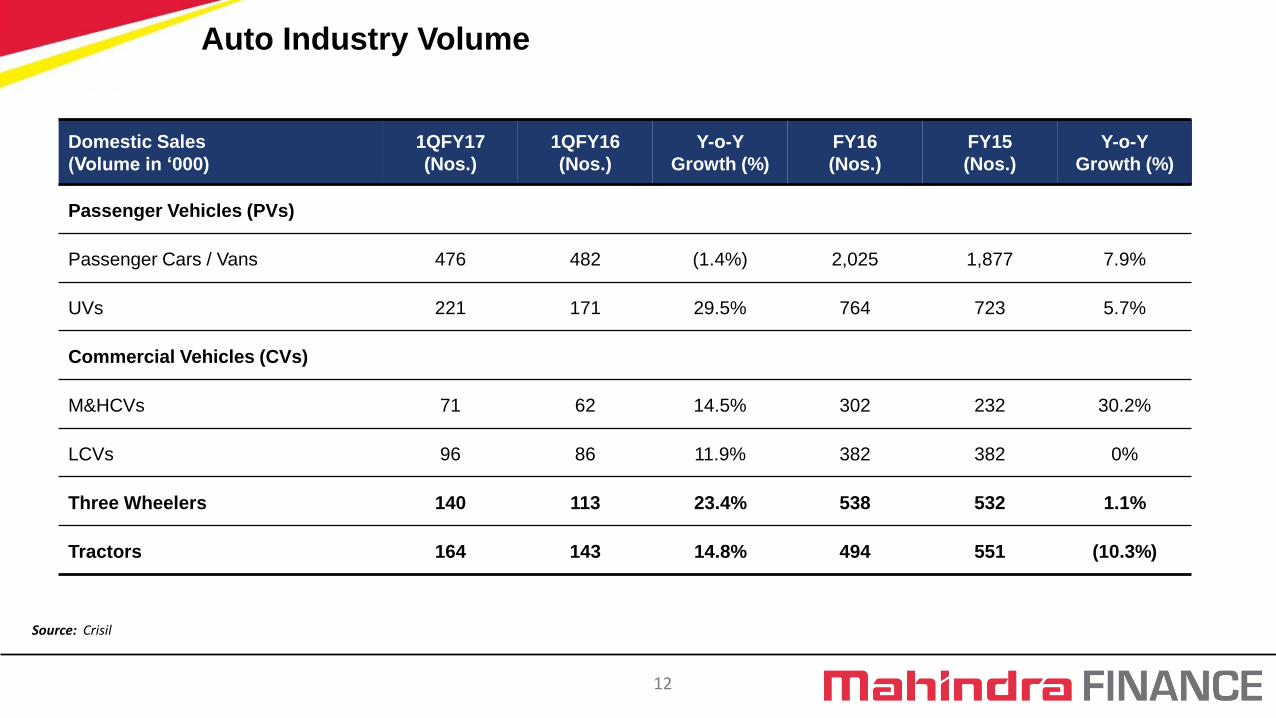
Source: Crisil
Domestic Sales
(Volume in „000)
1QFY17
(Nos.)
1QFY16
(Nos.)
Y-o-Y
Growth (%)
FY16
(Nos.)
FY15
(Nos.)
Y-o-Y
Growth (%)
Passenger Vehicles (PVs)
Passenger Cars / Vans 476 482 (1.4%) 2,025 1,877 7.9%
UVs 221 171 29.5% 764 723 5.7%
Commercial Vehicles (CVs)
M&HCVs 71 62 14.5% 302 232 30.2%
LCVs 96 86 11.9% 382 382 0%
Three Wheelers 140 113 23.4% 538 532 1.1%
Tractors 164 143 14.8% 494 551 (10.3%)
Auto Industry Volume
13
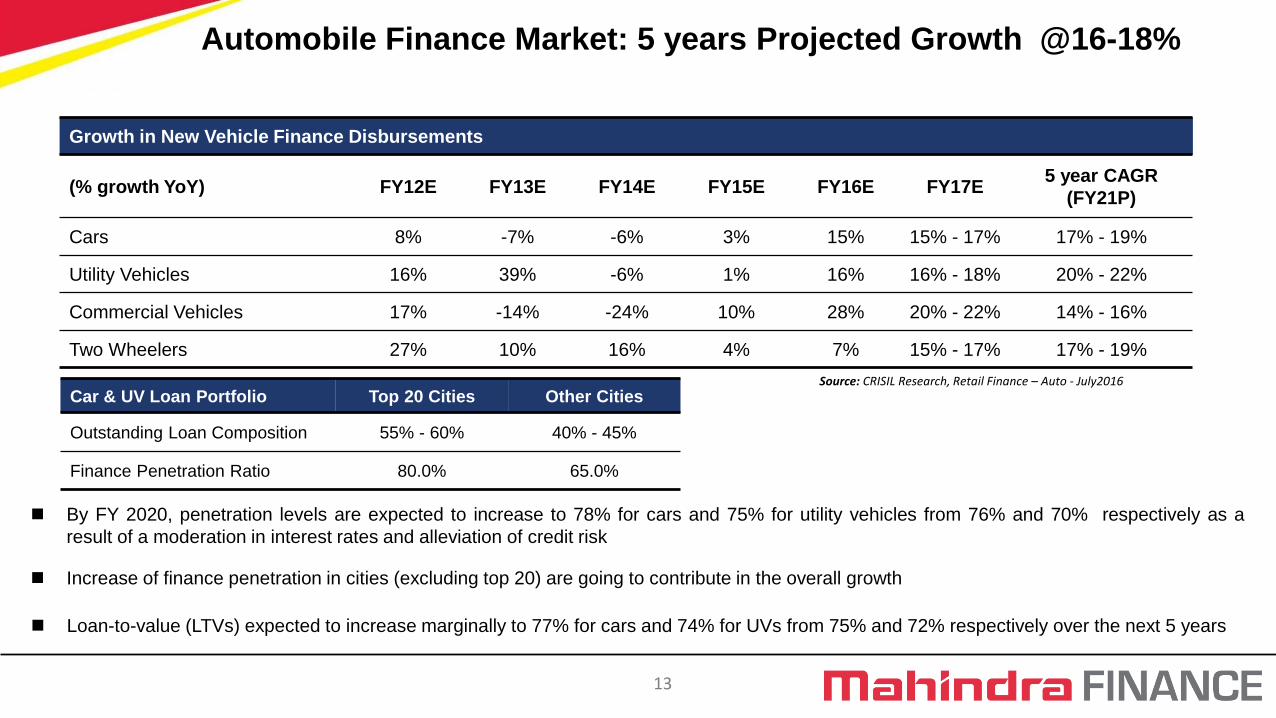
By FY 2020, penetration levels are expected to increase to 78% for cars and 75% for utility vehicles from 76% and 70% respectively as a
result of a moderation in interest rates and alleviation of credit risk
Increase of finance penetration in cities (excluding top 20) are going to contribute in the overall growth
Loan-to-value (LTVs) expected to increase marginally to 77% for cars and 74% for UVs from 75% and 72% respectively over the next 5 years
Source: CRISIL Research, Retail Finance – Auto - July2016
Automobile Finance Market: 5 years Projected Growth @16-18%
Growth in New Vehicle Finance Disbursements
(% growth YoY) FY12E FY13E FY14E FY15E FY16E FY17E 5 year CAGR
(FY21P)
Cars 8% -7% -6% 3% 15% 15% - 17% 17% - 19%
Utility Vehicles 16% 39% -6% 1% 16% 16% - 18% 20% - 22%
Commercial Vehicles 17% -14% -24% 10% 28% 20% - 22% 14% - 16%
Two Wheelers 27% 10% 16% 4% 7% 15% - 17% 17% - 19%
Car & UV Loan Portfolio Top 20 Cities Other Cities
Outstanding Loan Composition 55% - 60% 40% - 45%
Finance Penetration Ratio 80.0% 65.0%
14
9%
18% 20%
32% 36%
40% 45% 45%
56% 62%
81%
94%
0%
10%
20%
30%
40%
50%
60%
70%
80%
90%
100%
Ind
ia
Ch
ina
Thai
lan
d
Mal
asyi
a
Ko
rea
Taiw
an
Ho
ng
Ko
ng
Ger
man
y
Sin
gap
ore
USA U
K
Den
mar
k
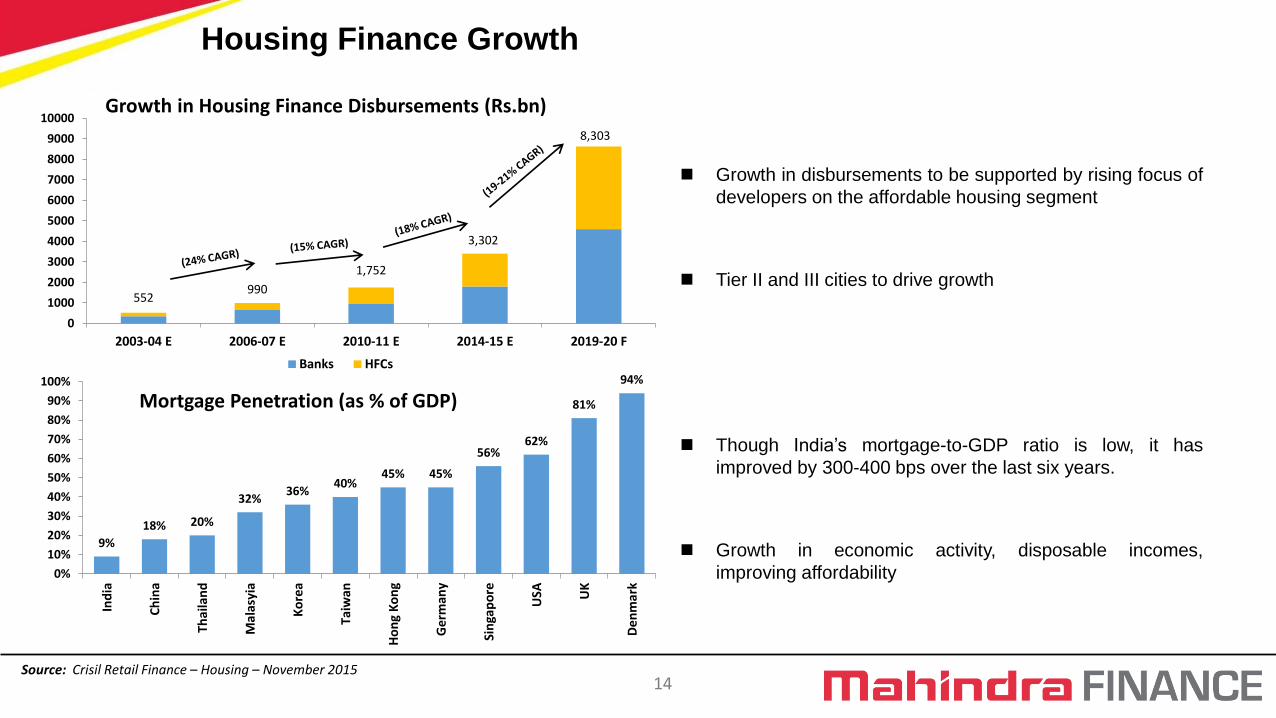
552 990
1,752
3,302
8,303
0
1000
2000
3000
4000
5000
6000
7000
8000
9000
10000
2003-04 E 2006-07 E 2010-11 E 2014-15 E 2019-20 F
Banks HFCs
Source: Crisil Retail Finance – Housing – November 2015
Growth in Housing Finance Disbursements (Rs.bn)
Mortgage Penetration (as % of GDP)
Growth in disbursements to be supported by rising focus of
developers on the affordable housing segment
Tier II and III cities to drive growth
Though India‟s mortgage-to-GDP ratio is low, it has
improved by 300-400 bps over the last six years.
Growth in economic activity, disposable incomes,
improving affordability
Housing Finance Growth

15 15
Transforming rural lives across the country
Company Overview
Industry Overview
Business Strategy
Financial Information
Key Subsidiaries
Awards & Accolades
Risk Management Policies
16
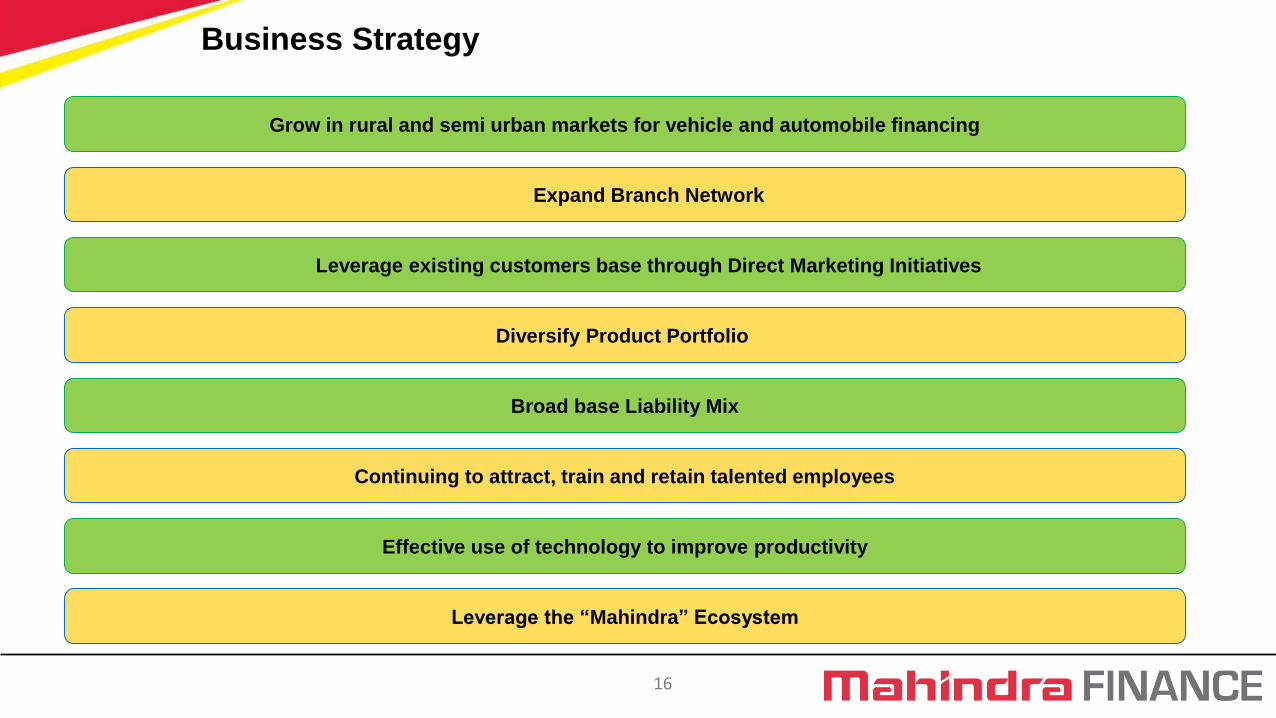
Business Strategy
Grow in rural and semi urban markets for vehicle and automobile financing
Diversify Product Portfolio
Continuing to attract, train and retain talented employees
Effective use of technology to improve productivity
Broad base Liability Mix
Leverage the “Mahindra” Ecosystem
Leverage existing customers base through Direct Marketing Initiatives
Expand Branch Network
17
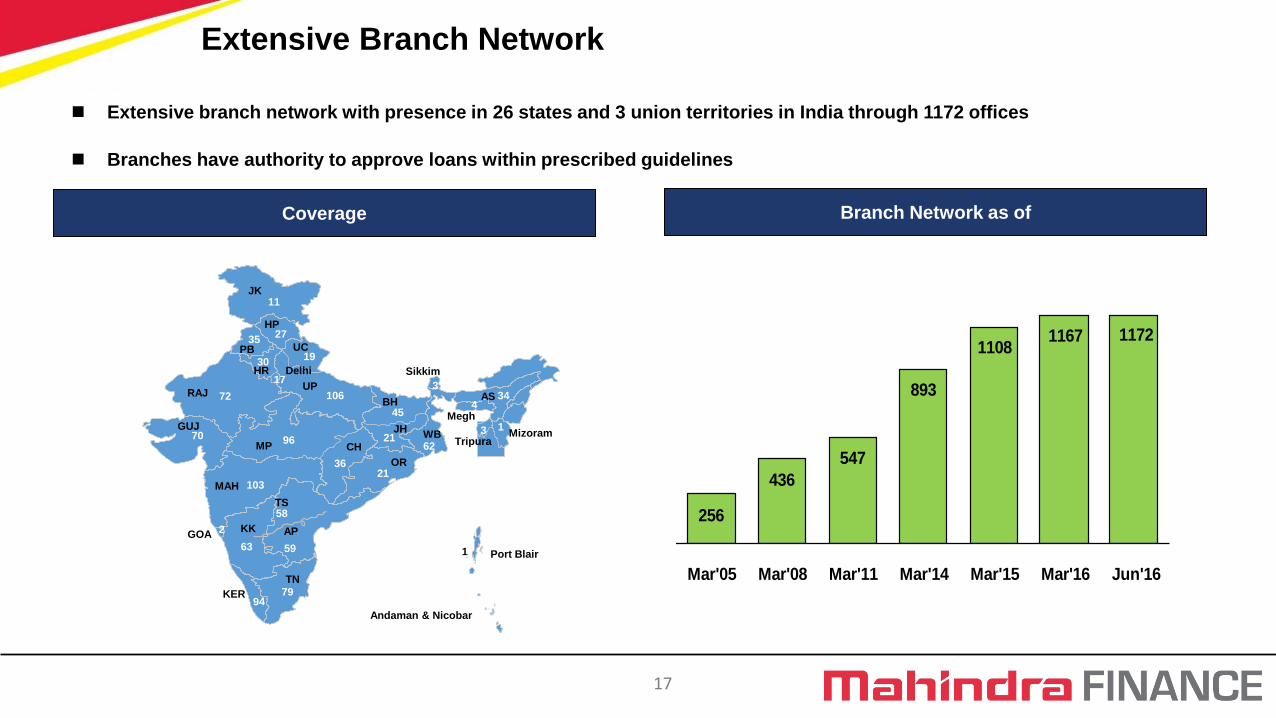
Extensive branch network with presence in 26 states and 3 union territories in India through 1172 offices
Branches have authority to approve loans within prescribed guidelines
Coverage Branch Network as of
1
11
35 27
19 30
17
106 72
96 70
103
36
59 63
2
94 79
21
21
45
3
62
4
3
34
JK
PB
HP
UC
HR Delhi
UP RAJ
GUJ
MAH
MP CH
GOA KK
KER
TN
Port Blair
Andaman & Nicobar
AP
OR
JH
BH
WB
AS
Sikkim
Megh
Tripura Mizoram
1
58 TS
256
436
547
893
11081167 1172
Mar'05 Mar'08 Mar'11 Mar'14 Mar'15 Mar'16 Jun'16
Extensive Branch Network

18
Loans for auto and utility vehicles, tractors, cars, commercial vehicles and construction
equipments Vehicle Financing
Pre-Owned Vehicles
Mutual Fund Distribution
Loans for pre-owned cars, multi-utility vehicles, tractors and commercial vehicles
Advises clients on investing money through AMFI certified professionals under the brand
“MAHINDRA FINANCE FINSMART”
SME Financing Loans for varied purposes like project finance, equipment finance and working capital
finance
Personal Loans Offers personal loans typically for weddings, children‟s education, medical treatment and
working capital
Insurance Broking
Housing Finance
Insurance solutions to retail customers as well as corporations through our subsidiary
MIBL
Loans for buying, renovating, extending and improving homes in rural and semi-urban
India through our subsidiary MRHFL
Diversified Product Portfolio
Mutual Fund & AMC Asset Management Company/ Investment Manager to „Mahindra Mutual Fund‟, which
received certificate of registration from SEBI

19
Asset Class Quarter ended
June – 16
Quarter ended
June – 15
Year ended
March – 16
Auto/ Utility vehicles 29% 31% 30%
Tractors 17% 16% 15%
Cars 22% 24% 22%
Commercial vehicles and Construction equipments 13% 10% 11%
Pre-owned vehicles 14% 16% 16%
Others* 5% 3% 6%
Break up of estimated value of Assets Financed
* Others include SME assets

20
Asset Class As on
June – 16
As on
June – 15
As on
March – 16
Auto/ Utility vehicles 31% 31% 31%
Tractors 17% 18% 17%
Cars 24% 23% 24%
Commercial vehicles and Construction equipments 13% 13% 12%
Pre-owned vehicles 9% 10% 10%
Others* 6% 5% 6%
1. Approximate percentages 2. As on 30th June 16, ~48% of the AUM was from M&M assets * Others include SME assets
Break up of AUM
21
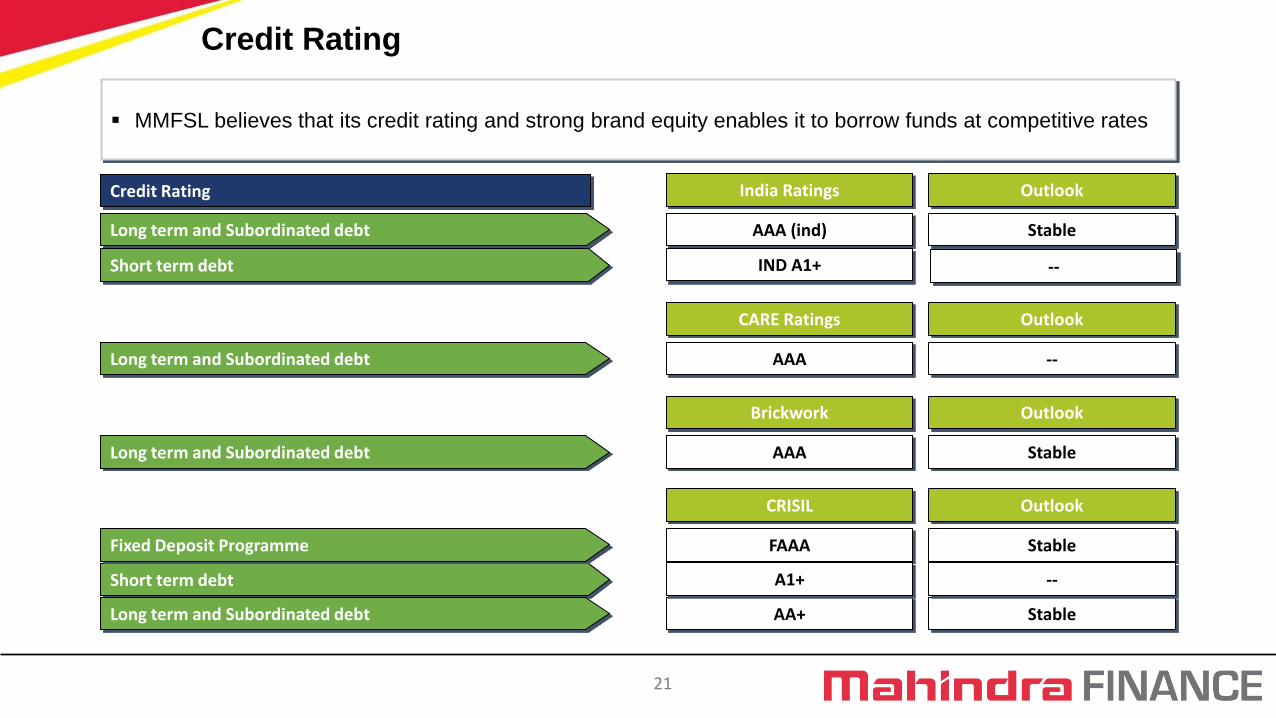
MMFSL believes that its credit rating and strong brand equity enables it to borrow funds at competitive rates
Long term and Subordinated debt
Short term debt
Long term and Subordinated debt
Fixed Deposit Programme
Long term and Subordinated debt
AAA (ind) Stable
India Ratings Outlook
Brickwork Outlook
AAA Stable
FAAA Stable
CRISIL Outlook
AA+ Stable
A1+ --
Credit Rating
Long term and Subordinated debt
CARE Ratings Outlook
AAA --
Short term debt IND A1+ --
Credit Rating
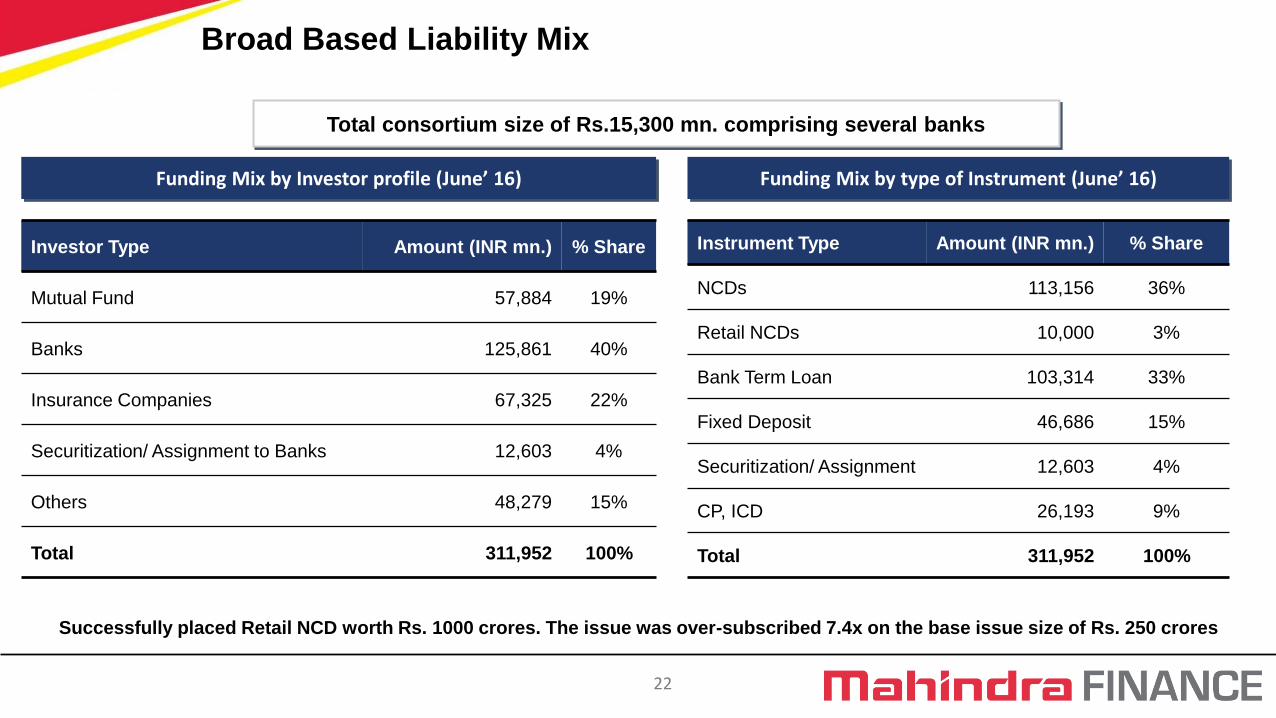
22
Funding Mix by Investor profile (June’ 16) Funding Mix by type of Instrument (June’ 16)
Investor Type Amount (INR mn.) % Share
Mutual Fund 57,884 19%
Banks 125,861 40%
Insurance Companies 67,325 22%
Securitization/ Assignment to Banks 12,603 4%
Others 48,279 15%
Total 311,952 100%
Instrument Type Amount (INR mn.) % Share
NCDs 113,156 36%
Retail NCDs 10,000 3%
Bank Term Loan 103,314 33%
Fixed Deposit 46,686 15%
Securitization/ Assignment 12,603 4%
CP, ICD 26,193 9%
Total 311,952 100%
Broad Based Liability Mix
Successfully placed Retail NCD worth Rs. 1000 crores. The issue was over-subscribed 7.4x on the base issue size of Rs. 250 crores
Total consortium size of Rs.15,300 mn. comprising several banks
23
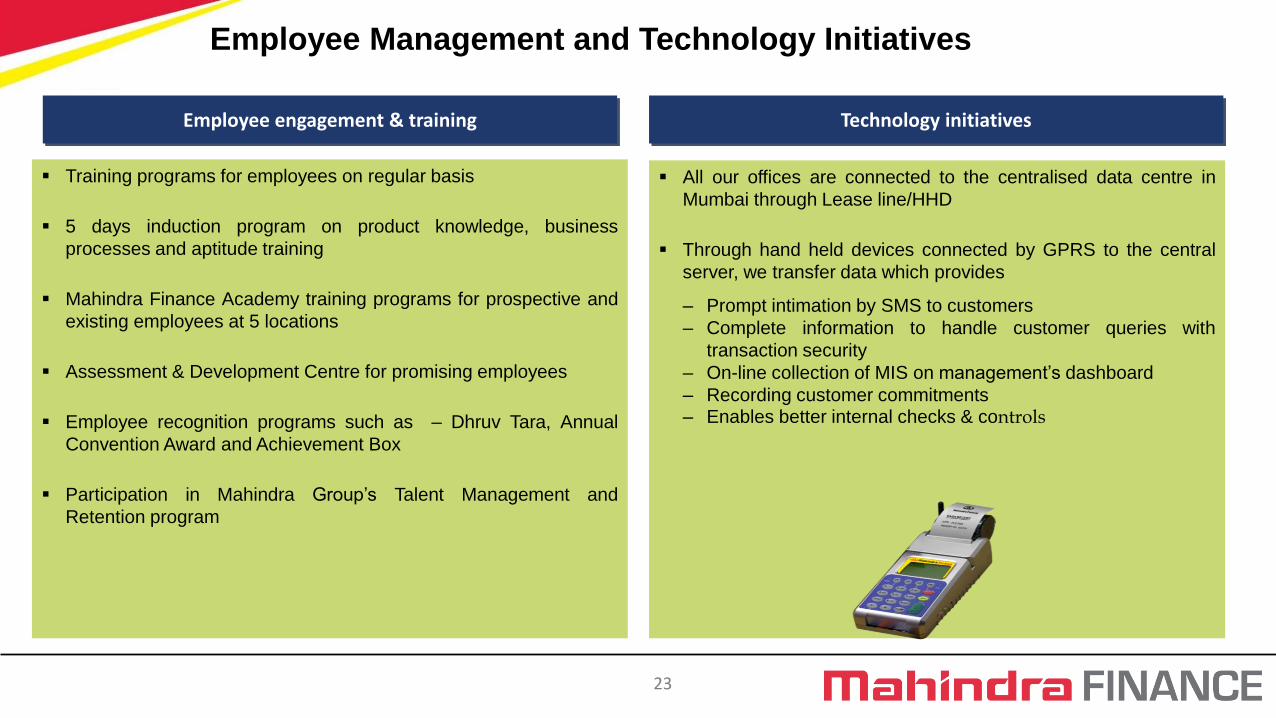
All our offices are connected to the centralised data centre in
Mumbai through Lease line/HHD
Through hand held devices connected by GPRS to the central
server, we transfer data which provides
– Prompt intimation by SMS to customers
– Complete information to handle customer queries with
transaction security
– On-line collection of MIS on management‟s dashboard
– Recording customer commitments – Enables better internal checks & controls
Technology initiatives
Training programs for employees on regular basis
5 days induction program on product knowledge, business
processes and aptitude training
Mahindra Finance Academy training programs for prospective and
existing employees at 5 locations
Assessment & Development Centre for promising employees
Employee recognition programs such as – Dhruv Tara, Annual
Convention Award and Achievement Box
Participation in Mahindra Group‟s Talent Management and
Retention program
Employee engagement & training
Employee Management and Technology Initiatives
24 24
Transforming rural lives across the country
Company Overview
Industry Overview
Business Strategy
Financial Information
Key Subsidiaries
Awards & Accolades
Risk Management Policies

25
Rs 870 mn
Rs 890 mn
2%
Total Income Profit after Tax Value of Asset Financed
Rs 65,639 mn
Rs 60,569 mn
8%
Rs 13,757 mn
Rs 13,684 mn
1%
Key Financials
* Note: The Company is required to recognise NPA based on four months overdue by end of FY 2017, which the Company has been following w.e.f. quarter ended 31st March 2016. This has resulted in
additional provision of Rs. 918 mn in the current quarter (including income de-recognition) as compared to quarter ended June 30, 2015 (NPA recognised on a 5 months basis)
Q1 FY 17
Q1 FY 16
Figures on standalone basis
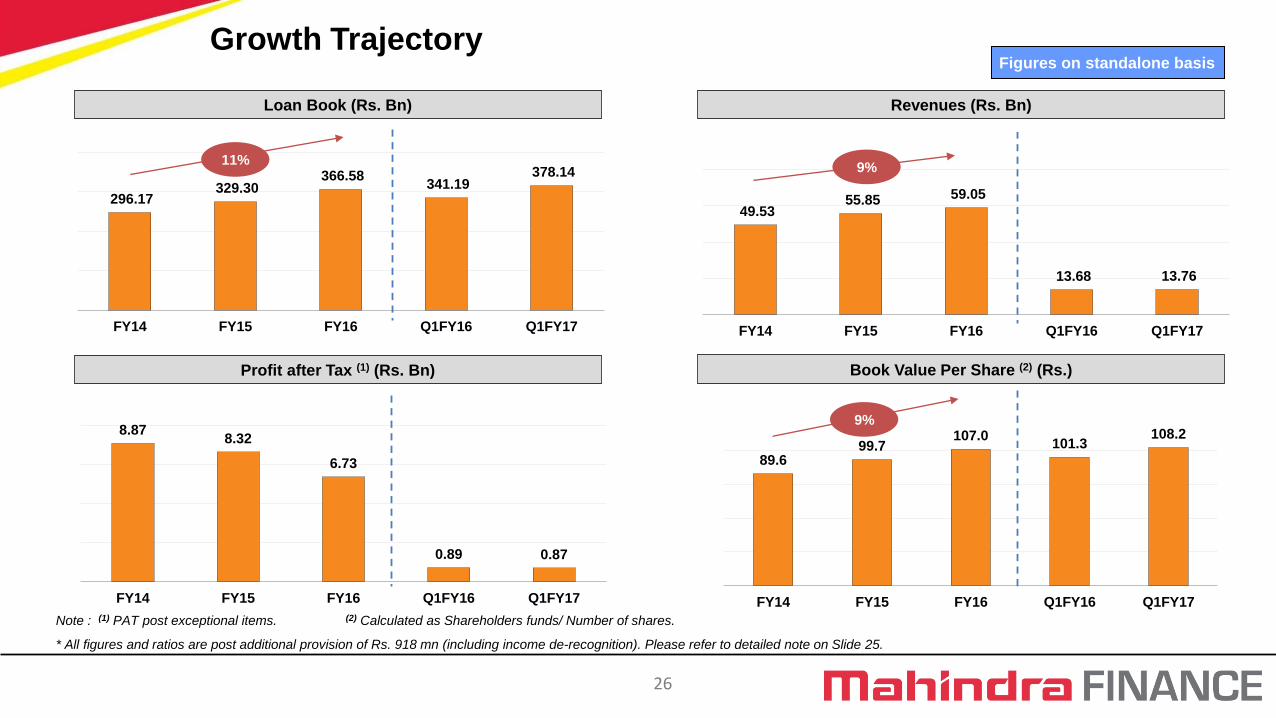
26
49.53 55.85 59.05
13.68 13.76
FY14 FY15 FY16 Q1FY16 Q1FY17
9%
8.87 8.32
6.73
0.89 0.87
FY14 FY15 FY16 Q1FY16 Q1FY17
89.6 99.7
107.0 101.3
108.2
FY14 FY15 FY16 Q1FY16 Q1FY17
9%
Note : (1) PAT post exceptional items. (2) Calculated as Shareholders funds/ Number of shares.
* All figures and ratios are post additional provision of Rs. 918 mn (including income de-recognition). Please refer to detailed note on Slide 25.
296.17 329.30
366.58 341.19
378.14
FY14 FY15 FY16 Q1FY16 Q1FY17
11%
Growth Trajectory Figures on standalone basis
Loan Book (Rs. Bn) Revenues (Rs. Bn)
Book Value Per Share (2) (Rs.) Profit after Tax (1) (Rs. Bn)

27
Note : (1) Cost to Income calculated as Operating Expenses (including depreciation)/(Net Interest Income + Other Income). (2) Calculated based on average total assets
* All figures and ratios are post additional provision of Rs. 918 mn (including income de-recognition). Please refer to detailed note on Slide 25.
Financial Performance Figures on standalone basis
Cost to income ratio (1) (%) Return on Assets (ROA) (2) (%)
33.0% 32.6%
36.1% 36.4%
47.6%
FY14 FY15 FY16 Q1FY16 Q1FY17
Return on Net Worth (RONW) (*) (%)
3.2%
2.5%
1.8%
1.0% 0.9%
FY14 FY15 FY16 Q1FY16 Q1FY17
4.4%
5.9%
8.0% 8.0%
10.7%
1.9% 2.4% 3.2% 3.6%
5.4%
FY14 FY15 FY16 Q1FY16 Q1FY17
Gross NPA Net NPA
Asset Quality
18.6%
15.5%
11.4%
6.2% 5.7%
FY14 FY15 FY16 Q1FY16 Q1FY17 59.0% 61.0% 61.7% 56.6% Provision
Coverage Ratio 52.3%
28
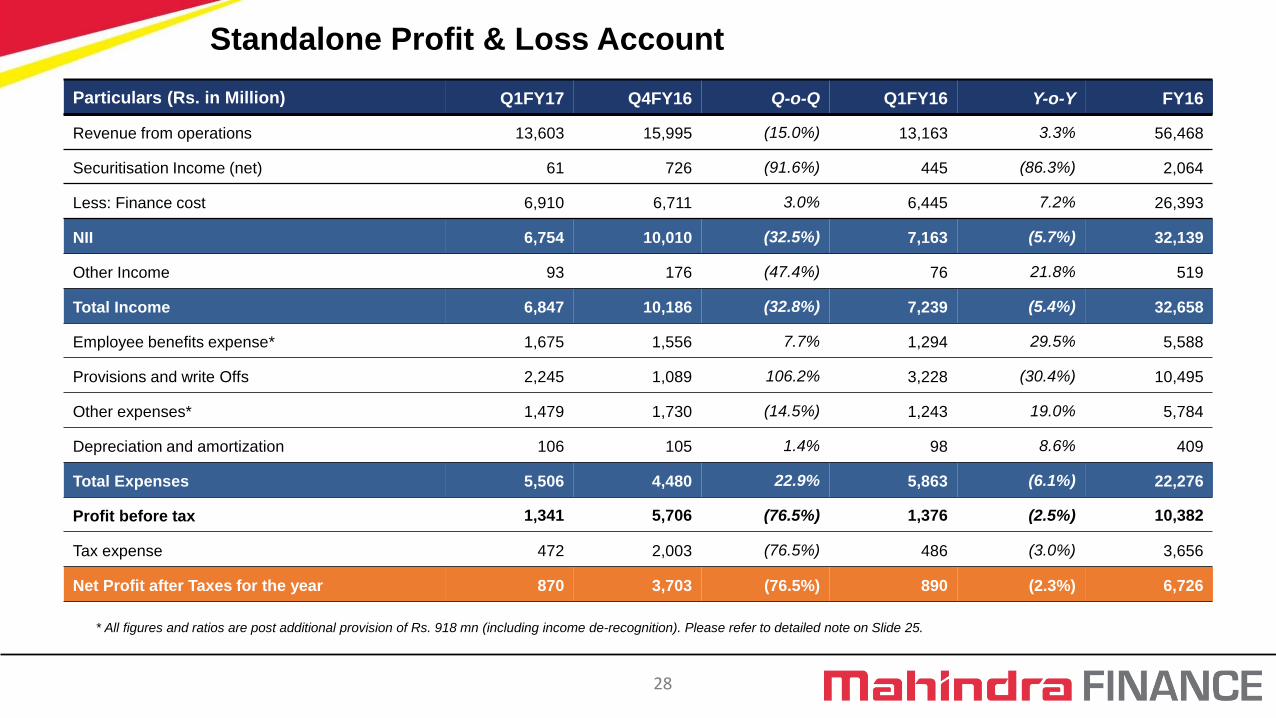
Particulars (Rs. in Million) Q1FY17 Q4FY16 Q-o-Q Q1FY16 Y-o-Y FY16
Revenue from operations 13,603 15,995 (15.0%) 13,163 3.3% 56,468
Securitisation Income (net) 61 726 (91.6%) 445 (86.3%) 2,064
Less: Finance cost 6,910 6,711 3.0% 6,445 7.2% 26,393
NII 6,754 10,010 (32.5%) 7,163 (5.7%) 32,139
Other Income 93 176 (47.4%) 76 21.8% 519
Total Income 6,847 10,186 (32.8%) 7,239 (5.4%) 32,658
Employee benefits expense* 1,675 1,556 7.7% 1,294 29.5% 5,588
Provisions and write Offs 2,245 1,089 106.2% 3,228 (30.4%) 10,495
Other expenses* 1,479 1,730 (14.5%) 1,243 19.0% 5,784
Depreciation and amortization 106 105 1.4% 98 8.6% 409
Total Expenses 5,506 4,480 22.9% 5,863 (6.1%) 22,276
Profit before tax 1,341 5,706 (76.5%) 1,376 (2.5%) 10,382
Tax expense 472 2,003 (76.5%) 486 (3.0%) 3,656
Net Profit after Taxes for the year 870 3,703 (76.5%) 890 (2.3%) 6,726
Standalone Profit & Loss Account
* All figures and ratios are post additional provision of Rs. 918 mn (including income de-recognition). Please refer to detailed note on Slide 25.
29
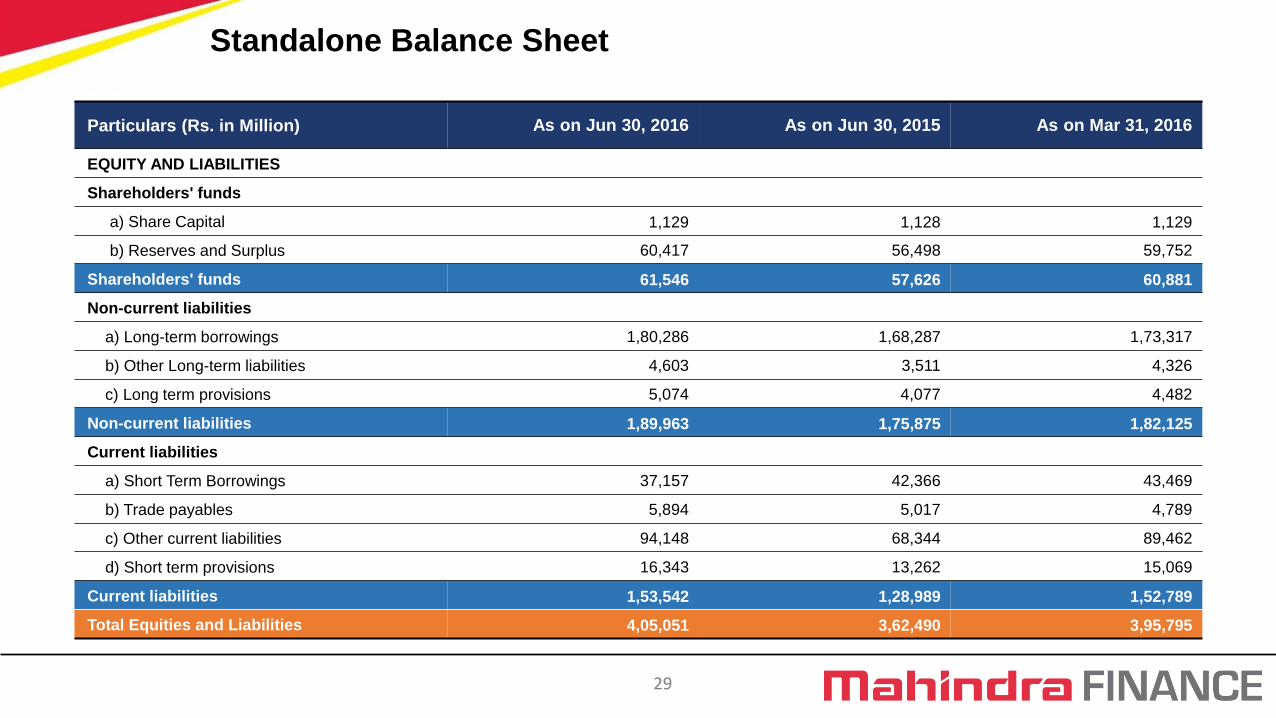
Particulars (Rs. in Million) As on Jun 30, 2016 As on Jun 30, 2015 As on Mar 31, 2016
EQUITY AND LIABILITIES
Shareholders' funds
a) Share Capital 1,129 1,128 1,129
b) Reserves and Surplus 60,417 56,498 59,752
Shareholders' funds 61,546 57,626 60,881
Non-current liabilities
a) Long-term borrowings 1,80,286 1,68,287 1,73,317
b) Other Long-term liabilities 4,603 3,511 4,326
c) Long term provisions 5,074 4,077 4,482
Non-current liabilities 1,89,963 1,75,875 1,82,125
Current liabilities
a) Short Term Borrowings 37,157 42,366 43,469
b) Trade payables 5,894 5,017 4,789
c) Other current liabilities 94,148 68,344 89,462
d) Short term provisions 16,343 13,262 15,069
Current liabilities 1,53,542 1,28,989 1,52,789
Total Equities and Liabilities 4,05,051 3,62,490 3,95,795
Standalone Balance Sheet

30
Particulars (Rs. in Million) As on Jun 30, 2016 As on Jun 30, 2015 As on Mar 31, 2016
ASSETS
Non-current assets
a) Fixed Assets 1,161 1,106 1,135
b) Non-current investments 9,916 7,914 9,923
c) Deferred tax assets (Net) 6,133 4,280 5,853
d) Long-term loans and advances 1,86,384 1,71,388 1,84,172
e) Other non-current assets 547 2,848 518
Non-current assets 2,04,141 1,87,536 2,01,601
Current assets
a) Current investments 2,612 937 4,910
b) Trade receivables 49 49 51
c) Cash and cash equivalents 5,475 3,748 5,890
d) Short-term loans and advances 1,91,752 1,69,805 1,82,406
e) Other current assets 1,022 415 937
Current assets 2,00,910 1,74,954 1,94,194
Total Assets 4,05,051 3,62,490 3,95,795
Standalone Balance Sheet (Contd.)
31
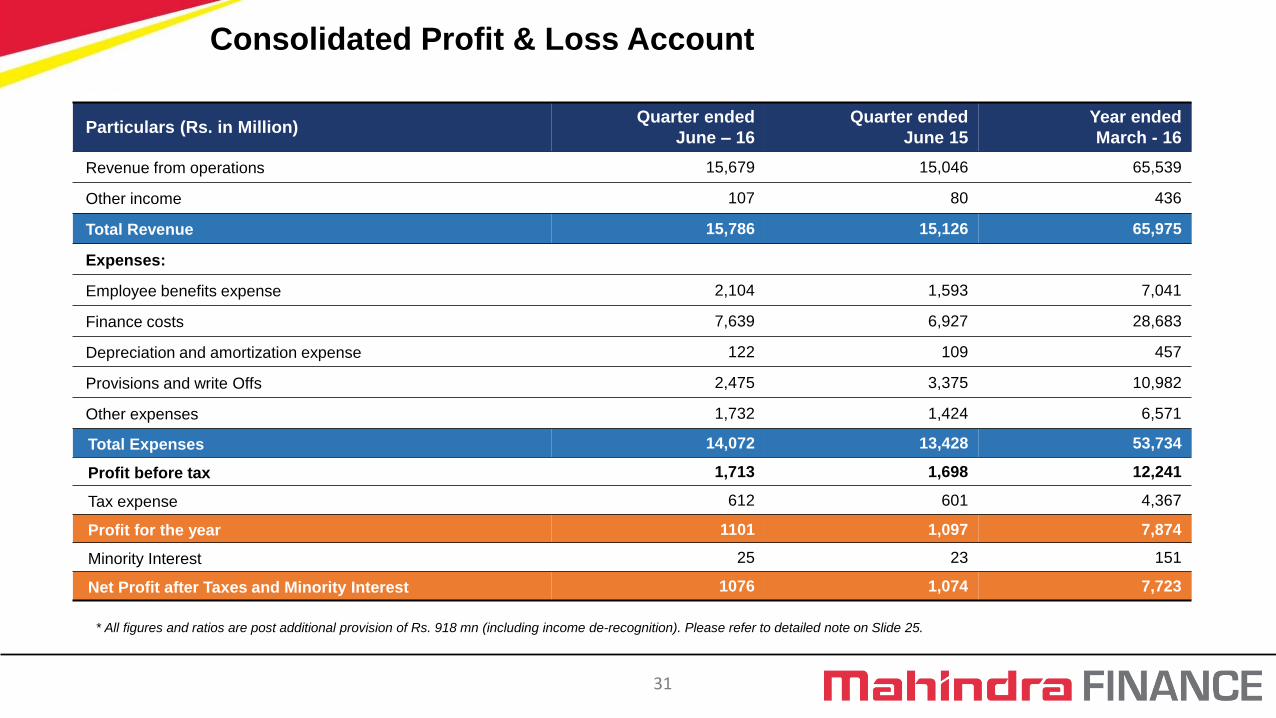
Particulars (Rs. in Million) Quarter ended
June – 16
Quarter ended
June 15
Year ended
March - 16
Revenue from operations 15,679 15,046 65,539
Other income 107 80 436
Total Revenue 15,786 15,126 65,975
Expenses:
Employee benefits expense 2,104 1,593 7,041
Finance costs 7,639 6,927 28,683
Depreciation and amortization expense 122 109 457
Provisions and write Offs 2,475 3,375 10,982
Other expenses 1,732 1,424 6,571
Total Expenses 14,072 13,428 53,734
Profit before tax 1,713 1,698 12,241
Tax expense 612 601 4,367
Profit for the year 1101 1,097 7,874
Minority Interest 25 23 151
Net Profit after Taxes and Minority Interest 1076 1,074 7,723
* All figures and ratios are post additional provision of Rs. 918 mn (including income de-recognition). Please refer to detailed note on Slide 25.
Consolidated Profit & Loss Account

32
Particulars (Rs. in Million) As on Jun 30, 2016 As on Jun 30, 2015 As on Mar 31, 2016
EQUITY AND LIABILITIES
Shareholders' funds
a) Share Capital 1,129 1,128 1,129
b) Reserves and Surplus 64,481 59,444 63,565
Shareholders' funds 65,610 60,572 64,694
Minority Interest 700 516 675
Non-current liabilities
a) Long-term borrowings 2,12,604 1,90,267 2,03,412
b) Other Long-term liabilities 4,604 3,511 4,326
c) Long term provisions 5,635 4,400 4,919
Non-current liabilities 2,22,843 1,98,178 2,12,657
Current liabilities
a) Short Term Borrowings 47,252 49,209 52,175
b) Trade payables 6,206 5,199 5,073
c) Other current liabilities 105,008 75,722 99,103
d) Short term provisions 16,954 13,686 15,691
Current liabilities 1,75,420 1,43,816 1,72,042
Total Equities and Liabilities 4,64,575 4,03,082 4,50,068
Consolidated Balance Sheet

33
Particulars (Rs. in Million) As on Jun 30, 2016 As on Jun 30, 2015 As on Mar 31, 2016
ASSETS
Non-current assets
a) Fixed Assets 1,332 1,199 1,291
b) Non-current investments 6,399 5,807 6,522
c) Deferred tax assets (Net) 6,282 4,349 5,992
d) Long-term loans and advances 2,33,484 2,03,672 2,28,420
e) Other non current assets 553 2,854 524
Non-current assets 2,48,050 2,17,881 2,42,749
Current assets
a) Current investments 2,819 938 5,467
b) Trade receivables 159 109 200
c) Cash and cash equivalents 5,738 3,919 6,098
d) Short-term loans and advances 2,06,852 1,79,841 1,94,669
e) Other current assets 957 394 885
Current assets 2,16,525 1,85,201 2,07,319
Total Assets 4,64,575 4,03,082 4,50,068
Consolidated Balance Sheet (Contd.)
34
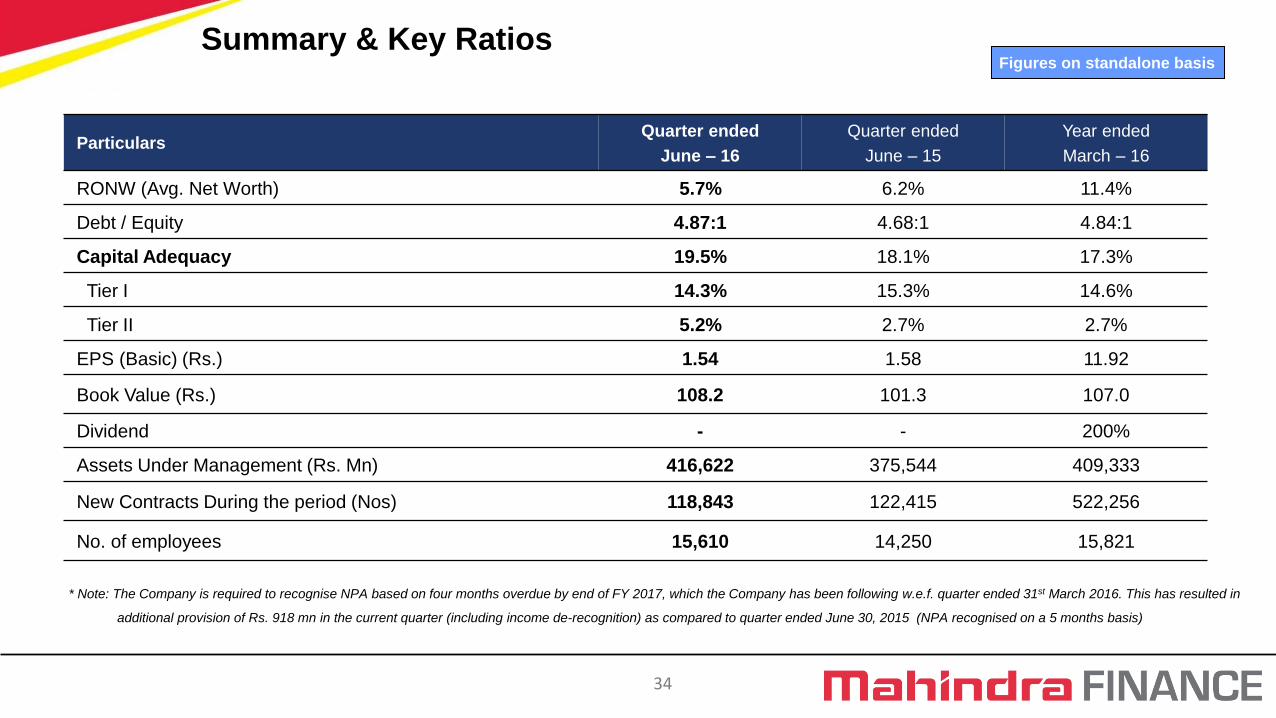
Particulars Quarter ended
June – 16
Quarter ended
June – 15
Year ended
March – 16
RONW (Avg. Net Worth) 5.7% 6.2% 11.4%
Debt / Equity 4.87:1 4.68:1 4.84:1
Capital Adequacy 19.5% 18.1% 17.3%
Tier I 14.3% 15.3% 14.6%
Tier II 5.2% 2.7% 2.7%
EPS (Basic) (Rs.) 1.54 1.58 11.92
Book Value (Rs.) 108.2 101.3 107.0
Dividend - - 200%
Assets Under Management (Rs. Mn) 416,622 375,544 409,333
New Contracts During the period (Nos) 118,843 122,415 522,256
No. of employees 15,610 14,250 15,821
Summary & Key Ratios Figures on standalone basis
* Note: The Company is required to recognise NPA based on four months overdue by end of FY 2017, which the Company has been following w.e.f. quarter ended 31st March 2016. This has resulted in
additional provision of Rs. 918 mn in the current quarter (including income de-recognition) as compared to quarter ended June 30, 2015 (NPA recognised on a 5 months basis)
35
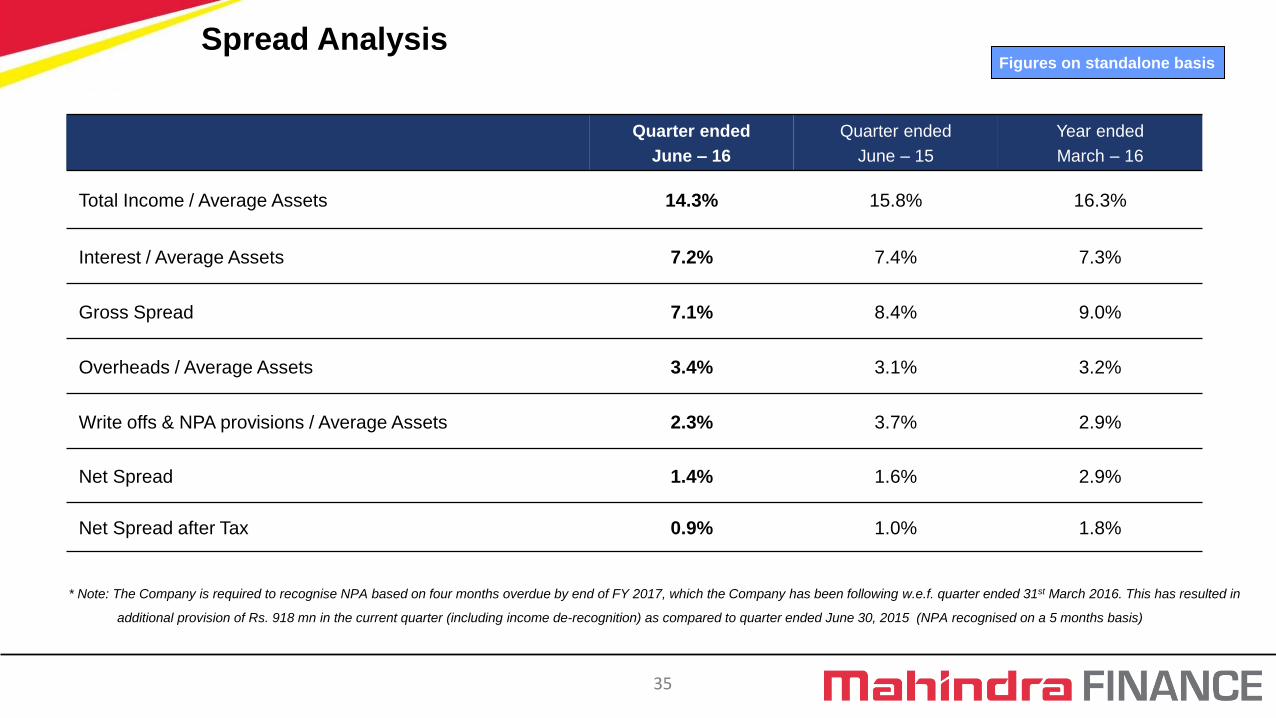
Quarter ended
June – 16
Quarter ended
June – 15
Year ended
March – 16
Total Income / Average Assets 14.3% 15.8% 16.3%
Interest / Average Assets 7.2% 7.4% 7.3%
Gross Spread 7.1% 8.4% 9.0%
Overheads / Average Assets 3.4% 3.1% 3.2%
Write offs & NPA provisions / Average Assets 2.3% 3.7% 2.9%
Net Spread 1.4% 1.6% 2.9%
Net Spread after Tax 0.9% 1.0% 1.8%
Spread Analysis Figures on standalone basis
* Note: The Company is required to recognise NPA based on four months overdue by end of FY 2017, which the Company has been following w.e.f. quarter ended 31st March 2016. This has resulted in
additional provision of Rs. 918 mn in the current quarter (including income de-recognition) as compared to quarter ended June 30, 2015 (NPA recognised on a 5 months basis)

36
Particulars (Rs. million) June – 16 June – 15 March – 16
Gross Non - Performing Assets 44,147* 29,411 32,242*
Less: NPA Provisions 23,087 16,644 19,891
Net Non – Performing Assets 21,060 12,767 12,351
Total Assets (Incl. NPA Provision) 411,337 366,656 400,764
Gross NPA to Total Assets(%) 10.7% 8.0% 8.0%
Net NPA to Total Assets(%) 5.4% 3.6% 3.2%
Coverage Ratio(%) 52.3% 56.6% 61.7%
Note: *includes additional assets of Rs. 2486 mn and Rs. 4496 mn for March 2016 and June 2016 respectively identified due to accelerated recognition.
* The Company is required to recognise NPA based on four months overdue by end of FY 2017, which the Company has been following w.e.f. quarter ended 31st March 2016. This has resulted in
additional provision of Rs. 918 mn in the current quarter (including income de-recognition) as compared to quarter ended June 30, 2015 (NPA recognised on a 5 months basis)
Above workings are excluding securitised/assigned portfolio
NPA Analysis Figures on standalone basis
37 37
Transforming rural lives across the country
Company Overview
Industry Overview
Business Strategy
Financial Information
Key Subsidiaries
Awards & Accolades
Risk Management Policies
38
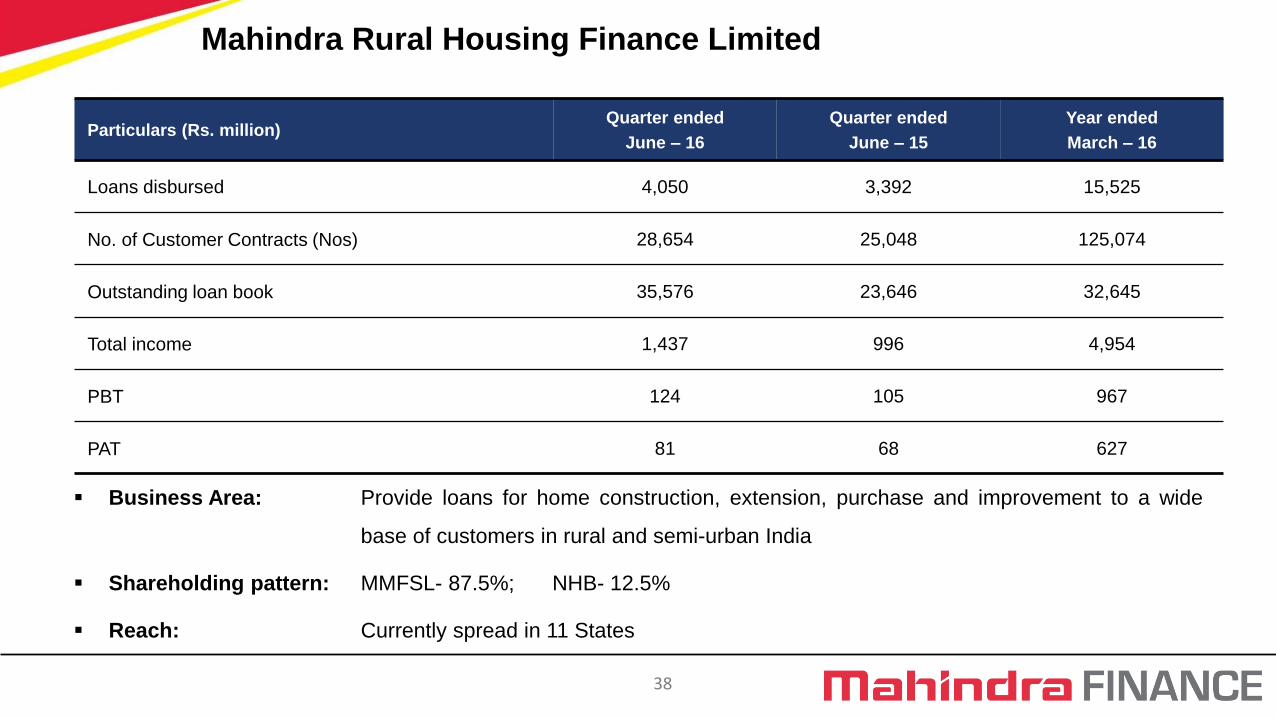
Business Area: Provide loans for home construction, extension, purchase and improvement to a wide
base of customers in rural and semi-urban India
Shareholding pattern: MMFSL- 87.5%; NHB- 12.5%
Reach: Currently spread in 11 States
Particulars (Rs. million) Quarter ended
June – 16
Quarter ended
June – 15
Year ended
March – 16
Loans disbursed 4,050 3,392 15,525
No. of Customer Contracts (Nos) 28,654 25,048 125,074
Outstanding loan book 35,576 23,646 32,645
Total income 1,437 996 4,954
PBT 124 105 967
PAT 81 68 627
Mahindra Rural Housing Finance Limited

39
Particulars (Rs. million) Quarter ended
June – 16
Quarter ended
June – 15
Year ended
March – 16
Total income 365 317 1,492
Net premium 2,680 2,499 10,870
PBT 154 146 752
PAT 101 96 485
No. of Policies for the Period (nos.) 360,128 300,483 1,330,929
No. of employees (nos.) 825 733 802
Business Area: Licensed by IRDA for undertaking insurance broking in Life, Non-Life and reinsurance businesses
Shareholding pattern: MMFSL- 85%; Inclusion Resources Pvt. Ltd.- 15%
Mahindra Insurance Brokers Limited
40 40
Transforming rural lives across the country
Company Overview
Industry Overview
Business Strategy
Financial Information
Key Subsidiaries
Awards & Accolades
Risk Management Policies
41
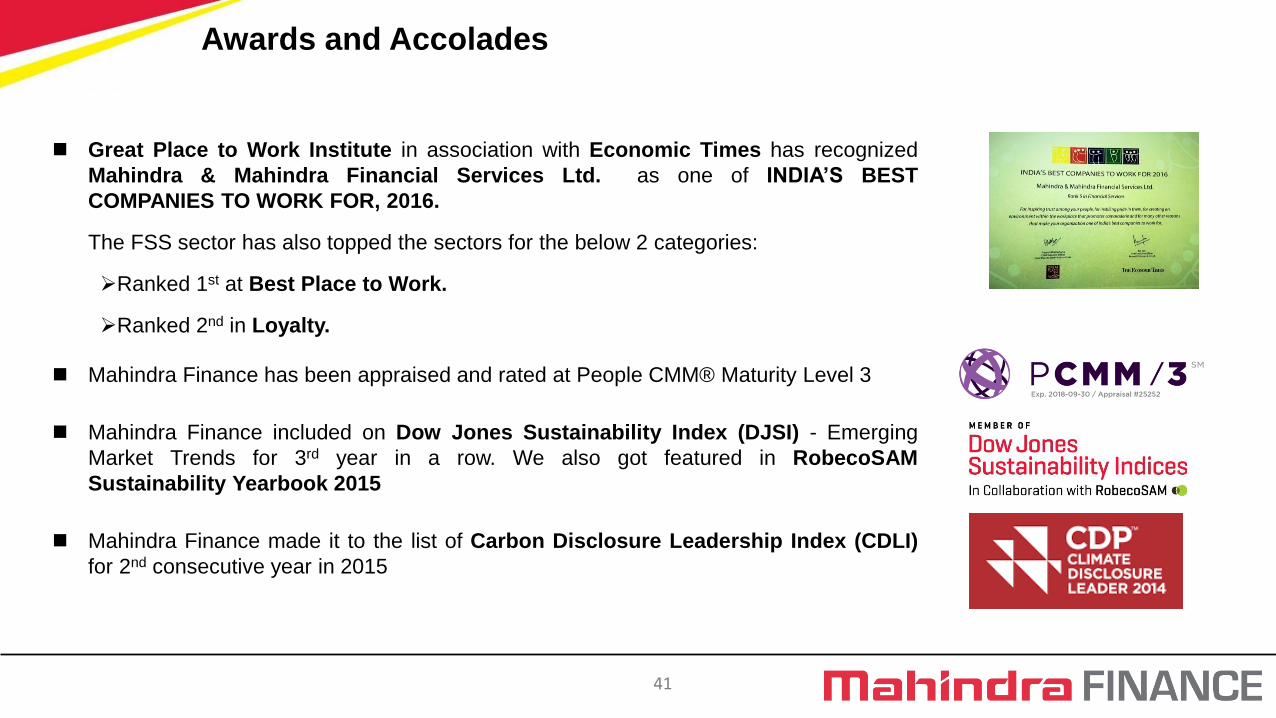
Awards and Accolades
Great Place to Work Institute in association with Economic Times has recognized
Mahindra & Mahindra Financial Services Ltd. as one of INDIA‟S BEST
COMPANIES TO WORK FOR, 2016.
The FSS sector has also topped the sectors for the below 2 categories:
Ranked 1st at Best Place to Work.
Ranked 2nd in Loyalty.
Mahindra Finance has been appraised and rated at People CMM® Maturity Level 3
Mahindra Finance included on Dow Jones Sustainability Index (DJSI) - Emerging
Market Trends for 3rd year in a row. We also got featured in RobecoSAM
Sustainability Yearbook 2015
Mahindra Finance made it to the list of Carbon Disclosure Leadership Index (CDLI)
for 2nd consecutive year in 2015
42 42
Transforming rural lives across the country
Company Overview
Industry Overview
Business Strategy
Financial Information
Key Subsidiaries
Awards & Accolades
Risk Management Policies

43
Duration (months) RBI Norms Duration (months) MMFSL
5 and <= 16 10% > 4* and <= 11 10%
> 16 and <= 28 20% > 11 and <= 24 50%
> 28 and <= 52 30% > 24 months 100%
> 52 months 50%
At MMFSL, NPA
provisioning norms
are more stringent
than RBI norms
Key Risks & Management Strategies
Key Risks Management Strategies
Volatility in interest rates Matching of asset and liabilities
Rising competition Increasing branch network
Raising funds at competitive rates Maintaining credit rating & improving asset quality
Dependence on M&M Increasing non-M&M Portfolio
Occurrence of natural disasters Increasing geographical spread
Adhering to write-off standards Diversify the product portfolio
Employee retention Job rotation / ESOP/ Recovery based performance initiatives
Physical cash management Insurance & effective internal control
Provisioning Norms
Conservative Risk Management Policies
Note: During the current quarter, the Company has reviewed the basis of estimating provision for non-performing assets and has considered estimated realisable value of underlying security (which
conforms to the RBI norms) for loan assets to determine 100% provisioning for assets which are 24 months overdue. As a result, provision for the quarter ended 30 June 2016 is lower by
Rs.19275.18 lacs with a consequent impact on the Profit before tax.
* Note: The Company is required to recognise NPA based on four months overdue by end of FY 2017, which the Company has been following w.e.f. quarter ended 31st March 2016. This has resulted in
additional provision of Rs. 918 mn in the current quarter (including income de-recognition) as compared to quarter ended June 30, 2015 (NPA recognised on a 5 months basis)
44 44
This presentation does not constitute or form part of any offer or invitation or inducement to sell or issue, or any solicitation of any offer to purchase or subscribe for, any securities of Mahindra & Mahindra Financial Services Limited (the “Company”), nor shall it or any part of it or the fact of its distribution form the basis of, or be relied on in connection with, any contract or commitment there for.
This presentation contains statements that constitute forward-looking statements. These statements include descriptions regarding the intent, belief or current expectations of the Company or its directors and officers with respect to the results of operations and financial condition of the Company. These statements can be recognized by the use of words such as “expects,” “plans,” “will,” “estimates,” “projects,” or other words of similar meaning. Such forward-looking statements are not guarantees of future performance and involve risks and uncertainties, and actual results may differ from those in such forward-looking statements as a result of various factors and assumptions which the Company believes to be reasonable in light of its operating experience in recent years. The Company does not undertake to revise any forward-looking statement that may be made from time to time by or on behalf of the Company.
No representation, warranty, guarantee or undertaking, express or implied, is or will be made as to, and no reliance should be placed on, the accuracy, completeness or fairness of the information, estimates, projections and opinions contained in this presentation. Potential investors must make their own assessment of the relevance, accuracy and adequacy of the information contained in this presentation and must make such independent investigation as they may consider necessary or appropriate for such purpose. Any opinions expressed in this presentation are subject to change without notice. None of the Company, the placement agents, promoters or any other persons that may participate in the offering of any securities of the Company shall have any responsibility or liability whatsoever for any loss howsoever arising from this presentation or its contents or otherwise arising in connection therewith.
This presentation and its contents are confidential and should not be distributed, published or reproduced, in whole or part, or disclosed by recipients directly or indirectly to any other person. In particular, this presentation is not for publication or distribution or release in the United States, Australia, Canada or Japan or in any other country where such distribution may lead to a breach of any law or regulatory requirement. The information contained herein does not constitute or form part of an offer or solicitation of an offer to purchase or subscribe for securities for sale in the United States, Australia, Canada or Japan or any other jurisdiction. The securities referred to herein have not been and will not be registered under the United States Securities Act of 1933, as amended, and may not be offered or sold in the United States or to or for the benefit of US persons absent registration or an applicable exemption from registration.
CRISIL DISCLAIMER: CRISIL limited has used due care and caution in preparing this report. Information has been obtained by CRISIL from sources which it considers reliable. However, CRISIL does not guarantee the accuracy, adequacy or completeness of any information and is not responsible for any errors or omissions or for the results obtained from the use of such information. No part of this report may be published/reproduced in any form without CRISIL‟s prior written approval. CRISIL is not liable for investment decisions which may be based on the views expressed in this report. CRISIL Research operates independently of, and does not have access to information obtained by CRISIL‟s Rating Division, which may, in its regular operations, obtain information of a confidential nature that is not available to CRISIL Research.
Disclaimer
45 45
Thank You
Transforming rural lives
across the country