Notice MAHINDRA & MAHINDRA LIMITED - Bombay … & MAHINDRA LIMITED 1 THE SIXTY-SEVENTH ANNUAL...
211
MAHINDRA & MAHINDRA LIMITED 1 THE SIXTY-SEVENTH ANNUAL GENERAL MEETING OF MAHINDRA & MAHINDRA LIMITED will be held at Birla Matushri Sabhagar, 19, Sir Vithaldas Thackersey Marg (New Marine Lines), Mumbai-400 020 on Tuesday, the 13 th day of August 2013 at 3.30 p.m. to transact the following businesses: 1. To receive and adopt the audited Balance Sheet as at 31 st March 2013 and the Statement of Profit and Loss for the year ended on that date and the Reports of the Directors and the Auditors thereon. 2. To declare a dividend on Ordinary (Equity) Shares. 3. To appoint a Director in place of Mr. Anand G. Mahindra, who retires by rotation and, being eligible, offers himself for re-election. 4. To appoint a Director in place of Mr. Nadir B. Godrej, who retires by rotation and, being eligible, offers himself for re-election. 5. To appoint a Director in place of Mr. Anupam Puri who retires by rotation and, being eligible, offers himself for re-election. 6. To consider and, if thought fit, to pass, with or without modification(s), the following as an Ordinary Resolution: “RESOLVED that Dr. A. S. Ganguly, a Director liable to retire by rotation, who does not seek re-appointment, be not re-appointed a Director of the Company. FURTHER RESOLVED that the vacancy, so created on the Board of Directors of the Company, be not filled.” 7. To consider and, if thought fit, to pass, with or without modification(s), the following as an Ordinary Resolution: “RESOLVED that pursuant to section 224 of the Companies Act, 1956, Messrs Deloitte Haskins & Sells, Chartered Accountants (ICAI Registration Number 117364W), the retiring Auditors of the Company, be re-appointed as Auditors of the Company to hold office from the conclusion of this Annual General Meeting, until the conclusion of the next Annual General Meeting of the Company at a remuneration to be determined by the Board of Directors of the Company in addition to out of pocket expenses as may be Incurred by them during the course of the Audit.” Notes: A. A MEMBER ENTITLED TO ATTEND AND VOTE AT THE MEETING IS ENTITLED TO APPOINT A PROXY TO ATTEND AND VOTE INSTEAD OF HIMSELF AND A PROXY NEED NOT BE A MEMBER. B. The instrument appointing a proxy must be deposited with the Company at its Registered Office not less than 48 hours before the time for holding the Meeting. Notice C. The Company’s Registrar and Transfer Agents for its Share Registry Work (Physical and Electronic) are Sharepro Services (India) Private Limited having their Registered Office at 13AB, Samhita Warehousing Complex, 2 nd Floor, Sakinaka Telephone Exchange Lane, Off Andheri Kurla Road, Sakinaka, Andheri (East), Mumbai - 400 072. D. The Register of Members and Transfer Books of the Company will be closed from 20 th July 2013 to 13 th August 2013 (both days inclusive). E. The dividend, if declared at the Annual General Meeting, would be paid/despatched on and after 14 th August 2013 to those persons or their mandates: (a) whose names appear as Beneficial Owners as at the end of the business hours on 19 th July 2013 in the list of Beneficial Owners to be furnished by National Securities Depository Limited and Central Depository Services (India) Limited in respect of the shares held in electronic mode; and (b) whose names appear as Members in the Register of Members of the Company after giving effect to valid share transfers in physical form lodged with the Company/its Registrar and Transfer Agents on or before 19 th July 2013. F. Under the Companies Act, 1956 dividends that are unclaimed for a period of seven years are required to be transferred to the Investors Education and Protection Fund (IEPF) administered by the Central Government. An amount of Rs. 50,19,755 being unclaimed dividend of the Company for the Financial Year ended 31 st March 2005 was transferred in September 2012 to IEPF and no claim lies against the Company in respect thereof. Due dates of transferring unclaimed and unpaid dividends declared by the Company for the Financial Year 2005-06 and thereafter to IEPF: Financial Year ended Date of declaration of dividend Last date for claiming unpaid/ unclaimed dividend 31 st March 2006 26 th July 2006 24 th August 2013 31 st March 2007 – (Interim Dividend) 21 st March 2007 19 th April 2014 31 st March 2007 30 th July 2007 30 th August 2014 31 st March 2008 30 th July 2008 28 th August 2015 31 st March 2009 30 th July 2009 30 th August 2016 31 st March 2010 28 th July 2010 26 th August 2017 31 st March 2011 8 th August 2011 6 th September 2018 31 st March 2012 8 th August 2012 6 th September 2019 PDF processed with CutePDF evaluation edition www.CutePDF.com
Transcript of Notice MAHINDRA & MAHINDRA LIMITED - Bombay … & MAHINDRA LIMITED 1 THE SIXTY-SEVENTH ANNUAL...

MAHINDRA & MAHINDRA LIMITED
1
THE SIXTY-SEVENTH ANNUAL GENERAL MEETING OF MAHINDRA & MAHINDRA LIMITED will be held at Birla Matushri Sabhagar, 19, Sir Vithaldas Thackersey Marg (New Marine Lines), Mumbai-400 020 on Tuesday, the 13th day of August 2013 at 3.30 p.m. to transact the following businesses:
1. To receive and adopt the audited Balance Sheet as at 31st March 2013 and the Statement of Profit and Loss for the year ended on that date and the Reports of the Directors and the Auditors thereon.
2. To declare a dividend on Ordinary (Equity) Shares.
3. To appoint a Director in place of Mr. Anand G. Mahindra, who retires by rotation and, being eligible, offers himself for re-election.
4. To appoint a Director in place of Mr. Nadir B. Godrej, who retires by rotation and, being eligible, offers himself for re-election.
5. To appoint a Director in place of Mr. Anupam Puri who retires by rotation and, being eligible, offers himself for re-election.
6. To consider and, if thought fit, to pass, with or without modification(s), the following as an Ordinary Resolution:
“RESOLVED that Dr. A. S. Ganguly, a Director liable to retire by rotation, who does not seek re-appointment, be not re-appointed a Director of the Company.
FURTHER RESOLVED that the vacancy, so created on the Board of Directors of the Company, be not filled.”
7. To consider and, if thought fit, to pass, with or without modification(s), the following as an Ordinary Resolution:
“RESOLVED that pursuant to section 224 of the Companies Act, 1956, Messrs Deloitte Haskins & Sells, Chartered Accountants (ICAI Registration Number 117364W), the retiring Auditors of the Company, be re-appointed as Auditors of the Company to hold office from the conclusion of this Annual General Meeting, until the conclusion of the next Annual General Meeting of the Company at a remuneration to be determined by the Board of Directors of the Company in addition to out of pocket expenses as may be Incurred by them during the course of the Audit.”
Notes:
A. A MEMBER ENTITLED TO ATTEND AND VOTE AT THE MEETING IS ENTITLED TO APPOINT A PROXY TO ATTEND AND VOTE INSTEAD OF HIMSELF AND A PROXY NEED NOT BE A MEMBER.
B. The instrument appointing a proxy must be deposited with the Company at its Registered Office not less than 48 hours before the time for holding the Meeting.
Notice
C. The Company’s Registrar and Transfer Agents for its Share Registry Work (Physical and Electronic) are Sharepro Services (India) Private Limited having their Registered Office at 13AB, Samhita Warehousing Complex, 2nd Floor, Sakinaka Telephone Exchange Lane, Off Andheri Kurla Road, Sakinaka, Andheri (East), Mumbai - 400 072.
D. The Register of Members and Transfer Books of the Company will be closed from 20th July 2013 to 13th August 2013 (both days inclusive).
E. The dividend, if declared at the Annual General Meeting, would be paid/despatched on and after 14th August 2013 to those persons or their mandates:
(a) whose names appear as Beneficial Owners as at the end of the business hours on 19th July 2013 in the list of Beneficial Owners to be furnished by National Securities Depository Limited and Central Depository Services (India) Limited in respect of the shares held in electronic mode; and
(b) whose names appear as Members in the Register of Members of the Company after giving effect to valid share transfers in physical form lodged with the Company/its Registrar and Transfer Agents on or before 19th July 2013.
F. Under the Companies Act, 1956 dividends that are unclaimed for a period of seven years are required to be transferred to the Investors Education and Protection Fund (IEPF) administered by the Central Government. An amount of Rs. 50,19,755 being unclaimed dividend of the Company for the Financial Year ended 31st March 2005 was transferred in September 2012 to IEPF and no claim lies against the Company in respect thereof.
Due dates of transferring unclaimed and unpaid dividends declared by the Company for the Financial Year 2005-06 and thereafter to IEPF:
Financial Year ended
Date of declaration of dividend
Last date for claiming unpaid/unclaimed dividend
31st March 2006 26th July 2006 24th August 2013
31st March 2007 – (Interim Dividend)
21st March 2007 19th April 2014
31st March 2007 30th July 2007 30th August 2014
31st March 2008 30th July 2008 28th August 2015
31st March 2009 30th July 2009 30th August 2016
31st March 2010 28th July 2010 26th August 2017
31st March 2011 8th August 2011 6th September 2018
31st March 2012 8th August 2012 6th September 2019
PDF processed with CutePDF evaluation edition www.CutePDF.com
2
Members who have not encashed the dividend warrants so far in respect of the aforesaid periods, are requested to make their claim to Sharepro Services (India) Private Limited well in advance of the above due dates. It may be noted that once the amounts in the unpaid dividend accounts are transferred to IEPF, no claim shall lie against the IEPF or the Company in respect thereof and the Members would lose their right to claim such dividend.
G. Members can avail of the facility of nomination in respect of shares held by them in physical form pursuant to the provisions of section 109A of the Companies Act, 1956. Members desiring to avail of this facility may send their nomination in the prescribed Form No. 2B duly filled in to Sharepro Services (India) Private Limited at the above mentioned address. Members holding shares in electronic mode may contact their respective Depository Participants for availing this facility.
H. The Securities and Exchange Board of India has made it mandatory for all companies to use the bank account details furnished by the Depositories and the bank account details maintained by the Registrar and Transfer Agents for payment of dividend through Electronic Mode to investors wherever bank details are available. In the absence of Electronic Clearing Services (ECS) facilities, the Company will print the bank account details, if available, on the payment instrument for distribution of dividend. The Company will not entertain any direct request from Members holding shares in electronic mode for deletion of/change in such bank details. Further, instructions if any, already given by them in respect ofshares held in physical form will not be automatically applicable to shares held in the electronic mode. Members who wish to change such bank account details are therefore requested to advise their Depository Participants about such change, with complete details of bank account.
I. The Company has extended the facility of electronic credit of dividend directly to the respective bank accounts of the Member(s) through the Electronic Clearing Service (ECS)/National Electronic Clearing Service (NECS). The ECS facility is available at Ahmedabad, Bengaluru, Bhubaneshwar, Chandigarh, Chennai, New Delhi, Guwahati, Hyderabad, Jaipur, Kanpur, Kolkata, Mumbai, Nagpur, Patna, Pune and Thiruvananthapuram. Members wishing to avail of this facility are requested to intimate the Company’s Registrar and Transfer Agents/Depository Participants in the prescribed form and with the prescribed details. Members located in places where ECS/NECS facility is not available may submit their bank details. This will enable the Company to incorporate this information on the dividend warrants and thus prevent fraudulent encashment.
J. The Ministry of Corporate Affairs, Government of India, has taken a “Green Initiative in Corporate Governance” by allowing paperless compliances by the companies and has issued Circulars allowing companies to send official documents to their Shareholders electronically.
In support of the Green Initiative, your Company has sent e-mail to the Members at their e-mail addresses
available in the records of the Company informing them about the Company’s proposal to send the documents like Notice calling the Annual General Meeting andAnnual Report containing Balance Sheet, Statement of Profit & Loss and Directors’ Report, etc. for the year ended 31st March 2013 and other communication, in electronic form.
These Members were also given an option to receive the documents in physical form. Accordingly, the Annual Report for the year 2012-13, Notice for the Annual General Meeting, etc. would be sent in electronic mode to such of the Members of the Company who do not opt to receive the same in physical form.
Members are requested to support this Green Initiative by registering/updating their e-mail addresses, with the Depository Participant (in case of Shares held in dematerialised form) or with Sharepro Services (India) Private Limited (in case of Shares held in physical form).
K. Members are requested to:
(a) intimate to the Company’s Registrar and Transfer Agents, Sharepro Services (India) Private Limited at the above mentioned address, changes, if any, in their registered addresses at an early date, in case of Shares held in physical form;
(b) intimate to the respective Depository Participant, changes, if any, in their registered addresses at an early date, in case of Shares held in dematerialised form;
(c) quote their folio numbers/Client ID/DP ID in all correspondence; and
(d) consolidate their holdings into one folio in case they hold Shares under multiple folios in the identical order of names.
L. Re-appointment of Directors
Mr. Anand G. Mahindra holds 6,75,004 Ordinary (Equity) Shares, Mr. Nadir B. Godrej holds 3,25,591 Ordinary (Equity) Shares and Mr. Anupam Puri does not hold any Ordinary (Equity) Shares of Rs. 5 each in the Company.
None of the Directors of the Company are inter-se related to each other.
In respect of the information to be provided under Clause 49 of the Listing Agreement pertaining to the Directors being re- appointed, Members are requested to kindly refer the Chapter on Corporate Governance in theAnnual Report.
By Order of the Board
NARAYAN SHANKAR Company Secretary
Registered Office:
Gateway Building,Apollo Bunder,Mumbai-400 001.e-mail: [email protected]
10th June 2013
vakils


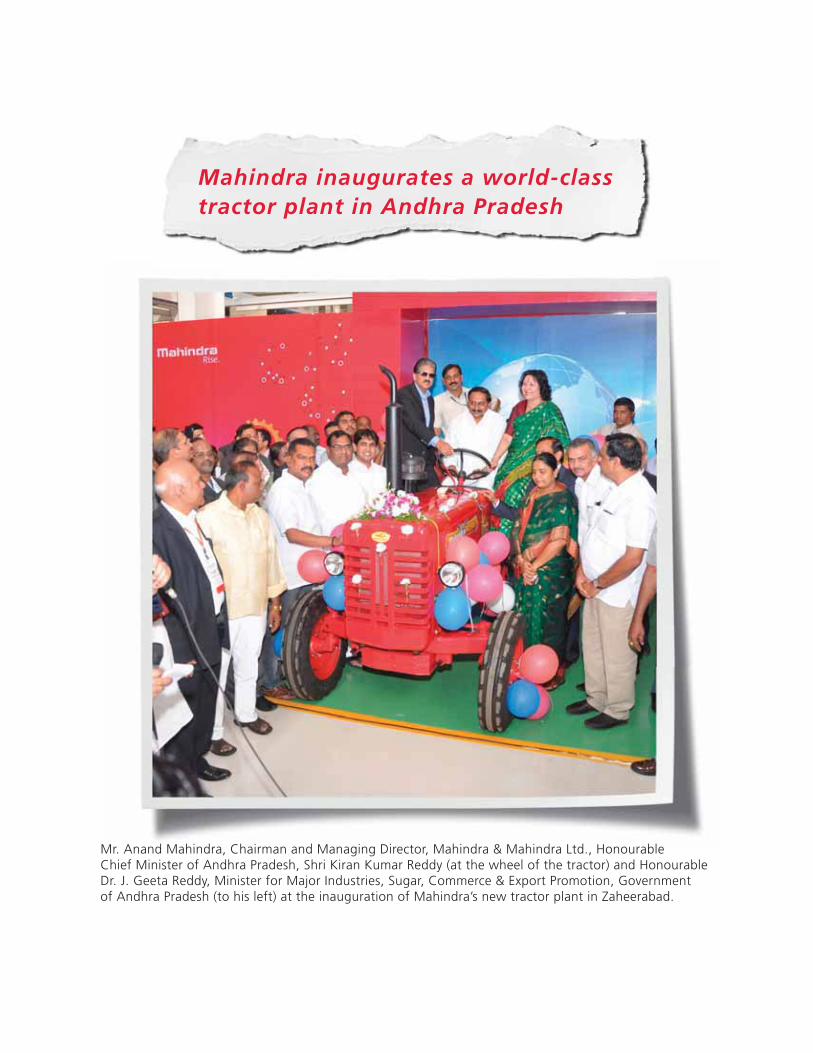
Mahindra inaugurates a world-classtractor plant in Andhra Pradesh
Mr. Anand Mahindra, Chairman and Managing Director, Mahindra & Mahindra Ltd., Honourable Chief Minister of Andhra Pradesh, Shri Kiran Kumar Reddy (at the wheel of the tractor) and Honourable Dr. J. Geeta Reddy, Minister for Major Industries, Sugar, Commerce & Export Promotion, Government of Andhra Pradesh (to his left) at the inauguration of Mahindra’s new tractor plant in Zaheerabad.

12
COMMITTEES OF THE BOARDAudit CommitteeMr. Deepak S. Parekh ChairmanMr. Nadir B. GodrejMr. M. M. MurugappanMr. R. K. Kulkarni
Share Transfer and Shareholders/Investors Grievance CommitteeMr. A. K. Nanda ChairmanMr. Anand G. Mahindra Mr. Bharat DoshiMr. R. K. Kulkarni
Governance, Remuneration and Nomination CommitteeMr. Narayanan Vaghul ChairmanMr. Nadir B. GodrejMr. M. M. MurugappanMr. R. K. Kulkarni
Corporate Social Responsibility CommitteeMr. Anand G. Mahindra ChairmanMr. Bharat DoshiMr. A. K. NandaMr. R. K. KulkarniDr. Vishakha N. Desai
Strategic Investment CommitteeMr. Anand G. Mahindra ChairmanMr. Bharat DoshiMr. Deepak S. ParekhMr. Nadir B. GodrejDr. A. S. GangulyMr. Vikram Singh MehtaMr. Anupam Puri
Loans & Investment CommitteeMr. Anand G. Mahindra ChairmanMr. Bharat DoshiMr. A. K. NandaMr. R. K. KulkarniMr. Vikram Singh Mehta
Research & Development CommitteeDr. A. S. Ganguly ChairmanMr. Anand G. Mahindra Mr. Bharat DoshiMr. Nadir B. GodrejMr. M. M. Murugappan
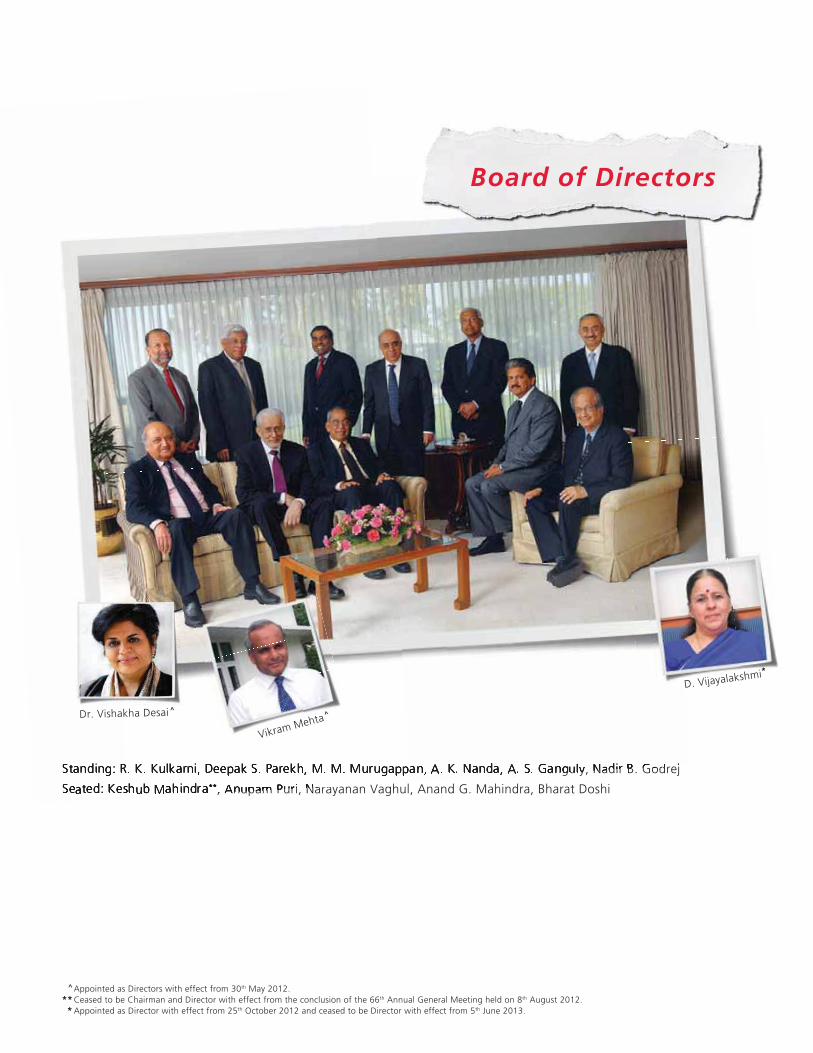
BOARD OF DIRECTORSMr. Keshub Mahindra Chairman Emeritus(Ceased to be Chairman and Director at the conclusion of the AGM held on 8th August 2012)
Mr. Anand G. Mahindra Chairman & Managing Director
Mr. Bharat Doshi Executive Director & Group Chief Financial Officer
Mr. Deepak S. Parekh
Mr. Nadir B. Godrej
Mr. M. M. Murugappan
Mr. A. K. Nanda
Mr. Narayanan Vaghul
Dr. A. S. Ganguly
Mr. R. K. Kulkarni
Mr. Anupam Puri
Dr. Vishakha N. Desai
Mr. Vikram Singh Mehta
Mrs. D. Vijayalakshmi Nominee of Life Insurance Corporation of India(Ceased to be a Director with effect from 5th June 2013)
Mr. Narayan ShankarCompany Secretary
BANKERSBank of America N.A.Bank of BarodaBank of IndiaCanara BankCentral Bank of IndiaHDFC Bank LimitedStandard Chartered BankState Bank of IndiaUnion Bank of India
AUDITORSDeloitte Haskins & Sells Tower 3, 27th – 32nd Floor, Indiabulls Finance Centre, Elphinstone Mill Compound, Senapati Bapat Marg, Elphinstone (W), Mumbai 400 013
ADVOCATESKhaitan & Co., One Indiabulls Centre, 13th Floor, 841, Senapati Bapat Marg, Elphinstone Road, Mumbai 400 013
REGISTERED OFFICEGateway Building, Apollo Bunder, Mumbai 400 001
CONTENTS
Directors’ Report .....................................................................................................13
Management Discussion and Analysis ...................................................................35
Corporate Governance ............................................................................................55
Business Responsibility Report ...............................................................................73
Accounts ...................................................................................................................87
Statement pursuant to Section 212 .....................................................................139
Consolidated Accounts ..........................................................................................145


MAHINDRA & MAHINDRA LIMITED
15
Dear ShareholdersYour Directors present their Report together with the audited accounts of your Company for the year ended 31st March 2013.
Financial Highlights(Rs. in crores)
2013 2012
Gross Income 43,962 34,820
Less: Excise Duty on Sales 2,972 2,501
Net Income 40,990 32,319
Profit before Depreciation, Finance Costs, Exceptional item and Taxation 5,258 4,237
Less: Depreciation/Amortisation 711 576
Profit before Finance Costs, Exceptional item and Taxation 4,547 3,661
Less: Finance Costs 191 163
Profit before Exceptional item and Taxation 4,356 3,498
Add: Exceptional item 91 108
Profit before Taxation 4,447 3,606
Less: Provision for Tax – Current Tax (including MAT credit entitlement) 933 538
Less: Provision for Tax – Deferred Tax (Net) 161 189
Profit for the year 3,353 2,879
Balance of profit for earlier years 7,905 6,209
Less: Transfer to Debenture Redemption Reserve 15 14
Profits available for appropriation 11,243 9,074
Less: General Reserve 400 300
Proposed Dividends 798 768
Income-tax on Proposed Dividend 93 101
Balance carried forward 9,952 7,905
The Indian economy performed poorly in the Financial Year 2012-13. Faced with economic turbulence abroad and an unsupportive policy environment at home, industrial activity slowed steadily through the year, critical infrastructural projects stalled and private corporate investments lost much of their dynamism. A weak south-west monsoon added further stress. Food prices shot up, keeping inflation and interest rates high through most of the year, while rural incomes lost momentum. Consumer demand, as a result, slowed sharply, impacting business performance and profitability across the board. The country’s current account deficit widened significantly, putting severe pressure on the rupee. At the same time, with domestic economic activity slowing, Government revenues lost buoyancy, worsening the already weak state of Government finances.
With the economy under severe pressure and rating agencies threatening a downgrade, the Government finally swung into action in the second half of the year, announcing a series of critical reforms. These measures have, undoubtedly, improved the extant economic environment in the country but deeper structural and administrative reforms are needed for the economy to regain momentum and fully realise its long term potential.
Financial Performance
Against the backdrop of this challenging situation, the Automotive and Farm Divisions of your Company have shown good performance during the year, reflecting substantial growth in the net income of the Company by 26.8% from Rs. 32,319 crores in the previous year to Rs. 40,990 crores in the year under review.
Consequent to this commendable performance, the profit for the year before Depreciation, Finance Costs, Exceptional items and Taxation recorded an increase of 24.1% at Rs. 5,258 crores as against Rs. 4,237 crores in the previous
DIRECTORS’ REPORT
16
year. Similarly, profit after tax clocked an increase of 16.5% at Rs. 3,353 crores as against Rs. 2,879 crores in the previous year. Your Company continues with its rigorous cost restructuring exercises and efficiency improvements which have resulted in significant savings through continued focus on cost controls, process efficiencies and product innovations thereby enabling the Company to maintain profitable growth in the current economic scenario.
Dividend
Your Directors are pleased to recommend a dividend of Rs. 12.50 per Ordinary (Equity) Share and also a Special Dividend of Re. 0.50 per Ordinary (Equity) Share aggregating Rs. 13.00 per Ordinary (Equity) Share of the face value of Rs. 5 each, payable to those Shareholders whose names appear in the Register of Members as on the Book Closure Date. The Special Dividend is recommended in view of the profit made by the Company on sale of part of its shareholding in Mahindra Holidays & Resorts India Limited, a subsidiary of the Company. The equity dividend outgo for the Financial Year 2012-13, inclusive of tax on distributed profits (after reducing the tax on distributed profits of Rs. 42.67 crores on the dividends receivable from the subsidiaries during the current Financial Year) would absorb a sum of Rs. 891.15 crores (as against Rs. 868.61 crores comprising the dividend of Rs. 12.50 per Ordinary (Equity) Share of the face value of Rs. 5 each and tax thereon paid for the previous year).
Performance Review
Automotive Division:
Your Company’s Automotive Division recorded total sales of 4,83,734 vehicles and 67,735 three-wheelers as compared to 3,98,357 vehicles and 70,988 three-wheelers in the previous year registering a growth of 21.4% in vehicle sales and a de-growth of 4.6% in three-wheeler sales.
On the domestic sales front, your Company sold 3,10,706 Passenger Vehicles [including 2,63,925 Utility Vehicles (UVs), 31,437 Multi Purpose Vehicles (MPVs) and 15,344 Cars] registering a growth of 26.5% over the previous year’s volumes of 2,45,700 Passenger Vehicles (including 2,02,217 UVs, 25,644 MPVs and 17,839 Cars). In the commercial vehicle segment, your Company sold 1,42,797 vehicles (including 39,911 vehicles < 2T GVW and 1,02,886 vehicles between 2-3.5T GVW) registering a growth of 12.4% over the previous year’s volume of 1,27,029 commercial vehicles (including 53,895 vehicles < 2T GVW and
73,134 vehicles between 2-3.5T GVW). In the three-wheeler segment, your Company sold 65,510 three-wheelers registering de-growth of 2.9% over the previous year’s volume of 67,440 three-wheelers.
Your Company’s UV sales volume grew by 30.5% and your Company continued to maintain its leadership position in the domestic UV market by posting a market share of 47.7%. During the year, the Bolero posted record sales of more than 1,00,000 units for the second consecutive year and the Scorpio also posted sales of over 50,000 units for the second successive year.
After a very successful launch of the XUV500 last year, the Cheetah inspired XUV500 continues to win customer preference. The Company had more than 35,000 Cheetahs on the road within just one year of launch.
Strengthening the UV portfolio, the Company launched two new products – Quanto and Rexton, marking entry into two new product segments. Both the products have been very well received by the market. Rexton is already the second largest selling product in its category.
With the aim of strengthening its product portfolio and entering new segments, your Company has successfully launched many new products over the past three years. As a result, the Company’s share of the Indian Automotive market stood at 13.2% in 2012-13 as compared to 11.5% in the previous year.
In the overseas market, your Company registered a volume growth of 11.2% over the previous year. This growth was driven by volume growth in SAARC, Chile and South Africa. During the year under review, your Company sold 30,231 vehicles [including 209 vehicles sourced from Mahindra Navistar Automotives Limited {renamed as Mahindra Trucks and Buses Limited (“MTBL”) with effect from 4th June 2013}] and 2,225 three-wheelers in the overseas market as compared to 25,628 vehicles (including 157 vehicles sourced from MTBL)and 3,548 three-wheelers in the previous year.
Spare parts sales for the year stood at Rs. 1,190.30 crores (including exports of Rs. 90.30 crores) as compared to Rs. 873.99 crores (including exports of Rs. 55.47 crores) in the previous year, registering a growth of 36.2%.
Farm Division:
Your Company’s Farm Division (including Swaraj Division) recorded sales of 2,24,844 tractors as against 2,36,666 tractors sold in the previous year, recording a decline of 5%.
MAHINDRA & MAHINDRA LIMITED
17
In the Financial Year 2013, there was a 1.7% decline in the domestic tractor industry, after three years of double digit growth. The domestic industry recorded sales of 5,25,970 tractors as compared to 5,35,210 tractors in the previous year.
The industry decline was greater in the Southern States, where your Company commands a comparatively greater market share. Against this background, your Company achieved domestic sales of 2,12,555 tractors as compared to 2,22,944 tractors in the previous year, a decline of 4.7%. Your Company continues to enjoy a market share of 40.2% making it the market leader for the 30th consecutive year.
Your Company achieved tractor exports of 12,289 tractors as compared to 13,722 tractors exported in the previous year, which is 10.4% lower compared with the previous year. The decline was primarily on account of industry decline in markets of Sri Lanka and Bangladesh, with growing exports to Mahindra USA, Inc. and Africa bridging some of the shortfall.
Beyond agriculture, in the power generation space under the Mahindra Powerol Brand, your Company achieved gross revenue of over Rs. 1,000 crores. The last time that Mahindra Powerol crossed this threshold was in 2010, mainly on account of the growth in the telecom segment. This achievement in Financial Year 2013 was despite telecom segment DG sales accounting for only 19% of revenues currently, as compared with 58% in Financial Year 2010. While retaining its leadership position in the genset market catering to the telecom space, your Company has become the No. 2 player in retail for lower kVA.
Mahindra Defence Systems (MDS) Division:
Your Company, through Mahindra Defence Systems Division (“MDS”), is engaged in two businesses – a) Mahindra Defence Naval Systems (“MDNS”) and b) Mahindra Special Services Group (“MSSG”).
Mahindra Defence Naval Systems:
The MDNS provides weapons, sub-systems and components to the Navy, Ordnance Factories and the Defence Research & Development Organisation and Defence Public Sector Undertakings viz. Bharat Electronics Limited/Bharat Dynamics Limited. Among the major products being supplied are (i) the Triple Tube Torpedo Launcher which is fitted on board Indian Naval ships to counter attacking submarines by firing a torpedo at them, (ii) Anti Torpedo Decoy Launcher which launches a decoy to deceive an attacking torpedo and (iii) other components for the Ordnance Factories which go into Naval and Army weapon systems.
Pursuant to an approval accorded by the Shareholders by way of Postal Ballot on 4th April 2009, this business has been hived off into a wholly owned subsidiary viz. Mahindra Defence Naval Systems Private Limited with effect from 1st June 2012.
Mahindra Special Services Group:
The Special Services Group business of your Company provides Corporate Security Risk Management Consultancy services, assisting organisations to maintain their competitive edge by protecting information, physical and personnel assets. During the year, the Special Services Group has posted growth in the areas of Governance & Fraud Risk Management vertical and also launched its training services vertical by setting up the Information Assurance and Homeland Security Academy which aims at providing functional training in these areas.
Management Discussion and Analysis ReportA detailed analysis of the Company’s performance is discussed in the Management Discussion and Analysis Report, which forms part of this Annual Report.
Corporate GovernanceYour Company has a rich legacy of ethical governance practices many of which were implemented by the Company, even before they were mandated by law. Your Company is committed to transparency in all its dealings and places high emphasis on business ethics.
A Report on Corporate Governance alongwith a Certificate from the Statutory Auditors of the Company regarding compliance with the conditions of Corporate Governance as stipulated under Clause 49 of the Listing Agreement form part of this Annual Report.
FinanceThe headwinds of the previous year continued to slow global growth during the Financial Year 2012-13. The recovery was tentative in US and Europe continued to be under the overhang of recession, with a new banking crisis in Cyprus adding to the Eurozone troubles. The emerging markets also slowed down, causing concerns about a protracted low growth environment.
On the domestic front, tight liquidity conditions prevailed throughout the year. Despite RBI cutting the Repo rate by 100 bps in several instalments, short term interest rates remained at elevated levels in view of shortfall in liquidity.
18
Weak exports and Current Account Deficit worsened the situation, impacting the exchange rate scenario. As a result, the Indian Rupee continued to remain volatile during the period. In these difficult financial conditions, your Company, with its good credit standing and strong underlying Corporate Governance principles, enjoyed privileged access to liquidity and competitive pricing.
Your Company continued to focus on managing cash efficiently and ensured that it had adequate liquidity in its books at all times, along with strong back up lines of credit. During the course of the year, your Company repaid long term loan instalments amounting to Rs. 380.73 crores on due dates from internal accruals. The Consortium of Bankers continues to rate your Company as a prime customer and extends facilities/services at prime rates.
Your Company follows a prudent financial policy and aims to maintain optimum financial gearing at all times. The Company’s total Debt to Equity Ratio was 0.24 as at 31st March 2013.
In an environment of financial stress and rating downgrades, your Company continues to enjoy prime credit rating with CRISIL Limited (“CRISIL”), ICRA Limited (“ICRA”) and Credit Analysis & Research Limited (“CARE”). These organisations have all re-affirmed the highest safety rating of A1+ for your Company’s Short Term facilities and high safety rating for its Long Term Banking facilities. CRISIL maintains a rating of “CRISIL AA+/Stable”, ICRA maintains a rating of “[ICRA] AA+ (stable)” and CARE maintains a rating of “CARE AA+”.
Investor Relations
In line with the best practices aimed at fostering improved investor relations, your Company engaged with investors in many ways, including one on one meetings, attendance at investor conferences, regular quarterly earnings calls and annual analyst meet during the year. New technology, including telepresence and webcasting enabled your Company to reach out to a large number of investors. Your Company interacted with over 550 Indian and overseas investors and analysts from a wide cross section of the investment universe during the year. Several investor/analyst interactions with the Chairman & Managing Director and Business Heads were organised during the year. Your Company won top awards/ranking in various investor relations categories from Thomson Reuters Extel Survey for 2011 (awarded in June 2012) and from
Institutional Investor, Asia, for the year 2012. A user friendly investor relations page on the Company’s Corporate Website ensures the benefit of easy access to relevant information for investors.
Acquisitions and other matters
(1) Buyout of Navistar Inc.’s stake in Truck and Engine Joint Venture
In November 2005, your Company along with Navistar Inc. and its affiliates had entered into a Joint Venture Agreement and set up Mahindra Navistar Automotives Limited [renamed Mahindra Trucks and Buses Limited (“MTBL”) with effect from 4th June 2013] in which your Company held 51% of the Equity Share Capital. Navistar Inc. along with its affiliates held 49% of the Equity Share Capital. Additionally, in November 2007, your Company along with Navistar Inc. and its affiliates had entered into a Joint Venture Agreement and set up Mahindra Navistar Engines Private Limited [renamed Mahindra Heavy Engines Private Limited (“MHEPL”) with effect from 4th June 2013]. Here too your Company held 51% of the Equity Share Capital and Navistar Inc. along with its affiliates held 49% of the Equity Share Capital.
As a part of its own strategy, Navistar Inc. decided to exit both its Joint Ventures in India. Given the strategic importance of these Joint Ventures, your Company decided to buy out the respective stakes of Navistar Inc. and its affiliates in both MTBL and MHEPL for a total consideration of approximately Rs. 173 crores, thereby making MTBL and MHEPL wholly owned subsidiaries of your Company. These transactions were completed in February 2013.
(2) Rights Issue of EPC Industrie’ Limited
During the year, EPC Industrie’ Limited (“EPC”), a subsidiary of your Company engaged in the business of manufacturing and marketing micro irrigation systems, successfully completed its Rights Issue. The proceeds of the issue will be utilised towards funding the procurement of plant and machinery, working capital requirements and for general corporate purposes.
(3) Buyout of BAE Systems Plc. stake in Land Systems Joint Venture
Your Company had entered into a Joint Venture with BAE Systems Plc. in Defence Land Systems India Private
MAHINDRA & MAHINDRA LIMITED
19
Limited (“DLSI”) wherein the Company held 74% in the Equity Share Capital of DLSI and the balance 26% was held by BAE Systems Plc.
The scope of the Joint Venture included development of land systems technical capabilities and products for the Indian armed forces, para-military forces and homeland security. On account of developments in both the industry environment and customer procurement frameworks, Mahindra Defence Systems Limited, a wholly owned subsidiary of the Company, decided to purchase the entire shareholding of BAE Systems Plc. in DLSI, thereby making DLSI a wholly owned subsidiary of your Company.
(4) Joint Venture with Telephonics Corporation
Your Company, in venturing into the Defence Sector, had also been exploring opportunities for partnerships with companies with globally proven high end defence technologies. In pursuance of the same in August 2012 your Company entered into a Joint Venture Agreement with Telephonics Corporation, which will provide the Indian Ministry of Defence and the Indian Civil Sector with radar and surveillance systems, Identification Friend or Foe devices and communication systems. In addition, this Joint Venture intends to provide systems for Air Traffic Management services, Homeland Security and other emerging surveillance requirements. Telephonics Corporation, is a leading US based designer, developer and manufacturer of high-technology integrated information, communication and sensor system solutions to military and commercial markets worldwide and a subsidiary of Griffon Corporation. The Joint Venture company has been incorporated in this respect, named as ‘Mahindra Telephonics Integrated Systems Limited’, in which your Company holds 74% stake through its wholly owned subsidiary company Mahindra Defence Systems Limited and the balance 26% is held by Telephonics Corporation.
(5) ‘Offer for Sale’ of shares held in Mahindra Holidays & Resorts India Limited
The Department of Economic Affairs of the Ministry of Finance by its notifications dated 4th June 2010 and 9th August 2010, increased the minimum public holding requirement for listed companies from 10% to 25% of their total paid-up capital. All public listed companies in India (excluding public sector companies) were required
to reduce their promoter holding to a minimum level of 75% by June 2013.
Your Company held 82.69% in Mahindra Holidays & Resorts India Limited (“MHRIL”). In compliance with the above notification, your Company, as promoter and holding Company of MHRIL, sold an aggregate of 34,00,000 Equity Shares of Rs. 10 each representing 4.02% of the then Equity Share Capital of MHRIL during the year under review. This was done through an ‘Offer for Sale of Shares by Promoters through the Stock Exchange Mechanism’ on the separate window provided by the Stock Exchanges for this purpose, in accordance with the Securities and Exchange Board of India Circulars.
After the end of the Financial Year, MHRIL allotted 41,41,084 Equity Shares of Rs. 10 each on 12th April 2013 to successful applicants under the Institutional Placement Programme in terms of Chapter VIII-A of the Securities and Exchange Board of India (Issue of Capital and Disclosure Requirements) Regulations, 2009, as amended.
The shareholding of your Company in MHRIL therefore stands reduced to 75%.
(6) Further Equity Investment in Ssangyong Motor Company
Subsequent to the year end, Ssangyong Motor Company, a subsidiary of the Company (“SYMC”) made a third party allotment by way of a Preferential Issue of 1,45,45,455 Equity Shares to your Company at an issue price of 5,500 Korean Won per share for an amount aggregating around 80 billion Korean Won, resulting into an increase in the shareholding of your Company in SYMC from 69.63% to 72.85%. The said issue will facilitate improvement of the financial structure of SYMC and proceeds of the issue will be utilised by SYMC for new product development and strengthening its competitiveness.
Stock Options
During the year under review, on the recommendation of the Governance, Remuneration and Nomination Committee of your Company, the Trustees of the Mahindra & Mahindra Employees’ Stock Option Trust have granted 5,65,094 Stock Options to Eligible Employees under the Mahindra &
20
Mahindra Limited Employees Stock Option Scheme – 2010. Further, 20,000 Stock Options have also been granted under the Mahindra & Mahindra Limited Employees Stock Option Scheme – 2000.
Details required to be provided under the Securities and Exchange Board of India (Employee Stock Option Scheme and Employee Stock Purchase Scheme) Guidelines, 1999 are set out in Annexure I to this Report.
Industrial Relations
A cordial Industrial Relations environment prevailed at all the manufacturing units across the Company during the year under review except for a wrinkle, when workmen at the Igatpuri plant went on a ‘tool down’ for 13 days starting from 9th April 2013 to 21st April 2013. This however did not affect the production schedule of the plant.
Employees are the Company’s vital and most valuable assets. Your Company has focussed on propagating proactive and employee centric shop floor practices, quick grievance resolution mechanisms and alignment to overall business goals, thus ensuring that there was no loss of production in the Financial Year 2013. As a result of propagating employee engagement as a business imperative, Financial Year 2013 recorded the highest production figures in the history of the Company.
Over the last few years, your Company has placed significant emphasis on enhancing capabilities at the shop floor, beyond merely technical skills. Operators are trained and encouraged to generate ideas for resolving quality concerns, reducing cost, improving safety and efficiency. For the year under review, the workmen generated over 19 ideas per person towards this cause.
Safety, Occupational Health and Environment
Your Company has a well-established Safety, Occupational Health & Environmental Policy (“SH&E Policy”) in line with the National Safety, Occupational Health & Environmental Policy.
The safety and occupational health of employees is a major area of focus for the Company. The SH&E Policy, inter alia, covers the safety of all stakeholders, ensures compliance on a monthly basis and imparts necessary education and training to all employees and stakeholders. External surveillance audits of the facilities as per legal and other requirements are conducted regularly. Internal and external medical check-ups of employees and contractors are conducted.
Road Safety Week, National Safety Week, Fire Service Day and World Environment Day are celebrated. Behavioural Based Safety (“BBS”) observations, small group working, Safety Inspection alongwith Safety awareness training with benchmarks on overall safety performance are conducted. Your Company’s plants organise Occupational Health Examination Camps, medical check-ups, consultation and counselling, etc. for the employees’ well being.
Your Company tracks the objectives and targets laid out in the road map of the triple bottom line approach. Various green projects have been implemented by your Company in the areas of abatement of air pollution, recycling and reduction of water and Solid Waste Management in accordance with world class Green supply chain standards. Your Company’s commitment to the environment stems from the Mahindra Group’s abiding concern for all stakeholders of society.
All plants of the Automotive Division have been certified for ISO 14001: 2004 & OHSAS 18001: 2007 (“amended standards”). An External Audit for Safety, Occupational Health and Environment is conducted every year and all the Company’s plants of the Automotive Division have been certified during the year 2012-13.
Corporate Social Responsibility
Mahindra’s Corporate Social Responsibility (“CSR”) is committed to ‘building possibilities’ for socially and economically disadvantaged communities to enable them to ‘RISE’ above their limiting circumstances.
Some of the major initiatives the Company has undertaken in India during the Financial Year 2013 are described below:
A. Project Nanhi Kali
Nanhi Kali, which supports the education of the disadvantaged girl child, has been the flagship programme of the K. C. Mahindra Education Trust (“KCMET”) since 1996. The Nanhi Kali sponsorship provides underprivileged girls with academic support classes where concepts of Maths, Science and Language are taught to the girls. In addition, the girls are provided with material support including uniforms, school bags, shoes, socks and stationery which allow them to attend school with dignity. In the Financial Year 2013, 7,414 individuals and corporates donated Rs. 22.65 crores to the Nanhi Kali Project, enabling the Project to support the education of 78,338 underprivileged
MAHINDRA & MAHINDRA LIMITED
21
girls across 9 states of India. The largest donor is the Mahindra Group, which supports the education of 29,702 Nanhi Kalis. This initiative has had a significant impact in terms of increase in learning outcomes by 10% and curtailing drop out of girls from school to less than 10%.
B. Mahindra Pride Schools
The Mahindra Pride Schools through their one-of-a-kind livelihood training programmes continue to take forward their vision to completely transform youth from socially disadvantaged communities by training and placing them in high growth service sector careers. The last Financial Year witnessed the setting up of the 5th Mahindra Pride School in Srinagar in October 2012, where the 1st batch of students braved extreme weather and socio-political unrest to complete their training and are now ready to be placed. In the Financial Year 2013, a total of 2,605 Scheduled Caste/Scheduled Tribe students received intensive training at the 5 Mahindra Pride Schools in Pune, Chennai, Patna, Chandigarh and Srinagar. Areas of training included Hospitality Craft, Information Technology Enabled Services (ITES – for BPOs and KPOs) and Customer Relationship Management. The total number of Mahindra Pride School students trained till date is 5,666. Post training, the Mahindra Pride School students have been recruited by food chains such as McDonald’s, Pizza Hut, KFC and Café Coffee Day, 5 star Hotels such as Hotel Le Meridien, Department Stores such as Westside, Mom & Me and BPOs & KPOs such as Bajaj Allianz, Syntel, HCL, TCS, Dell, Cognizant, Tech Mahindra and Mphasis. There has been 100% placement of students in lucrative jobs and a consistent increase in average salary per batch. The average salary is currently over Rs. 10,000 per month.
C. Scholarships and Grants
1. Mahindra All India Talent Scholarships
Instituted in 1995, Mahindra All India Talent Scholarships (“MAITS”) are awarded to students from lower socio economic strata to enable them to pursue a job oriented diploma course at a recognised Government Polytechnic Institute in India. Approximately 500 scholarships are given every year to students who undergo a three year course. In the Financial Year 2013, 550 students were awarded the MAITS leading to a disbursement of Rs. 91.43
lakhs. MAITS has been awarded to 6,354 students till date.
2. K. C. Mahindra Scholarships for Post-Graduate studies abroad
The K. C. Mahindra Scholarship for Post-Graduate studies abroad (instituted in the year 1956) is an interest free loan scholarship awarded to deserving graduates interested in pursuing their post-graduate studies overseas. In the Financial Year 2013, 44 students were awarded a scholarship of Rs. 2 lakhs each. Recipients will be doing their post-graduation in a wide range of subjects like Computer Science and Engineering, Mechanical Engineering, Electrical Engineering, Chemical Engineering, Economics and Law and had received admission in renowned universities like Harvard Business School, Yale, Stanford, Massachusetts Institute of Technology, Carnegie Mellon, London School of Economics, etc. Further, the K. C. Mahindra Fellows Fund awarded scholarships of Rs. 24 lakhs to the top 3 candidates (a maximum scholarship of Rs. 8 lakhs each). The total number of scholarships given till date is 1,070.
3. K. C. Mahindra United World Colleges (“UWC”) Scholarships
Till date 86 students have benefited from the K. C. Mahindra UWC Scholarship enabling them to study at the United World Colleges, and in particular, the Mahindra United World College. KCMET has disbursed a total of Rs. 655.31 lakhs in the form of these scholarships. During the Financial Year 2013, 12 students were given scholarships amounting to a disbursement of Rs. 69.31 lakhs.
4. Mahindra Search for Talent Scholarship
This scholarship which rewards excellence in academics has been set up in 35 institutions in India. In addition, students who receive the Mahindra Search for Talent Scholarship for two consecutive years also receive the Honours Scholarship Award comprising a cash prize of Rs. 5,000 and a citation from the Trust.
Employee Social Options
Esops stands for Employee Social Options. Esops is a platform offering employees a set of social work volunteering options.
22
These options are created and implemented exclusively by employees themselves based on the needs of underprivileged communities in and around their areas of operation. In a way, it is each employee’s CSR initiative.
Esops enables the workforce to collectively donate thousands of human hours for various social projects, in the three focussed areas of Education, Health and Environment, making social work an integral part of everyone’s lives. In this manner Esops enables our employees to give not just their wealth but also their time. To fund these employee initiatives, each Sector of the Company donates 0.5% of its profit after tax to the Central CSR fund and 0.5% to Esops.
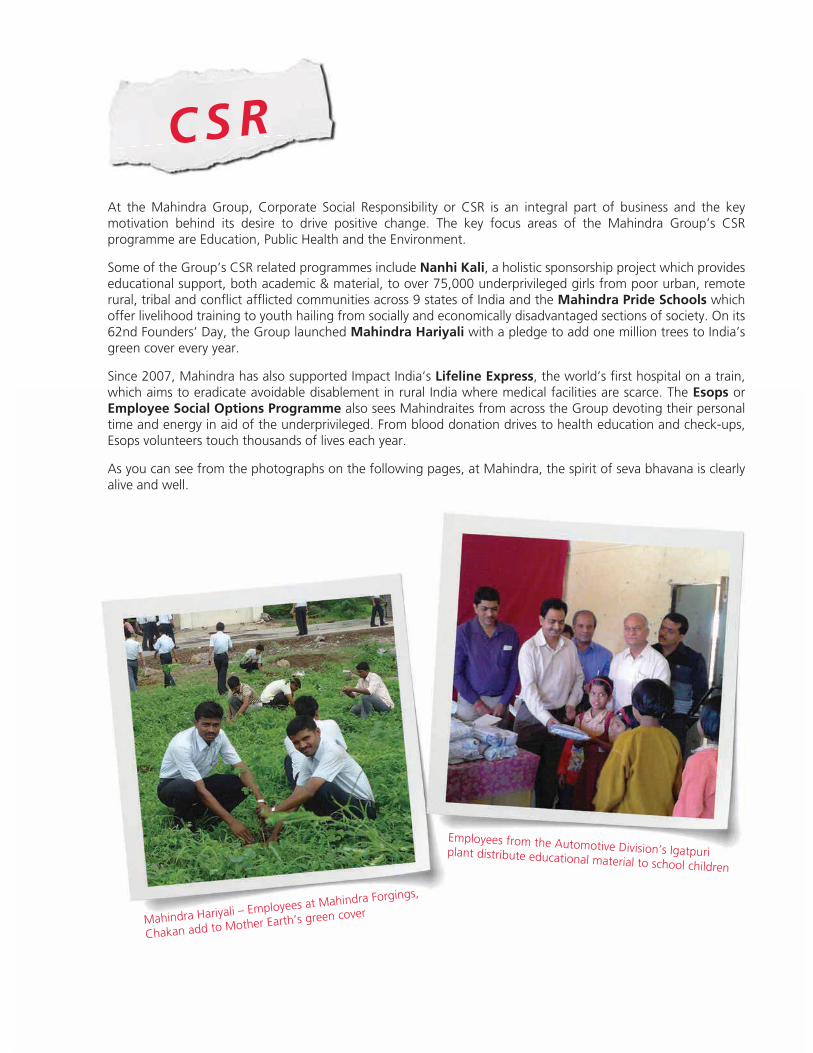
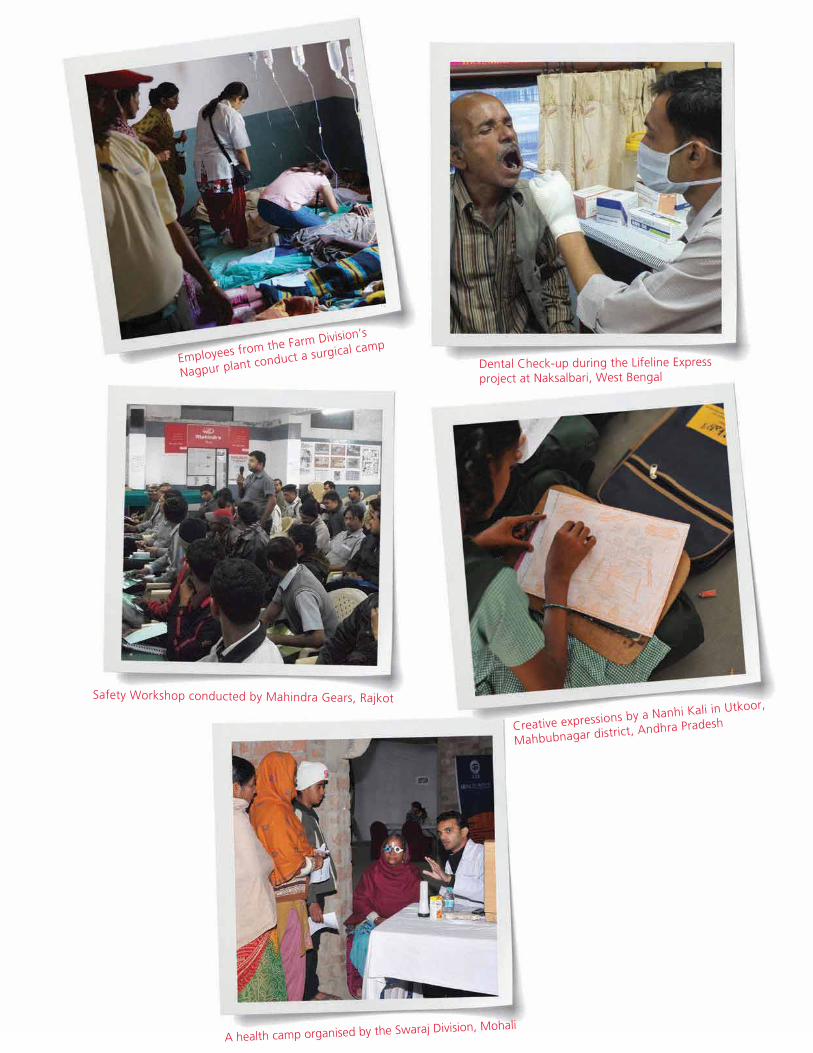
Some notable Esops initiatives during the year were the Lifeline Express at Puri in Odisha and at Naksalbari in West Bengal where a total of 4,219 patients were treated by performing surgeries, giving medicines and distribution of aids and appliances free of cost. Another notable initiative was Mahindra Hariyali where the 1 million tree plantation target was surpassed by planting more than 1.7 million trees. Esops Awards – 2012, Esops Star Performers Awards, Group level Esops Champions Meet were organised to motivate employees and ensure their maximum participation in Esops.
The other Esops activities included numerous initiatives in the fields of Education, Health, Environment, etc. which had a short term as well as a long term impact on the beneficiaries and society at large.
Esops is also a culture that the Mahindra Group has cultivated as an ethic. The Esops platform and a set of structures and protocols have been created, to make it easier and possible for every employee, who wishes to make a contribution to society, to do so.
‘Sustainability’ Initiatives
During the year under review, the 5th Sustainability Report for the year 2011-12 was released and it received a GRI rating of ‘A+’ (like the earlier four Reports). The external assurance of the Report was carried out by KPMG.
Your Company is now five years into its ‘Sustainability’ journey. Resource efficiency and social commitment continue to be important drivers of profitable growth. The focus on the Environmental, Social and Governance (“ESG”) parameters continues, and year on year, initiatives taken in the previous years are consolidated and new ones are taken
up. Several projects for water management and conservation and continuous improvement in energy conservation were undertaken, resulting in reduced consumption of energy and water. The Carbon footprint of Scope I, II and III GHG emissions as per the GHG protocol developed by WBCSD and WRI, was further strengthened especially for tracking indirect emissions from inbound and outbound logistics. The targets taken under the Sustainability Road Map have been surpassed in four out of the seven parameters. Complete details of the Sustainability performance for 2012-13 will be elaborated in the GRI Report which is under preparation and will be ready for release shortly.
During 2012-13, your Company’s consistent performance on the ESG dimensions has been recognised in the following ways.
The Company :
— Retained its position in the top 10 Indian Companies in the CRISIL/Standard & Poor ESG Index 2012.
— Ranked 8th out of 750 companies in South East Asia and 2nd out of 100 in India by The Asian Sustainability Rating™, a Singapore based financial research agency.
— Achieved “Sustainability Plus” GOLD Rating by CII – a first of its kind Sustainability Labeling – to reflect ESG performance of leading Indian Companies.
— Received the FE-EVI Green Business Leadership Award 2011-12 for the Automobile Sector category.
— Ranked 2nd in the India 200 Carbon Disclosure Leadership Index in 2012.
— Was invited to participate in the Dow Jones Sustainability Index 2012 for the second time.
Business Responsibility Report
In August 2012, Securities and Exchange Board of India (“SEBI”) introduced Clause 55 of the Listing Agreement, which prescribes disclosures on certain non-financial parameters. The prescribed format is the ‘Business Responsibility Report’ (“BRR”) which has to be a part of the Company’s Annual Report. This requirement is mandatory for the top 100 listed companies (based on market capitalisation) on the National Stock Exchange of India Limited and BSE Limited. In compliance with this requirement, the BRR for your Company for the year 2012-13 forms part of this Annual Report.
MAHINDRA & MAHINDRA LIMITED
23
It is clear that balancing economic growth, optimising the ecological footprint and ensuring inclusive human development will be very critical for continued growth and development. Your Company strongly believes that sustainable growth is possible only if there is ecological well-being, social equity and transparency in business. By living with its ‘Alternative Thinking’ mantra, your Company will continue to strive towards these goals.
Directors
As reported in the Annual Report for the Financial Year 2012, Mr. Keshub Mahindra relinquished his office as Chairman and Director of the Company at the conclusion of the 66th Annual General Meeting of the Shareholders held on 8th August 2012. As a tribute to his unparalled contribution to the cause and growth of the organisation and his immense leadership qualities, Mr. Keshub Mahindra has been made the Company’s Chairman Emeritus.
Consequent to the above mentioned Board level change, Mr. Anand G. Mahindra was elevated to the position of Chairman and designated as Chairman & Managing Director of the Company with effect from the conclusion of the 66th Annual General Meeting of the Shareholders held on 8th August 2012.
Pursuant to the recommendation of the Governance, Remuneration and Nomination Committee, the Board at its Meeting held on 25th October 2012 appointed Mrs. D. Vijayalakshmi, Executive Director Investment – Risk Management & Research of LIC, as an Additional Director of the Company representing Life Insurance Corporation of India (“LIC”), in place of Mr. Arun Kanti Dasgupta who ceased to be a Director of the Company with effect from 9th August 2011. She was to hold the office of Director up to the date of the ensuing Annual General Meeting of the Company.
However, the Company received an intimation from LIC on 10th June 2013, informing that Mrs. Vijayalakshmi has resigned from the Board of the Company with effect from 5th June 2013.
The Board places on record its sincere appreciation of the valuable services rendered by Mrs. Vijayalakshmi during her tenure as a Director of the Company.
Pursuant to the provisions of section 256 of the Companies Act, 1956, Dr. A. S. Ganguly, Director of the Company, retires by rotation at the forthcoming Annual General Meeting
scheduled to be held on 13th August 2013. Dr. Ganguly has expressed his desire not to seek re-appointment. It is proposed not to fill up the vacancy thereby caused.
The Board placed on record its deep appreciation of the invaluable counsel rendered by Dr. Ganguly to the Company and his contribution in guiding and supporting the management during his tenure as an Independent Director on the Board of Directors of the Company. His inputs were valuable across all functions of the Company, but in particular, his mentoring of the Board’s Research & Development Committee was especially appreciated by the Company’s Management.
Quote from Chairman Emeritus
“Dr. Ganguly joined the Board in August 1997. Ever since his induction on the Board, he has imparted considerable value to the deliberations at the Meetings of the Board and those of the Research & Development Committee, of which he was the Chairman and the Strategic Investment Committee, of which he was a Member.
In his long association with the Mahindras, I reminisce of him having given a strong momentum to the Company’s R&D efforts, his persistence on having a clear R&D strategy and in guiding the management to have a brutal focus on new product design and development.
These notable contributions have enabled the Company to keep itself in pace with the ever changing tastes and preferences of customers, outperform its peers and maintain a leadership position in the otherwise fiercely competitive auto industry.“
Mr. Anand G. Mahindra, Mr. Nadir B. Godrej and Mr. Anupam Puri retire by rotation and, being eligible, offer themselves for re-appointment.
Directors’ Responsibility Statement
Pursuant to section 217(2AA) of the Companies Act, 1956, your Directors, based on the representations received from the Operating Management, and after due enquiry, confirm that:
(i) in the preparation of the annual accounts, the applicable accounting standards have been followed;
(ii) they have, in the selection of the accounting policies, consulted the Statutory Auditors and these have been applied consistently and reasonable and prudent
24
judgments and estimates have been made so as to give a true and fair view of the state of affairs of the Company as at 31st March 2013 and of the profit of the Company for the year ended on that date;
(iii) proper and sufficient care has been taken for the maintenance of adequate accounting records in accordance with the provisions of the Companies Act, 1956 for safeguarding the assets of the Company and for preventing and detecting fraud and other irregularities;
(iv) the annual accounts have been prepared on a going concern basis.
Subsidiary Companies
The subsidiary companies of your Company continue to contribute to the overall growth of the Company. Major subsidiaries such as Mahindra & Mahindra Financial Services Limited with a 44% growth in its consolidated profits and Mahindra Lifespace Developers Limited with a 19% growth in its consolidated profits deserve special mention. The consolidated Group Profit for the year after exceptional items, prior period adjustments and tax and after deducting minority interests is Rs. 4,099.20 crores as against Rs. 3,126.66 crores earned in the previous year.
During the year under review, Mahindra Defence Naval Systems Private Limited, Mahindra Defence Systems Limited, Divine Heritage Hotels Private Limited, Gables Promoters Private Limited, 2 x 2 Logistics Private Limited, Holiday on Hills Resorts Private Limited, Mahindra Tractor Assembly Inc., MH Boutique Hospitality Limited, Infinity Hospitality Group Company Limited, Jiangxi Mahindra Yueda Tractor Company Limited and Mahindra Housing Private Limited became subsidiaries of your Company.
During the year under review, Mahindra (China) Tractor Company Limited and Jensand Limited ceased to be subsidiaries of your Company.
Subsequent to the year end, Mahindra Telephonics Integrated Systems Limited, Mahindra Investments (India) Private Limited and Mahindra Investments (International) Private Limited were formed as subsidiaries of your Company.
The Statement pursuant to section 212 of the Companies Act, 1956 containing details of the Company’s subsidiaries is attached.
In accordance with the General Circular issued by the Ministry of Corporate Affairs, Government of India, the Balance Sheet, Statement of Profit and Loss and other documents of the subsidiary companies are not being attached with the Balance Sheet of the Company. The Company will make available the Annual Accounts of the subsidiary companies and the related detailed information to any Member of the Company who may be interested in obtaining the same. Further, the Annual Accounts of the subsidiaries would also be available for inspection by any Member at the Head Office of the Company and at the Office of the respective subsidiary companies, during working hours upto the date of the Annual General Meeting.
Consolidated Financial Statements
The Consolidated Financial Statements of the Company and its subsidiaries, prepared in accordance with Accounting Standard AS 21 form part of this Annual Report.
The Consolidated Financial Statements presented by the Company include the financial results of its subsidiary companies, associates and joint ventures.
Auditors
Messrs Deloitte Haskins & Sells, Chartered Accountants, retire as Auditors of the Company and have given their consent for re-appointment. The Members would be required to elect Auditors for the current year and fix their remuneration.
As required under the provisions of section 224(1B) of the Companies Act, 1956, the Company has obtained a written Certificate from the above Auditors proposed to be re-appointed to the effect that their re-appointment, if made, would be in conformity with the limits specified in the said section.
Cost Auditors
As per the Order of the Central Government and in pursuance of section 233B of the Companies Act, 1956, your Company carries out an audit of its cost records. The due date for filing of the Cost Audit Report with the Ministry of Corporate Affairs for the Financial Year ended 31st March 2012, was 180 days from the closure of the Company’s Financial Year or 28th February 2013, whichever is later. The combined Cost Audit Report for the Farm Equipment Sector and Motor Vehicles for the Financial Year ended 31st March 2012 was filed on 31st January 2013 in the XBRL format. The Central Government
MAHINDRA & MAHINDRA LIMITED
25
has approved the appointment of M/s. N. I. Mehta & Co., Cost Accountants as Cost Auditors for conducting Cost Audit for the Financial Year 2012-13.
Pursuant to section 233B(2) of the Companies Act, 1956, the Board of Directors on the recommendation of the Audit Committee appointed M/s. N. I. Mehta & Co., Cost Accountants, as the Cost Auditors of the Company for the Financial Year 2013-14. M/s. N. I. Mehta & Co. have confirmed that their appointment is within the limits of section 224 (1B) of the Companies Act, 1956 and have also certified that they are free from any disqualifications specified under section 233B(5) read with section 224 and sub section (3) and sub section (4) of section 226 of the Companies Act, 1956.
The Audit Committee has also received a Certificate from the Cost Auditors certifying their independence and arm’s length relationship with the Company.
Public Deposits and Loans/Advances
Out of the total 7,241 deposits of Rs. 5,295.39 lakhs from the Public and Shareholders as at 31st March 2013, 173 deposits amounting to Rs. 70.15 lakhs had matured and had not been claimed as at the end of the Financial Year. Since then, 42 of these deposits of the value of Rs. 15.48 lakhs have been claimed.
The particulars of loans/advances and investment in its own shares by listed companies, their subsidiaries, associates, etc., required to be disclosed in the Annual Accounts of the Company pursuant to Clause 32 of the Listing Agreement are furnished separately.
Current Year
During the period 1st April 2013 to 9th June 2013, 69,301 vehicles were despatched as against 65,063 vehicles during the corresponding period in the previous year. During the same period, 51,373 tractors were despatched as against 42,450 tractors despatched during the corresponding period in the previous year.
Looking forward, your Company expects the Indian economy to stage a mild, consumption-led recovery in the current year. Subject to a normal monsoon, as forecast by the Indian Meteorological Department, agricultural growth is likely to see considerable improvement in 2013-14, leading to a steady moderation in inflation and a bounce back in rural incomes, and consumer demand. At the same time, supported by a weakened currency and steady growth recovery in the US, export volumes may also gain momentum through the year. Private investment demand, however, is likely to remain weak, with a significant pick up contingent on concerted policy action by the Government.
Energy Conservation, Technology Absorption and Foreign Exchange Earnings and Outgo
Particulars required to be disclosed under the Companies (Disclosure of Particulars in the Report of Board of Directors) Rules, 1988 are set out in Annexure II to this Report.
Particulars of Employees
The Company had 229 employees who were in receipt of remuneration of not less than Rs. 60,00,000 during the year ended 31st March 2013 or not less than Rs. 5,00,000 per month during any part of the said year. However, as per the provisions of section 219(1)(b)(iv) of the Companies Act, 1956, the Directors’ Report and Accounts are being sent to all the Members of the Company excluding the Statement of particulars of employees. Any Member interested in obtaining a copy of the Statement may write to the Company Secretary, whereupon a copy would be sent.
For and on behalf of the Board
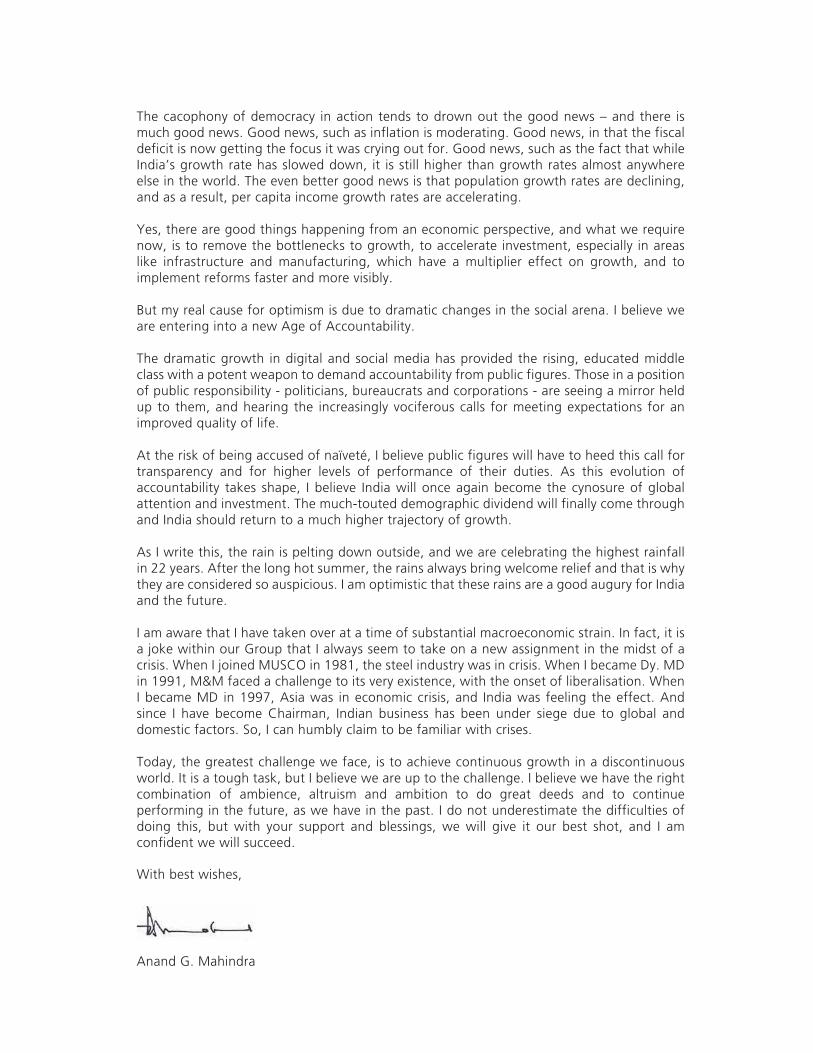
ANAND G. MAHINDRAChairman & Managing Director
Mumbai, 10th June 2013
26
ANNEXURE I TO THE DIRECTORS’ REPORT FOR THE YEAR ENDED 31ST MARCH 2013
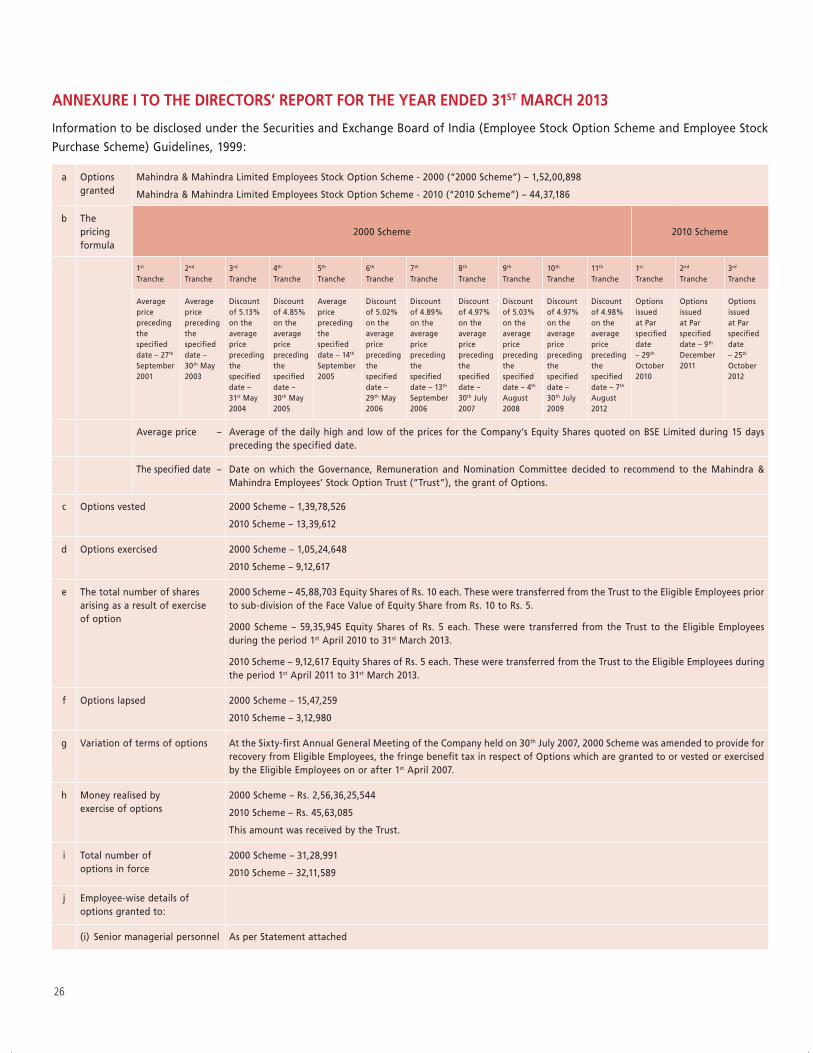
Information to be disclosed under the Securities and Exchange Board of India (Employee Stock Option Scheme and Employee Stock Purchase Scheme) Guidelines, 1999:
a Options granted
Mahindra & Mahindra Limited Employees Stock Option Scheme - 2000 (“2000 Scheme”) – 1,52,00,898
Mahindra & Mahindra Limited Employees Stock Option Scheme - 2010 (“2010 Scheme”) – 44,37,186
b The pricing formula
2000 Scheme 2010 Scheme
1st Tranche
2nd Tranche
3rd Tranche
4th Tranche
5th Tranche
6th Tranche
7th Tranche
8th Tranche
9th Tranche
10th Tranche
11th Tranche
1st Tranche
2nd Tranche
3rd Tranche
Average price preceding the specified date – 27th September 2001
Average price preceding the specified date – 30th May 2003
Discount of 5.13% on the average price preceding the specified date – 31st May 2004
Discount of 4.85% on the average price preceding the specified date – 30th May 2005
Average price preceding the specified date – 14th September 2005
Discount of 5.02% on the average price preceding the specified date – 29th May 2006
Discount of 4.89% on the average price preceding the specified date – 13th September 2006
Discount of 4.97% on the average price preceding the specified date – 30th July 2007
Discount of 5.03% on the average price preceding the specified date – 4th August 2008
Discount of 4.97% on the average price preceding the specified date – 30th July 2009
Discount of 4.98% on the average price preceding the specified date – 7th August 2012
Options issued at Par specified date – 29th October 2010
Options issued at Par specified date – 9th December 2011
Options issued at Par specified date – 25th October 2012
Average price – Average of the daily high and low of the prices for the Company’s Equity Shares quoted on BSE Limited during 15 days preceding the specified date.
The specified date – Date on which the Governance, Remuneration and Nomination Committee decided to recommend to the Mahindra & Mahindra Employees’ Stock Option Trust (“Trust”), the grant of Options.
c Options vested 2000 Scheme – 1,39,78,526
2010 Scheme – 13,39,612
d Options exercised 2000 Scheme – 1,05,24,648
2010 Scheme – 9,12,617
e The total number of shares arising as a result of exercise of option
2000 Scheme – 45,88,703 Equity Shares of Rs. 10 each. These were transferred from the Trust to the Eligible Employees prior to sub-division of the Face Value of Equity Share from Rs. 10 to Rs. 5.
2000 Scheme – 59,35,945 Equity Shares of Rs. 5 each. These were transferred from the Trust to the Eligible Employees during the period 1st April 2010 to 31st March 2013.
2010 Scheme – 9,12,617 Equity Shares of Rs. 5 each. These were transferred from the Trust to the Eligible Employees during the period 1st April 2011 to 31st March 2013.
f Options lapsed 2000 Scheme – 15,47,259
2010 Scheme – 3,12,980
g Variation of terms of options At the Sixty-first Annual General Meeting of the Company held on 30th July 2007, 2000 Scheme was amended to provide for recovery from Eligible Employees, the fringe benefit tax in respect of Options which are granted to or vested or exercised by the Eligible Employees on or after 1st April 2007.
h Money realised by exercise of options
2000 Scheme – Rs. 2,56,36,25,544
2010 Scheme – Rs. 45,63,085
This amount was received by the Trust.
i Total number of options in force
2000 Scheme – 31,28,991
2010 Scheme – 32,11,589
j Employee-wise details of options granted to:
(i) Senior managerial personnel As per Statement attached
MAHINDRA & MAHINDRA LIMITED
27
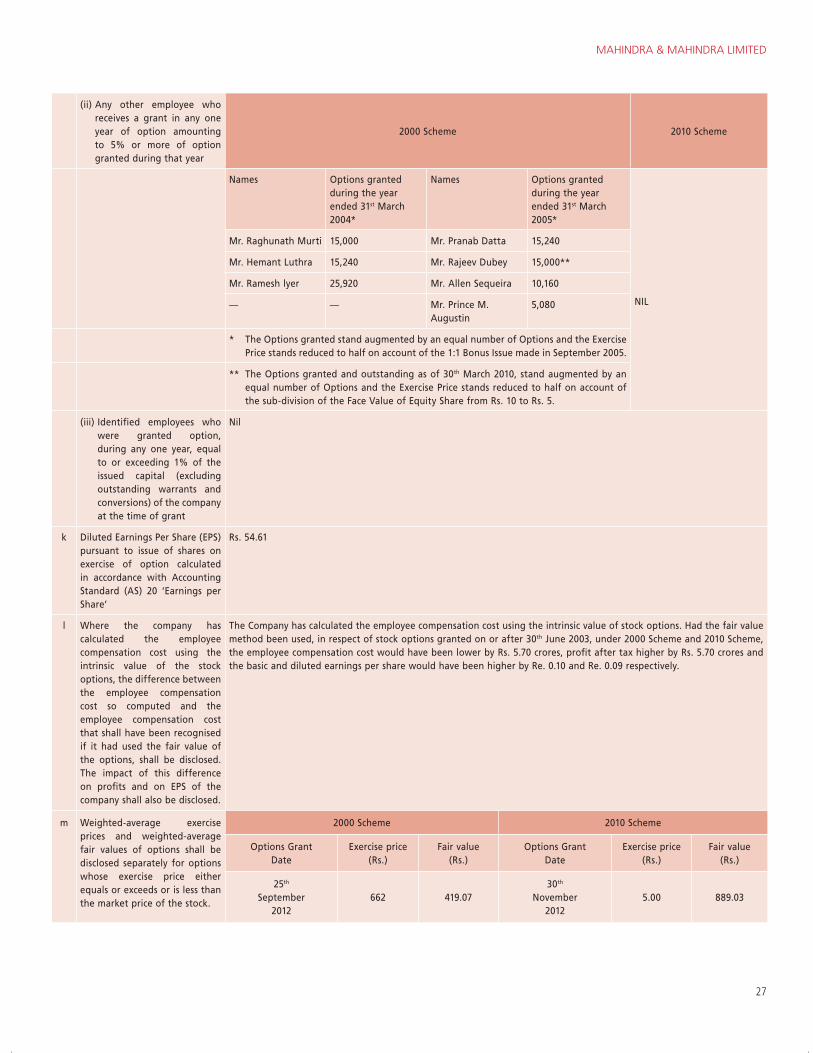
(ii) Any other employee who receives a grant in any one year of option amounting to 5% or more of option granted during that year
2000 Scheme 2010 Scheme
Names Options granted during the year ended 31st March 2004*
Names Options granted during the year ended 31st March 2005*
NIL
Mr. Raghunath Murti 15,000 Mr. Pranab Datta 15,240
Mr. Hemant Luthra 15,240 Mr. Rajeev Dubey 15,000**
Mr. Ramesh lyer 25,920 Mr. Allen Sequeira 10,160
— — Mr. Prince M. Augustin
5,080
* The Options granted stand augmented by an equal number of Options and the Exercise Price stands reduced to half on account of the 1:1 Bonus Issue made in September 2005.
** The Options granted and outstanding as of 30th March 2010, stand augmented by an equal number of Options and the Exercise Price stands reduced to half on account of the sub-division of the Face Value of Equity Share from Rs. 10 to Rs. 5.
(iii) Identified employees who were granted option, during any one year, equal to or exceeding 1% of the issued capital (excluding outstanding warrants and conversions) of the company at the time of grant
Nil
k Diluted Earnings Per Share (EPS) pursuant to issue of shares on exercise of option calculated in accordance with Accounting Standard (AS) 20 ‘Earnings per Share’
Rs. 54.61
l Where the company has calculated the employee compensation cost using the intrinsic value of the stock options, the difference between the employee compensation cost so computed and the employee compensation cost that shall have been recognised if it had used the fair value of the options, shall be disclosed. The impact of this difference on profits and on EPS of the company shall also be disclosed.
The Company has calculated the employee compensation cost using the intrinsic value of stock options. Had the fair value method been used, in respect of stock options granted on or after 30th June 2003, under 2000 Scheme and 2010 Scheme, the employee compensation cost would have been lower by Rs. 5.70 crores, profit after tax higher by Rs. 5.70 crores and the basic and diluted earnings per share would have been higher by Re. 0.10 and Re. 0.09 respectively.
m Weighted-average exercise prices and weighted-average fair values of options shall be disclosed separately for options whose exercise price either equals or exceeds or is less than the market price of the stock.
2000 Scheme 2010 Scheme
Options Grant Date
Exercise price (Rs.)
Fair value (Rs.)
Options Grant Date
Exercise price (Rs.)
Fair value (Rs.)
25th September
2012662 419.07
30th November
20125.00 889.03
28
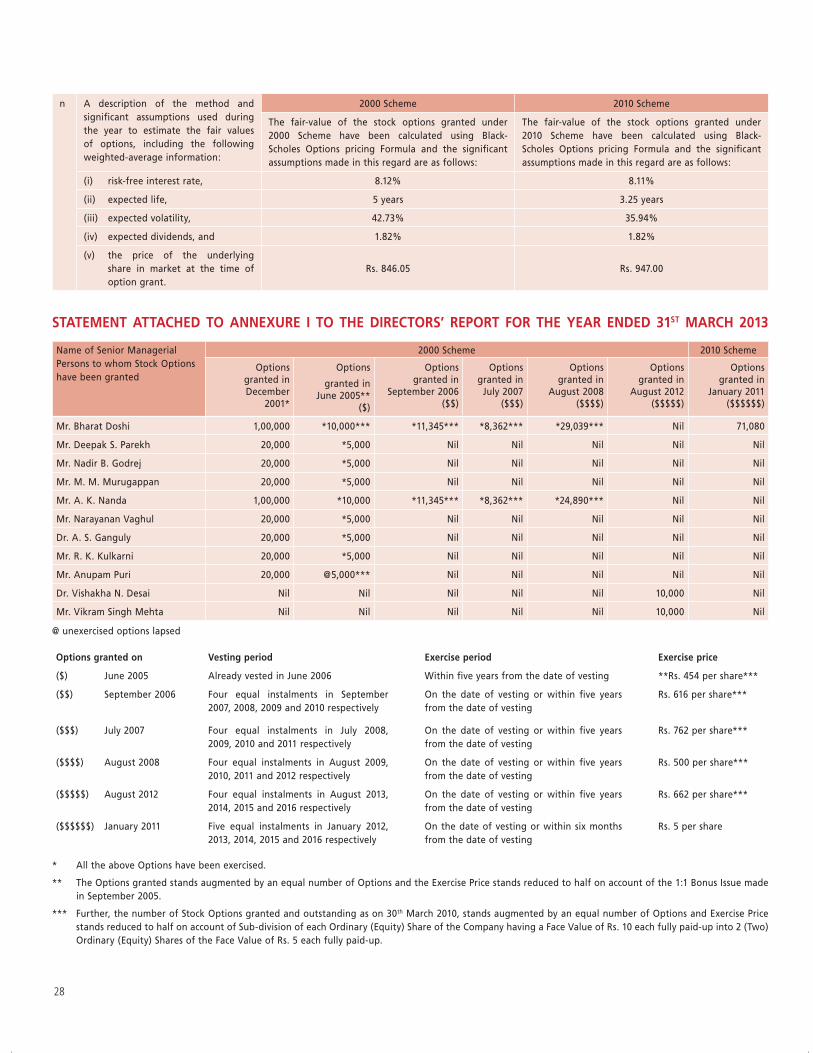
n A description of the method and significant assumptions used during the year to estimate the fair values of options, including the following weighted-average information:
2000 Scheme 2010 Scheme
The fair-value of the stock options granted under 2000 Scheme have been calculated using Black-Scholes Options pricing Formula and the significant assumptions made in this regard are as follows:
The fair-value of the stock options granted under 2010 Scheme have been calculated using Black-Scholes Options pricing Formula and the significant assumptions made in this regard are as follows:
(i) risk-free interest rate, 8.12% 8.11%
(ii) expected life, 5 years 3.25 years
(iii) expected volatility, 42.73% 35.94%
(iv) expected dividends, and 1.82% 1.82%
(v) the price of the underlying share in market at the time of option grant.
Rs. 846.05 Rs. 947.00
STATEMENT ATTACHED TO ANNEXURE I TO THE DIRECTORS’ REPORT FOR THE YEAR ENDED 31ST MARCH 2013
Name of Senior Managerial Persons to whom Stock Options have been granted
2000 Scheme 2010 Scheme
Options granted in December
2001*
Options
granted in June 2005**
($)
Options granted in
September 2006 ($$)
Options granted in
July 2007 ($$$)
Options granted in
August 2008($$$$)
Options granted in
August 2012 ($$$$$)
Options granted in
January 2011 ($$$$$$)
Mr. Bharat Doshi 1,00,000 *10,000*** *11,345*** *8,362*** *29,039*** Nil 71,080
Mr. Deepak S. Parekh 20,000 *5,000 Nil Nil Nil Nil Nil
Mr. Nadir B. Godrej 20,000 *5,000 Nil Nil Nil Nil Nil
Mr. M. M. Murugappan 20,000 *5,000 Nil Nil Nil Nil Nil
Mr. A. K. Nanda 1,00,000 *10,000 *11,345*** *8,362*** *24,890*** Nil Nil
Mr. Narayanan Vaghul 20,000 *5,000 Nil Nil Nil Nil Nil
Dr. A. S. Ganguly 20,000 *5,000 Nil Nil Nil Nil Nil
Mr. R. K. Kulkarni 20,000 *5,000 Nil Nil Nil Nil Nil
Mr. Anupam Puri 20,000 @5,000*** Nil Nil Nil Nil Nil
Dr. Vishakha N. Desai Nil Nil Nil Nil Nil 10,000 Nil
Mr. Vikram Singh Mehta Nil Nil Nil Nil Nil 10,000 Nil
@ unexercised options lapsed
Options granted on Vesting period Exercise period Exercise price
($) June 2005 Already vested in June 2006 Within five years from the date of vesting **Rs. 454 per share***
($$) September 2006 Four equal instalments in September 2007, 2008, 2009 and 2010 respectively
On the date of vesting or within five years from the date of vesting
Rs. 616 per share***
($$$) July 2007 Four equal instalments in July 2008, 2009, 2010 and 2011 respectively
On the date of vesting or within five years from the date of vesting
Rs. 762 per share***
($$$$) August 2008 Four equal instalments in August 2009, 2010, 2011 and 2012 respectively
On the date of vesting or within five years from the date of vesting
Rs. 500 per share***
($$$$$) August 2012 Four equal instalments in August 2013, 2014, 2015 and 2016 respectively
On the date of vesting or within five years from the date of vesting
Rs. 662 per share***
($$$$$$) January 2011 Five equal instalments in January 2012, 2013, 2014, 2015 and 2016 respectively
On the date of vesting or within six months from the date of vesting
Rs. 5 per share
* All the above Options have been exercised.
** The Options granted stands augmented by an equal number of Options and the Exercise Price stands reduced to half on account of the 1:1 Bonus Issue made in September 2005.
*** Further, the number of Stock Options granted and outstanding as on 30th March 2010, stands augmented by an equal number of Options and Exercise Price stands reduced to half on account of Sub-division of each Ordinary (Equity) Share of the Company having a Face Value of Rs. 10 each fully paid-up into 2 (Two) Ordinary (Equity) Shares of the Face Value of Rs. 5 each fully paid-up.
MAHINDRA & MAHINDRA LIMITED
29
PARTICULARS AS PER THE COMPANIES (DISCLOSURE OF PARTICULARS IN THE REPORT OF BOARD OF DIRECTORS) RULES, 1988 AND FORMING PART OF THE DIRECTORS’ REPORT FOR THE YEAR ENDED 31ST MARCH 2013
(A) Conservation of Energy
Your Company has always been aware of the need for conservation of energy and natural resources and has been consciously making efforts year on year towards improving the energy performance. Energy efficiency improvement initiatives have been implemented across all the plants and offices by undertaking various energy conservation projects.
Your Company ensures strict compliance with all the statutory requirements and has taken several sustainable steps voluntarily to contribute towards better environment like:
Reduction in Sp. carbon footprint in spite of production increasing continuously.
Effective effluent and sewerage treatment, recycle and reuse of water.
Reduce, reuse, recycle of waste and eco-friendly waste disposal.
Reduction in water footprint and encouraging rain water harvesting.
Saving of natural resources like Electricity, Oil, Fuel, etc.
Use of Renewable Energy in Manufacturing.
Use of natural lighting and natural ventilation.
(a) During the year, the Company has taken the following initiatives for conservation of energy:
(i) Engineering Initiatives
Installation of heat recovery systems on Paint shop oven exhaust for hot water generation and air preheating.
Installation of Closed Loop efficient Cooling tower in Body Shops for gun cooling.
Installation of VFD’s at select locations.
Installation of Energy Saving Magnetic Induction Lamps for Shop and Street Lighting.
Energy Savers for Air-Conditioners in various offices.
ANNEXURE II TO THE DIRECTORS’ REPORT FOR THE YEAR ENDED 31ST MARCH 2013
Replacement of inefficient compressor with energy efficient compressors.
Installation of fan less cooling tower.
Replacement of electrical heaters with gas burners in heat treatment furnaces.
Flat belt instead of V belt for blowers.
Installation of energy efficient pumping system.
Light Pipe installation in offices.
(ii) Process Improvement
Optimisation in VFD Frequency.
Energy efficient Burners for plant canteen.
No air loss drain valves for moisture removal from compressed air.
Timers for blowers, fans and lights.
Lighting sensor auto-switches for lighting.
Downsizing Motors HP by Optimising Operation periods.
Conversion of hot coolant to cold coolant for cleaning parts.
Processing of more BMT/Cabs per skid.
Conversion of Paint shop AED to CED process at Zaheerabad.
Energy reduction of slab cores using cold box instead of hot box at moulding in Foundry.
Improvements through small group activities
Adjustment of chiller temperature.
Replacing tube light Electromagnetic ballasts with Electronic ballasts.
Installation of Motion Sensors in various areas.
Energy saving by switching off high bay lamps.
(iii) Initiatives Generating Awareness on Energy Consumption
Energy Conservation Week celebration at all plants.
Energy Conservation Oath at all locations.
E-mailer’s and Wallpapers for awareness.
Display of posters and slogans on energy conservation.
30
Conducted slogan, poster and suggestion competition for employees on energy efficiency.
Release of Energy Management Guidelines.
Organised Green Product Exhibition, 23 reputed Exhibitors displayed Green Products. More than 1,000 visitors have visited the exhibition.
Energy Quiz and Suggestion Competition.
Publication and release of E-Booklet containing ECON initiatives.
Promoting energy conservation by showing ECON movies during lunch and dinner time in canteen.
ECON stall on Founders Day Celebration.
Extensive involvement of shop floor operating teams in improvement activities and projects.
Spreading the importance of energy conservation in nearby schools and colleges.
(b) Additional investments and proposals, if any, being implemented for reduction of consumption of energy
Solar Heater for utensils cleaning.
Provision of solar street lights inside the plant.
Demand controller for Paint shop air line.
Solar water heating system for LPG vaporizers.
Installation of VFD drive for pumps in hot water generator section.
(c) Impact of the measures at (a) & (b) above for reduction in energy consumption and consequent impact on the cost of production of goods
The measures taken have resulted in lower energy consumption.
In the Automotive Sector, Specific Electrical energy consumption is reduced by 11.6% over the previous year and Specific Thermal energy consumption is reduced by 7.9% over the previous year.
However, in the Farm Equipment Sector, on account of drop in production, there was a marginal increase in Specific energy consumption.
(d) Total energy consumption and energy consumptions per unit of production as per Form A of the Annexure to the Rules in respect of industries specified in the Schedule
Not Applicable.
(B) Technology Absorption
Research & Development
1. Areas in which Research & Development is carried out:
During the year under review, the focus of Automotive Division continued on technology upgradation and capability development in the core areas of Power train, safety, weight reduction, alternate material and developing capabilities in automotive infotronics.
The Farm Division focussed on upgrading the product range, improving fuel efficiency while meeting the emission norms in India and US. Efforts were also focussed on development of a range of mechanisation solutions for focussed crops.
Your Company is also working to derive synergy benefits with Ssangyong Motor Company. The Company is developing 2 common platforms and various new engines to be used on those platforms. The Company also has actioned the benefits of common sourcing.
2. Benefits derived as a result of the above efforts:
Some significant achievements in the Automotive Division include launch of Quanto, domestic launch of Rexton, e2o, Verito Refresh and Maxximo Plus.
The Company has launched its products in Europe, Chile and Brazil.
Quanto is a spacious 5+2 seater, first in sub-4m segment, twin stage turbo 1.5l, 3 cylinder engine, with class leading horse power of 100 ps. It is the most compact SUV in India with easy maneuverability. It is also having micro hybrid technology. It is lighter and fuel efficient SUV which comes with an all new 5MT320 transmission.
For safety, Quanto has an engine immobiliser, specially designed crumple zones, to absorb the impact in case of a collision, Antilock Braking System (“ABS”) with Electronic Brake Distribution (“EBD”). The C8 version comes with dual SRS Airbags, intellipark reverse assist, for assisting in safe parking.
Maxximo Plus is powered by advanced re-engineered 2cyl DHOC 4 valve engine. Maxximo Plus is the
MAHINDRA & MAHINDRA LIMITED
31
country’s most technologically advanced 0.85 ton capacity mini-truck. Equipped with the pioneering yet simple-to-use ‘Fuel Smart Technology’, the new Maxximo Plus allows the customer to choose between higher power (26 hp; 19.2 kw) and higher mileage (21.9 kmpl), as and when the customer deems fit, at the press of a switch. This vehicle has a much stronger rear suspension as well.
The e2o car is powered by next generation lithium-ion batteries, and a three phase induction electric motor, a maximum power output of 19 kw and 53 Nm of maximum torque driving the rear wheels. The principal advantage which this motor offers is refinement. The motor is mated to an automatic transmission. There are three basic driving modes offered, a forward and reverse and a boost mode. It has driving range of 100 km per charge. This Car has GPS navigation system, keyless entry and regenerative braking features, which puts energy back into the car’s batteries and charges them every time it is slowed down or brakes are applied.
On Rexton, it has offered a 2.7 litre; 5 cylinder engine with power of 184 bhp on RX7. The Rexton comes with an exclusive torque on demand function. Electronic transmission in Rexton ensures best driving performance, 8-way power seats with memory, Anti-trap electrical sun roof adds to the glamour of the Rexton. Side airbags for RX7 improves the safety and protection of the passengers.
Moving on to the Farm Division, the Company has launched the upgraded variants of 475, 295 with oil immersed brakes, power steering and larger tyres. The Arjun MAT Tractor continues to enjoy the position of strength with the introduction of 2 new variants. Yuvraj Tractor has now crossed the 10,000 volume. The 255 Tractor was launched with better engine offering higher luggability and is well received in the market. The same holds true for 395 and 595 Tractors with OBP sheet metal. The Company has successfully productionised 12 new variants on current Bhoomiputra, Sarpanch and Arjun platforms. In order to showcase the technology prowess, higher horsepower Cabin tractor has been test marketed during the year.
In the International space, the Company has offered the most cost effective emission solutions in the US market while meeting Tier IV norms. The Compact Tractor continues to do well with its PST and HST variants. The integrated cabin project has progressed well and the Company would be launching the same in the coming year. The 90 hp Tractor has now been extended to other markets in Latin America and Africa.
The in-house engine development effort resulted in higher KVA engines adding to the Mahindra Powerol portfolio.
During the year, Auto and Farm divisions filed 47 new patents, while 4 patents were granted.
3. Future plan of action:
Your Company continues its efforts on developing new products and technologies to meet the ever growing customer needs, regulatory requirements, competitive pressures and to prepare for the future.
Your Company has started construction of the Mahindra Technical Academy at Mahindra Research Valley (“MRV”) in Chennai. The Mahindra Technical Academy will train and coach the new Graduate Engineers in various system domains to deliver robust designs. At MRV, the vehicle test tracks for validation are operational. All the Company’s new technology and product programs are already operating from MRV.
Sustainable mobility solutions are a key focus area and your Company will continue to aggressively pursue technology development in these areas. Some of the key thrust areas in this direction are weight reduction by using alternate materials, designing modularity to take care of variants and VAVE (Value Analysis Value Engineering) approach for meeting cost pressures. Development and adaptation of safety technologies also remain a key focus area.
4. Expenditure on R&D:
The Company spent Rs. 1,060.54 crores (including Rs. 449.78 crores on Capital Expenditure) for Research & Development work during the year, which was approximately 2.41% of the total turnover.
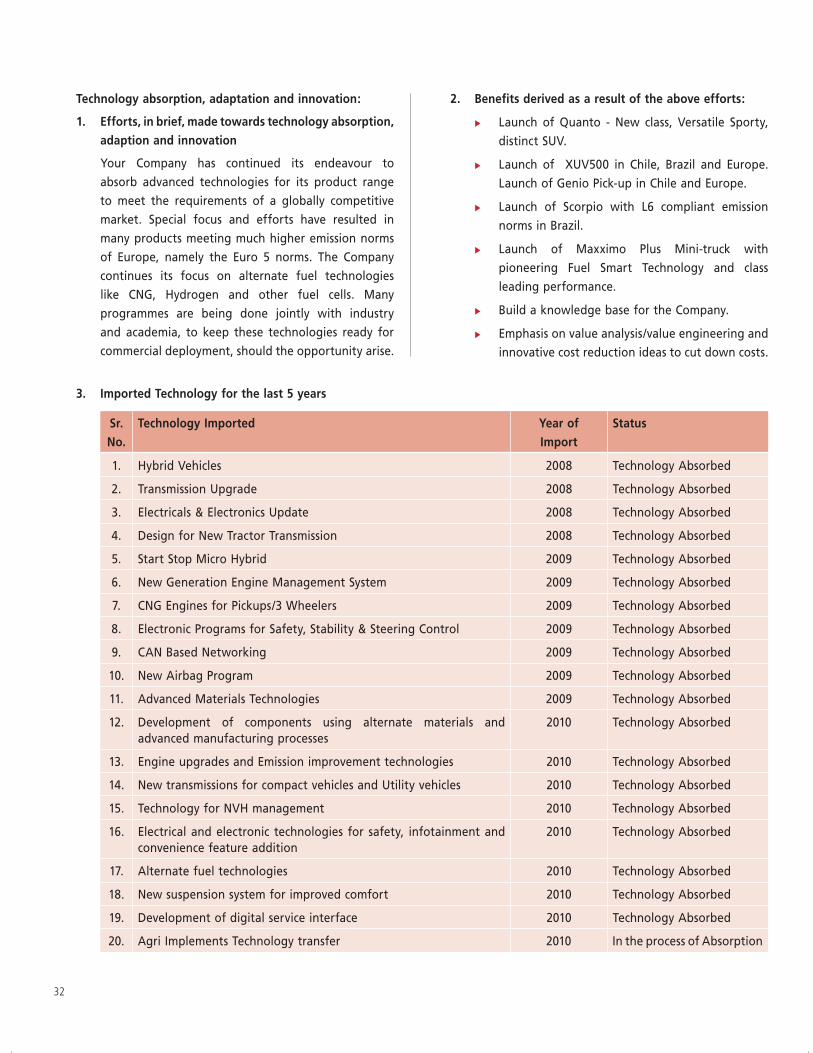
32
Technology absorption, adaptation and innovation:
1. Efforts, in brief, made towards technology absorption, adaption and innovation
Your Company has continued its endeavour to absorb advanced technologies for its product range to meet the requirements of a globally competitive market. Special focus and efforts have resulted in many products meeting much higher emission norms of Europe, namely the Euro 5 norms. The Company continues its focus on alternate fuel technologies like CNG, Hydrogen and other fuel cells. Many programmes are being done jointly with industry and academia, to keep these technologies ready for commercial deployment, should the opportunity arise.
2. Benefits derived as a result of the above efforts:
Launch of Quanto - New class, Versatile Sporty, distinct SUV.
Launch of XUV500 in Chile, Brazil and Europe. Launch of Genio Pick-up in Chile and Europe.
Launch of Scorpio with L6 compliant emission norms in Brazil.
Launch of Maxximo Plus Mini-truck with pioneering Fuel Smart Technology and class leading performance.
Build a knowledge base for the Company.
Emphasis on value analysis/value engineering and innovative cost reduction ideas to cut down costs.
3. Imported Technology for the last 5 years
Sr. No.
Technology Imported Year of Import
Status
1. Hybrid Vehicles 2008 Technology Absorbed
2. Transmission Upgrade 2008 Technology Absorbed
3. Electricals & Electronics Update 2008 Technology Absorbed
4. Design for New Tractor Transmission 2008 Technology Absorbed
5. Start Stop Micro Hybrid 2009 Technology Absorbed
6. New Generation Engine Management System 2009 Technology Absorbed
7. CNG Engines for Pickups/3 Wheelers 2009 Technology Absorbed
8. Electronic Programs for Safety, Stability & Steering Control 2009 Technology Absorbed
9. CAN Based Networking 2009 Technology Absorbed
10. New Airbag Program 2009 Technology Absorbed
11. Advanced Materials Technologies 2009 Technology Absorbed
12. Development of components using alternate materials and advanced manufacturing processes
2010 Technology Absorbed
13. Engine upgrades and Emission improvement technologies 2010 Technology Absorbed
14. New transmissions for compact vehicles and Utility vehicles 2010 Technology Absorbed
15. Technology for NVH management 2010 Technology Absorbed
16. Electrical and electronic technologies for safety, infotainment and convenience feature addition
2010 Technology Absorbed
17. Alternate fuel technologies 2010 Technology Absorbed
18. New suspension system for improved comfort 2010 Technology Absorbed
19. Development of digital service interface 2010 Technology Absorbed
20. Agri Implements Technology transfer 2010 In the process of Absorption
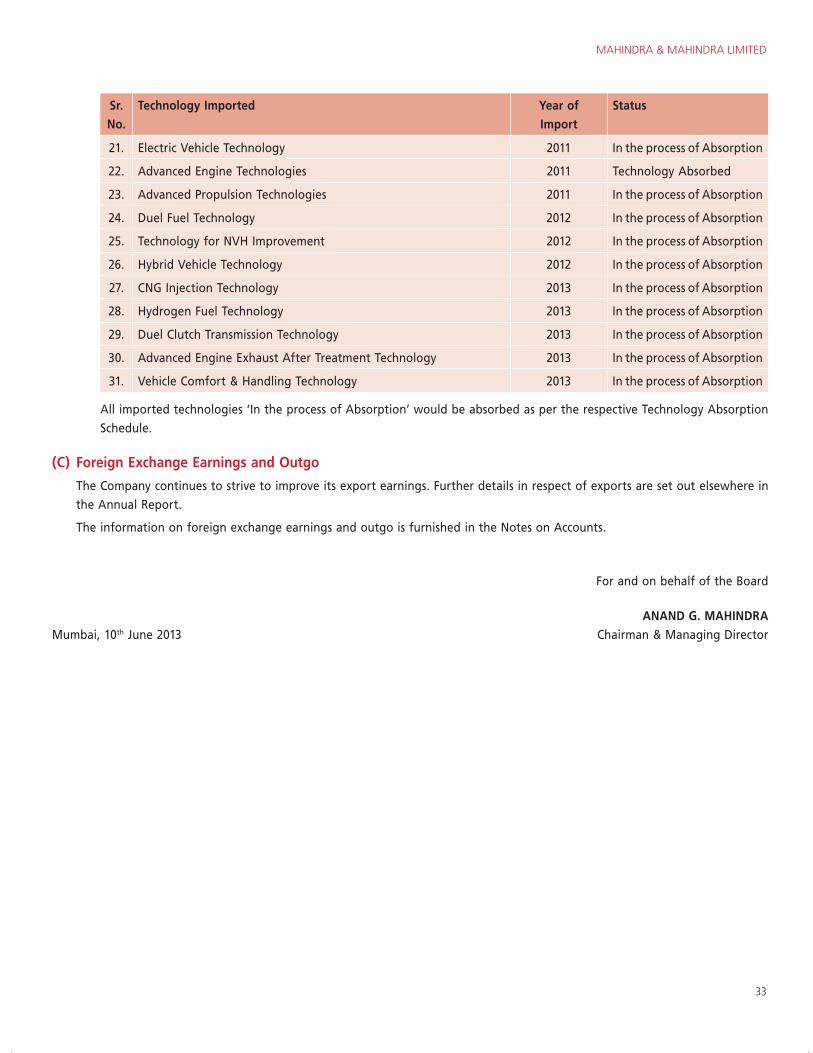
MAHINDRA & MAHINDRA LIMITED
33
Sr. No.
Technology Imported Year of Import
Status
21. Electric Vehicle Technology 2011 In the process of Absorption
22. Advanced Engine Technologies 2011 Technology Absorbed
23. Advanced Propulsion Technologies 2011 In the process of Absorption
24. Duel Fuel Technology 2012 In the process of Absorption
25. Technology for NVH Improvement 2012 In the process of Absorption
26. Hybrid Vehicle Technology 2012 In the process of Absorption
27. CNG Injection Technology 2013 In the process of Absorption
28. Hydrogen Fuel Technology 2013 In the process of Absorption
29. Duel Clutch Transmission Technology 2013 In the process of Absorption
30. Advanced Engine Exhaust After Treatment Technology 2013 In the process of Absorption
31. Vehicle Comfort & Handling Technology 2013 In the process of Absorption
All imported technologies ‘In the process of Absorption’ would be absorbed as per the respective Technology Absorption Schedule.
(C) Foreign Exchange Earnings and Outgo
The Company continues to strive to improve its export earnings. Further details in respect of exports are set out elsewhere in the Annual Report.
The information on foreign exchange earnings and outgo is furnished in the Notes on Accounts.
For and on behalf of the Board
ANAND G. MAHINDRAMumbai, 10th June 2013 Chairman & Managing Director
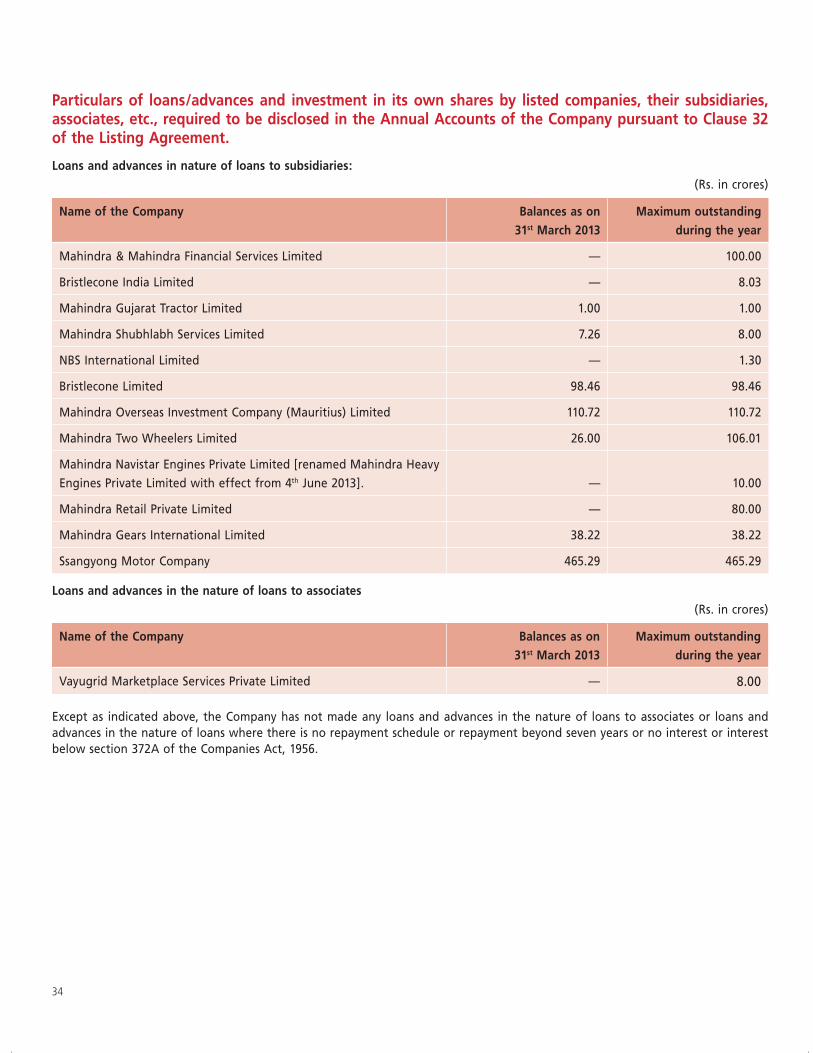
34
Particulars of loans/advances and investment in its own shares by listed companies, their subsidiaries, associates, etc., required to be disclosed in the Annual Accounts of the Company pursuant to Clause 32 of the Listing Agreement.
Loans and advances in nature of loans to subsidiaries: (Rs. in crores)
Name of the Company Balances as on 31st March 2013
Maximum outstanding during the year
Mahindra & Mahindra Financial Services Limited — 100.00
Bristlecone India Limited — 8.03
Mahindra Gujarat Tractor Limited 1.00 1.00
Mahindra Shubhlabh Services Limited 7.26 8.00
NBS International Limited — 1.30
Bristlecone Limited 98.46 98.46
Mahindra Overseas Investment Company (Mauritius) Limited 110.72 110.72
Mahindra Two Wheelers Limited 26.00 106.01
Mahindra Navistar Engines Private Limited [renamed Mahindra Heavy Engines Private Limited with effect from 4th June 2013]. — 10.00
Mahindra Retail Private Limited — 80.00
Mahindra Gears International Limited 38.22 38.22
Ssangyong Motor Company 465.29 465.29
Loans and advances in the nature of loans to associates (Rs. in crores)
Name of the Company Balances as on 31st March 2013
Maximum outstanding during the year
Vayugrid Marketplace Services Private Limited — 8.00
Except as indicated above, the Company has not made any loans and advances in the nature of loans to associates or loans and advances in the nature of loans where there is no repayment schedule or repayment beyond seven years or no interest or interest below section 372A of the Companies Act, 1956.

MAHINDRA & MAHINDRA LIMITED
37
Mahindra & Mahindra Limited (“M&M”) or (“Mahindra”) is the flagship brand of the Mahindra Group which consists of 141 companies with diverse businesses across the globe and aggregate revenues of US $ 16.2 billion. The Financial Year 2012-13 was a challenging one with several shocks in the global and domestic environment. Your Company however, fortified by its Rise philosophy of accepting no limits, thinking innovatively and driving positive change in the lives of others, successfully took on the challenge of performing in a very volatile environment.
The Automotive and Farm Equipment Sectors of M&M worked together, as always, with distinct and strong customer focus at the front end and structured synergy at the back end. In the Financial Year 2012-13, your Company sold 551,469 vehicles (a growth of 17.5% over the previous year) while tractor sales added up to 224,844 tractors (a drop of 5.0% in comparison to the previous year).
The Automotive and Farm Equipment Sectors, along with their subsidiary companies and joint ventures, achieved global sales of 944,902 vehicles and tractors (685,371 vehicles and 255,531 tractors).
Industry StructureThe Indian automotive industry comprises of a number of Indian-origin and multinational players with varying degrees of presence in different segments. Today, nine of the top ten global automotive manufacturers have a presence in India which clearly points to its importance as a strategic market.
Similarly, the domestic tractor market also has a mix of Indian-origin and international manufacturers and is segmented by horsepower into the sub 30 HP segment, the 30-40 HP segment, the 40-50 HP segment and the higher segment of above 50 HP.
Industry Overview and Trends
Global Automotive IndustryIn the calendar year (CY) 2012, global automotive sales registered a growth of 4.9%, compared to 4.4% in the
previous year. This was a moderate pace of growth considering that CY 2010 had a very high growth of 14.1% on the back of the slowdown in CY 2009 (when growth dropped by 3.9%). Source: OICA (Organisation Internationale des Constructeurs d’Automobiles).
China became the world’s largest automotive market in CY 2009 with very high growth of ~ 39% CAGR for the period 2008-2010. In CY 2012, China retained its crown as the world’s largest automotive market with sales of 19.3 million vehicles, but the growth slowed down to 4.3%.
The US market has shown some signs of recovery, posting 13.4% growth in CY 2012. In terms of size, the US market still lags behind China by around 4.5 million vehicles. Automotive sales in Europe continue to slide. In CY 2012, sales were down by 5.5%, the lowest in the last seven years. Key markets like France, Italy and Spain posted the lowest sales in the last seven years.
Sales in Japan were the highest in five years in 2012, posting a growth of 27.5% as the country bounced back from the effects of the economic slow down and the 2011 earthquake.
Indian Automotive IndustryThe Financial Year 2012-13 was a very challenging one for the Indian auto industry. The performance of the Indian automotive industry was significantly lower than the 10-12% growth projected by SIAM (Society of Indian Automobile Manufacturers) at the beginning of the year. The year ended with a growth of just 2.6%. This below potential industry performance was due to factors such as uncertainty over economic growth, high vehicle financing rates, high inflation leading to less discretionary expenses and hike in fuel prices.
Industry volumes (excluding two wheelers) grew just 1.7% over the previous year. Seven of twelve industry sub segments witnessed de-growth during the Financial Year 2012-13.
The Passenger Vehicle segment grew overall by a mere 2.2%, with domestic sales hovering at about 2.6 million vehicles for the second consecutive year. Within this segment, the Utility Vehicle (UV) segment registered a record growth of 52.2%, the
MANAGEMENT DISCUSSION & ANALYSIS
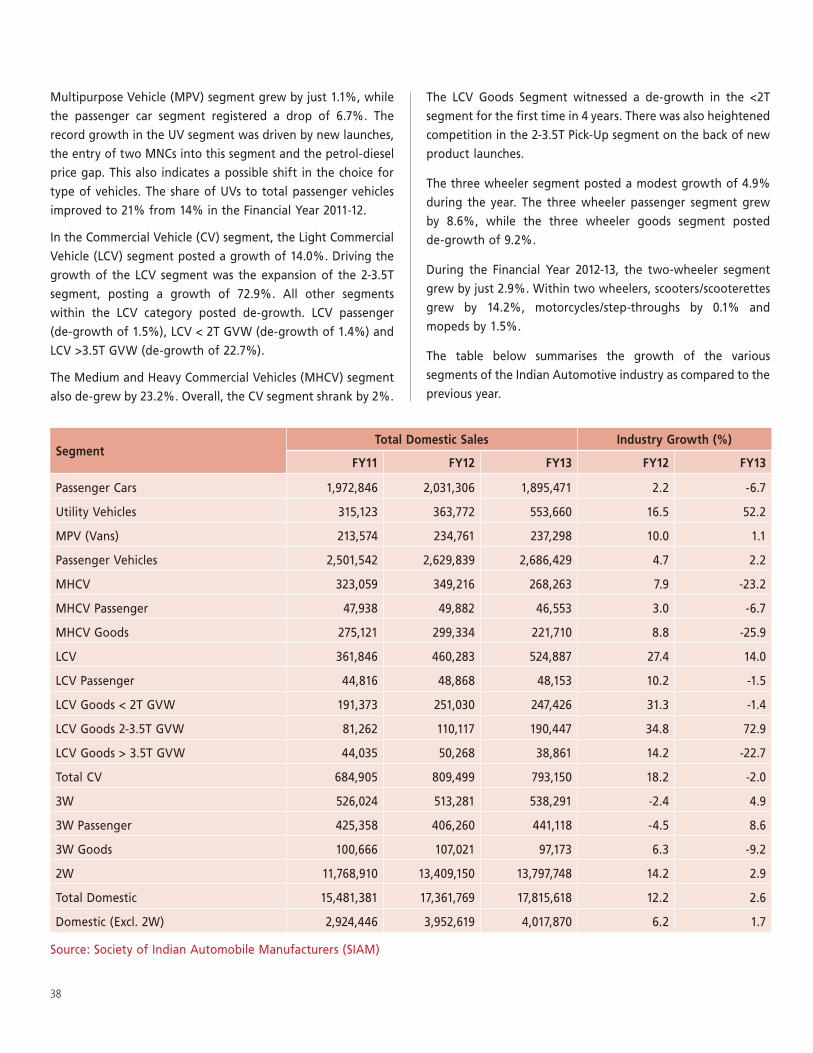
38
Multipurpose Vehicle (MPV) segment grew by just 1.1%, while the passenger car segment registered a drop of 6.7%. The record growth in the UV segment was driven by new launches, the entry of two MNCs into this segment and the petrol-diesel price gap. This also indicates a possible shift in the choice for type of vehicles. The share of UVs to total passenger vehicles improved to 21% from 14% in the Financial Year 2011-12.
In the Commercial Vehicle (CV) segment, the Light Commercial Vehicle (LCV) segment posted a growth of 14.0%. Driving the growth of the LCV segment was the expansion of the 2-3.5T segment, posting a growth of 72.9%. All other segments within the LCV category posted de-growth. LCV passenger (de-growth of 1.5%), LCV < 2T GVW (de-growth of 1.4%) and LCV >3.5T GVW (de-growth of 22.7%).
The Medium and Heavy Commercial Vehicles (MHCV) segment also de-grew by 23.2%. Overall, the CV segment shrank by 2%.
The LCV Goods Segment witnessed a de-growth in the <2T segment for the first time in 4 years. There was also heightened competition in the 2-3.5T Pick-Up segment on the back of new product launches.
The three wheeler segment posted a modest growth of 4.9% during the year. The three wheeler passenger segment grew by 8.6%, while the three wheeler goods segment posted de-growth of 9.2%.
During the Financial Year 2012-13, the two-wheeler segment grew by just 2.9%. Within two wheelers, scooters/scooterettes grew by 14.2%, motorcycles/step-throughs by 0.1% and mopeds by 1.5%.
The table below summarises the growth of the various segments of the Indian Automotive industry as compared to the previous year.
SegmentTotal Domestic Sales Industry Growth (%)
FY11 FY12 FY13 FY12 FY13
Passenger Cars 1,972,846 2,031,306 1,895,471 2.2 -6.7
Utility Vehicles 315,123 363,772 553,660 16.5 52.2
MPV (Vans) 213,574 234,761 237,298 10.0 1.1
Passenger Vehicles 2,501,542 2,629,839 2,686,429 4.7 2.2
MHCV 323,059 349,216 268,263 7.9 -23.2
MHCV Passenger 47,938 49,882 46,553 3.0 -6.7
MHCV Goods 275,121 299,334 221,710 8.8 -25.9
LCV 361,846 460,283 524,887 27.4 14.0
LCV Passenger 44,816 48,868 48,153 10.2 -1.5
LCV Goods < 2T GVW 191,373 251,030 247,426 31.3 -1.4
LCV Goods 2-3.5T GVW 81,262 110,117 190,447 34.8 72.9
LCV Goods > 3.5T GVW 44,035 50,268 38,861 14.2 -22.7
Total CV 684,905 809,499 793,150 18.2 -2.0
3W 526,024 513,281 538,291 -2.4 4.9
3W Passenger 425,358 406,260 441,118 -4.5 8.6
3W Goods 100,666 107,021 97,173 6.3 -9.2
2W 11,768,910 13,409,150 13,797,748 14.2 2.9
Total Domestic 15,481,381 17,361,769 17,815,618 12.2 2.6
Domestic (Excl. 2W) 2,924,446 3,952,619 4,017,870 6.2 1.7
Source: Society of Indian Automobile Manufacturers (SIAM)
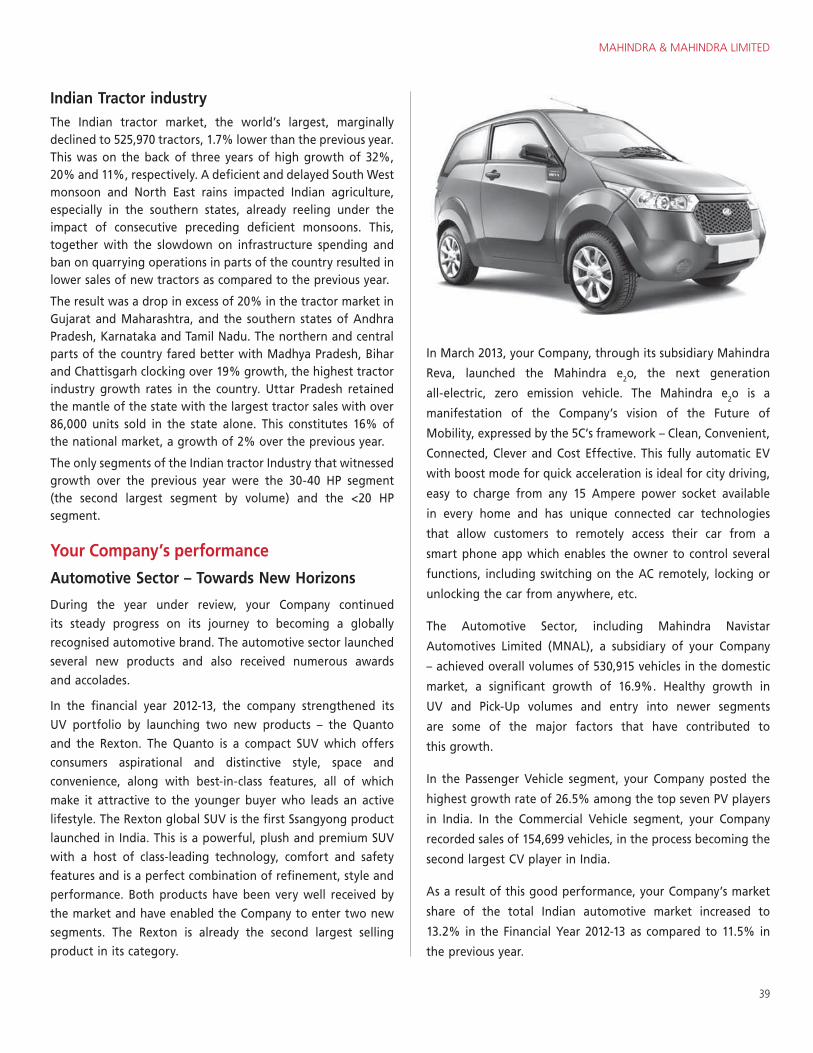
MAHINDRA & MAHINDRA LIMITED
39
Indian Tractor industryThe Indian tractor market, the world’s largest, marginally declined to 525,970 tractors, 1.7% lower than the previous year. This was on the back of three years of high growth of 32%, 20% and 11%, respectively. A deficient and delayed South West monsoon and North East rains impacted Indian agriculture, especially in the southern states, already reeling under the impact of consecutive preceding deficient monsoons. This, together with the slowdown on infrastructure spending and ban on quarrying operations in parts of the country resulted in lower sales of new tractors as compared to the previous year.
The result was a drop in excess of 20% in the tractor market in Gujarat and Maharashtra, and the southern states of Andhra Pradesh, Karnataka and Tamil Nadu. The northern and central parts of the country fared better with Madhya Pradesh, Bihar and Chattisgarh clocking over 19% growth, the highest tractor industry growth rates in the country. Uttar Pradesh retained the mantle of the state with the largest tractor sales with over 86,000 units sold in the state alone. This constitutes 16% of the national market, a growth of 2% over the previous year.
The only segments of the Indian tractor Industry that witnessed growth over the previous year were the 30-40 HP segment (the second largest segment by volume) and the <20 HP segment.
Your Company’s performance
Automotive Sector – Towards New Horizons
During the year under review, your Company continued its steady progress on its journey to becoming a globally recognised automotive brand. The automotive sector launched several new products and also received numerous awards and accolades.
In the financial year 2012-13, the company strengthened its UV portfolio by launching two new products – the Quanto and the Rexton. The Quanto is a compact SUV which offers consumers aspirational and distinctive style, space and convenience, along with best-in-class features, all of which make it attractive to the younger buyer who leads an active lifestyle. The Rexton global SUV is the first Ssangyong product launched in India. This is a powerful, plush and premium SUV with a host of class-leading technology, comfort and safety features and is a perfect combination of refinement, style and performance. Both products have been very well received by the market and have enabled the Company to enter two new segments. The Rexton is already the second largest selling product in its category.
In March 2013, your Company, through its subsidiary Mahindra
Reva, launched the Mahindra e2o, the next generation
all-electric, zero emission vehicle. The Mahindra e2o is a
manifestation of the Company’s vision of the Future of
Mobility, expressed by the 5C’s framework – Clean, Convenient,
Connected, Clever and Cost Effective. This fully automatic EV
with boost mode for quick acceleration is ideal for city driving,
easy to charge from any 15 Ampere power socket available
in every home and has unique connected car technologies
that allow customers to remotely access their car from a
smart phone app which enables the owner to control several
functions, including switching on the AC remotely, locking or
unlocking the car from anywhere, etc.
The Automotive Sector, including Mahindra Navistar
Automotives Limited (MNAL), a subsidiary of your Company
– achieved overall volumes of 530,915 vehicles in the domestic
market, a significant growth of 16.9%. Healthy growth in
UV and Pick-Up volumes and entry into newer segments
are some of the major factors that have contributed to
this growth.
In the Passenger Vehicle segment, your Company posted the
highest growth rate of 26.5% among the top seven PV players
in India. In the Commercial Vehicle segment, your Company
recorded sales of 154,699 vehicles, in the process becoming the
second largest CV player in India.
As a result of this good performance, your Company’s market
share of the total Indian automotive market increased to
13.2% in the Financial Year 2012-13 as compared to 11.5% in
the previous year.
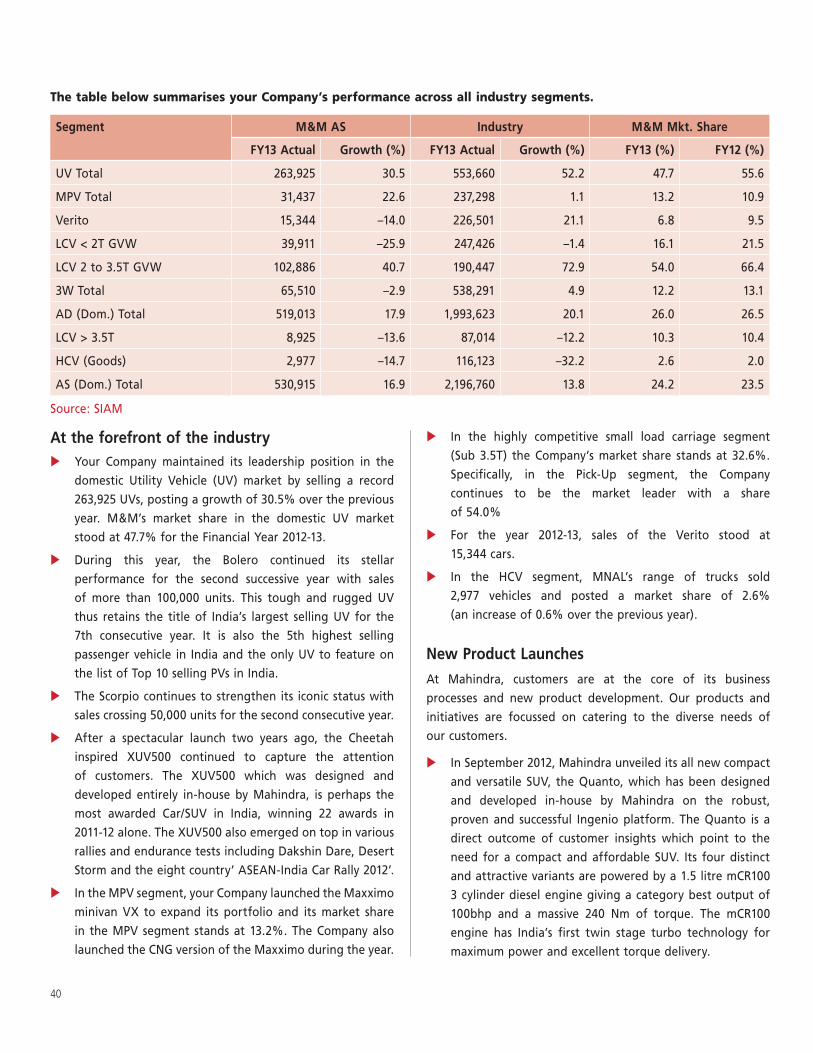
40
The table below summarises your Company’s performance across all industry segments.
Segment M&M AS Industry M&M Mkt. Share
FY13 Actual Growth (%) FY13 Actual Growth (%) FY13 (%) FY12 (%)
UV Total 263,925 30.5 553,660 52.2 47.7 55.6
MPV Total 31,437 22.6 237,298 1.1 13.2 10.9
Verito 15,344 –14.0 226,501 21.1 6.8 9.5
LCV < 2T GVW 39,911 –25.9 247,426 –1.4 16.1 21.5
LCV 2 to 3.5T GVW 102,886 40.7 190,447 72.9 54.0 66.4
3W Total 65,510 –2.9 538,291 4.9 12.2 13.1
AD (Dom.) Total 519,013 17.9 1,993,623 20.1 26.0 26.5
LCV > 3.5T 8,925 –13.6 87,014 –12.2 10.3 10.4
HCV (Goods) 2,977 –14.7 116,123 –32.2 2.6 2.0
AS (Dom.) Total 530,915 16.9 2,196,760 13.8 24.2 23.5
Source: SIAM
At the forefront of the industry Your Company maintained its leadership position in the
domestic Utility Vehicle (UV) market by selling a record 263,925 UVs, posting a growth of 30.5% over the previous year. M&M’s market share in the domestic UV market stood at 47.7% for the Financial Year 2012-13.
During this year, the Bolero continued its stellar performance for the second successive year with sales of more than 100,000 units. This tough and rugged UV thus retains the title of India’s largest selling UV for the 7th consecutive year. It is also the 5th highest selling passenger vehicle in India and the only UV to feature on the list of Top 10 selling PVs in India.
The Scorpio continues to strengthen its iconic status with sales crossing 50,000 units for the second consecutive year.
After a spectacular launch two years ago, the Cheetah inspired XUV500 continued to capture the attention of customers. The XUV500 which was designed and developed entirely in-house by Mahindra, is perhaps the most awarded Car/SUV in India, winning 22 awards in 2011-12 alone. The XUV500 also emerged on top in various rallies and endurance tests including Dakshin Dare, Desert Storm and the eight country’ ASEAN-India Car Rally 2012’.
In the MPV segment, your Company launched the Maxximo minivan VX to expand its portfolio and its market share in the MPV segment stands at 13.2%. The Company also launched the CNG version of the Maxximo during the year.
In the highly competitive small load carriage segment (Sub 3.5T) the Company’s market share stands at 32.6%. Specifically, in the Pick-Up segment, the Company continues to be the market leader with a share of 54.0%
For the year 2012-13, sales of the Verito stood at 15,344 cars.
In the HCV segment, MNAL’s range of trucks sold 2,977 vehicles and posted a market share of 2.6% (an increase of 0.6% over the previous year).
New Product Launches
At Mahindra, customers are at the core of its business processes and new product development. Our products and initiatives are focussed on catering to the diverse needs of our customers.
In September 2012, Mahindra unveiled its all new compact and versatile SUV, the Quanto, which has been designed and developed in-house by Mahindra on the robust, proven and successful Ingenio platform. The Quanto is a direct outcome of customer insights which point to the need for a compact and affordable SUV. Its four distinct and attractive variants are powered by a 1.5 litre mCR100 3 cylinder diesel engine giving a category best output of 100bhp and a massive 240 Nm of torque. The mCR100 engine has India’s first twin stage turbo technology for maximum power and excellent torque delivery.
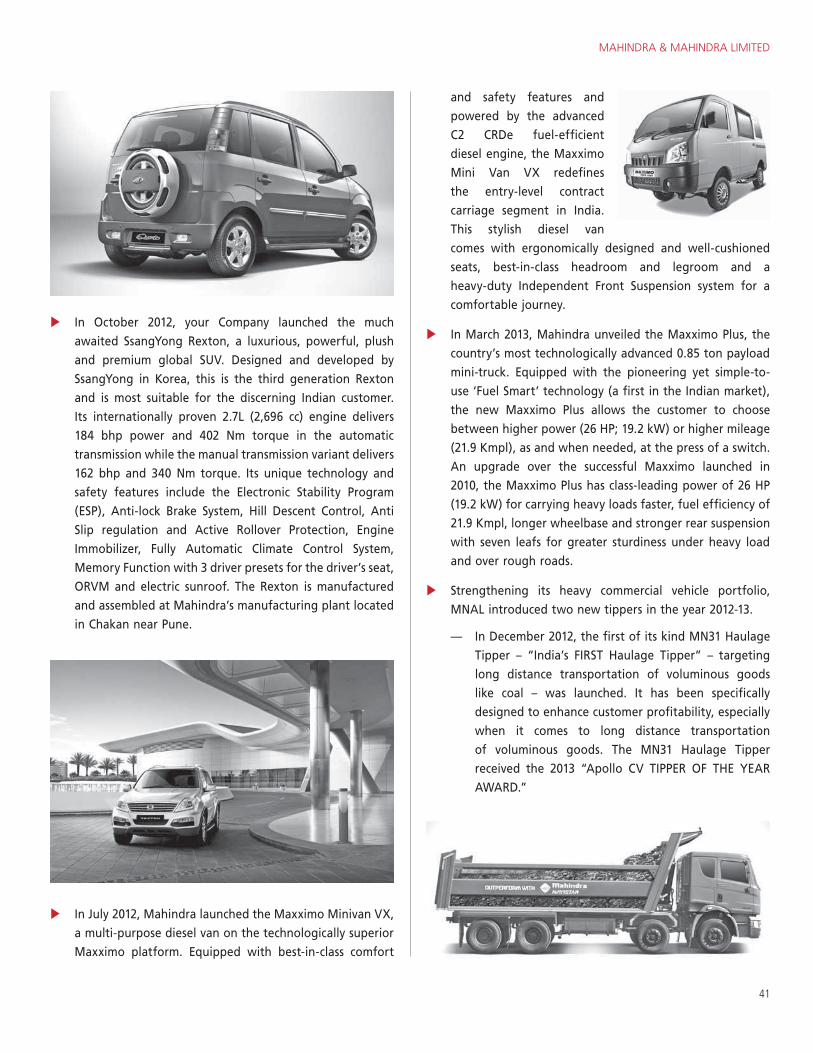
MAHINDRA & MAHINDRA LIMITED
41
In October 2012, your Company launched the much awaited SsangYong Rexton, a luxurious, powerful, plush and premium global SUV. Designed and developed by SsangYong in Korea, this is the third generation Rexton and is most suitable for the discerning Indian customer. Its internationally proven 2.7L (2,696 cc) engine delivers 184 bhp power and 402 Nm torque in the automatic transmission while the manual transmission variant delivers 162 bhp and 340 Nm torque. Its unique technology and safety features include the Electronic Stability Program (ESP), Anti-lock Brake System, Hill Descent Control, Anti Slip regulation and Active Rollover Protection, Engine Immobilizer, Fully Automatic Climate Control System, Memory Function with 3 driver presets for the driver’s seat, ORVM and electric sunroof. The Rexton is manufactured and assembled at Mahindra’s manufacturing plant located in Chakan near Pune.
In July 2012, Mahindra launched the Maxximo Minivan VX, a multi-purpose diesel van on the technologically superior Maxximo platform. Equipped with best-in-class comfort
and safety features and powered by the advanced C2 CRDe fuel-efficient diesel engine, the Maxximo Mini Van VX redefines the entry-level contract carriage segment in India. This stylish diesel van comes with ergonomically designed and well-cushioned seats, best-in-class headroom and legroom and a heavy-duty Independent Front Suspension system for a comfortable journey.
In March 2013, Mahindra unveiled the Maxximo Plus, the country’s most technologically advanced 0.85 ton payload mini-truck. Equipped with the pioneering yet simple-to-use ‘Fuel Smart’ technology (a first in the Indian market), the new Maxximo Plus allows the customer to choose between higher power (26 HP; 19.2 kW) or higher mileage (21.9 Kmpl), as and when needed, at the press of a switch. An upgrade over the successful Maxximo launched in 2010, the Maxximo Plus has class-leading power of 26 HP (19.2 kW) for carrying heavy loads faster, fuel efficiency of 21.9 Kmpl, longer wheelbase and stronger rear suspension with seven leafs for greater sturdiness under heavy load and over rough roads.
Strengthening its heavy commercial vehicle portfolio, MNAL introduced two new tippers in the year 2012-13.
— In December 2012, the first of its kind MN31 Haulage Tipper – “India’s FIRST Haulage Tipper” – targeting long distance transportation of voluminous goods like coal – was launched. It has been specifically designed to enhance customer profitability, especially when it comes to long distance transportation of voluminous goods. The MN31 Haulage Tipper received the 2013 “Apollo CV TIPPER OF THE YEAR AWARD.”
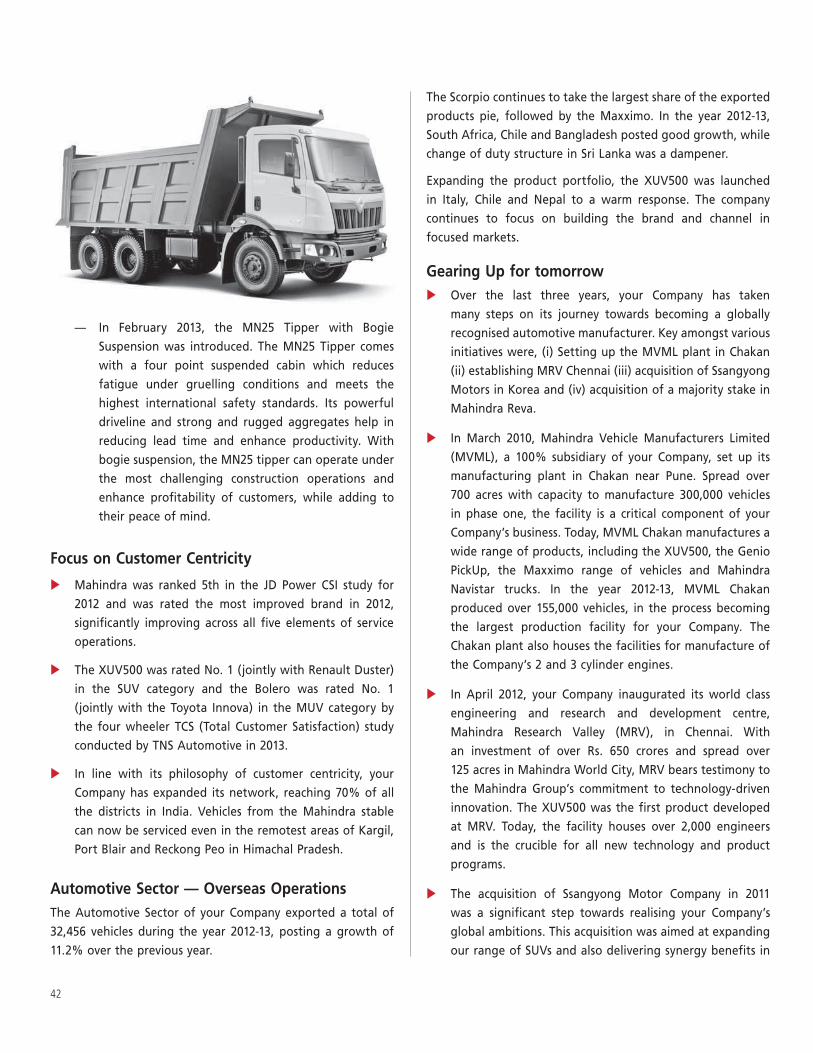
42
— In February 2013, the MN25 Tipper with Bogie Suspension was introduced. The MN25 Tipper comes with a four point suspended cabin which reduces fatigue under gruelling conditions and meets the highest international safety standards. Its powerful driveline and strong and rugged aggregates help in reducing lead time and enhance productivity. With bogie suspension, the MN25 tipper can operate under the most challenging construction operations and enhance profitability of customers, while adding to their peace of mind.
Focus on Customer Centricity
Mahindra was ranked 5th in the JD Power CSI study for 2012 and was rated the most improved brand in 2012, significantly improving across all five elements of service operations.
The XUV500 was rated No. 1 (jointly with Renault Duster) in the SUV category and the Bolero was rated No. 1 (jointly with the Toyota Innova) in the MUV category by the four wheeler TCS (Total Customer Satisfaction) study conducted by TNS Automotive in 2013.
In line with its philosophy of customer centricity, your Company has expanded its network, reaching 70% of all the districts in India. Vehicles from the Mahindra stable can now be serviced even in the remotest areas of Kargil, Port Blair and Reckong Peo in Himachal Pradesh.
Automotive Sector — Overseas OperationsThe Automotive Sector of your Company exported a total of 32,456 vehicles during the year 2012-13, posting a growth of 11.2% over the previous year.
The Scorpio continues to take the largest share of the exported products pie, followed by the Maxximo. In the year 2012-13, South Africa, Chile and Bangladesh posted good growth, while change of duty structure in Sri Lanka was a dampener.
Expanding the product portfolio, the XUV500 was launched in Italy, Chile and Nepal to a warm response. The company continues to focus on building the brand and channel in focused markets.
Gearing Up for tomorrow Over the last three years, your Company has taken
many steps on its journey towards becoming a globally recognised automotive manufacturer. Key amongst various initiatives were, (i) Setting up the MVML plant in Chakan (ii) establishing MRV Chennai (iii) acquisition of Ssangyong Motors in Korea and (iv) acquisition of a majority stake in Mahindra Reva.
In March 2010, Mahindra Vehicle Manufacturers Limited (MVML), a 100% subsidiary of your Company, set up its manufacturing plant in Chakan near Pune. Spread over 700 acres with capacity to manufacture 300,000 vehicles in phase one, the facility is a critical component of your Company’s business. Today, MVML Chakan manufactures a wide range of products, including the XUV500, the Genio PickUp, the Maxximo range of vehicles and Mahindra Navistar trucks. In the year 2012-13, MVML Chakan produced over 155,000 vehicles, in the process becoming the largest production facility for your Company. The Chakan plant also houses the facilities for manufacture of the Company’s 2 and 3 cylinder engines.
In April 2012, your Company inaugurated its world class engineering and research and development centre, Mahindra Research Valley (MRV), in Chennai. With an investment of over Rs. 650 crores and spread over 125 acres in Mahindra World City, MRV bears testimony to the Mahindra Group’s commitment to technology-driven innovation. The XUV500 was the first product developed at MRV. Today, the facility houses over 2,000 engineers and is the crucible for all new technology and product programs.
The acquisition of Ssangyong Motor Company in 2011 was a significant step towards realising your Company’s global ambitions. This acquisition was aimed at expanding our range of SUVs and also delivering synergy benefits in
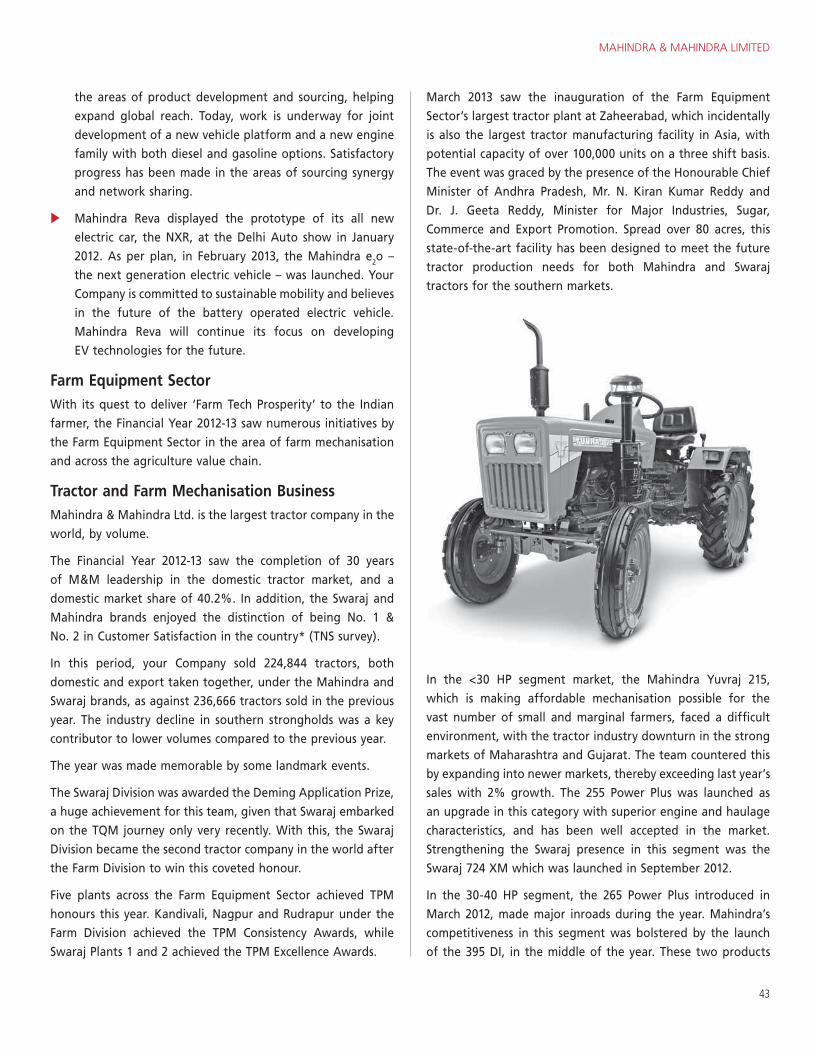
MAHINDRA & MAHINDRA LIMITED
43
the areas of product development and sourcing, helping expand global reach. Today, work is underway for joint development of a new vehicle platform and a new engine family with both diesel and gasoline options. Satisfactory progress has been made in the areas of sourcing synergy and network sharing.
Mahindra Reva displayed the prototype of its all new electric car, the NXR, at the Delhi Auto show in January 2012. As per plan, in February 2013, the Mahindra e2o – the next generation electric vehicle – was launched. Your Company is committed to sustainable mobility and believes in the future of the battery operated electric vehicle. Mahindra Reva will continue its focus on developing EV technologies for the future.
Farm Equipment SectorWith its quest to deliver ‘Farm Tech Prosperity’ to the Indian farmer, the Financial Year 2012-13 saw numerous initiatives by the Farm Equipment Sector in the area of farm mechanisation and across the agriculture value chain.
Tractor and Farm Mechanisation BusinessMahindra & Mahindra Ltd. is the largest tractor company in the world, by volume.
The Financial Year 2012-13 saw the completion of 30 years of M&M leadership in the domestic tractor market, and a domestic market share of 40.2%. In addition, the Swaraj and Mahindra brands enjoyed the distinction of being No. 1 & No. 2 in Customer Satisfaction in the country* (TNS survey).
In this period, your Company sold 224,844 tractors, both domestic and export taken together, under the Mahindra and Swaraj brands, as against 236,666 tractors sold in the previous year. The industry decline in southern strongholds was a key contributor to lower volumes compared to the previous year.
The year was made memorable by some landmark events.
The Swaraj Division was awarded the Deming Application Prize, a huge achievement for this team, given that Swaraj embarked on the TQM journey only very recently. With this, the Swaraj Division became the second tractor company in the world after the Farm Division to win this coveted honour.
Five plants across the Farm Equipment Sector achieved TPM honours this year. Kandivali, Nagpur and Rudrapur under the Farm Division achieved the TPM Consistency Awards, while Swaraj Plants 1 and 2 achieved the TPM Excellence Awards.
March 2013 saw the inauguration of the Farm Equipment Sector’s largest tractor plant at Zaheerabad, which incidentally is also the largest tractor manufacturing facility in Asia, with potential capacity of over 100,000 units on a three shift basis. The event was graced by the presence of the Honourable Chief Minister of Andhra Pradesh, Mr. N. Kiran Kumar Reddy and Dr. J. Geeta Reddy, Minister for Major Industries, Sugar, Commerce and Export Promotion. Spread over 80 acres, this state-of-the-art facility has been designed to meet the future tractor production needs for both Mahindra and Swaraj tractors for the southern markets.
In the <30 HP segment market, the Mahindra Yuvraj 215, which is making affordable mechanisation possible for the vast number of small and marginal farmers, faced a difficult environment, with the tractor industry downturn in the strong markets of Maharashtra and Gujarat. The team countered this by expanding into newer markets, thereby exceeding last year’s sales with 2% growth. The 255 Power Plus was launched as an upgrade in this category with superior engine and haulage characteristics, and has been well accepted in the market. Strengthening the Swaraj presence in this segment was the Swaraj 724 XM which was launched in September 2012.
In the 30-40 HP segment, the 265 Power Plus introduced in March 2012, made major inroads during the year. Mahindra’s competitiveness in this segment was bolstered by the launch of the 395 DI, in the middle of the year. These two products
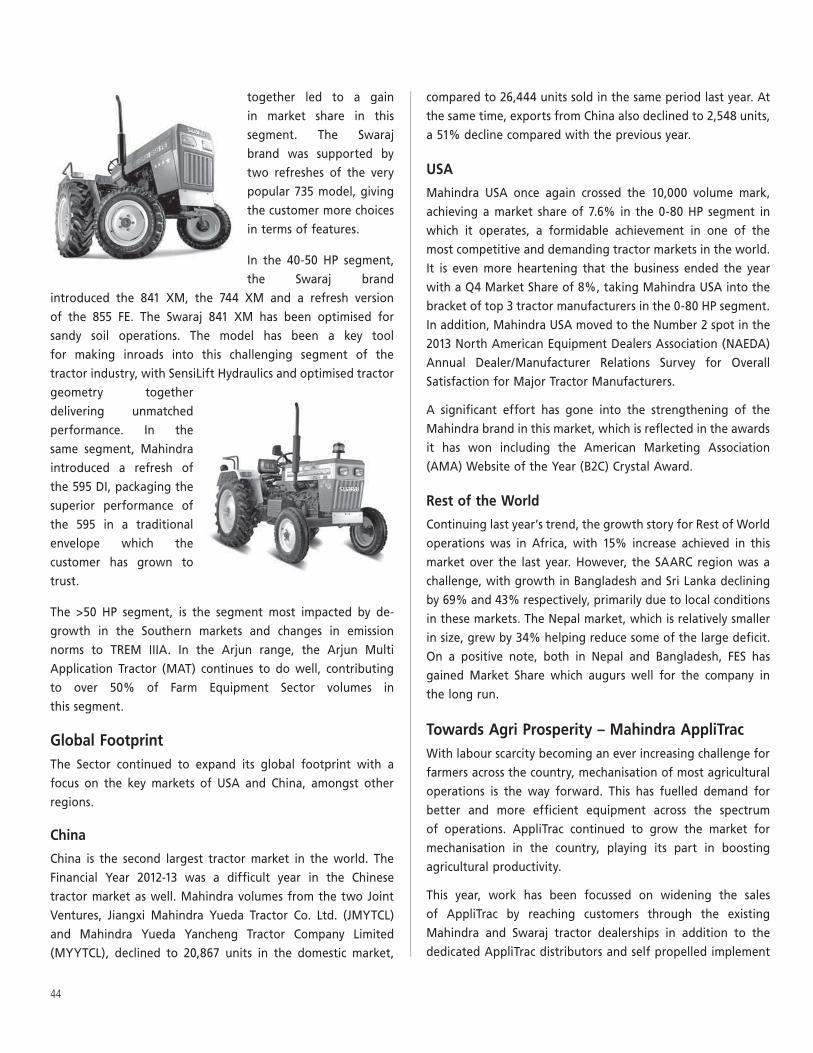
44
together led to a gain in market share in this segment. The Swaraj brand was supported by two refreshes of the very popular 735 model, giving the customer more choices in terms of features.
In the 40-50 HP segment, the Swaraj brand
introduced the 841 XM, the 744 XM and a refresh version of the 855 FE. The Swaraj 841 XM has been optimised for sandy soil operations. The model has been a key tool for making inroads into this challenging segment of the tractor industry, with SensiLift Hydraulics and optimised tractor geometry together delivering unmatched performance. In the same segment, Mahindra introduced a refresh of the 595 DI, packaging the superior performance of the 595 in a traditional envelope which the customer has grown to trust.
The >50 HP segment, is the segment most impacted by de-growth in the Southern markets and changes in emission norms to TREM IIIA. In the Arjun range, the Arjun Multi Application Tractor (MAT) continues to do well, contributing to over 50% of Farm Equipment Sector volumes in this segment.
Global FootprintThe Sector continued to expand its global footprint with a focus on the key markets of USA and China, amongst other regions.
China
China is the second largest tractor market in the world. The Financial Year 2012-13 was a difficult year in the Chinese tractor market as well. Mahindra volumes from the two Joint Ventures, Jiangxi Mahindra Yueda Tractor Co. Ltd. (JMYTCL) and Mahindra Yueda Yancheng Tractor Company Limited (MYYTCL), declined to 20,867 units in the domestic market,
compared to 26,444 units sold in the same period last year. At the same time, exports from China also declined to 2,548 units, a 51% decline compared with the previous year.
USA
Mahindra USA once again crossed the 10,000 volume mark, achieving a market share of 7.6% in the 0-80 HP segment in which it operates, a formidable achievement in one of the most competitive and demanding tractor markets in the world. It is even more heartening that the business ended the year with a Q4 Market Share of 8%, taking Mahindra USA into the bracket of top 3 tractor manufacturers in the 0-80 HP segment. In addition, Mahindra USA moved to the Number 2 spot in the 2013 North American Equipment Dealers Association (NAEDA) Annual Dealer/Manufacturer Relations Survey for Overall Satisfaction for Major Tractor Manufacturers.
A significant effort has gone into the strengthening of the Mahindra brand in this market, which is reflected in the awards it has won including the American Marketing Association (AMA) Website of the Year (B2C) Crystal Award.
Rest of the World
Continuing last year’s trend, the growth story for Rest of World operations was in Africa, with 15% increase achieved in this market over the last year. However, the SAARC region was a challenge, with growth in Bangladesh and Sri Lanka declining by 69% and 43% respectively, primarily due to local conditions in these markets. The Nepal market, which is relatively smaller in size, grew by 34% helping reduce some of the large deficit. On a positive note, both in Nepal and Bangladesh, FES has gained Market Share which augurs well for the company in the long run.
Towards Agri Prosperity – Mahindra AppliTracWith labour scarcity becoming an ever increasing challenge for farmers across the country, mechanisation of most agricultural operations is the way forward. This has fuelled demand for better and more efficient equipment across the spectrum of operations. AppliTrac continued to grow the market for mechanisation in the country, playing its part in boosting agricultural productivity.
This year, work has been focussed on widening the sales of AppliTrac by reaching customers through the existing Mahindra and Swaraj tractor dealerships in addition to the dedicated AppliTrac distributors and self propelled implement
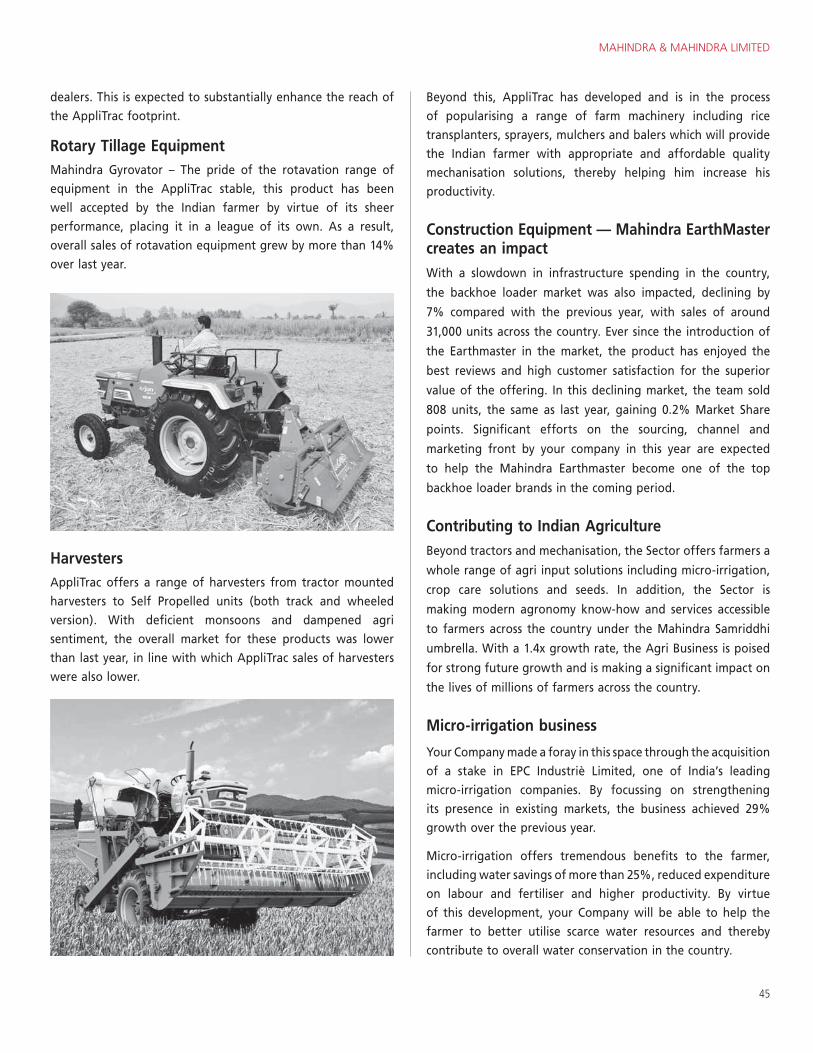
MAHINDRA & MAHINDRA LIMITED
45
dealers. This is expected to substantially enhance the reach of the AppliTrac footprint.
Rotary Tillage EquipmentMahindra Gyrovator – The pride of the rotavation range of equipment in the AppliTrac stable, this product has been well accepted by the Indian farmer by virtue of its sheer performance, placing it in a league of its own. As a result, overall sales of rotavation equipment grew by more than 14% over last year.
HarvestersAppliTrac offers a range of harvesters from tractor mounted harvesters to Self Propelled units (both track and wheeled version). With deficient monsoons and dampened agri sentiment, the overall market for these products was lower than last year, in line with which AppliTrac sales of harvesters were also lower.
Beyond this, AppliTrac has developed and is in the process of popularising a range of farm machinery including rice transplanters, sprayers, mulchers and balers which will provide the Indian farmer with appropriate and affordable quality mechanisation solutions, thereby helping him increase his productivity.
Construction Equipment — Mahindra EarthMaster creates an impactWith a slowdown in infrastructure spending in the country,
the backhoe loader market was also impacted, declining by
7% compared with the previous year, with sales of around
31,000 units across the country. Ever since the introduction of
the Earthmaster in the market, the product has enjoyed the
best reviews and high customer satisfaction for the superior
value of the offering. In this declining market, the team sold
808 units, the same as last year, gaining 0.2% Market Share
points. Significant efforts on the sourcing, channel and
marketing front by your company in this year are expected
to help the Mahindra Earthmaster become one of the top
backhoe loader brands in the coming period.
Contributing to Indian AgricultureBeyond tractors and mechanisation, the Sector offers farmers a
whole range of agri input solutions including micro-irrigation,
crop care solutions and seeds. In addition, the Sector is
making modern agronomy know-how and services accessible
to farmers across the country under the Mahindra Samriddhi
umbrella. With a 1.4x growth rate, the Agri Business is poised
for strong future growth and is making a significant impact on
the lives of millions of farmers across the country.
Micro-irrigation business
Your Company made a foray in this space through the acquisition of a stake in EPC Industriè Limited, one of India’s leading micro-irrigation companies. By focussing on strengthening its presence in existing markets, the business achieved 29% growth over the previous year.
Micro-irrigation offers tremendous benefits to the farmer, including water savings of more than 25%, reduced expenditure on labour and fertiliser and higher productivity. By virtue of this development, your Company will be able to help the farmer to better utilise scarce water resources and thereby contribute to overall water conservation in the country.
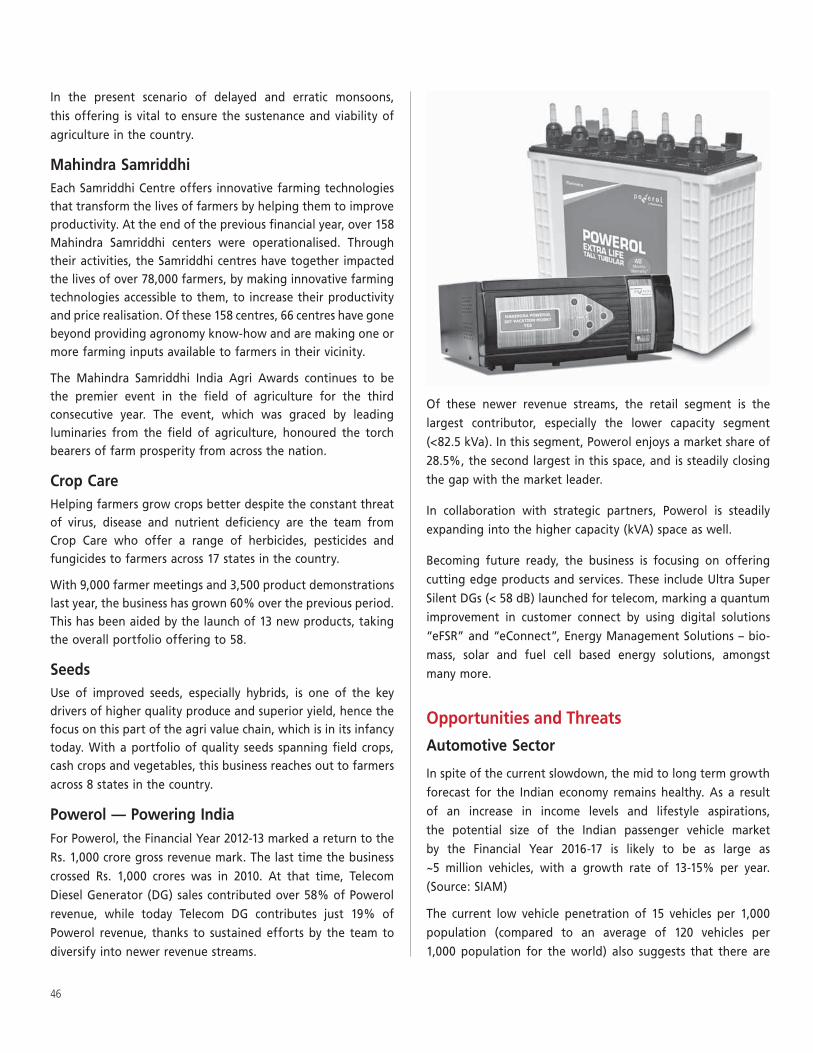
46
In the present scenario of delayed and erratic monsoons, this offering is vital to ensure the sustenance and viability of agriculture in the country.
Mahindra SamriddhiEach Samriddhi Centre offers innovative farming technologies that transform the lives of farmers by helping them to improve productivity. At the end of the previous financial year, over 158 Mahindra Samriddhi centers were operationalised. Through their activities, the Samriddhi centres have together impacted the lives of over 78,000 farmers, by making innovative farming technologies accessible to them, to increase their productivity and price realisation. Of these 158 centres, 66 centres have gone beyond providing agronomy know-how and are making one or more farming inputs available to farmers in their vicinity.
The Mahindra Samriddhi India Agri Awards continues to be the premier event in the field of agriculture for the third consecutive year. The event, which was graced by leading luminaries from the field of agriculture, honoured the torch bearers of farm prosperity from across the nation.
Crop CareHelping farmers grow crops better despite the constant threat of virus, disease and nutrient deficiency are the team from Crop Care who offer a range of herbicides, pesticides and fungicides to farmers across 17 states in the country.
With 9,000 farmer meetings and 3,500 product demonstrations last year, the business has grown 60% over the previous period. This has been aided by the launch of 13 new products, taking the overall portfolio offering to 58.
SeedsUse of improved seeds, especially hybrids, is one of the key drivers of higher quality produce and superior yield, hence the focus on this part of the agri value chain, which is in its infancy today. With a portfolio of quality seeds spanning field crops, cash crops and vegetables, this business reaches out to farmers across 8 states in the country.
Powerol — Powering IndiaFor Powerol, the Financial Year 2012-13 marked a return to the Rs. 1,000 crore gross revenue mark. The last time the business crossed Rs. 1,000 crores was in 2010. At that time, Telecom Diesel Generator (DG) sales contributed over 58% of Powerol revenue, while today Telecom DG contributes just 19% of Powerol revenue, thanks to sustained efforts by the team to diversify into newer revenue streams.
Of these newer revenue streams, the retail segment is the largest contributor, especially the lower capacity segment (<82.5 kVa). In this segment, Powerol enjoys a market share of 28.5%, the second largest in this space, and is steadily closing the gap with the market leader.
In collaboration with strategic partners, Powerol is steadily expanding into the higher capacity (kVA) space as well.
Becoming future ready, the business is focusing on offering cutting edge products and services. These include Ultra Super Silent DGs (< 58 dB) launched for telecom, marking a quantum improvement in customer connect by using digital solutions “eFSR” and “eConnect”, Energy Management Solutions – bio-mass, solar and fuel cell based energy solutions, amongst many more.
Opportunities and Threats
Automotive Sector
In spite of the current slowdown, the mid to long term growth forecast for the Indian economy remains healthy. As a result of an increase in income levels and lifestyle aspirations, the potential size of the Indian passenger vehicle market by the Financial Year 2016-17 is likely to be as large as ~5 million vehicles, with a growth rate of 13-15% per year. (Source: SIAM)
The current low vehicle penetration of 15 vehicles per 1,000 population (compared to an average of 120 vehicles per 1,000 population for the world) also suggests that there are
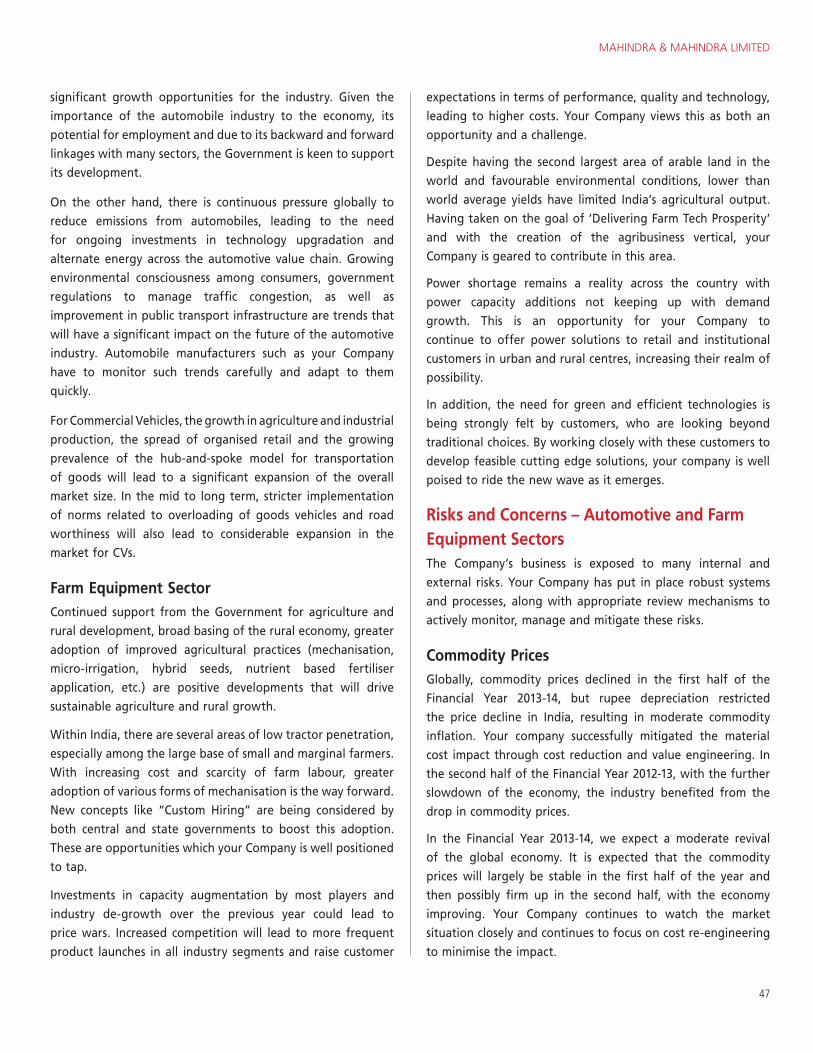
MAHINDRA & MAHINDRA LIMITED
47
significant growth opportunities for the industry. Given the importance of the automobile industry to the economy, its potential for employment and due to its backward and forward linkages with many sectors, the Government is keen to support its development.
On the other hand, there is continuous pressure globally to reduce emissions from automobiles, leading to the need for ongoing investments in technology upgradation and alternate energy across the automotive value chain. Growing environmental consciousness among consumers, government regulations to manage traffic congestion, as well as improvement in public transport infrastructure are trends that will have a significant impact on the future of the automotive industry. Automobile manufacturers such as your Company have to monitor such trends carefully and adapt to them quickly.
For Commercial Vehicles, the growth in agriculture and industrial production, the spread of organised retail and the growing prevalence of the hub-and-spoke model for transportation of goods will lead to a significant expansion of the overall market size. In the mid to long term, stricter implementation of norms related to overloading of goods vehicles and road worthiness will also lead to considerable expansion in the market for CVs.
Farm Equipment SectorContinued support from the Government for agriculture and rural development, broad basing of the rural economy, greater adoption of improved agricultural practices (mechanisation, micro-irrigation, hybrid seeds, nutrient based fertiliser application, etc.) are positive developments that will drive sustainable agriculture and rural growth.
Within India, there are several areas of low tractor penetration, especially among the large base of small and marginal farmers. With increasing cost and scarcity of farm labour, greater adoption of various forms of mechanisation is the way forward. New concepts like “Custom Hiring” are being considered by both central and state governments to boost this adoption. These are opportunities which your Company is well positioned to tap.
Investments in capacity augmentation by most players and industry de-growth over the previous year could lead to price wars. Increased competition will lead to more frequent product launches in all industry segments and raise customer
expectations in terms of performance, quality and technology, leading to higher costs. Your Company views this as both an opportunity and a challenge.
Despite having the second largest area of arable land in the world and favourable environmental conditions, lower than world average yields have limited India’s agricultural output. Having taken on the goal of ‘Delivering Farm Tech Prosperity’ and with the creation of the agribusiness vertical, your Company is geared to contribute in this area.
Power shortage remains a reality across the country with power capacity additions not keeping up with demand growth. This is an opportunity for your Company to continue to offer power solutions to retail and institutional customers in urban and rural centres, increasing their realm of possibility.
In addition, the need for green and efficient technologies is being strongly felt by customers, who are looking beyond traditional choices. By working closely with these customers to develop feasible cutting edge solutions, your company is well poised to ride the new wave as it emerges.
Risks and Concerns – Automotive and Farm Equipment SectorsThe Company’s business is exposed to many internal and external risks. Your Company has put in place robust systems and processes, along with appropriate review mechanisms to actively monitor, manage and mitigate these risks.
Commodity PricesGlobally, commodity prices declined in the first half of the Financial Year 2013-14, but rupee depreciation restricted the price decline in India, resulting in moderate commodity inflation. Your company successfully mitigated the material cost impact through cost reduction and value engineering. In the second half of the Financial Year 2012-13, with the further slowdown of the economy, the industry benefited from the drop in commodity prices.
In the Financial Year 2013-14, we expect a moderate revival of the global economy. It is expected that the commodity prices will largely be stable in the first half of the year and then possibly firm up in the second half, with the economy improving. Your Company continues to watch the market situation closely and continues to focus on cost re-engineering to minimise the impact.
48
CapacityWith the rapid growth of the Indian auto industry, some of the Company’s key suppliers occasionally face capacity constraints and are unable to meet demand peaks. This could lead to potential loss of volumes and market share. The Company is working closely with its key suppliers to minimise such supply constraints through capacity planning, capacity enhancement and longer term contracts. Opportunities for global sourcing are also being actively explored.
Competitive IntensityKeeping in mind the high growth potential of the Indian automotive market, all Original Equipment Manufacturers (OEMs) are actively investing in new product development and product technology upgrades.
Multinational OEMs are increasingly becoming India focused and developing products which are built around the needs of the Indian customer. Further, with increased local sourcing and development taking place in India, cost structures of multinational corporations are becoming competitive. Also, in the past, most MNC OEMs entering India were focused on the car market. In the recent past, they have started to focus on the UV segment as well. We expect this trend to continue, leading to the competition in the UV space becoming very intense.
With the strengthening of the hub and spoke transportation model, the need for vehicles in the feeder and distributor routes is going up. Keeping this trend in mind, many new products are being launched in the 2-3.5T Pick-Up segment, resulting in high competitive intensity.
Your Company continues to invest in new product development as well as technology upgrades and will focus on delivering customer centric products. Frugal innovation remains a thrust area for the Company as it moves forward.
Tax and Excise Duty RegulationsIn India, there is a large differential between taxes levied on small cars and larger vehicles. With the resulting lower price tag for small cars, many customers may opt to postpone large car purchases or buy a small car which could impact the growth of UVs and the large car segment.
In the Union budget 2013-14, the government levied 3% extra excise duty on SUVs larger than 4,000 mm length, with more than 170 mm ground clearance and engine capacity of more
than 1,500 cc for diesel engines. While most of your Company’s products fall within this description, certain key competitor products have the benefit of lower excise duty, offering them an advantage. Your Company is working on plans to meet the changing regulatory environment.
Many state governments have increased the registration tax for diesel vehicles. Almost all of your Company’s UV models are diesel powered and an increase in prices can have a negative impact on demand.
Diesel – Petrol price parityIn January 2013, the Government of India announced a policy for partial deregulation of diesel prices. In line with this policy and market dynamics, the diesel – petrol price gap has narrowed from Rs. 30 in Q1 F13 to Rs. 21 in Q4 F13. This will impact the cost of ownership and may have an impact on the demand of your Company’s products, as almost all its products are diesel powered.
Environment and Alternate fuelsStringent regulatory norms are being introduced to safeguard the environment, especially in the area of emissions. Your company has invested in appropriate technologies to meet these regulations.
At present, there is customer demand for vehicles powered by CNG, LPG and electric batteries, as well as hybrid powertrains and the Government is also promoting these. Your Company is well prepared to meet these demands. It has proactively invested in development of vehicles that run on CNG, bio diesel and hydrogen. Further, substantial progress has been made for development of a hybrid powertrain.
The launch of the Mahindra e2o, the next generation electric vehicle, in March 2013 was an important milestone in this direction. The vehicle was launched by Mahindra Reva Electric Vehicles Private Limited, a subsidiary of your Company. The company continues its effort to upgrade its EV technology capabilities.
Your Company has also developed tractors and gensets capable of running on bio-diesel which are a benchmark for fuel efficiency.
Financial Market ConditionsThe Reserve Bank of India (RBI) cut its policy rates – repo and CRR – beginning September 2012. The RBI delivered a total CRR reduction of 75 bps, in view of significant liquidity shortages in
MAHINDRA & MAHINDRA LIMITED
49
the system. It also cut the Repo rates by 50 bps during January – March of the Financial Year 2012-13. While the bond markets, led by GoI bonds, reflected some of these reductions, the Base Rates of leading banks remained unchanged. Hence, the cost of borrowing in the corporate loan market remained relatively high. The external commercial borrowings remained favourable as was the domestic bond market for good corporate credits. Your company however, was not a borrower during the year but retained a cash surplus throughout the year. The retail auto loans saw some corrections but no major reductions. However, your company’s products remained attractive financing propositions for financiers and availability of finance remained comfortable. The company also strengthened its banking relationships to ensure that financing for the ecosystem of suppliers and dealers is fortified to meet the requirements of business.
During the year, Current Account Deficit (CAD) attained
alarming proportions, sowing doubts about the sustainability
of INR strength. The slowdown in exports and increasing gold
imports were some key factors for the deficit. Your company
has a policy for hedging its net currency exposures to reduce
risks. However, continued CAD and the depreciation of INR can
have implications for the management of fiscal and monetary
policies and in turn, these may affect the financial markets.
Such adverse financial market developments can impact
demand, interest rates and foreign exchange exposures of your
company. Your company would strive to meet the challenges
arising out of these risks through a combination of preservation
of cash and robust financial flexibility.
New projectsIn order to meet customer needs and keep a watch on
competition, your Company is investing in an aggressive new
product development programme. The success of new product
launches will have an important bearing on its future growth
and profitability.
MonsoonA normal monsoon is vital for both agriculture as well as
the rural economy. The tractor business in particular and the
automotive business to some degree, run the risk of a drop in
demand in case of a significant variation in the monsoon, both
positive and negative. In addition, an untimely monsoon and
uneven spread have the potential of adversely impacting the
business.
Outlook – Automotive & Farm Equipment SectorsBoth the Automotive and Farm Equipment Sectors with their updated product portfolios and continued exploration of global horizons will strive to maintain their leadership position in their respective markets. Simultaneously, your Company will continue its focus on achieving cost leadership through focused cost optimisation, productivity improvements, value engineering, improved efficiency measures like supply chain management, connectivity of all its suppliers and dealers and exploiting synergies between its Sectors. The long term outlook for the automotive industry is bright and robust, though in the near term there are some challenges relating to the external environment. Inflation, interest rates, fuel prices and steep price hikes stemming from either commodity prices or taxes could dampen consumer confidence and sentiment which has always been a key determinant of automobile sales.
In the long term, the Indian economy is projected to grow rapidly and demand conditions are expected to remain strong. According to SIAM long term forecasts, the Indian automobile industry is expected to grow at an annual average rate of 10-15%. However, in the near term, the challenges as outlined above will have a bearing on demand and OEM profitability. For the Financial Year 2013-14, SIAM has projected a growth of 5-7% for the personal vehicle segment, 10-12% for the LCV Goods segment and 1-3% for the MHCV segment.
Similarly, in the case of tractors, the long term outlook continues to be positive with the tractor industry expected to continue to grow with a CAGR ranging between 7% and 10%.
Strategy
Automotive Sector
Your Company is pursuing several strategic initiatives in all key areas of business, to maintain a healthy and sustainable growth for its Automotive Sector. Some of the key elements of strategy include enriching the product portfolio to strengthen presence across various automotive segments, continually refreshing and updating products and strengthening R&D and technology capabilities.
In addition, your Company is pursuing expansion in overseas markets through organic and inorganic routes. Establishing the channel and building the brand in key focus markets remain the priorities for your Company.
50
With increasing concerns over global warming and the need for sustainable mobility, your Company continues to focus and invest in development of alternate fuel technologies and solutions in this area.
Farm Equipment Sector
The Farm Equipment Sector’s strategy is aligned to delivering Farm Tech Prosperity to the farmer. The core business of tractors will deliver this through its range of existing and future products that reduce drudgery and enhance farm productivity. At the same time, the business will continue to build on its position of global leadership in volumes across major markets around the world. In addition, your Company will offer a wider range of mechanisation solutions to make life easier and more prosperous for farmers. This will enable the organisation to offer farmers a range of inputs and know-how. All these together will thus, lead to greater farm productivity and deliver prosperity, strengthening the Company’s leadership position.
Material Developments in Human Resources/Industrial Relations for Automotive and Farm Equipment SectorsThe strategic purpose of Human Resources in the Mahindra Group is to be the change agent for creation of a cultural transformation to create competitiveness at the marketplace through sustained business outperformance while simultaneously addressing the needs of all its stakeholders, starting with customers and employees and strengthening the core values of the Group. In the long run, the metric for success would be improvements in the total factor productivity, while addressing the business imperatives of cash, cost, competence and confidence. The emphasis was on aligning all the HR levers towards achieving these goals.
In line with the above, the internal transformation journey through Rise to create a company of tomorrow saw a slew of initiatives taken to bring the Rise cultural pillars of Accepting No Limits, Alternative Thinking and Driving Positive Change alive through the nuts and bolts of HR levers. The philosophy of Rise and its three cultural pillars have got a buy-in from employees across the Group. In order to ensure internalization of this culture, the Mahindra Leadership Competency Framework has been developed and rolled out across the company. A complete integration of these competencies has been achieved in recruitment, on-boarding and other HR processes. We are now working towards integrating Rise with other HR levers like
Talent Management, Leadership Development, Rewards and Recognition and the Performance Management System.
In this overall architecture, some key strategic initiatives that need mention are employer branding, coupled with the employee value proposition to provide employees with a uniform One Mahindra experience. The template for creating Tomorrow’s Leaders and harnessing the power of diversity (across its many dimensions which include gender, age, nationality and culture) is also being put in place. There was huge focus on the Talent Management and Leadership Development process which included Development Centers, Individual Development Planning, e-learning, up-skilling programs, Leadership Lifecycle programs and action-learning projects. This was supplemented by a continuous dialogue with top management through Intranet and Fireside Chats. The Talent Management process has been strengthened with the Sector Councils and the Apex talent council playing a pivotal role in processes like Succession Planning, Career Planning, Job Rotation, Hi-potential Identification and talent pipeline development process. The Performance Management System has helped in the integration of the Balanced Score Card with business goals which in turn have been aligned with individual goals through the annual goal setting process. The rigour in implementation has helped in creating a shared understanding and has tapped the discretionary efforts of employees in building a culture of outperformance. In order to ensure that the pulse of the employees is captured, a customized employee engagement model called MCARES has been launched and interventions to create an engaged workforce have been put in place.
A Leadership development process with a three tier approach, at the entry, middle and senior management levels, has been put in place. Tie-ups with Harvard Business School (HBS), Wharton School of Management, Ross School of Management – Michigan, Centre for Creative Leadership (CCL) – USA, Indian Institutes of Management and other leading management institutions in the country have helped us in a big way in building capability. The 3E approach (Experience, Exposure and Education) towards capability building has been integrated into the development process and capability building. Experience is delivered by providing people with meaningful roles/projects, Exposure happens through coaching and mentoring by leaders and Education by building mental acumen through development programs and classroom training. We are trying to bring together the various learning initiatives under one common
MAHINDRA & MAHINDRA LIMITED
51
Discussion on financial performance with respect to operational performance
OverviewThe financial statements have been prepared in compliance with the requirements of the Companies Act, 1956, and Generally Accepted Accounting Principles (GAAP) in India.
The Group’s consolidated financial statements have been prepared in compliance with the standard AS 21 on Consolidation of Accounts and presented in a separate section.
Financial Information [Standalone]
Fixed Assets:
As at 31st March 2013 the Fixed Assets was Rs. 5,821.34 crores as compared to Rs. 5,088.08 crores as at 31st March 2012. During the year, the Company incurred capital expenditure of Rs. 1,435.62 crores (previous year Rs. 1,374.69 crores). The major items of capital expenditure were on New Product Development, Capacity Enhancement and Research & Development, including on the Company’s research facility in Chennai.
Inventories:
March 31, 2013 March 31, 2012
Raw materials and bought out components as a % of cost of materials consumed 3.85% 4.43%
Finished goods and Stock-in-trade as a % of sales of products 3.11% 3.74%
The reduction in raw material and bought out components as a percentage of consumption and of finished goods as a percentage of sales is due to better materials planning and control.
Trade Receivable:Trade Receivable is Rs. 2,208.35 crores as at March 31, 2013, as compared with Rs. 1,928.53 crores as at March 31, 2012. Though higher as an absolute amount, as a percentage of Gross revenue from sales of products and services, trade receivable is lower at 5.15% for the year ended March 31, 2013, as compared to 5.69% for the previous year. The increase in the trade receivable levels during the current year is due to growth in the volume of auto sales.
umbrella to synergize and create a learning organization. The project of integrating and creating e-enabled services covering 24 HR processes has been nearly completed and we are able to see positive results emerging out of it.
The Rise internalization programs not only covered officers but also the workmen on the shop-floor and there has been a whole-hearted participation by workmen in all the manufacturing plants. The Transformational Work Culture initiative has gained acceptance on the shop floor and the Transformational Work Culture Committee (TWCC) is working on a long term strategy and approach with a view to ensure a productive shop-floor and build competitiveness at the marketplace. Although the overall Industrial Relations climate in the country and the industry has been adverse, we have been able to maintain cordial relations. Our philosophy of solving issues through dialogue and building trust has helped us to a large extent in maintaining harmony on the shop floor. The strife at two of our manufacturing locations has also been resolved amicably. In order to foster togetherness at the workplace, we organized training and engagement programs across all locations for developing behavioural and technical skills of workmen. These training programs covered a wide range of topics, including Positive Attitude, Stress Management, Creativity, Team Effectiveness, Safety and Environment, Quality Tools, TPM, Dexterity and Technical Training.
The permanent employee strength of Mahindra & Mahindra Limited as on 31st March 2013 was 19,434.
Internal Control SystemsThe Company maintains adequate internal control systems commensurate with the nature of its business and size and complexity of its operations. These are regularly tested for their effectiveness by Statutory as well as Internal Auditors. In the highly networked IT environment of the company, validation of IT Security receives focussed attention from IT specialists and Statutory Auditors. The Company has a strong and independent internal audit function consisting of professionally qualified accountants and engineers. The Chief Internal Auditor reports directly to the Chairman of the Board. Significant observations made by the internal audit team and the follow up actions thereon are reported to the audit committee. The audit committee reviews the adequacy and effectiveness of the company’s internal control environment and monitors the implementation of audit recommendations.
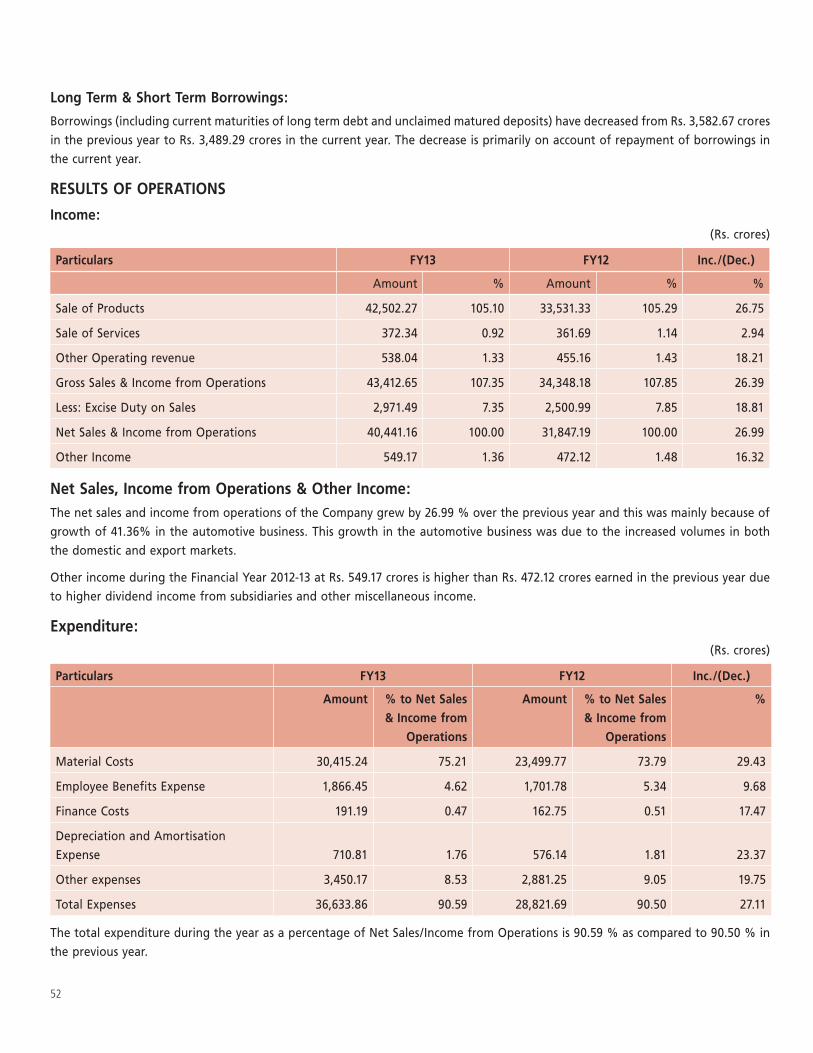
52
Long Term & Short Term Borrowings:
Borrowings (including current maturities of long term debt and unclaimed matured deposits) have decreased from Rs. 3,582.67 crores in the previous year to Rs. 3,489.29 crores in the current year. The decrease is primarily on account of repayment of borrowings in the current year.
RESULTS OF OPERATIONS
Income:(Rs. crores)
Particulars FY13 FY12 Inc./(Dec.)
Amount % Amount % %
Sale of Products 42,502.27 105.10 33,531.33 105.29 26.75
Sale of Services 372.34 0.92 361.69 1.14 2.94
Other Operating revenue 538.04 1.33 455.16 1.43 18.21
Gross Sales & Income from Operations 43,412.65 107.35 34,348.18 107.85 26.39
Less: Excise Duty on Sales 2,971.49 7.35 2,500.99 7.85 18.81
Net Sales & Income from Operations 40,441.16 100.00 31,847.19 100.00 26.99
Other Income 549.17 1.36 472.12 1.48 16.32
Net Sales, Income from Operations & Other Income:The net sales and income from operations of the Company grew by 26.99 % over the previous year and this was mainly because of growth of 41.36% in the automotive business. This growth in the automotive business was due to the increased volumes in both the domestic and export markets.
Other income during the Financial Year 2012-13 at Rs. 549.17 crores is higher than Rs. 472.12 crores earned in the previous year due to higher dividend income from subsidiaries and other miscellaneous income.
Expenditure: (Rs. crores)
Particulars FY13 FY12 Inc./(Dec.)
Amount % to Net Sales & Income from
Operations
Amount % to Net Sales & Income from
Operations
%
Material Costs 30,415.24 75.21 23,499.77 73.79 29.43
Employee Benefits Expense 1,866.45 4.62 1,701.78 5.34 9.68
Finance Costs 191.19 0.47 162.75 0.51 17.47
Depreciation and Amortisation Expense 710.81 1.76 576.14 1.81 23.37
Other expenses 3,450.17 8.53 2,881.25 9.05 19.75
Total Expenses 36,633.86 90.59 28,821.69 90.50 27.11
The total expenditure during the year as a percentage of Net Sales/Income from Operations is 90.59 % as compared to 90.50 % in the previous year.

MAHINDRA & MAHINDRA LIMITED
53
Material Cost:
The increase in material cost has been largely driven by the rise in input cost due to increase in commodity prices and changes in product mix. The above were partially offset through selling price increase and continued cost reduction initiatives undertaken by the Company.
Personnel Cost:
Personnel cost has increased by 9.68% to Rs. 1,866.45 crores from Rs. 1,701.78 crores in the previous year. This is mainly due to increase in strength and annual increments during the year.
Other Expenses:
Other expenses as a percentage of net sales and operating income shows a decrease over the previous year. However, expenses in absolute terms are higher due to increased marketing related expenses on warranty, incentives, advertisement and sales promotion due to greater volumes and for brand building.
Depreciation and Amortisation:
The depreciation and amortisation for the year ended March 31, 2013 stood at Rs. 710.81 crores as compared to Rs. 576.14 crores in the previous year. This is due to the impact in the current year on account capitalization of assets during the year and increased amortisation of intangibles.
Finance Costs:
The interest expense for the year ended March 31, 2013 is Rs. 191.19 crores as compared to Rs. 162.75 crores in the previous year. This is mainly due to vendor bill discounting scheme.
Exceptional Item:
The profit from Exceptional Item during the year ended 31st March 2013 is Rs. 90.62 crores as against Rs. 108.27 crores in the previous year. The profit in the current year is on account of profit earned on sale of shares of Mahindra Holidays & Resorts India Limited. The Exceptional item in the previous year was on account of reversal of provision for impairment of assets, acquired as part of the merger of the automotive business of Mahindra Automobile Distributor Private Limited with the Company as per Scheme of Arrangement.
Provision for taxation:
The provision for current tax and deferred tax for the year ended March 31, 2013 as a percentage to profit before tax is higher than the previous year, because of a revaluation of the Company’s deferred tax liability due to increase in the statutory tax rate from 32.45% to 33.99%. Moreover, the tax charge during last year was lower due to the unabsorbed tax losses of the automotive division of MADPL which became available to the Company on the merger of that division with the Company.
Consolidated Financial Position of the Mahindra Group
As of 31st March 2013, the Group comprised of the flagship holding company, Mahindra & Mahindra Limited, 123 Subsidiaries, 5 Joint Ventures and 12 Associates.
The Gross Revenue & Other Income for the year ended 31st March 2013 of the Consolidated Mahindra Group is Rs. 74,403.0 crores as against Rs. 63,357.80 crores for the previous year. The Group’s net revenue and other income grew by 15.7% to Rs. 69,124.60 crores in the current year from Rs. 59,744.95 crores in F-2012. The profit before exceptional items and tax for the current year is Rs. 5,127.87 crores as compared to Rs. 4,122.76 crores in the previous year. The consolidated Group Profit for the year after exceptional items, prior period adjustments and tax and after deducting minority interest is Rs. 4,099.20 crores as against Rs. 3,126.66 crores earned last year.
Tech Mahindra Ltd., the company’s flagship company in the IT Sector, has reported consolidated revenue of Rs. 6,873.08 crores in April 2012 – March 2013 as against Rs. 5,489.69 crores in the previous year – an increase of 25.2%. Its consolidated PAT, backed by an impressive performance by its associate Mahindra Satyam, grew by 17.6% to Rs. 1,287.81 crores as against Rs. 1,095.54 crores in the previous year. During the year, Tech Mahindra acquired a 100% stake in Hutchison Global Services Private Limited (a company engaged in providing BPO services) and a 55.67% stake in Comviva (a global leader in providing mobile value added services).
The Group’s finance company, Mahindra & Mahindra Financial Services Limited (MMFSL), maintained a healthy growth in business and profits despite the slowdown in the auto and tractor industry and the continuing high cost of borrowings,
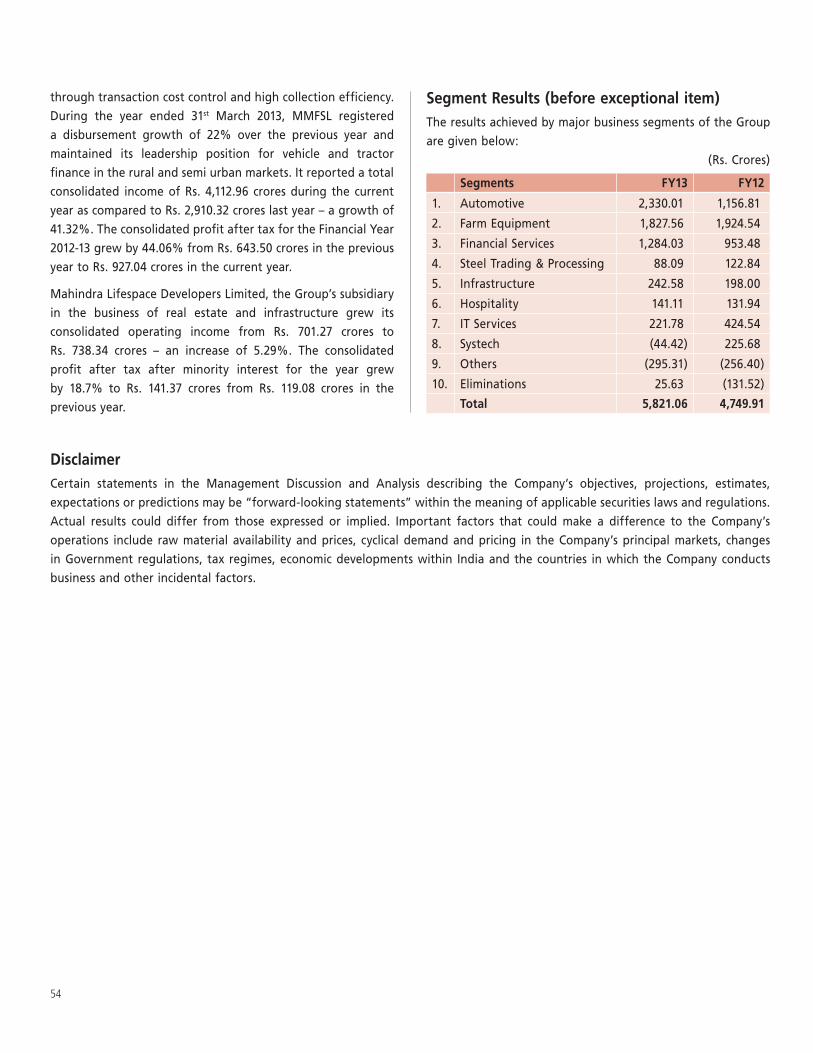
54
through transaction cost control and high collection efficiency. During the year ended 31st March 2013, MMFSL registered a disbursement growth of 22% over the previous year and maintained its leadership position for vehicle and tractor finance in the rural and semi urban markets. It reported a total consolidated income of Rs. 4,112.96 crores during the current year as compared to Rs. 2,910.32 crores last year – a growth of 41.32%. The consolidated profit after tax for the Financial Year 2012-13 grew by 44.06% from Rs. 643.50 crores in the previous year to Rs. 927.04 crores in the current year.
Mahindra Lifespace Developers Limited, the Group’s subsidiary in the business of real estate and infrastructure grew its consolidated operating income from Rs. 701.27 crores to Rs. 738.34 crores – an increase of 5.29%. The consolidated profit after tax after minority interest for the year grew by 18.7% to Rs. 141.37 crores from Rs. 119.08 crores in the previous year.
Segment Results (before exceptional item)The results achieved by major business segments of the Group are given below:
(Rs. Crores)
Segments FY13 FY12
1. Automotive 2,330.01 1,156.81
2. Farm Equipment 1,827.56 1,924.54
3. Financial Services 1,284.03 953.48
4. Steel Trading & Processing 88.09 122.84
5. Infrastructure 242.58 198.00
6. Hospitality 141.11 131.94
7. IT Services 221.78 424.54
8. Systech (44.42) 225.68
9. Others (295.31) (256.40)
10. Eliminations 25.63 (131.52)
Total 5,821.06 4,749.91
DisclaimerCertain statements in the Management Discussion and Analysis describing the Company’s objectives, projections, estimates, expectations or predictions may be “forward-looking statements” within the meaning of applicable securities laws and regulations. Actual results could differ from those expressed or implied. Important factors that could make a difference to the Company’s operations include raw material availability and prices, cyclical demand and pricing in the Company’s principal markets, changes in Government regulations, tax regimes, economic developments within India and the countries in which the Company conducts business and other incidental factors.


MAHINDRA & MAHINDRA LIMITED
57
Your Company’s Governance practices are built on core
values, beliefs and ethics derived through sustained efforts
and commitment to the highest standards of Corporate
Conduct.
Your Company believes that sound Corporate Governance
is critical for enhancing long-term shareholder value and
retaining investor trust.
A Report on compliance with the Code of Corporate Governance
as prescribed by the Securities and Exchange Board of India
and incorporated in the Listing Agreement is given below.
I. Board of Directors
The composition of the Board of your Company is in conformity
with Clause 49 of the Listing Agreement, as amended from
time to time. The Chairman & Managing Director of the
Company, though a Professional Director in his individual
capacity, is a Promoter and the number of Non-Executive
Independent Directors is more than one-half of the total
number of Directors. The Board reviews and approves
strategy and oversees the actions and results of the
management to ensure that the long term objectives of
enhancing stakeholders’ value are met.
The Chairman & Managing Director and the Executive
Director & Group Chief Financial Officer are the Whole-time
Directors of your Company. The remaining Non-Executive
Directors, comprising of ten Independent Directors and one
Non-Independent Non-Executive Director as on 31st March
2013 possess the requisite qualifications and experience in
general corporate management, finance, banking, insurance,
economics and other allied fields which enable them to
contribute effectively to the Company in their capacity as
Directors of the Company.
As reported in the Annual Report for the Financial Year 2012,
Mr. Keshub Mahindra relinquished his office as Chairman
and Director of the Company at the conclusion of the
66th Annual General Meeting (“AGM”) of the Shareholders
held on 8th August 2012. Consequent to the above mentioned Board level change, Mr. Anand G. Mahindra was elevated to the position of Chairman and designated as Chairman & Managing Director of the Company with effect from the conclusion of the 66th AGM of the Shareholders held on
8th August 2012.
Apart from reimbursement of expenses incurred in the
discharge of their duties, the remuneration that these
Directors would be entitled under the Companies Act, 1956
as Non-Executive Directors and the remuneration that a
Director may receive for professional services rendered to the
Company through a firm in which he is a partner, none of
these Directors has any other material pecuniary relationships
or transactions with the Company, its Promoters, its Directors,
its Senior Management or its Subsidiaries and Associates
which in their judgment would affect their independence.
None of the Directors of the Company are inter-se related to
each other.
Professional fees for the year under review to Khaitan
& Co., Advocates & Solicitors, in which Mr. R. K. Kulkarni,
Non-Executive and Independent Director is a partner, amounted
to Rs. 389.67 lakhs (including out of pocket expenses).
The Senior Management of the Company have made
disclosures to the Board confirming that there are no material,
financial and/or commercial transactions between them and
the Company which could have potential conflict of interest
with the Company at large.
CORPORATE GOVERNANCE
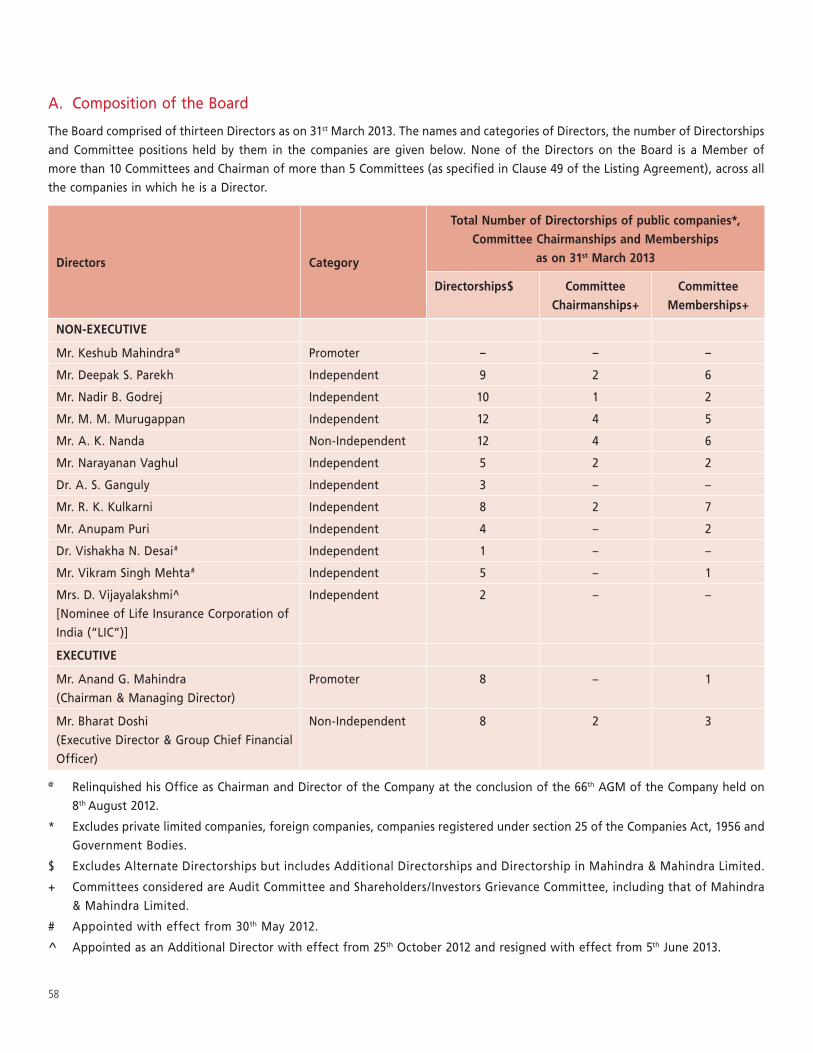
58
A. Composition of the Board
The Board comprised of thirteen Directors as on 31st March 2013. The names and categories of Directors, the number of Directorships and Committee positions held by them in the companies are given below. None of the Directors on the Board is a Member of more than 10 Committees and Chairman of more than 5 Committees (as specified in Clause 49 of the Listing Agreement), across all the companies in which he is a Director.
Directors Category
Total Number of Directorships of public companies*, Committee Chairmanships and Memberships
as on 31st March 2013
Directorships$ Committee Chairmanships+
Committee Memberships+
NON-EXECUTIVE
Mr. Keshub Mahindra@ Promoter – – –
Mr. Deepak S. Parekh Independent 9 2 6
Mr. Nadir B. Godrej Independent 10 1 2
Mr. M. M. Murugappan Independent 12 4 5
Mr. A. K. Nanda Non-Independent 12 4 6
Mr. Narayanan Vaghul Independent 5 2 2
Dr. A. S. Ganguly Independent 3 – –
Mr. R. K. Kulkarni Independent 8 2 7
Mr. Anupam Puri Independent 4 – 2
Dr. Vishakha N. Desai# Independent 1 – –
Mr. Vikram Singh Mehta# Independent 5 – 1
Mrs. D. Vijayalakshmi^ [Nominee of Life Insurance Corporation of India (“LIC”)]
Independent 2 – –
EXECUTIVE
Mr. Anand G. Mahindra (Chairman & Managing Director)
Promoter 8 – 1
Mr. Bharat Doshi (Executive Director & Group Chief Financial Officer)
Non-Independent 8 2 3
@ Relinquished his Office as Chairman and Director of the Company at the conclusion of the 66th AGM of the Company held on 8th August 2012.
* Excludes private limited companies, foreign companies, companies registered under section 25 of the Companies Act, 1956 and Government Bodies.
$ Excludes Alternate Directorships but includes Additional Directorships and Directorship in Mahindra & Mahindra Limited.
+ Committees considered are Audit Committee and Shareholders/Investors Grievance Committee, including that of Mahindra & Mahindra Limited.
# Appointed with effect from 30th May 2012.
^ Appointed as an Additional Director with effect from 25th October 2012 and resigned with effect from 5th June 2013.
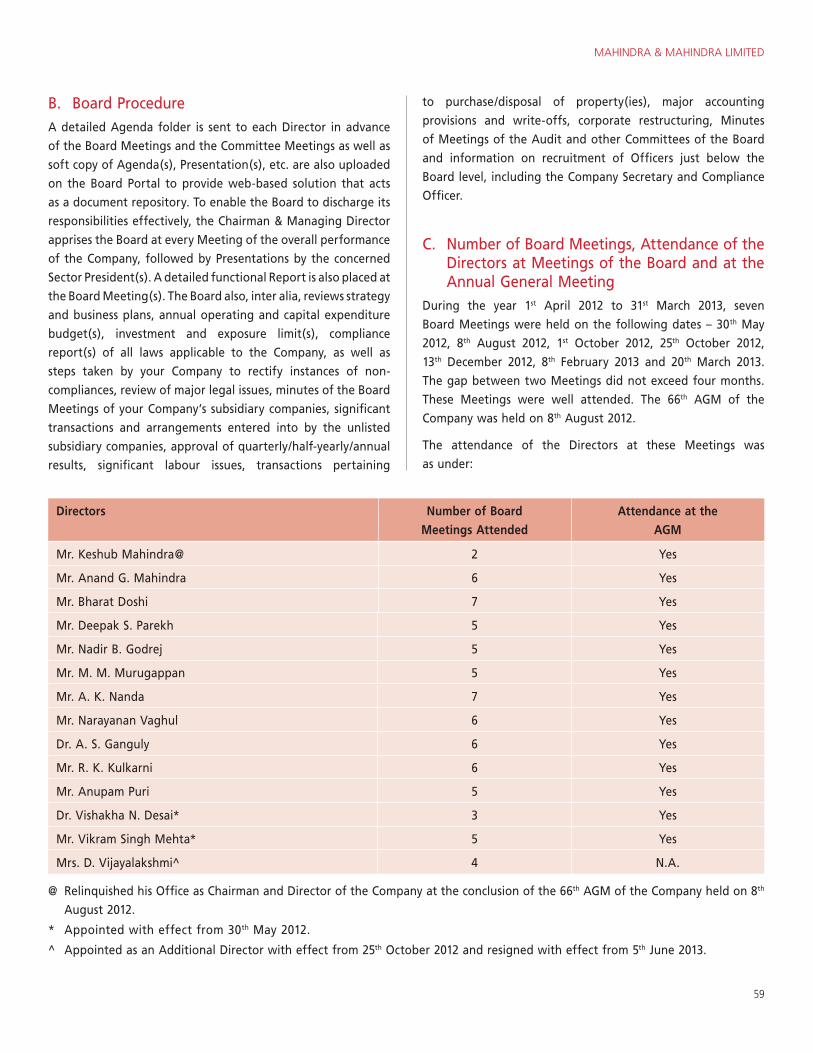
MAHINDRA & MAHINDRA LIMITED
59
B. Board ProcedureA detailed Agenda folder is sent to each Director in advance of the Board Meetings and the Committee Meetings as well as soft copy of Agenda(s), Presentation(s), etc. are also uploaded on the Board Portal to provide web-based solution that acts as a document repository. To enable the Board to discharge its responsibilities effectively, the Chairman & Managing Director apprises the Board at every Meeting of the overall performance of the Company, followed by Presentations by the concerned Sector President(s). A detailed functional Report is also placed at the Board Meeting(s). The Board also, inter alia, reviews strategy and business plans, annual operating and capital expenditure budget(s), investment and exposure limit(s), compliance report(s) of all laws applicable to the Company, as well as steps taken by your Company to rectify instances of non-compliances, review of major legal issues, minutes of the Board Meetings of your Company’s subsidiary companies, significant transactions and arrangements entered into by the unlisted subsidiary companies, approval of quarterly/half -yearly/annual results, significant labour issues, transactions pertaining
to purchase/disposal of property(ies), major accounting provisions and write-offs, corporate restructuring, Minutes of Meetings of the Audit and other Committees of the Board and information on recruitment of Officers just below the Board level, including the Company Secretary and Compliance Officer.
C. Number of Board Meetings, Attendance of the Directors at Meetings of the Board and at the Annual General Meeting
During the year 1st April 2012 to 31st March 2013, seven Board Meetings were held on the following dates – 30th May 2012, 8th August 2012, 1st October 2012, 25th October 2012, 13th December 2012, 8th February 2013 and 20th March 2013. The gap between two Meetings did not exceed four months. These Meetings were well attended. The 66th AGM of the Company was held on 8th August 2012.
The attendance of the Directors at these Meetings was as under:
Directors Number of Board Meetings Attended
Attendance at the AGM
Mr. Keshub Mahindra@ 2 Yes
Mr. Anand G. Mahindra 6 Yes
Mr. Bharat Doshi 7 Yes
Mr. Deepak S. Parekh 5 Yes
Mr. Nadir B. Godrej 5 Yes
Mr. M. M. Murugappan 5 Yes
Mr. A. K. Nanda 7 Yes
Mr. Narayanan Vaghul 6 Yes
Dr. A. S. Ganguly 6 Yes
Mr. R. K. Kulkarni 6 Yes
Mr. Anupam Puri 5 Yes
Dr. Vishakha N. Desai* 3 Yes
Mr. Vikram Singh Mehta* 5 Yes
Mrs. D. Vijayalakshmi^ 4 N.A.
@ Relinquished his Office as Chairman and Director of the Company at the conclusion of the 66th AGM of the Company held on 8th
August 2012.
* Appointed with effect from 30th May 2012.
^ Appointed as an Additional Director with effect from 25th October 2012 and resigned with effect from 5th June 2013.
60
D. Meetings of Independent DirectorsThe Independent Directors of the Company meet before the Board Meeting to examine various Corporate Governance issues, functioning of the Company and of the Group and other issues without the presence of Chairman & Managing Director or Executive Director & Group Chief Financial Officer or any other Management Personnel. These Meetings are conducted in an informal and flexible manner to enable the Independent Directors to discuss matters pertaining to the affairs of the Company and put forth their views and recommend their suggestions to the Board.
E. Directors seeking Re-appointment/AppointmentMr. Anand G. Mahindra, Mr. Nadir B. Godrej, Mr. Anupam Puri and Dr. A. S. Ganguly retire by rotation and are eligible for re-appointment at the forthcoming AGM of the Company. Mr. Anand G. Mahindra, Mr. Nadir B. Godrej and Mr. Anupam Puri have offered themselves for re-appointment, whereas Dr. A. S. Ganguly has expressed his desire not to seek re-appointment.
Mr. Anand G. Mahindra
Career Graph
Mr. Anand G. Mahindra, Chairman & Managing Director of Mahindra & Mahindra Limited graduated with Honours (Magna cum laude) from Harvard College, Cambridge, Massachusetts, in 1977. In 1981 he secured an MBA degree from the Harvard Business School, Boston, Massachusetts. He returned to India that year and joined Mahindra Ugine Steel Company Limited (“MUSCO”), the country’s foremost producer of specialty steels, as an Executive Assistant to the Finance Director. In 1989 he was appointed President and Deputy Managing Director of MUSCO.
During his stint at MUSCO, he initiated the Mahindra Group’s diversification into the new business areas of real estate development and hospitality management.
In the summer of 1991, he was appointed as Deputy Managing Director of Mahindra & Mahindra Limited, the country’s dominant producer of off-road vehicles and agricultural tractors. He initiated a comprehensive change programme in Mahindra & Mahindra Limited to make the company an efficient and aggressive competitor in the new liberalized economic environment in India.
In April 1997, he was appointed as Managing Director of Mahindra & Mahindra Limited and in January 2001, given the additional responsibility of Vice-Chairman. He was appointed
as Chairman and designated as Chairman & Managing Director with effect from the conclusion of the 66th AGM of the Company held on 8th August 2012.
During Mr. Mahindra’s tenure, the Mahindra Group has also grown inorganically, seizing opportunities across the globe. Recent acquisitions include Ssangyong Motor Company, Mahindra Reva Electric Vehicles Private Limited, Satyam Computer Services Limited, Aerostaff Australia Pty. Limited and Gippsland Aeronautics among others.
Industry Participant
Mr. Mahindra is the co-founder of the Harvard Business School Association of India, an association dedicated to the promotion of professional management in India.
Mr. Mahindra is currently the Chairman & Managing Director of Mahindra & Mahindra Limited, Vice-Chairman of Mahindra Ugine Steel Company Limited, Chairman of Tech Mahindra Limited, Mahindra Trucks and Buses Limited, Mahindra First Choice Wheels Limited, Mahindra Two Wheelers Limited and Director of Mahindra Holdings Limited, Tech Mahindra Foundation, Prudential Management & Services Private Limited, Araku Originals Limited, Naandi Community Water Services Private Limited, Avion Aerosols Private Limited, M.A.R.K. Hotels Private Limited and Prana Holdings Inc.
He was a co-promoter of Kotak Mahindra Finance Limited, which in 2003 was converted into a Bank. Kotak Mahindra is one of the foremost private sector banks today.
As a leading industry figure, he has served as President of the Confederation of Indian Industry in 2003-04 and has also been President of the Automotive Research Association of India (ARAI). He has also served on the Boards of the National Stock Exchange of India Limited and the National Council of Applied Economic Research and as a Member of the Council of Scientific & Industrial Research.
Recognition
Mr. Mahindra continues to receive several honours, a few of which have been the ‘Knight of the Order of Merit’ conferred on him by the President of the French Republic, Rajiv Gandhi Award 2004 for outstanding contribution in the business field, 2005 Leadership Award from the American India Foundation for his and the Mahindra Group’s commitment to corporate social responsibility, CNBC Asia Business Leader Award for the Year 2006, The Most Inspiring Corporate Leader of the Year 2007 from NDTV Profit, Business
MAHINDRA & MAHINDRA LIMITED
61
Man of the Year 2007 from Business India, Harvard Business School Alumni Achievement Award 2008, National Statesman for Excellence in Business Practices – Qimpro Platinum Standard 2008 Award by Qimpro Foundation, CNBC TV18 Outstanding Business Leader of the Year 2009, Business Leader of the Year 2009 by The Economic Times, Ernst & Young Entrepreneur of the Year India Award for 2009, Indian of the Year Award 2009 by NDTV, IMC Juran Quality Medal 2010 by IMC Ramkrishna Bajaj National Quality Award Trust, featured in Asia’s 25 most powerful business people of 2011 by Fortune Magazine, Lloyds Banking Group Business Leader of the Year Award at The Asian Awards 2011, JRD Tata Corporate Leadership Award 2011 from the All India Management Association, Global Leadership Award June 2012 by the US-India Business Council, Business Courage Award 2012 by Asia Business Leadership Forum, Best Transformational Leader Award 2012 by the Asian Centre For Corporate Governance & Sustainability and Business Leader of the Year 2012 by NDTV.
Mr. Mahindra is a Member of the following Board Committees:
Sr. No.
Name of the Company
Name of the Committee Position held
1. Mahindra & Mahindra Limited
Strategic Investment Committee
Chairman
Loans & Investment Committee
Chairman
Corporate Social Responsibility Committee
Chairman
Share Transfer and Shareholders/Investors Grievance Committee
Member
Research & Development Committee
Member
2. Mahindra Two Wheelers Limited
Remuneration Committee
Member
3. Mahindra Trucks and Buses Limited
Remuneration Committee
Chairman
4. Mahindra Holdings Limited
Loans & Investment Committee
Member
Mr. Anand G. Mahindra holds 6,75,004 Ordinary (Equity) Shares in the Company.
Mr. Nadir B. Godrej
Mr. Nadir B. Godrej joined the Board in 1992. He holds a Master of Science degree in Chemical Engineering from Stanford University and an MBA from Harvard Business School. He has been a Director of several Godrej companies since 1977 and has developed the animal feed, agricultural
inputs and chemicals businesses of Godrej Industries and other associated companies, and has been very active in research.
Besides his professional assignments, Mr. Godrej was the former President of Oil Technologists’ Association of India, Indo-French Technical Association and the Compound Livestock Feed Manufacturers Association of India.
He is currently the Managing Director of Godrej Industries Limited, Chairman of Godrej Agrovet Limited, Godrej Tyson Foods Limited and Director of Godrej & Boyce Manufacturing Company Limited, Godrej Properties Limited, Godrej Consumer Products Limited, Mahindra & Mahindra Limited, Tata Teleservices (Maharashtra) Limited, Isprava Technologies Limited, The Indian Hotels Company Limited, Godrej International Limited, Godrej Global Mid East FZE, ACI Godrej Agrovet Private Limited; Bangladesh, Keyline Brands Limited, Rapidol (Pty) Limited, Godrej Nigeria Limited and Chairman of Poultry Processors’ Association of India.
Mr. Godrej is a Member of the following Board Committees:
Sr. No.
Name of the Company Name of Committee Position held
1. Godrej Consumer Products Limited
Shareholders Committee
Chairman
2. Mahindra & Mahindra Limited
Audit Committee Member
Strategic Investment Committee
Member
Governance, Remuneration and Nomination Committee
Member
Research & Development Committee
Member
Mr. Nadir B. Godrej holds 3,25,591 Ordinary (Equity) Shares in the Company.
Mr. Anupam Puri
Mr. Anupam Puri holds an M.Phil. in Economics from Nuffield College, Oxford University, 1969; an M.A. in Economics from Balliol College, Oxford University, 1967; and a B.A. in Economics from Delhi University, India, 1965. Mr. Puri was a Management Consultant with McKinsey & Company from 1970 to 2000. He has worked globally with corporate clients in several industries on strategy and organisational issues and has also served several Governments and multilateral institutions on public policy. Mr. Anupam Puri spearheaded the development of McKinsey’s India practice, oversaw the
62
Asian and Latin American offices and was an elected Member of the Board. He is currently a Member of the Board of Dr. Reddy’s Laboratories Limited, Mahindra & Mahindra Limited, Tech Mahindra Limited and Mumbai Mantra Media Limited as well as on the Advisory Boards of Corsair Capital and Spencer Stuart, India.
Mr. Puri is a Member of the following Board Committees:
Sr. No.
Name of the Company
Name of Committee
Position held
1. Mahindra & Mahindra Limited
Strategic Investment Committee
Member
2. Dr. Reddy’s Laboratories Limited
Governance and Compensation Committee
Chairman
3. Tech Mahindra Limited Audit Committee MemberCompensation Committee
Member
4. Mumbai Mantra Media Limited
Audit Committee Member
Mr. Anupam Puri does not hold any Ordinary (Equity) Shares in the Company.
F. Codes of ConductThe Board has laid down two separate Codes of Conduct (“Codes”), one for the Board Members and the other for the Senior Management and Employees of the Company. These Codes have been posted on the Company’s website http://www.mahindra.com. All the Board Members and Senior Management Personnel have affirmed compliance with these Codes. A declaration signed by the Chairman & Managing Director to this effect is enclosed at the end of this Report.
G. CEO/CFO Certification
As required under Clause 49 V of the Listing Agreement with the Stock Exchanges, the Chairman & Managing Director and the Executive Director & Group Chief Financial Officer of the Company have certified to the Board regarding the Financial Statements for the year ended 31st March 2013.
II. Remuneration to Directors A. Remuneration PolicyWhile deciding on the remuneration for Directors, the Board and the Governance, Remuneration and Nomination Committee (“Committee”) takes into consideration the performance of your Company, the current trends in the industry, the qualification
of the appointee(s), their experience, past performance and other relevant factors. The Board/ Committee regularly keeps track of the market trends in terms of compensation levels and practices in relevant industries. This information is used to review the Company’s remuneration policy(ies) from time to time.
B. Remuneration to Non-Executive Directors for the year ended 31st March 2013
The eligible Non-Executive Directors are paid commission upto a maximum of 1% of the net profits of the Company as specifically computed for this purpose.
During the year under review, the Non-Executive Directors were paid a commission of Rs. 172.99 lakhs (provided in the accounts for the year ended 31st March 2012), distributed amongst the Directors as under:
(Rs. in Lakhs)
DirectorsCommission for the year ended 31st March 2012, paid during the
year under review
Mr. Keshub Mahindra@ 56.00
Mr. Deepak S. Parekh 14.00
Mr. Nadir B. Godrej 14.00
Mr. M. M. Murugappan 14.00
Mr. A. K. Nanda 14.00
Mr. Narayanan Vaghul 14.00
Dr. A. S. Ganguly 14.00
Mr. R. K. Kulkarni 14.00*
Mr. Anupam Puri 14.00
Mr. Arun Kanti Dasgupta^ (Nominee of LIC)
4.99#
@ Relinquished his Office as Chairman and Director of the Company at the conclusion of the 66th AGM of the Company held on 8th August 2012.
* The commission was paid to Khaitan & Co., in which Mr. R.K. Kulkarni is a partner.
# The commission was paid to LIC.^ Resigned with effect from 9th August 2011.
A commission of Rs. 661.59 lakhs has been provided as payable to the Non-Executive Directors in the accounts for the year under review. Non-Executive Directors are also paid sitting fees of Rs. 20,000 for every Meeting of the Board or Committee attended other than the Share Transfer and Shareholders/ Investors Grievance Committee. The sitting fees for Share Transfer and Shareholders/Investors Grievance Committee is Rs. 10,000.
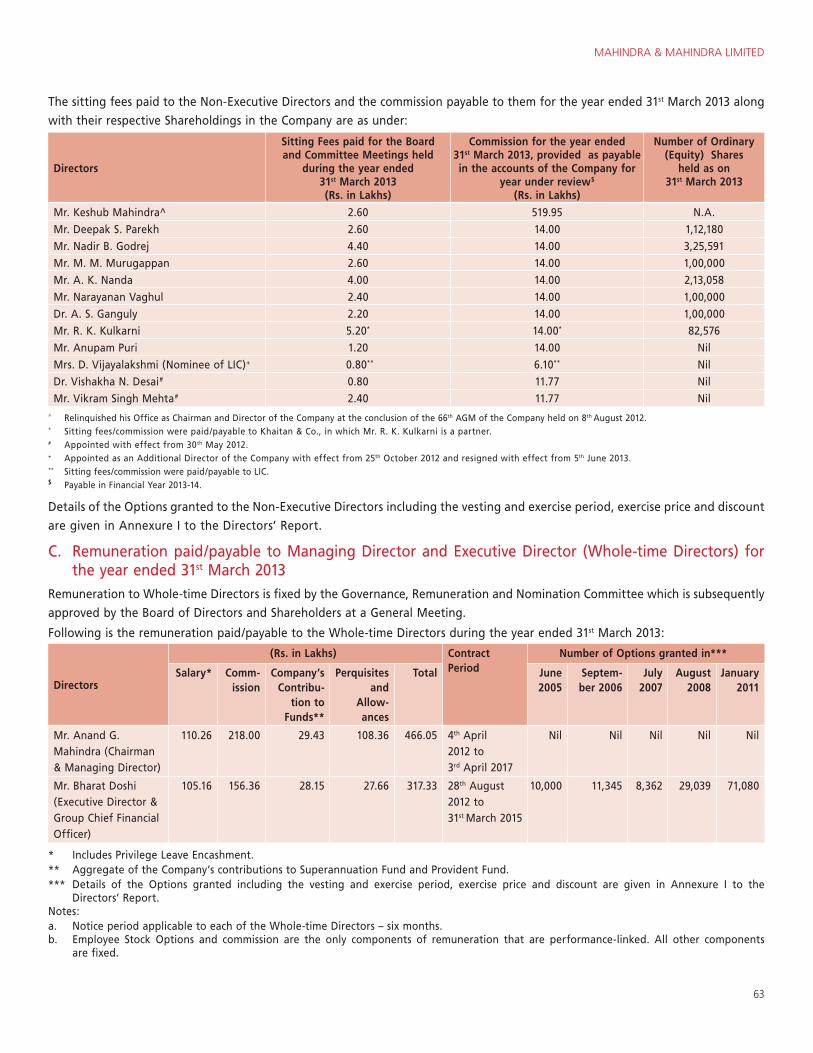
MAHINDRA & MAHINDRA LIMITED
63
The sitting fees paid to the Non-Executive Directors and the commission payable to them for the year ended 31st March 2013 along with their respective Shareholdings in the Company are as under:
Directors
Sitting Fees paid for the Board and Committee Meetings held
during the year ended 31st March 2013 (Rs. in Lakhs)
Commission for the year ended 31st March 2013, provided as payable in the accounts of the Company for
year under review$
(Rs. in Lakhs)
Number of Ordinary (Equity) Shares
held as on 31st March 2013
Mr. Keshub Mahindra^ 2.60 519.95 N.A.
Mr. Deepak S. Parekh 2.60 14.00 1,12,180
Mr. Nadir B. Godrej 4.40 14.00 3,25,591
Mr. M. M. Murugappan 2.60 14.00 1,00,000
Mr. A. K. Nanda 4.00 14.00 2,13,058
Mr. Narayanan Vaghul 2.40 14.00 1,00,000
Dr. A. S. Ganguly 2.20 14.00 1,00,000
Mr. R. K. Kulkarni 5.20* 14.00* 82,576
Mr. Anupam Puri 1.20 14.00 Nil
Mrs. D. Vijayalakshmi (Nominee of LIC)+ 0.80** 6.10** Nil
Dr. Vishakha N. Desai# 0.80 11.77 Nil
Mr. Vikram Singh Mehta# 2.40 11.77 Nil^ Relinquished his Office as Chairman and Director of the Company at the conclusion of the 66th AGM of the Company held on 8th August 2012.* Sitting fees/commission were paid/payable to Khaitan & Co., in which Mr. R. K. Kulkarni is a partner.# Appointed with effect from 30th May 2012.+ Appointed as an Additional Director of the Company with effect from 25th October 2012 and resigned with effect from 5th June 2013.** Sitting fees/commission were paid/payable to LIC.$ Payable in Financial Year 2013-14.
Details of the Options granted to the Non-Executive Directors including the vesting and exercise period, exercise price and discount are given in Annexure I to the Directors’ Report.
C. Remuneration paid/payable to Managing Director and Executive Director (Whole-time Directors) for the year ended 31st March 2013
Remuneration to Whole-time Directors is fixed by the Governance, Remuneration and Nomination Committee which is subsequently approved by the Board of Directors and Shareholders at a General Meeting.
Following is the remuneration paid/payable to the Whole-time Directors during the year ended 31st March 2013:
Directors
(Rs. in Lakhs) Contract Period
Number of Options granted in***
Salary* Comm- ission
Company’s Contribu-
tion to Funds**
Perquisites and
Allow- ances
Total June 2005
Septem- ber 2006
July 2007
August 2008
January 2011
Mr. Anand G. Mahindra (Chairman & Managing Director)
110.26 218.00 29.43 108.36 466.05 4th April 2012 to 3rd April 2017
Nil Nil Nil Nil Nil
Mr. Bharat Doshi (Executive Director & Group Chief Financial Officer)
105.16 156.36 28.15 27.66 317.33 28th August 2012 to 31st March 2015
10,000 11,345 8,362 29,039 71,080
* Includes Privilege Leave Encashment.** Aggregate of the Company’s contributions to Superannuation Fund and Provident Fund.*** Details of the Options granted including the vesting and exercise period, exercise price and discount are given in Annexure I to the
Directors’ Report.Notes:a. Notice period applicable to each of the Whole-time Directors – six months.b. Employee Stock Options and commission are the only components of remuneration that are performance-linked. All other components
are fixed.
64
III. Risk ManagementYour Company has a well-defined risk management framework in place. Further, your Company has established procedures to periodically place before the Board, the risk assessment and minimisation procedures being followed by the Company and steps taken by it to mitigate these risks.
IV. Committees of the Board
A. Audit CommitteeThis Committee comprises solely of Independent Directors viz. Mr. Deepak S. Parekh (Chairman of the Committee), Mr. Nadir B. Godrej, Mr. M. M. Murugappan and Mr. R. K. Kulkarni. All the Members of the Committee possess strong accounting and financial management knowledge. The Company Secretary is the Secretary to the Committee.
The terms of reference of this Committee are very wide. Besides having access to all the required information from within the Company, the Committee can obtain external professional advice whenever required. The Committee acts as a link between the Statutory and the Internal Auditors and the Board of Directors of the Company. It is authorised to select and establish accounting policies, review Reports of the Statutory and the Internal Auditors and meet with them to discuss their findings, suggestions and other related matters. The Committee is empowered to, inter alia, review the remuneration payable to the Statutory Auditors and to recommend a change in the Auditors, if felt necessary. It reviews Financial Statements and investments of unlisted subsidiary companies, Management Discussion & Analysis of financial condition and results of operations, material individual transactions with related parties not in normal course of business or which are not on an arm’s length basis. Generally all items listed in Clause 49 II (D) of the Listing Agreement are covered in the terms of reference. The Audit Committee has been granted powers as prescribed under Clause 49 II (C) and reviews all the information as prescribed in Clause 49 II (E). The Meetings of the Audit Committee are also attended by the Chairman & Managing Director, the Executive Director & Group Chief Financial Officer, the Group CIO, Executive Vice President – Group M&A, Finance & Accounts, the Executive Vice President – M&A and Secretarial, the Executive Vice President – Corporate Finance & Investor Relations, the Statutory Auditors, the Chief Internal Auditor, Controller of Accounts, Senior General Manager – Accounts and the Company Secretary. The Chairman of the Audit Committee,
Mr. Deepak S. Parekh was present at the 66th AGM of the Company held on 8th August 2012 to address the Shareholders’ queries pertaining to Annual Accounts of the Company.
The Committee met five times during the year under review. The Committee Meetings were held on the following dates – 29th May 2012, 7th August 2012, 25th October 2012, 7th February 2013 and 19th March 2013. The gap between two Meetings did not exceed four months. The attendance at the Meetings was as under:
Members Number of Meetings attended
Mr. Deepak S. Parekh (Chairman)
Mr. Nadir B. Godrej
Mr. M. M. Murugappan
Mr. R. K. Kulkarni
4
5
4
5
B. Governance, Remuneration and Nomination Committee
The Governance, Remuneration and Nomination Committee has been vested with the authority to, inter alia, recommend nominations for Board Membership, develop and recommend policies with respect to composition of the Board commensurate with the size, nature of the business and operations of the Company, establish criteria for selection to the Board with respect to the competencies, qualifications, experience, track record and integrity and establish Director retirement policies and appropriate succession plans and determine overall compensation policies of the Company.
The Committee also administers the Company’s ESOP Schemes formulated from time to time including “Mahindra & Mahindra Limited Employees’ Stock Option Scheme”, “Mahindra & Mahindra Limited Employees Stock Option Scheme-2010” and take appropriate decisions in terms of the concerned Scheme(s).
The scope of the Committee also includes review of market practices and decide on remuneration packages applicable to the Chairman & Managing Director, the Executive Director(s), Presidents, etc., lay down performance parameters for the Chairman & Managing Director, the Executive Director(s), Presidents, etc. and review the same.
The Committee currently comprises of Independent Directors which includes its Chairman.
MAHINDRA & MAHINDRA LIMITED
65
Mr. Narayanan Vaghul is the Chairman of the Committee. Mr. Nadir B. Godrej, Mr. M. M. Murugappan and Mr. R. K. Kulkarni are the other Members of the Committee. Mr. Anand G. Mahindra is a permanent invitee to the Committee.
The Committee met six times during the year under review. The attendance at the Meetings was as under:
Members Number of Meetings attended
Mr. Narayanan Vaghul (Chairman)
Mr. Keshub Mahindra*
Mr. Nadir B. Godrej
Mr. M. M. Murugappan
Mr. R. K. Kulkarni
6
3
6
4
6
* Relinquished his Office as Chairman and Director of the Company at the conclusion of the 66th AGM of the Company held on 8th August 2012.
C. Share Transfer and Shareholders/Investors Grievance Committee
The Company’s Share Transfer and Shareholders/Investors Grievance Committee currently functions under the Chairmanship of Mr. A. K. Nanda, Non-Independent Non-Executive Director. Mr. Anand G. Mahindra, Mr. Bharat Doshi and Mr. R. K. Kulkarni are also Members of the Committee. Mr. Narayan Shankar, Company Secretary is the Compliance Officer of the Company.
The Committee meets, as and when required to, inter alia, deal with matters relating to transfer of shares and monitor redressal of complaints from Shareholders relating to transfers, non-receipt of Annual Reports, non-receipt of dividends declared, etc. With a view to expedite the process of share transfers, necessary authority has been delegated to approve the transfers of not more than 10,000 Ordinary (Equity) Shares per transfer, provided the transferee does not hold 2,00,000 or more Ordinary (Equity) Shares in your Company.
The Committee met two times during the year. Both the Meetings were well attended by its Members. During the year, 32 complaints were received from the Shareholders, all of which have been attended to/resolved till date. As of date, there are no pending share transfers pertaining to the year under review.
D. Corporate Social Responsibility CommitteeThe Corporate Social Responsibility Committee is constituted by the Board with powers, inter alia, to make donations/contributions to any Charitable and/or other Institutions for the Company’s Corporate Social Responsibilitiy initiatives.
Pursuant to Clause 55 of the Listing Agreement with the Stock Exchanges, the scope of functions of the Committee has been enlarged, inter alia, to formulate and recommend to the Board for its approval and implementation, the Business Responsibility (“BR”) Policy(ies) of the Company, undertake periodical assessment of the Company’s BR performance, review the draft Business Responsibility Report and recommend the same to the Board for its approval and inclusion in the Annual Report of the Company.
Mr. Anand G. Mahindra is the Chairman of the Committee. Mr. Bharat Doshi, Mr. A. K. Nanda, Mr. R. K. Kulkarni and Dr. Vishakha N. Desai are the other Members of the Committee. The Committee met three times during the year. All the Meetings were well attended by the Members.
E. Research & Development Committee (a voluntary initiative of the Company)
The Research & Development (R&D) Committee, which was constituted by the Board in 1998, provides direction on the R&D mission and strategy and key R&D and technology issues. The Committee also reviews and makes recommendations on the skills and competencies required and the structure and the process needed to ensure that the R&D initiatives result in products that are in keeping with the business needs. Dr. A. S. Ganguly is the Chairman of the Committee. Mr. Anand G. Mahindra, Mr. Bharat Doshi, Mr. Nadir B. Godrej and Mr. M. M. Murugappan are the other Members of the Committee.
F. Strategic Investment Committee (a voluntary initiative of the Company)
The Strategic Investment Committee is constituted by the Board with powers, inter alia, to take up for evaluation and scrutinise significant investments/funding including but not limited to business acquisitions, reviewing and monitoring existing investments in Subsidiaries, Joint Ventures and other Group companies, overseeing and reviewing performance of various subsidiaries and make necessary recommendations to the Board from time to time including disinvestments. Mr. Anand G. Mahindra is the Chairman of the Committee. Mr. Bharat Doshi, Mr. Deepak S. Parekh, Mr. Nadir B. Godrej, Dr. A. S. Ganguly, Mr. Vikram Singh Mehta and Mr. Anupam Puri are the other Members of the Committee.
66
G. Loans & Investment Committee (a voluntary initiative of the Company)
The Loans & Investment Committee approves of making of loans and investment, disinvestment, borrowing moneys and related aspects of fund management in accordance with the authority granted and parameters prescribed by the Board. Mr. Anand G. Mahindra is the Chairman of the Committee. Mr. Bharat Doshi, Mr. A. K. Nanda, Mr. R. K. Kulkarni and Mr. Vikram Singh Mehta are the other Members of the Committee.
V. Subsidiary CompaniesClause 49 defines a “material non-listed Indian subsidiary” as an unlisted subsidiary, incorporated in India, whose turnover or net worth (i.e. paid-up capital and free reserves) exceeds 20% of the consolidated turnover or net worth respectively, of the listed holding company and its subsidiaries in the immediately preceding accounting year.
Under this definition, the Company did not have any “material non-listed Indian subsidiary” during the year under review. The subsidiaries of the Company function independently, with an adequately empowered Board of Directors and sufficient resources. For more effective governance, the Minutes of the Board Meetings of the subsidiaries of the Company are placed before the Board of Directors of the Company for their review.
VI. DisclosuresA. Disclosure of transactions with Related PartiesDuring the Financial Year 2012-13, there were no materially significant transactions entered into between the Company and its Promoters, Directors or the Management, Subsidiaries or Relatives, etc. that may have potential conflict with the interests of the Company at large. Further, details of related party transactions are presented in Note Number “41” to Annual Accounts in the Annual Report.
B. Disclosure of Accounting Treatment in preparation of Financial Statements
Your Company has followed the Accounting Standards laid down by the Companies (Accounting Standards) Rules, 2006, as amended from time to time, in preparation of its financial statements.
C. Code for Prevention of Insider Trading PracticesThe Company has instituted a comprehensive Code of Conduct for Prevention of Insider Trading for its designated employees, in compliance with Securities and Exchange Board of India (Prohibition of Insider Trading) Regulations, 1992, as amended from time to time. The Code lays down Guidelines, which advise them on procedures to be followed and
disclosures to be made, while dealing in the shares of the Company and cautions them of the consequences of violations.
VII. Shareholder Information1. 67th Annual General Meeting Date : 13th August 2013 Time : 3:30 p.m. Venue : Birla Matushri Sabhagar,
19, Sir Vithaldas Thackersey Marg (New Marine Lines), Mumbai - 400 020.
2. Date of Book Closure Book Closure for Dividend will be from 20th July 2013 to
13th August 2013, both days inclusive.3. Date of Dividend Payment The Dividend would be paid/despatched on and after
14th August 2013.4. Financial Year of the Company The Financial Year covers the period from 1st April to
31st March. Financial Reporting for: Quarter ending 30th June 2013 – Second week of August 2013 Half-year ending 30th September 2013 – Second week of November 2013 Quarter ending 31st December 2013 – Second week of February 2014 Year ending 31st March 2014 – End May 2014 Note : The above dates are indicative.5. Registered Office Mahindra & Mahindra Limited
Gateway Building, Apollo Bunder, Mumbai - 400 001.6. Listing of Ordinary (Equity) Shares and Debentures on
Stock Exchanges Your Company’s Shares are listed on BSE Limited (BSE) and
National Stock Exchange of India Limited (NSE). The Global Depository Receipts (GDRs) of your Company are listed on the Luxembourg Stock Exchange and are also admitted for trading on International Order Book (IOB) of the London Stock Exchange. The requisite listing fees have been paid in full to all these Stock Exchanges.
7A. Stock Codes 1. BSE : 500520 2. NSE : M&M 3. Demat International Securities Identification Number (ISIN) for Ordinary (Equity) Shares : INE101A01026 4. GDRs , Luxembourg Stock Exchange (ISIN) : USY5416411947B. Corporate Identity Number : L65990MH1945PLC004558
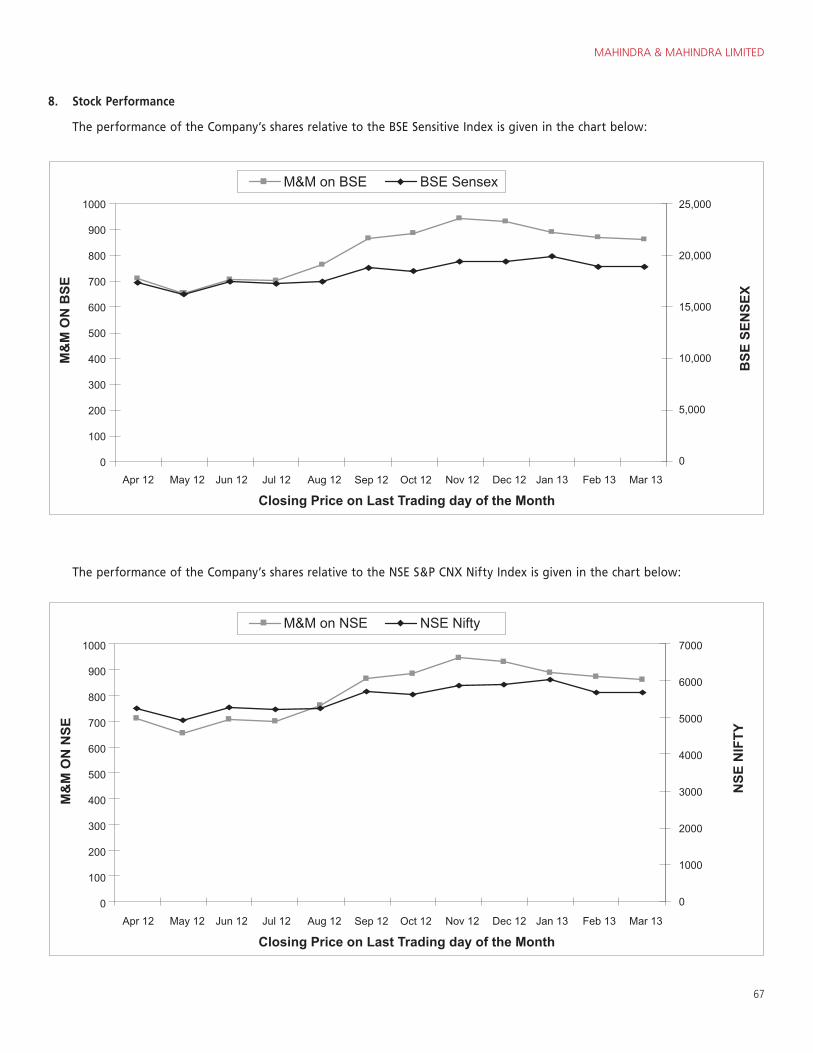
MAHINDRA & MAHINDRA LIMITED
67
8. Stock Performance
The performance of the Company’s shares relative to the BSE Sensitive Index is given in the chart below:
The performance of the Company’s shares relative to the NSE S&P CNX Nifty Index is given in the chart below:
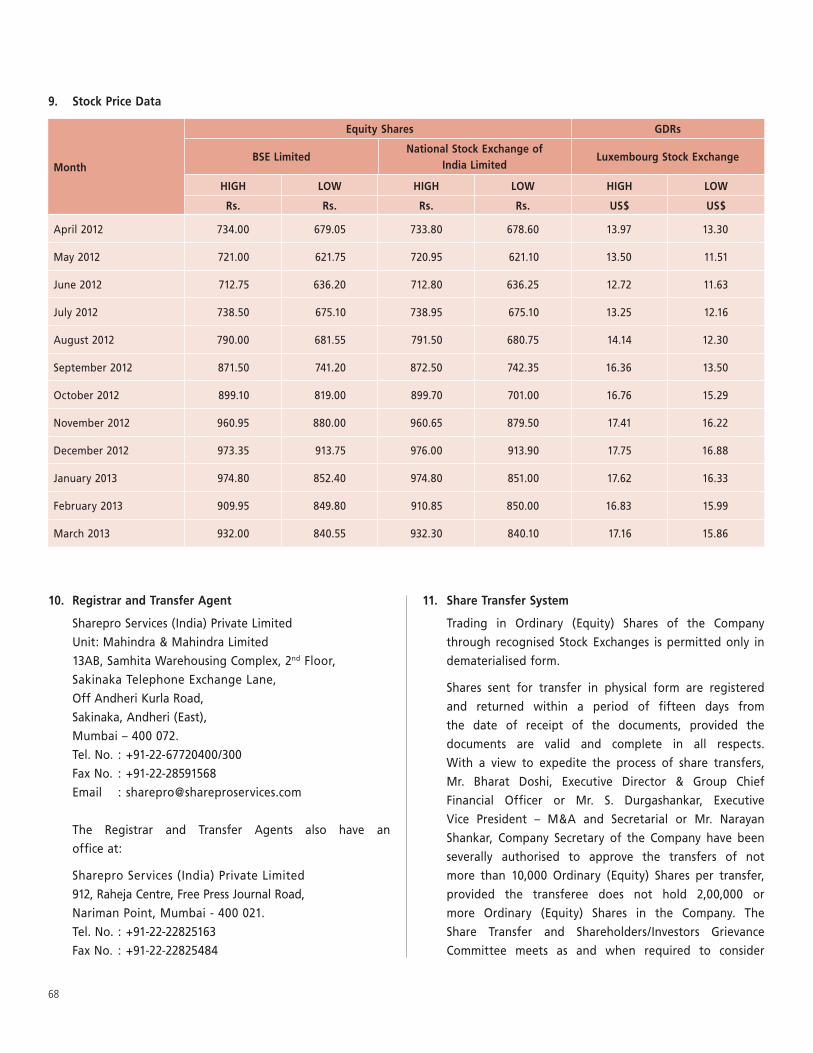
68
9. Stock Price Data
Month
Equity Shares GDRs
BSE LimitedNational Stock Exchange of
India LimitedLuxembourg Stock Exchange
HIGH LOW HIGH LOW HIGH LOW
Rs. Rs. Rs. Rs. US$ US$
April 2012 734.00 679.05 733.80 678.60 13.97 13.30
May 2012 721.00 621.75 720.95 621.10 13.50 11.51
June 2012 712.75 636.20 712.80 636.25 12.72 11.63
July 2012 738.50 675.10 738.95 675.10 13.25 12.16
August 2012 790.00 681.55 791.50 680.75 14.14 12.30
September 2012 871.50 741.20 872.50 742.35 16.36 13.50
October 2012 899.10 819.00 899.70 701.00 16.76 15.29
November 2012 960.95 880.00 960.65 879.50 17.41 16.22
December 2012 973.35 913.75 976.00 913.90 17.75 16.88
January 2013 974.80 852.40 974.80 851.00 17.62 16.33
February 2013 909.95 849.80 910.85 850.00 16.83 15.99
March 2013 932.00 840.55 932.30 840.10 17.16 15.86
11. Share Transfer System
Trading in Ordinary (Equity) Shares of the Company through recognised Stock Exchanges is permitted only in dematerialised form.
Shares sent for transfer in physical form are registered and returned within a period of fifteen days from the date of receipt of the documents, provided the documents are valid and complete in all respects. With a view to expedite the process of share transfers, Mr. Bharat Doshi, Executive Director & Group Chief Financial Officer or Mr. S. Durgashankar, Executive Vice President – M&A and Secretarial or Mr. Narayan Shankar, Company Secretary of the Company have been severally authorised to approve the transfers of not more than 10,000 Ordinary (Equity) Shares per transfer, provided the transferee does not hold 2,00,000 or more Ordinary (Equity) Shares in the Company. The Share Transfer and Shareholders/Investors Grievance Committee meets as and when required to consider
10. Registrar and Transfer Agent
Sharepro Services (India) Private Limited Unit: Mahindra & Mahindra Limited 13AB, Samhita Warehousing Complex, 2nd Floor, Sakinaka Telephone Exchange Lane, Off Andheri Kurla Road, Sakinaka, Andheri (East), Mumbai – 400 072. Tel. No. : +91-22-67720400/300 Fax No. : +91-22-28591568 Email : [email protected]
The Registrar and Transfer Agents also have an office at:
Sharepro Services (India) Private Limited 912, Raheja Centre, Free Press Journal Road, Nariman Point, Mumbai - 400 021. Tel. No. : +91-22-22825163 Fax No. : +91-22-22825484
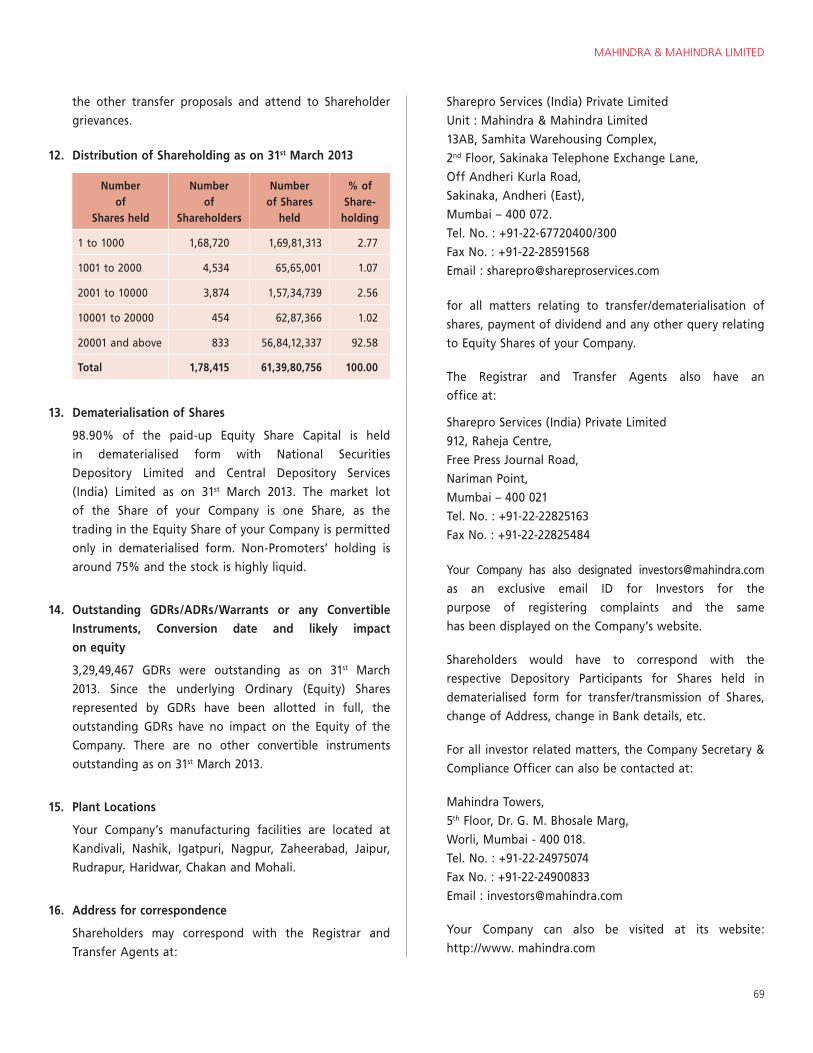
MAHINDRA & MAHINDRA LIMITED
69
the other transfer proposals and attend to Shareholder grievances.
12. Distribution of Shareholding as on 31st March 2013
Number of
Shares held
Number of
Shareholders
Number of Shares
held
% of Share-
holding
1 to 1000 1,68,720 1,69,81,313 2.77
1001 to 2000 4,534 65,65,001 1.07
2001 to 10000 3,874 1,57,34,739 2.56
10001 to 20000 454 62,87,366 1.02
20001 and above 833 56,84,12,337 92.58
Total 1,78,415 61,39,80,756 100.00
13. Dematerialisation of Shares
98.90% of the paid-up Equity Share Capital is held in dematerialised form with National Securities Depository Limited and Central Depository Services (India) Limited as on 31st March 2013. The market lot of the Share of your Company is one Share, as the trading in the Equity Share of your Company is permitted only in dematerialised form. Non-Promoters’ holding is around 75% and the stock is highly liquid.
14. Outstanding GDRs/ADRs/Warrants or any Convertible Instruments, Conversion date and likely impact on equity
3,29,49,467 GDRs were outstanding as on 31st March 2013. Since the underlying Ordinary (Equity) Shares represented by GDRs have been allotted in full, the outstanding GDRs have no impact on the Equity of the Company. There are no other convertible instruments outstanding as on 31st March 2013.
15. Plant Locations
Your Company’s manufacturing facilities are located at Kandivali, Nashik, Igatpuri, Nagpur, Zaheerabad, Jaipur, Rudrapur, Haridwar, Chakan and Mohali.
16. Address for correspondence
Shareholders may correspond with the Registrar and Transfer Agents at:
Sharepro Services (India) Private Limited Unit : Mahindra & Mahindra Limited 13AB, Samhita Warehousing Complex, 2nd Floor, Sakinaka Telephone Exchange Lane, Off Andheri Kurla Road, Sakinaka, Andheri (East), Mumbai – 400 072. Tel. No. : +91-22-67720400/300 Fax No. : +91-22-28591568 Email : [email protected]
for all matters relating to transfer/dematerialisation of shares, payment of dividend and any other query relating to Equity Shares of your Company.
The Registrar and Transfer Agents also have an office at:
Sharepro Services (India) Private Limited 912, Raheja Centre, Free Press Journal Road, Nariman Point, Mumbai – 400 021 Tel. No. : +91-22-22825163 Fax No. : +91-22-22825484
Your Company has also designated [email protected] as an exclusive email ID for Investors for the purpose of registering complaints and the same has been displayed on the Company’s website.
Shareholders would have to correspond with the respective Depository Participants for Shares held in dematerialised form for transfer/transmission of Shares, change of Address, change in Bank details, etc.
For all investor related matters, the Company Secretary & Compliance Officer can also be contacted at:
Mahindra Towers, 5th Floor, Dr. G. M. Bhosale Marg, Worli, Mumbai - 400 018. Tel. No. : +91-22-24975074 Fax No. : +91-22-24900833 Email : [email protected]
Your Company can also be visited at its website: http://www. mahindra.com
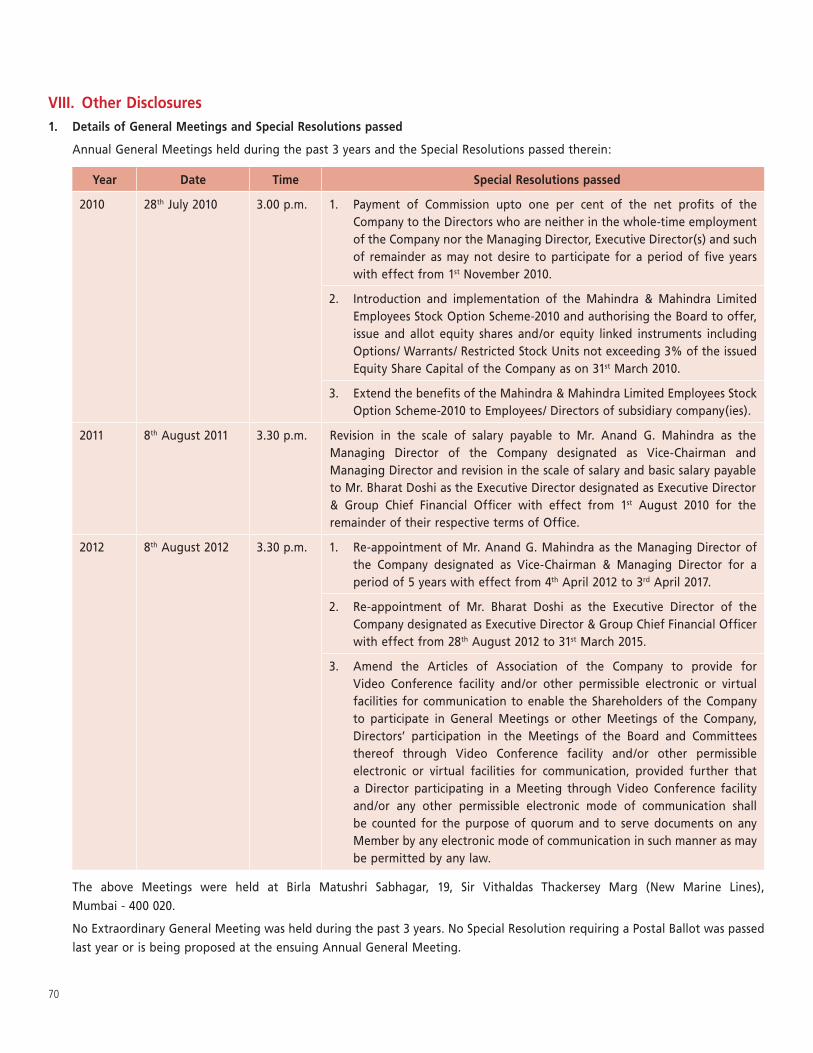
70
VIII. Other Disclosures1. Details of General Meetings and Special Resolutions passed
Annual General Meetings held during the past 3 years and the Special Resolutions passed therein:
Year Date Time Special Resolutions passed
2010 28th July 2010 3.00 p.m. 1. Payment of Commission upto one per cent of the net profits of the Company to the Directors who are neither in the whole-time employment of the Company nor the Managing Director, Executive Director(s) and such of remainder as may not desire to participate for a period of five years with effect from 1st November 2010.
2. Introduction and implementation of the Mahindra & Mahindra Limited Employees Stock Option Scheme-2010 and authorising the Board to offer, issue and allot equity shares and/or equity linked instruments including Options/ Warrants/ Restricted Stock Units not exceeding 3% of the issued Equity Share Capital of the Company as on 31st March 2010.
3. Extend the benefits of the Mahindra & Mahindra Limited Employees Stock Option Scheme-2010 to Employees/ Directors of subsidiary company(ies).
2011 8th August 2011 3.30 p.m. Revision in the scale of salary payable to Mr. Anand G. Mahindra as the Managing Director of the Company designated as Vice-Chairman and Managing Director and revision in the scale of salary and basic salary payable to Mr. Bharat Doshi as the Executive Director designated as Executive Director & Group Chief Financial Officer with effect from 1st August 2010 for the remainder of their respective terms of Office.
2012 8th August 2012 3.30 p.m. 1. Re-appointment of Mr. Anand G. Mahindra as the Managing Director of the Company designated as Vice-Chairman & Managing Director for a period of 5 years with effect from 4th April 2012 to 3rd April 2017.
2. Re-appointment of Mr. Bharat Doshi as the Executive Director of the Company designated as Executive Director & Group Chief Financial Officer with effect from 28th August 2012 to 31st March 2015.
3. Amend the Articles of Association of the Company to provide for Video Conference facility and/or other permissible electronic or virtual facilities for communication to enable the Shareholders of the Company to participate in General Meetings or other Meetings of the Company, Directors’ participation in the Meetings of the Board and Committees thereof through Video Conference facility and/or other permissible electronic or virtual facilities for communication, provided further that a Director participating in a Meeting through Video Conference facility and/or any other permissible electronic mode of communication shall be counted for the purpose of quorum and to serve documents on any Member by any electronic mode of communication in such manner as may be permitted by any law.
The above Meetings were held at Birla Matushri Sabhagar, 19, Sir Vithaldas Thackersey Marg (New Marine Lines), Mumbai - 400 020.
No Extraordinary General Meeting was held during the past 3 years. No Special Resolution requiring a Postal Ballot was passed last year or is being proposed at the ensuing Annual General Meeting.
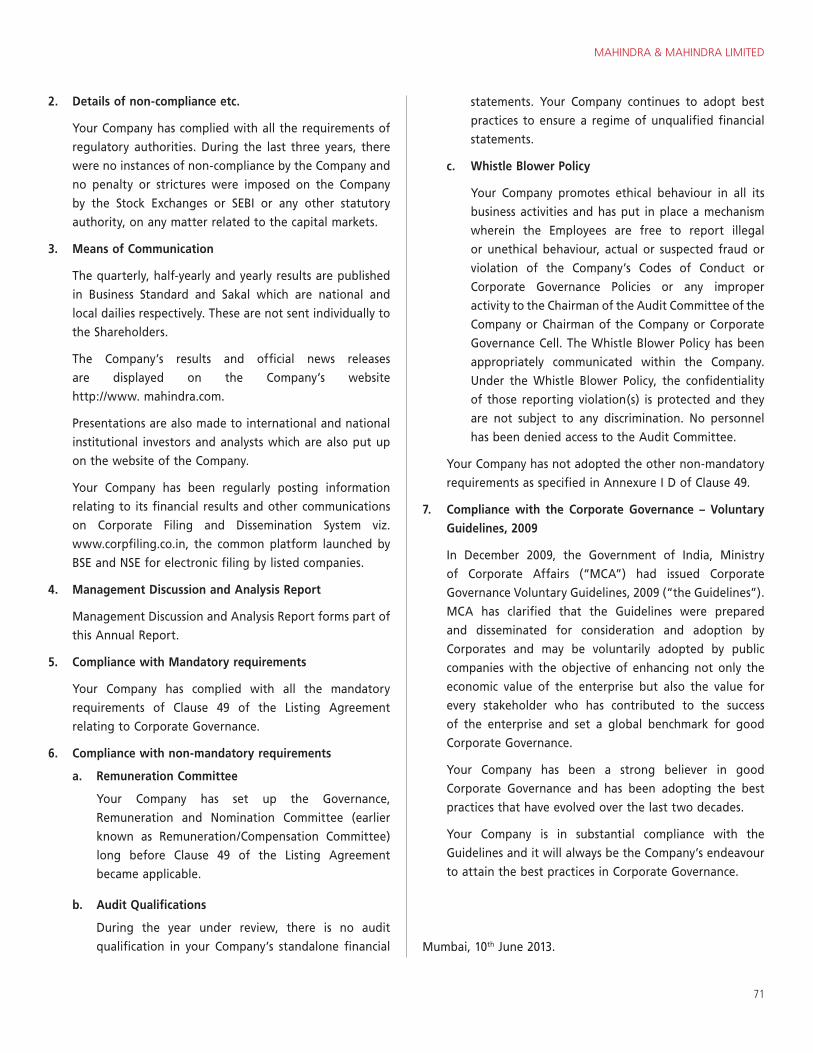
MAHINDRA & MAHINDRA LIMITED
71
2. Details of non-compliance etc.
Your Company has complied with all the requirements of regulatory authorities. During the last three years, there were no instances of non-compliance by the Company and no penalty or strictures were imposed on the Company by the Stock Exchanges or SEBI or any other statutory authority, on any matter related to the capital markets.
3. Means of Communication
The quarterly, half-yearly and yearly results are published in Business Standard and Sakal which are national and local dailies respectively. These are not sent individually to the Shareholders.
The Company’s results and official news releases are displayed on the Company’s website http://www. mahindra.com.
Presentations are also made to international and national institutional investors and analysts which are also put up on the website of the Company.
Your Company has been regularly posting information relating to its financial results and other communications on Corporate Filing and Dissemination System viz. www.corpfiling.co.in, the common platform launched by BSE and NSE for electronic filing by listed companies.
4. Management Discussion and Analysis Report
Management Discussion and Analysis Report forms part of this Annual Report.
5. Compliance with Mandatory requirements
Your Company has complied with all the mandatory requirements of Clause 49 of the Listing Agreement relating to Corporate Governance.
6. Compliance with non-mandatory requirements
a. Remuneration Committee
Your Company has set up the Governance, Remuneration and Nomination Committee (earlier known as Remuneration/Compensation Committee) long before Clause 49 of the Listing Agreement became applicable.
b. Audit Qualifications
During the year under review, there is no audit qualification in your Company’s standalone financial
statements. Your Company continues to adopt best practices to ensure a regime of unqualified financial statements.
c. Whistle Blower Policy
Your Company promotes ethical behaviour in all its business activities and has put in place a mechanism wherein the Employees are free to report illegal or unethical behaviour, actual or suspected fraud or violation of the Company’s Codes of Conduct or Corporate Governance Policies or any improper activity to the Chairman of the Audit Committee of the Company or Chairman of the Company or Corporate Governance Cell. The Whistle Blower Policy has been appropriately communicated within the Company. Under the Whistle Blower Policy, the confidentiality of those reporting violation(s) is protected and they are not subject to any discrimination. No personnel has been denied access to the Audit Committee.
Your Company has not adopted the other non-mandatory requirements as specified in Annexure I D of Clause 49.
7. Compliance with the Corporate Governance – Voluntary Guidelines, 2009
In December 2009, the Government of India, Ministry of Corporate Affairs (“MCA”) had issued Corporate Governance Voluntary Guidelines, 2009 (“the Guidelines”). MCA has clarified that the Guidelines were prepared and disseminated for consideration and adoption by Corporates and may be voluntarily adopted by public companies with the objective of enhancing not only the economic value of the enterprise but also the value for every stakeholder who has contributed to the success of the enterprise and set a global benchmark for good Corporate Governance.
Your Company has been a strong believer in good Corporate Governance and has been adopting the best practices that have evolved over the last two decades.
Your Company is in substantial compliance with the Guidelines and it will always be the Company’s endeavour to attain the best practices in Corporate Governance.
Mumbai, 10th June 2013.
72
DECLARATION BY THE MANAGING DIRECTOR UNDER CLAUSE 49 OF THE LISTING AGREEMENT
To
The Members of Mahindra & Mahindra Limited
I, Anand G. Mahindra, Chairman & Managing Director of Mahindra & Mahindra Limited declare that all the Members of the Board of Directors and Senior Management Personnel have affirmed compliance with the Code of Conduct for the year ended 31st March 2013.
Anand G. Mahindra Chairman & Managing Director
Mumbai, 30th May 2013
CERTIFICATE
To
The Members of
Mahindra & Mahindra Limited
We have examined the compliance of conditions of Corporate Governance by Mahindra & Mahindra Limited, for the year ended 31st March 2013, as stipulated in Clause 49 of the Listing Agreement of the said Company with stock exchanges in India.
The compliance of conditions of Corporate Governance is the responsibility of the management. Our examination was limited to procedures and implementation thereof, adopted by the Company for ensuring the compliance of the conditions of Corporate Governance. It is neither an audit nor an expression of opinion on the financial statements of the Company.
In our opinion and to the best of our information and according to the explanations given to us, we certify that the Company has complied with the conditions of Corporate Governance as stipulated in the above mentioned Listing Agreement.
We state that such compliance is neither an assurance as to the future viability of the Company nor the efficiency or effectiveness with which the management has conducted the affairs of the Company.
For DELOITTE HASKINS & SELLS Chartered Accountants
(Firm Registration No. 117364W)
Shyamak R TataPartner
(Membership No. 38320)
Mumbai, 10th June 2013

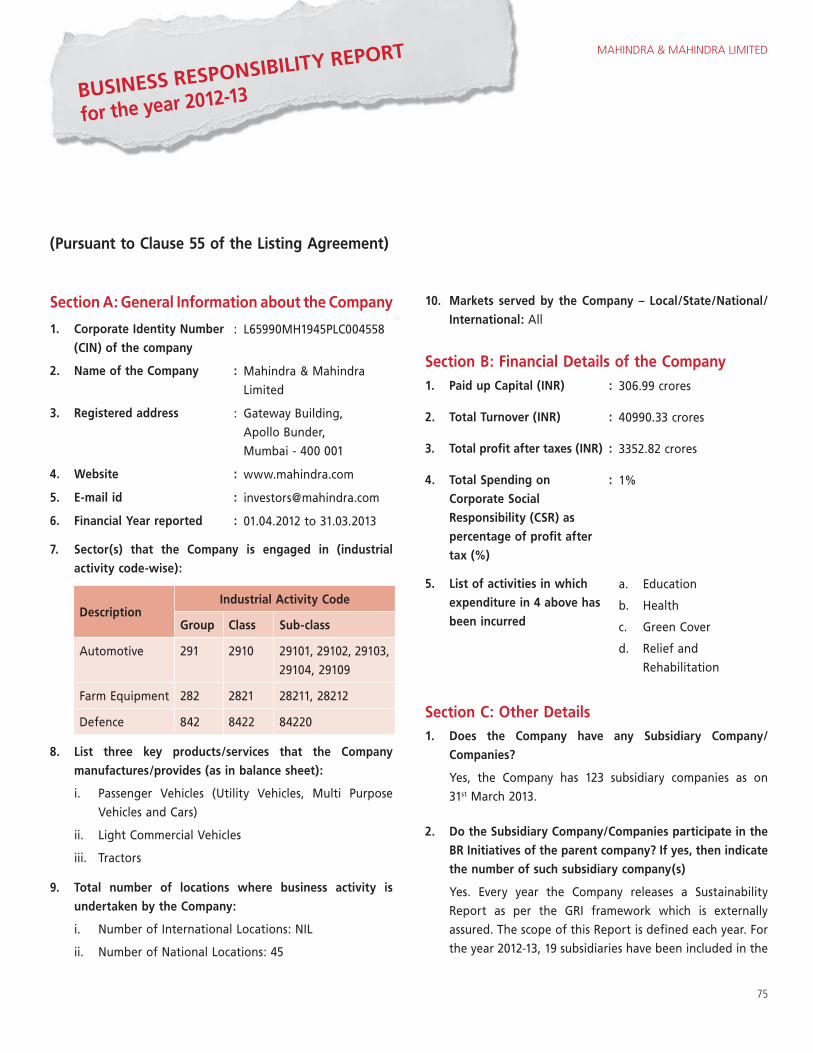
MAHINDRA & MAHINDRA LIMITED
75
Section A: General Information about the Company
1. Corporate Identity Number (CIN) of the company
: L65990MH1945PLC004558
2. Name of the Company : Mahindra & Mahindra Limited
3. Registered address : Gateway Building, Apollo Bunder, Mumbai - 400 001
4. Website : www.mahindra.com
5. E-mail id : [email protected]
6. Financial Year reported : 01.04.2012 to 31.03.2013
7. Sector(s) that the Company is engaged in (industrial activity code-wise):
DescriptionIndustrial Activity Code
Group Class Sub-class
Automotive 291 2910 29101, 29102, 29103, 29104, 29109
Farm Equipment 282 2821 28211, 28212
Defence 842 8422 84220
8. List three key products/services that the Company manufactures/provides (as in balance sheet):
i. Passenger Vehicles (Utility Vehicles, Multi Purpose Vehicles and Cars)
ii. Light Commercial Vehicles
iii. Tractors
9. Total number of locations where business activity is undertaken by the Company:
i. Number of International Locations: NIL
ii. Number of National Locations: 45
(Pursuant to Clause 55 of the Listing Agreement)
10. Markets served by the Company – Local/State/National/International: All
Section B: Financial Details of the Company1. Paid up Capital (INR) : 306.99 crores
2. Total Turnover (INR) : 40990.33 crores
3. Total profit after taxes (INR) : 3352.82 crores
4. Total Spending on Corporate Social Responsibility (CSR) as percentage of profit after tax (%)
: 1%
5. List of activities in which expenditure in 4 above has been incurred
a. Education
b. Health
c. Green Cover
d. Relief and Rehabilitation
Section C: Other Details1. Does the Company have any Subsidiary Company/
Companies?
Yes, the Company has 123 subsidiary companies as on 31st March 2013.
2. Do the Subsidiary Company/Companies participate in the BR Initiatives of the parent company? If yes, then indicate the number of such subsidiary company(s)
Yes. Every year the Company releases a Sustainability Report as per the GRI framework which is externally assured. The scope of this Report is defined each year. For the year 2012-13, 19 subsidiaries have been included in the
BUSINESS RESPONSIBILITY REPORT
for the year 2012-13
76
scope of Sustainability Report viz. Mahindra & Mahindra Financial Services Limited (MMFSL), Mahindra First Choice Wheels Limited (MFCWL), Mahindra First Choice Services Limited (MFCSL), Mahindra Forgings Limited, Mahindra Gears & Transmissions Private Limited, Mahindra Hinoday Industries Limited, Mahindra Holidays & Resorts India Limited (MHRIL), Mahindra Lifespace Developers Limited (MLDL), Mahindra Insurance Brokers Limited, Mahindra Intertrade Limited (MIL), Mahindra Logistics Limited (MLL), Mahindra Reva Electric Vehicles Private Limited (MREVA), Mahindra Rural Housing Finance Limited, Mahindra Steel Service Centre Limited, Mahindra Two Wheelers Limited (MTWL), Mahindra Vehicle Manufacturers Limited (MVML), Mahindra World City Developers Limited (MWCDL), Mahindra World City (Jaipur) Limited (MWCJL) and Mahindra Sanyo Special Steel Private Limited (MSSSPL).
Do any other entity/entities (e.g. suppliers, distributors etc.) that the Company does business with, participate in the BR initiatives of the Company? If yes, then indicate the percentage of such entity/entities? [Less than 30%, 30-60%, More than 60%]
The Company has longstanding relationships with its dealers and suppliers. A majority of supplier base has already been covered by conducting awareness sessions on ‘Sustainability’. The Company also engages with suppliers and dealers in programs meant for energy efficiency, reduction of packaging waste, skill up-gradation, logistics and transportation, etc. which in turn helps in creating a sustainable supply chain. The percentage of entities covered is estimated at less than 30% for dealers and 30-60% for suppliers.
Section D: BR Information
1. Details of Director/Directors responsible for BR
a. Details of the Director/Director responsible for implementation of the BR policy/policies
DIN Number : 00012541
Name : Mr. Bharat Doshi
Designation : Executive Director & Group Chief Financial Officer
b. Details of the BR Head
S. No.
Particulars Details
1. DIN Number (If applicable)
00104817
2. Name Mr. Rajeev Dubey
3. Designation President (Group HR, Corporate Services & After-Market)
4. Telephone Number
+9122 24975192 +9122 24901441 Extn. 5594
5. e-mail ID [email protected]
2. Principle-wise (as per NVGs) BR Policy/policies (Reply in Y/N)
The Business Responsibility Policy (“BR Policy”) encompassing the following 9 principles as per the National Voluntary Guidelines on Social, Environmental and Economic Responsibilities of Business (NVGs), duly approved by the Board, is in place. This policy is operationalised and supported by various other policies, guidelines and manuals.
P1: Businesses should conduct and govern themselves with Ethics, Transparency and Accountability.
P2: Businesses should provide goods and services that are safe and contribute to sustainability throughout their life cycle.
P3: Businesses should promote the wellbeing of all employees.
P4: Businesses should respect the interests of, and be responsive towards all stakeholders, especially those who are disadvantaged, vulnerable and marginalised.
P5: Businesses should respect and promote human rights.
P6: Business should respect, protect, and make efforts to restore the environment.
P7: Businesses, when engaged in influencing public and regulatory policy, should do so in a responsible manner.
P8: Businesses should support inclusive growth and equitable development.
P9: Businesses should engage with and provide value to their customers and consumers in a responsible manner.
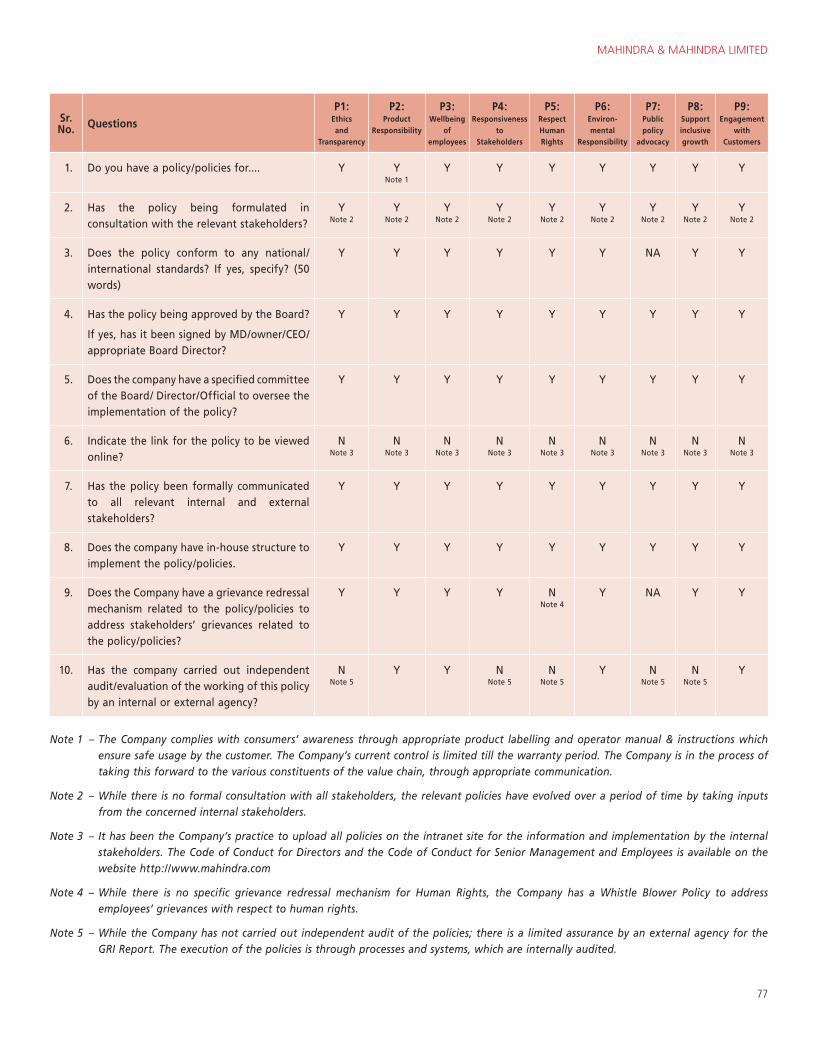
MAHINDRA & MAHINDRA LIMITED
77
Sr. No. Questions
P1: Ethics and
Transparency
P2: Product
Responsibility
P3: Wellbeing
of employees
P4: Responsiveness
to Stakeholders
P5: Respect Human Rights
P6: Environ- mental
Responsibility
P7: Public policy
advocacy
P8: Support inclusive growth
P9: Engagement
with Customers
1. Do you have a policy/policies for.... Y Y Note 1
Y Y Y Y Y Y Y
2. Has the policy being formulated in consultation with the relevant stakeholders?
Y Note 2
Y Note 2
Y Note 2
Y Note 2
Y Note 2
Y Note 2
Y Note 2
Y Note 2
Y Note 2
3. Does the policy conform to any national/international standards? If yes, specify? (50 words)
Y Y Y Y Y Y NA Y Y
4. Has the policy being approved by the Board?
If yes, has it been signed by MD/owner/CEO/appropriate Board Director?
Y Y Y Y Y Y Y Y Y
5. Does the company have a specified committee of the Board/ Director/Official to oversee the implementation of the policy?
Y Y Y Y Y Y Y Y Y
6. Indicate the link for the policy to be viewed online?
N Note 3
N Note 3
N Note 3
N Note 3
N Note 3
N Note 3
N Note 3
N Note 3
N Note 3
7. Has the policy been formally communicated to all relevant internal and external stakeholders?
Y Y Y Y Y Y Y Y Y
8. Does the company have in-house structure to implement the policy/policies.
Y Y Y Y Y Y Y Y Y
9. Does the Company have a grievance redressal mechanism related to the policy/policies to address stakeholders’ grievances related to the policy/policies?
Y Y Y Y N Note 4
Y NA Y Y
10. Has the company carried out independent audit/evaluation of the working of this policy by an internal or external agency?
N Note 5
Y Y N Note 5
N Note 5
Y N Note 5
N Note 5
Y
Note 1 – The Company complies with consumers’ awareness through appropriate product labelling and operator manual & instructions which ensure safe usage by the customer. The Company’s current control is limited till the warranty period. The Company is in the process of taking this forward to the various constituents of the value chain, through appropriate communication.
Note 2 – While there is no formal consultation with all stakeholders, the relevant policies have evolved over a period of time by taking inputs from the concerned internal stakeholders.
Note 3 – It has been the Company’s practice to upload all policies on the intranet site for the information and implementation by the internal stakeholders. The Code of Conduct for Directors and the Code of Conduct for Senior Management and Employees is available on the website http://www.mahindra.com
Note 4 – While there is no specific grievance redressal mechanism for Human Rights, the Company has a Whistle Blower Policy to address employees’ grievances with respect to human rights.
Note 5 – While the Company has not carried out independent audit of the policies; there is a limited assurance by an external agency for the GRI Report. The execution of the policies is through processes and systems, which are internally audited.
78
3. Governance Related to BR
Indicate the frequency with which the Board of Directors, Committee of the Board or CEO to assess the BR performance of the Company. Within 3 months, 3-6 months, Annually, More than 1 year:
The CSR Committee of the Board meets at an interval of every 6 months to assess the BR performance. Other supporting councils/cells viz. Group Sustainability Council, Group CSR council, Central Safety Council and Corporate Governance Cell meet every 3 months.
Does the Company publish a BR or a Sustainability Report? What is the hyperlink for viewing this report? How frequently it is published?
Mahindra Group Sustainability Report as per the GRI framework is published annually. All Sustainability Reports commencing from 2007-08 till 2011-12 are GRI compliant and are accessible on the company website at the hyperlink http://www.mahindra.com/How-We-Help/Environment/Sustainability
The Sustainability Report for 2012-13 is under preparation and will be uploaded on the website of the Company in due course of time.
Section E: Principle-wise performancePrinciple 1: Businesses should conduct and govern themselves with Ethics, Transparency and Accountability
1. Does the policy relating to ethics, bribery and corruption cover only the company? Yes/No. Does it extend to the Group/Joint Ventures/Suppliers/Contractors/NGOs/Others?
The Company has a defined Code of Conduct for Directors as well as the Senior Management and Employees of the Company that covers issues, inter alia, related to ethics, bribery, etc. The Code of Conduct for Senior Management and Employees, inter alia, covers all dealings with suppliers, customers and other business partners including Joint Ventures and other stakeholders.
2. How many stakeholder complaints have been received in the past financial year and what percentage was satisfactorily resolved by the management? If so, provide details thereof, in about 50 words or so.
The Company has not received complaints from any stakeholders of the Company, except from an individual who is a shareholder and former employee whose services with the Company were terminated on proven misconduct. This individual frequently writes to the Company, alleging mismanagement of the affairs of the Company, violations of various statutory provisions as also
about his allegedly unjust termination from the services of the Company. The Company has replied to all his allegations.
The Company has different mechanisms for receiving and dealing with complaints from various stakeholders like Investors, Customers, Employees, and Suppliers etc.
Principle 2: Businesses should provide goods and services that are safe and contribute to sustainability throughout their life cycle
1. List up to 3 of your products or services whose design has incorporated social or environmental concerns, risks and/or opportunities
Product Social & environmental benefits
i. Passenger Vehicles (UV/ MPV/ Cars)
Fuel efficient and engine stop/start technology.
Micro Hybrid/CNG variants for certain models. End of Life of Vehicles (ELVs) for all export models.
XUV500 model with extra safety features such as Hill hold control, Hill decent control, ESP with Roll-on mitigation, Multiple air bags, ABS with Electronic force distribution, Crash protection & Crumble zones and side impact protection.
ii. Light Commercial Vehicles (Gio & Maxximo)
Low cost and energy efficient small transport vehicles for encouraging self employment and better livelihood for rural and semi urban people.
iii. Low Cost Tractors (Yuvraj)
Specially designed low weight tractor for small and marginalised farmers.
2. For each such product, provide the following details in respect of resource use (energy, water, raw material etc.) per unit of product (optional):
i. Reduction during sourcing/production/distribution achieved since the previous year throughout the value chain?
For above mentioned products, there is no explicit tracking mechanism in respect of resource use. However, the resource use for entire portfolio of products is tracked and monitored. Since the products
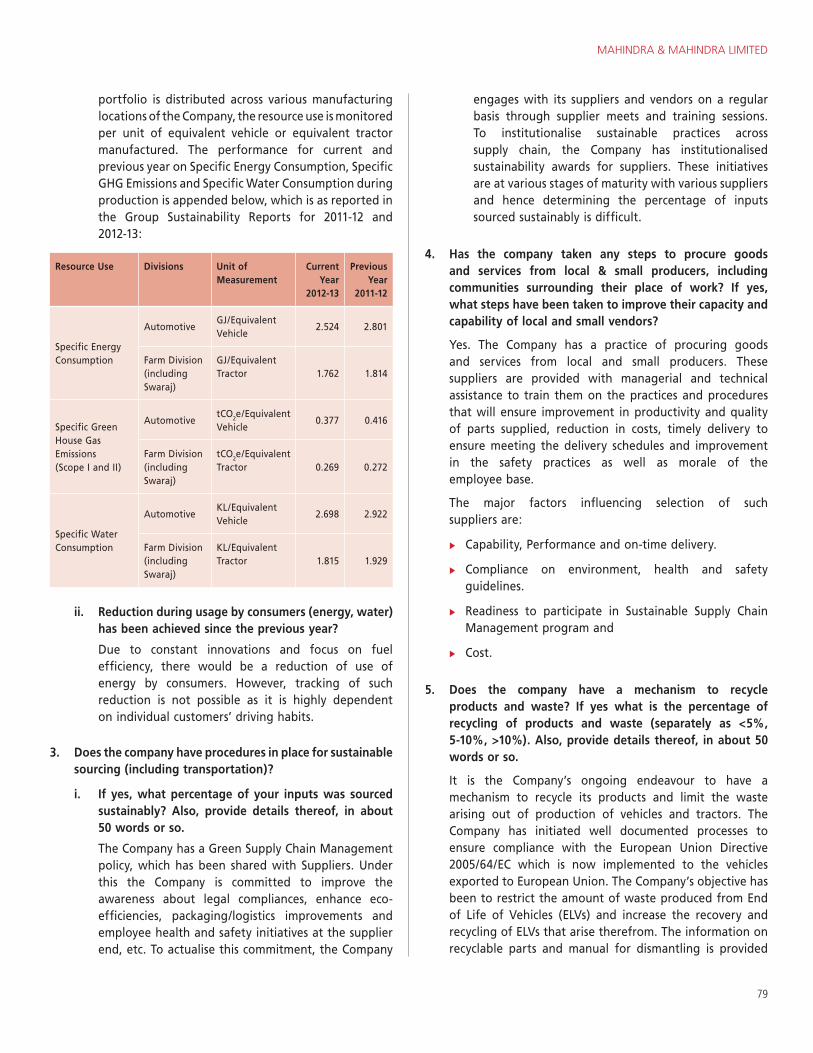
MAHINDRA & MAHINDRA LIMITED
79
portfolio is distributed across various manufacturing locations of the Company, the resource use is monitored per unit of equivalent vehicle or equivalent tractor manufactured. The performance for current and previous year on Specific Energy Consumption, Specific GHG Emissions and Specific Water Consumption during production is appended below, which is as reported in the Group Sustainability Reports for 2011-12 and 2012-13:
Resource Use Divisions Unit of Measurement
Current Year
2012-13
Previous Year
2011-12
Specific Energy Consumption
AutomotiveGJ/Equivalent Vehicle
2.524 2.801
Farm Division (including Swaraj)
GJ/Equivalent Tractor 1.762 1.814
Specific Green House Gas Emissions (Scope I and II)
AutomotivetCO2e/Equivalent Vehicle
0.377 0.416
Farm Division (including Swaraj)
tCO2e/Equivalent Tractor 0.269 0.272
Specific Water Consumption
AutomotiveKL/Equivalent Vehicle
2.698 2.922
Farm Division (including Swaraj)
KL/Equivalent Tractor 1.815 1.929
ii. Reduction during usage by consumers (energy, water) has been achieved since the previous year?
Due to constant innovations and focus on fuel efficiency, there would be a reduction of use of energy by consumers. However, tracking of such reduction is not possible as it is highly dependent on individual customers’ driving habits.
3. Does the company have procedures in place for sustainable sourcing (including transportation)?
i. If yes, what percentage of your inputs was sourced sustainably? Also, provide details thereof, in about 50 words or so.
The Company has a Green Supply Chain Management policy, which has been shared with Suppliers. Under this the Company is committed to improve the awareness about legal compliances, enhance eco-efficiencies, packaging/logistics improvements and employee health and safety initiatives at the supplier end, etc. To actualise this commitment, the Company
engages with its suppliers and vendors on a regular basis through supplier meets and training sessions. To institutionalise sustainable practices across supply chain, the Company has institutionalised sustainability awards for suppliers. These initiatives are at various stages of maturity with various suppliers and hence determining the percentage of inputs sourced sustainably is difficult.
4. Has the company taken any steps to procure goods and services from local & small producers, including communities surrounding their place of work? If yes, what steps have been taken to improve their capacity and capability of local and small vendors?
Yes. The Company has a practice of procuring goods and services from local and small producers. These suppliers are provided with managerial and technical assistance to train them on the practices and procedures that will ensure improvement in productivity and quality of parts supplied, reduction in costs, timely delivery to ensure meeting the delivery schedules and improvement in the safety practices as well as morale of the employee base.
The major factors influencing selection of such suppliers are:
Capability, Performance and on-time delivery.
Compliance on environment, health and safety guidelines.
Readiness to participate in Sustainable Supply Chain Management program and
Cost.
5. Does the company have a mechanism to recycle products and waste? If yes what is the percentage of recycling of products and waste (separately as <5%, 5-10%, >10%). Also, provide details thereof, in about 50 words or so.
It is the Company’s ongoing endeavour to have a mechanism to recycle its products and limit the waste arising out of production of vehicles and tractors. The Company has initiated well documented processes to ensure compliance with the European Union Directive 2005/64/EC which is now implemented to the vehicles exported to European Union. The Company’s objective has been to restrict the amount of waste produced from End of Life of Vehicles (ELVs) and increase the recovery and recycling of ELVs that arise therefrom. The information on recyclable parts and manual for dismantling is provided
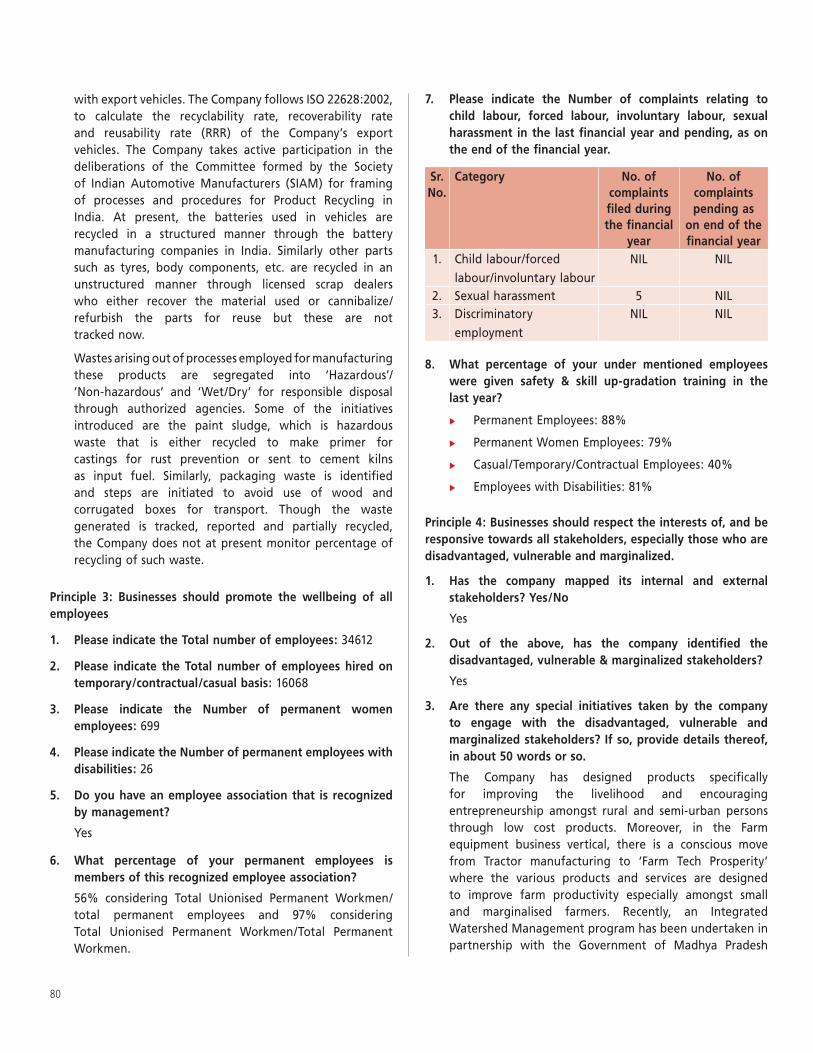
80
with export vehicles. The Company follows ISO 22628:2002, to calculate the recyclability rate, recoverability rate and reusability rate (RRR) of the Company’s export vehicles. The Company takes active participation in the deliberations of the Committee formed by the Society of Indian Automotive Manufacturers (SIAM) for framing of processes and procedures for Product Recycling in India. At present, the batteries used in vehicles are recycled in a structured manner through the battery manufacturing companies in India. Similarly other parts such as tyres, body components, etc. are recycled in an unstructured manner through licensed scrap dealers who either recover the material used or cannibalize/refurbish the parts for reuse but these are not tracked now.
Wastes arising out of processes employed for manufacturing these products are segregated into ‘Hazardous’/ ’Non-hazardous’ and ‘Wet/Dry’ for responsible disposal through authorized agencies. Some of the initiatives introduced are the paint sludge, which is hazardous waste that is either recycled to make primer for castings for rust prevention or sent to cement kilns as input fuel. Similarly, packaging waste is identified and steps are initiated to avoid use of wood and corrugated boxes for transport. Though the waste generated is tracked, reported and partially recycled, the Company does not at present monitor percentage of recycling of such waste.
Principle 3: Businesses should promote the wellbeing of all employees
1. Please indicate the Total number of employees: 34612
2. Please indicate the Total number of employees hired on temporary/contractual/casual basis: 16068
3. Please indicate the Number of permanent women employees: 699
4. Please indicate the Number of permanent employees with disabilities: 26
5. Do you have an employee association that is recognized by management?
Yes
6. What percentage of your permanent employees is members of this recognized employee association?
56% considering Total Unionised Permanent Workmen/ total permanent employees and 97% considering Total Unionised Permanent Workmen/Total Permanent Workmen.
7. Please indicate the Number of complaints relating to child labour, forced labour, involuntary labour, sexual harassment in the last financial year and pending, as on the end of the financial year.
Sr. No.
Category No. of complaints filed during the financial
year
No. of complaints pending as
on end of the financial year
1. Child labour/forced labour/involuntary labour
NIL NIL
2. Sexual harassment 5 NIL3. Discriminatory
employment NIL NIL
8. What percentage of your under mentioned employees were given safety & skill up-gradation training in the last year?
Permanent Employees: 88%
Permanent Women Employees: 79%
Casual/Temporary/Contractual Employees: 40%
Employees with Disabilities: 81%
Principle 4: Businesses should respect the interests of, and be responsive towards all stakeholders, especially those who are disadvantaged, vulnerable and marginalized.
1. Has the company mapped its internal and external stakeholders? Yes/No
Yes
2. Out of the above, has the company identified the disadvantaged, vulnerable & marginalized stakeholders?
Yes
3. Are there any special initiatives taken by the company to engage with the disadvantaged, vulnerable and marginalized stakeholders? If so, provide details thereof, in about 50 words or so.
The Company has designed products specifically for improving the livelihood and encouraging entrepreneurship amongst rural and semi-urban persons through low cost products. Moreover, in the Farm equipment business vertical, there is a conscious move from Tractor manufacturing to ‘Farm Tech Prosperity’ where the various products and services are designed to improve farm productivity especially amongst small and marginalised farmers. Recently, an Integrated Watershed Management program has been undertaken in partnership with the Government of Madhya Pradesh
MAHINDRA & MAHINDRA LIMITED
81
at Damoh, with a view to improve the standard of living in that area.
In addition, the Company has also undertaken community development initiatives, the details of which are given in answers under Principle 8.
Principle 5: Businesses should respect and promote human rights
1. Does the policy of the company on human rights cover only the company or extend to the Group/Joint Ventures/Suppliers/Contractors/NGOs/Others?
The Business Responsibility Policy covers the aspects on Human Rights for the Company.
2. How many stakeholder complaints have been received in the past financial year and what percent was satisfactorily resolved by the management?
There is an active and a well defined four step Grievance Redressal Machinery available at each plant for workmen where all types of grievances are redressed. Additionally, Employee Satisfaction Survey for workmen is periodically carried out through an external agency. All low scoring responses are discussed in Focused Group Meetings and duly resolved. Although there is no process to separately maintain records for grievances related to Human Rights, the above stated mechanism adequately addresses this issue. There is a mechanism for all employees of Automotive and Farm Sectors to voice their concerns to the Sector President through a ‘Reach-out’ e-mailer which is addressed with confidentiality. As on 31st March 2013, there were no stakeholder complaints pending at any of Company’s plants/ workplace.
Principle 6: Business should respect, protect, and make efforts to restore the environment
1. Does the policy related to Principle 6 cover only the company or extends to the Group/Joint Ventures/Suppliers/Contractors/NGOs/others.
The Company has various policies related to environmental protection. The Green Supply Chain Management Policy includes environment protection and covers suppliers. The Subsidiaries/Joint Ventures have their own policies which are in sync with the Company’s environmental policies.
2. Does the company have strategies/initiatives to address global environmental issues such as climate change, global warming, etc? Y/N. If yes, please give hyperlink for webpage etc.
Yes. These strategies and initiatives are elaborated in the Company’s GRI reports since 2007-08 which are
available on http://www.mahindra.com/How-We-Help/Environment/Sustainability. All the targets set out in the sustainability roadmap developed in 2008-09, on the commitments related to energy conservation, GHG reduction and Water Conservation etc. have already been achieved. These strategies and initiatives are also aligned to the National Action Plan on Climate Change.
The strategies and new initiatives continue year on year. In the current reporting year, various initiatives on energy saving, water saving, waste reduction etc. were implemented. An indicative list in this regard is appended below and complete details will be available in the Sustainability Report for the year 2012-13.
Energy Savings:
Implementation of energy saving Induction Lamps in place of 450W Metal Halide roof lamps.
Replaced forced cooling draft towers with natural cooling towers.
Installation of Variable Frequency Drive for Compressors.
Interlocking program for lights and fans with conveyor so that they are ‘ON’ only when conveyor operates.
Reduction in running hours of chilling compressor by shifting to CED technology in place of AED in paint shop.
Installation of energy efficient compressors.
Installation of ‘Light Pipe’ working on Solar Lighting in day time using new technology of 3 stage principle of Light Collection, Light Reflection and Light Dispersion.
Water Saving:
Installation of Rain Water Harvesting.
Conversion of open loop cooling system to closed loop.
Usage of treated recycled water.
Connection of all overhead tanks in series along with overflow sensors to avoid loss due to overflow.
Identification and elimination of leakages from underground fire pipe lines.
Waste Reduction:
Robotic painting in paint shop for optimum paint application and reduction in paint sludge.
Filter press for Phosphate & Effluent Treatment Plant (ETP) Sludge handling.
Reuse and resizing of cotton waste.
System for paint sludge dewatering.
Recycling of used thinner for lower end application.

82
3. Does the company identify and assess potential environmental risks? Y/N
Yes, the Company has a mechanism to identify and assess potential environmental risks across all locations.
4. Does the company have any project related to Clean Development Mechanism? If so, provide details thereof, in about 50 words or so. Also, if Yes, whether any environmental compliance report is filed?
No.
5. Has the company undertaken any other initiatives on – clean technology, energy efficiency, renewable energy, etc.? Y/N. If yes, please give hyperlink for web page etc.
Yes. Same as stated under point 2.
6. Are the Emissions/Waste generated by the company within the permissible limits given by CPCB/SPCB for the financial year being reported?
Yes
7. Number of show cause/legal notices received from CPCB/SPCB which are pending (i.e. not resolved to satisfaction) as on end of Financial Year.
NIL
Principle 7: Businesses, when engaged in influencing public and regulatory policy, should do so in a responsible manner
1. Is your company a member of any trade and chamber or association? If Yes, Name only those major ones that your business deals with:
Yes, the Company is a member of the following trade and chambers of associations in alphabetical order :
a. The Associated Chambers of Commerce and Industry of India (ASSOCHAM), b. Bombay Chamber of Commerce and Industry (BCCI), c. Confederation of Indian Industry (CII), d. Employers’ Federation of India (EFI), e. The Federation of Indian Chambers of Commerce and Industry (FICCI), f. Indian Merchants Chambers, g. National Human Resource Development Network (NHRDN), h. Society of Indian Automobile Manufacturers (SIAM), i. The Energy and Resource Institute (TERI), j. Tractor Manufacturer’s Association (TMA).
2. Have you advocated/lobbied through above associations for the advancement or improvement of public good? Yes/No; if yes specify the broad areas (drop box: Governance and Administration, Economic Reforms, Inclusive Development Policies, Energy security, Water, Food Security, Sustainable Business Principles, Others).
The Company participates as a stakeholder of SIAM and TMA on policies related to automotive and tractor
industry, Sustainable Mobility, Farm Tech Prosperity, Economic Reforms, Sustainable Business Principles (Sustainable Supply Chain Management) and Vehicle Recall policy. The Company also contributes through Confederation of Indian Industry/Bombay Chamber of Commerce and Industry, when views are solicited on matters such as Securities Law, Corporate Laws, etc.
Principle 8: Businesses should support inclusive growth and equitable development
1. Does the company have specified programmes/initiatives/projects in pursuit of the policy related to Principle 8? If yes details thereof.
Yes, the Company focuses on three essential aspects of holistic community development – education, health and environment. Since the year 2005, the company has pledged to contribute upto 1% of profit after tax towards Corporate Social Responsibility initiatives. While there are many programs on health, education and environment taken up especially under the employee volunteerism program, the major initiatives supported by the Company are:
a. Mahindra Pride School – Youth training program for employability of SC/ST youth.
b. Nanhi Kali – Education of Underprivileged Girl Child.
c. Lifeline Express – Mass medical interventions and surgeries in remote rural areas.
d. Mahindra Hariyali – Mass tree plantation to improve the green cover across the country.
2. Are the programmes/projects undertaken through in-house team/own foundation/external NGO/government structures/any other organization?
Programs/projects are undertaken through a combination of in-house teams, under the employee volunteerism, through its own Foundations set up for CSR activities and in collaboration with recognised and reputed NGOs.
3. Have you done any impact assessment of your initiative?
Impact assessment of large initiatives like Nanhi Kali and Mahindra Pride School are undertaken from time to time.
4. What is your company’s direct contribution to community development projects – Amount in INR and the details of the projects undertaken?
Contribution to community development projects; Amount in INR: 33.53 crores during the Financial Year 2012-13.
MAHINDRA & MAHINDRA LIMITED
83
The details of projects: a. Education (Nanhi Kali, Mahindra Pride Schools,
scholarships). b. Health (Lifeline Express, Aids Awareness). c. Environmental (Project Hariyali – tree plantation for
green cover).
5. Have you taken steps to ensure that this community development initiative is successfully adopted by the community? Please explain in 50 words, or so.
a. Through the Nanhi Kali program, parents, teachers and village elders are also positively impacted through counseling sessions and such other interventions. Number of Nanhi Kalis adopted during the Financial Year 2012-13 is 78,338 of which, the Mahindra Group has supported the education of 29,702 Nanhi Kalis.
Students, who pass out of the Mahindra Pride Schools, become mentors for new students and spread awareness of the initiatives taken by them in their respective localities. During the Financial Year 2012-13, a total of 2,605 scheduled caste/scheduled tribe students were trained at Mahindra Pride Schools.
b. The lifeline express program is conducted in collaboration with local governments and communities and is aimed at spreading awareness on the importance of improved health and medical interventions.
c. The Project Hariyali program not only adds green cover, but also enhances the livelihood of local tribesmen in areas where mass plantation is undertaken.
Principle 9: Businesses should engage with and provide value to their customers and consumers in a responsible manner
1. What percentage of customer complaints/consumer cases are pending as on the end of financial year.
Customer complaints are treated very seriously in the organisation. The Company hears its customers through various mediums such as emails to [email protected], With You Hamesha 24 x 7 Call centre toll free no, websites, tweet handle, telephone, letter, fax etc. The status of pending complaints/cases as on 31st March 2013 is as follows :
Complaints Consumer Cases
Auto Division Farm Division
1%2%
44.15%42.94%
2. Does the company display product information on the product label, over and above what is mandated as per local laws? Yes/No/N.A./Remarks (additional information)
Yes. In addition to mandatory requirements, the Company also provides service and safety labels as deemed appropriate. e.g. Product fuel economy data displayed for each variant at selling points (Dealership).
3. Is there any case filed by any stakeholder against the company regarding unfair trade practices, irresponsible advertising and/or anti-competitive behaviour during the last five years and pending as on end of financial year. If so, provide details thereof, in about 50 words or so.
Yes. There are 2 matters related to alleged unfair trade practices and 1 matter related to alleged anti-competitive activity for which cases have been filed against the Company and which are pending for disposal as on the end of the financial year.
The anti-competitive activity alleged is about the non-availability of spare parts in the open market. One of the allegations is that OEMs are restricting the availability of spare parts in the open market and limiting them to their own distribution network resulting in high prices of these spare parts and their non-availability to the independent car repairers.
One matter pertaining to unfair trade practice is where the Petitioner has alleged that although the Company has appointed them as their sole dealer, the Company has subsequently appointed a distributor in the same Region. In an other matter, the allegation is from an automotive dealer who has alleged that his dealership has been terminated forcibly and fraudulently by the Company.
4. Did your company carry out any consumer survey/ consumer satisfaction trends?
Yes, through
J. D. Power survey for Automobiles
MQRS survey for load carriers and
TNS Survey for Tractors.
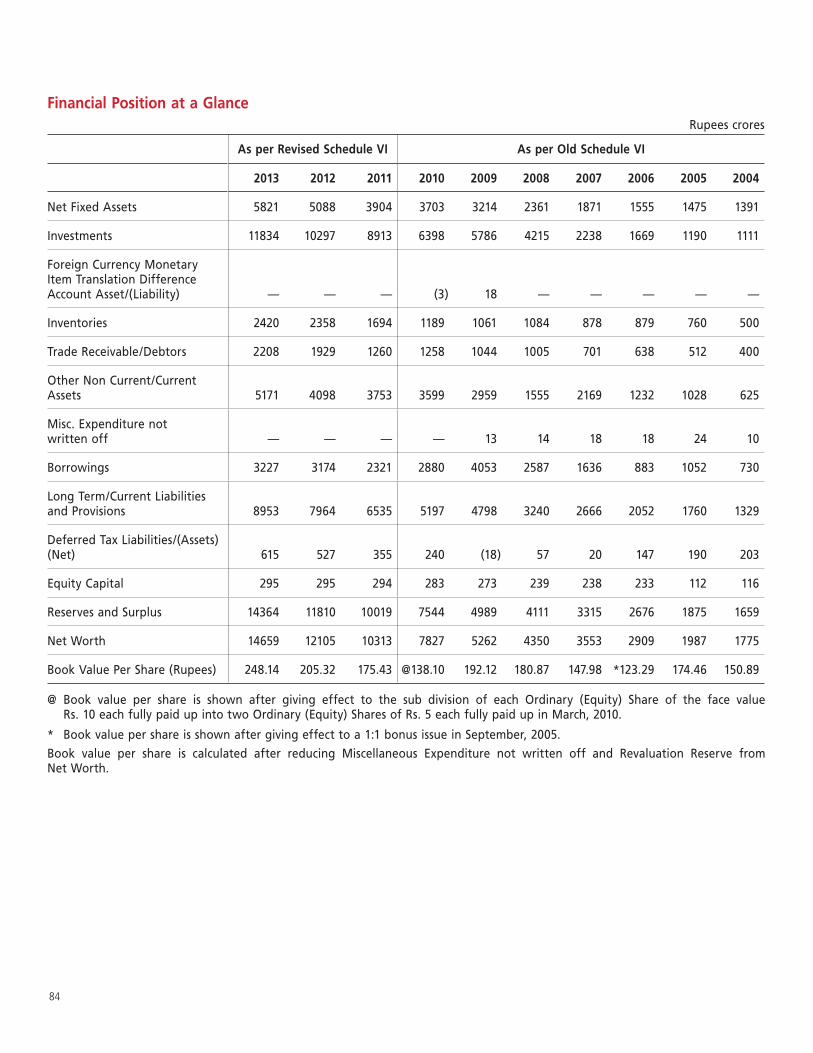
84
Financial Position at a GlanceRupees crores
As per Revised Schedule VI As per Old Schedule VI
2013 2012 2011 2010 2009 2008 2007 2006 2005 2004
Net Fixed Assets 5821 5088 3904 3703 3214 2361 1871 1555 1475 1391
Investments 11834 10297 8913 6398 5786 4215 2238 1669 1190 1111
Foreign Currency Monetary Item Translation Difference Account Asset/(Liability) — — — (3) 18 — — — — —
Inventories 2420 2358 1694 1189 1061 1084 878 879 760 500
Trade Receivable/Debtors 2208 1929 1260 1258 1044 1005 701 638 512 400
Other Non Current/Current Assets 5171 4098 3753 3599 2959 1555 2169 1232 1028 625
Misc. Expenditure not written off — — — — 13 14 18 18 24 10
Borrowings 3227 3174 2321 2880 4053 2587 1636 883 1052 730
Long Term/Current Liabilities and Provisions 8953 7964 6535 5197 4798 3240 2666 2052 1760 1329
Deferred Tax Liabilities/(Assets) (Net) 615 527 355 240 (18) 57 20 147 190 203
Equity Capital 295 295 294 283 273 239 238 233 112 116
Reserves and Surplus 14364 11810 10019 7544 4989 4111 3315 2676 1875 1659
Net Worth 14659 12105 10313 7827 5262 4350 3553 2909 1987 1775
Book Value Per Share (Rupees) 248.14 205.32 175.43 @138.10 192.12 180.87 147.98 *123.29 174.46 150.89
@ Book value per share is shown after giving effect to the sub division of each Ordinary (Equity) Share of the face value Rs. 10 each fully paid up into two Ordinary (Equity) Shares of Rs. 5 each fully paid up in March, 2010.
* Book value per share is shown after giving effect to a 1:1 bonus issue in September, 2005. Book value per share is calculated after reducing Miscellaneous Expenditure not written off and Revaluation Reserve from Net Worth.
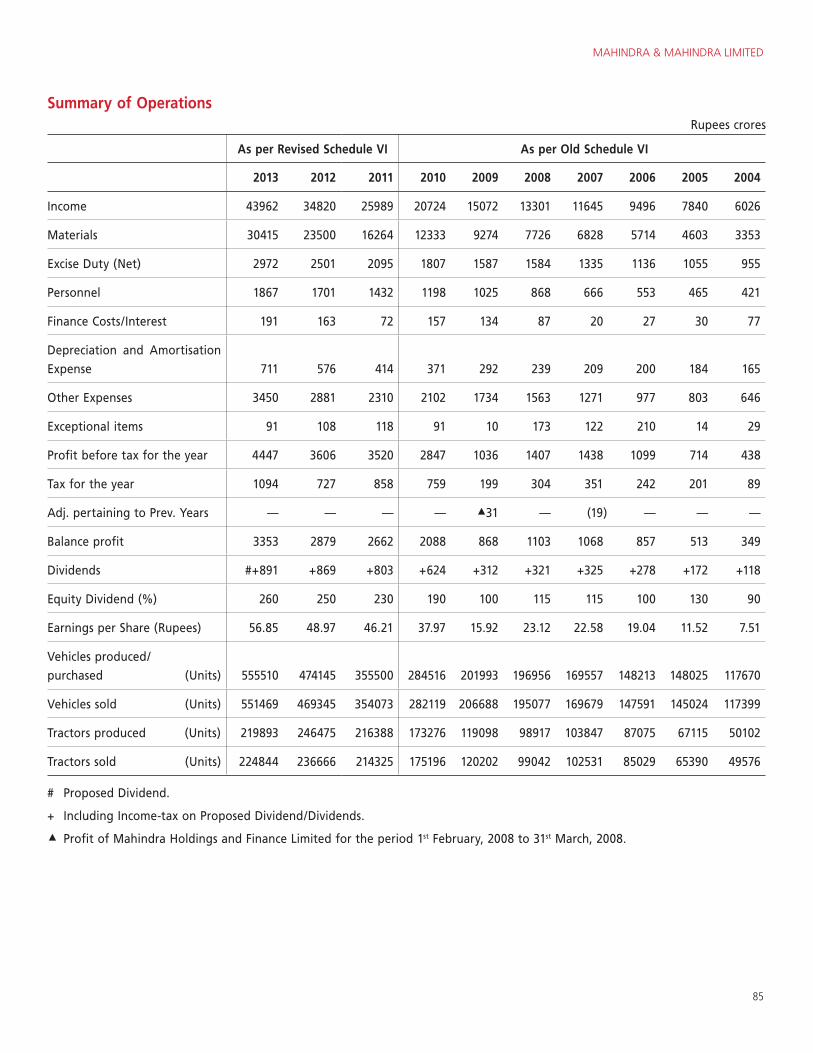
MAHINDRA & MAHINDRA LIMITED
85
Summary of Operations Rupees crores
As per Revised Schedule VI As per Old Schedule VI
2013 2012 2011 2010 2009 2008 2007 2006 2005 2004
Income 43962 34820 25989 20724 15072 13301 11645 9496 7840 6026
Materials 30415 23500 16264 12333 9274 7726 6828 5714 4603 3353
Excise Duty (Net) 2972 2501 2095 1807 1587 1584 1335 1136 1055 955
Personnel 1867 1701 1432 1198 1025 868 666 553 465 421
Finance Costs/Interest 191 163 72 157 134 87 20 27 30 77
Depreciation and Amortisation Expense 711 576 414 371 292 239 209 200 184 165
Other Expenses 3450 2881 2310 2102 1734 1563 1271 977 803 646
Exceptional items 91 108 118 91 10 173 122 210 14 29
Profit before tax for the year 4447 3606 3520 2847 1036 1407 1438 1099 714 438
Tax for the year 1094 727 858 759 199 304 351 242 201 89
Adj. pertaining to Prev. Years — — — — 31 — (19) — — —
Balance profit 3353 2879 2662 2088 868 1103 1068 857 513 349
Dividends #+891 +869 +803 +624 +312 +321 +325 +278 +172 +118
Equity Dividend (%) 260 250 230 190 100 115 115 100 130 90
Earnings per Share (Rupees) 56.85 48.97 46.21 37.97 15.92 23.12 22.58 19.04 11.52 7.51
Vehicles produced/ purchased (Units) 555510 474145 355500 284516 201993 196956 169557 148213 148025 117670
Vehicles sold (Units) 551469 469345 354073 282119 206688 195077 169679 147591 145024 117399
Tractors produced (Units) 219893 246475 216388 173276 119098 98917 103847 87075 67115 50102
Tractors sold (Units) 224844 236666 214325 175196 120202 99042 102531 85029 65390 49576
# Proposed Dividend.
+ Including Income-tax on Proposed Dividend/Dividends.
Profit of Mahindra Holdings and Finance Limited for the period 1st February, 2008 to 31st March, 2008.
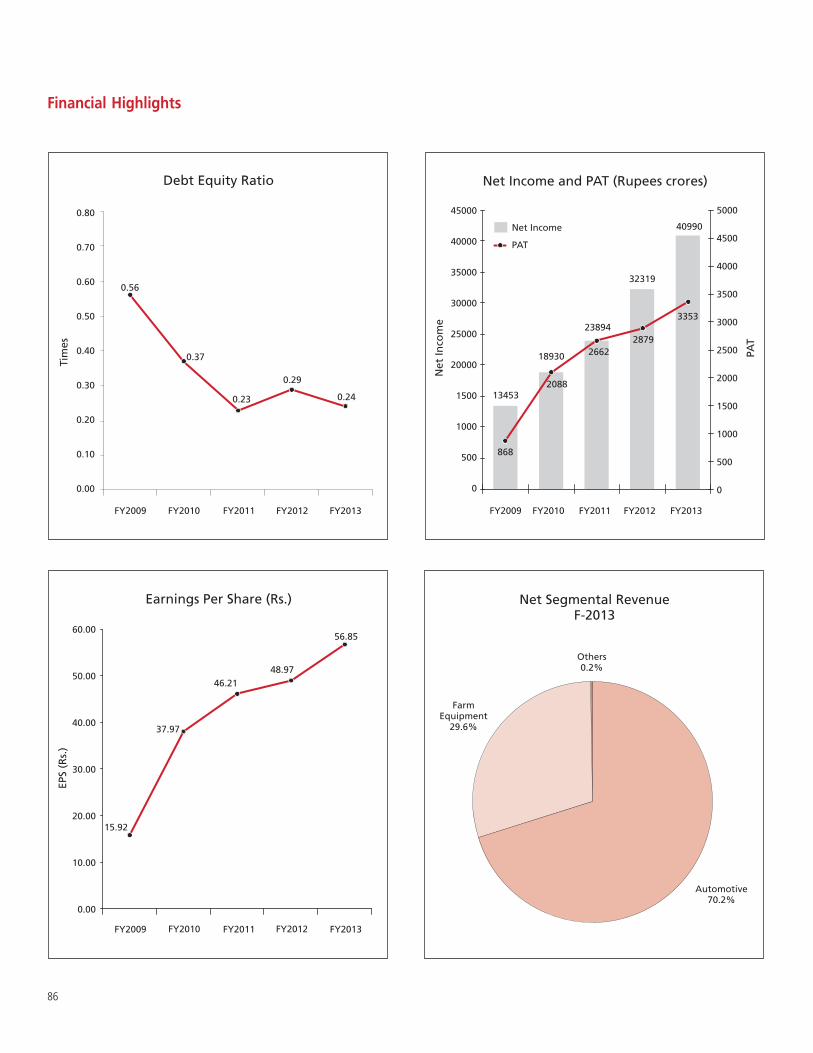
86
Financial Highlights


MAHINDRA & MAHINDRA LIMITED
89
Report on the Financial Statements
1. We have audited the accompanying financial statements of Mahindra & Mahindra Limited (“the Company”), which comprise the Balance Sheet as at 31st March, 2013, the Statement of Profit and Loss and the Cash Flow Statement for the year then ended, and a summary of the significant accounting policies and other explanatory information.
Management’s Responsibility for the Financial Statements
2. The Company’s Management is responsible for the preparation of these financial statements that give a true and fair view of the financial position, financial performance and cash flows of the Company in accordance with the Accounting Standards referred to in Section 211(3C) of the Companies Act, 1956 (“the Act”) and in accordance with the accounting principles generally accepted in India. This responsibility includes the design, implementation and maintenance of internal control relevant to the preparation and presentation of the financial statements that give a true and fair view and are free from material misstatement, whether due to fraud or error.
Auditors’ Responsibility
3. Our responsibility is to express an opinion on these financial statements based on our audit. We conducted our audit in accordance with the Standards on Auditing issued by the Institute of Chartered Accountants of India. Those Standards require that we comply with ethical requirements and plan and perform the audit to obtain reasonable assurance about whether the financial statements are free from material misstatement.
4. An audit involves performing procedures to obtain audit evidence about the amounts and the disclosures in the financial statements. The procedures selected depend on the auditor’s judgment, including the assessment of the risks of material misstatement of the financial statements, whether due to fraud or error. In making those risk assessments, the auditor considers internal control relevant to the Company’s preparation and fair presentation of the financial statements in order to design audit procedures that are appropriate in the circumstances, but not for the purpose of expressing an opinion on the effectiveness of the Company’s internal control. An audit also includes evaluating the appropriateness of the accounting policies used and the reasonableness of the accounting estimates made by the Management, as well as evaluating the overall presentation of the financial statements. We believe that the audit evidence we have obtained is sufficient and appropriate to provide a basis for our audit opinion.
Opinion
5. In our opinion and to the best of our information and according to the explanations given to us, the aforesaid financial statements give the information required by the Act in the manner so required and give a true and fair view in conformity with the accounting principles generally accepted in India:
(i) in the case of the Balance Sheet, of the state of affairs of the Company as at 31st March, 2013;
(ii) in the case of the Statement of Profit and Loss, of the profit of the Company for the year ended on that date; and
(iii) in the case of the Cash Flow Statement, of the cash flows of the Company for the year ended on that date.
Report on Other Legal and Regulatory Requirements
6. As required by the Companies (Auditor’s Report) Order, 2003 (“the Order”) issued by the Central Government in terms of Section 227(4A) of the Act, we give in the Annexure a statement on the matters specified in paragraphs 4 and 5 of the Order.
7. As required by Section 227(3) of the Act, we report that:
(a) We have obtained all the information and explanations which to the best of our knowledge and belief were necessary for the purposes of our audit;
(b) In our opinion, proper books of account as required by law have been kept by the Company so far as it appears from our examination of those books;
(c) The Balance Sheet, the Statement of Profit and Loss and the Cash Flow Statement dealt with by this report are in agreement with the books of account;
(d) In our opinion, the Balance Sheet, the Statement of Profit and Loss and the Cash Flow Statement comply with the Accounting Standards referred to in Section 211(3C) of the Act.
(e) On the basis of the written representations received from the directors as on 31st March, 2013 taken on record by the Board of Directors, none of the directors is disqualified as on 31st March, 2013 from being appointed as a director in terms of Section 274(1)(g) of the Act.
For DELOITTE HASKINS & SELLSChartered Accountants
(Firm Registration No. 117364W)
Shyamak R TataPartner
(Membership No. 38320)MUMBAI : 30th May, 2013
Independent Auditors’ Report to the Members of Mahindra & Mahindra Limited
90
(Referred to in paragraph 6 under ‘Report on Other Legal and Regulatory Requirements’ section of our report of even date)
In our opinion and according to the information and explanations given to us, the nature of the Company’s business/activities during the year are such that clauses (x), (xii), (xiii) and (xiv) of paragraph 4 of the Order, are not applicable to the Company. In respect of the other clauses, we report as under:
i. In respect of its fixed assets:
(a) The Company has maintained proper records showing full particulars, including quantitative details and situation of the fixed assets.
(b) The fixed assets were physically verified during the year by the Management in accordance with a regular programme of verification which, in our opinion, provides for physical verification of all the fixed assets at reasonable intervals. According to the information and explanations given to us, no material discrepancies were noticed on such verification.
(c) During the year, in our opinion, a substantial part of fixed assets has not been disposed off by the Company.
ii. In respect of its inventories:
(a) As explained to us, the inventories were physically verified during the year by the Management at reasonable intervals.
(b) In our opinion and according to the information and explanations given to us, the procedures of physical verification of inventories followed by the Management were reasonable and adequate in relation to the size of the Company and the nature of its business.
(c) In our opinion and according to the information and explanations given to us, the Company has maintained proper records of its inventories and no material discrepancies were noticed on physical verification.
iii. The Company has neither granted nor taken any loans, secured or unsecured, to/from companies, firms or other parties covered in the Register maintained under Section 301 of the Companies Act, 1956.
iv. In our opinion and according to the information and explanations given to us, having regard to the explanations that some of the items purchased are of special nature and suitable alternative sources are not readily available for obtaining comparable quotations, there is an adequate internal control system commensurate with the size of the Company and the nature of its business with regard to purchase of inventory and fixed assets and for the sale of goods and services. During the course of our audit, we have not observed any major weakness in such internal control system.
v. In respect of contracts or arrangements entered in the Register maintained in pursuance of Section 301 of the Companies Act, 1956, to the best of our knowledge and belief and according to the information and explanations given to us:
(a) The particulars of contracts or arrangements referred to in Section 301 that needed to be entered in the Register maintained under the said Section have been so entered.
(b) Where each of such transaction is in excess of Rs. 5 lakhs in respect of any party, having regard to the explanations that some of items purchase, are of special nature and suitable alternative sources are not readily available for obtaining comparable quotations, the transactions have been made at prices which are prima facie reasonable having regard to the prevailing market prices at the relevant time.
vi. In our opinion and according to the information and explanations given to us, the Company has complied with the provisions of Sections 58A and 58AA or any other relevant provisions of the Companies Act, 1956 and the Companies (Acceptance of Deposits) Rules, 1975 with regard to the deposits accepted from the public. According to the information and explanations given to us, no Order has been passed by the Company Law Board or the National Company Law Tribunal or the Reserve Bank of India or any Court or any other Tribunal.
vii. In our opinion, the Company has an adequate internal audit system commensurate with the size of the Company and the nature of its business.
viii. We have broadly reviewed the cost records maintained by the Company, as prescribed by the Central Government under Section 209(1)(d) of the Companies Act, 1956 and are of the opinion that, prima facie, the prescribed cost records have been maintained and are being made up. We have, however, not made a detailed examination of the cost records with a view to determine whether they are accurate or complete.
ix. According to the information and explanations given to us, in respect of statutory dues:
(a) The Company has generally been regular in depositing undisputed statutory dues, including Provident Fund, Investor Education and Protection Fund, Employees’ State Insurance, Income-Tax, Sales Tax, Wealth Tax, Service Tax, Customs Duty, Excise Duty, Cess and other material statutory dues applicable to it with the appropriate authorities.
(b) There were no undisputed amounts payable in respect of Provident Fund, Investor Education and Protection Fund, Employees’ State Insurance, Income-Tax, Sales Tax, Wealth Tax, Service Tax, Customs Duty, Excise Duty, Cess and other material statutory dues in arrears as at 31st March, 2013 for a period of more than six months from the date they became payable.
Annexure to the Independent Auditors’ Report
MAHINDRA & MAHINDRA LIMITED
91
(c) As at 31st March, 2013, the following are the particulars of dues on account of Income-Tax, Sales Tax, Service Tax, Wealth Tax, Customs Duty, Excise Duty and Cess that have not been deposited on account of any dispute:
Name of Statute Nature of Dues Forum where the Dispute is pending Period to which the amount relates
Amount involved (Rs. in crores)
Income-Tax Laws Income-Tax Appellate Authority – Commissioner (Appeals) 1999-2012 76.97
Sales Tax Laws Sales Tax High Court 1987-2013 191.07
Appellate Authority – Tribunal Level 1987-2011 10.55
Appellate Authority – Commissioner (Appeals) 1997-2010 42.77
Service Tax Laws Service Tax Appellate Authority – Tribunal Level 2001-2009 1.00
Appellate Authority – Commissioner 2007-2012 44.84
Excise Duty Laws Excise Duty Supreme Court 1991-1996 506.88
High Court 2007-2008 29.69
Appellate Authority – Tribunal Level 1990-2012 497.72
Appellate Authority – Commissioner 2002-2013 127.46
Customs Duty Laws Customs Duty Appellate Authority – Tribunal Level 2008-2009 1.14
x. In our opinion and according to the information and explanations given to us, the Company has not defaulted in repayment of dues to financial institutions, banks and debenture holders.
xi. According to the information and explanations given to us, the Company has not given any guarantees for loans taken by others from banks or financial institutions, the terms and conditions, whereof, in our opinion are prejudicial to the interests of the Company.
xii. In our opinion and according to the information and explanations given to us, the term loans have been applied for the purposes for which they were obtained.
xiii. In our opinion and according to the information and explanations given to us and on an overall examination of the Balance Sheet, we report that funds raised on short term basis, have not been used during the year for long-term investment.
xiv. The Company has not made any preferential allotment of shares to parties and companies covered in the register maintained under Section 301 of the Companies Act, 1956, during the year.
xv. According to the information and explanations given to us, the Company has created security in respect of the debentures issued in earlier years.
xvi. The Company has not raised any money by public issue during the year.
xvii. To the best of our knowledge and according to the information and explanations given to us, no fraud by the Company and no significant fraud on the Company has been noticed or reported during the year.
For DELOITTE HASKINS & SELLSChartered Accountants
(Firm Registration No. 117364W)
Shyamak R TataPartner
(Membership No. 38320)MUMBAI : 30th May, 2013
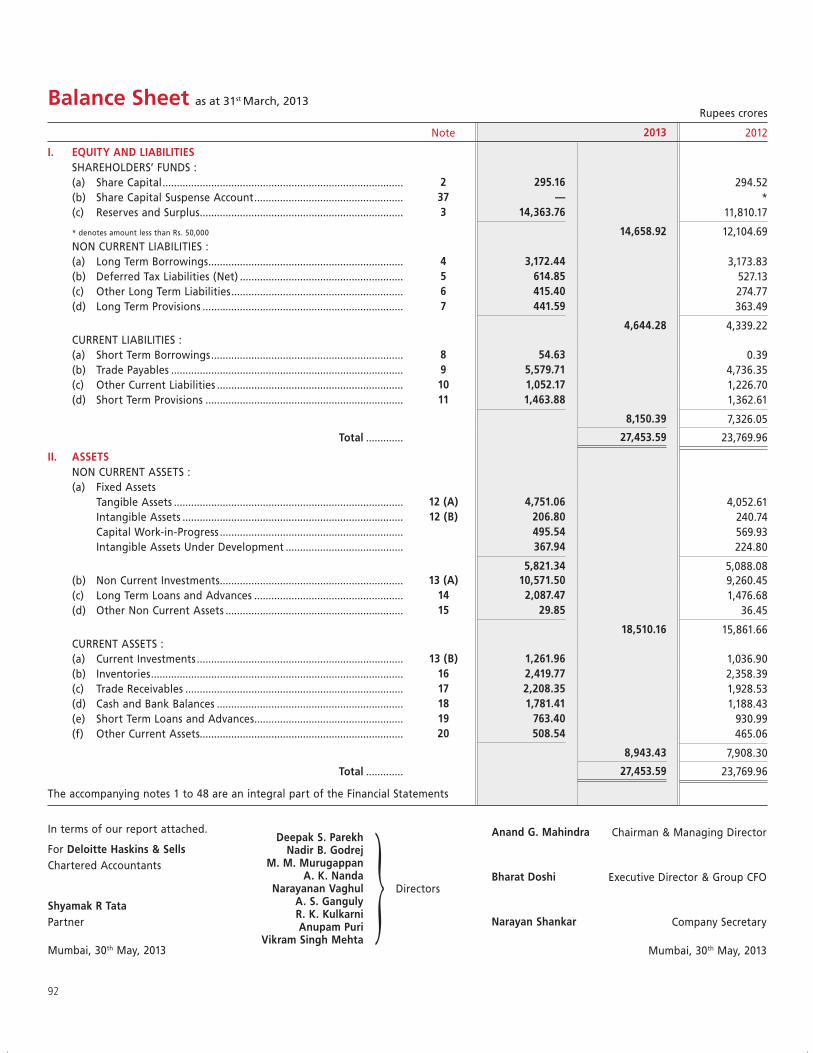
92
Balance Sheet as at 31st March, 2013Rupees crores
Note 2013 2012
I. EQUITY AND LIABILITIES SHAREHOLDERS’ FUNDS : (a) Share Capital .................................................................................... 2 295.16 294.52 (b) Share Capital Suspense Account .................................................... 37 — * (c) Reserves and Surplus ....................................................................... 3 14,363.76 11,810.17
* denotes amount less than Rs. 50,000 14,658.92 12,104.69 NON CURRENT LIABILITIES : (a) Long Term Borrowings .................................................................... 4 3,172.44 3,173.83 (b) Deferred Tax Liabilities (Net) ......................................................... 5 614.85 527.13 (c) Other Long Term Liabilities ............................................................ 6 415.40 274.77 (d) Long Term Provisions ...................................................................... 7 441.59 363.49
4,644.28 4,339.22 CURRENT LIABILITIES : (a) Short Term Borrowings ................................................................... 8 54.63 0.39 (b) Trade Payables ................................................................................. 9 5,579.71 4,736.35 (c) Other Current Liabilities ................................................................. 10 1,052.17 1,226.70 (d) Short Term Provisions ..................................................................... 11 1,463.88 1,362.61
8,150.39 7,326.05
Total ............. 27,453.59 23,769.96
II. ASSETS NON CURRENT ASSETS : (a) Fixed Assets Tangible Assets ................................................................................ 12 (A) 4,751.06 4,052.61 Intangible Assets ............................................................................. 12 (B) 206.80 240.74 Capital Work-in-Progress ................................................................ 495.54 569.93 Intangible Assets Under Development ......................................... 367.94 224.80
5,821.34 5,088.08 (b) Non Current Investments ................................................................ 13 (A) 10,571.50 9,260.45 (c) Long Term Loans and Advances .................................................... 14 2,087.47 1,476.68 (d) Other Non Current Assets .............................................................. 15 29.85 36.45
18,510.16 15,861.66 CURRENT ASSETS : (a) Current Investments ........................................................................ 13 (B) 1,261.96 1,036.90 (b) Inventories ........................................................................................ 16 2,419.77 2,358.39 (c) Trade Receivables ............................................................................ 17 2,208.35 1,928.53 (d) Cash and Bank Balances ................................................................. 18 1,781.41 1,188.43 (e) Short Term Loans and Advances .................................................... 19 763.40 930.99 (f) Other Current Assets....................................................................... 20 508.54 465.06
8,943.43 7,908.30
Total ............. 27,453.59 23,769.96
The accompanying notes 1 to 48 are an integral part of the Financial Statements
Deepak S. ParekhNadir B. Godrej
M. M. MurugappanA. K. Nanda
Narayanan Vaghul A. S. GangulyR. K. KulkarniAnupam Puri
Vikram Singh Mehta
Directors
In terms of our report attached.
For Deloitte Haskins & SellsChartered Accountants
Shyamak R TataPartner
Mumbai, 30th May, 2013
Anand G. Mahindra Chairman & Managing Director
Bharat Doshi Executive Director & Group CFO
Narayan Shankar Company Secretary
Mumbai, 30th May, 2013
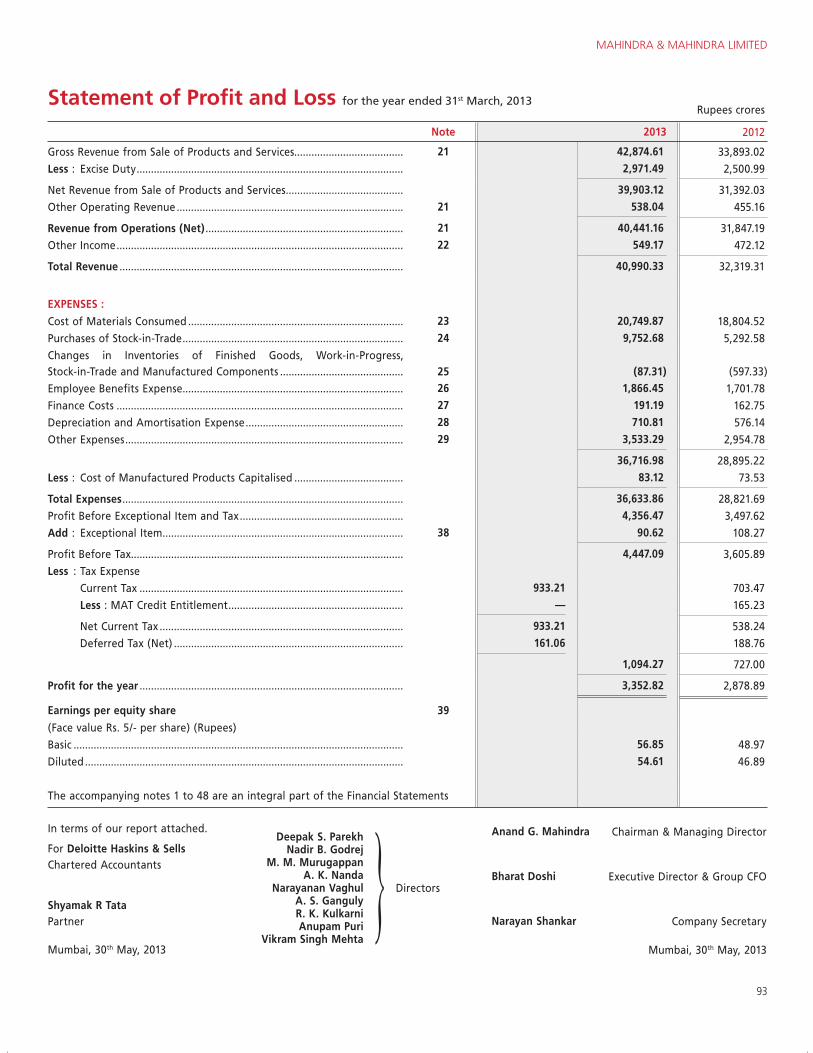
MAHINDRA & MAHINDRA LIMITED
93
Statement of Profit and Loss for the year ended 31st March, 2013Rupees crores
Note 2013 2012
Gross Revenue from Sale of Products and Services...................................... 21 42,874.61 33,893.02
Less : Excise Duty ............................................................................................. 2,971.49 2,500.99
Net Revenue from Sale of Products and Services ......................................... 39,903.12 31,392.03
Other Operating Revenue ............................................................................... 21 538.04 455.16
Revenue from Operations (Net) ..................................................................... 21 40,441.16 31,847.19
Other Income .................................................................................................... 22 549.17 472.12
Total Revenue ................................................................................................... 40,990.33 32,319.31
EXPENSES :
Cost of Materials Consumed ........................................................................... 23 20,749.87 18,804.52
Purchases of Stock-in-Trade ............................................................................. 24 9,752.68 5,292.58
Changes in Inventories of Finished Goods, Work-in-Progress, Stock-in-Trade and Manufactured Components ........................................... 25 (87.31) (597.33)
Employee Benefits Expense ............................................................................. 26 1,866.45 1,701.78
Finance Costs .................................................................................................... 27 191.19 162.75
Depreciation and Amortisation Expense ....................................................... 28 710.81 576.14
Other Expenses ................................................................................................. 29 3,533.29 2,954.78
36,716.98 28,895.22
Less : Cost of Manufactured Products Capitalised ...................................... 83.12 73.53
Total Expenses .................................................................................................. 36,633.86 28,821.69
Profit Before Exceptional Item and Tax ......................................................... 4,356.47 3,497.62
Add : Exceptional Item .................................................................................... 38 90.62 108.27
Profit Before Tax............................................................................................... 4,447.09 3,605.89
Less : Tax Expense
Current Tax ............................................................................................ 933.21 703.47
Less : MAT Credit Entitlement ............................................................. — 165.23
Net Current Tax ..................................................................................... 933.21 538.24
Deferred Tax (Net) ................................................................................ 161.06 188.76
1,094.27 727.00
Profit for the year ............................................................................................ 3,352.82 2,878.89
Earnings per equity share 39
(Face value Rs. 5/- per share) (Rupees)
Basic ................................................................................................................... 56.85 48.97
Diluted ............................................................................................................... 54.61 46.89
The accompanying notes 1 to 48 are an integral part of the Financial Statements
Deepak S. ParekhNadir B. Godrej
M. M. MurugappanA. K. Nanda
Narayanan Vaghul A. S. GangulyR. K. KulkarniAnupam Puri
Vikram Singh Mehta
Directors
In terms of our report attached.
For Deloitte Haskins & SellsChartered Accountants
Shyamak R TataPartner
Mumbai, 30th May, 2013
Anand G. Mahindra Chairman & Managing Director
Bharat Doshi Executive Director & Group CFO
Narayan Shankar Company Secretary
Mumbai, 30th May, 2013
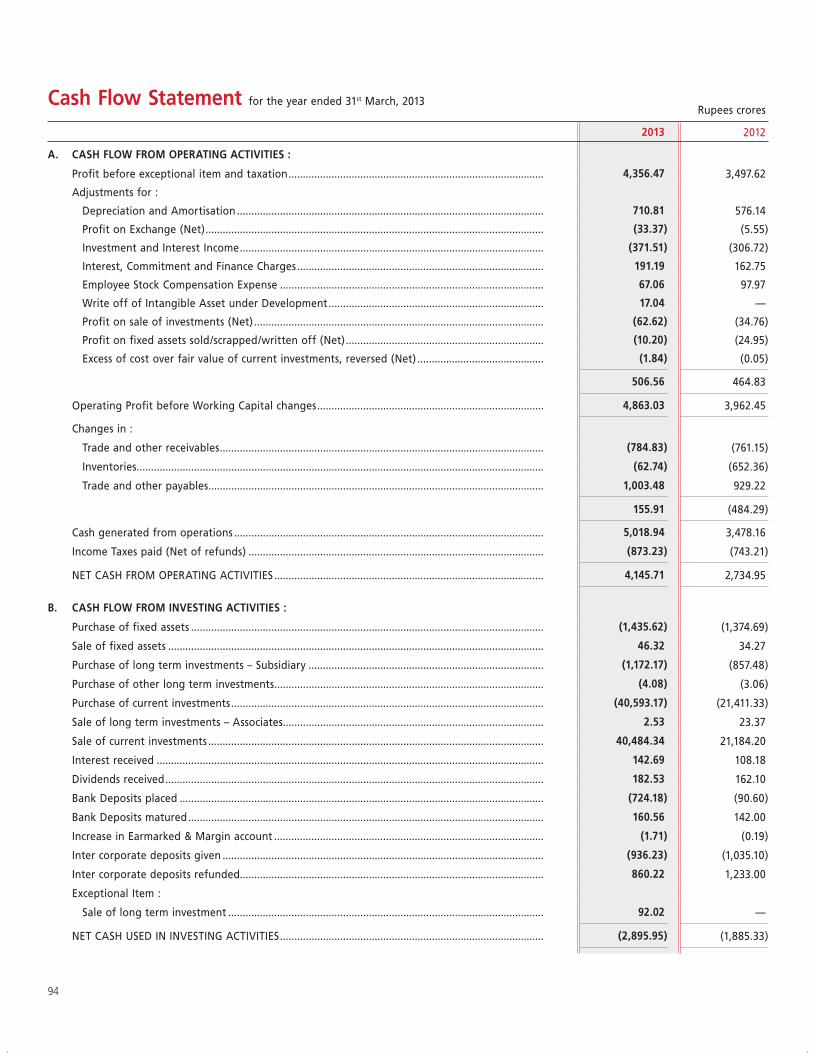
94
Rupees crores
2013 2012
A. CASH FLOW FROM OPERATING ACTIVITIES :
Profit before exceptional item and taxation ......................................................................................... 4,356.47 3,497.62
Adjustments for :
Depreciation and Amortisation ........................................................................................................... 710.81 576.14
Profit on Exchange (Net) ...................................................................................................................... (33.37) (5.55)
Investment and Interest Income .......................................................................................................... (371.51) (306.72)
Interest, Commitment and Finance Charges ...................................................................................... 191.19 162.75
Employee Stock Compensation Expense ............................................................................................ 67.06 97.97
Write off of Intangible Asset under Development ........................................................................... 17.04 —
Profit on sale of investments (Net) ..................................................................................................... (62.62) (34.76)
Profit on fixed assets sold/scrapped/written off (Net) ..................................................................... (10.20) (24.95)
Excess of cost over fair value of current investments, reversed (Net) ............................................ (1.84) (0.05)
506.56 464.83
Operating Profit before Working Capital changes ............................................................................... 4,863.03 3,962.45
Changes in :
Trade and other receivables ................................................................................................................. (784.83) (761.15)
Inventories .............................................................................................................................................. (62.74) (652.36)
Trade and other payables ..................................................................................................................... 1,003.48 929.22
155.91 (484.29)
Cash generated from operations ............................................................................................................ 5,018.94 3,478.16
Income Taxes paid (Net of refunds) ....................................................................................................... (873.23) (743.21)
NET CASH FROM OPERATING ACTIVITIES .............................................................................................. 4,145.71 2,734.95
B. CASH FLOW FROM INVESTING ACTIVITIES :
Purchase of fixed assets ........................................................................................................................... (1,435.62) (1,374.69)
Sale of fixed assets ................................................................................................................................... 46.32 34.27
Purchase of long term investments – Subsidiary .................................................................................. (1,172.17) (857.48)
Purchase of other long term investments .............................................................................................. (4.08) (3.06)
Purchase of current investments ............................................................................................................. (40,593.17) (21,411.33)
Sale of long term investments – Associates ........................................................................................... 2.53 23.37
Sale of current investments ..................................................................................................................... 40,484.34 21,184.20
Interest received ....................................................................................................................................... 142.69 108.18
Dividends received .................................................................................................................................... 182.53 162.10
Bank Deposits placed ............................................................................................................................... (724.18) (90.60)
Bank Deposits matured ............................................................................................................................ 160.56 142.00
Increase in Earmarked & Margin account .............................................................................................. (1.71) (0.19)
Inter corporate deposits given ................................................................................................................ (936.23) (1,035.10)
Inter corporate deposits refunded.......................................................................................................... 860.22 1,233.00
Exceptional Item :
Sale of long term investment .............................................................................................................. 92.02 —
NET CASH USED IN INVESTING ACTIVITIES ............................................................................................ (2,895.95) (1,885.33)
Cash Flow Statement for the year ended 31st March, 2013
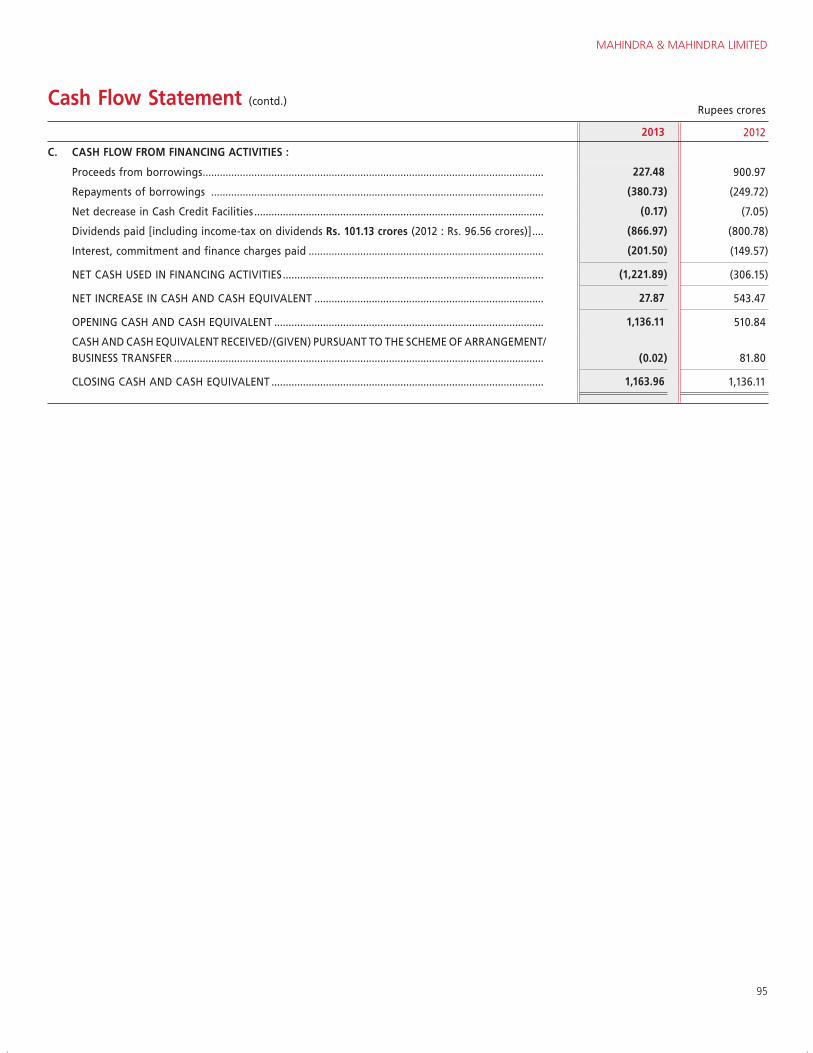
MAHINDRA & MAHINDRA LIMITED
95
Rupees crores
2013 2012
C. CASH FLOW FROM FINANCING ACTIVITIES :
Proceeds from borrowings ....................................................................................................................... 227.48 900.97
Repayments of borrowings .................................................................................................................... (380.73) (249.72)
Net decrease in Cash Credit Facilities ..................................................................................................... (0.17) (7.05)
Dividends paid [including income-tax on dividends Rs. 101.13 crores (2012 : Rs. 96.56 crores)] .... (866.97) (800.78)
Interest, commitment and finance charges paid .................................................................................. (201.50) (149.57)
NET CASH USED IN FINANCING ACTIVITIES ........................................................................................... (1,221.89) (306.15)
NET INCREASE IN CASH AND CASH EQUIVALENT ................................................................................ 27.87 543.47
OPENING CASH AND CASH EQUIVALENT .............................................................................................. 1,136.11 510.84
CASH AND CASH EQUIVALENT RECEIVED/(GIVEN) PURSUANT TO THE SCHEME OF ARRANGEMENT/BUSINESS TRANSFER ................................................................................................................................. (0.02) 81.80
CLOSING CASH AND CASH EQUIVALENT ............................................................................................... 1,163.96 1,136.11
Cash Flow Statement (contd.)
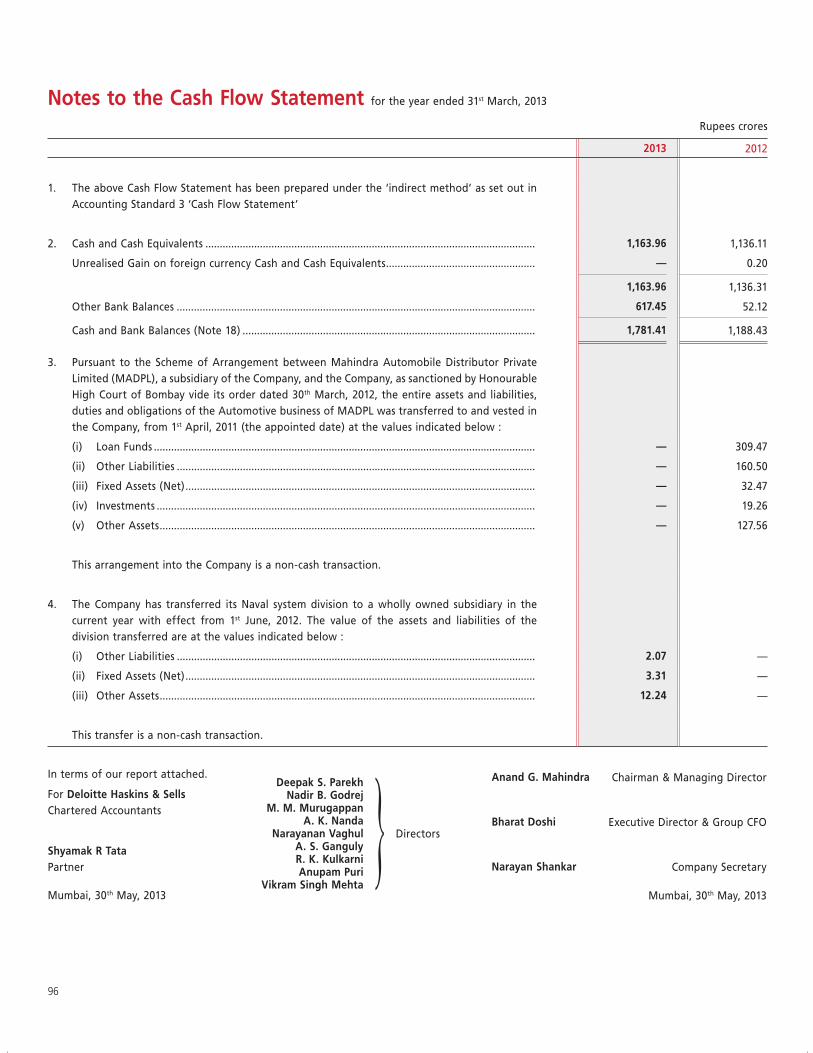
96
Notes to the Cash Flow Statement for the year ended 31st March, 2013
Rupees crores
2013 2012
1. The above Cash Flow Statement has been prepared under the ‘indirect method’ as set out in Accounting Standard 3 ‘Cash Flow Statement’
2. Cash and Cash Equivalents ................................................................................................................... 1,163.96 1,136.11
Unrealised Gain on foreign currency Cash and Cash Equivalents .................................................... — 0.20
1,163.96 1,136.31
Other Bank Balances ............................................................................................................................. 617.45 52.12
Cash and Bank Balances (Note 18) ...................................................................................................... 1,781.41 1,188.43
3. Pursuant to the Scheme of Arrangement between Mahindra Automobile Distributor Private Limited (MADPL), a subsidiary of the Company, and the Company, as sanctioned by Honourable High Court of Bombay vide its order dated 30th March, 2012, the entire assets and liabilities, duties and obligations of the Automotive business of MADPL was transferred to and vested in the Company, from 1st April, 2011 (the appointed date) at the values indicated below :
(i) Loan Funds ..................................................................................................................................... — 309.47
(ii) Other Liabilities ............................................................................................................................. — 160.50
(iii) Fixed Assets (Net) .......................................................................................................................... — 32.47
(iv) Investments .................................................................................................................................... — 19.26
(v) Other Assets ................................................................................................................................... — 127.56
This arrangement into the Company is a non-cash transaction.
4. The Company has transferred its Naval system division to a wholly owned subsidiary in the current year with effect from 1st June, 2012. The value of the assets and liabilities of the division transferred are at the values indicated below :
(i) Other Liabilities ............................................................................................................................. 2.07 —
(ii) Fixed Assets (Net) .......................................................................................................................... 3.31 —
(iii) Other Assets ................................................................................................................................... 12.24 —
This transfer is a non-cash transaction.
Deepak S. ParekhNadir B. Godrej
M. M. MurugappanA. K. Nanda
Narayanan Vaghul A. S. GangulyR. K. KulkarniAnupam Puri
Vikram Singh Mehta
Directors
In terms of our report attached.
For Deloitte Haskins & SellsChartered Accountants
Shyamak R TataPartner
Mumbai, 30th May, 2013
Anand G. Mahindra Chairman & Managing Director
Bharat Doshi Executive Director & Group CFO
Narayan Shankar Company Secretary
Mumbai, 30th May, 2013
MAHINDRA & MAHINDRA LIMITED
97
Notes forming part of the Financial Statements for the year ended 31st March, 2013
1. Significant Accounting Policies :
(A) Basis of Accounting :
The financial statements are prepared in accordance with the generally accepted accounting principles in India and comply with the Accounting Standards notified under sub-section (3C) of Section 211 of the Companies Act, 1956 and the relevant provisions thereof.
(B) Tangible Assets :
(a) (i) Tangible assets are carried at cost less depreciation except as stated in (ii) below. Cost includes financing cost relating to borrowed funds attributable to the construction or acquisition of qualifying tangible assets upto the date the assets are ready for use. Where the acquisition of depreciable tangible assets are financed through long term foreign currency loans (having a term of 12 months or more at the time of their origination) the exchange differences on such loans are added to or subtracted from the cost of such depreciable tangible assets.
When an asset is scrapped or otherwise disposed off, the cost and related depreciation are removed from the books of account and resultant profit (including capital profit) or loss, if any, is reflected in the Statement of Profit and Loss.
(ii) Land and Buildings, had been revalued as at 31st October, 1984 at depreciated replacement values on the basis of a valuation made by a firm of Chartered Surveyors and Valuers. The indices, if any, used are not stated in the valuation.
(b) (i) Leasehold land is amortised over the period of the lease.
(ii) Depreciation on assets is calculated on Straight Line Method over their estimated useful lives, or lives based on the rates specified in Schedule XIV to the Companies Act, 1956, whichever is higher. Accordingly depreciation is provided on :
(1) Certain items of Plant and Machinery individually costing more than Rs. 5,000 - over their useful lives (2 years, 3 years, 5 years or 7 years, as the case may be).
(2) Cars and Vehicles – at 15% of cost.
(iii) Depreciation charge for each year is after deducting the amount representing the depreciation on the increase due to revaluation of Land and Buildings, transferred from the Revaluation Reserve.
(C) Intangible Assets :
Intangible assets are initially measured at cost and amortised so as to reflect the pattern in which the asset’s economic benefits are consumed.
(a) Technical Knowhow :
The expenditure incurred is amortised over the estimated period of benefit, not exceeding six years commencing with the year of purchase of the technology.
(b) Development Expenditure :
` The expenditure incurred on technical services and other project/product related expenses are amortised over the estimated period of benefit, not exceeding five years.
(c) Software Expenditure :
The expenditure incurred is amortised over three financial years equally commencing from the year in which the expenditure is incurred.
(D) Impairment of Assets :
The carrying value of assets/cash generating units at each balance sheet date are reviewed for impairment. If any indication of impairment exists, the recoverable amount of such assets is estimated and impairment is recognised, if the carrying amount of these assets exceeds their recoverable amount. The recoverable amount is the greater of the net selling price and their value in use. Value in use is arrived at by discounting the future cash flows expected to arise from the continuing use of an asset and from its disposal at the end of its useful life to their present value based on an appropriate discount factor. When there is indication that an impairment loss recognised for an asset in earlier accounting periods no longer exists or may have decreased, such reversal of impairment loss is recognised in the Statement of Profit and Loss, except in case of revalued assets.
98
(E) Investments :
Long term investments are valued at cost. However, provision for diminution in value is made to recognise a decline other than temporary in the value of investments. Current investments are valued at the lower of cost and fair value, determined by category of investment.
(F) Inventories :
Inventories comprise all costs of purchase, conversion and other costs incurred in bringing the inventories to their present location and condition.
Raw materials and bought out components are valued at the lower of cost or net realisable value. Cost is determined on the basis of the weighted average method.
Finished goods produced and purchased for sale, manufactured components and work-in-progress are carried at cost or net realisable value whichever is lower. Excise duty is included in the value of finished goods inventory.
Stores, spares and tools other than obsolete and slow moving items are carried at cost. Obsolete and slow moving items are valued at cost or estimated net realisable value, whichever is lower.
(G) Foreign Exchange Transactions :
Transactions in foreign currencies (other than firm commitments and highly probable forecast transactions) are recorded at the exchange rates prevailing on the date of transaction. Monetary items are translated at the year-end rates. The exchange difference between the rate prevailing on the date of transaction and on the date of settlement as also on translation of monetary items at the end of the year (other than those relating to long term foreign currency monetary items) is recognised as income or expense, as the case may be.
Exchange differences relating to long term foreign currency monetary items, to the extent they are used for financing the acquisition of depreciable tangible assets are added to, or subtracted from, the cost of such depreciable tangible assets and the balance accumulated in ‘Foreign Currency Monetary Item Translation Difference Account’, under Reserves and Surplus, and amortised over the balance term of the long term monetary item.
Any premium or discount arising at the inception of a forward exchange contract is recognised as income or expense over the life of the contract, except where the contract is designated as a cash flow hedge.
(H) Derivative Instruments and Hedge Accounting :
The Company uses foreign currency forward contracts and currency options to hedge its risks associated with foreign currency fluctuations relating to certain firm commitments and highly probable forecast transactions. The Company does not hold derivative financial instruments for speculative purposes. The Company has applied to such contracts the hedge accounting principles set out in Accounting Standard 30 ‘Financial Instruments : Recognition and Measurement’ (AS 30) by marking them to market at each reporting date.
Changes in the fair value of the contracts that are designated and effective as hedges of future cash flows are recognised directly in Hedging Reserve Account and the ineffective portion is recognised in the Statement of Profit and Loss.
(I) Revenue Recognition :
Sales of products and services including export benefits thereon are recognised when the products are shipped or services rendered.
Excise duty recovered on sales is included in “Revenue from Operations”.
Dividend from investments are recognised in the Statement of Profit and Loss when the right to receive payment is established.
(J) Government Grants :
The Company, directly or indirectly through a consortium of Mahindra Group Companies, is entitled to various incentives from government authorities in respect of manufacturing units located in developing regions. The Company accounts for its entitlement as income on accrual basis.
(K) Employee Benefits :
In respect of Defined Contribution Plans/Defined Benefit Plans/Long term Compensated Absences :
Company’s contributions paid/payable during the year to Superannuation Fund, ESIC and Labour Welfare Fund are recognised in the Statement of Profit and Loss.
MAHINDRA & MAHINDRA LIMITED
99
Contributions to Provident Fund are made to a Trust administered by the Company and are charged to Statement of Profit and Loss as incurred. The Company is liable for the contribution and any shortfall in interest between the amount of interest realised by the investments and the interest payable to members at the rate declared by the Government of India.
Company’s liability towards gratuity, long term compensated absences, post retirement medical benefit and post retirement housing allowance schemes are determined by independent actuaries, using the projected unit credit method. Past services are recognised on a straight line basis over the average period until the benefits become vested. Actuarial gains and losses are recognised immediately in the Statement of Profit and Loss as income or expense. Obligation is measured at the present value of estimated future cash flows using a discounted rate that is determined by reference to the market yields at the Balance Sheet date on Government Bonds where the currency and terms of the Government Bonds are consistent with the currency and estimated terms of the defined benefit obligation.
In respect of Employee Stock Option Scheme :
The compensation cost of stock options granted to employees is measured by the Intrinsic Value Method. The intrinsic value, which is the excess of the market price of the underlying equity shares as of the date of the grant over the exercise price of the option, is recognised and amortised on straight line basis over the vesting period.
(L) Borrowing Costs :
All borrowing costs are charged to the Statement of Profit and Loss except :
(i) Borrowing costs that are attributable to the acquisition or construction of assets that necessarily take a substantial period of time to get ready for their intended use, which are capitalised as part of the cost of such assets.
(ii) Expenses incurred on raising long term borrowings are amortised over the period of borrowings. On early buyback, conversion or repayment of borrowings, any unamortised expenditure is fully written off in that year.
(M) Product Warranty :
In respect of warranties given by the Company on sale of certain products, the estimated costs of these warranties are accrued at the time of sale. The estimates for accounting of warranties are reviewed and revisions are made as required.
(N) Leases :
The Company’s significant leasing arrangements are in respect of operating leases for premises (residential, office, stores, godowns, computer hardware etc.). The leasing arrangements, which are not non-cancellable, range between eleven months and five years generally, and are usually renewable by mutual consent on agreed terms. The aggregate lease rentals payable are charged as rent.
(O) Taxes on Income :
Current tax is determined as the amount of tax payable in respect of taxable income for the year. Deferred tax is recognised, subject to consideration of prudence, on timing differences, being the difference between taxable income and accounting income that originate in one period and are capable of reversal in one or more subsequent periods. Deferred tax assets arising on account of unabsorbed depreciation or carry forward of tax losses are recognised only to the extent that there is virtual certainty supported by convincing evidence that sufficient future tax income will be available against which such deferred tax assets can be realised.
Minimum Alternate Tax (MAT) paid in accordance with the tax laws, which gives future economic benefits in the form of adjustment to future income tax liability, is considered as an asset if there is convincing evidence that the Company will pay normal income tax against which the MAT paid will be adjusted.
(P) Segment Reporting :
Segments are identified having regard to the dominant source and nature of risks and returns and internal organisation and management structure.
Revenues and expenses have been identified to the segment based on their relationship to the business activity of the segment.
Income/Expenses relating to the enterprise as a whole and not allocable on a reasonable basis to business segments are reflected as unallocated corporate income/expenses. Inter-segment transfers are at prices which are generally market led.
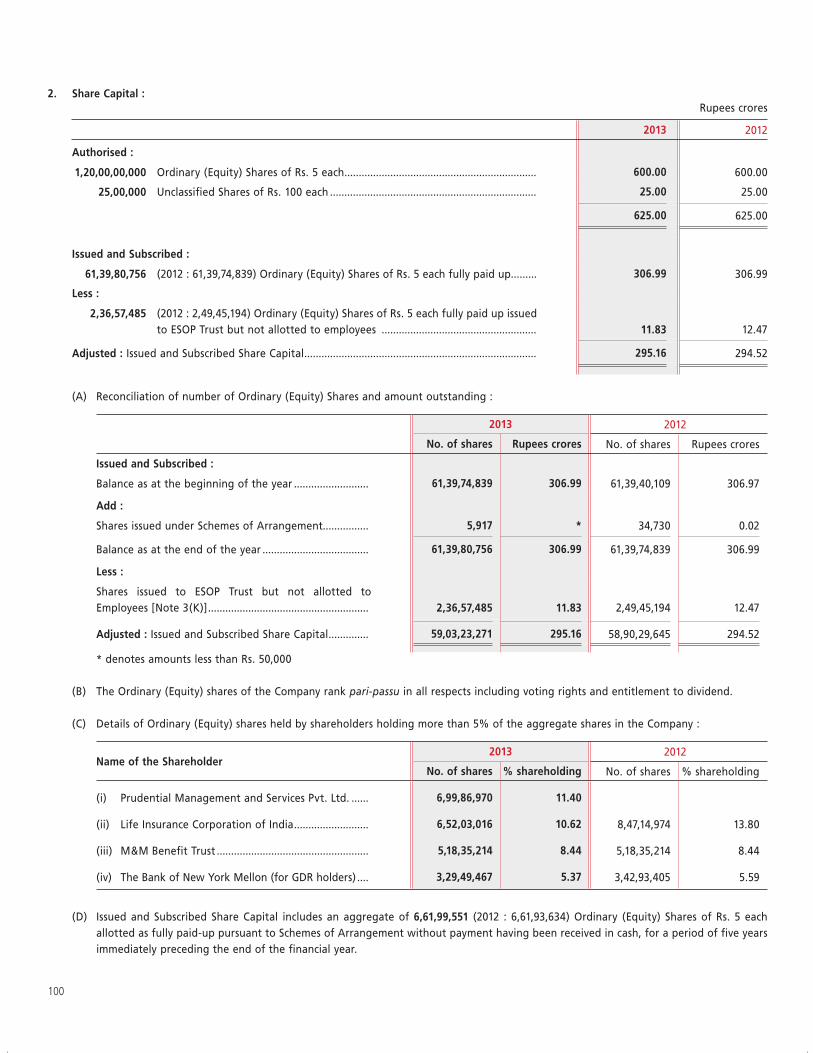
100
2. Share Capital :Rupees crores
2013 2012
Authorised :
1,20,00,00,000 Ordinary (Equity) Shares of Rs. 5 each ................................................................... 600.00 600.00
25,00,000 Unclassified Shares of Rs. 100 each ........................................................................ 25.00 25.00
625.00 625.00
Issued and Subscribed :
61,39,80,756 (2012 : 61,39,74,839) Ordinary (Equity) Shares of Rs. 5 each fully paid up......... 306.99 306.99
Less :
2,36,57,485 (2012 : 2,49,45,194) Ordinary (Equity) Shares of Rs. 5 each fully paid up issued to ESOP Trust but not allotted to employees ...................................................... 11.83 12.47
Adjusted : Issued and Subscribed Share Capital ................................................................................. 295.16 294.52
(A) Reconciliation of number of Ordinary (Equity) Shares and amount outstanding :
2013 2012
No. of shares Rupees crores No. of shares Rupees crores
Issued and Subscribed :
Balance as at the beginning of the year .......................... 61,39,74,839 306.99 61,39,40,109 306.97
Add :
Shares issued under Schemes of Arrangement................ 5,917 * 34,730 0.02
Balance as at the end of the year ..................................... 61,39,80,756 306.99 61,39,74,839 306.99
Less :
Shares issued to ESOP Trust but not allotted to Employees [Note 3(K)] ........................................................ 2,36,57,485 11.83 2,49,45,194 12.47
Adjusted : Issued and Subscribed Share Capital .............. 59,03,23,271 295.16 58,90,29,645 294.52
* denotes amounts less than Rs. 50,000
(B) The Ordinary (Equity) shares of the Company rank pari-passu in all respects including voting rights and entitlement to dividend.
(C) Details of Ordinary (Equity) shares held by shareholders holding more than 5% of the aggregate shares in the Company :
Name of the Shareholder2013 2012
No. of shares % shareholding No. of shares % shareholding
(i) Prudential Management and Services Pvt. Ltd. ...... 6,99,86,970 11.40
(ii) Life Insurance Corporation of India .......................... 6,52,03,016 10.62 8,47,14,974 13.80
(iii) M&M Benefit Trust ..................................................... 5,18,35,214 8.44 5,18,35,214 8.44
(iv) The Bank of New York Mellon (for GDR holders) .... 3,29,49,467 5.37 3,42,93,405 5.59
(D) Issued and Subscribed Share Capital includes an aggregate of 6,61,99,551 (2012 : 6,61,93,634) Ordinary (Equity) Shares of Rs. 5 each allotted as fully paid-up pursuant to Schemes of Arrangement without payment having been received in cash, for a period of five years immediately preceding the end of the financial year.
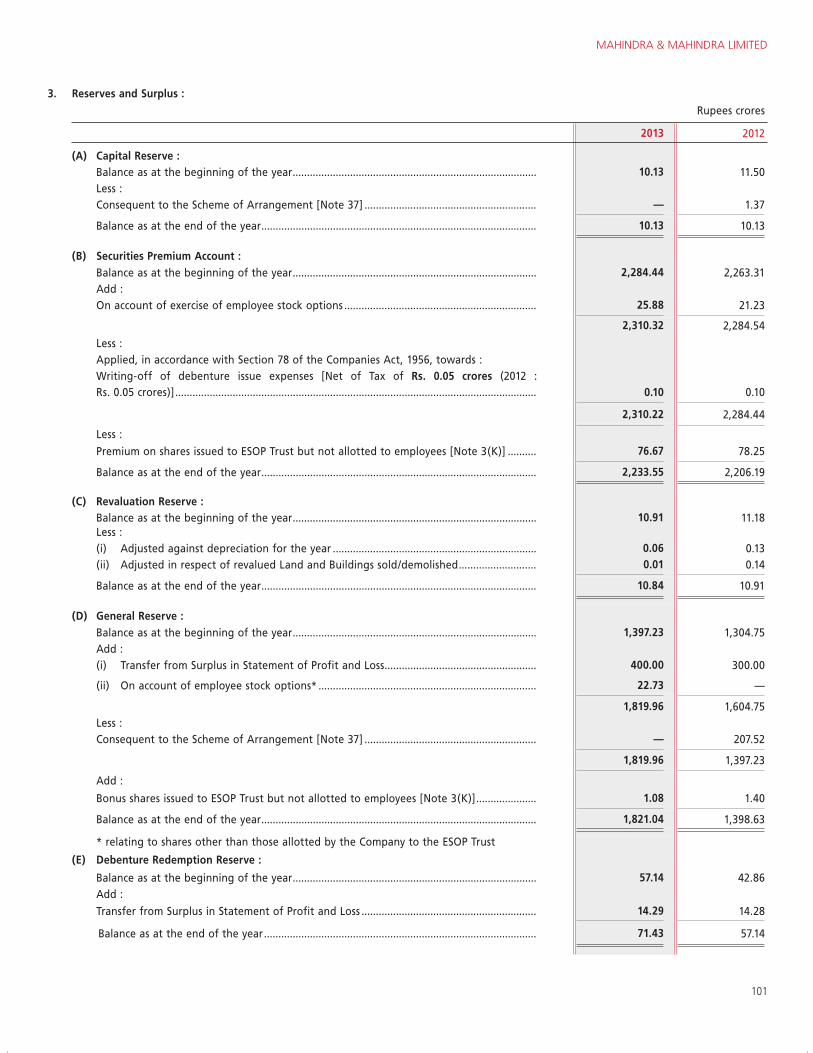
MAHINDRA & MAHINDRA LIMITED
101
3. Reserves and Surplus : (contd.)
Rupees crores
2013 2012
(A) Capital Reserve : Balance as at the beginning of the year ..................................................................................... 10.13 11.50 Less : Consequent to the Scheme of Arrangement [Note 37] ............................................................ — 1.37
Balance as at the end of the year ................................................................................................ 10.13 10.13
(B) Securities Premium Account : Balance as at the beginning of the year ..................................................................................... 2,284.44 2,263.31 Add : On account of exercise of employee stock options ................................................................... 25.88 21.23
2,310.32 2,284.54
Less : Applied, in accordance with Section 78 of the Companies Act, 1956, towards : Writing-off of debenture issue expenses [Net of Tax of Rs. 0.05 crores (2012 :
Rs. 0.05 crores)] .............................................................................................................................. 0.10 0.10
2,310.22 2,284.44
Less :
Premium on shares issued to ESOP Trust but not allotted to employees [Note 3(K)] .......... 76.67 78.25
Balance as at the end of the year ................................................................................................ 2,233.55 2,206.19
(C) Revaluation Reserve : Balance as at the beginning of the year ..................................................................................... 10.91 11.18 Less : (i) Adjusted against depreciation for the year ....................................................................... 0.06 0.13 (ii) Adjusted in respect of revalued Land and Buildings sold/demolished ........................... 0.01 0.14
Balance as at the end of the year ................................................................................................ 10.84 10.91
(D) General Reserve : Balance as at the beginning of the year ..................................................................................... 1,397.23 1,304.75 Add : (i) Transfer from Surplus in Statement of Profit and Loss ..................................................... 400.00 300.00
(ii) On account of employee stock options* ............................................................................ 22.73 —
1,819.96 1,604.75 Less : Consequent to the Scheme of Arrangement [Note 37] ............................................................ — 207.52
1,819.96 1,397.23
Add :
Bonus shares issued to ESOP Trust but not allotted to employees [Note 3(K)] ..................... 1.08 1.40
Balance as at the end of the year ................................................................................................ 1,821.04 1,398.63
* relating to shares other than those allotted by the Company to the ESOP Trust
(E) Debenture Redemption Reserve :
Balance as at the beginning of the year ..................................................................................... 57.14 42.86 Add :
Transfer from Surplus in Statement of Profit and Loss ............................................................. 14.29 14.28
Balance as at the end of the year ............................................................................................... 71.43 57.14
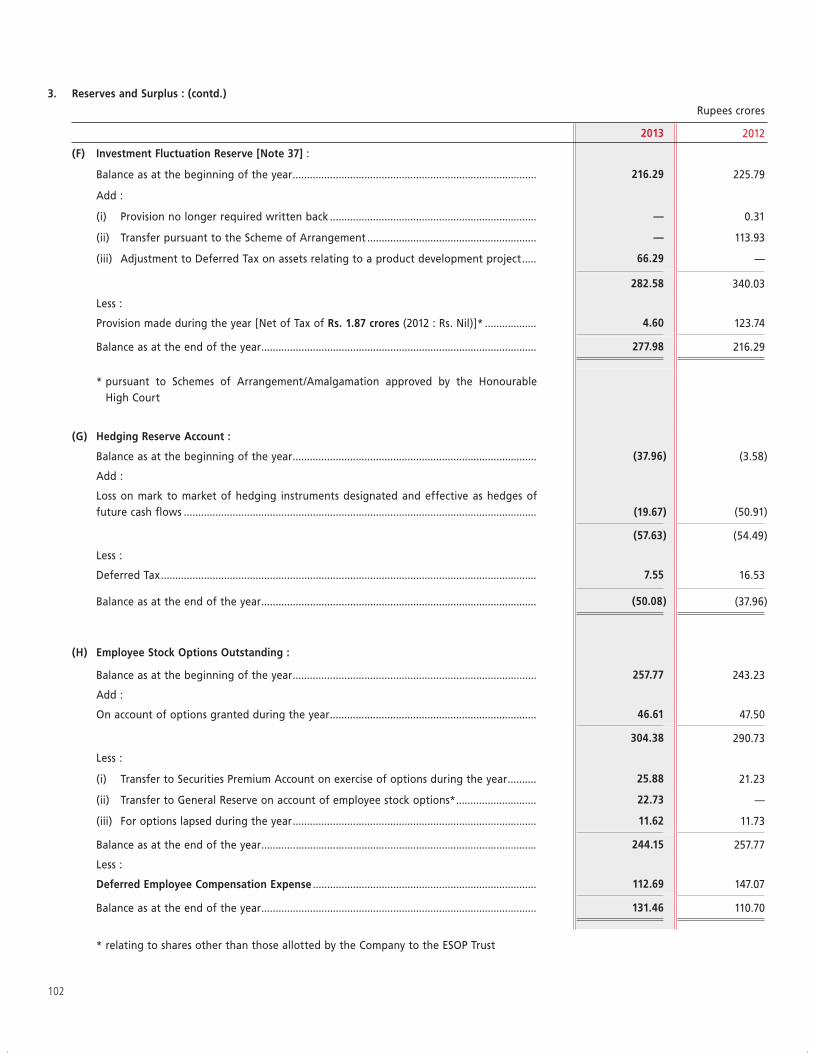
102
3. Reserves and Surplus : (contd.)
Rupees crores
2013 2012
(F) Investment Fluctuation Reserve [Note 37] :
Balance as at the beginning of the year ..................................................................................... 216.29 225.79
Add :
(i) Provision no longer required written back ........................................................................ — 0.31
(ii) Transfer pursuant to the Scheme of Arrangement ........................................................... — 113.93
(iii) Adjustment to Deferred Tax on assets relating to a product development project ..... 66.29 —
282.58 340.03
Less :
Provision made during the year [Net of Tax of Rs. 1.87 crores (2012 : Rs. Nil)]* .................. 4.60 123.74
Balance as at the end of the year ................................................................................................ 277.98 216.29
* pursuant to Schemes of Arrangement/Amalgamation approved by the Honourable High Court
(G) Hedging Reserve Account :
Balance as at the beginning of the year ..................................................................................... (37.96) (3.58)
Add :
Loss on mark to market of hedging instruments designated and effective as hedges of future cash flows ........................................................................................................................... (19.67) (50.91)
(57.63) (54.49)
Less :
Deferred Tax ................................................................................................................................... 7.55 16.53
Balance as at the end of the year ................................................................................................ (50.08) (37.96)
(H) Employee Stock Options Outstanding :
Balance as at the beginning of the year ..................................................................................... 257.77 243.23
Add :
On account of options granted during the year ........................................................................ 46.61 47.50
304.38 290.73
Less :
(i) Transfer to Securities Premium Account on exercise of options during the year .......... 25.88 21.23
(ii) Transfer to General Reserve on account of employee stock options* ............................ 22.73 —
(iii) For options lapsed during the year ..................................................................................... 11.62 11.73
Balance as at the end of the year ................................................................................................ 244.15 257.77
Less :
Deferred Employee Compensation Expense .............................................................................. 112.69 147.07
Balance as at the end of the year ................................................................................................ 131.46 110.70
* relating to shares other than those allotted by the Company to the ESOP Trust
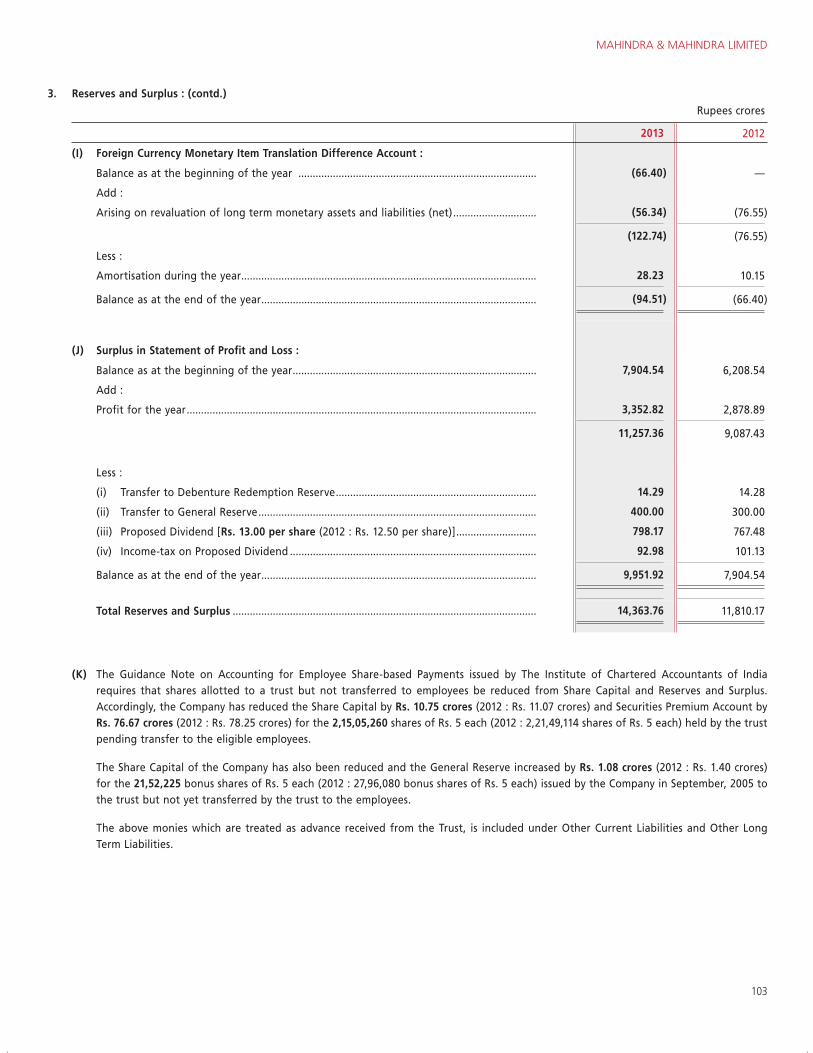
MAHINDRA & MAHINDRA LIMITED
103
3. Reserves and Surplus : (contd.)
Rupees crores
2013 2012
(I) Foreign Currency Monetary Item Translation Difference Account :
Balance as at the beginning of the year ................................................................................... (66.40) —
Add :
Arising on revaluation of long term monetary assets and liabilities (net) ............................. (56.34) (76.55)
(122.74) (76.55)
Less :
Amortisation during the year ....................................................................................................... 28.23 10.15
Balance as at the end of the year ................................................................................................ (94.51) (66.40)
(J) Surplus in Statement of Profit and Loss :
Balance as at the beginning of the year ..................................................................................... 7,904.54 6,208.54
Add :
Profit for the year .......................................................................................................................... 3,352.82 2,878.89
11,257.36 9,087.43
Less :
(i) Transfer to Debenture Redemption Reserve ...................................................................... 14.29 14.28
(ii) Transfer to General Reserve ................................................................................................. 400.00 300.00
(iii) Proposed Dividend [Rs. 13.00 per share (2012 : Rs. 12.50 per share)] ............................ 798.17 767.48
(iv) Income-tax on Proposed Dividend ...................................................................................... 92.98 101.13
Balance as at the end of the year ................................................................................................ 9,951.92 7,904.54
Total Reserves and Surplus .......................................................................................................... 14,363.76 11,810.17
(K) The Guidance Note on Accounting for Employee Share-based Payments issued by The Institute of Chartered Accountants of India requires that shares allotted to a trust but not transferred to employees be reduced from Share Capital and Reserves and Surplus. Accordingly, the Company has reduced the Share Capital by Rs. 10.75 crores (2012 : Rs. 11.07 crores) and Securities Premium Account by Rs. 76.67 crores (2012 : Rs. 78.25 crores) for the 2,15,05,260 shares of Rs. 5 each (2012 : 2,21,49,114 shares of Rs. 5 each) held by the trust pending transfer to the eligible employees.
The Share Capital of the Company has also been reduced and the General Reserve increased by Rs. 1.08 crores (2012 : Rs. 1.40 crores) for the 21,52,225 bonus shares of Rs. 5 each (2012 : 27,96,080 bonus shares of Rs. 5 each) issued by the Company in September, 2005 to the trust but not yet transferred by the trust to the employees.
The above monies which are treated as advance received from the Trust, is included under Other Current Liabilities and Other Long Term Liabilities.
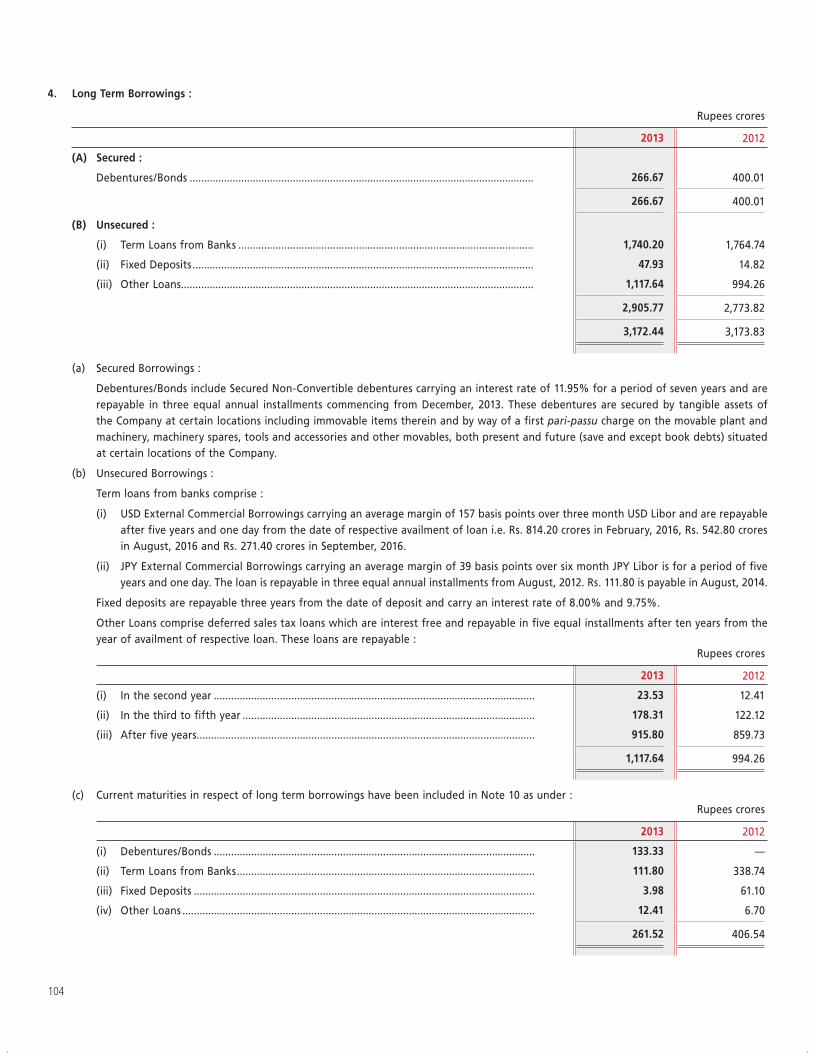
104
4. Long Term Borrowings :
Rupees crores
2013 2012
(A) Secured :
Debentures/Bonds ........................................................................................................................ 266.67 400.01
266.67 400.01
(B) Unsecured :
(i) Term Loans from Banks ....................................................................................................... 1,740.20 1,764.74
(ii) Fixed Deposits ....................................................................................................................... 47.93 14.82
(iii) Other Loans ........................................................................................................................... 1,117.64 994.26
2,905.77 2,773.82
3,172.44 3,173.83
(a) Secured Borrowings :
Debentures/Bonds include Secured Non-Convertible debentures carrying an interest rate of 11.95% for a period of seven years and are repayable in three equal annual installments commencing from December, 2013. These debentures are secured by tangible assets of the Company at certain locations including immovable items therein and by way of a first pari-passu charge on the movable plant and machinery, machinery spares, tools and accessories and other movables, both present and future (save and except book debts) situated at certain locations of the Company.
(b) Unsecured Borrowings :
Term loans from banks comprise :
(i) USD External Commercial Borrowings carrying an average margin of 157 basis points over three month USD Libor and are repayable after five years and one day from the date of respective availment of loan i.e. Rs. 814.20 crores in February, 2016, Rs. 542.80 crores in August, 2016 and Rs. 271.40 crores in September, 2016.
(ii) JPY External Commercial Borrowings carrying an average margin of 39 basis points over six month JPY Libor is for a period of five years and one day. The loan is repayable in three equal annual installments from August, 2012. Rs. 111.80 is payable in August, 2014.
Fixed deposits are repayable three years from the date of deposit and carry an interest rate of 8.00% and 9.75%.
Other Loans comprise deferred sales tax loans which are interest free and repayable in five equal installments after ten years from the year of availment of respective loan. These loans are repayable :
Rupees crores
2013 2012
(i) In the second year ................................................................................................................ 23.53 12.41
(ii) In the third to fifth year ...................................................................................................... 178.31 122.12
(iii) After five years ...................................................................................................................... 915.80 859.73
1,117.64 994.26
(c) Current maturities in respect of long term borrowings have been included in Note 10 as under :Rupees crores
2013 2012
(i) Debentures/Bonds ................................................................................................................ 133.33 —
(ii) Term Loans from Banks ........................................................................................................ 111.80 338.74
(iii) Fixed Deposits ....................................................................................................................... 3.98 61.10
(iv) Other Loans ........................................................................................................................... 12.41 6.70
261.52 406.54
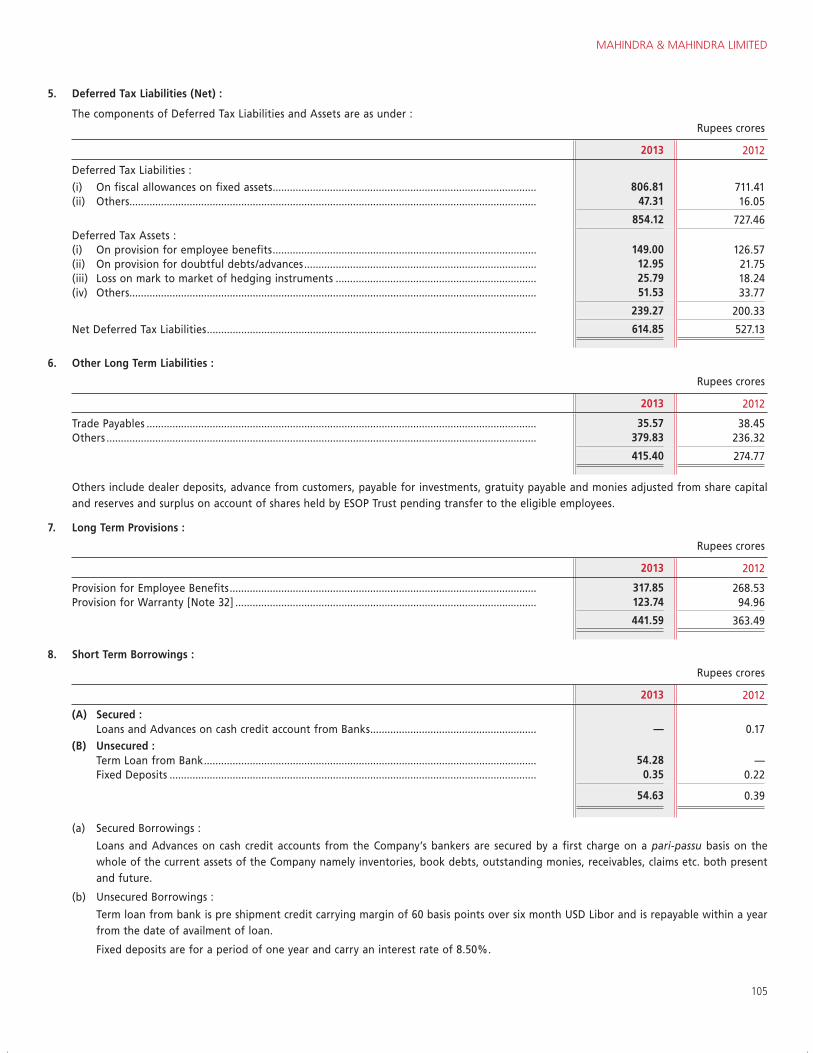
MAHINDRA & MAHINDRA LIMITED
105
5. Deferred Tax Liabilities (Net) :
The components of Deferred Tax Liabilities and Assets are as under :Rupees crores
2013 2012
Deferred Tax Liabilities :
(i) On fiscal allowances on fixed assets ............................................................................................ 806.81 711.41 (ii) Others .............................................................................................................................................. 47.31 16.05
854.12 727.46 Deferred Tax Assets :(i) On provision for employee benefits ............................................................................................ 149.00 126.57 (ii) On provision for doubtful debts/advances ................................................................................. 12.95 21.75 (iii) Loss on mark to market of hedging instruments ...................................................................... 25.79 18.24 (iv) Others .............................................................................................................................................. 51.53 33.77
239.27 200.33
Net Deferred Tax Liabilities ................................................................................................................... 614.85 527.13
6. Other Long Term Liabilities :
Rupees crores
2013 2012
Trade Payables ........................................................................................................................................ 35.57 38.45 Others ...................................................................................................................................................... 379.83 236.32
415.40 274.77
Others include dealer deposits, advance from customers, payable for investments, gratuity payable and monies adjusted from share capital and reserves and surplus on account of shares held by ESOP Trust pending transfer to the eligible employees.
7. Long Term Provisions :
Rupees crores
2013 2012
Provision for Employee Benefits ........................................................................................................... 317.85 268.53 Provision for Warranty [Note 32] ......................................................................................................... 123.74 94.96
441.59 363.49
8. Short Term Borrowings :
Rupees crores
2013 2012
(A) Secured : Loans and Advances on cash credit account from Banks .......................................................... — 0.17 (B) Unsecured : Term Loan from Bank .................................................................................................................... 54.28 — Fixed Deposits ................................................................................................................................ 0.35 0.22
54.63 0.39
(a) Secured Borrowings :
Loans and Advances on cash credit accounts from the Company’s bankers are secured by a first charge on a pari-passu basis on the whole of the current assets of the Company namely inventories, book debts, outstanding monies, receivables, claims etc. both present and future.
(b) Unsecured Borrowings :
Term loan from bank is pre shipment credit carrying margin of 60 basis points over six month USD Libor and is repayable within a year from the date of availment of loan.
Fixed deposits are for a period of one year and carry an interest rate of 8.50%.
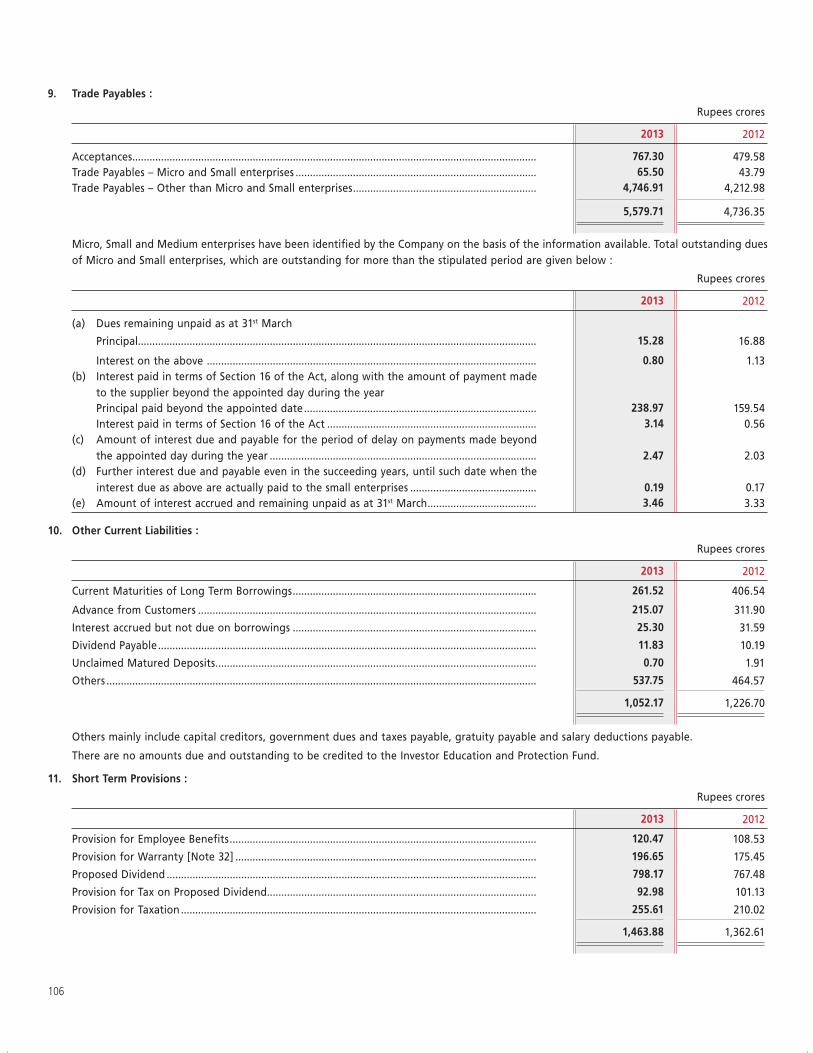
106
9. Trade Payables :
Rupees crores
2013 2012
Acceptances ............................................................................................................................................. 767.30 479.58Trade Payables – Micro and Small enterprises .................................................................................... 65.50 43.79Trade Payables – Other than Micro and Small enterprises ................................................................ 4,746.91 4,212.98
5,579.71 4,736.35
Micro, Small and Medium enterprises have been identified by the Company on the basis of the information available. Total outstanding dues of Micro and Small enterprises, which are outstanding for more than the stipulated period are given below :
Rupees crores
2013 2012
(a) Dues remaining unpaid as at 31st March
Principal........................................................................................................................................... 15.28 16.88
Interest on the above ................................................................................................................... 0.80 1.13 (b) Interest paid in terms of Section 16 of the Act, along with the amount of payment made
to the supplier beyond the appointed day during the year Principal paid beyond the appointed date ................................................................................. 238.97 159.54 Interest paid in terms of Section 16 of the Act ......................................................................... 3.14 0.56 (c) Amount of interest due and payable for the period of delay on payments made beyond
the appointed day during the year ............................................................................................. 2.47 2.03 (d) Further interest due and payable even in the succeeding years, until such date when the
interest due as above are actually paid to the small enterprises ............................................ 0.19 0.17 (e) Amount of interest accrued and remaining unpaid as at 31st March ...................................... 3.46 3.33
10. Other Current Liabilities :
Rupees crores
2013 2012
Current Maturities of Long Term Borrowings ..................................................................................... 261.52 406.54
Advance from Customers ...................................................................................................................... 215.07 311.90
Interest accrued but not due on borrowings ..................................................................................... 25.30 31.59
Dividend Payable .................................................................................................................................... 11.83 10.19
Unclaimed Matured Deposits ................................................................................................................ 0.70 1.91
Others ...................................................................................................................................................... 537.75 464.57
1,052.17 1,226.70
Others mainly include capital creditors, government dues and taxes payable, gratuity payable and salary deductions payable.
There are no amounts due and outstanding to be credited to the Investor Education and Protection Fund.
11. Short Term Provisions :
Rupees crores
2013 2012
Provision for Employee Benefits ........................................................................................................... 120.47 108.53
Provision for Warranty [Note 32] ......................................................................................................... 196.65 175.45
Proposed Dividend ................................................................................................................................. 798.17 767.48
Provision for Tax on Proposed Dividend.............................................................................................. 92.98 101.13
Provision for Taxation ............................................................................................................................ 255.61 210.02
1,463.88 1,362.61
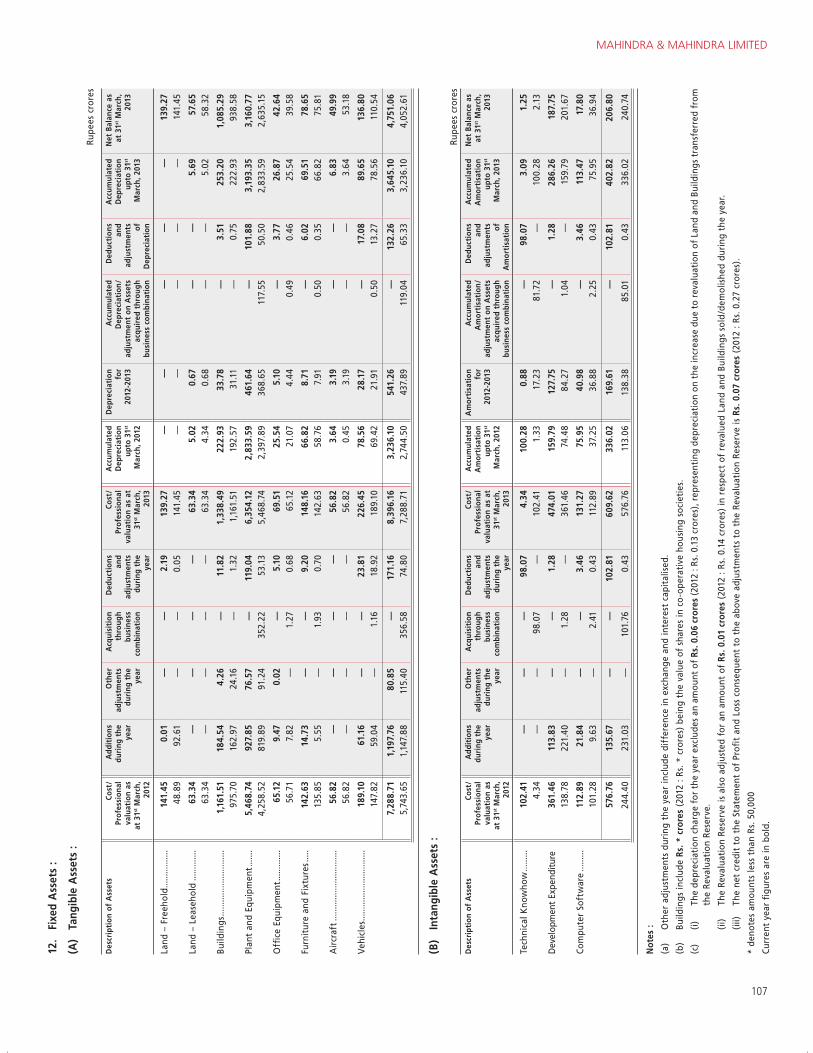
MAHINDRA & MAHINDRA LIMITED
107
12.
Fixe
d A
sset
s :
(A)
Tang
ible
Ass
ets
:Ru
pees
cro
res
Des
crip
tion
of
Ass
ets
Cost
/Pr
ofes
sion
al
valu
atio
n as
at
31st
Mar
ch,
2012
Add
itio
ns
duri
ng t
he
year
Oth
er
adju
stm
ents
du
ring
the
ye
ar
Acq
uisi
tion
th
roug
h bu
sine
ss
com
bina
tion
Ded
ucti
ons
and
adju
stm
ents
du
ring
the
ye
ar
Cost
/ Pr
ofes
sion
al
valu
atio
n as
at
31st M
arch
, 20
13
Acc
umul
ated
D
epre
ciat
ion
upto
31st
M
arch
, 201
2
Dep
reci
atio
n fo
r 20
12-2
013
Acc
umul
ated
D
epre
ciat
ion
/ ad
just
men
t on
Ass
ets
acqu
ired
thr
ough
bu
sine
ss c
ombi
nati
on
Ded
ucti
ons
and
adju
stm
ents
of
D
epre
ciat
ion
Acc
umul
ated
D
epre
ciat
ion
upto
31st
M
arch
, 201
3
Net
Bal
ance
as
at 3
1st M
arch
, 20
13
Land
– F
reeh
old .
......
......
... 1
41.4
5 0
.01
——
2.1
9 1
39.2
7 —
——
——
139
.27
48.
89
92.
61
——
0.0
5 1
41.4
5 —
——
——
141
.45
Land
– L
ease
hold
.....
......
.. 6
3.34
—
——
— 6
3.34
5
.02
0.6
7 —
— 5
.69
57.
65
63.
34
——
——
63.
34
4.3
4 0
.68
——
5.0
2 5
8.32
Build
ings
......
......
......
......
....
1,1
61.5
1 1
84.5
4 4
.26
— 1
1.82
1
,338
.49
222
.93
33.
78
— 3
.51
253
.20
1,0
85.2
9 9
75.7
0 1
62.9
7 2
4.16
—
1.3
2 1
,161
.51
192
.57
31.
11
— 0
.75
222
.93
938
.58
Plan
t an
d Eq
uipm
ent .
......
5,4
68.7
4 9
27.8
5 7
6.57
—
119
.04
6,3
54.1
2 2
,833
.59
461
.64
— 1
01.8
8 3
,193
.35
3,1
60.7
7 4
,258
.52
819
.89
91.
24
352
.22
53.
13
5,4
68.7
4 2
,397
.89
368
.65
117
.55
50.
50
2,8
33.5
9 2
,635
.15
Offi
ce E
quip
men
t ....
......
... 6
5.12
9
.47
0.0
2 —
5.1
0 6
9.51
2
5.54
5
.10
— 3
.77
26.
87
42.
64
56.
71
7.8
2 —
1.2
7 0
.68
65.
12
21.
07
4.4
4 0
.49
0.4
6 2
5.54
3
9.58
Furn
itur
e an
d Fi
xtur
es ..
... 1
42.6
3 1
4.73
—
— 9
.20
148
.16
66.
82
8.7
1 —
6.0
2 6
9.51
7
8.65
1
35.8
5 5
.55
— 1
.93
0.7
0 1
42.6
3 5
8.76
7
.91
0.5
0 0
.35
66.
82
75.
81
Air
craf
t ....
......
......
......
......
.. 5
6.82
—
——
— 5
6.82
3
.64
3.1
9 —
— 6
.83
49.
99
56.
82
——
——
56.
82
0.4
5 3
.19
——
3.6
4 5
3.18
Vehi
cles
......
......
......
......
......
189
.10
61.
16
——
23.
81
226
.45
78.
56
28.
17
— 1
7.08
8
9.65
1
36.8
0 1
47.8
2 5
9.04
—
1.1
6 1
8.92
1
89.1
0 6
9.42
2
1.91
0
.50
13.
27
78.
56
110
.54
7,2
88.7
1 1
,197
.76
80.
85
— 1
71.1
6 8
,396
.16
3,2
36.1
0 5
41.2
6 —
132
.26
3,6
45.1
0 4
,751
.06
5,7
43.6
5 1
,147
.88
115
.40
356
.58
74.
80
7,2
88.7
1 2
,744
.50
437
.89
119
.04
65.
33
3,2
36.1
0 4
,052
.61
(B)
Inta
ngib
le A
sset
s :
Rupe
es c
rore
s
Des
crip
tion
of
Ass
ets
Cost
/Pr
ofes
sion
al
valu
atio
n as
at
31st
Mar
ch,
2012
Add
itio
ns
duri
ng t
he
year
Oth
er
adju
stm
ents
du
ring
the
ye
ar
Acq
uisi
tion
th
roug
h bu
sine
ss
com
bina
tion
Ded
ucti
ons
and
adju
stm
ents
du
ring
the
ye
ar
Cost
/ Pr
ofes
sion
al
valu
atio
n as
at
31st M
arch
, 20
13
Acc
umul
ated
A
mor
tisa
tion
up
to 3
1st
Mar
ch, 2
012
Am
orti
sati
on
for
2012
-201
3
Acc
umul
ated
A
mor
tisa
tion
/ ad
just
men
t on
Ass
ets
acqu
ired
thr
ough
bu
sine
ss c
ombi
nati
on
Ded
ucti
ons
and
adju
stm
ents
of
A
mor
tisa
tion
Acc
umul
ated
A
mor
tisa
tion
up
to 3
1st
Mar
ch, 2
013
Net
Bal
ance
as
at 3
1st M
arch
, 20
13
Tech
nica
l Kno
who
w ...
......
102
.41
——
— 9
8.07
4
.34
100
.28
0.8
8 —
98.
07
3.0
9 1
.25
4.3
4 —
— 9
8.07
—
102
.41
1.3
3 1
7.23
8
1.72
—
100
.28
2.1
3
Dev
elop
men
t Ex
pend
iture
361
.46
113
.83
——
1.2
8 4
74.0
1 1
59.7
9 1
27.7
5 —
1.2
8 2
86.2
6 1
87.7
5 1
38.7
8 2
21.4
0 —
1.2
8 —
361
.46
74.
48
84.
27
1.0
4 —
159
.79
201
.67
Com
pute
r So
ftw
are
......
... 1
12.8
9 2
1.84
—
— 3
.46
131
.27
75.
95
40.
98
— 3
.46
113
.47
17.
80
101
.28
9.6
3 —
2.4
1 0
.43
112
.89
37.
25
36.
88
2.2
5 0
.43
75.
95
36.
94
576
.76
135
.67
——
102
.81
609
.62
336
.02
169
.61
— 1
02.8
1 4
02.8
2 2
06.8
0
244
.40
231
.03
— 1
01.7
6 0
.43
576
.76
113
.06
138
.38
85.
01
0.4
3 3
36.0
2 2
40.7
4
Not
es :
(a)
Oth
er a
djus
tmen
ts d
urin
g th
e ye
ar in
clud
e di
ffer
ence
in e
xcha
nge
and
inte
rest
cap
ital
ised
.
(b)
Build
ings
incl
ude
Rs. *
cro
res
(201
2 : R
s. *
cro
res)
bei
ng t
he v
alue
of
shar
es in
co
-ope
rati
ve h
ousi
ng s
ocie
ties
.
(c)
(i)
The
depr
ecia
tion
cha
rge
for
the
year
exc
lude
s an
am
ount
of
Rs. 0
.06
cror
es (
2012
: Rs
. 0.1
3 cr
ores
), r
epre
sent
ing
depr
ecia
tion
on
the
incr
ease
due
to
reva
luat
ion
of L
and
and
Build
ings
tra
nsfe
rred
fro
m
the
Reva
luat
ion
Rese
rve.
(ii
) Th
e Re
valu
atio
n Re
serv
e is
als
o ad
just
ed f
or a
n am
ount
of
Rs. 0
.01
cror
es (
2012
: Rs
. 0.1
4 cr
ores
) in
res
pect
of
reva
lued
Lan
d an
d Bu
ildin
gs s
old
/dem
olis
hed
duri
ng t
he y
ear.
(ii
i) Th
e ne
t cr
edit
to
the
Stat
emen
t of
Pro
fit
and
Loss
con
sequ
ent
to t
he a
bove
adj
ustm
ents
to
the
Reva
luat
ion
Rese
rve
is R
s. 0
.07
cror
es (
2012
: Rs
. 0.2
7 cr
ores
).
* de
note
s am
ount
s le
ss t
han
Rs. 5
0,00
0
Curr
ent
year
figu
res
are
in b
old.
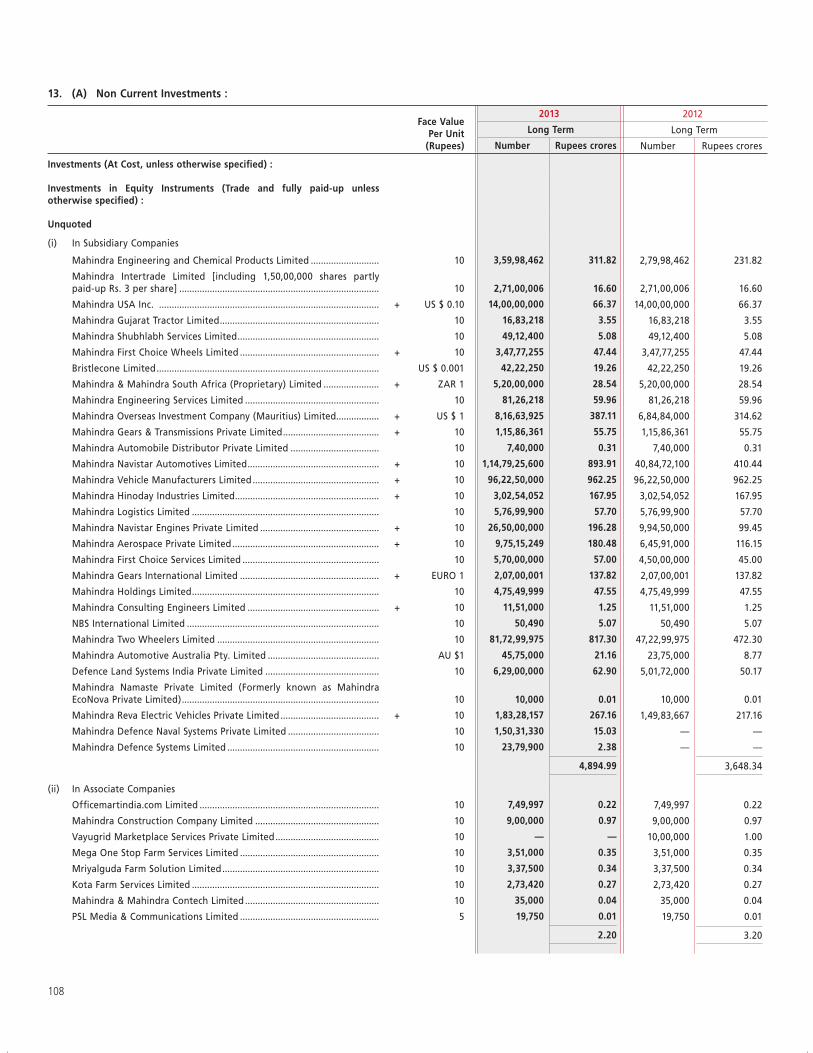
108
13. (A) Non Current Investments : (contd.)
Face Value Per Unit
(Rupees)
2013 2012
Long Term Long Term
Number Rupees crores Number Rupees crores
Investments (At Cost, unless otherwise specified) :
Investments in Equity Instruments (Trade and fully paid-up unless otherwise specified) :
Unquoted
(i) In Subsidiary Companies
Mahindra Engineering and Chemical Products Limited ........................... 10 3,59,98,462 311.82 2,79,98,462 231.82
Mahindra Intertrade Limited [including 1,50,00,000 shares partly paid-up Rs. 3 per share] ............................................................................... 10 2,71,00,006 16.60 2,71,00,006 16.60
Mahindra USA Inc. ....................................................................................... + US $ 0.10 14,00,00,000 66.37 14,00,00,000 66.37
Mahindra Gujarat Tractor Limited ............................................................... 10 16,83,218 3.55 16,83,218 3.55
Mahindra Shubhlabh Services Limited ........................................................ 10 49,12,400 5.08 49,12,400 5.08
Mahindra First Choice Wheels Limited ....................................................... + 10 3,47,77,255 47.44 3,47,77,255 47.44
Bristlecone Limited ........................................................................................ US $ 0.001 42,22,250 19.26 42,22,250 19.26
Mahindra & Mahindra South Africa (Proprietary) Limited ...................... + ZAR 1 5,20,00,000 28.54 5,20,00,000 28.54
Mahindra Engineering Services Limited ..................................................... 10 81,26,218 59.96 81,26,218 59.96
Mahindra Overseas Investment Company (Mauritius) Limited ................. + US $ 1 8,16,63,925 387.11 6,84,84,000 314.62
Mahindra Gears & Transmissions Private Limited ...................................... + 10 1,15,86,361 55.75 1,15,86,361 55.75
Mahindra Automobile Distributor Private Limited ................................... 10 7,40,000 0.31 7,40,000 0.31
Mahindra Navistar Automotives Limited .................................................... + 10 1,14,79,25,600 893.91 40,84,72,100 410.44
Mahindra Vehicle Manufacturers Limited .................................................. + 10 96,22,50,000 962.25 96,22,50,000 962.25
Mahindra Hinoday Industries Limited ......................................................... + 10 3,02,54,052 167.95 3,02,54,052 167.95
Mahindra Logistics Limited .......................................................................... 10 5,76,99,900 57.70 5,76,99,900 57.70
Mahindra Navistar Engines Private Limited ............................................... + 10 26,50,00,000 196.28 9,94,50,000 99.45
Mahindra Aerospace Private Limited .......................................................... + 10 9,75,15,249 180.48 6,45,91,000 116.15
Mahindra First Choice Services Limited ...................................................... 10 5,70,00,000 57.00 4,50,00,000 45.00
Mahindra Gears International Limited ....................................................... + EURO 1 2,07,00,001 137.82 2,07,00,001 137.82
Mahindra Holdings Limited .......................................................................... 10 4,75,49,999 47.55 4,75,49,999 47.55
Mahindra Consulting Engineers Limited .................................................... + 10 11,51,000 1.25 11,51,000 1.25
NBS International Limited ............................................................................ 10 50,490 5.07 50,490 5.07
Mahindra Two Wheelers Limited ................................................................ 10 81,72,99,975 817.30 47,22,99,975 472.30
Mahindra Automotive Australia Pty. Limited ............................................ AU $1 45,75,000 21.16 23,75,000 8.77
Defence Land Systems India Private Limited ............................................. 10 6,29,00,000 62.90 5,01,72,000 50.17
Mahindra Namaste Private Limited (Formerly known as Mahindra EcoNova Private Limited) .............................................................................. 10 10,000 0.01 10,000 0.01
Mahindra Reva Electric Vehicles Private Limited ....................................... + 10 1,83,28,157 267.16 1,49,83,667 217.16
Mahindra Defence Naval Systems Private Limited .................................... 10 1,50,31,330 15.03 — —
Mahindra Defence Systems Limited ............................................................ 10 23,79,900 2.38 — —
4,894.99 3,648.34
(ii) In Associate Companies
Officemartindia.com Limited ....................................................................... 10 7,49,997 0.22 7,49,997 0.22
Mahindra Construction Company Limited ................................................. 10 9,00,000 0.97 9,00,000 0.97
Vayugrid Marketplace Services Private Limited ......................................... 10 — — 10,00,000 1.00
Mega One Stop Farm Services Limited ....................................................... 10 3,51,000 0.35 3,51,000 0.35
Mriyalguda Farm Solution Limited .............................................................. 10 3,37,500 0.34 3,37,500 0.34
Kota Farm Services Limited .......................................................................... 10 2,73,420 0.27 2,73,420 0.27
Mahindra & Mahindra Contech Limited ..................................................... 10 35,000 0.04 35,000 0.04
PSL Media & Communications Limited ....................................................... 5 19,750 0.01 19,750 0.01
2.20 3.20
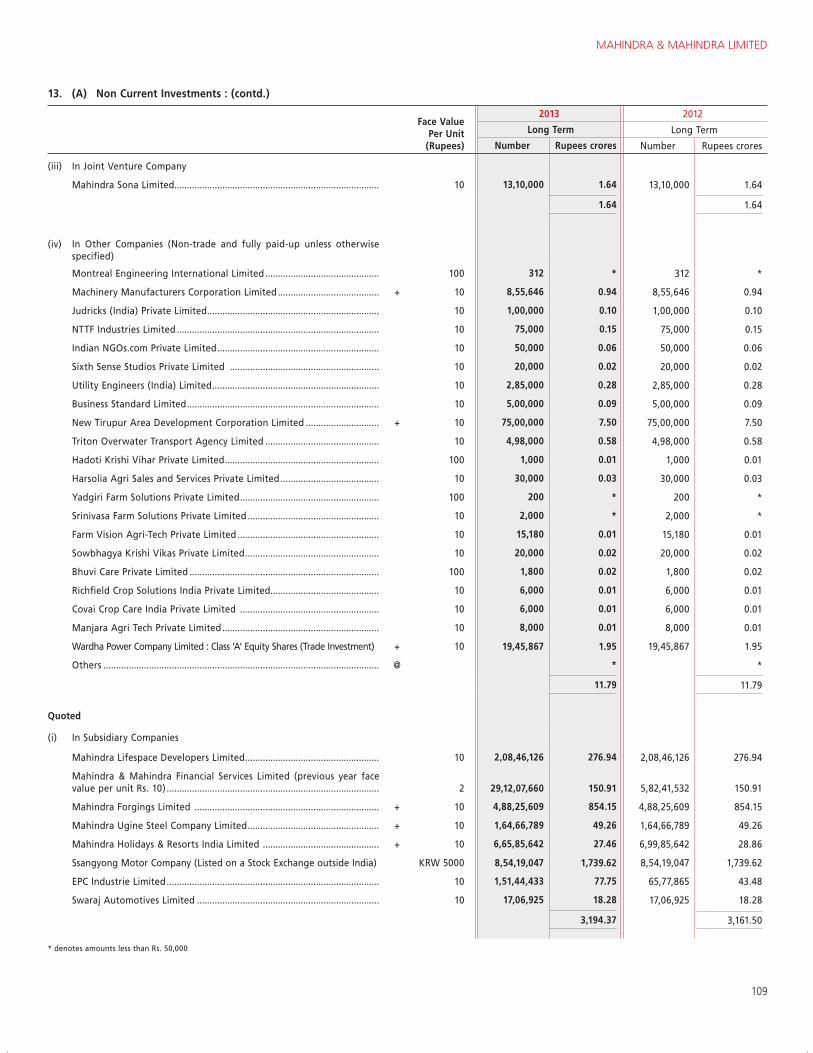
MAHINDRA & MAHINDRA LIMITED
109
13. (A) Non Current Investments : (contd.)
Face Value Per Unit
(Rupees)
2013 2012
Long Term Long Term
Number Rupees crores Number Rupees crores
(iii) In Joint Venture Company
Mahindra Sona Limited................................................................................. 10 13,10,000 1.64 13,10,000 1.64
1.64 1.64
(iv) In Other Companies (Non-trade and fully paid-up unless otherwise specified)
Montreal Engineering International Limited ............................................. 100 312 * 312 *
Machinery Manufacturers Corporation Limited ........................................ + 10 8,55,646 0.94 8,55,646 0.94
Judricks (India) Private Limited .................................................................... 10 1,00,000 0.10 1,00,000 0.10
NTTF Industries Limited ................................................................................ 10 75,000 0.15 75,000 0.15
Indian NGOs.com Private Limited ................................................................ 10 50,000 0.06 50,000 0.06
Sixth Sense Studios Private Limited ........................................................... 10 20,000 0.02 20,000 0.02
Utility Engineers (India) Limited .................................................................. 10 2,85,000 0.28 2,85,000 0.28
Business Standard Limited ............................................................................ 10 5,00,000 0.09 5,00,000 0.09
New Tirupur Area Development Corporation Limited ............................. + 10 75,00,000 7.50 75,00,000 7.50
Triton Overwater Transport Agency Limited ............................................. 10 4,98,000 0.58 4,98,000 0.58
Hadoti Krishi Vihar Private Limited ............................................................. 100 1,000 0.01 1,000 0.01
Harsolia Agri Sales and Services Private Limited ....................................... 10 30,000 0.03 30,000 0.03
Yadgiri Farm Solutions Private Limited ....................................................... 100 200 * 200 *
Srinivasa Farm Solutions Private Limited .................................................... 10 2,000 * 2,000 *
Farm Vision Agri-Tech Private Limited ........................................................ 10 15,180 0.01 15,180 0.01
Sowbhagya Krishi Vikas Private Limited ..................................................... 10 20,000 0.02 20,000 0.02
Bhuvi Care Private Limited ........................................................................... 100 1,800 0.02 1,800 0.02
Richfield Crop Solutions India Private Limited........................................... 10 6,000 0.01 6,000 0.01
Covai Crop Care India Private Limited ....................................................... 10 6,000 0.01 6,000 0.01
Manjara Agri Tech Private Limited .............................................................. 10 8,000 0.01 8,000 0.01
Wardha Power Company Limited : Class ‘A’ Equity Shares (Trade Investment) + 10 19,45,867 1.95 19,45,867 1.95
Others ............................................................................................................. @ * *
11.79 11.79
Quoted
(i) In Subsidiary Companies
Mahindra Lifespace Developers Limited ..................................................... 10 2,08,46,126 276.94 2,08,46,126 276.94
Mahindra & Mahindra Financial Services Limited (previous year face value per unit Rs. 10) .................................................................................... 2 29,12,07,660 150.91 5,82,41,532 150.91
Mahindra Forgings Limited ......................................................................... + 10 4,88,25,609 854.15 4,88,25,609 854.15
Mahindra Ugine Steel Company Limited .................................................... + 10 1,64,66,789 49.26 1,64,66,789 49.26
Mahindra Holidays & Resorts India Limited .............................................. + 10 6,65,85,642 27.46 6,99,85,642 28.86
Ssangyong Motor Company (Listed on a Stock Exchange outside India) KRW 5000 8,54,19,047 1,739.62 8,54,19,047 1,739.62
EPC Industrie Limited .................................................................................... 10 1,51,44,433 77.75 65,77,865 43.48
Swaraj Automotives Limited ........................................................................ 10 17,06,925 18.28 17,06,925 18.28
3,194.37 3,161.50
* denotes amounts less than Rs. 50,000
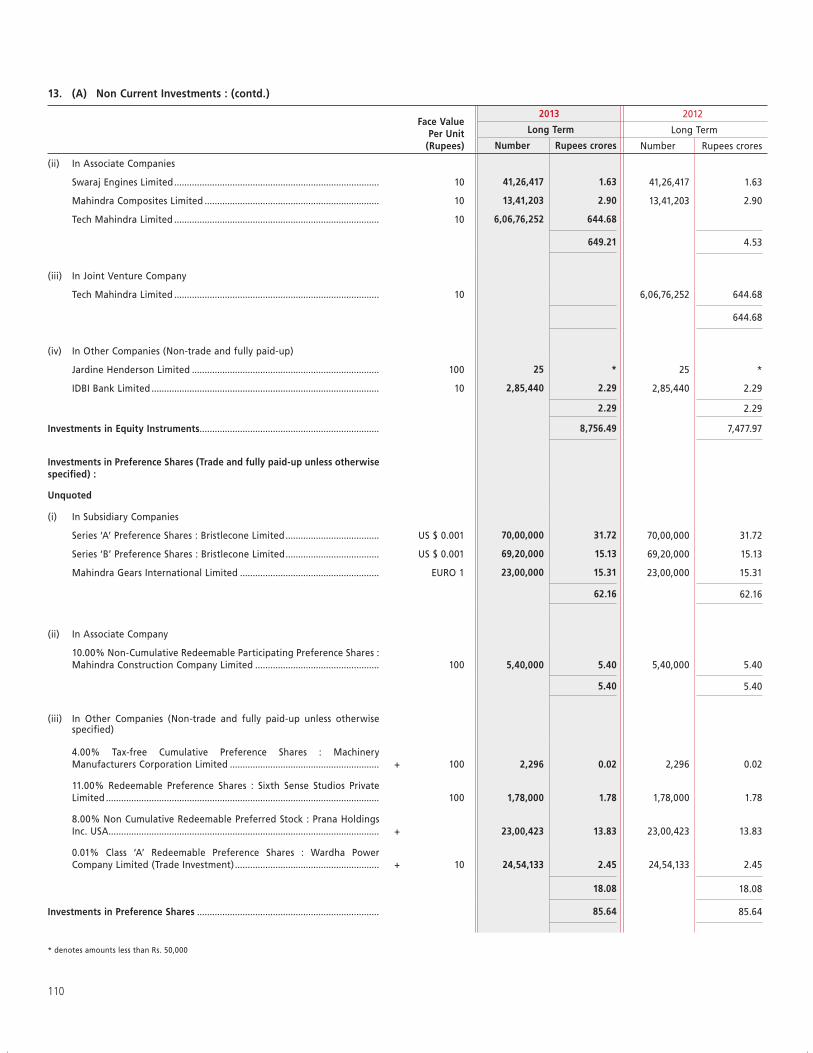
110
13. (A) Non Current Investments : (contd.)
Face Value Per Unit
(Rupees)
2013 2012
Long Term Long Term
Number Rupees crores Number Rupees crores
(ii) In Associate Companies
Swaraj Engines Limited ................................................................................. 10 41,26,417 1.63 41,26,417 1.63
Mahindra Composites Limited ..................................................................... 10 13,41,203 2.90 13,41,203 2.90
Tech Mahindra Limited ................................................................................. 10 6,06,76,252 644.68
649.21 4.53
(iii) In Joint Venture Company
Tech Mahindra Limited ................................................................................. 10 6,06,76,252 644.68
644.68
(iv) In Other Companies (Non-trade and fully paid-up)
Jardine Henderson Limited .......................................................................... 100 25 * 25 *
IDBI Bank Limited .......................................................................................... 10 2,85,440 2.29 2,85,440 2.29
2.29 2.29
Investments in Equity Instruments ....................................................................... 8,756.49 7,477.97
Investments in Preference Shares (Trade and fully paid-up unless otherwise specified) :
Unquoted
(i) In Subsidiary Companies
Series ‘A’ Preference Shares : Bristlecone Limited ..................................... US $ 0.001 70,00,000 31.72 70,00,000 31.72
Series ‘B’ Preference Shares : Bristlecone Limited ..................................... US $ 0.001 69,20,000 15.13 69,20,000 15.13
Mahindra Gears International Limited ....................................................... EURO 1 23,00,000 15.31 23,00,000 15.31
62.16 62.16
(ii) In Associate Company
10.00% Non-Cumulative Redeemable Participating Preference Shares : Mahindra Construction Company Limited ................................................. 100 5,40,000 5.40 5,40,000 5.40
5.40 5.40
(iii) In Other Companies (Non-trade and fully paid-up unless otherwise specified)
4.00% Tax-free Cumulative Preference Shares : Machinery Manufacturers Corporation Limited ........................................................... + 100 2,296 0.02 2,296 0.02
11.00% Redeemable Preference Shares : Sixth Sense Studios Private Limited ............................................................................................................ 100 1,78,000 1.78 1,78,000 1.78
8.00% Non Cumulative Redeemable Preferred Stock : Prana Holdings Inc. USA ........................................................................................................... + 23,00,423 13.83 23,00,423 13.83
0.01% Class ‘A’ Redeemable Preference Shares : Wardha Power Company Limited (Trade Investment) ......................................................... + 10 24,54,133 2.45 24,54,133 2.45
18.08 18.08
Investments in Preference Shares ........................................................................ 85.64 85.64
* denotes amounts less than Rs. 50,000
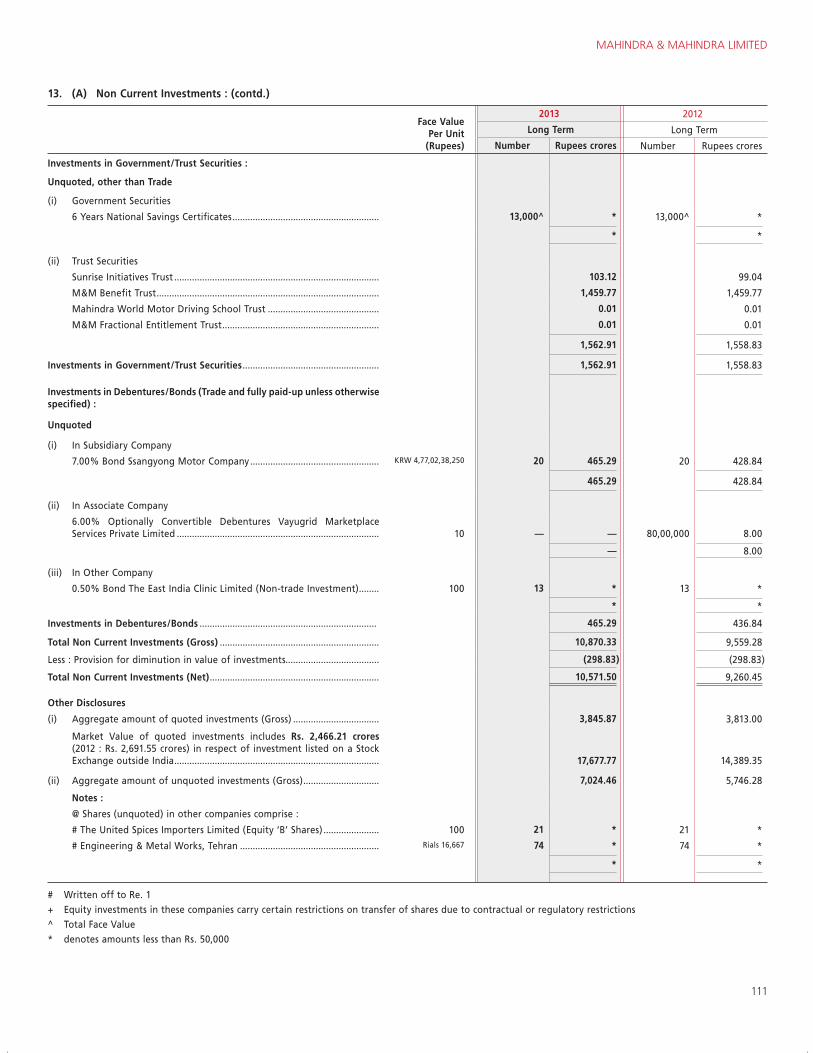
MAHINDRA & MAHINDRA LIMITED
111
13. (A) Non Current Investments : (contd.)
Face Value Per Unit
(Rupees)
2013 2012
Long Term Long Term
Number Rupees crores Number Rupees crores
Investments in Government/Trust Securities :
Unquoted, other than Trade
(i) Government Securities
6 Years National Savings Certificates .......................................................... 13,000^ * 13,000^ *
* *
(ii) Trust Securities
Sunrise Initiatives Trust ................................................................................. 103.12 99.04
M&M Benefit Trust ........................................................................................ 1,459.77 1,459.77
Mahindra World Motor Driving School Trust ............................................ 0.01 0.01
M&M Fractional Entitlement Trust .............................................................. 0.01 0.01
1,562.91 1,558.83
Investments in Government/Trust Securities ...................................................... 1,562.91 1,558.83
Investments in Debentures/Bonds (Trade and fully paid-up unless otherwise specified) :
Unquoted
(i) In Subsidiary Company
7.00% Bond Ssangyong Motor Company ................................................... KRW 4,77,02,38,250 20 465.29 20 428.84
465.29 428.84
(ii) In Associate Company
6.00% Optionally Convertible Debentures Vayugrid Marketplace Services Private Limited ................................................................................ 10 — — 80,00,000 8.00
— 8.00
(iii) In Other Company
0.50% Bond The East India Clinic Limited (Non-trade Investment) ........ 100 13 * 13 *
* *
Investments in Debentures/Bonds ...................................................................... 465.29 436.84
Total Non Current Investments (Gross) ............................................................... 10,870.33 9,559.28
Less : Provision for diminution in value of investments..................................... (298.83) (298.83)
Total Non Current Investments (Net) ................................................................... 10,571.50 9,260.45
Other Disclosures
(i) Aggregate amount of quoted investments (Gross) .................................. 3,845.87 3,813.00
Market Value of quoted investments includes Rs. 2,466.21 crores (2012 : Rs. 2,691.55 crores) in respect of investment listed on a Stock Exchange outside India ................................................................................. 17,677.77 14,389.35
(ii) Aggregate amount of unquoted investments (Gross) .............................. 7,024.46 5,746.28
Notes :
@ Shares (unquoted) in other companies comprise :
# The United Spices Importers Limited (Equity ‘B’ Shares) ...................... 100 21 * 21 *
# Engineering & Metal Works, Tehran ....................................................... Rials 16,667 74 * 74 *
* *
# Written off to Re. 1+ Equity investments in these companies carry certain restrictions on transfer of shares due to contractual or regulatory restrictions^ Total Face Value* denotes amounts less than Rs. 50,000
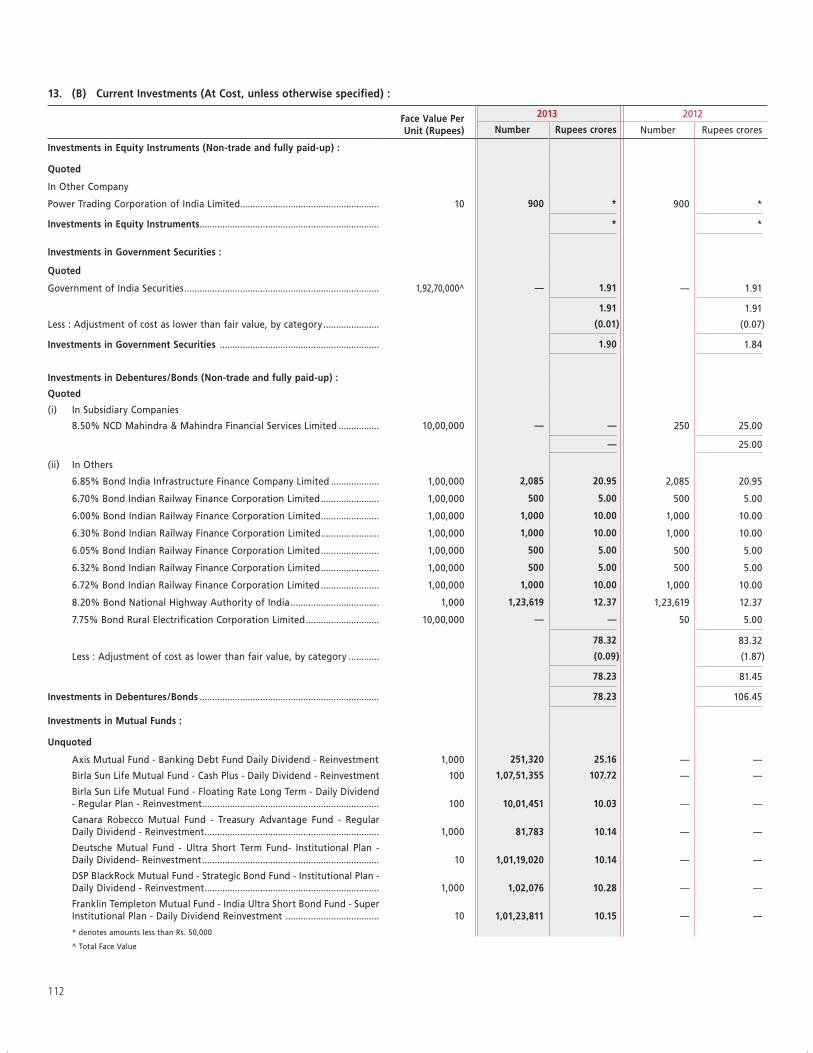
112
13. (B) Current Investments (At Cost, unless otherwise specified) : (contd.)
Face Value Per Unit (Rupees)
2013 2012
Number Rupees crores Number Rupees crores
Investments in Equity Instruments (Non-trade and fully paid-up) :
Quoted
In Other Company
Power Trading Corporation of India Limited....................................................... 10 900 * 900 *
Investments in Equity Instruments ....................................................................... * *
Investments in Government Securities :
Quoted
Government of India Securities ............................................................................. 1,92,70,000^ — 1.91 — 1.91
1.91 1.91
Less : Adjustment of cost as lower than fair value, by category ...................... (0.01) (0.07)
Investments in Government Securities ............................................................... 1.90 1.84
Investments in Debentures/Bonds (Non-trade and fully paid-up) :
Quoted
(i) In Subsidiary Companies
8.50% NCD Mahindra & Mahindra Financial Services Limited ................ 10,00,000 — — 250 25.00
— 25.00
(ii) In Others
6.85% Bond India Infrastructure Finance Company Limited ................... 1,00,000 2,085 20.95 2,085 20.95
6.70% Bond Indian Railway Finance Corporation Limited ....................... 1,00,000 500 5.00 500 5.00
6.00% Bond Indian Railway Finance Corporation Limited ....................... 1,00,000 1,000 10.00 1,000 10.00
6.30% Bond Indian Railway Finance Corporation Limited ....................... 1,00,000 1,000 10.00 1,000 10.00
6.05% Bond Indian Railway Finance Corporation Limited ....................... 1,00,000 500 5.00 500 5.00
6.32% Bond Indian Railway Finance Corporation Limited ....................... 1,00,000 500 5.00 500 5.00
6.72% Bond Indian Railway Finance Corporation Limited ....................... 1,00,000 1,000 10.00 1,000 10.00
8.20% Bond National Highway Authority of India ................................... 1,000 1,23,619 12.37 1,23,619 12.37
7.75% Bond Rural Electrification Corporation Limited ............................. 10,00,000 — — 50 5.00
78.32 83.32
Less : Adjustment of cost as lower than fair value, by category ............ (0.09) (1.87)
78.23 81.45
Investments in Debentures/Bonds ....................................................................... 78.23 106.45
Investments in Mutual Funds :
Unquoted
Axis Mutual Fund - Banking Debt Fund Daily Dividend - Reinvestment 1,000 251,320 25.16 — —
Birla Sun Life Mutual Fund - Cash Plus - Daily Dividend - Reinvestment 100 1,07,51,355 107.72 — —
Birla Sun Life Mutual Fund - Floating Rate Long Term - Daily Dividend - Regular Plan - Reinvestment ...................................................................... 100 10,01,451 10.03 — —
Canara Robecco Mutual Fund - Treasury Advantage Fund - Regular Daily Dividend - Reinvestment ..................................................................... 1,000 81,783 10.14 — —
Deutsche Mutual Fund - Ultra Short Term Fund- Institutional Plan - Daily Dividend- Reinvestment ...................................................................... 10 1,01,19,020 10.14 — —
DSP BlackRock Mutual Fund - Strategic Bond Fund - Institutional Plan - Daily Dividend - Reinvestment ..................................................................... 1,000 1,02,076 10.28 — —
Franklin Templeton Mutual Fund - India Ultra Short Bond Fund - Super Institutional Plan - Daily Dividend Reinvestment ..................................... 10 1,01,23,811 10.15 — —
* denotes amounts less than Rs. 50,000
^ Total Face Value
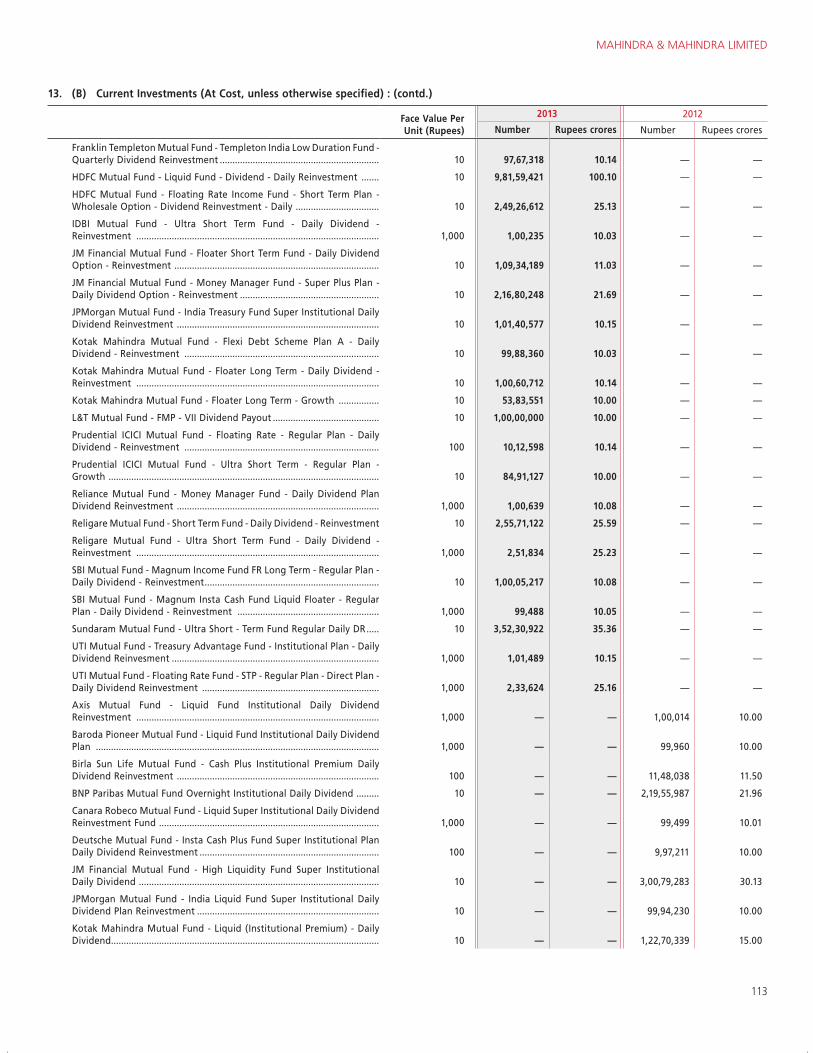
MAHINDRA & MAHINDRA LIMITED
113
13. (B) Current Investments (At Cost, unless otherwise specified) : (contd.)
Face Value Per Unit (Rupees)
2013 2012
Number Rupees crores Number Rupees crores
Franklin Templeton Mutual Fund - Templeton India Low Duration Fund - Quarterly Dividend Reinvestment ............................................................... 10 97,67,318 10.14 — —
HDFC Mutual Fund - Liquid Fund - Dividend - Daily Reinvestment ....... 10 9,81,59,421 100.10 — —
HDFC Mutual Fund - Floating Rate Income Fund - Short Term Plan - Wholesale Option - Dividend Reinvestment - Daily ................................. 10 2,49,26,612 25.13 — —
IDBI Mutual Fund - Ultra Short Term Fund - Daily Dividend - Reinvestment ................................................................................................ 1,000 1,00,235 10.03 — —
JM Financial Mutual Fund - Floater Short Term Fund - Daily Dividend Option - Reinvestment ................................................................................. 10 1,09,34,189 11.03 — —
JM Financial Mutual Fund - Money Manager Fund - Super Plus Plan - Daily Dividend Option - Reinvestment ....................................................... 10 2,16,80,248 21.69 — —
JPMorgan Mutual Fund - India Treasury Fund Super Institutional Daily Dividend Reinvestment ................................................................................ 10 1,01,40,577 10.15 — —
Kotak Mahindra Mutual Fund - Flexi Debt Scheme Plan A - Daily Dividend - Reinvestment ............................................................................. 10 99,88,360 10.03 — —
Kotak Mahindra Mutual Fund - Floater Long Term - Daily Dividend - Reinvestment ................................................................................................ 10 1,00,60,712 10.14 — —
Kotak Mahindra Mutual Fund - Floater Long Term - Growth ................ 10 53,83,551 10.00 — —
L&T Mutual Fund - FMP - VII Dividend Payout .......................................... 10 1,00,00,000 10.00 — —
Prudential ICICI Mutual Fund - Floating Rate - Regular Plan - Daily Dividend - Reinvestment ............................................................................. 100 10,12,598 10.14 — —
Prudential ICICI Mutual Fund - Ultra Short Term - Regular Plan - Growth ........................................................................................................... 10 84,91,127 10.00 — —
Reliance Mutual Fund - Money Manager Fund - Daily Dividend Plan Dividend Reinvestment ................................................................................ 1,000 1,00,639 10.08 — —
Religare Mutual Fund - Short Term Fund - Daily Dividend - Reinvestment 10 2,55,71,122 25.59 — —
Religare Mutual Fund - Ultra Short Term Fund - Daily Dividend - Reinvestment ................................................................................................ 1,000 2,51,834 25.23 — —
SBI Mutual Fund - Magnum Income Fund FR Long Term - Regular Plan - Daily Dividend - Reinvestment ..................................................................... 10 1,00,05,217 10.08 — —
SBI Mutual Fund - Magnum Insta Cash Fund Liquid Floater - Regular Plan - Daily Dividend - Reinvestment ........................................................ 1,000 99,488 10.05 — —
Sundaram Mutual Fund - Ultra Short - Term Fund Regular Daily DR ..... 10 3,52,30,922 35.36 — —
UTI Mutual Fund - Treasury Advantage Fund - Institutional Plan - Daily Dividend Reinvesment .................................................................................. 1,000 1,01,489 10.15 — —
UTI Mutual Fund - Floating Rate Fund - STP - Regular Plan - Direct Plan - Daily Dividend Reinvestment ...................................................................... 1,000 2,33,624 25.16 — —
Axis Mutual Fund - Liquid Fund Institutional Daily Dividend Reinvestment ................................................................................................ 1,000 — — 1,00,014 10.00
Baroda Pioneer Mutual Fund - Liquid Fund Institutional Daily Dividend Plan ................................................................................................................ 1,000 — — 99,960 10.00
Birla Sun Life Mutual Fund - Cash Plus Institutional Premium Daily Dividend Reinvestment ................................................................................ 100 — — 11,48,038 11.50
BNP Paribas Mutual Fund Overnight Institutional Daily Dividend ......... 10 — — 2,19,55,987 21.96
Canara Robeco Mutual Fund - Liquid Super Institutional Daily Dividend Reinvestment Fund ....................................................................................... 1,000 — — 99,499 10.01
Deutsche Mutual Fund - Insta Cash Plus Fund Super Institutional Plan Daily Dividend Reinvestment ....................................................................... 100 — — 9,97,211 10.00
JM Financial Mutual Fund - High Liquidity Fund Super Institutional Daily Dividend ............................................................................................... 10 — — 3,00,79,283 30.13
JPMorgan Mutual Fund - India Liquid Fund Super Institutional Daily Dividend Plan Reinvestment ........................................................................ 10 — — 99,94,230 10.00
Kotak Mahindra Mutual Fund - Liquid (Institutional Premium) - Daily Dividend .......................................................................................................... 10 — — 1,22,70,339 15.00
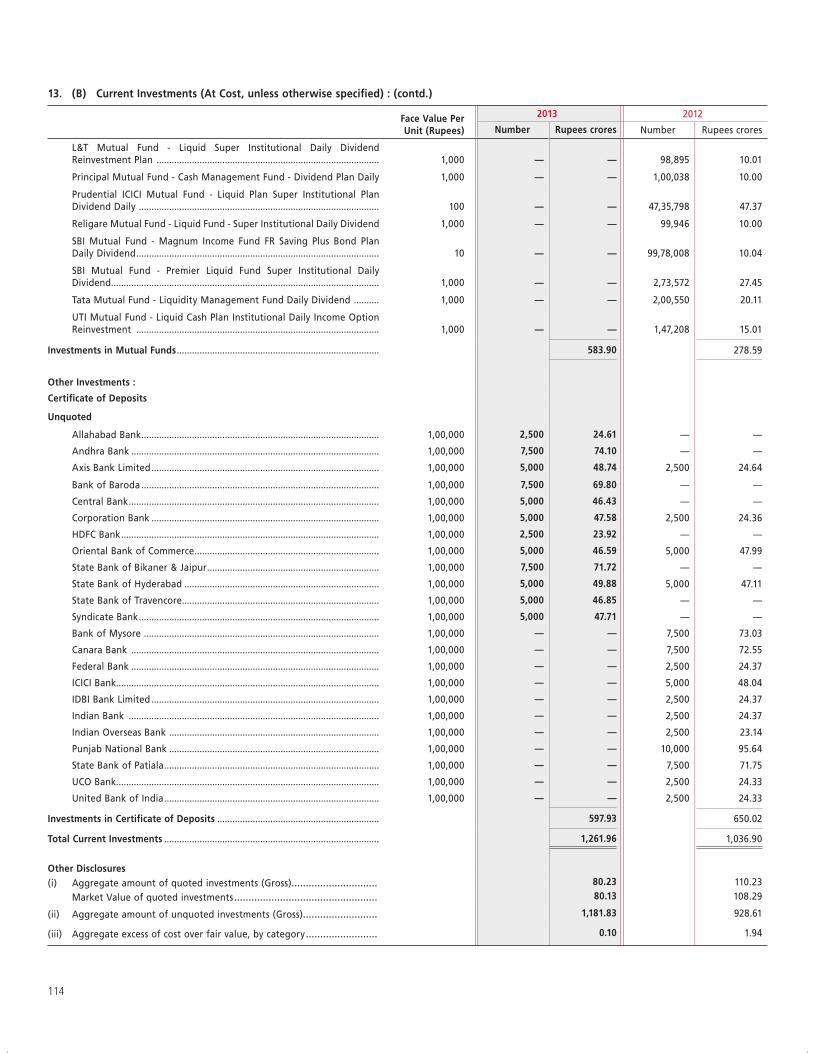
114
13. (B) Current Investments (At Cost, unless otherwise specified) : (contd.)
Face Value Per Unit (Rupees)
2013 2012
Number Rupees crores Number Rupees crores
L&T Mutual Fund - Liquid Super Institutional Daily Dividend Reinvestment Plan ........................................................................................ 1,000 — — 98,895 10.01
Principal Mutual Fund - Cash Management Fund - Dividend Plan Daily 1,000 — — 1,00,038 10.00
Prudential ICICI Mutual Fund - Liquid Plan Super Institutional Plan Dividend Daily ............................................................................................... 100 — — 47,35,798 47.37
Religare Mutual Fund - Liquid Fund - Super Institutional Daily Dividend 1,000 — — 99,946 10.00
SBI Mutual Fund - Magnum Income Fund FR Saving Plus Bond Plan Daily Dividend ................................................................................................ 10 — — 99,78,008 10.04
SBI Mutual Fund - Premier Liquid Fund Super Institutional Daily Dividend .......................................................................................................... 1,000 — — 2,73,572 27.45
Tata Mutual Fund - Liquidity Management Fund Daily Dividend .......... 1,000 — — 2,00,550 20.11
UTI Mutual Fund - Liquid Cash Plan Institutional Daily Income Option Reinvestment ................................................................................................ 1,000 — — 1,47,208 15.01
Investments in Mutual Funds ................................................................................ 583.90 278.59
Other Investments :
Certificate of Deposits
Unquoted
Allahabad Bank .............................................................................................. 1,00,000 2,500 24.61 — —
Andhra Bank .................................................................................................. 1,00,000 7,500 74.10 — —
Axis Bank Limited .......................................................................................... 1,00,000 5,000 48.74 2,500 24.64
Bank of Baroda .............................................................................................. 1,00,000 7,500 69.80 — —
Central Bank ................................................................................................... 1,00,000 5,000 46.43 — —
Corporation Bank .......................................................................................... 1,00,000 5,000 47.58 2,500 24.36
HDFC Bank ...................................................................................................... 1,00,000 2,500 23.92 — —
Oriental Bank of Commerce ......................................................................... 1,00,000 5,000 46.59 5,000 47.99
State Bank of Bikaner & Jaipur .................................................................... 1,00,000 7,500 71.72 — —
State Bank of Hyderabad ............................................................................. 1,00,000 5,000 49.88 5,000 47.11
State Bank of Travencore .............................................................................. 1,00,000 5,000 46.85 — —
Syndicate Bank ............................................................................................... 1,00,000 5,000 47.71 — —
Bank of Mysore ............................................................................................. 1,00,000 — — 7,500 73.03
Canara Bank .................................................................................................. 1,00,000 — — 7,500 72.55
Federal Bank .................................................................................................. 1,00,000 — — 2,500 24.37
ICICI Bank........................................................................................................ 1,00,000 — — 5,000 48.04
IDBI Bank Limited .......................................................................................... 1,00,000 — — 2,500 24.37
Indian Bank ................................................................................................... 1,00,000 — — 2,500 24.37
Indian Overseas Bank ................................................................................... 1,00,000 — — 2,500 23.14
Punjab National Bank ................................................................................... 1,00,000 — — 10,000 95.64
State Bank of Patiala ..................................................................................... 1,00,000 — — 7,500 71.75
UCO Bank........................................................................................................ 1,00,000 — — 2,500 24.33
United Bank of India ..................................................................................... 1,00,000 — — 2,500 24.33
Investments in Certificate of Deposits ................................................................ 597.93 650.02
Total Current Investments ..................................................................................... 1,261.96 1,036.90
Other Disclosures(i) Aggregate amount of quoted investments (Gross) .............................. 80.23 110.23
Market Value of quoted investments .................................................. 80.13 108.29
(ii) Aggregate amount of unquoted investments (Gross) .......................... 1,181.83 928.61
(iii) Aggregate excess of cost over fair value, by category ......................... 0.10 1.94
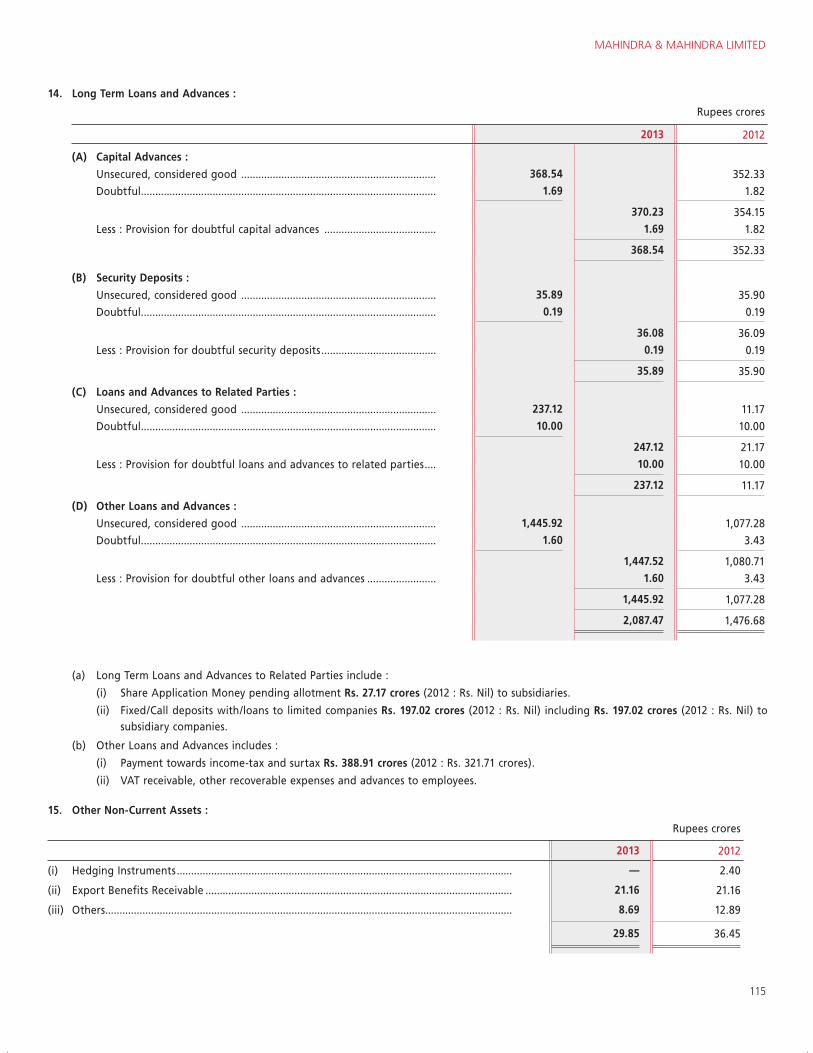
MAHINDRA & MAHINDRA LIMITED
115
14. Long Term Loans and Advances :
Rupees crores
2013 2012
(A) Capital Advances :
Unsecured, considered good .................................................................... 368.54 352.33
Doubtful ....................................................................................................... 1.69 1.82
370.23 354.15
Less : Provision for doubtful capital advances ....................................... 1.69 1.82
368.54 352.33
(B) Security Deposits :
Unsecured, considered good .................................................................... 35.89 35.90
Doubtful ....................................................................................................... 0.19 0.19
36.08 36.09
Less : Provision for doubtful security deposits ........................................ 0.19 0.19
35.89 35.90
(C) Loans and Advances to Related Parties :
Unsecured, considered good .................................................................... 237.12 11.17
Doubtful ....................................................................................................... 10.00 10.00
247.12 21.17
Less : Provision for doubtful loans and advances to related parties .... 10.00 10.00
237.12 11.17
(D) Other Loans and Advances :
Unsecured, considered good .................................................................... 1,445.92 1,077.28
Doubtful ....................................................................................................... 1.60 3.43
1,447.52 1,080.71
Less : Provision for doubtful other loans and advances ........................ 1.60 3.43
1,445.92 1,077.28
2,087.47 1,476.68
(a) Long Term Loans and Advances to Related Parties include :
(i) Share Application Money pending allotment Rs. 27.17 crores (2012 : Rs. Nil) to subsidiaries.
(ii) Fixed/Call deposits with/loans to limited companies Rs. 197.02 crores (2012 : Rs. Nil) including Rs. 197.02 crores (2012 : Rs. Nil) to subsidiary companies.
(b) Other Loans and Advances includes :
(i) Payment towards income-tax and surtax Rs. 388.91 crores (2012 : Rs. 321.71 crores).
(ii) VAT receivable, other recoverable expenses and advances to employees.
15. Other Non-Current Assets :
Rupees crores
2013 2012
(i) Hedging Instruments ..................................................................................................................... — 2.40
(ii) Export Benefits Receivable ........................................................................................................... 21.16 21.16
(iii) Others .............................................................................................................................................. 8.69 12.89
29.85 36.45
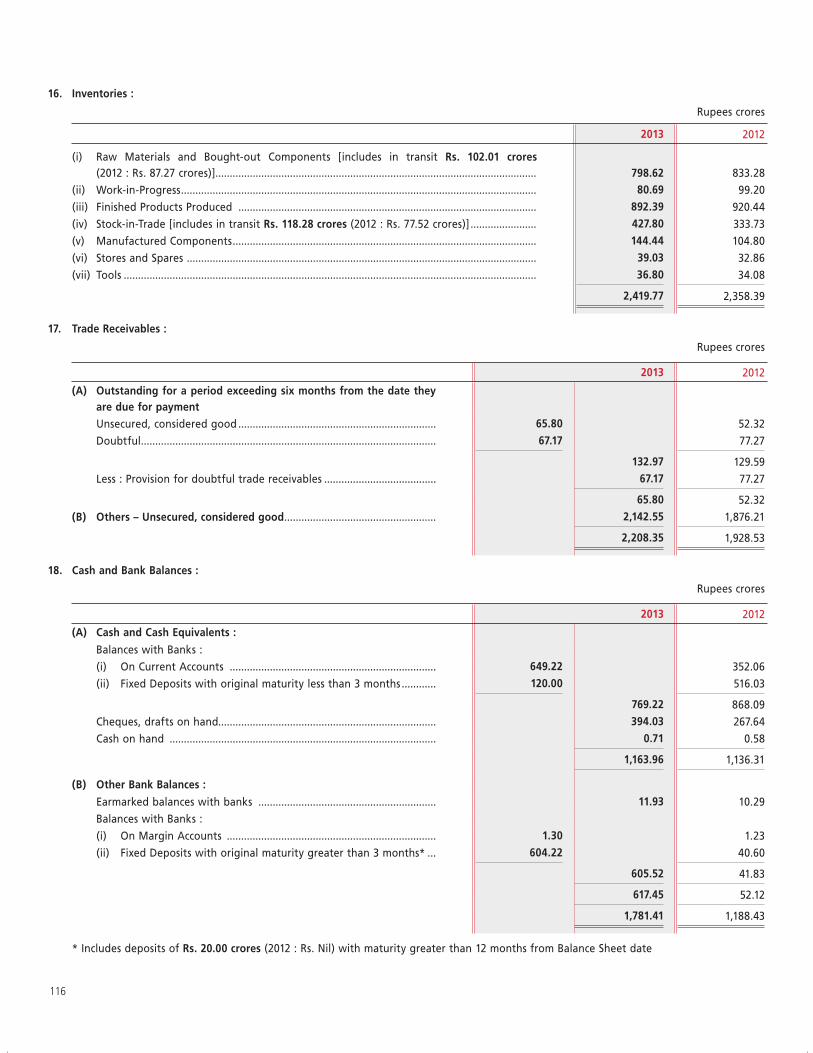
116
16. Inventories :
Rupees crores
2013 2012
(i) Raw Materials and Bought-out Components [includes in transit Rs. 102.01 crores (2012 : Rs. 87.27 crores)] ................................................................................................................ 798.62 833.28
(ii) Work-in-Progress ............................................................................................................................ 80.69 99.20
(iii) Finished Products Produced ........................................................................................................ 892.39 920.44
(iv) Stock-in-Trade [includes in transit Rs. 118.28 crores (2012 : Rs. 77.52 crores)] ....................... 427.80 333.73
(v) Manufactured Components .......................................................................................................... 144.44 104.80
(vi) Stores and Spares .......................................................................................................................... 39.03 32.86
(vii) Tools ................................................................................................................................................ 36.80 34.08
2,419.77 2,358.39
17. Trade Receivables :
Rupees crores
2013 2012
(A) Outstanding for a period exceeding six months from the date they are due for payment
Unsecured, considered good ..................................................................... 65.80 52.32
Doubtful ....................................................................................................... 67.17 77.27
132.97 129.59
Less : Provision for doubtful trade receivables ....................................... 67.17 77.27
65.80 52.32
(B) Others – Unsecured, considered good ..................................................... 2,142.55 1,876.21
2,208.35 1,928.53
18. Cash and Bank Balances :
Rupees crores
2013 2012
(A) Cash and Cash Equivalents :
Balances with Banks :
(i) On Current Accounts ........................................................................ 649.22 352.06
(ii) Fixed Deposits with original maturity less than 3 months ............ 120.00 516.03
769.22 868.09
Cheques, drafts on hand............................................................................ 394.03 267.64
Cash on hand ............................................................................................. 0.71 0.58
1,163.96 1,136.31
(B) Other Bank Balances :
Earmarked balances with banks .............................................................. 11.93 10.29
Balances with Banks :
(i) On Margin Accounts ......................................................................... 1.30 1.23
(ii) Fixed Deposits with original maturity greater than 3 months* ... 604.22 40.60
605.52 41.83
617.45 52.12
1,781.41 1,188.43
* Includes deposits of Rs. 20.00 crores (2012 : Rs. Nil) with maturity greater than 12 months from Balance Sheet date
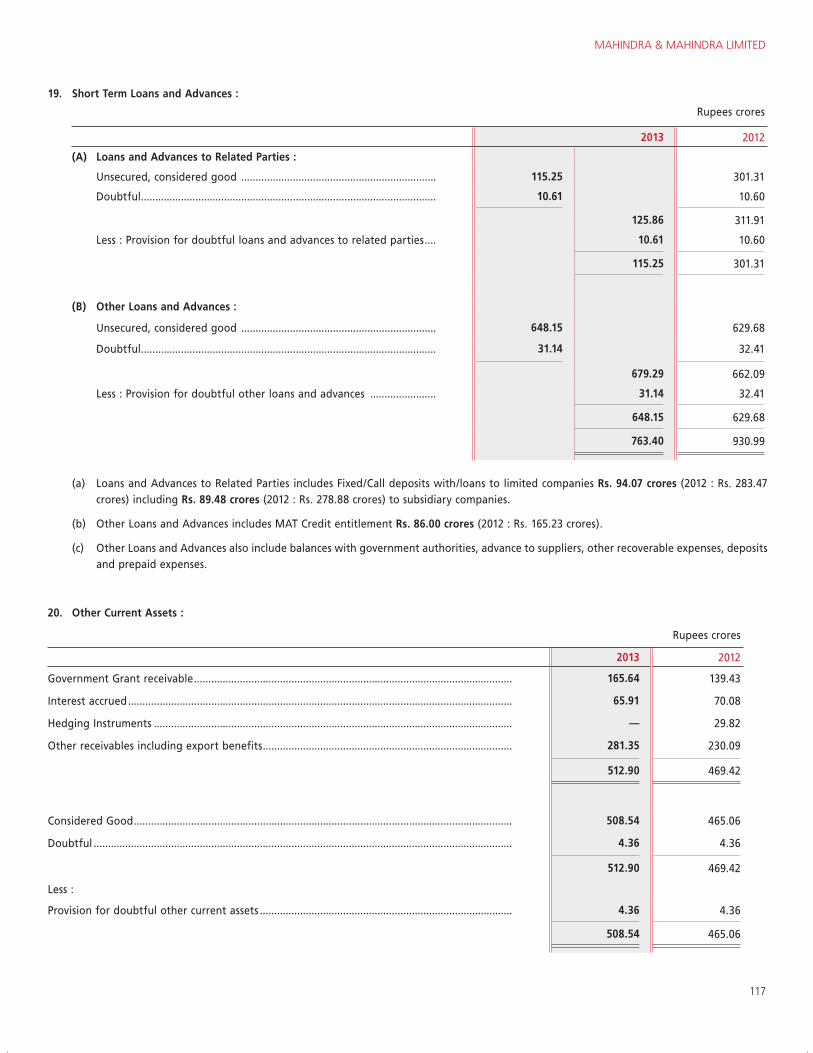
MAHINDRA & MAHINDRA LIMITED
117
19. Short Term Loans and Advances :
Rupees crores
2013 2012
(A) Loans and Advances to Related Parties :
Unsecured, considered good .................................................................... 115.25 301.31
Doubtful ....................................................................................................... 10.61 10.60
125.86 311.91
Less : Provision for doubtful loans and advances to related parties .... 10.61 10.60
115.25 301.31
(B) Other Loans and Advances :
Unsecured, considered good .................................................................... 648.15 629.68
Doubtful ....................................................................................................... 31.14 32.41
679.29 662.09
Less : Provision for doubtful other loans and advances ....................... 31.14 32.41
648.15 629.68
763.40 930.99
(a) Loans and Advances to Related Parties includes Fixed/Call deposits with/loans to limited companies Rs. 94.07 crores (2012 : Rs. 283.47 crores) including Rs. 89.48 crores (2012 : Rs. 278.88 crores) to subsidiary companies.
(b) Other Loans and Advances includes MAT Credit entitlement Rs. 86.00 crores (2012 : Rs. 165.23 crores).
(c) Other Loans and Advances also include balances with government authorities, advance to suppliers, other recoverable expenses, deposits and prepaid expenses.
20. Other Current Assets :
Rupees crores
2013 2012
Government Grant receivable ............................................................................................................... 165.64 139.43
Interest accrued ...................................................................................................................................... 65.91 70.08
Hedging Instruments ............................................................................................................................. — 29.82
Other receivables including export benefits ....................................................................................... 281.35 230.09
512.90 469.42
Considered Good .................................................................................................................................... 508.54 465.06
Doubtful .................................................................................................................................................. 4.36 4.36
512.90 469.42
Less :
Provision for doubtful other current assets ........................................................................................ 4.36 4.36
508.54 465.06
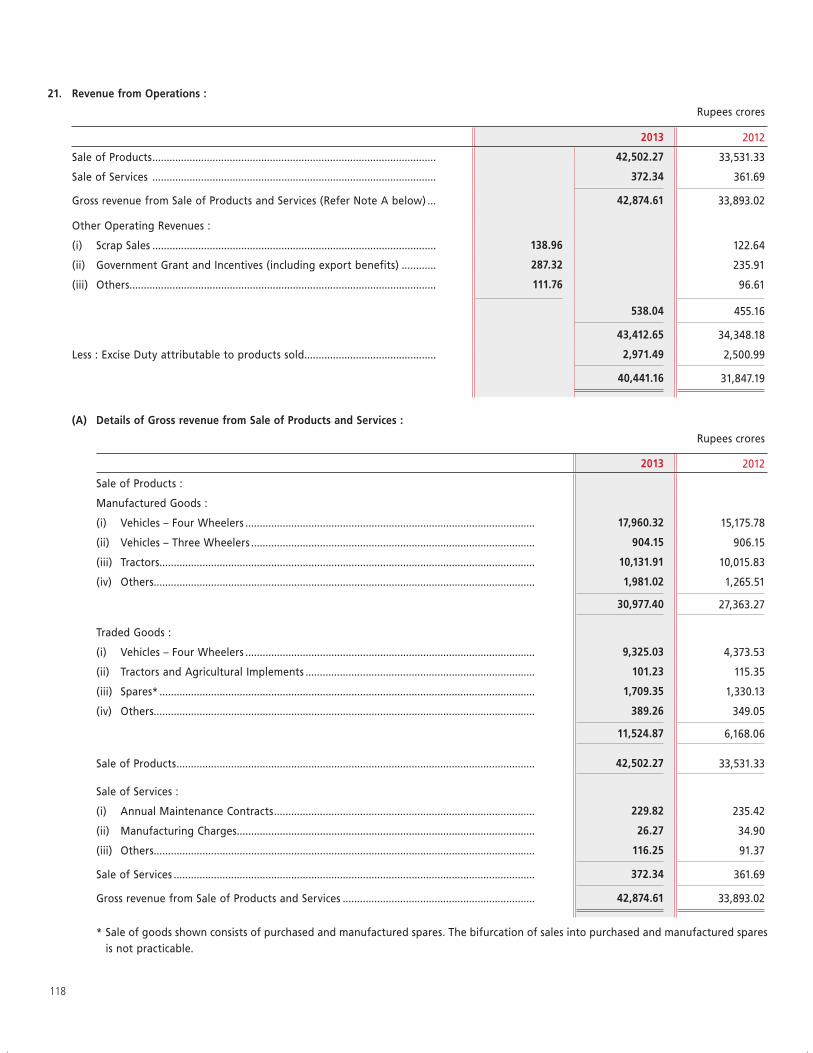
118
21. Revenue from Operations :
Rupees crores
2013 2012
Sale of Products ................................................................................................... 42,502.27 33,531.33
Sale of Services ................................................................................................... 372.34 361.69
Gross revenue from Sale of Products and Services (Refer Note A below) ... 42,874.61 33,893.02
Other Operating Revenues :
(i) Scrap Sales ................................................................................................... 138.96 122.64
(ii) Government Grant and Incentives (including export benefits) ............ 287.32 235.91
(iii) Others ........................................................................................................... 111.76 96.61
538.04 455.16
43,412.65 34,348.18
Less : Excise Duty attributable to products sold.............................................. 2,971.49 2,500.99
40,441.16 31,847.19
(A) Details of Gross revenue from Sale of Products and Services :
Rupees crores
2013 2012
Sale of Products :
Manufactured Goods :
(i) Vehicles – Four Wheelers ..................................................................................................... 17,960.32 15,175.78
(ii) Vehicles – Three Wheelers ................................................................................................... 904.15 906.15
(iii) Tractors ................................................................................................................................... 10,131.91 10,015.83
(iv) Others ..................................................................................................................................... 1,981.02 1,265.51
30,977.40 27,363.27
Traded Goods :
(i) Vehicles – Four Wheelers ..................................................................................................... 9,325.03 4,373.53
(ii) Tractors and Agricultural Implements ................................................................................ 101.23 115.35
(iii) Spares* ................................................................................................................................... 1,709.35 1,330.13
(iv) Others ..................................................................................................................................... 389.26 349.05
11,524.87 6,168.06
Sale of Products ............................................................................................................................. 42,502.27 33,531.33
Sale of Services :
(i) Annual Maintenance Contracts ........................................................................................... 229.82 235.42
(ii) Manufacturing Charges ........................................................................................................ 26.27 34.90
(iii) Others ..................................................................................................................................... 116.25 91.37
Sale of Services .............................................................................................................................. 372.34 361.69
Gross revenue from Sale of Products and Services ................................................................... 42,874.61 33,893.02
* Sale of goods shown consists of purchased and manufactured spares. The bifurcation of sales into purchased and manufactured spares is not practicable.
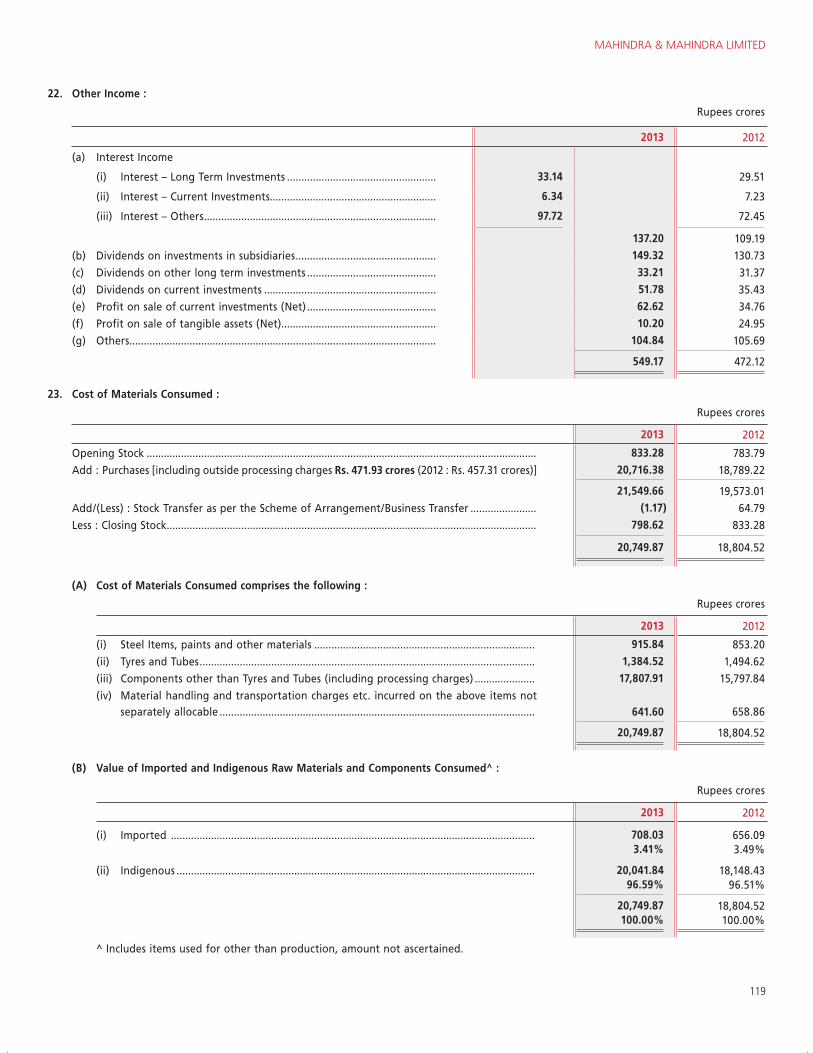
MAHINDRA & MAHINDRA LIMITED
119
22. Other Income :
Rupees crores
2013 2012
(a) Interest Income
(i) Interest – Long Term Investments .................................................... 33.14 29.51
(ii) Interest – Current Investments.......................................................... 6.34 7.23
(iii) Interest – Others ................................................................................. 97.72 72.45
137.20 109.19
(b) Dividends on investments in subsidiaries ................................................. 149.32 130.73
(c) Dividends on other long term investments ............................................. 33.21 31.37
(d) Dividends on current investments ............................................................ 51.78 35.43
(e) Profit on sale of current investments (Net) ............................................. 62.62 34.76
(f) Profit on sale of tangible assets (Net)...................................................... 10.20 24.95
(g) Others ........................................................................................................... 104.84 105.69
549.17 472.12
23. Cost of Materials Consumed :
Rupees crores
2013 2012
Opening Stock ........................................................................................................................................ 833.28 783.79
Add : Purchases [including outside processing charges Rs. 471.93 crores (2012 : Rs. 457.31 crores)] 20,716.38 18,789.22
21,549.66 19,573.01
Add/(Less) : Stock Transfer as per the Scheme of Arrangement/Business Transfer ....................... (1.17) 64.79
Less : Closing Stock ................................................................................................................................. 798.62 833.28
20,749.87 18,804.52
(A) Cost of Materials Consumed comprises the following :
Rupees crores
2013 2012
(i) Steel Items, paints and other materials ............................................................................. 915.84 853.20
(ii) Tyres and Tubes ..................................................................................................................... 1,384.52 1,494.62
(iii) Components other than Tyres and Tubes (including processing charges) ..................... 17,807.91 15,797.84
(iv) Material handling and transportation charges etc. incurred on the above items not separately allocable .............................................................................................................. 641.60 658.86
20,749.87 18,804.52
(B) Value of Imported and Indigenous Raw Materials and Components Consumed^ :
Rupees crores
2013 2012
(i) Imported ............................................................................................................................... 708.03 656.09 3.41% 3.49%
(ii) Indigenous ............................................................................................................................. 20,041.84 18,148.43 96.59% 96.51%
20,749.87 18,804.52 100.00% 100.00%
^ Includes items used for other than production, amount not ascertained.
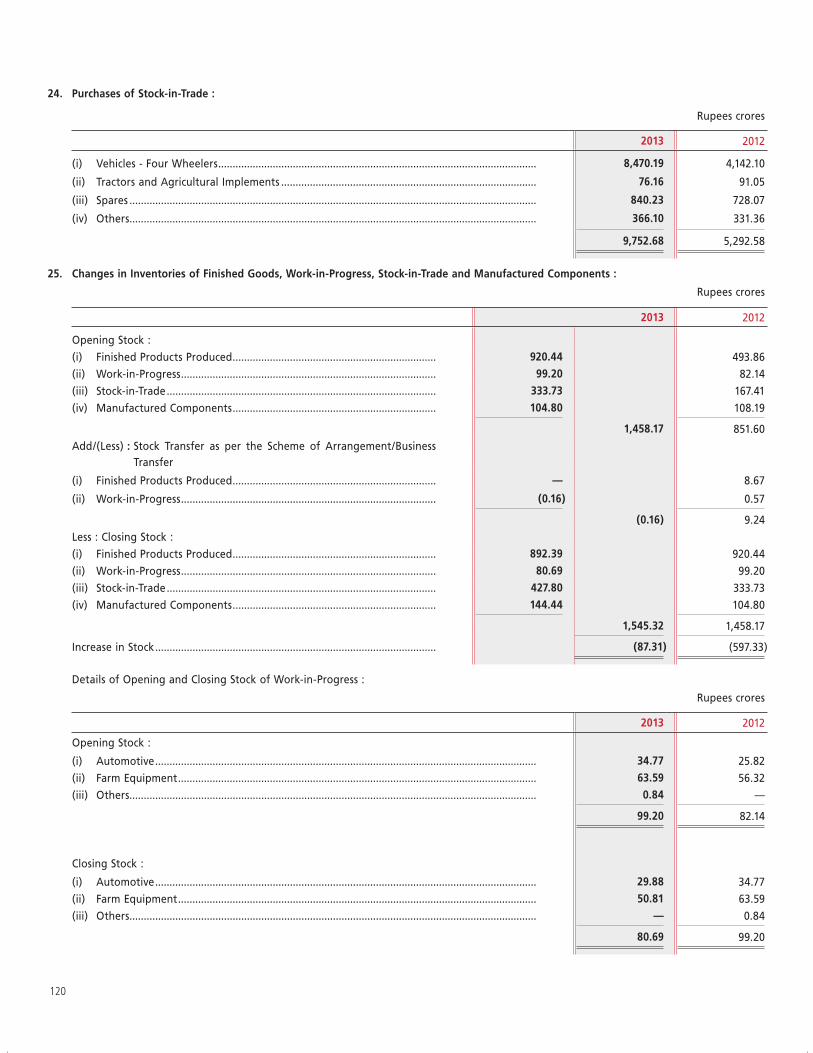
120
24. Purchases of Stock-in-Trade :
Rupees crores
2013 2012
(i) Vehicles - Four Wheelers ............................................................................................................... 8,470.19 4,142.10
(ii) Tractors and Agricultural Implements ......................................................................................... 76.16 91.05
(iii) Spares .............................................................................................................................................. 840.23 728.07
(iv) Others .............................................................................................................................................. 366.10 331.36
9,752.68 5,292.58
25. Changes in Inventories of Finished Goods, Work-in-Progress, Stock-in-Trade and Manufactured Components :
Rupees crores
2013 2012
Opening Stock :
(i) Finished Products Produced ....................................................................... 920.44 493.86
(ii) Work-in-Progress ......................................................................................... 99.20 82.14
(iii) Stock-in-Trade .............................................................................................. 333.73 167.41
(iv) Manufactured Components ....................................................................... 104.80 108.19
1,458.17 851.60
Add/(Less) : Stock Transfer as per the Scheme of Arrangement/Business Transfer
(i) Finished Products Produced ....................................................................... — 8.67
(ii) Work-in-Progress ......................................................................................... (0.16) 0.57
(0.16) 9.24
Less : Closing Stock :
(i) Finished Products Produced ....................................................................... 892.39 920.44
(ii) Work-in-Progress ......................................................................................... 80.69 99.20
(iii) Stock-in-Trade .............................................................................................. 427.80 333.73
(iv) Manufactured Components ....................................................................... 144.44 104.80
1,545.32 1,458.17
Increase in Stock .................................................................................................. (87.31) (597.33)
Details of Opening and Closing Stock of Work-in-Progress :
Rupees crores
2013 2012
Opening Stock :
(i) Automotive ..................................................................................................................................... 34.77 25.82
(ii) Farm Equipment ............................................................................................................................. 63.59 56.32
(iii) Others .............................................................................................................................................. 0.84 —
99.20 82.14
Closing Stock :
(i) Automotive ..................................................................................................................................... 29.88 34.77
(ii) Farm Equipment ............................................................................................................................. 50.81 63.59
(iii) Others .............................................................................................................................................. — 0.84
80.69 99.20
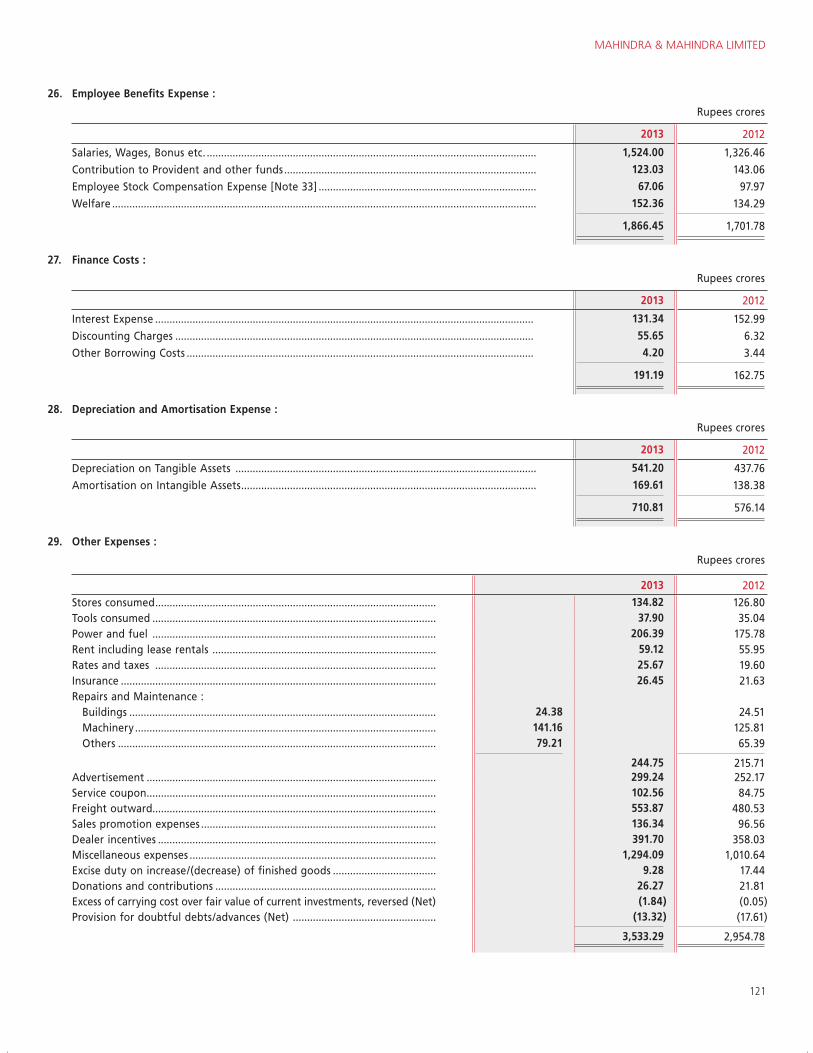
MAHINDRA & MAHINDRA LIMITED
121
26. Employee Benefits Expense :
Rupees crores
2013 2012
Salaries, Wages, Bonus etc. ................................................................................................................... 1,524.00 1,326.46
Contribution to Provident and other funds ........................................................................................ 123.03 143.06
Employee Stock Compensation Expense [Note 33] ............................................................................ 67.06 97.97
Welfare .................................................................................................................................................... 152.36 134.29
1,866.45 1,701.78
27. Finance Costs :
Rupees crores
2013 2012
Interest Expense .................................................................................................................................... 131.34 152.99
Discounting Charges ............................................................................................................................. 55.65 6.32
Other Borrowing Costs ......................................................................................................................... 4.20 3.44
191.19 162.75
28. Depreciation and Amortisation Expense :
Rupees crores
2013 2012
Depreciation on Tangible Assets ......................................................................................................... 541.20 437.76
Amortisation on Intangible Assets ....................................................................................................... 169.61 138.38
710.81 576.14
29. Other Expenses :
Rupees crores
2013 2012
Stores consumed .................................................................................................. 134.82 126.80 Tools consumed ................................................................................................... 37.90 35.04 Power and fuel ................................................................................................... 206.39 175.78 Rent including lease rentals .............................................................................. 59.12 55.95 Rates and taxes .................................................................................................. 25.67 19.60 Insurance .............................................................................................................. 26.45 21.63 Repairs and Maintenance : Buildings ........................................................................................................... 24.38 24.51 Machinery ......................................................................................................... 141.16 125.81 Others ............................................................................................................... 79.21 65.39
244.75 215.71 Advertisement ..................................................................................................... 299.24 252.17 Service coupon ..................................................................................................... 102.56 84.75 Freight outward................................................................................................... 553.87 480.53 Sales promotion expenses .................................................................................. 136.34 96.56 Dealer incentives ................................................................................................. 391.70 358.03 Miscellaneous expenses ...................................................................................... 1,294.09 1,010.64 Excise duty on increase/(decrease) of finished goods .................................... 9.28 17.44 Donations and contributions ............................................................................. 26.27 21.81 Excess of carrying cost over fair value of current investments, reversed (Net) (1.84) (0.05)Provision for doubtful debts/advances (Net) .................................................. (13.32) (17.61)
3,533.29 2,954.78
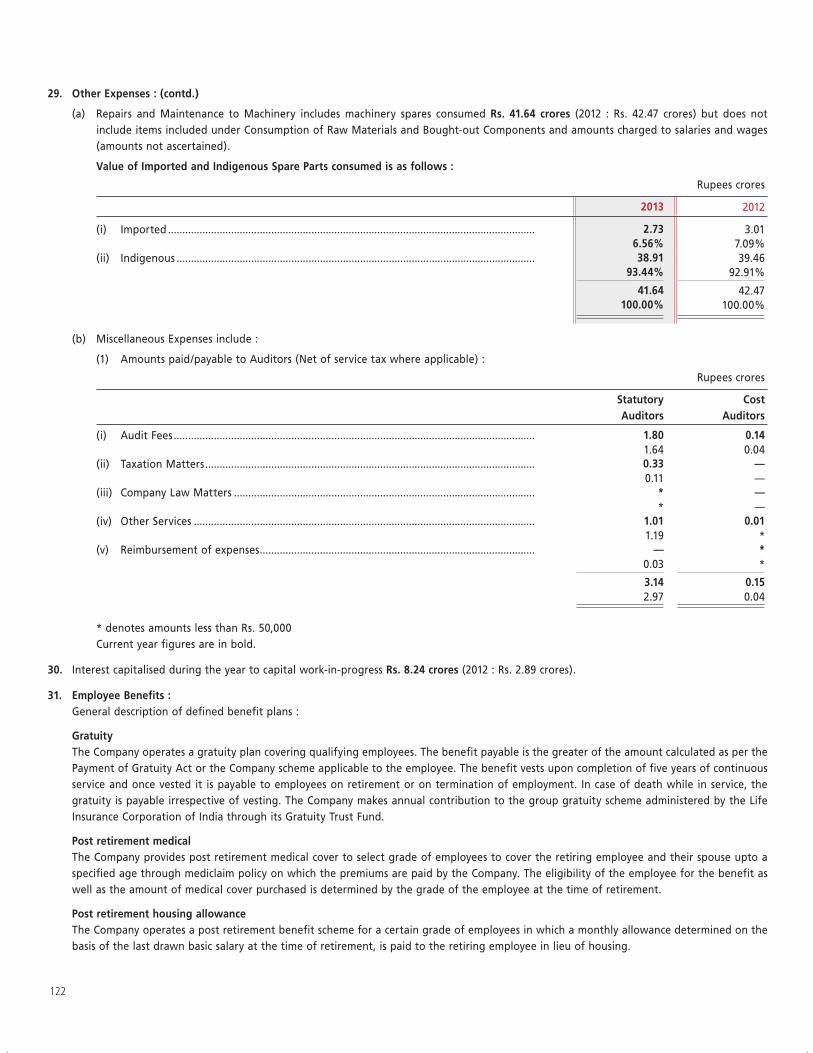
122
29. Other Expenses : (contd.)
(a) Repairs and Maintenance to Machinery includes machinery spares consumed Rs. 41.64 crores (2012 : Rs. 42.47 crores) but does not include items included under Consumption of Raw Materials and Bought-out Components and amounts charged to salaries and wages (amounts not ascertained).
Value of Imported and Indigenous Spare Parts consumed is as follows :
Rupees crores
2013 2012
(i) Imported ................................................................................................................................ 2.73 3.016.56% 7.09%
(ii) Indigenous ............................................................................................................................. 38.91 39.4693.44% 92.91%
41.64 42.47100.00% 100.00%
(b) Miscellaneous Expenses include :
(1) Amounts paid/payable to Auditors (Net of service tax where applicable) :
Rupees crores
Statutory Auditors
Cost Auditors
(i) Audit Fees .............................................................................................................................. 1.80 0.14 1.64 0.04
(ii) Taxation Matters ................................................................................................................... 0.33 —0.11 —
(iii) Company Law Matters ......................................................................................................... * — * —
(iv) Other Services ....................................................................................................................... 1.01 0.01 1.19 *
(v) Reimbursement of expenses ................................................................................................ — * 0.03 *
3.14 0.15 2.97 0.04
* denotes amounts less than Rs. 50,000 Current year figures are in bold.
30. Interest capitalised during the year to capital work-in-progress Rs. 8.24 crores (2012 : Rs. 2.89 crores).
31. Employee Benefits : General description of defined benefit plans :
Gratuity The Company operates a gratuity plan covering qualifying employees. The benefit payable is the greater of the amount calculated as per the
Payment of Gratuity Act or the Company scheme applicable to the employee. The benefit vests upon completion of five years of continuous service and once vested it is payable to employees on retirement or on termination of employment. In case of death while in service, the gratuity is payable irrespective of vesting. The Company makes annual contribution to the group gratuity scheme administered by the Life Insurance Corporation of India through its Gratuity Trust Fund.
Post retirement medical The Company provides post retirement medical cover to select grade of employees to cover the retiring employee and their spouse upto a
specified age through mediclaim policy on which the premiums are paid by the Company. The eligibility of the employee for the benefit as well as the amount of medical cover purchased is determined by the grade of the employee at the time of retirement.
Post retirement housing allowance The Company operates a post retirement benefit scheme for a certain grade of employees in which a monthly allowance determined on the
basis of the last drawn basic salary at the time of retirement, is paid to the retiring employee in lieu of housing.
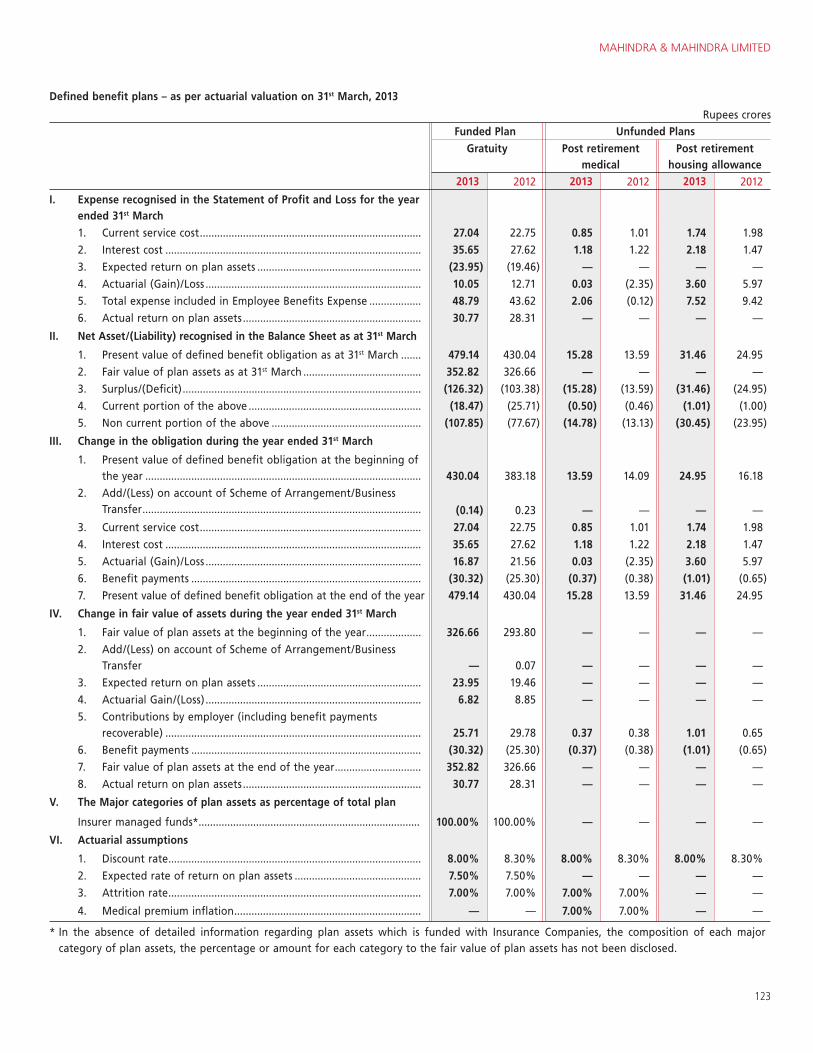
MAHINDRA & MAHINDRA LIMITED
123
Defined benefit plans – as per actuarial valuation on 31st March, 2013
Rupees croresFunded Plan Unfunded Plans
Gratuity Post retirement medical
Post retirement housing allowance
2013 2012 2013 2012 2013 2012
I. Expense recognised in the Statement of Profit and Loss for the year ended 31st March
1. Current service cost ............................................................................. 27.04 22.75 0.85 1.01 1.74 1.98
2. Interest cost ......................................................................................... 35.65 27.62 1.18 1.22 2.18 1.47
3. Expected return on plan assets ......................................................... (23.95) (19.46) — — — —
4. Actuarial (Gain)/Loss ........................................................................... 10.05 12.71 0.03 (2.35) 3.60 5.97
5. Total expense included in Employee Benefits Expense .................. 48.79 43.62 2.06 (0.12) 7.52 9.42
6. Actual return on plan assets .............................................................. 30.77 28.31 — — — —
II. Net Asset/(Liability) recognised in the Balance Sheet as at 31st March
1. Present value of defined benefit obligation as at 31st March ....... 479.14 430.04 15.28 13.59 31.46 24.95
2. Fair value of plan assets as at 31st March ......................................... 352.82 326.66 — — — —
3. Surplus/(Deficit) ................................................................................... (126.32) (103.38) (15.28) (13.59) (31.46) (24.95)
4. Current portion of the above ............................................................ (18.47) (25.71) (0.50) (0.46) (1.01) (1.00)
5. Non current portion of the above .................................................... (107.85) (77.67) (14.78) (13.13) (30.45) (23.95)
III. Change in the obligation during the year ended 31st March
1. Present value of defined benefit obligation at the beginning of the year ................................................................................................ 430.04 383.18 13.59 14.09 24.95 16.18
2. Add/(Less) on account of Scheme of Arrangement/Business Transfer ................................................................................................. (0.14) 0.23 — — — —
3. Current service cost ............................................................................. 27.04 22.75 0.85 1.01 1.74 1.98
4. Interest cost ......................................................................................... 35.65 27.62 1.18 1.22 2.18 1.47
5. Actuarial (Gain)/Loss ........................................................................... 16.87 21.56 0.03 (2.35) 3.60 5.97
6. Benefit payments ................................................................................ (30.32) (25.30) (0.37) (0.38) (1.01) (0.65)
7. Present value of defined benefit obligation at the end of the year 479.14 430.04 15.28 13.59 31.46 24.95
IV. Change in fair value of assets during the year ended 31st March
1. Fair value of plan assets at the beginning of the year ................... 326.66 293.80 — — — —
2. Add/(Less) on account of Scheme of Arrangement/Business Transfer — 0.07 — — — —
3. Expected return on plan assets ......................................................... 23.95 19.46 — — — —
4. Actuarial Gain/(Loss) ........................................................................... 6.82 8.85 — — — —
5. Contributions by employer (including benefit payments recoverable) ......................................................................................... 25.71 29.78 0.37 0.38 1.01 0.65
6. Benefit payments ................................................................................ (30.32) (25.30) (0.37) (0.38) (1.01) (0.65)
7. Fair value of plan assets at the end of the year .............................. 352.82 326.66 — — — —
8. Actual return on plan assets .............................................................. 30.77 28.31 — — — —
V. The Major categories of plan assets as percentage of total plan
Insurer managed funds* ............................................................................. 100.00% 100.00% — — — —
VI. Actuarial assumptions
1. Discount rate ........................................................................................ 8.00% 8.30% 8.00% 8.30% 8.00% 8.30%
2. Expected rate of return on plan assets ............................................ 7.50% 7.50% — — — —
3. Attrition rate ........................................................................................ 7.00% 7.00% 7.00% 7.00% — —
4. Medical premium inflation ................................................................. — — 7.00% 7.00% — —
* In the absence of detailed information regarding plan assets which is funded with Insurance Companies, the composition of each major category of plan assets, the percentage or amount for each category to the fair value of plan assets has not been disclosed.
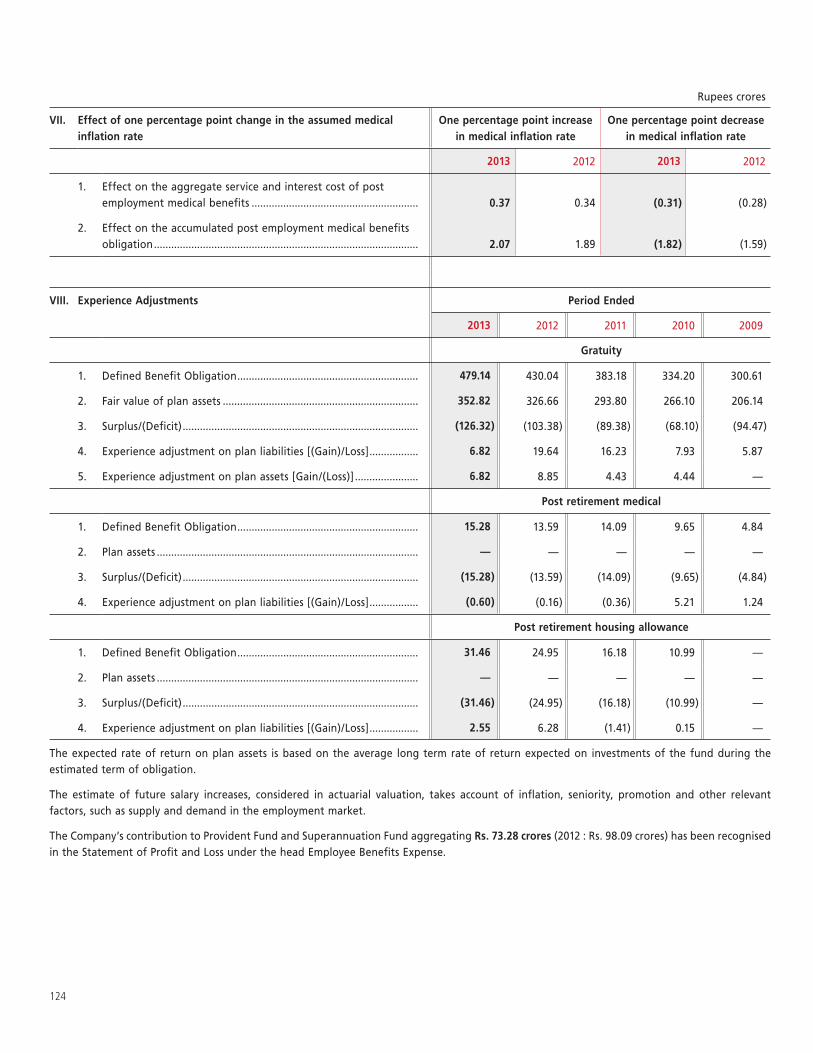
124
Rupees crores
VII. Effect of one percentage point change in the assumed medical inflation rate
One percentage point increase in medical inflation rate
One percentage point decrease in medical inflation rate
2013 2012 2013 2012
1. Effect on the aggregate service and interest cost of post employment medical benefits .......................................................... 0.37 0.34 (0.31) (0.28)
2. Effect on the accumulated post employment medical benefits obligation ............................................................................................ 2.07 1.89 (1.82) (1.59)
VIII. Experience Adjustments Period Ended
2013 2012 2011 2010 2009
Gratuity
1. Defined Benefit Obligation ............................................................... 479.14 430.04 383.18 334.20 300.61
2. Fair value of plan assets .................................................................... 352.82 326.66 293.80 266.10 206.14
3. Surplus/(Deficit) .................................................................................. (126.32) (103.38) (89.38) (68.10) (94.47)
4. Experience adjustment on plan liabilities [(Gain)/Loss] ................. 6.82 19.64 16.23 7.93 5.87
5. Experience adjustment on plan assets [Gain/(Loss)] ...................... 6.82 8.85 4.43 4.44 —
Post retirement medical
1. Defined Benefit Obligation ............................................................... 15.28 13.59 14.09 9.65 4.84
2. Plan assets ........................................................................................... — — — — —
3. Surplus/(Deficit) .................................................................................. (15.28) (13.59) (14.09) (9.65) (4.84)
4. Experience adjustment on plan liabilities [(Gain)/Loss] ................. (0.60) (0.16) (0.36) 5.21 1.24
Post retirement housing allowance
1. Defined Benefit Obligation ............................................................... 31.46 24.95 16.18 10.99 —
2. Plan assets ........................................................................................... — — — — —
3. Surplus/(Deficit) .................................................................................. (31.46) (24.95) (16.18) (10.99) —
4. Experience adjustment on plan liabilities [(Gain)/Loss] ................. 2.55 6.28 (1.41) 0.15 —
The expected rate of return on plan assets is based on the average long term rate of return expected on investments of the fund during the estimated term of obligation.
The estimate of future salary increases, considered in actuarial valuation, takes account of inflation, seniority, promotion and other relevant factors, such as supply and demand in the employment market.
The Company’s contribution to Provident Fund and Superannuation Fund aggregating Rs. 73.28 crores (2012 : Rs. 98.09 crores) has been recognised in the Statement of Profit and Loss under the head Employee Benefits Expense.
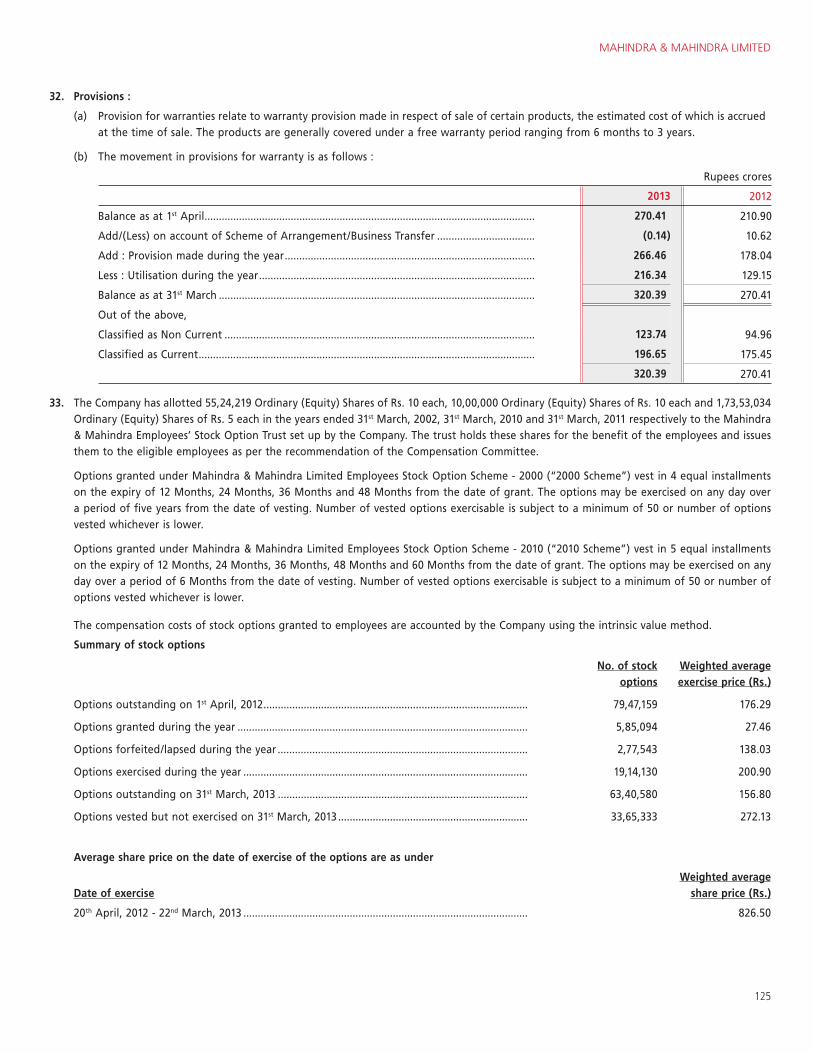
MAHINDRA & MAHINDRA LIMITED
125
32. Provisions :
(a) Provision for warranties relate to warranty provision made in respect of sale of certain products, the estimated cost of which is accrued at the time of sale. The products are generally covered under a free warranty period ranging from 6 months to 3 years.
(b) The movement in provisions for warranty is as follows :
Rupees crores
2013 2012
Balance as at 1st April ................................................................................................................... 270.41 210.90
Add/(Less) on account of Scheme of Arrangement/Business Transfer .................................. (0.14) 10.62
Add : Provision made during the year ....................................................................................... 266.46 178.04
Less : Utilisation during the year ................................................................................................ 216.34 129.15
Balance as at 31st March .............................................................................................................. 320.39 270.41
Out of the above,
Classified as Non Current ............................................................................................................ 123.74 94.96
Classified as Current ..................................................................................................................... 196.65 175.45
320.39 270.41
33. The Company has allotted 55,24,219 Ordinary (Equity) Shares of Rs. 10 each, 10,00,000 Ordinary (Equity) Shares of Rs. 10 each and 1,73,53,034 Ordinary (Equity) Shares of Rs. 5 each in the years ended 31st March, 2002, 31st March, 2010 and 31st March, 2011 respectively to the Mahindra & Mahindra Employees’ Stock Option Trust set up by the Company. The trust holds these shares for the benefit of the employees and issues them to the eligible employees as per the recommendation of the Compensation Committee.
Options granted under Mahindra & Mahindra Limited Employees Stock Option Scheme - 2000 (“2000 Scheme”) vest in 4 equal installments on the expiry of 12 Months, 24 Months, 36 Months and 48 Months from the date of grant. The options may be exercised on any day over a period of five years from the date of vesting. Number of vested options exercisable is subject to a minimum of 50 or number of options vested whichever is lower.
Options granted under Mahindra & Mahindra Limited Employees Stock Option Scheme - 2010 (“2010 Scheme”) vest in 5 equal installments on the expiry of 12 Months, 24 Months, 36 Months, 48 Months and 60 Months from the date of grant. The options may be exercised on any day over a period of 6 Months from the date of vesting. Number of vested options exercisable is subject to a minimum of 50 or number of options vested whichever is lower.
The compensation costs of stock options granted to employees are accounted by the Company using the intrinsic value method.
Summary of stock options
No. of stock options
Weighted average exercise price (Rs.)
Options outstanding on 1st April, 2012 ............................................................................................ 79,47,159 176.29
Options granted during the year ..................................................................................................... 5,85,094 27.46
Options forfeited/lapsed during the year ....................................................................................... 2,77,543 138.03
Options exercised during the year ................................................................................................... 19,14,130 200.90
Options outstanding on 31st March, 2013 ....................................................................................... 63,40,580 156.80
Options vested but not exercised on 31st March, 2013 .................................................................. 33,65,333 272.13
Average share price on the date of exercise of the options are as under
Date of exerciseWeighted average
share price (Rs.)
20th April, 2012 - 22nd March, 2013 ................................................................................................... 826.50

126
Information in respect of options outstanding as at 31st March, 2013
Range of exercise price Number of options Weighted average remaining life
Rs. 5.00 ................................................................................................................................................ 32,11,589 2.28 Years
Rs. 250.00 ............................................................................................................................................ 15,19,023 4.11 Years
Rs. 308.00 – Rs. 310.00 ....................................................................................................................... 1,80,384 2.27 Years
Rs. 381.00 ............................................................................................................................................ 10,16,235 2.67 Years
Rs. 362.00 ............................................................................................................................................ 3,93,349 4.67 Years
Rs. 662.00 ............................................................................................................................................ 20,000 6.98 Years
The fair value of options granted during the year on 25th September, 2012 is Rs. 419.07 per share and for the option granted on 30th November, 2012 is Rs. 889.03 per share.
The fair value has been calculated using the Black Scholes Options Pricing Model and the significant assumptions made in this regard are as follows :
Grant dated 25th September, 2012
Grant dated 30th November, 2012
Risk free interest rate ........................................................................................................................ 8.12% 8.11%
Expected life ....................................................................................................................................... 5 Years 3.25 Years
Expected volatility .............................................................................................................................. 42.73% 35.94%
Expected dividend yield .................................................................................................................... 1.82% 1.82%
Exercise Price (Rs.) .............................................................................................................................. 662.00 5.00
Stock Price (Rs.) .................................................................................................................................. 846.05 947.00
In respect of Options granted under the Employee Stock Option Plan, in accordance with guidelines issued by SEBI, the accounting value of the options is accounted as deferred employee compensation, which is amortised on a straight line basis over the period between the date of grant of options and eligible dates for conversion into equity shares. Consequently, salaries, wages, bonus etc. includes Rs. 67.06 crores (2012 : Rs. 97.97 crores) being the amortisation of deferred employee compensation, after adjusting for reversals on account of options lapsed. The amount excludes Rs. 2.31 crores charged to its subsidiaries for options issued to their employees.
Had the Company adopted fair value method in respect of options granted on or after 1st April, 2005, the employee compensation cost would have been lower by Rs. 5.70 crores, Profit after tax higher by Rs. 5.70 crores and the basic and diluted earnings per share would have been higher by Rs. 0.10 & Rs. 0.09 respectively.
34. Contingent Liability & Commitments : (A) Contingent Liability : (a) Guarantees given by the Company :
Rupees crores
Amount of guarantees Outstanding amounts against guarantees
2013 2012 2013 2012
For other companies ............................................................... 87.20 171.98 80.35 166.83
(b) Claims against the Company not acknowledged as debts comprise of :
(i) Excise Duty, Sales Tax and Service Tax claims disputed by the Company relating to issues of applicability and classification aggregating Rs. 1,526.09 crores before tax (2012 : Rs. 1,464.96 crores before tax).
(ii) Other matters (excluding claims where amounts are not ascertainable) : Rs. 26.94 crores before tax (2012 : Rs. 21.36 crores before tax).
(c) Taxation matters :
(i) Demands against the Company not acknowledged as debts and not provided for, relating to issues of deductibility and taxability in respect of which the Company is in appeal and exclusive of the effect of similar matters in respect of assessments remaining to be completed :
– Income-tax : Rs. 195.74 crores (2012 : Rs. 319.29 crores).
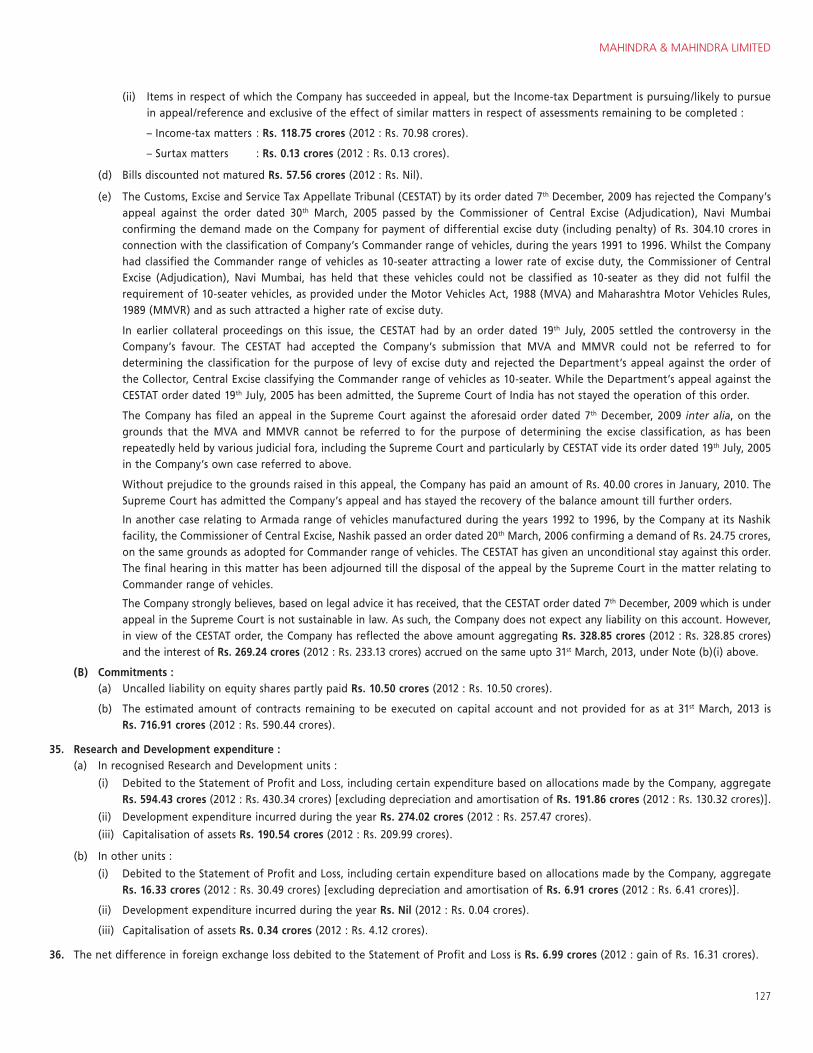
MAHINDRA & MAHINDRA LIMITED
127
(ii) Items in respect of which the Company has succeeded in appeal, but the Income-tax Department is pursuing/likely to pursue in appeal/reference and exclusive of the effect of similar matters in respect of assessments remaining to be completed :
– Income-tax matters : Rs. 118.75 crores (2012 : Rs. 70.98 crores).
– Surtax matters : Rs. 0.13 crores (2012 : Rs. 0.13 crores).
(d) Bills discounted not matured Rs. 57.56 crores (2012 : Rs. Nil).
(e) The Customs, Excise and Service Tax Appellate Tribunal (CESTAT) by its order dated 7th December, 2009 has rejected the Company’s appeal against the order dated 30th March, 2005 passed by the Commissioner of Central Excise (Adjudication), Navi Mumbai confirming the demand made on the Company for payment of differential excise duty (including penalty) of Rs. 304.10 crores in connection with the classification of Company’s Commander range of vehicles, during the years 1991 to 1996. Whilst the Company had classified the Commander range of vehicles as 10-seater attracting a lower rate of excise duty, the Commissioner of Central Excise (Adjudication), Navi Mumbai, has held that these vehicles could not be classified as 10-seater as they did not fulfil the requirement of 10-seater vehicles, as provided under the Motor Vehicles Act, 1988 (MVA) and Maharashtra Motor Vehicles Rules, 1989 (MMVR) and as such attracted a higher rate of excise duty.
In earlier collateral proceedings on this issue, the CESTAT had by an order dated 19th July, 2005 settled the controversy in the Company’s favour. The CESTAT had accepted the Company’s submission that MVA and MMVR could not be referred to for determining the classification for the purpose of levy of excise duty and rejected the Department’s appeal against the order of the Collector, Central Excise classifying the Commander range of vehicles as 10-seater. While the Department’s appeal against the CESTAT order dated 19th July, 2005 has been admitted, the Supreme Court of India has not stayed the operation of this order.
The Company has filed an appeal in the Supreme Court against the aforesaid order dated 7th December, 2009 inter alia, on the grounds that the MVA and MMVR cannot be referred to for the purpose of determining the excise classification, as has been repeatedly held by various judicial fora, including the Supreme Court and particularly by CESTAT vide its order dated 19th July, 2005 in the Company’s own case referred to above.
Without prejudice to the grounds raised in this appeal, the Company has paid an amount of Rs. 40.00 crores in January, 2010. The Supreme Court has admitted the Company’s appeal and has stayed the recovery of the balance amount till further orders.
In another case relating to Armada range of vehicles manufactured during the years 1992 to 1996, by the Company at its Nashik facility, the Commissioner of Central Excise, Nashik passed an order dated 20th March, 2006 confirming a demand of Rs. 24.75 crores, on the same grounds as adopted for Commander range of vehicles. The CESTAT has given an unconditional stay against this order. The final hearing in this matter has been adjourned till the disposal of the appeal by the Supreme Court in the matter relating to Commander range of vehicles.
The Company strongly believes, based on legal advice it has received, that the CESTAT order dated 7th December, 2009 which is under appeal in the Supreme Court is not sustainable in law. As such, the Company does not expect any liability on this account. However, in view of the CESTAT order, the Company has reflected the above amount aggregating Rs. 328.85 crores (2012 : Rs. 328.85 crores) and the interest of Rs. 269.24 crores (2012 : Rs. 233.13 crores) accrued on the same upto 31st March, 2013, under Note (b)(i) above.
(B) Commitments : (a) Uncalled liability on equity shares partly paid Rs. 10.50 crores (2012 : Rs. 10.50 crores).
(b) The estimated amount of contracts remaining to be executed on capital account and not provided for as at 31st March, 2013 is Rs. 716.91 crores (2012 : Rs. 590.44 crores).
35. Research and Development expenditure : (a) In recognised Research and Development units :
(i) Debited to the Statement of Profit and Loss, including certain expenditure based on allocations made by the Company, aggregate Rs. 594.43 crores (2012 : Rs. 430.34 crores) [excluding depreciation and amortisation of Rs. 191.86 crores (2012 : Rs. 130.32 crores)].
(ii) Development expenditure incurred during the year Rs. 274.02 crores (2012 : Rs. 257.47 crores).
(iii) Capitalisation of assets Rs. 190.54 crores (2012 : Rs. 209.99 crores).
(b) In other units :
(i) Debited to the Statement of Profit and Loss, including certain expenditure based on allocations made by the Company, aggregate Rs. 16.33 crores (2012 : Rs. 30.49 crores) [excluding depreciation and amortisation of Rs. 6.91 crores (2012 : Rs. 6.41 crores)].
(ii) Development expenditure incurred during the year Rs. Nil (2012 : Rs. 0.04 crores).
(iii) Capitalisation of assets Rs. 0.34 crores (2012 : Rs. 4.12 crores).
36. The net difference in foreign exchange loss debited to the Statement of Profit and Loss is Rs. 6.99 crores (2012 : gain of Rs. 16.31 crores).
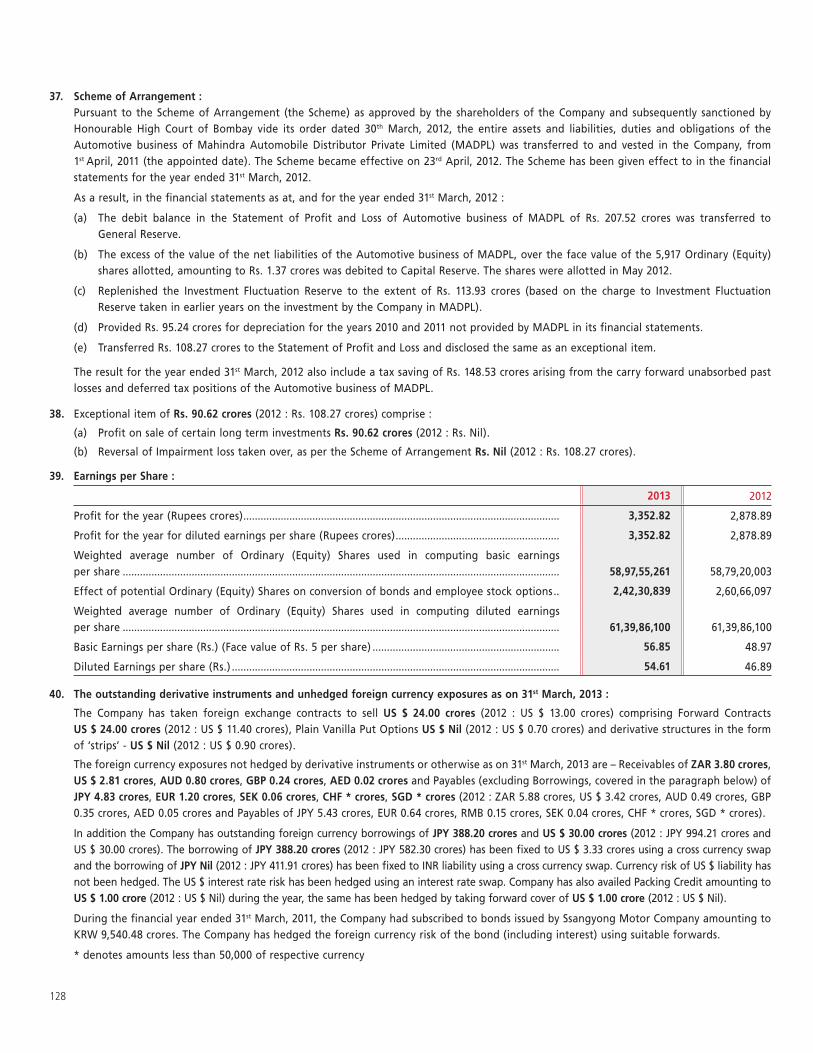
128
37. Scheme of Arrangement : Pursuant to the Scheme of Arrangement (the Scheme) as approved by the shareholders of the Company and subsequently sanctioned by
Honourable High Court of Bombay vide its order dated 30th March, 2012, the entire assets and liabilities, duties and obligations of the Automotive business of Mahindra Automobile Distributor Private Limited (MADPL) was transferred to and vested in the Company, from 1st April, 2011 (the appointed date). The Scheme became effective on 23rd April, 2012. The Scheme has been given effect to in the financial statements for the year ended 31st March, 2012.
As a result, in the financial statements as at, and for the year ended 31st March, 2012 :
(a) The debit balance in the Statement of Profit and Loss of Automotive business of MADPL of Rs. 207.52 crores was transferred to General Reserve.
(b) The excess of the value of the net liabilities of the Automotive business of MADPL, over the face value of the 5,917 Ordinary (Equity) shares allotted, amounting to Rs. 1.37 crores was debited to Capital Reserve. The shares were allotted in May 2012.
(c) Replenished the Investment Fluctuation Reserve to the extent of Rs. 113.93 crores (based on the charge to Investment Fluctuation Reserve taken in earlier years on the investment by the Company in MADPL).
(d) Provided Rs. 95.24 crores for depreciation for the years 2010 and 2011 not provided by MADPL in its financial statements.
(e) Transferred Rs. 108.27 crores to the Statement of Profit and Loss and disclosed the same as an exceptional item.
The result for the year ended 31st March, 2012 also include a tax saving of Rs. 148.53 crores arising from the carry forward unabsorbed past losses and deferred tax positions of the Automotive business of MADPL.
38. Exceptional item of Rs. 90.62 crores (2012 : Rs. 108.27 crores) comprise :
(a) Profit on sale of certain long term investments Rs. 90.62 crores (2012 : Rs. Nil).
(b) Reversal of Impairment loss taken over, as per the Scheme of Arrangement Rs. Nil (2012 : Rs. 108.27 crores).
39. Earnings per Share :
2013 2012
Profit for the year (Rupees crores) .............................................................................................................. 3,352.82 2,878.89
Profit for the year for diluted earnings per share (Rupees crores) ......................................................... 3,352.82 2,878.89
Weighted average number of Ordinary (Equity) Shares used in computing basic earnings per share ........................................................................................................................................................ 58,97,55,261 58,79,20,003
Effect of potential Ordinary (Equity) Shares on conversion of bonds and employee stock options .. 2,42,30,839 2,60,66,097
Weighted average number of Ordinary (Equity) Shares used in computing diluted earnings per share ........................................................................................................................................................ 61,39,86,100 61,39,86,100
Basic Earnings per share (Rs.) (Face value of Rs. 5 per share) ................................................................. 56.85 48.97
Diluted Earnings per share (Rs.) .................................................................................................................. 54.61 46.89
40. The outstanding derivative instruments and unhedged foreign currency exposures as on 31st March, 2013 :
The Company has taken foreign exchange contracts to sell US $ 24.00 crores (2012 : US $ 13.00 crores) comprising Forward Contracts US $ 24.00 crores (2012 : US $ 11.40 crores), Plain Vanilla Put Options US $ Nil (2012 : US $ 0.70 crores) and derivative structures in the form of ‘strips’ - US $ Nil (2012 : US $ 0.90 crores).
The foreign currency exposures not hedged by derivative instruments or otherwise as on 31st March, 2013 are – Receivables of ZAR 3.80 crores, US $ 2.81 crores, AUD 0.80 crores, GBP 0.24 crores, AED 0.02 crores and Payables (excluding Borrowings, covered in the paragraph below) of JPY 4.83 crores, EUR 1.20 crores, SEK 0.06 crores, CHF * crores, SGD * crores (2012 : ZAR 5.88 crores, US $ 3.42 crores, AUD 0.49 crores, GBP 0.35 crores, AED 0.05 crores and Payables of JPY 5.43 crores, EUR 0.64 crores, RMB 0.15 crores, SEK 0.04 crores, CHF * crores, SGD * crores).
In addition the Company has outstanding foreign currency borrowings of JPY 388.20 crores and US $ 30.00 crores (2012 : JPY 994.21 crores and US $ 30.00 crores). The borrowing of JPY 388.20 crores (2012 : JPY 582.30 crores) has been fixed to US $ 3.33 crores using a cross currency swap and the borrowing of JPY Nil (2012 : JPY 411.91 crores) has been fixed to INR liability using a cross currency swap. Currency risk of US $ liability has not been hedged. The US $ interest rate risk has been hedged using an interest rate swap. Company has also availed Packing Credit amounting to US $ 1.00 crore (2012 : US $ Nil) during the year, the same has been hedged by taking forward cover of US $ 1.00 crore (2012 : US $ Nil).
During the financial year ended 31st March, 2011, the Company had subscribed to bonds issued by Ssangyong Motor Company amounting to KRW 9,540.48 crores. The Company has hedged the foreign currency risk of the bond (including interest) using suitable forwards.
* denotes amounts less than 50,000 of respective currency
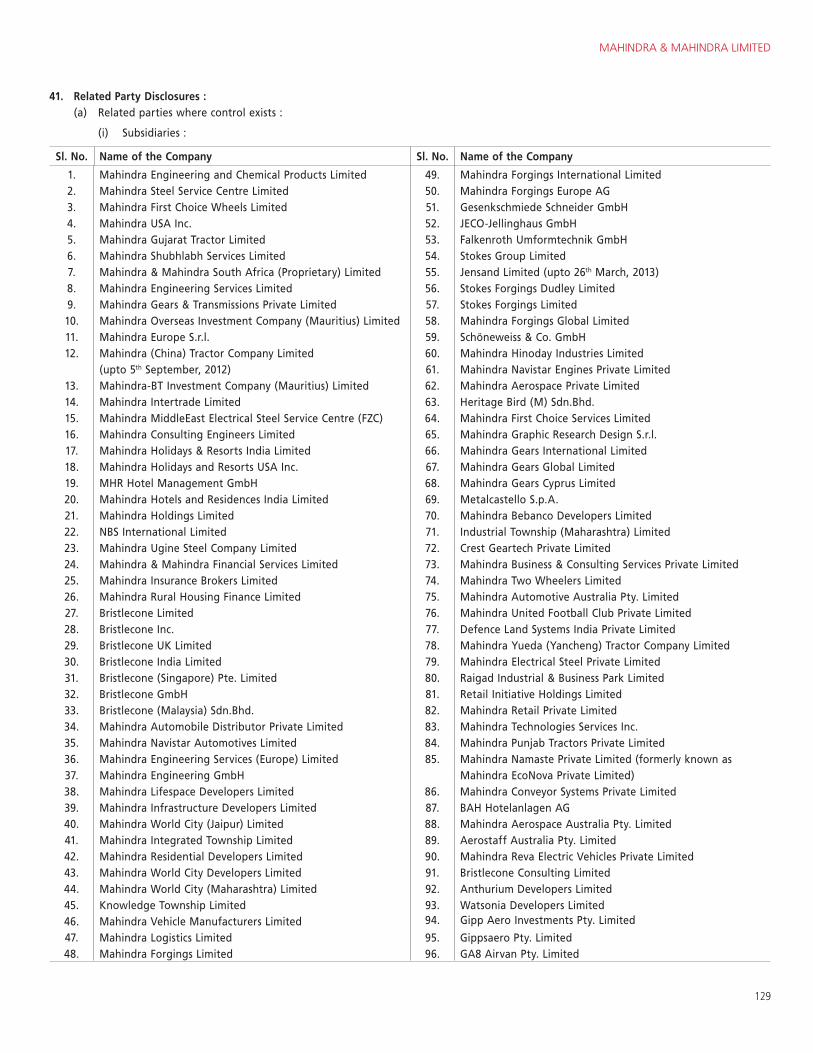
MAHINDRA & MAHINDRA LIMITED
129
41. Related Party Disclosures : (a) Related parties where control exists :
(i) Subsidiaries :
Sl. No. Name of the Company Sl. No. Name of the Company
1. Mahindra Engineering and Chemical Products Limited 49. Mahindra Forgings International Limited 2. Mahindra Steel Service Centre Limited 50. Mahindra Forgings Europe AG 3. Mahindra First Choice Wheels Limited 51. Gesenkschmiede Schneider GmbH4. Mahindra USA Inc. 52. JECO-Jellinghaus GmbH 5. Mahindra Gujarat Tractor Limited 53. Falkenroth Umformtechnik GmbH 6. Mahindra Shubhlabh Services Limited 54. Stokes Group Limited7. Mahindra & Mahindra South Africa (Proprietary) Limited 55. Jensand Limited (upto 26th March, 2013)8. Mahindra Engineering Services Limited 56. Stokes Forgings Dudley Limited 9. Mahindra Gears & Transmissions Private Limited 57. Stokes Forgings Limited 10. Mahindra Overseas Investment Company (Mauritius) Limited 58. Mahindra Forgings Global Limited11. Mahindra Europe S.r.l. 59. Schöneweiss & Co. GmbH12. Mahindra (China) Tractor Company Limited
(upto 5th September, 2012)60. Mahindra Hinoday Industries Limited 61. Mahindra Navistar Engines Private Limited
13. Mahindra-BT Investment Company (Mauritius) Limited 62. Mahindra Aerospace Private Limited 14. Mahindra Intertrade Limited 63. Heritage Bird (M) Sdn.Bhd. 15. Mahindra MiddleEast Electrical Steel Service Centre (FZC) 64. Mahindra First Choice Services Limited16. Mahindra Consulting Engineers Limited 65. Mahindra Graphic Research Design S.r.l.17. Mahindra Holidays & Resorts India Limited 66. Mahindra Gears International Limited18. Mahindra Holidays and Resorts USA Inc. 67. Mahindra Gears Global Limited 19. MHR Hotel Management GmbH 68. Mahindra Gears Cyprus Limited 20. Mahindra Hotels and Residences India Limited 69. Metalcastello S.p.A. 21. Mahindra Holdings Limited 70. Mahindra Bebanco Developers Limited 22. NBS International Limited 71. Industrial Township (Maharashtra) Limited23. Mahindra Ugine Steel Company Limited 72. Crest Geartech Private Limited 24. Mahindra & Mahindra Financial Services Limited 73. Mahindra Business & Consulting Services Private Limited 25. Mahindra Insurance Brokers Limited 74. Mahindra Two Wheelers Limited 26. Mahindra Rural Housing Finance Limited 75. Mahindra Automotive Australia Pty. Limited27. Bristlecone Limited 76. Mahindra United Football Club Private Limited28. Bristlecone Inc. 77. Defence Land Systems India Private Limited 29. Bristlecone UK Limited 78. Mahindra Yueda (Yancheng) Tractor Company Limited 30. Bristlecone India Limited 79. Mahindra Electrical Steel Private Limited31. Bristlecone (Singapore) Pte. Limited 80. Raigad Industrial & Business Park Limited 32. Bristlecone GmbH 81. Retail Initiative Holdings Limited33. Bristlecone (Malaysia) Sdn.Bhd. 82. Mahindra Retail Private Limited 34. Mahindra Automobile Distributor Private Limited 83. Mahindra Technologies Services Inc. 35. Mahindra Navistar Automotives Limited 84. Mahindra Punjab Tractors Private Limited 36. Mahindra Engineering Services (Europe) Limited 85. Mahindra Namaste Private Limited (formerly known as
Mahindra EcoNova Private Limited)37. Mahindra Engineering GmbH 38. Mahindra Lifespace Developers Limited 86. Mahindra Conveyor Systems Private Limited 39. Mahindra Infrastructure Developers Limited 87. BAH Hotelanlagen AG 40. Mahindra World City (Jaipur) Limited 88. Mahindra Aerospace Australia Pty. Limited41. Mahindra Integrated Township Limited 89. Aerostaff Australia Pty. Limited42. Mahindra Residential Developers Limited 90. Mahindra Reva Electric Vehicles Private Limited43. Mahindra World City Developers Limited 91. Bristlecone Consulting Limited44. Mahindra World City (Maharashtra) Limited 92. Anthurium Developers Limited 45. Knowledge Township Limited 93. Watsonia Developers Limited 46. Mahindra Vehicle Manufacturers Limited 94. Gipp Aero Investments Pty. Limited
47. Mahindra Logistics Limited 95. Gippsaero Pty. Limited 48. Mahindra Forgings Limited 96. GA8 Airvan Pty. Limited
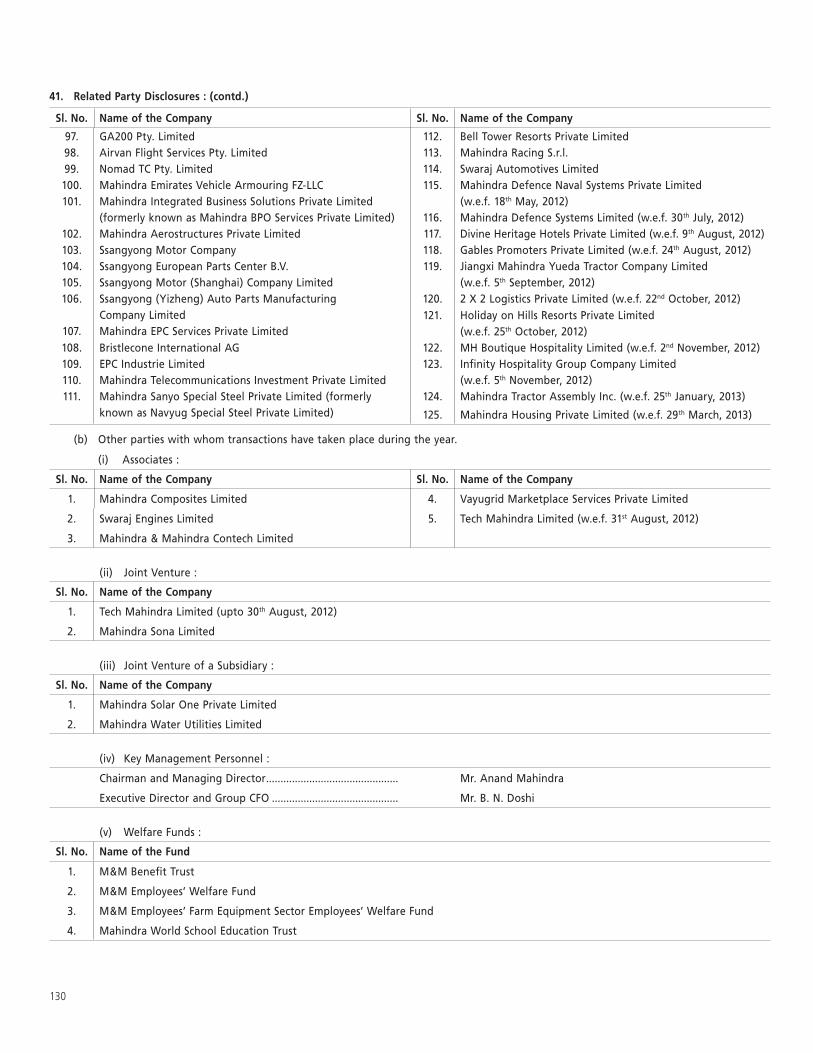
130
Sl. No. Name of the Company Sl. No. Name of the Company
97. GA200 Pty. Limited 112. Bell Tower Resorts Private Limited98. Airvan Flight Services Pty. Limited 113. Mahindra Racing S.r.l.99. Nomad TC Pty. Limited 114. Swaraj Automotives Limited
100. Mahindra Emirates Vehicle Armouring FZ-LLC 115. Mahindra Defence Naval Systems Private Limited (w.e.f. 18th May, 2012) 101. Mahindra Integrated Business Solutions Private Limited
(formerly known as Mahindra BPO Services Private Limited) 116. Mahindra Defence Systems Limited (w.e.f. 30th July, 2012)102. Mahindra Aerostructures Private Limited 117. Divine Heritage Hotels Private Limited (w.e.f. 9th August, 2012)103. Ssangyong Motor Company 118. Gables Promoters Private Limited (w.e.f. 24th August, 2012)104. Ssangyong European Parts Center B.V. 119. Jiangxi Mahindra Yueda Tractor Company Limited
(w.e.f. 5th September, 2012)105. Ssangyong Motor (Shanghai) Company Limited 106. Ssangyong (Yizheng) Auto Parts Manufacturing
Company Limited120. 2 X 2 Logistics Private Limited (w.e.f. 22nd October, 2012)121. Holiday on Hills Resorts Private Limited
(w.e.f. 25th October, 2012)107. Mahindra EPC Services Private Limited108. Bristlecone International AG 122. MH Boutique Hospitality Limited (w.e.f. 2nd November, 2012)109. EPC Industrie Limited 123. Infinity Hospitality Group Company Limited
(w.e.f. 5th November, 2012)110. Mahindra Telecommunications Investment Private Limited111. Mahindra Sanyo Special Steel Private Limited (formerly
known as Navyug Special Steel Private Limited)124. Mahindra Tractor Assembly Inc. (w.e.f. 25th January, 2013)
125. Mahindra Housing Private Limited (w.e.f. 29th March, 2013)
(b) Other parties with whom transactions have taken place during the year.
(i) Associates :
Sl. No. Name of the Company Sl. No. Name of the Company
1. Mahindra Composites Limited 4. Vayugrid Marketplace Services Private Limited
2. Swaraj Engines Limited 5. Tech Mahindra Limited (w.e.f. 31st August, 2012)
3. Mahindra & Mahindra Contech Limited
(ii) Joint Venture :
Sl. No. Name of the Company
1. Tech Mahindra Limited (upto 30th August, 2012)
2. Mahindra Sona Limited
(iii) Joint Venture of a Subsidiary :
Sl. No. Name of the Company
1. Mahindra Solar One Private Limited
2. Mahindra Water Utilities Limited
(iv) Key Management Personnel :
Chairman and Managing Director .............................................. Mr. Anand Mahindra
Executive Director and Group CFO ............................................ Mr. B. N. Doshi
(v) Welfare Funds :
Sl. No. Name of the Fund
1. M&M Benefit Trust
2. M&M Employees’ Welfare Fund
3. M&M Employees’ Farm Equipment Sector Employees’ Welfare Fund
4. Mahindra World School Education Trust
41. Related Party Disclosures : (contd.)
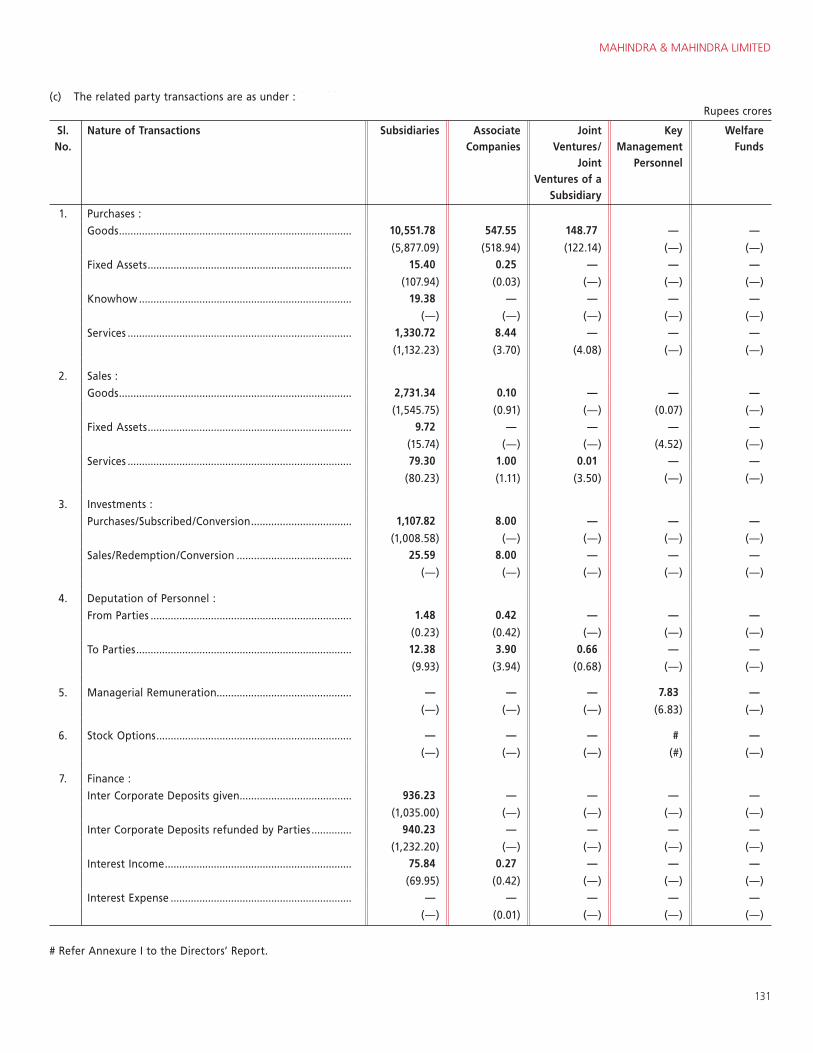
MAHINDRA & MAHINDRA LIMITED
131
(c) The related party transactions are as under : (contd.)Rupees crores
Sl. No.
Nature of Transactions Subsidiaries Associate Companies
Joint Ventures/
Joint Ventures of a
Subsidiary
Key Management
Personnel
Welfare Funds
1. Purchases :
Goods ................................................................................. 10,551.78 547.55 148.77 — —
(5,877.09) (518.94) (122.14) (—) (—)
Fixed Assets ....................................................................... 15.40 0.25 — — —
(107.94) (0.03) (—) (—) (—)
Knowhow .......................................................................... 19.38 — — — —
(—) (—) (—) (—) (—)
Services .............................................................................. 1,330.72 8.44 — — —
(1,132.23) (3.70) (4.08) (—) (—)
2. Sales :
Goods ................................................................................. 2,731.34 0.10 — — —
(1,545.75) (0.91) (—) (0.07) (—)
Fixed Assets ....................................................................... 9.72 — — — —
(15.74) (—) (—) (4.52) (—)
Services .............................................................................. 79.30 1.00 0.01 — —
(80.23) (1.11) (3.50) (—) (—)
3. Investments :
Purchases/Subscribed/Conversion ................................... 1,107.82 8.00 — — —
(1,008.58) (—) (—) (—) (—)
Sales/Redemption/Conversion ........................................ 25.59 8.00 — — —
(—) (—) (—) (—) (—)
4. Deputation of Personnel :
From Parties ...................................................................... 1.48 0.42 — — —
(0.23) (0.42) (—) (—) (—)
To Parties ........................................................................... 12.38 3.90 0.66 — —
(9.93) (3.94) (0.68) (—) (—)
5. Managerial Remuneration............................................... — — — 7.83 —
(—) (—) (—) (6.83) (—)
6. Stock Options .................................................................... — — — # —
(—) (—) (—) (#) (—)
7. Finance :
Inter Corporate Deposits given....................................... 936.23 — — — —
(1,035.00) (—) (—) (—) (—)
Inter Corporate Deposits refunded by Parties .............. 940.23 — — — —
(1,232.20) (—) (—) (—) (—)
Interest Income ................................................................. 75.84 0.27 — — —
(69.95) (0.42) (—) (—) (—)
Interest Expense ............................................................... — — — — —
(—) (0.01) (—) (—) (—)
# Refer Annexure I to the Directors’ Report.
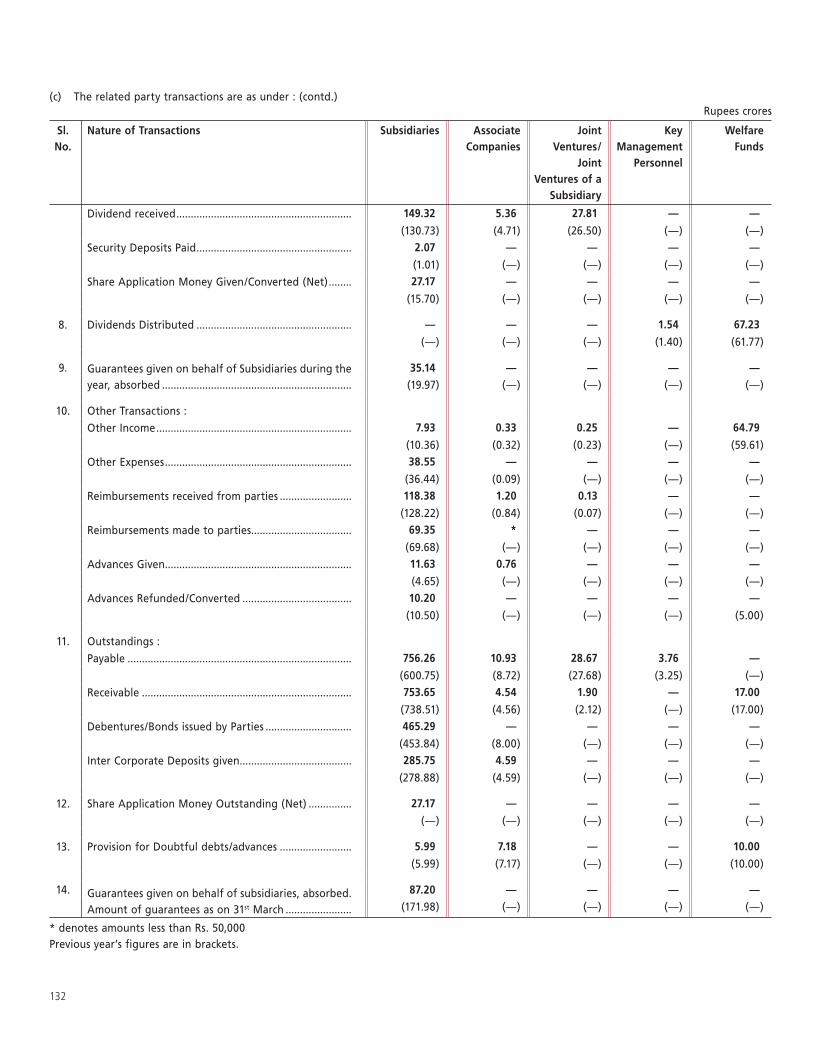
132
(c) The related party transactions are as under : (contd.)Rupees crores
Sl. No.
Nature of Transactions Subsidiaries Associate Companies
Joint Ventures/
Joint Ventures of a
Subsidiary
Key Management
Personnel
Welfare Funds
Dividend received ............................................................. 149.32 5.36 27.81 — —
(130.73) (4.71) (26.50) (—) (—)
Security Deposits Paid ...................................................... 2.07 — — — —
(1.01) (—) (—) (—) (—)
Share Application Money Given/Converted (Net) ........ 27.17 — — — —
(15.70) (—) (—) (—) (—)
8. Dividends Distributed ...................................................... — — — 1.54 67.23
(—) (—) (—) (1.40) (61.77)
9. Guarantees given on behalf of Subsidiaries during the year, absorbed ..................................................................
35.14 — — — —
(19.97) (—) (—) (—) (—)
10. Other Transactions :
Other Income .................................................................... 7.93 0.33 0.25 — 64.79
(10.36) (0.32) (0.23) (—) (59.61)
Other Expenses ................................................................. 38.55 — — — —
(36.44) (0.09) (—) (—) (—)
Reimbursements received from parties ......................... 118.38 1.20 0.13 — —
(128.22) (0.84) (0.07) (—) (—)
Reimbursements made to parties................................... 69.35 * — — —
(69.68) (—) (—) (—) (—)
Advances Given ................................................................. 11.63 0.76 — — —
(4.65) (—) (—) (—) (—)
Advances Refunded/Converted ...................................... 10.20 — — — —
(10.50) (—) (—) (—) (5.00)
11. Outstandings :
Payable .............................................................................. 756.26 10.93 28.67 3.76 —
(600.75) (8.72) (27.68) (3.25) (—)
Receivable ......................................................................... 753.65 4.54 1.90 — 17.00
(738.51) (4.56) (2.12) (—) (17.00)
Debentures/Bonds issued by Parties .............................. 465.29 — — — —
(453.84) (8.00) (—) (—) (—)
Inter Corporate Deposits given....................................... 285.75 4.59 — — —
(278.88) (4.59) (—) (—) (—)
12. Share Application Money Outstanding (Net) ............... 27.17 — — — —
(—) (—) (—) (—) (—)
13. Provision for Doubtful debts/advances ......................... 5.99 7.18 — — 10.00
(5.99) (7.17) (—) (—) (10.00)
14. Guarantees given on behalf of subsidiaries, absorbed. Amount of guarantees as on 31st March .......................
87.20 — — — —
(171.98) (—) (—) (—) (—)
* denotes amounts less than Rs. 50,000Previous year’s figures are in brackets.
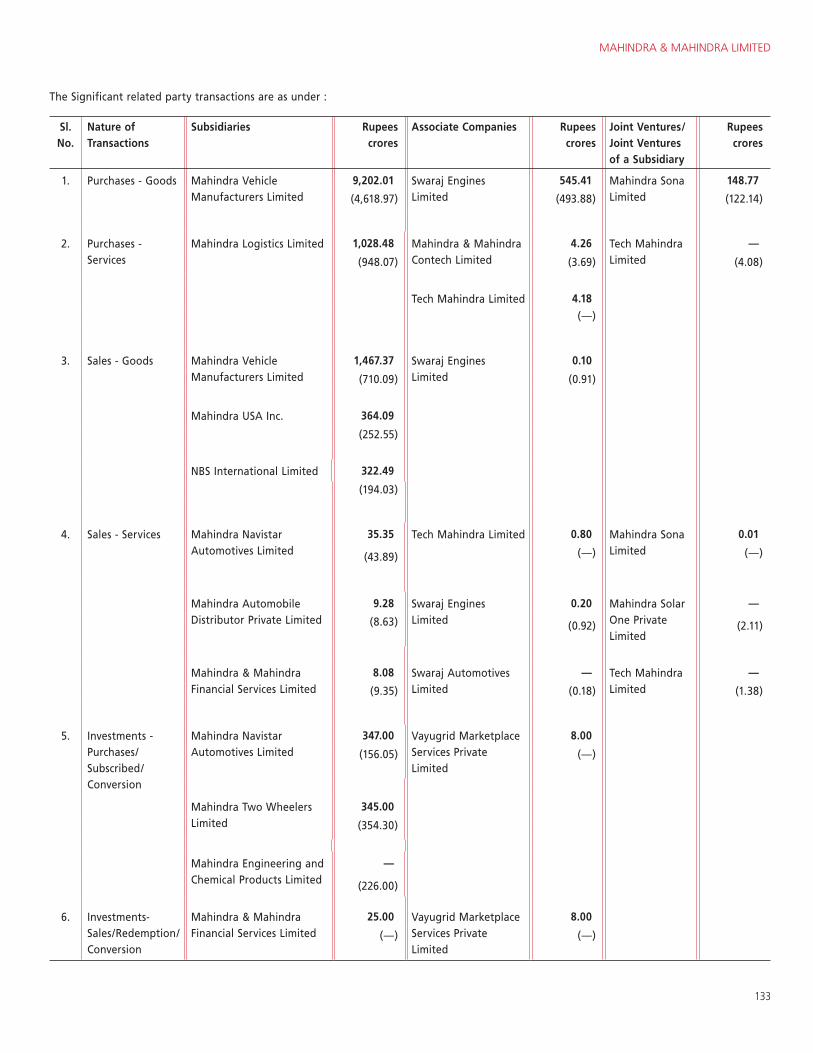
MAHINDRA & MAHINDRA LIMITED
133
The Significant related party transactions are as under : (contd.)
Sl. No.
Nature of Transactions
Subsidiaries Rupees crores
Associate Companies Rupees crores
Joint Ventures/Joint Ventures of a Subsidiary
Rupees crores
1. Purchases - Goods Mahindra Vehicle Manufacturers Limited
9,202.01 Swaraj Engines Limited
545.41 Mahindra Sona Limited
148.77
(4,618.97) (493.88) (122.14)
2. Purchases - Services
Mahindra Logistics Limited 1,028.48 Mahindra & Mahindra Contech Limited
4.26 Tech Mahindra Limited
—
(948.07) (3.69) (4.08)
Tech Mahindra Limited 4.18
(—)
3. Sales - Goods Mahindra Vehicle Manufacturers Limited
1,467.37 Swaraj Engines Limited
0.10
(710.09) (0.91)
Mahindra USA Inc. 364.09
(252.55)
NBS International Limited 322.49
(194.03)
4. Sales - Services Mahindra Navistar Automotives Limited
35.35 Tech Mahindra Limited 0.80 Mahindra Sona Limited
0.01
(43.89) (—) (—)
Mahindra Automobile Distributor Private Limited
9.28 Swaraj Engines Limited
0.20 Mahindra Solar One Private Limited
—
(8.63) (0.92) (2.11)
Mahindra & Mahindra Financial Services Limited
8.08 Swaraj Automotives Limited
— Tech Mahindra Limited
—
(9.35) (0.18) (1.38)
5. Investments - Purchases/ Subscribed/ Conversion
Mahindra Navistar Automotives Limited
347.00 Vayugrid Marketplace Services Private Limited
8.00
(156.05) (—)
Mahindra Two Wheelers Limited
345.00
(354.30)
Mahindra Engineering and Chemical Products Limited
—
(226.00)
6. Investments- Sales/Redemption/ Conversion
Mahindra & Mahindra Financial Services Limited
25.00 Vayugrid Marketplace Services Private Limited
8.00
(—) (—)
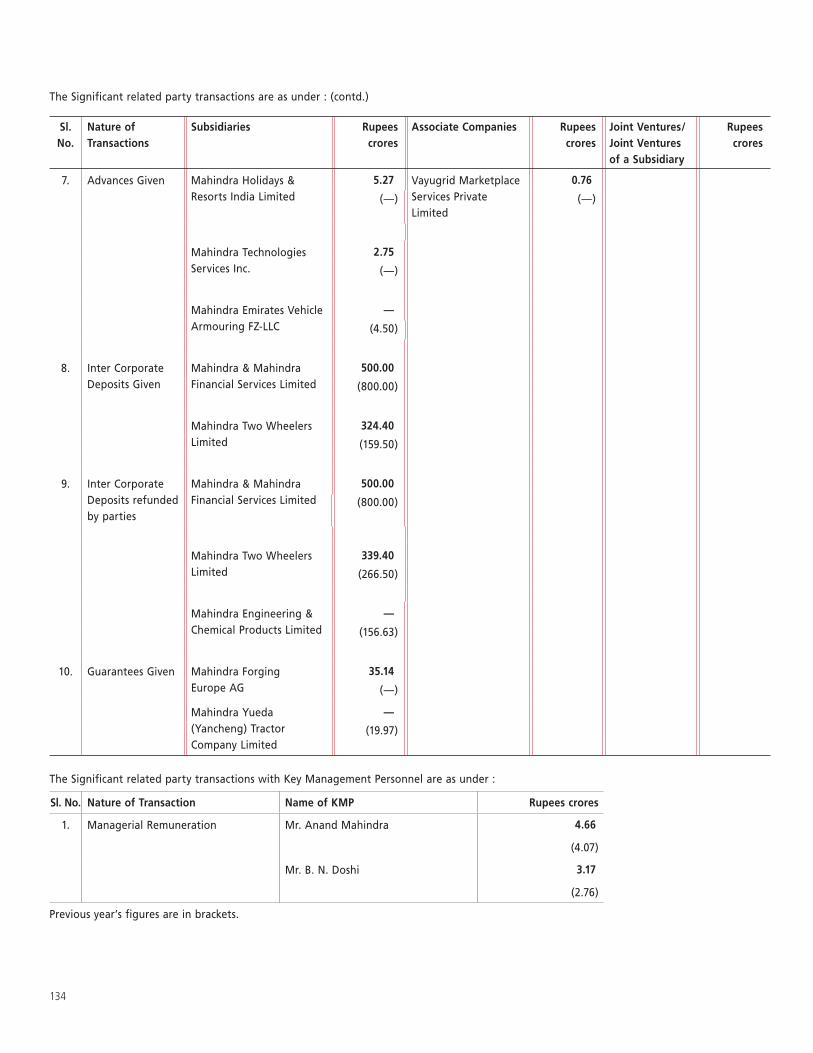
134
The Significant related party transactions are as under : (contd.)
Sl. No.
Nature of Transactions
Subsidiaries Rupees crores
Associate Companies Rupees crores
Joint Ventures/Joint Ventures of a Subsidiary
Rupees crores
7. Advances Given Mahindra Holidays & Resorts India Limited
5.27 Vayugrid Marketplace Services Private Limited
0.76
(—) (—)
Mahindra Technologies Services Inc.
2.75
(—)
Mahindra Emirates Vehicle Armouring FZ-LLC
—
(4.50)
8. Inter Corporate Deposits Given
Mahindra & Mahindra Financial Services Limited
500.00
(800.00)
Mahindra Two Wheelers Limited
324.40
(159.50)
9. Inter Corporate Deposits refunded by parties
Mahindra & Mahindra Financial Services Limited
500.00
(800.00)
Mahindra Two Wheelers Limited
339.40
(266.50)
Mahindra Engineering & Chemical Products Limited
—
(156.63)
10. Guarantees Given Mahindra Forging Europe AG
35.14
(—)
Mahindra Yueda (Yancheng) Tractor Company Limited
—
(19.97)
The Significant related party transactions with Key Management Personnel are as under :
Sl. No. Nature of Transaction Name of KMP Rupees crores
1. Managerial Remuneration Mr. Anand Mahindra 4.66
(4.07)
Mr. B. N. Doshi 3.17
(2.76)
Previous year’s figures are in brackets.
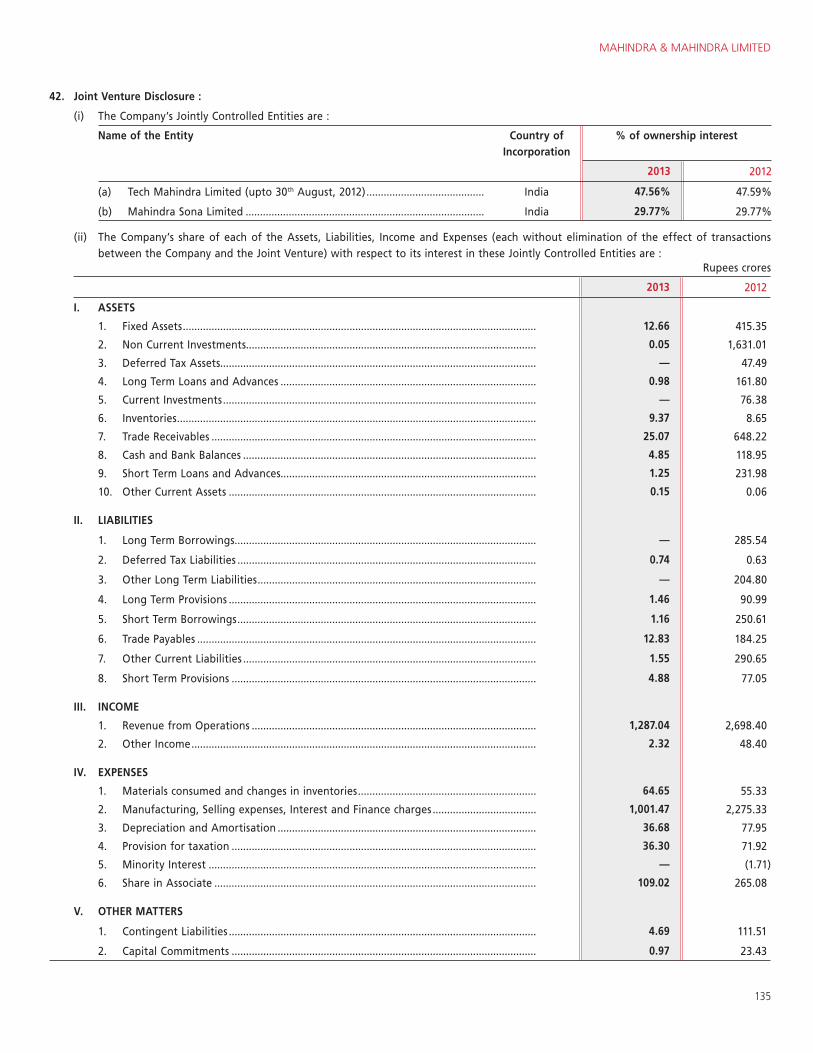
MAHINDRA & MAHINDRA LIMITED
135
42. Joint Venture Disclosure :
(i) The Company’s Jointly Controlled Entities are :
Name of the Entity Country of Incorporation
% of ownership interest
2013 2012
(a) Tech Mahindra Limited (upto 30th August, 2012) ......................................... India 47.56% 47.59%
(b) Mahindra Sona Limited ................................................................................... India 29.77% 29.77%
(ii) The Company’s share of each of the Assets, Liabilities, Income and Expenses (each without elimination of the effect of transactions between the Company and the Joint Venture) with respect to its interest in these Jointly Controlled Entities are :
Rupees crores
2013 2012
I. ASSETS
1. Fixed Assets ........................................................................................................................... 12.66 415.35
2. Non Current Investments..................................................................................................... 0.05 1,631.01
3. Deferred Tax Assets.............................................................................................................. — 47.49
4. Long Term Loans and Advances ......................................................................................... 0.98 161.80
5. Current Investments ............................................................................................................. — 76.38
6. Inventories ............................................................................................................................. 9.37 8.65
7. Trade Receivables ................................................................................................................. 25.07 648.22
8. Cash and Bank Balances ...................................................................................................... 4.85 118.95
9. Short Term Loans and Advances......................................................................................... 1.25 231.98
10. Other Current Assets ........................................................................................................... 0.15 0.06
II. LIABILITIES
1. Long Term Borrowings ......................................................................................................... — 285.54
2. Deferred Tax Liabilities ........................................................................................................ 0.74 0.63
3. Other Long Term Liabilities ................................................................................................. — 204.80
4. Long Term Provisions ........................................................................................................... 1.46 90.99
5. Short Term Borrowings ........................................................................................................ 1.16 250.61
6. Trade Payables ...................................................................................................................... 12.83 184.25
7. Other Current Liabilities ...................................................................................................... 1.55 290.65
8. Short Term Provisions .......................................................................................................... 4.88 77.05
III. INCOME
1. Revenue from Operations ................................................................................................... 1,287.04 2,698.40
2. Other Income ........................................................................................................................ 2.32 48.40
IV. EXPENSES
1. Materials consumed and changes in inventories .............................................................. 64.65 55.33
2. Manufacturing, Selling expenses, Interest and Finance charges .................................... 1,001.47 2,275.33
3. Depreciation and Amortisation .......................................................................................... 36.68 77.95
4. Provision for taxation .......................................................................................................... 36.30 71.92
5. Minority Interest .................................................................................................................. — (1.71)
6. Share in Associate ................................................................................................................ 109.02 265.08
V. OTHER MATTERS
1. Contingent Liabilities ........................................................................................................... 4.69 111.51
2. Capital Commitments .......................................................................................................... 0.97 23.43
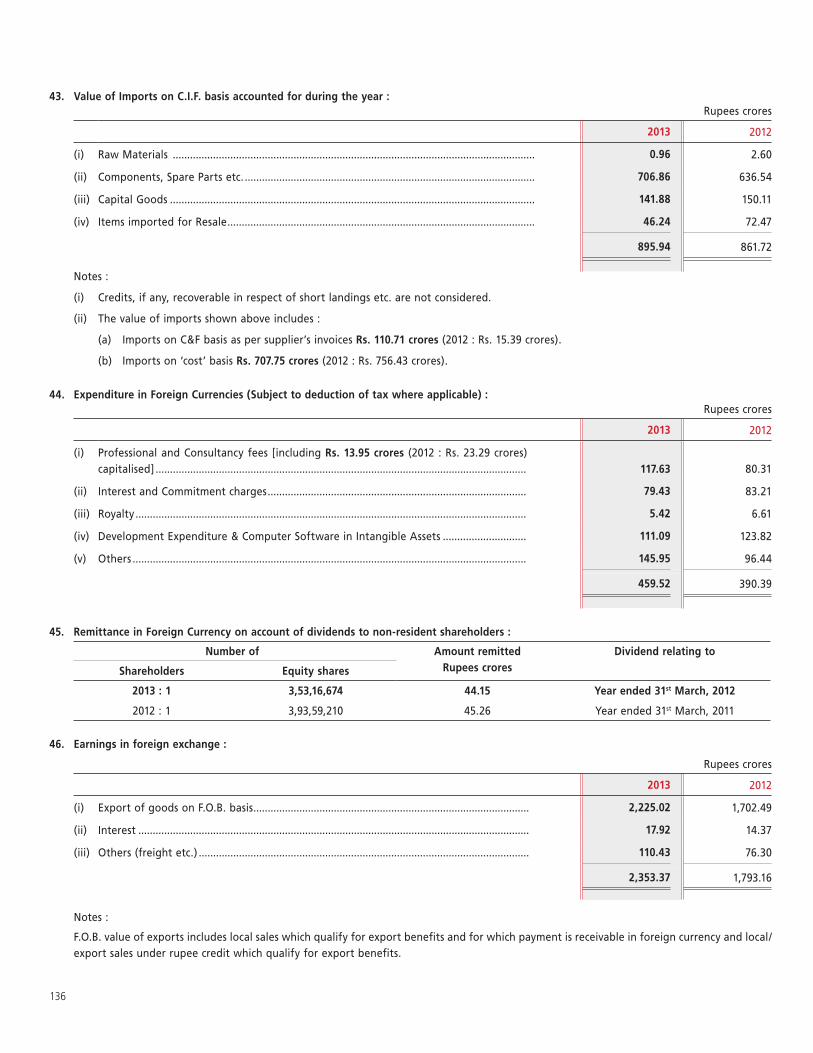
136
43. Value of Imports on C.I.F. basis accounted for during the year :Rupees crores
2013 2012
(i) Raw Materials .............................................................................................................................. 0.96 2.60
(ii) Components, Spare Parts etc. ..................................................................................................... 706.86 636.54
(iii) Capital Goods ............................................................................................................................... 141.88 150.11
(iv) Items imported for Resale ........................................................................................................... 46.24 72.47
895.94 861.72
Notes :
(i) Credits, if any, recoverable in respect of short landings etc. are not considered.
(ii) The value of imports shown above includes :
(a) Imports on C&F basis as per supplier’s invoices Rs. 110.71 crores (2012 : Rs. 15.39 crores).
(b) Imports on ‘cost’ basis Rs. 707.75 crores (2012 : Rs. 756.43 crores).
44. Expenditure in Foreign Currencies (Subject to deduction of tax where applicable) :Rupees crores
2013 2012
(i) Professional and Consultancy fees [including Rs. 13.95 crores (2012 : Rs. 23.29 crores) capitalised] ................................................................................................................................. 117.63 80.31
(ii) Interest and Commitment charges .......................................................................................... 79.43 83.21
(iii) Royalty ........................................................................................................................................ 5.42 6.61
(iv) Development Expenditure & Computer Software in Intangible Assets ............................. 111.09 123.82
(v) Others ......................................................................................................................................... 145.95 96.44
459.52 390.39
45. Remittance in Foreign Currency on account of dividends to non-resident shareholders :
Number of Amount remitted Rupees crores
Dividend relating to
Shareholders Equity shares
2013 : 1 3,53,16,674 44.15 Year ended 31st March, 2012
2012 : 1 3,93,59,210 45.26 Year ended 31st March, 2011
46. Earnings in foreign exchange :
Rupees crores
2013 2012
(i) Export of goods on F.O.B. basis ................................................................................................ 2,225.02 1,702.49
(ii) Interest ........................................................................................................................................ 17.92 14.37
(iii) Others (freight etc.) ................................................................................................................... 110.43 76.30
2,353.37 1,793.16
Notes :
F.O.B. value of exports includes local sales which qualify for export benefits and for which payment is receivable in foreign currency and local/export sales under rupee credit which qualify for export benefits.
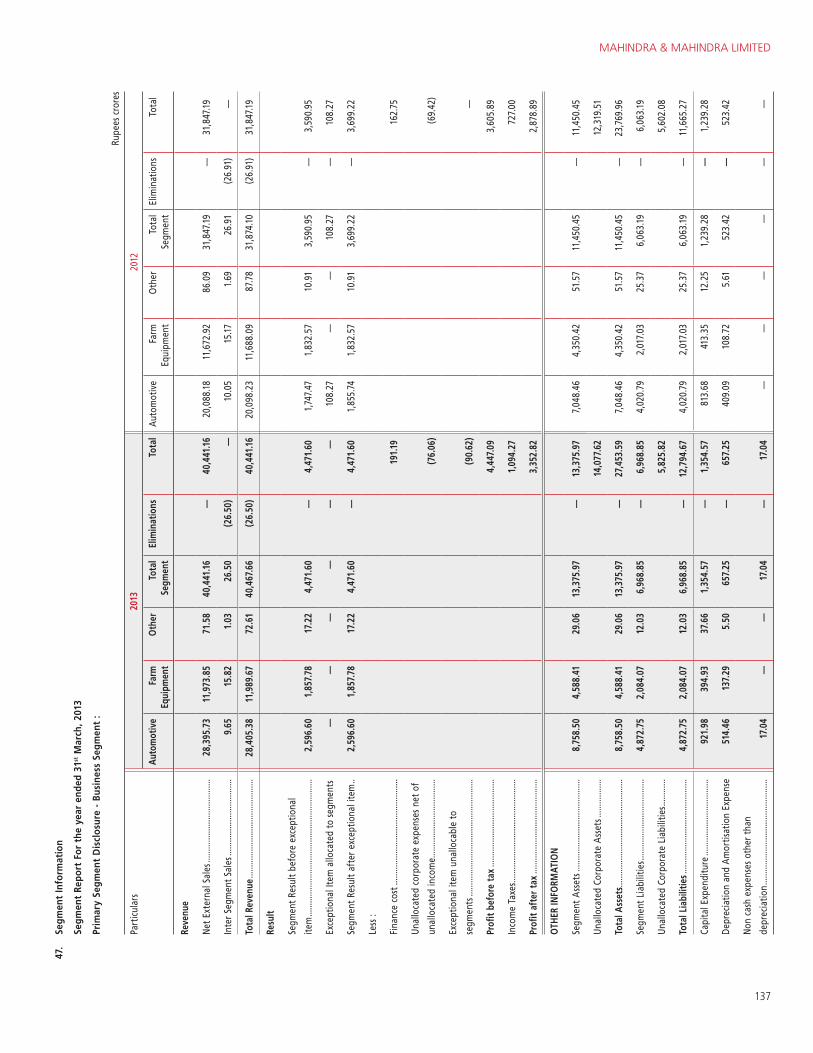
MAHINDRA & MAHINDRA LIMITED
137
47.
Segm
ent
Info
rmat
ion
Segm
ent
Repo
rt F
or t
he y
ear
ende
d 31
st M
arch
, 201
3
Prim
ary
Segm
ent
Dis
clos
ure
- Bu
sine
ss S
egm
ent
:
Rupe
es c
rore
s
Part
icul
ars
2013
2012
Auto
mot
ive
Farm
Eq
uipm
ent
Oth
erTo
tal
Segm
ent
Elim
inat
ions
Tota
l Au
tom
otiv
eFa
rm
Equi
pmen
t O
ther
Tota
l Se
gmen
tEl
imin
atio
nsTo
tal
Reve
nue
Net
Ext
erna
l Sal
es ...
......
......
......
......
......
....
28,
395.
73
11,
973.
85
71.
58
40,
441.
16
—
40,
441.
16
20,
088.
18
11,
672.
92
86.
09
31,
847.1
9 —
3
1,84
7.19
Inte
r Seg
men
t Sal
es ...
......
......
......
......
......
. 9
.65
15.
82
1.0
3 2
6.50
(2
6.50
) —
1
0.05
1
5.17
1
.69
26.
91
(26.
91)
—
Tota
l Rev
enue
......
......
......
......
......
......
......
.. 2
8,40
5.38
1
1,98
9.67
7
2.61
4
0,46
7.66
(2
6.50
) 4
0,44
1.16
2
0,09
8.23
1
1,68
8.09
8
7.78
3
1,87
4.10
(2
6.91
) 3
1,84
7.19
Resu
lt
Segm
ent R
esul
t bef
ore
exce
ptio
nal
item
......
......
......
......
......
......
......
......
......
......
. 2
,596
.60
1,8
57.7
8 1
7.22
4
,471
.60
—
4,4
71.6
0 1
,747
.47
1,8
32.5
7 1
0.91
3
,590
.95
—
3,5
90.9
5
Exce
ptio
nal I
tem
allo
cate
d to
seg
men
ts
—
—
—
—
—
—
108
.27
—
—
108
.27
—
108
.27
Segm
ent R
esul
t aft
er e
xcep
tiona
l ite
m ..
2,5
96.6
0 1
,857
.78
17.
22
4,4
71.6
0 —
4
,471
.60
1,8
55.7
4 1
,832
.57
10.
91
3,6
99.2
2 —
3
,699
.22
Less
:
Fina
nce
cost
.....
......
......
......
......
......
......
......
191
.19
162
.75
Unal
loca
ted
corp
orat
e ex
pens
es n
et o
f
unal
loca
ted
inco
me.
......
......
......
......
......
....
(76.
06)
(69.
42)
Exce
ptio
nal i
tem
una
lloca
ble
to
segm
ents
.....
......
......
......
......
......
......
......
.....
(90.
62)
—
Profi
t bef
ore
tax
......
......
......
......
......
......
... 4
,447
.09
3,6
05.8
9
Inco
me
Taxe
s .....
......
......
......
......
......
......
.....
1,0
94.2
7 7
27.0
0
Profi
t aft
er t
ax ..
......
......
......
......
......
......
....
3,3
52.8
2 2
,878
.89
OTH
ER IN
FORM
ATIO
N
Segm
ent A
sset
s ....
......
......
......
......
......
......
. 8
,758
.50
4,5
88.4
1 2
9.06
1
3,37
5.97
—
1
3,37
5.97
7
,048
.46
4,3
50.4
2 5
1.57
1
1,45
0.45
—
1
1,45
0.45
Unal
loca
ted
Corp
orat
e A
sset
s ....
......
......
. 1
4,07
7.62
1
2,31
9.51
Tota
l Ass
ets..
......
......
......
......
......
......
......
....
8,7
58.5
0 4
,588
.41
29.
06
13,
375.
97
—
27,
453.
59
7,0
48.4
6 4
,350
.42
51.
57
11,
450.
45
—
23,
769.
96
Segm
ent L
iabi
litie
s ....
......
......
......
......
......
.. 4
,872
.75
2,0
84.0
7 1
2.03
6
,968
.85
—
6,9
68.8
5 4
,020
.79
2,0
17.0
3 2
5.37
6
,063
.19
—
6,0
63.1
9
Unal
loca
ted
Corp
orat
e Li
abili
ties ..
......
....
5,8
25.8
2 5
,602
.08
Tota
l Lia
bilit
ies .
......
......
......
......
......
......
.....
4,8
72.7
5 2
,084
.07
12.
03
6,9
68.8
5 —
1
2,79
4.67
4
,020
.79
2,0
17.0
3 2
5.37
6
,063
.19
—
11,
665.
27
Capi
tal E
xpen
ditu
re ...
......
......
......
......
......
. 9
21.9
8 3
94.9
3 3
7.66
1
,354
.57
— 1
,354
.57
813
.68
413
.35
12.
25
1,2
39.2
8 —
1,2
39.2
8
Dep
recia
tion
and
Am
ortis
atio
n Ex
pens
e 5
14.4
6 1
37.2
9 5
.50
657
.25
— 6
57.2
5 4
09.0
9 1
08.7
2 5
.61
523
.42
— 5
23.4
2
Non
cas
h ex
pens
es o
ther
tha
n
depr
ecia
tion .
......
......
......
......
......
......
......
....
17.
04
—
—
17.
04
—
17.
04
—
—
—
—
—
—
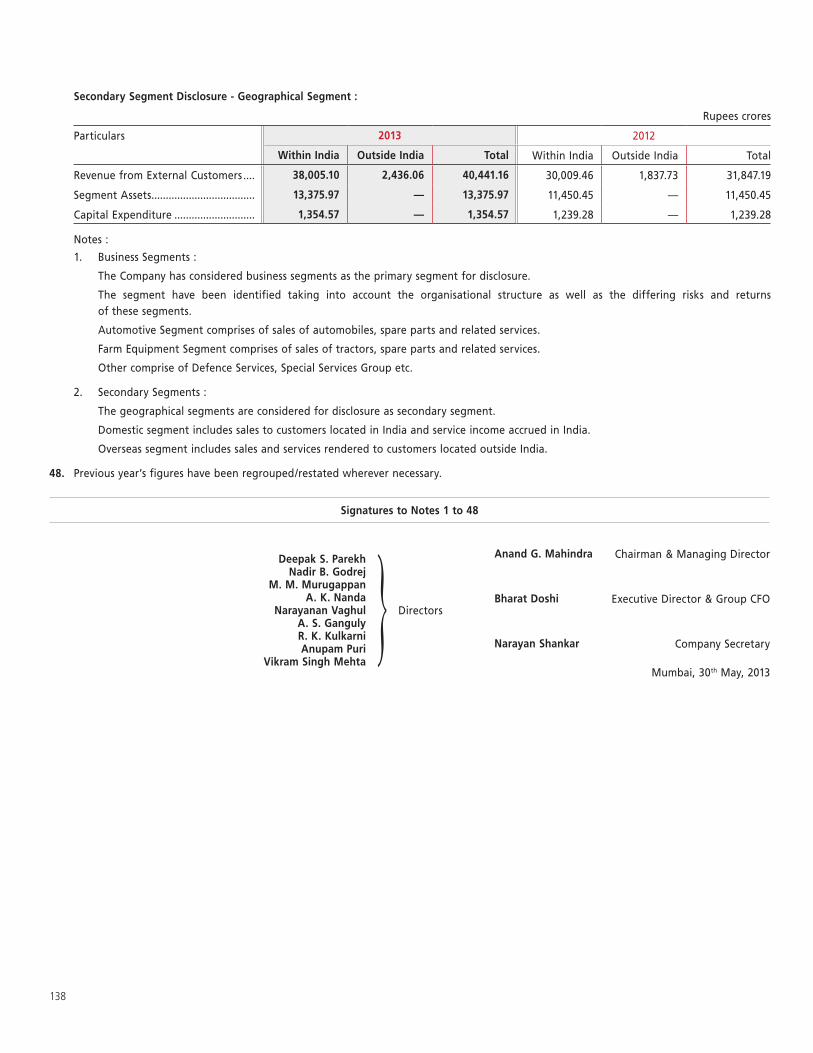
138
Secondary Segment Disclosure - Geographical Segment :
Rupees crores
Particulars 2013 2012
Within India Outside India Total Within India Outside India Total
Revenue from External Customers .... 38,005.10 2,436.06 40,441.16 30,009.46 1,837.73 31,847.19
Segment Assets .................................... 13,375.97 — 13,375.97 11,450.45 — 11,450.45
Capital Expenditure ............................ 1,354.57 — 1,354.57 1,239.28 — 1,239.28
Notes :
1. Business Segments :
The Company has considered business segments as the primary segment for disclosure.
The segment have been identified taking into account the organisational structure as well as the differing risks and returns of these segments.
Automotive Segment comprises of sales of automobiles, spare parts and related services.
Farm Equipment Segment comprises of sales of tractors, spare parts and related services.
Other comprise of Defence Services, Special Services Group etc.
2. Secondary Segments :
The geographical segments are considered for disclosure as secondary segment.
Domestic segment includes sales to customers located in India and service income accrued in India.
Overseas segment includes sales and services rendered to customers located outside India.
48. Previous year’s figures have been regrouped/restated wherever necessary.
Signatures to Notes 1 to 48
Deepak S. ParekhNadir B. Godrej
M. M. MurugappanA. K. Nanda
Narayanan Vaghul A. S. GangulyR. K. KulkarniAnupam Puri
Vikram Singh Mehta
Directors
Anand G. Mahindra Chairman & Managing Director
Bharat Doshi Executive Director & Group CFO
Narayan Shankar Company Secretary
Mumbai, 30th May, 2013
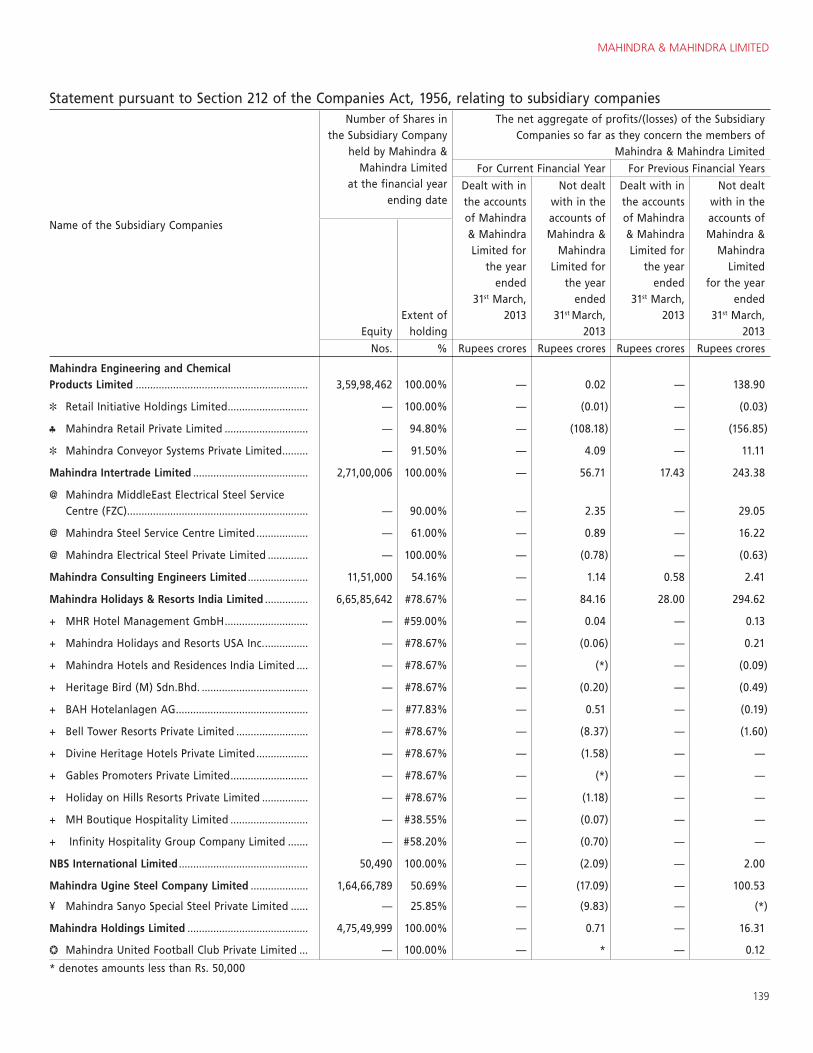
MAHINDRA & MAHINDRA LIMITED
139
Statement pursuant to Section 212 of the Companies Act, 1956, relating to subsidiary companies
Name of the Subsidiary Companies
Number of Shares in the Subsidiary Company
held by Mahindra & Mahindra Limited
at the financial year ending date
The net aggregate of profits/(losses) of the Subsidiary Companies so far as they concern the members of
Mahindra & Mahindra Limited
For Current Financial Year For Previous Financial Years
Dealt with in the accounts of Mahindra & Mahindra Limited for
the year ended
31st March, 2013
Not dealt with in the accounts of Mahindra &
Mahindra Limited for
the year ended
31st March, 2013
Dealt with in the accounts of Mahindra & Mahindra Limited for
the year ended
31st March, 2013
Not dealt with in the accounts of Mahindra &
Mahindra Limited
for the year ended
31st March, 2013Equity
Extent of holding
Nos. % Rupees crores Rupees crores Rupees crores Rupees crores
Mahindra Engineering and Chemical Products Limited ............................................................ 3,59,98,462 100.00% — 0.02 — 138.90
Retail Initiative Holdings Limited ............................ — 100.00% — (0.01) — (0.03)
Mahindra Retail Private Limited ............................. — 94.80% — (108.18) — (156.85)
Mahindra Conveyor Systems Private Limited ......... — 91.50% — 4.09 — 11.11
Mahindra Intertrade Limited ........................................ 2,71,00,006 100.00% — 56.71 17.43 243.38
@ Mahindra MiddleEast Electrical Steel Service Centre (FZC) ............................................................... — 90.00% — 2.35 — 29.05
@ Mahindra Steel Service Centre Limited .................. — 61.00% — 0.89 — 16.22
@ Mahindra Electrical Steel Private Limited .............. — 100.00% — (0.78) — (0.63)
Mahindra Consulting Engineers Limited ..................... 11,51,000 54.16% — 1.14 0.58 2.41
Mahindra Holidays & Resorts India Limited ............... 6,65,85,642 #78.67% — 84.16 28.00 294.62
+ MHR Hotel Management GmbH ............................. — #59.00% — 0.04 — 0.13
+ Mahindra Holidays and Resorts USA Inc. ............... — #78.67% — (0.06) — 0.21
+ Mahindra Hotels and Residences India Limited .... — #78.67% — (*) — (0.09)
+ Heritage Bird (M) Sdn.Bhd. ..................................... — #78.67% — (0.20) — (0.49)
+ BAH Hotelanlagen AG .............................................. — #77.83% — 0.51 — (0.19)
+ Bell Tower Resorts Private Limited ......................... — #78.67% — (8.37) — (1.60)
+ Divine Heritage Hotels Private Limited .................. — #78.67% — (1.58) — —
+ Gables Promoters Private Limited ........................... — #78.67% — (*) — —
+ Holiday on Hills Resorts Private Limited ................ — #78.67% — (1.18) — —
+ MH Boutique Hospitality Limited ........................... — #38.55% — (0.07) — —
+ Infinity Hospitality Group Company Limited ....... — #58.20% — (0.70) — —
NBS International Limited ............................................. 50,490 100.00% — (2.09) — 2.00
Mahindra Ugine Steel Company Limited .................... 1,64,66,789 50.69% — (17.09) — 100.53
¥ Mahindra Sanyo Special Steel Private Limited ...... — 25.85% — (9.83) — (*)
Mahindra Holdings Limited .......................................... 4,75,49,999 100.00% — 0.71 — 16.31
Mahindra United Football Club Private Limited ... — 100.00% — * — 0.12
* denotes amounts less than Rs. 50,000
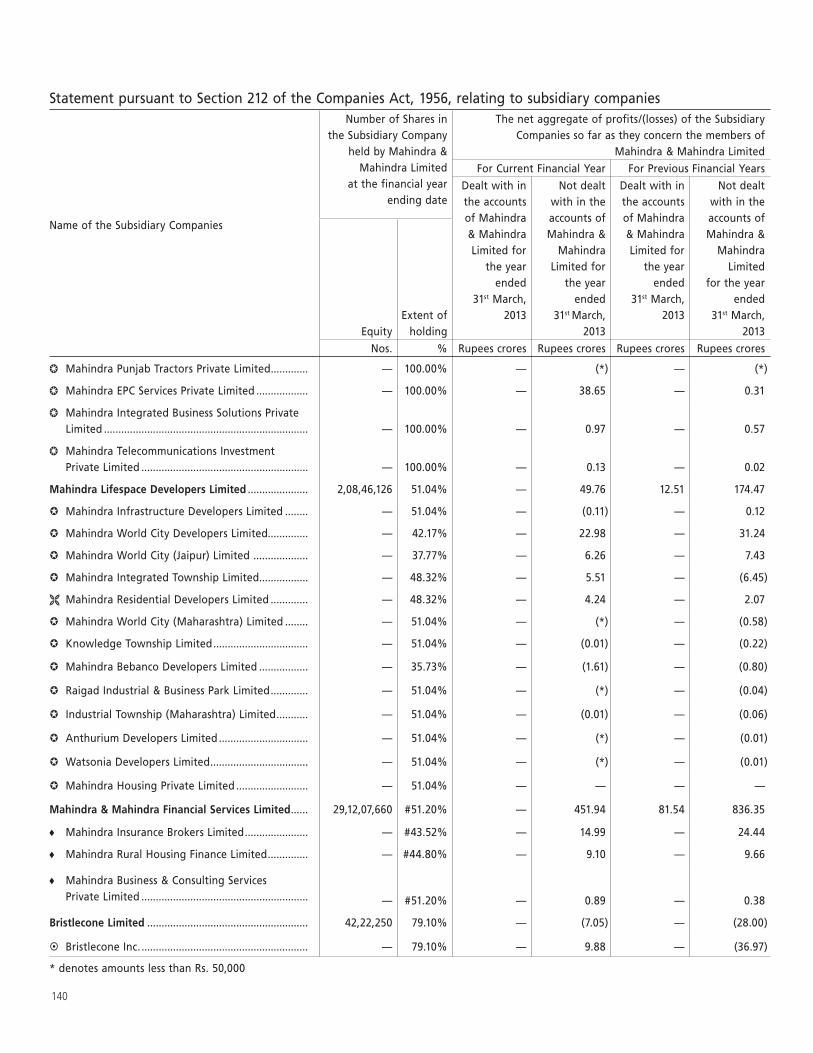
140
Statement pursuant to Section 212 of the Companies Act, 1956, relating to subsidiary companies
Name of the Subsidiary Companies
Number of Shares in the Subsidiary Company
held by Mahindra & Mahindra Limited
at the financial year ending date
The net aggregate of profits/(losses) of the Subsidiary Companies so far as they concern the members of
Mahindra & Mahindra Limited
For Current Financial Year For Previous Financial Years
Dealt with in the accounts of Mahindra & Mahindra Limited for
the year ended
31st March, 2013
Not dealt with in the accounts of Mahindra &
Mahindra Limited for
the year ended
31st March, 2013
Dealt with in the accounts of Mahindra & Mahindra Limited for
the year ended
31st March, 2013
Not dealt with in the accounts of Mahindra &
Mahindra Limited
for the year ended
31st March, 2013Equity
Extent of holding
Nos. % Rupees crores Rupees crores Rupees crores Rupees crores
Mahindra Punjab Tractors Private Limited ............. — 100.00% — (*) — (*)
Mahindra EPC Services Private Limited .................. — 100.00% — 38.65 — 0.31
Mahindra Integrated Business Solutions Private Limited ....................................................................... — 100.00% — 0.97 — 0.57
Mahindra Telecommunications Investment Private Limited .......................................................... — 100.00% — 0.13 — 0.02
Mahindra Lifespace Developers Limited ..................... 2,08,46,126 51.04% — 49.76 12.51 174.47
Mahindra Infrastructure Developers Limited ........ — 51.04% — (0.11) — 0.12
Mahindra World City Developers Limited.............. — 42.17% — 22.98 — 31.24
Mahindra World City (Jaipur) Limited ................... — 37.77% — 6.26 — 7.43
Mahindra Integrated Township Limited................. — 48.32% — 5.51 — (6.45)
Mahindra Residential Developers Limited ............. — 48.32% — 4.24 — 2.07
Mahindra World City (Maharashtra) Limited ........ — 51.04% — (*) — (0.58)
Knowledge Township Limited ................................. — 51.04% — (0.01) — (0.22)
Mahindra Bebanco Developers Limited ................. — 35.73% — (1.61) — (0.80)
Raigad Industrial & Business Park Limited ............. — 51.04% — (*) — (0.04)
Industrial Township (Maharashtra) Limited ........... — 51.04% — (0.01) — (0.06)
Anthurium Developers Limited ............................... — 51.04% — (*) — (0.01)
Watsonia Developers Limited .................................. — 51.04% — (*) — (0.01)
Mahindra Housing Private Limited ......................... — 51.04% — — — —
Mahindra & Mahindra Financial Services Limited ...... 29,12,07,660 #51.20% — 451.94 81.54 836.35
Mahindra Insurance Brokers Limited ...................... — #43.52% — 14.99 — 24.44
Mahindra Rural Housing Finance Limited .............. — #44.80% — 9.10 — 9.66
Mahindra Business & Consulting Services Private Limited .......................................................... — #51.20% — 0.89 — 0.38
Bristlecone Limited ........................................................ 42,22,250 79.10% — (7.05) — (28.00)
Bristlecone Inc. .......................................................... — 79.10% — 9.88 — (36.97)
* denotes amounts less than Rs. 50,000
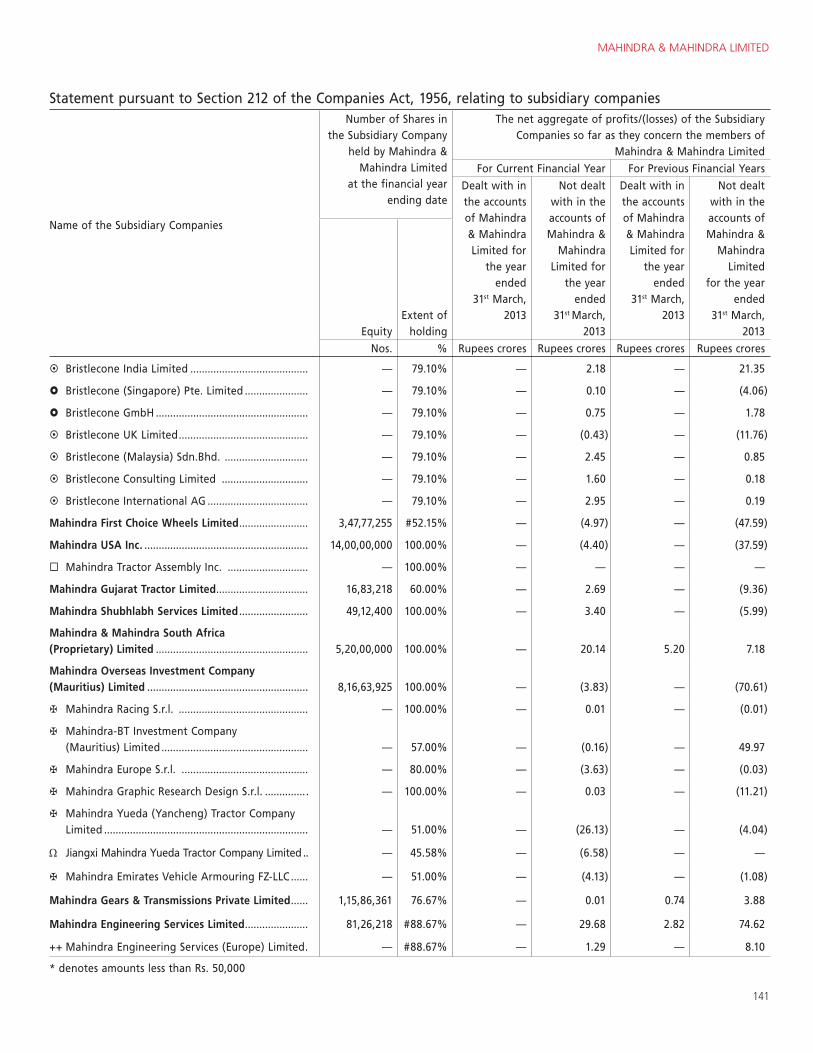
MAHINDRA & MAHINDRA LIMITED
141
Statement pursuant to Section 212 of the Companies Act, 1956, relating to subsidiary companies
Name of the Subsidiary Companies
Number of Shares in the Subsidiary Company
held by Mahindra & Mahindra Limited
at the financial year ending date
The net aggregate of profits/(losses) of the Subsidiary Companies so far as they concern the members of
Mahindra & Mahindra Limited
For Current Financial Year For Previous Financial Years
Dealt with in the accounts of Mahindra & Mahindra Limited for
the year ended
31st March, 2013
Not dealt with in the accounts of Mahindra &
Mahindra Limited for
the year ended
31st March, 2013
Dealt with in the accounts of Mahindra & Mahindra Limited for
the year ended
31st March, 2013
Not dealt with in the accounts of Mahindra &
Mahindra Limited
for the year ended
31st March, 2013Equity
Extent of holding
Nos. % Rupees crores Rupees crores Rupees crores Rupees crores
Bristlecone India Limited ......................................... — 79.10% — 2.18 — 21.35
Bristlecone (Singapore) Pte. Limited ...................... — 79.10% — 0.10 — (4.06)
Bristlecone GmbH ..................................................... — 79.10% — 0.75 — 1.78
Bristlecone UK Limited ............................................. — 79.10% — (0.43) — (11.76)
Bristlecone (Malaysia) Sdn.Bhd. ............................. — 79.10% — 2.45 — 0.85
Bristlecone Consulting Limited .............................. — 79.10% — 1.60 — 0.18
Bristlecone International AG ................................... — 79.10% — 2.95 — 0.19
Mahindra First Choice Wheels Limited ........................ 3,47,77,255 #52.15% — (4.97) — (47.59)
Mahindra USA Inc. ......................................................... 14,00,00,000 100.00% — (4.40) — (37.59)
Mahindra Tractor Assembly Inc. ............................ — 100.00% — — — —
Mahindra Gujarat Tractor Limited ................................ 16,83,218 60.00% — 2.69 — (9.36)
Mahindra Shubhlabh Services Limited ........................ 49,12,400 100.00% — 3.40 — (5.99)
Mahindra & Mahindra South Africa (Proprietary) Limited ..................................................... 5,20,00,000 100.00% — 20.14 5.20 7.18
Mahindra Overseas Investment Company (Mauritius) Limited ........................................................ 8,16,63,925 100.00% — (3.83) — (70.61)
Mahindra Racing S.r.l. ............................................. — 100.00% — 0.01 — (0.01)
Mahindra-BT Investment Company (Mauritius) Limited ................................................... — 57.00% — (0.16) — 49.97
Mahindra Europe S.r.l. ............................................ — 80.00% — (3.63) — (0.03)
Mahindra Graphic Research Design S.r.l. ............... — 100.00% — 0.03 — (11.21)
Mahindra Yueda (Yancheng) Tractor Company Limited ....................................................................... — 51.00% — (26.13) — (4.04)
Jiangxi Mahindra Yueda Tractor Company Limited .. — 45.58% — (6.58) — —
Mahindra Emirates Vehicle Armouring FZ-LLC ...... — 51.00% — (4.13) — (1.08)
Mahindra Gears & Transmissions Private Limited ...... 1,15,86,361 76.67% — 0.01 0.74 3.88
Mahindra Engineering Services Limited ...................... 81,26,218 #88.67% — 29.68 2.82 74.62
++ Mahindra Engineering Services (Europe) Limited . — #88.67% — 1.29 — 8.10
* denotes amounts less than Rs. 50,000
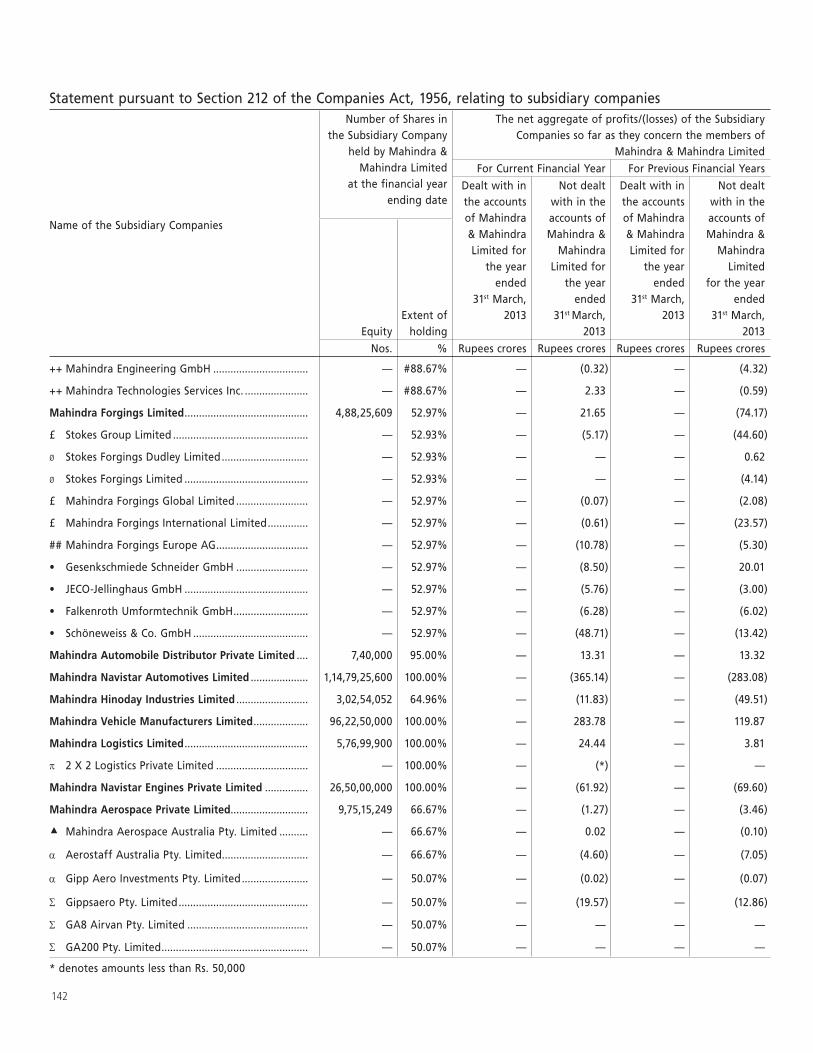
142
Statement pursuant to Section 212 of the Companies Act, 1956, relating to subsidiary companies
Name of the Subsidiary Companies
Number of Shares in the Subsidiary Company
held by Mahindra & Mahindra Limited
at the financial year ending date
The net aggregate of profits/(losses) of the Subsidiary Companies so far as they concern the members of
Mahindra & Mahindra Limited
For Current Financial Year For Previous Financial Years
Dealt with in the accounts of Mahindra & Mahindra Limited for
the year ended
31st March, 2013
Not dealt with in the accounts of Mahindra &
Mahindra Limited for
the year ended
31st March, 2013
Dealt with in the accounts of Mahindra & Mahindra Limited for
the year ended
31st March, 2013
Not dealt with in the accounts of Mahindra &
Mahindra Limited
for the year ended
31st March, 2013Equity
Extent of holding
Nos. % Rupees crores Rupees crores Rupees crores Rupees crores
++ Mahindra Engineering GmbH ................................. — #88.67% — (0.32) — (4.32)
++ Mahindra Technologies Services Inc. ...................... — #88.67% — 2.33 — (0.59)
Mahindra Forgings Limited ........................................... 4,88,25,609 52.97% — 21.65 — (74.17)
£ Stokes Group Limited ............................................... — 52.93% — (5.17) — (44.60)
ø Stokes Forgings Dudley Limited .............................. — 52.93% — — — 0.62
ø Stokes Forgings Limited ........................................... — 52.93% — — — (4.14)
£ Mahindra Forgings Global Limited ......................... — 52.97% — (0.07) — (2.08)
£ Mahindra Forgings International Limited .............. — 52.97% — (0.61) — (23.57)
## Mahindra Forgings Europe AG ................................ — 52.97% — (10.78) — (5.30)
......................... — 52.97% — (8.50) — 20.01
........................................... — 52.97% — (5.76) — (3.00)
.......................... — 52.97% — (6.28) — (6.02)
........................................ — 52.97% — (48.71) — (13.42)
Mahindra Automobile Distributor Private Limited .... 7,40,000 95.00% — 13.31 — 13.32
Mahindra Navistar Automotives Limited .................... 1,14,79,25,600 100.00% — (365.14) — (283.08)
Mahindra Hinoday Industries Limited ......................... 3,02,54,052 64.96% — (11.83) — (49.51)
Mahindra Vehicle Manufacturers Limited ................... 96,22,50,000 100.00% — 283.78 — 119.87
Mahindra Logistics Limited ........................................... 5,76,99,900 100.00% — 24.44 — 3.81
2 X 2 Logistics Private Limited ................................ — 100.00% — (*) — —
Mahindra Navistar Engines Private Limited ............... 26,50,00,000 100.00% — (61.92) — (69.60)
Mahindra Aerospace Private Limited........................... 9,75,15,249 66.67% — (1.27) — (3.46)
Mahindra Aerospace Australia Pty. Limited .......... — 66.67% — 0.02 — (0.10)
Aerostaff Australia Pty. Limited .............................. — 66.67% — (4.60) — (7.05)
Gipp Aero Investments Pty. Limited ....................... — 50.07% — (0.02) — (0.07)
Gippsaero Pty. Limited ............................................. — 50.07% — (19.57) — (12.86)
GA8 Airvan Pty. Limited .......................................... — 50.07% — — — —
GA200 Pty. Limited ................................................... — 50.07% — — — —
* denotes amounts less than Rs. 50,000
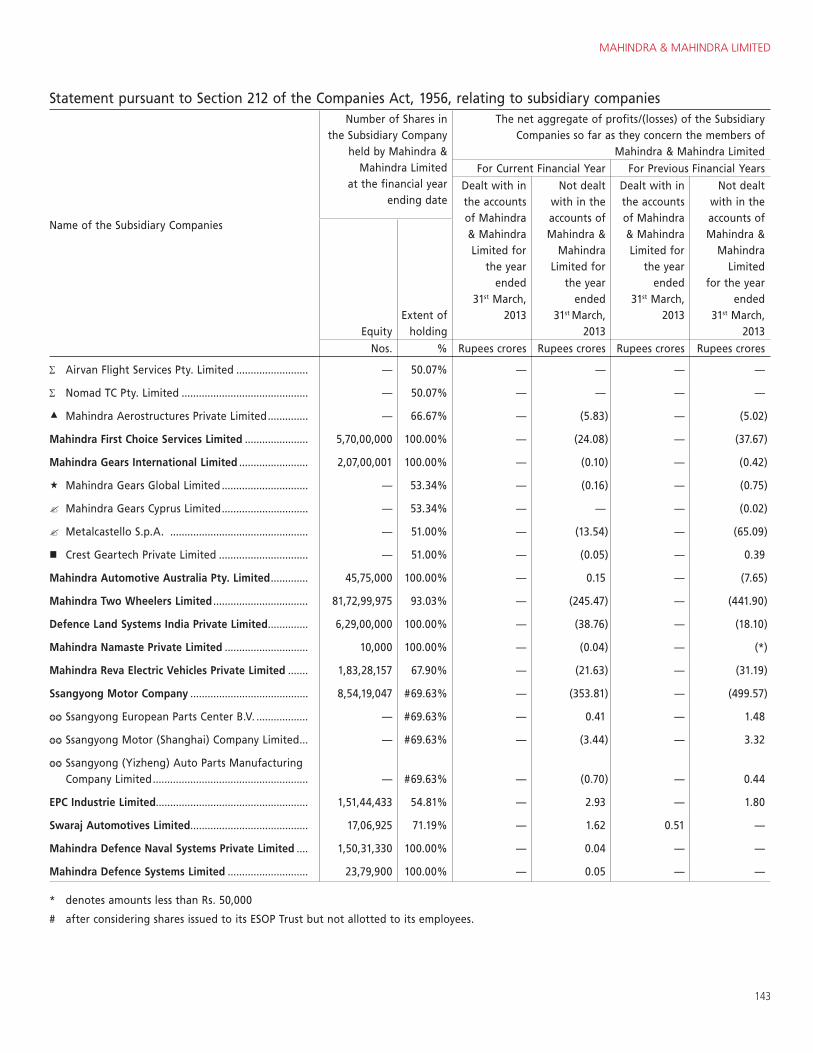
MAHINDRA & MAHINDRA LIMITED
143
Statement pursuant to Section 212 of the Companies Act, 1956, relating to subsidiary companies
Name of the Subsidiary Companies
Number of Shares in the Subsidiary Company
held by Mahindra & Mahindra Limited
at the financial year ending date
The net aggregate of profits/(losses) of the Subsidiary Companies so far as they concern the members of
Mahindra & Mahindra Limited
For Current Financial Year For Previous Financial Years
Dealt with in the accounts of Mahindra & Mahindra Limited for
the year ended
31st March, 2013
Not dealt with in the accounts of Mahindra &
Mahindra Limited for
the year ended
31st March, 2013
Dealt with in the accounts of Mahindra & Mahindra Limited for
the year ended
31st March, 2013
Not dealt with in the accounts of Mahindra &
Mahindra Limited
for the year ended
31st March, 2013Equity
Extent of holding
Nos. % Rupees crores Rupees crores Rupees crores Rupees crores
Airvan Flight Services Pty. Limited ......................... — 50.07% — — — —
Nomad TC Pty. Limited ............................................ — 50.07% — — — —
Mahindra Aerostructures Private Limited .............. — 66.67% — (5.83) — (5.02)
Mahindra First Choice Services Limited ...................... 5,70,00,000 100.00% — (24.08) — (37.67)
Mahindra Gears International Limited ........................ 2,07,00,001 100.00% — (0.10) — (0.42)
Mahindra Gears Global Limited .............................. — 53.34% — (0.16) — (0.75)
Mahindra Gears Cyprus Limited .............................. — 53.34% — — — (0.02)
Metalcastello S.p.A. ................................................ — 51.00% — (13.54) — (65.09)
Crest Geartech Private Limited ............................... — 51.00% — (0.05) — 0.39
Mahindra Automotive Australia Pty. Limited ............. 45,75,000 100.00% — 0.15 — (7.65)
Mahindra Two Wheelers Limited ................................. 81,72,99,975 93.03% — (245.47) — (441.90)
Defence Land Systems India Private Limited .............. 6,29,00,000 100.00% — (38.76) — (18.10)
Mahindra Namaste Private Limited ............................. 10,000 100.00% — (0.04) — (*)
Mahindra Reva Electric Vehicles Private Limited ....... 1,83,28,157 67.90% — (21.63) — (31.19)
Ssangyong Motor Company ......................................... 8,54,19,047 #69.63% — (353.81) — (499.57)
Ssangyong European Parts Center B.V. .................. — #69.63% — 0.41 — 1.48
Ssangyong Motor (Shanghai) Company Limited ... — #69.63% — (3.44) — 3.32
Ssangyong (Yizheng) Auto Parts Manufacturing Company Limited ...................................................... — #69.63% — (0.70) — 0.44
EPC Industrie Limited..................................................... 1,51,44,433 54.81% — 2.93 — 1.80
Swaraj Automotives Limited......................................... 17,06,925 71.19% — 1.62 0.51 —
Mahindra Defence Naval Systems Private Limited .... 1,50,31,330 100.00% — 0.04 — —
Mahindra Defence Systems Limited ............................ 23,79,900 100.00% — 0.05 — —
* denotes amounts less than Rs. 50,000
# after considering shares issued to its ESOP Trust but not allotted to its employees.
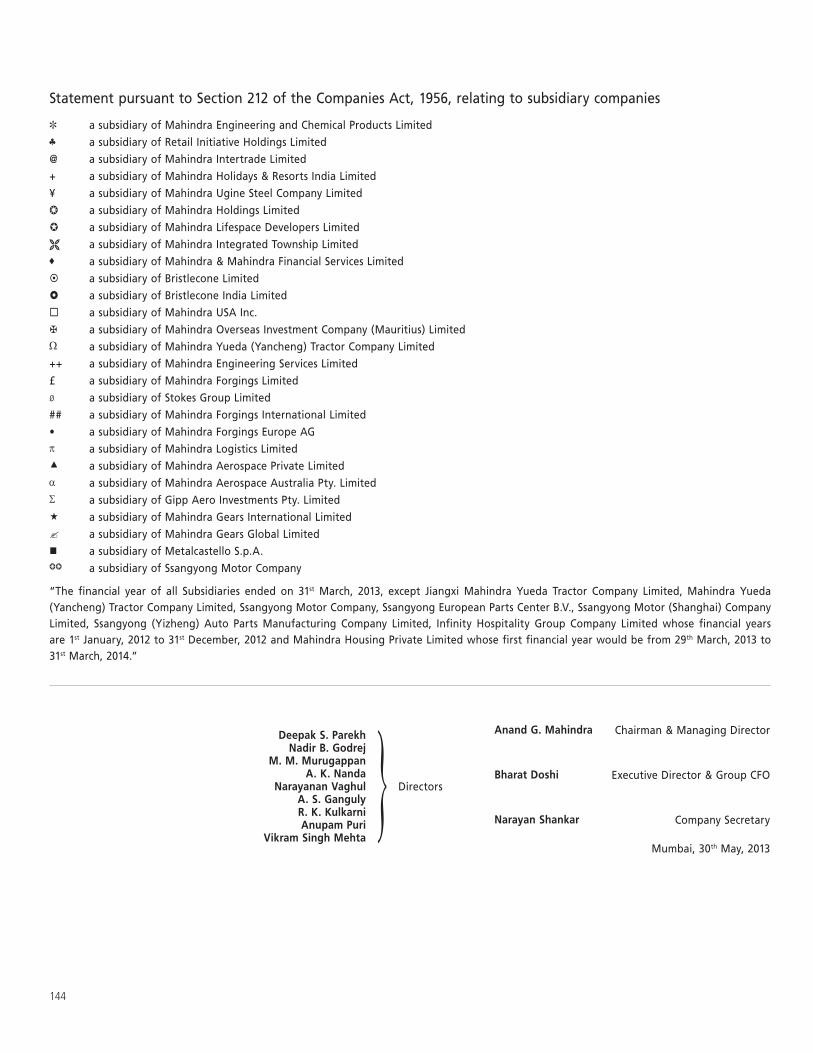
144
a subsidiary of Mahindra Engineering and Chemical Products Limited
a subsidiary of Retail Initiative Holdings Limited
@ a subsidiary of Mahindra Intertrade Limited
+ a subsidiary of Mahindra Holidays & Resorts India Limited
¥ a subsidiary of Mahindra Ugine Steel Company Limited
a subsidiary of Mahindra Holdings Limited
a subsidiary of Mahindra Lifespace Developers Limited
a subsidiary of Mahindra Integrated Township Limited
a subsidiary of Mahindra & Mahindra Financial Services Limited
a subsidiary of Bristlecone Limited
a subsidiary of Bristlecone India Limited
a subsidiary of Mahindra USA Inc.
a subsidiary of Mahindra Overseas Investment Company (Mauritius) Limited
a subsidiary of Mahindra Yueda (Yancheng) Tractor Company Limited
++ a subsidiary of Mahindra Engineering Services Limited
£ a subsidiary of Mahindra Forgings Limitedø a subsidiary of Stokes Group Limited
## a subsidiary of Mahindra Forgings International Limited
a subsidiary of Mahindra Forgings Europe AG
a subsidiary of Mahindra Logistics Limited
a subsidiary of Mahindra Aerospace Private Limited
a subsidiary of Mahindra Aerospace Australia Pty. Limited
a subsidiary of Gipp Aero Investments Pty. Limited
a subsidiary of Mahindra Gears International Limited
a subsidiary of Mahindra Gears Global Limited
a subsidiary of Metalcastello S.p.A.
a subsidiary of Ssangyong Motor Company
“The financial year of all Subsidiaries ended on 31st March, 2013, except Jiangxi Mahindra Yueda Tractor Company Limited, Mahindra Yueda (Yancheng) Tractor Company Limited, Ssangyong Motor Company, Ssangyong European Parts Center B.V., Ssangyong Motor (Shanghai) Company Limited, Ssangyong (Yizheng) Auto Parts Manufacturing Company Limited, Infinity Hospitality Group Company Limited whose financial years are 1st January, 2012 to 31st December, 2012 and Mahindra Housing Private Limited whose first financial year would be from 29th March, 2013 to 31st March, 2014.”
Statement pursuant to Section 212 of the Companies Act, 1956, relating to subsidiary companies
Deepak S. ParekhNadir B. Godrej
M. M. MurugappanA. K. Nanda
Narayanan Vaghul A. S. GangulyR. K. KulkarniAnupam Puri
Vikram Singh Mehta
Directors
Anand G. Mahindra Chairman & Managing Director
Bharat Doshi Executive Director & Group CFO
Narayan Shankar Company Secretary
Mumbai, 30th May, 2013


MAHINDRA & MAHINDRA LIMITED (CONSOLIDATED)
147
Report on the Consolidated Financial Statements
1. We have audited the accompanying consolidated financial statements of Mahindra & Mahindra Limited (the “Company”) and its subsidiaries (“the Group”) which comprise the Consolidated Balance Sheet as at 31st March, 2013, the Consolidated Statement of Profit and Loss and the Consolidated Cash Flow Statement for the year then ended, and a summary of the significant accounting policies and other explanatory information.
Management’s Responsibility for the Consolidated Financial Statements
2. The Company’s Management is responsible for the preparation of these consolidated financial statements that give a true and fair view of the consolidated financial position, consolidated financial performance and consolidated cash flows of the Group in accordance with the accounting principles generally accepted in India. This responsibility includes the design, implementation and maintenance of internal control relevant to the preparation and presentation of the consolidated financial statements that give a true and fair view and are free from material misstatement, whether due to fraud or error.
Auditors’ Responsibility
3. Our responsibility is to express an opinion on these consolidated financial statements based on our audit. We conducted our audit in accordance with the Standards on Auditing issued by the Institute of Chartered Accountants of India. Those Standards require that we comply with ethical requirements and plan and perform the audit to obtain reasonable assurance about whether the consolidated financial statements are free from material misstatement.
4. An audit involves performing procedures to obtain audit evidence about the amounts and the disclosures in the consolidated financial statements. The procedures selected depend on the auditor’s judgment, including the assessment of the risks of material misstatement of the consolidated financial statements, whether due to fraud or error. In making those risk assessments, the auditor considers internal control relevant to the Company’s preparation and presentation of the consolidated financial statements that give a true and fair view in order to design audit procedures that are appropriate in the circumstances, but not for the purpose of expressing an opinion on the effectiveness of the Company’s internal control. An audit also includes evaluating the appropriateness of the accounting policies used and the reasonableness of the accounting estimates made by the Management, as well as evaluating the overall presentation of the consolidated financial statements. We believe that the audit evidence we have obtained is sufficient and appropriate to provide a basis for our qualified audit opinion.
Basis for Qualified Opinion
5. As stated in Note 36, the auditors of Tech Mahindra Limited Group (TML), an associate, based on the audit report on the accounts of its associate Satyam Computers Services Limited (SCSL) for the year ended 31st March, 2013, have issued a qualified opinion on the Consolidated Financial Statements of TML for the year ended 31st March, 2013 on certain matters, expressing their inability to comment whether adjustments would be necessary in the financial statements of TML as a result of number of items, in the SCSL accounts, including ongoing investigations and legal proceedings by various regulators and investigating agencies in respect of financial
irregularities in SCSL relating to prior years; Net debit amounts aggregating Rs. 1,139.40 crores booked to ‘Unexplained Differences Suspense Account (Net)’ and fully provided for in prior years on grounds of prudence in its accounts by SCSL; Alleged advances of Rs. 1,230.40 relating to prior years as claimed by various companies which is presented separately in the Balance Sheet of SCSL under ‘Amount Pending Investigation Suspense Account (Net)’ and adequacy or otherwise of the provision for taxation pertaining to prior years.
In view of the above, we are unable to comment on the consequential impact, if any, of the same on the Company’s post acquisition Share of Profit/(Loss) of Associates for the year and Investment in Associates in the Consolidated Financial Statements of the Group.
Qualified Opinion
6. In our opinion and to the best of our information and according to the explanations given to us, except for the effects of the matters described in the Basis for Qualified Opinion paragraph, and based on the consideration of the reports of the other auditors on the financial statements of the subsidiaries, jointly controlled entities and associates referred to below in the Other Matter paragraph, the aforesaid consolidated financial statements give a true and fair view in conformity with the accounting principles generally accepted in India:
(a) in the case of the Consolidated Balance Sheet, of the state of affairs of the Group as at 31st March, 2013;
(b) in the case of the Consolidated Statement of Profit and Loss, of the profit of the Group for the year ended on that date; and
(c) in the case of the Consolidated Cash Flow Statement, of the cash flows of the Group for the year ended on that date.
Other Matter
7. We did not audit the financial statements of certain subsidiaries and jointly controlled entities, whose financial statements reflect the Group’s share of total assets of Rs. 33,856.11 crores as at 31st March, 2013, and the Group’s share of total revenues of Rs. 10,074.32 crores for the year ended on that date, and net cash inflows amounting to Rs. 200.34 crores for the year ended on that date and associates whose financial statements reflect the Group’s share of profit upto 31st March, 2013 of Rs. 51.34 crores and the Group’s share of profit of Rs. 15.49 crores for the year ended on that date as considered in the Consolidated Financial Statements. These financial statements and other financial information have been audited by other auditors whose reports have been furnished to us, and our opinion, in so far as it relates to the amounts and disclosures included in respect of these subsidiaries, jointly controlled entities and associates, is based solely on the reports of the other auditors. Our opinion is not qualified in respect of this matter.
For DELOITTE HASKINS & SELLSChartered Accountants
(Firm Registration No. 117364W)
Shyamak R TataPartner
(Membership No. 38320)
Mumbai, 30th May, 2013
Independent Auditors’ Report to the Board of Directors of Mahindra & Mahindra Limited
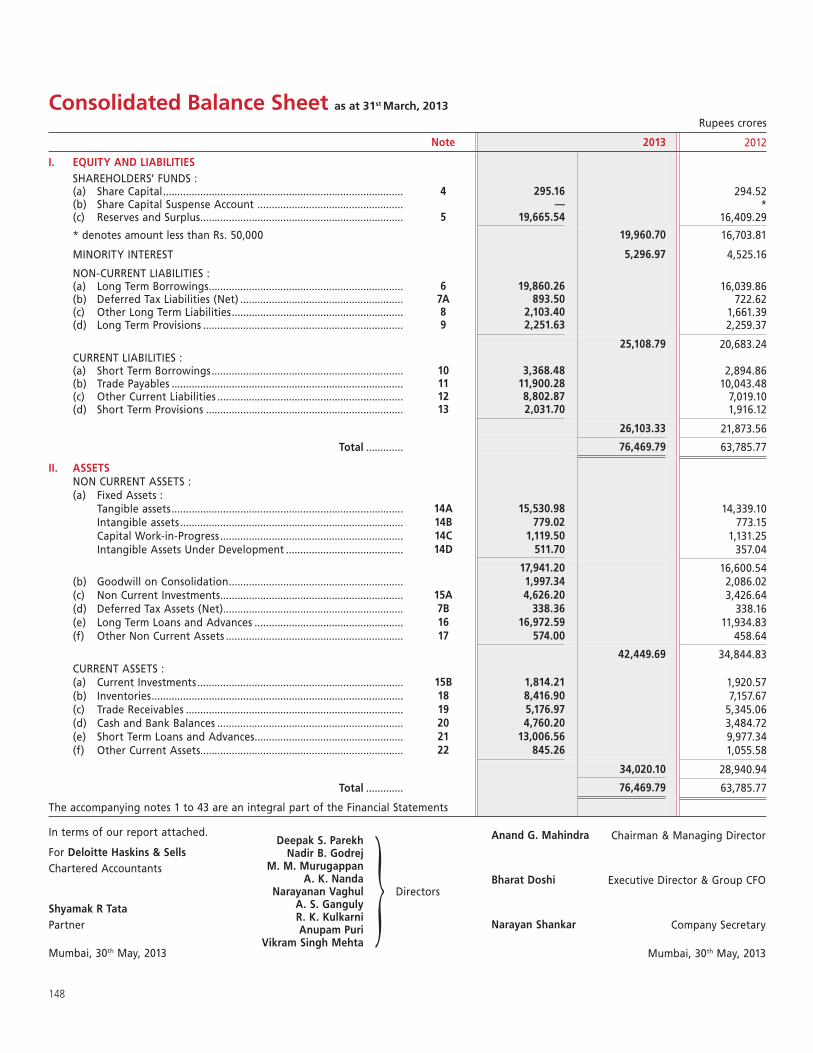
148
Consolidated Balance Sheet as at 31st March, 2013
Rupees crores
Note 2013 2012
I. EQUITY AND LIABILITIES SHAREHOLDERS’ FUNDS : (a) Share Capital .................................................................................... 4 295.16 294.52 (b) Share Capital Suspense Account ................................................... — * (c) Reserves and Surplus ....................................................................... 5 19,665.54 16,409.29
* denotes amount less than Rs. 50,000 19,960.70 16,703.81
MINORITY INTEREST 5,296.97 4,525.16
NON-CURRENT LIABILITIES : (a) Long Term Borrowings .................................................................... 6 19,860.26 16,039.86 (b) Deferred Tax Liabilities (Net) ......................................................... 7A 893.50 722.62 (c) Other Long Term Liabilities ............................................................ 8 2,103.40 1,661.39 (d) Long Term Provisions ...................................................................... 9 2,251.63 2,259.37
25,108.79 20,683.24 CURRENT LIABILITIES : (a) Short Term Borrowings ................................................................... 10 3,368.48 2,894.86 (b) Trade Payables ................................................................................. 11 11,900.28 10,043.48 (c) Other Current Liabilities ................................................................. 12 8,802.87 7,019.10 (d) Short Term Provisions ..................................................................... 13 2,031.70 1,916.12
26,103.33 21,873.56
Total ............. 76,469.79 63,785.77
II. ASSETS NON CURRENT ASSETS : (a) Fixed Assets : Tangible assets ................................................................................. 14A 15,530.98 14,339.10 Intangible assets .............................................................................. 14B 779.02 773.15 Capital Work-in-Progress ................................................................ 14C 1,119.50 1,131.25 Intangible Assets Under Development ......................................... 14D 511.70 357.04
17,941.20 16,600.54 (b) Goodwill on Consolidation ............................................................. 1,997.34 2,086.02 (c) Non Current Investments ................................................................ 15A 4,626.20 3,426.64 (d) Deferred Tax Assets (Net) ............................................................... 7B 338.36 338.16 (e) Long Term Loans and Advances .................................................... 16 16,972.59 11,934.83 (f) Other Non Current Assets .............................................................. 17 574.00 458.64
42,449.69 34,844.83 CURRENT ASSETS : (a) Current Investments ........................................................................ 15B 1,814.21 1,920.57 (b) Inventories ........................................................................................ 18 8,416.90 7,157.67 (c) Trade Receivables ............................................................................ 19 5,176.97 5,345.06 (d) Cash and Bank Balances ................................................................. 20 4,760.20 3,484.72 (e) Short Term Loans and Advances .................................................... 21 13,006.56 9,977.34 (f) Other Current Assets....................................................................... 22 845.26 1,055.58
34,020.10 28,940.94
Total ............. 76,469.79 63,785.77
The accompanying notes 1 to 43 are an integral part of the Financial Statements
Deepak S. ParekhNadir B. Godrej
M. M. MurugappanA. K. Nanda
Narayanan Vaghul A. S. GangulyR. K. KulkarniAnupam Puri
Vikram Singh Mehta
Directors
In terms of our report attached.
For Deloitte Haskins & SellsChartered Accountants
Shyamak R TataPartner
Mumbai, 30th May, 2013
Anand G. Mahindra Chairman & Managing Director
Bharat Doshi Executive Director & Group CFO
Narayan Shankar Company Secretary
Mumbai, 30th May, 2013
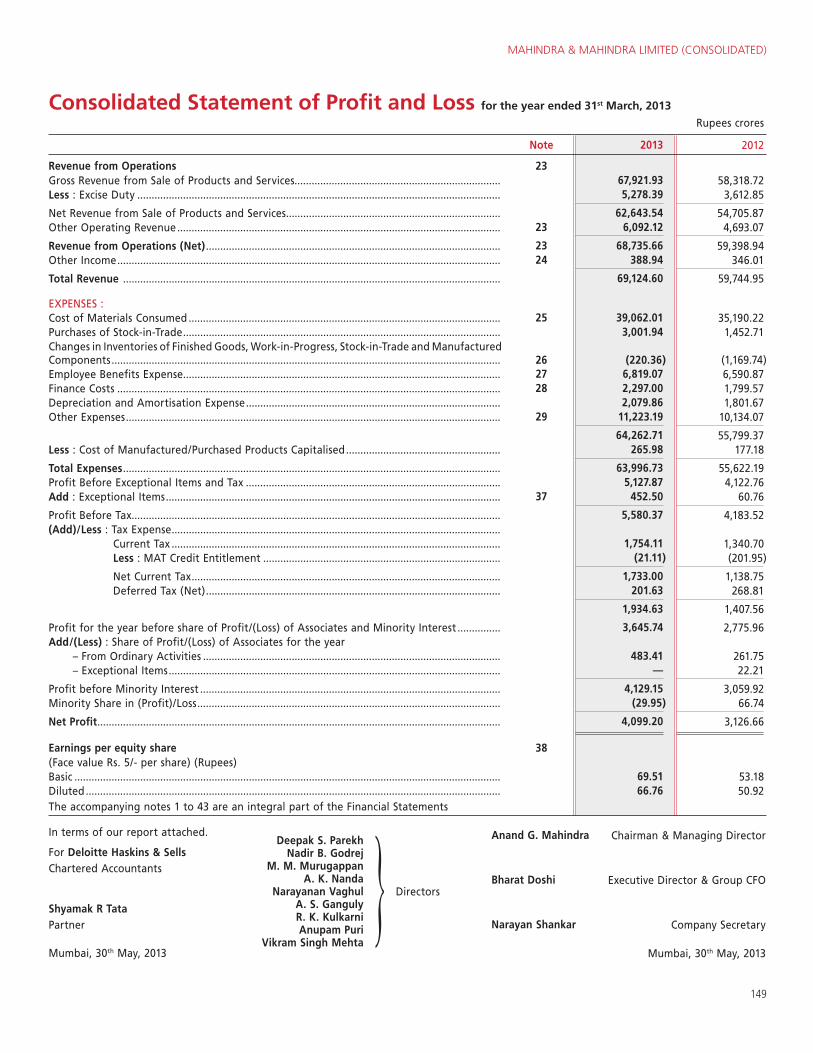
MAHINDRA & MAHINDRA LIMITED (CONSOLIDATED)
149
Consolidated Statement of Profit and Loss for the year ended 31st March, 2013
Rupees crores
Note 2013 2012
Revenue from Operations 23Gross Revenue from Sale of Products and Services........................................................................ 67,921.93 58,318.72 Less : Excise Duty ............................................................................................................................... 5,278.39 3,612.85
Net Revenue from Sale of Products and Services ........................................................................... 62,643.54 54,705.87 Other Operating Revenue ................................................................................................................. 23 6,092.12 4,693.07
Revenue from Operations (Net) ....................................................................................................... 23 68,735.66 59,398.94 Other Income ...................................................................................................................................... 24 388.94 346.01
Total Revenue .................................................................................................................................... 69,124.60 59,744.95
EXPENSES :Cost of Materials Consumed ............................................................................................................. 25 39,062.01 35,190.22 Purchases of Stock-in-Trade ............................................................................................................... 3,001.94 1,452.71 Changes in Inventories of Finished Goods, Work-in-Progress, Stock-in-Trade and Manufactured Components ........................................................................................................................................ 26 (220.36) (1,169.74)Employee Benefits Expense ............................................................................................................... 27 6,819.07 6,590.87 Finance Costs ...................................................................................................................................... 28 2,297.00 1,799.57 Depreciation and Amortisation Expense ......................................................................................... 2,079.86 1,801.67 Other Expenses ................................................................................................................................... 29 11,223.19 10,134.07
64,262.71 55,799.37 Less : Cost of Manufactured/Purchased Products Capitalised ...................................................... 265.98 177.18
Total Expenses .................................................................................................................................... 63,996.73 55,622.19 Profit Before Exceptional Items and Tax ......................................................................................... 5,127.87 4,122.76 Add : Exceptional Items ..................................................................................................................... 37 452.50 60.76
Profit Before Tax................................................................................................................................. 5,580.37 4,183.52 (Add)/Less : Tax Expense ................................................................................................................... Current Tax ................................................................................................................... 1,754.11 1,340.70 Less : MAT Credit Entitlement ................................................................................... (21.11) (201.95)
Net Current Tax ............................................................................................................ 1,733.00 1,138.75 Deferred Tax (Net) ....................................................................................................... 201.63 268.81
1,934.63 1,407.56
Profit for the year before share of Profit/(Loss) of Associates and Minority Interest ............... 3,645.74 2,775.96 Add/(Less) : Share of Profit/(Loss) of Associates for the year – From Ordinary Activities ........................................................................................................ 483.41 261.75 – Exceptional Items .................................................................................................................... — 22.21
Profit before Minority Interest ......................................................................................................... 4,129.15 3,059.92 Minority Share in (Profit)/Loss .......................................................................................................... (29.95) 66.74
Net Profit ............................................................................................................................................. 4,099.20 3,126.66
Earnings per equity share 38(Face value Rs. 5/- per share) (Rupees)Basic ..................................................................................................................................................... 69.51 53.18 Diluted ................................................................................................................................................. 66.76 50.92 The accompanying notes 1 to 43 are an integral part of the Financial Statements
Deepak S. ParekhNadir B. Godrej
M. M. MurugappanA. K. Nanda
Narayanan Vaghul A. S. GangulyR. K. KulkarniAnupam Puri
Vikram Singh Mehta
Directors
In terms of our report attached.
For Deloitte Haskins & SellsChartered Accountants
Shyamak R TataPartner
Mumbai, 30th May, 2013
Anand G. Mahindra Chairman & Managing Director
Bharat Doshi Executive Director & Group CFO
Narayan Shankar Company Secretary
Mumbai, 30th May, 2013
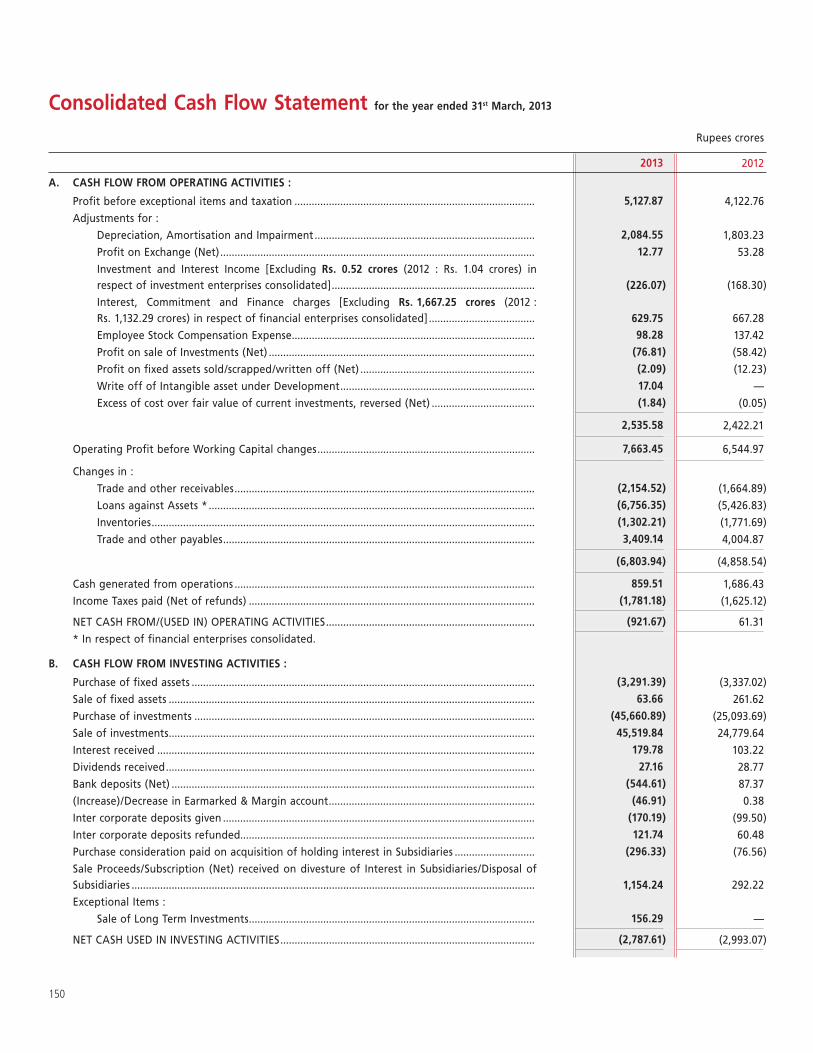
150
Consolidated Cash Flow Statement for the year ended 31st March, 2013
Rupees crores
2013 2012
A. CASH FLOW FROM OPERATING ACTIVITIES :
Profit before exceptional items and taxation .................................................................................... 5,127.87 4,122.76
Adjustments for :
Depreciation, Amortisation and Impairment ............................................................................. 2,084.55 1,803.23
Profit on Exchange (Net) .............................................................................................................. 12.77 53.28
Investment and Interest Income [Excluding Rs. 0.52 crores (2012 : Rs. 1.04 crores) in respect of investment enterprises consolidated] .......................................................................
(226.07) (168.30)
Interest, Commitment and Finance charges [Excluding Rs. 1,667.25 crores (2012 : Rs. 1,132.29 crores) in respect of financial enterprises consolidated] ..................................... 629.75 667.28
Employee Stock Compensation Expense ..................................................................................... 98.28 137.42
Profit on sale of Investments (Net) ............................................................................................. (76.81) (58.42)
Profit on fixed assets sold/scrapped/written off (Net) ............................................................. (2.09) (12.23)
Write off of Intangible asset under Development .................................................................... 17.04 —
Excess of cost over fair value of current investments, reversed (Net) .................................... (1.84) (0.05)
2,535.58 2,422.21
Operating Profit before Working Capital changes ............................................................................ 7,663.45 6,544.97
Changes in :
Trade and other receivables ......................................................................................................... (2,154.52) (1,664.89)
Loans against Assets * .................................................................................................................. (6,756.35) (5,426.83)
Inventories ...................................................................................................................................... (1,302.21) (1,771.69)
Trade and other payables ............................................................................................................. 3,409.14 4,004.87
(6,803.94) (4,858.54)
Cash generated from operations ......................................................................................................... 859.51 1,686.43
Income Taxes paid (Net of refunds) .................................................................................................... (1,781.18) (1,625.12)
NET CASH FROM/(USED IN) OPERATING ACTIVITIES ......................................................................... (921.67) 61.31
* In respect of financial enterprises consolidated.
B. CASH FLOW FROM INVESTING ACTIVITIES :
Purchase of fixed assets ........................................................................................................................ (3,291.39) (3,337.02)
Sale of fixed assets ................................................................................................................................ 63.66 261.62
Purchase of investments ....................................................................................................................... (45,660.89) (25,093.69)
Sale of investments ................................................................................................................................ 45,519.84 24,779.64
Interest received .................................................................................................................................... 179.78 103.22
Dividends received ................................................................................................................................. 27.16 28.77
Bank deposits (Net) ............................................................................................................................... (544.61) 87.37
(Increase)/Decrease in Earmarked & Margin account ........................................................................ (46.91) 0.38
Inter corporate deposits given ............................................................................................................. (170.19) (99.50)
Inter corporate deposits refunded....................................................................................................... 121.74 60.48
Purchase consideration paid on acquisition of holding interest in Subsidiaries ............................ (296.33) (76.56)
Sale Proceeds/Subscription (Net) received on divesture of Interest in Subsidiaries/Disposal of Subsidiaries ............................................................................................................................................. 1,154.24 292.22
Exceptional Items :
Sale of Long Term Investments .................................................................................................... 156.29 —
NET CASH USED IN INVESTING ACTIVITIES ......................................................................................... (2,787.61) (2,993.07)
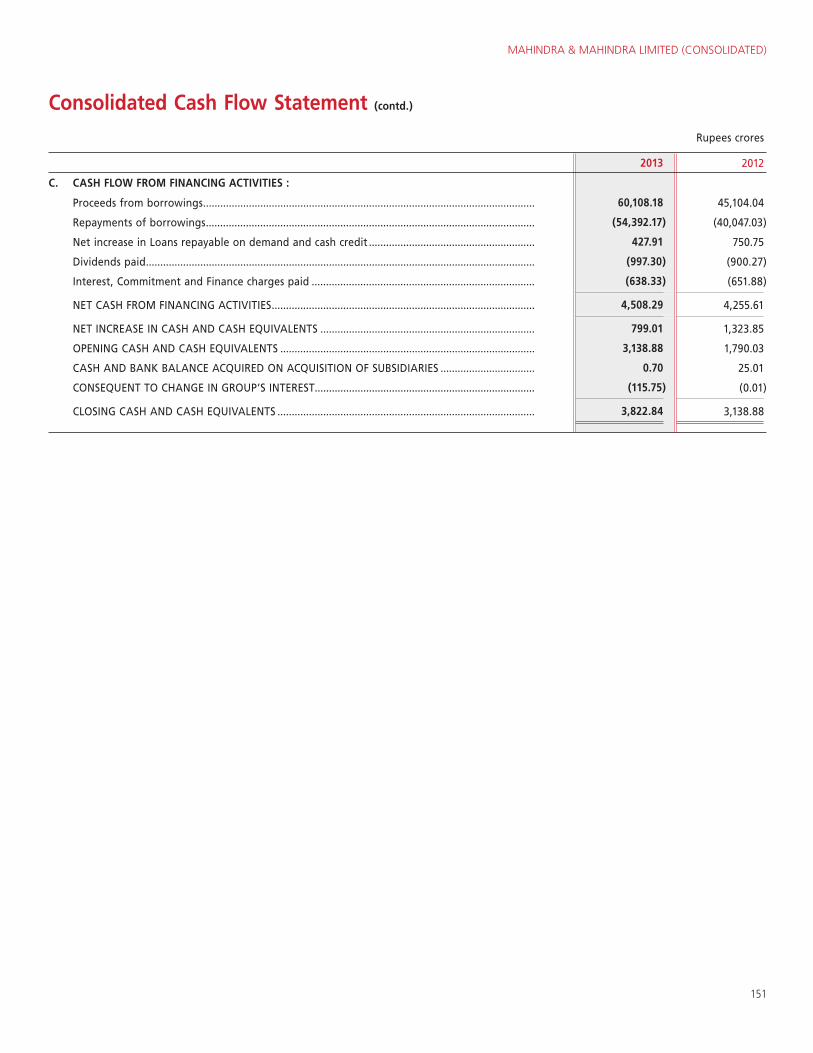
MAHINDRA & MAHINDRA LIMITED (CONSOLIDATED)
151
Consolidated Cash Flow Statement (contd.)
Rupees crores
2013 2012
C. CASH FLOW FROM FINANCING ACTIVITIES :
Proceeds from borrowings .................................................................................................................... 60,108.18 45,104.04
Repayments of borrowings ................................................................................................................... (54,392.17) (40,047.03)
Net increase in Loans repayable on demand and cash credit .......................................................... 427.91 750.75
Dividends paid ........................................................................................................................................ (997.30) (900.27)
Interest, Commitment and Finance charges paid .............................................................................. (638.33) (651.88)
NET CASH FROM FINANCING ACTIVITIES ............................................................................................ 4,508.29 4,255.61
NET INCREASE IN CASH AND CASH EQUIVALENTS ........................................................................... 799.01 1,323.85
OPENING CASH AND CASH EQUIVALENTS ......................................................................................... 3,138.88 1,790.03
CASH AND BANK BALANCE ACQUIRED ON ACQUISITION OF SUBSIDIARIES ................................. 0.70 25.01
CONSEQUENT TO CHANGE IN GROUP’S INTEREST............................................................................. (115.75) (0.01)
CLOSING CASH AND CASH EQUIVALENTS .......................................................................................... 3,822.84 3,138.88
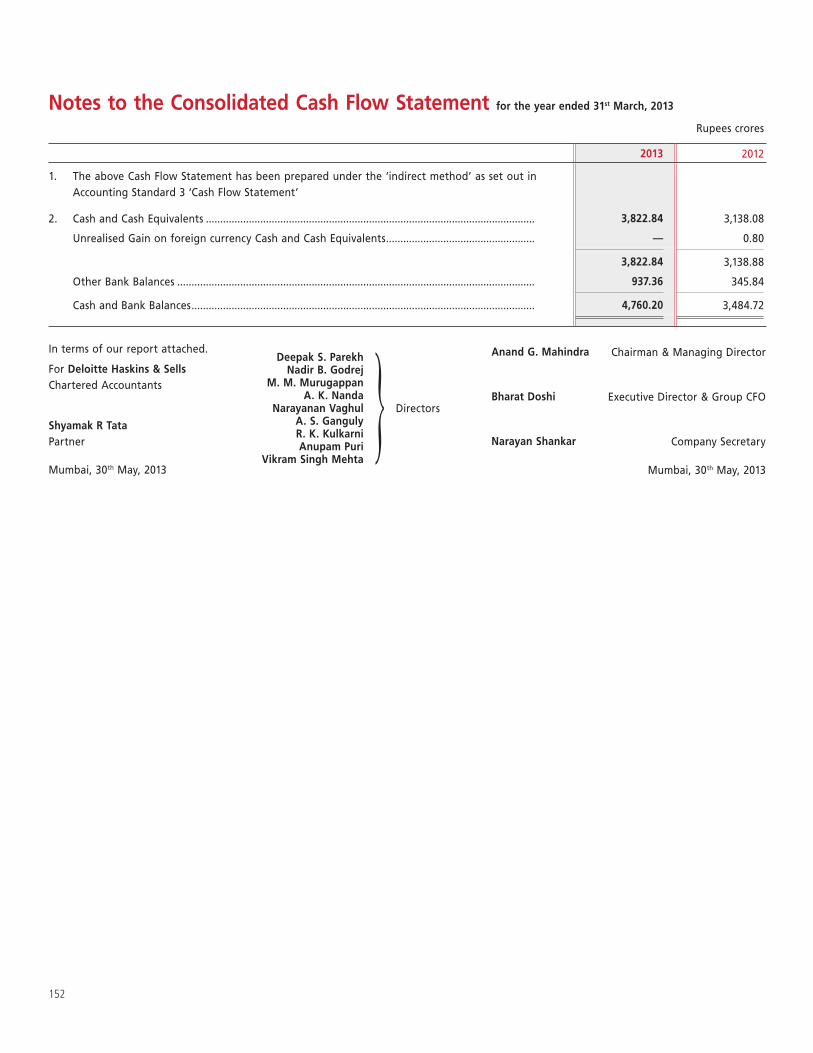
152
Notes to the Consolidated Cash Flow Statement for the year ended 31st March, 2013
Rupees crores
2013 2012
1. The above Cash Flow Statement has been prepared under the ‘indirect method’ as set out in Accounting Standard 3 ‘Cash Flow Statement’
2. Cash and Cash Equivalents ................................................................................................................... 3,822.84 3,138.08
Unrealised Gain on foreign currency Cash and Cash Equivalents .................................................... — 0.80
3,822.84 3,138.88
Other Bank Balances ............................................................................................................................. 937.36 345.84
Cash and Bank Balances ........................................................................................................................ 4,760.20 3,484.72
Deepak S. ParekhNadir B. Godrej
M. M. MurugappanA. K. Nanda
Narayanan Vaghul A. S. GangulyR. K. KulkarniAnupam Puri
Vikram Singh Mehta
Directors
In terms of our report attached.
For Deloitte Haskins & SellsChartered Accountants
Shyamak R TataPartner
Mumbai, 30th May, 2013
Anand G. Mahindra Chairman & Managing Director
Bharat Doshi Executive Director & Group CFO
Narayan Shankar Company Secretary
Mumbai, 30th May, 2013
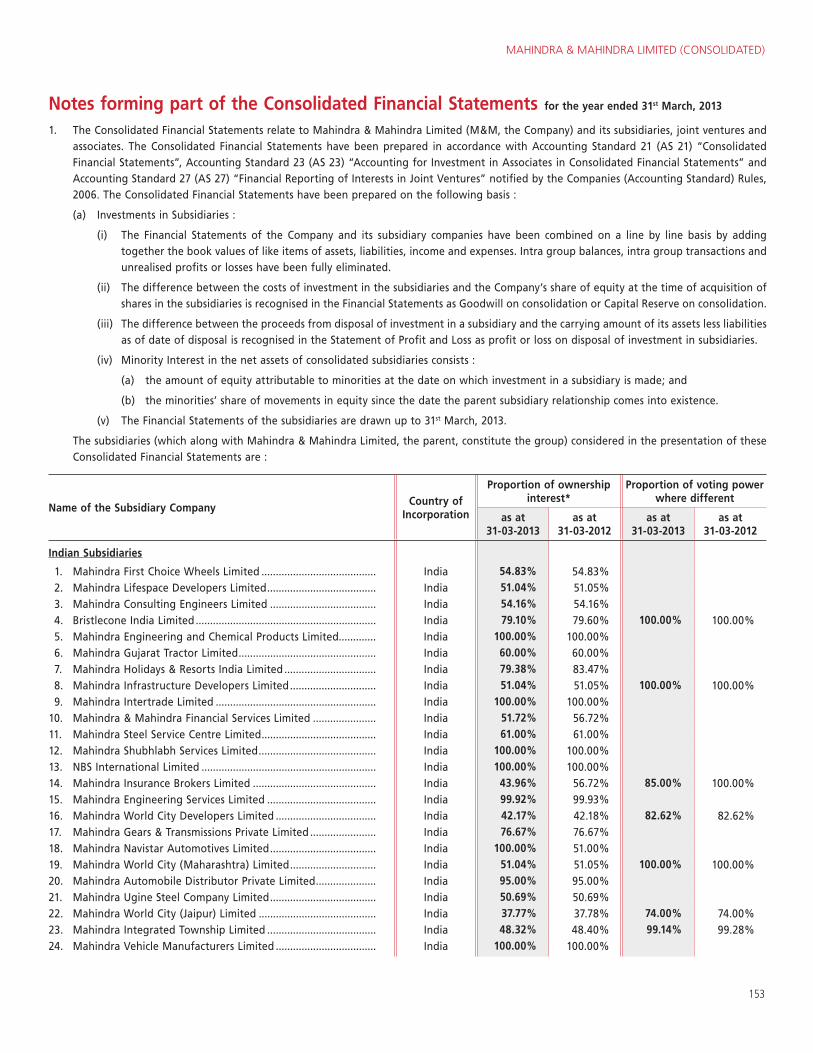
MAHINDRA & MAHINDRA LIMITED (CONSOLIDATED)
153
Notes forming part of the Consolidated Financial Statements for the year ended 31st March, 2013
1. The Consolidated Financial Statements relate to Mahindra & Mahindra Limited (M&M, the Company) and its subsidiaries, joint ventures and associates. The Consolidated Financial Statements have been prepared in accordance with Accounting Standard 21 (AS 21) “Consolidated Financial Statements”, Accounting Standard 23 (AS 23) “Accounting for Investment in Associates in Consolidated Financial Statements” and Accounting Standard 27 (AS 27) “Financial Reporting of Interests in Joint Ventures” notified by the Companies (Accounting Standard) Rules, 2006. The Consolidated Financial Statements have been prepared on the following basis :
(a) Investments in Subsidiaries :
(i) The Financial Statements of the Company and its subsidiary companies have been combined on a line by line basis by adding together the book values of like items of assets, liabilities, income and expenses. Intra group balances, intra group transactions and unrealised profits or losses have been fully eliminated.
(ii) The difference between the costs of investment in the subsidiaries and the Company’s share of equity at the time of acquisition of shares in the subsidiaries is recognised in the Financial Statements as Goodwill on consolidation or Capital Reserve on consolidation.
(iii) The difference between the proceeds from disposal of investment in a subsidiary and the carrying amount of its assets less liabilities as of date of disposal is recognised in the Statement of Profit and Loss as profit or loss on disposal of investment in subsidiaries.
(iv) Minority Interest in the net assets of consolidated subsidiaries consists :
(a) the amount of equity attributable to minorities at the date on which investment in a subsidiary is made; and
(b) the minorities’ share of movements in equity since the date the parent subsidiary relationship comes into existence.
(v) The Financial Statements of the subsidiaries are drawn up to 31st March, 2013.
The subsidiaries (which along with Mahindra & Mahindra Limited, the parent, constitute the group) considered in the presentation of these Consolidated Financial Statements are :
Name of the Subsidiary Company Country of Incorporation
Proportion of ownership interest*
Proportion of voting power where different
as at 31-03-2013
as at 31-03-2012
as at 31-03-2013
as at 31-03-2012
Indian Subsidiaries
1. Mahindra First Choice Wheels Limited ........................................ India 54.83% 54.83% 2. Mahindra Lifespace Developers Limited ...................................... India 51.04% 51.05% 3. Mahindra Consulting Engineers Limited ..................................... India 54.16% 54.16% 4. Bristlecone India Limited ............................................................... India 79.10% 79.60% 100.00% 100.00% 5. Mahindra Engineering and Chemical Products Limited............. India 100.00% 100.00% 6. Mahindra Gujarat Tractor Limited ................................................ India 60.00% 60.00% 7. Mahindra Holidays & Resorts India Limited ................................ India 79.38% 83.47% 8. Mahindra Infrastructure Developers Limited .............................. India 51.04% 51.05% 100.00% 100.00% 9. Mahindra Intertrade Limited ........................................................ India 100.00% 100.00%10. Mahindra & Mahindra Financial Services Limited ...................... India 51.72% 56.72%11. Mahindra Steel Service Centre Limited ........................................ India 61.00% 61.00%12. Mahindra Shubhlabh Services Limited ......................................... India 100.00% 100.00%13. NBS International Limited ............................................................. India 100.00% 100.00%14. Mahindra Insurance Brokers Limited ........................................... India 43.96% 56.72% 85.00% 100.00%15. Mahindra Engineering Services Limited ...................................... India 99.92% 99.93%16. Mahindra World City Developers Limited ................................... India 42.17% 42.18% 82.62% 82.62%17. Mahindra Gears & Transmissions Private Limited ....................... India 76.67% 76.67%18. Mahindra Navistar Automotives Limited ..................................... India 100.00% 51.00%19. Mahindra World City (Maharashtra) Limited .............................. India 51.04% 51.05% 100.00% 100.00%20. Mahindra Automobile Distributor Private Limited ..................... India 95.00% 95.00%21. Mahindra Ugine Steel Company Limited ..................................... India 50.69% 50.69%22. Mahindra World City (Jaipur) Limited ......................................... India 37.77% 37.78% 74.00% 74.00%23. Mahindra Integrated Township Limited ...................................... India 48.32% 48.40% 99.14% 99.28%24. Mahindra Vehicle Manufacturers Limited ................................... India 100.00% 100.00%
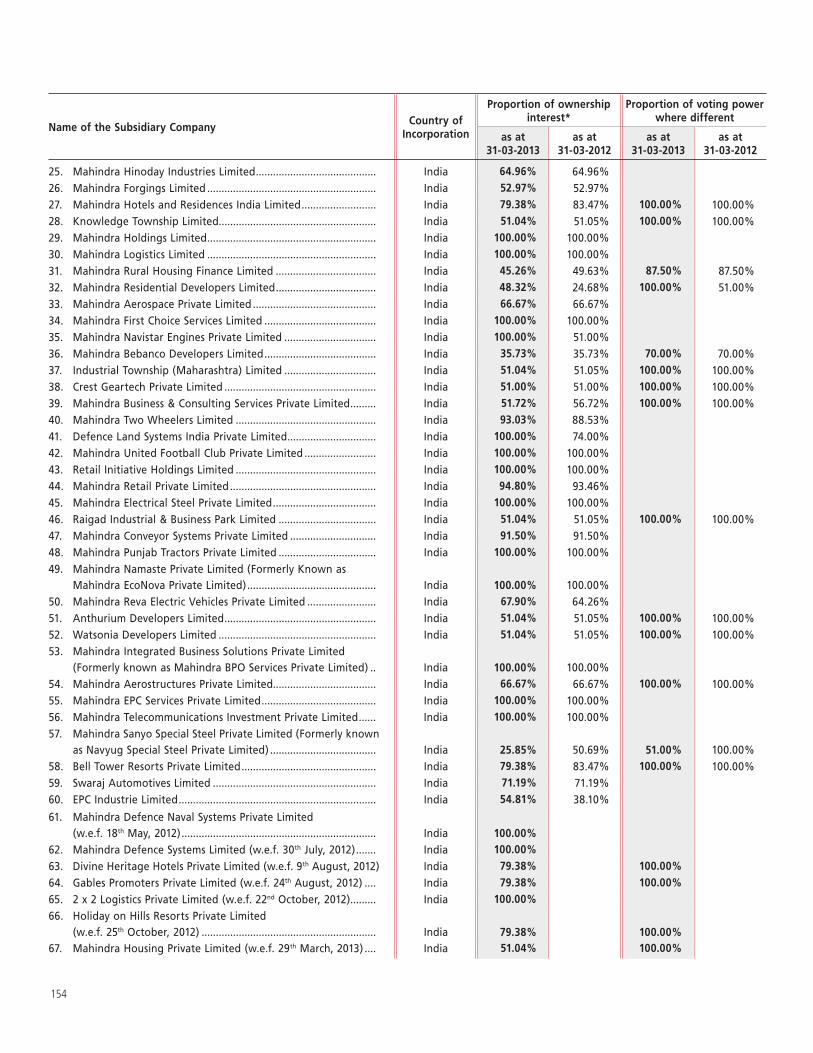
154
Name of the Subsidiary Company Country of Incorporation
Proportion of ownership interest*
Proportion of voting power where different
as at 31-03-2013
as at 31-03-2012
as at 31-03-2013
as at 31-03-2012
25. Mahindra Hinoday Industries Limited .......................................... India 64.96% 64.96%26. Mahindra Forgings Limited ........................................................... India 52.97% 52.97%27. Mahindra Hotels and Residences India Limited .......................... India 79.38% 83.47% 100.00% 100.00%28. Knowledge Township Limited....................................................... India 51.04% 51.05% 100.00% 100.00%29. Mahindra Holdings Limited ........................................................... India 100.00% 100.00%30. Mahindra Logistics Limited ........................................................... India 100.00% 100.00%31. Mahindra Rural Housing Finance Limited ................................... India 45.26% 49.63% 87.50% 87.50%32. Mahindra Residential Developers Limited ................................... India 48.32% 24.68% 100.00% 51.00%33. Mahindra Aerospace Private Limited ........................................... India 66.67% 66.67%34. Mahindra First Choice Services Limited ....................................... India 100.00% 100.00%35. Mahindra Navistar Engines Private Limited ................................ India 100.00% 51.00%36. Mahindra Bebanco Developers Limited ....................................... India 35.73% 35.73% 70.00% 70.00%37. Industrial Township (Maharashtra) Limited ................................ India 51.04% 51.05% 100.00% 100.00%38. Crest Geartech Private Limited ..................................................... India 51.00% 51.00% 100.00% 100.00%39. Mahindra Business & Consulting Services Private Limited ......... India 51.72% 56.72% 100.00% 100.00%40. Mahindra Two Wheelers Limited ................................................. India 93.03% 88.53%41. Defence Land Systems India Private Limited ............................... India 100.00% 74.00%42. Mahindra United Football Club Private Limited ......................... India 100.00% 100.00%43. Retail Initiative Holdings Limited ................................................. India 100.00% 100.00%44. Mahindra Retail Private Limited ................................................... India 94.80% 93.46%45. Mahindra Electrical Steel Private Limited .................................... India 100.00% 100.00%46. Raigad Industrial & Business Park Limited .................................. India 51.04% 51.05% 100.00% 100.00%47. Mahindra Conveyor Systems Private Limited .............................. India 91.50% 91.50%48. Mahindra Punjab Tractors Private Limited .................................. India 100.00% 100.00%49. Mahindra Namaste Private Limited (Formerly Known as
Mahindra EcoNova Private Limited) ............................................. India 100.00% 100.00%50. Mahindra Reva Electric Vehicles Private Limited ........................ India 67.90% 64.26%51. Anthurium Developers Limited ..................................................... India 51.04% 51.05% 100.00% 100.00%52. Watsonia Developers Limited ....................................................... India 51.04% 51.05% 100.00% 100.00%53. Mahindra Integrated Business Solutions Private Limited
(Formerly known as Mahindra BPO Services Private Limited) .. India 100.00% 100.00%54. Mahindra Aerostructures Private Limited.................................... India 66.67% 66.67% 100.00% 100.00%55. Mahindra EPC Services Private Limited ........................................ India 100.00% 100.00%56. Mahindra Telecommunications Investment Private Limited ...... India 100.00% 100.00%57. Mahindra Sanyo Special Steel Private Limited (Formerly known
as Navyug Special Steel Private Limited) ..................................... India 25.85% 50.69% 51.00% 100.00%58. Bell Tower Resorts Private Limited ............................................... India 79.38% 83.47% 100.00% 100.00%59. Swaraj Automotives Limited ......................................................... India 71.19% 71.19%60. EPC Industrie Limited ..................................................................... India 54.81% 38.10%
61. Mahindra Defence Naval Systems Private Limited (w.e.f. 18th May, 2012) .................................................................... India 100.00%
62. Mahindra Defence Systems Limited (w.e.f. 30th July, 2012) ....... India 100.00%63. Divine Heritage Hotels Private Limited (w.e.f. 9th August, 2012) India 79.38% 100.00%64. Gables Promoters Private Limited (w.e.f. 24th August, 2012) .... India 79.38% 100.00%65. 2 x 2 Logistics Private Limited (w.e.f. 22nd October, 2012) ......... India 100.00%66. Holiday on Hills Resorts Private Limited
(w.e.f. 25th October, 2012) ............................................................. India 79.38% 100.00%67. Mahindra Housing Private Limited (w.e.f. 29th March, 2013) .... India 51.04% 100.00%
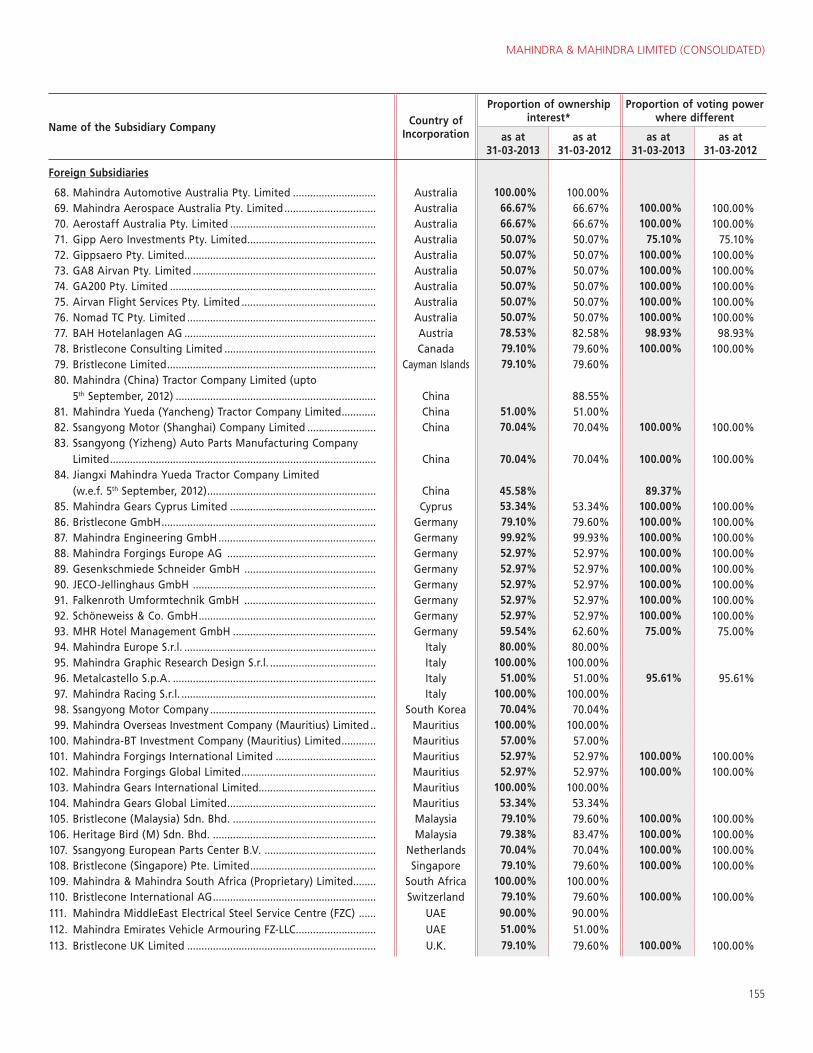
MAHINDRA & MAHINDRA LIMITED (CONSOLIDATED)
155
Name of the Subsidiary Company Country of Incorporation
Proportion of ownership interest*
Proportion of voting power where different
as at 31-03-2013
as at 31-03-2012
as at 31-03-2013
as at 31-03-2012
Foreign Subsidiaries
68. Mahindra Automotive Australia Pty. Limited ............................. Australia 100.00% 100.00% 69. Mahindra Aerospace Australia Pty. Limited ................................ Australia 66.67% 66.67% 100.00% 100.00% 70. Aerostaff Australia Pty. Limited ................................................... Australia 66.67% 66.67% 100.00% 100.00% 71. Gipp Aero Investments Pty. Limited ............................................. Australia 50.07% 50.07% 75.10% 75.10% 72. Gippsaero Pty. Limited ................................................................... Australia 50.07% 50.07% 100.00% 100.00% 73. GA8 Airvan Pty. Limited ................................................................ Australia 50.07% 50.07% 100.00% 100.00% 74. GA200 Pty. Limited ........................................................................ Australia 50.07% 50.07% 100.00% 100.00% 75. Airvan Flight Services Pty. Limited ............................................... Australia 50.07% 50.07% 100.00% 100.00% 76. Nomad TC Pty. Limited .................................................................. Australia 50.07% 50.07% 100.00% 100.00% 77. BAH Hotelanlagen AG ................................................................... Austria 78.53% 82.58% 98.93% 98.93% 78. Bristlecone Consulting Limited ..................................................... Canada 79.10% 79.60% 100.00% 100.00% 79. Bristlecone Limited ......................................................................... Cayman Islands 79.10% 79.60% 80. Mahindra (China) Tractor Company Limited (upto
5th September, 2012) ...................................................................... China 88.55% 81. Mahindra Yueda (Yancheng) Tractor Company Limited ............ China 51.00% 51.00% 82. Ssangyong Motor (Shanghai) Company Limited ........................ China 70.04% 70.04% 100.00% 100.00% 83. Ssangyong (Yizheng) Auto Parts Manufacturing Company
Limited ............................................................................................. China 70.04% 70.04% 100.00% 100.00% 84. Jiangxi Mahindra Yueda Tractor Company Limited
(w.e.f. 5th September, 2012) ........................................................... China 45.58% 89.37% 85. Mahindra Gears Cyprus Limited ................................................... Cyprus 53.34% 53.34% 100.00% 100.00% 86. Bristlecone GmbH ........................................................................... Germany 79.10% 79.60% 100.00% 100.00% 87. Mahindra Engineering GmbH ....................................................... Germany 99.92% 99.93% 100.00% 100.00% 88. Mahindra Forgings Europe AG .................................................... Germany 52.97% 52.97% 100.00% 100.00% 89. Gesenkschmiede Schneider GmbH .............................................. Germany 52.97% 52.97% 100.00% 100.00% 90. JECO-Jellinghaus GmbH ................................................................ Germany 52.97% 52.97% 100.00% 100.00% 91. Falkenroth Umformtechnik GmbH .............................................. Germany 52.97% 52.97% 100.00% 100.00% 92. Schöneweiss & Co. GmbH .............................................................. Germany 52.97% 52.97% 100.00% 100.00% 93. MHR Hotel Management GmbH .................................................. Germany 59.54% 62.60% 75.00% 75.00% 94. Mahindra Europe S.r.l. ................................................................... Italy 80.00% 80.00% 95. Mahindra Graphic Research Design S.r.l. ..................................... Italy 100.00% 100.00% 96. Metalcastello S.p.A. ....................................................................... Italy 51.00% 51.00% 95.61% 95.61% 97. Mahindra Racing S.r.l. .................................................................... Italy 100.00% 100.00% 98. Ssangyong Motor Company .......................................................... South Korea 70.04% 70.04% 99. Mahindra Overseas Investment Company (Mauritius) Limited .. Mauritius 100.00% 100.00%100. Mahindra-BT Investment Company (Mauritius) Limited ............ Mauritius 57.00% 57.00%101. Mahindra Forgings International Limited ................................... Mauritius 52.97% 52.97% 100.00% 100.00%102. Mahindra Forgings Global Limited ............................................... Mauritius 52.97% 52.97% 100.00% 100.00%103. Mahindra Gears International Limited......................................... Mauritius 100.00% 100.00%104. Mahindra Gears Global Limited .................................................... Mauritius 53.34% 53.34%105. Bristlecone (Malaysia) Sdn. Bhd. .................................................. Malaysia 79.10% 79.60% 100.00% 100.00%106. Heritage Bird (M) Sdn. Bhd. ......................................................... Malaysia 79.38% 83.47% 100.00% 100.00%107. Ssangyong European Parts Center B.V. ....................................... Netherlands 70.04% 70.04% 100.00% 100.00%108. Bristlecone (Singapore) Pte. Limited ............................................ Singapore 79.10% 79.60% 100.00% 100.00%109. Mahindra & Mahindra South Africa (Proprietary) Limited........ South Africa 100.00% 100.00%110. Bristlecone International AG ......................................................... Switzerland 79.10% 79.60% 100.00% 100.00%111. Mahindra MiddleEast Electrical Steel Service Centre (FZC) ...... UAE 90.00% 90.00%112. Mahindra Emirates Vehicle Armouring FZ-LLC ............................ UAE 51.00% 51.00%113. Bristlecone UK Limited .................................................................. U.K. 79.10% 79.60% 100.00% 100.00%
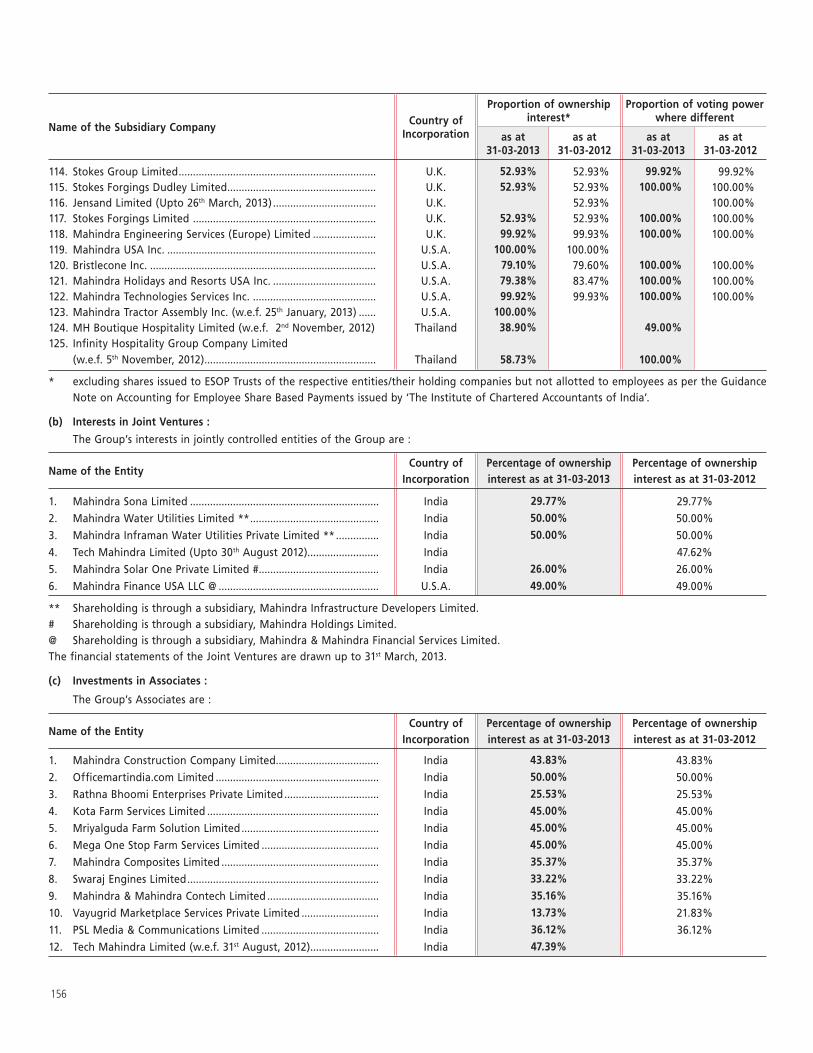
156
Name of the Subsidiary Company Country of Incorporation
Proportion of ownership interest*
Proportion of voting power where different
as at 31-03-2013
as at 31-03-2012
as at 31-03-2013
as at 31-03-2012
114. Stokes Group Limited ..................................................................... U.K. 52.93% 52.93% 99.92% 99.92%115. Stokes Forgings Dudley Limited .................................................... U.K. 52.93% 52.93% 100.00% 100.00%116. Jensand Limited (Upto 26th March, 2013) .................................... U.K. 52.93% 100.00%117. Stokes Forgings Limited ................................................................ U.K. 52.93% 52.93% 100.00% 100.00%118. Mahindra Engineering Services (Europe) Limited ...................... U.K. 99.92% 99.93% 100.00% 100.00%119. Mahindra USA Inc. ......................................................................... U.S.A. 100.00% 100.00%120. Bristlecone Inc. ............................................................................... U.S.A. 79.10% 79.60% 100.00% 100.00%121. Mahindra Holidays and Resorts USA Inc. .................................... U.S.A. 79.38% 83.47% 100.00% 100.00%122. Mahindra Technologies Services Inc. ........................................... U.S.A. 99.92% 99.93% 100.00% 100.00%123. Mahindra Tractor Assembly Inc. (w.e.f. 25th January, 2013) ...... U.S.A. 100.00%124. MH Boutique Hospitality Limited (w.e.f. 2nd November, 2012) Thailand 38.90% 49.00%125. Infinity Hospitality Group Company Limited
(w.e.f. 5th November, 2012) ............................................................ Thailand 58.73% 100.00%
* excluding shares issued to ESOP Trusts of the respective entities/their holding companies but not allotted to employees as per the Guidance Note on Accounting for Employee Share Based Payments issued by ‘The Institute of Chartered Accountants of India’.
(b) Interests in Joint Ventures :
The Group’s interests in jointly controlled entities of the Group are :
Name of the EntityCountry of
IncorporationPercentage of ownership interest as at 31-03-2013
Percentage of ownership interest as at 31-03-2012
1. Mahindra Sona Limited .................................................................. India 29.77% 29.77%
2. Mahindra Water Utilities Limited ** ............................................. India 50.00% 50.00%
3. Mahindra Inframan Water Utilities Private Limited ** ............... India 50.00% 50.00%
4. Tech Mahindra Limited (Upto 30th August 2012)......................... India 47.62%
5. Mahindra Solar One Private Limited # .......................................... India 26.00% 26.00%
6. Mahindra Finance USA LLC @ ........................................................ U.S.A. 49.00% 49.00%
** Shareholding is through a subsidiary, Mahindra Infrastructure Developers Limited.# Shareholding is through a subsidiary, Mahindra Holdings Limited.@ Shareholding is through a subsidiary, Mahindra & Mahindra Financial Services Limited.The financial statements of the Joint Ventures are drawn up to 31st March, 2013.
(c) Investments in Associates :
The Group’s Associates are :
Name of the EntityCountry of
IncorporationPercentage of ownership interest as at 31-03-2013
Percentage of ownership interest as at 31-03-2012
1. Mahindra Construction Company Limited.................................... India 43.83% 43.83%
2. Officemartindia.com Limited ......................................................... India 50.00% 50.00%
3. Rathna Bhoomi Enterprises Private Limited ................................. India 25.53% 25.53%
4. Kota Farm Services Limited ............................................................ India 45.00% 45.00%
5. Mriyalguda Farm Solution Limited ................................................ India 45.00% 45.00%
6. Mega One Stop Farm Services Limited ......................................... India 45.00% 45.00%
7. Mahindra Composites Limited ....................................................... India 35.37% 35.37%
8. Swaraj Engines Limited ................................................................... India 33.22% 33.22%
9. Mahindra & Mahindra Contech Limited ....................................... India 35.16% 35.16%
10. Vayugrid Marketplace Services Private Limited ........................... India 13.73% 21.83%
11. PSL Media & Communications Limited ......................................... India 36.12% 36.12%
12. Tech Mahindra Limited (w.e.f. 31st August, 2012) ........................ India 47.39%
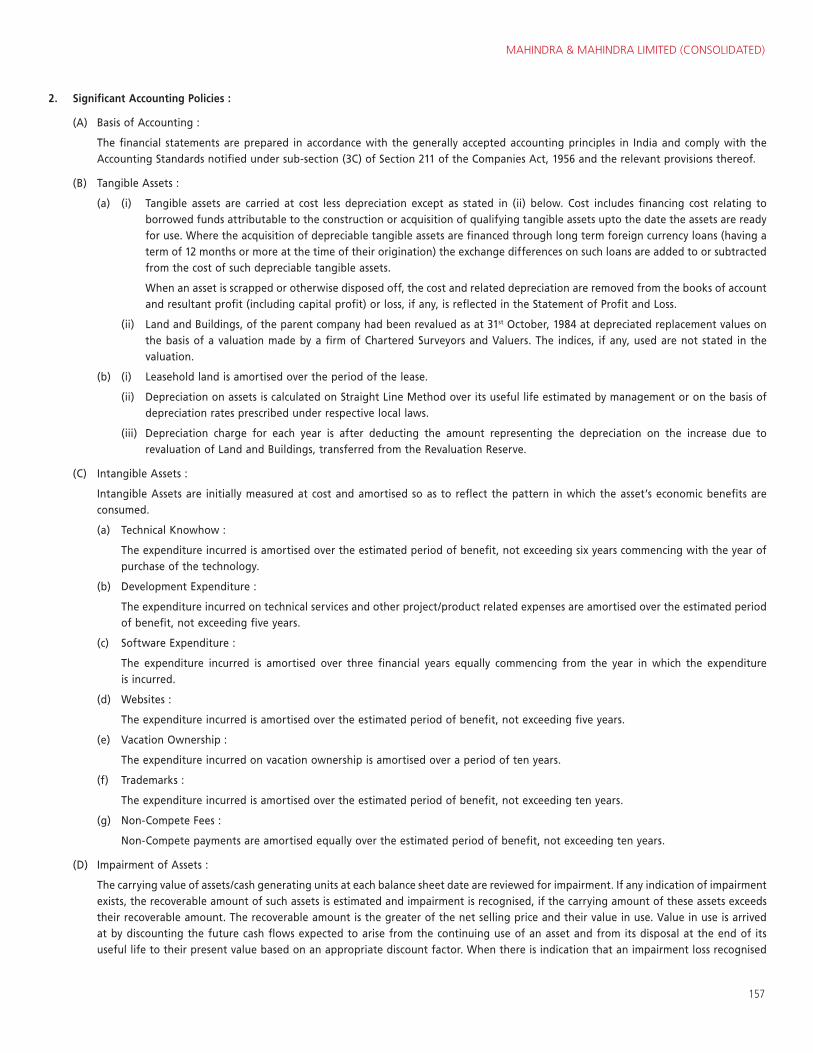
MAHINDRA & MAHINDRA LIMITED (CONSOLIDATED)
157
2. Significant Accounting Policies :
(A) Basis of Accounting :
The financial statements are prepared in accordance with the generally accepted accounting principles in India and comply with the Accounting Standards notified under sub-section (3C) of Section 211 of the Companies Act, 1956 and the relevant provisions thereof.
(B) Tangible Assets :
(a) (i) Tangible assets are carried at cost less depreciation except as stated in (ii) below. Cost includes financing cost relating to borrowed funds attributable to the construction or acquisition of qualifying tangible assets upto the date the assets are ready for use. Where the acquisition of depreciable tangible assets are financed through long term foreign currency loans (having a term of 12 months or more at the time of their origination) the exchange differences on such loans are added to or subtracted from the cost of such depreciable tangible assets.
When an asset is scrapped or otherwise disposed off, the cost and related depreciation are removed from the books of account and resultant profit (including capital profit) or loss, if any, is reflected in the Statement of Profit and Loss.
(ii) Land and Buildings, of the parent company had been revalued as at 31st October, 1984 at depreciated replacement values on the basis of a valuation made by a firm of Chartered Surveyors and Valuers. The indices, if any, used are not stated in the valuation.
(b) (i) Leasehold land is amortised over the period of the lease.
(ii) Depreciation on assets is calculated on Straight Line Method over its useful life estimated by management or on the basis of depreciation rates prescribed under respective local laws.
(iii) Depreciation charge for each year is after deducting the amount representing the depreciation on the increase due to revaluation of Land and Buildings, transferred from the Revaluation Reserve.
(C) Intangible Assets :
Intangible Assets are initially measured at cost and amortised so as to reflect the pattern in which the asset’s economic benefits are consumed.
(a) Technical Knowhow :
The expenditure incurred is amortised over the estimated period of benefit, not exceeding six years commencing with the year of purchase of the technology.
(b) Development Expenditure :
The expenditure incurred on technical services and other project/product related expenses are amortised over the estimated period of benefit, not exceeding five years.
(c) Software Expenditure :
The expenditure incurred is amortised over three financial years equally commencing from the year in which the expenditure is incurred.
(d) Websites :
The expenditure incurred is amortised over the estimated period of benefit, not exceeding five years.
(e) Vacation Ownership :
The expenditure incurred on vacation ownership is amortised over a period of ten years.
(f) Trademarks :
The expenditure incurred is amortised over the estimated period of benefit, not exceeding ten years.
(g) Non-Compete Fees :
Non-Compete payments are amortised equally over the estimated period of benefit, not exceeding ten years.
(D) Impairment of Assets :
The carrying value of assets/cash generating units at each balance sheet date are reviewed for impairment. If any indication of impairment exists, the recoverable amount of such assets is estimated and impairment is recognised, if the carrying amount of these assets exceeds their recoverable amount. The recoverable amount is the greater of the net selling price and their value in use. Value in use is arrived at by discounting the future cash flows expected to arise from the continuing use of an asset and from its disposal at the end of its useful life to their present value based on an appropriate discount factor. When there is indication that an impairment loss recognised
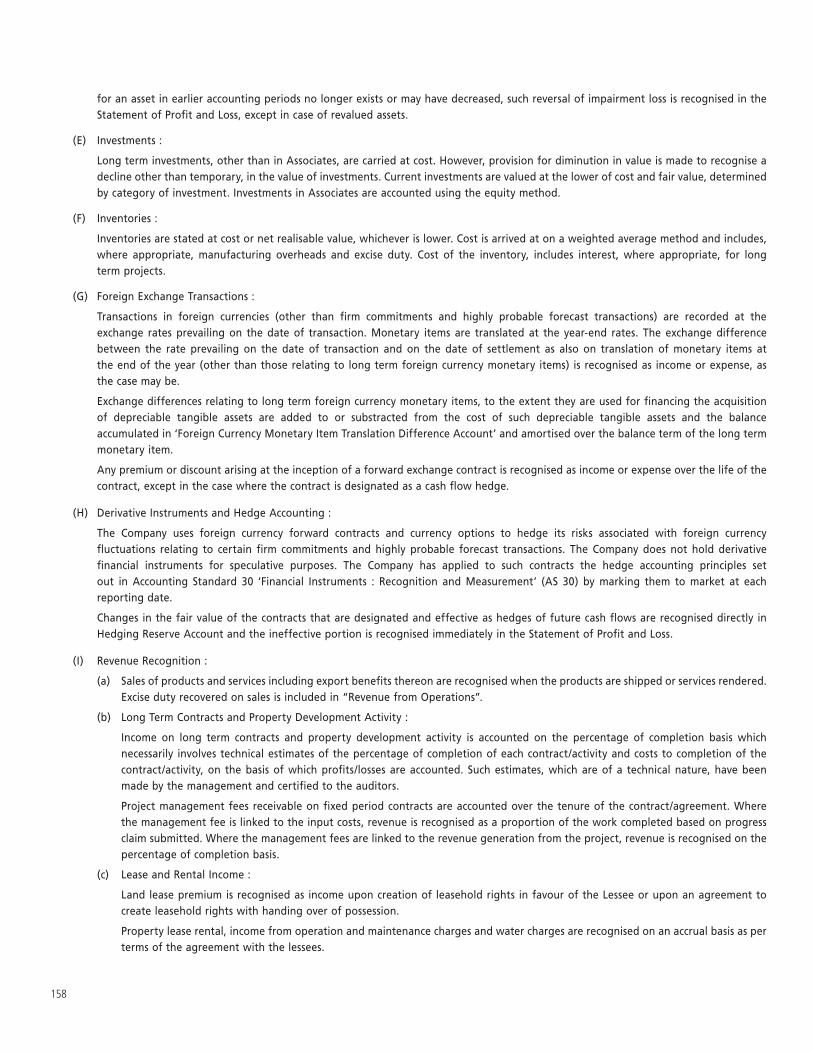
158
for an asset in earlier accounting periods no longer exists or may have decreased, such reversal of impairment loss is recognised in the Statement of Profit and Loss, except in case of revalued assets.
(E) Investments :
Long term investments, other than in Associates, are carried at cost. However, provision for diminution in value is made to recognise a decline other than temporary, in the value of investments. Current investments are valued at the lower of cost and fair value, determined by category of investment. Investments in Associates are accounted using the equity method.
(F) Inventories :
Inventories are stated at cost or net realisable value, whichever is lower. Cost is arrived at on a weighted average method and includes, where appropriate, manufacturing overheads and excise duty. Cost of the inventory, includes interest, where appropriate, for long term projects.
(G) Foreign Exchange Transactions :
Transactions in foreign currencies (other than firm commitments and highly probable forecast transactions) are recorded at the exchange rates prevailing on the date of transaction. Monetary items are translated at the year-end rates. The exchange difference between the rate prevailing on the date of transaction and on the date of settlement as also on translation of monetary items at the end of the year (other than those relating to long term foreign currency monetary items) is recognised as income or expense, as the case may be.
Exchange differences relating to long term foreign currency monetary items, to the extent they are used for financing the acquisition of depreciable tangible assets are added to or substracted from the cost of such depreciable tangible assets and the balance accumulated in ‘Foreign Currency Monetary Item Translation Difference Account’ and amortised over the balance term of the long term monetary item.
Any premium or discount arising at the inception of a forward exchange contract is recognised as income or expense over the life of the contract, except in the case where the contract is designated as a cash flow hedge.
(H) Derivative Instruments and Hedge Accounting :
The Company uses foreign currency forward contracts and currency options to hedge its risks associated with foreign currency fluctuations relating to certain firm commitments and highly probable forecast transactions. The Company does not hold derivative financial instruments for speculative purposes. The Company has applied to such contracts the hedge accounting principles set out in Accounting Standard 30 ‘Financial Instruments : Recognition and Measurement’ (AS 30) by marking them to market at each reporting date.
Changes in the fair value of the contracts that are designated and effective as hedges of future cash flows are recognised directly in Hedging Reserve Account and the ineffective portion is recognised immediately in the Statement of Profit and Loss.
(I) Revenue Recognition :
(a) Sales of products and services including export benefits thereon are recognised when the products are shipped or services rendered. Excise duty recovered on sales is included in “Revenue from Operations”.
(b) Long Term Contracts and Property Development Activity :
Income on long term contracts and property development activity is accounted on the percentage of completion basis which necessarily involves technical estimates of the percentage of completion of each contract/activity and costs to completion of the contract/activity, on the basis of which profits/losses are accounted. Such estimates, which are of a technical nature, have been made by the management and certified to the auditors.
Project management fees receivable on fixed period contracts are accounted over the tenure of the contract/agreement. Where the management fee is linked to the input costs, revenue is recognised as a proportion of the work completed based on progress claim submitted. Where the management fees are linked to the revenue generation from the project, revenue is recognised on the percentage of completion basis.
(c) Lease and Rental Income :
Land lease premium is recognised as income upon creation of leasehold rights in favour of the Lessee or upon an agreement to create leasehold rights with handing over of possession.
Property lease rental, income from operation and maintenance charges and water charges are recognised on an accrual basis as per terms of the agreement with the lessees.
MAHINDRA & MAHINDRA LIMITED (CONSOLIDATED)
159
(d) Income from loan, income from subvention/service/document charges :
Income from loan transactions is accounted for by applying the interest rate implicit in such contracts. Subvention received from dealers/manufacturers on retail cases is booked over the period of the contract. However, service charges and documentation charges are booked at the commencement of the contract.
(e) Vacation Ownership Business :
The activity of selling vacation ownership and providing holiday facilities to members for a specified period each year, over a number of years, for which membership fee is collected either in full up front, or on a deferred payment basis. Admission fee, which is non-refundable, is recognised as income on admission of member. Entitlement fee, which entitles the vacation ownership member for the vacation ownership facilities over the membership usage period, is recognised as income equally over the usage period. Request for cancellation of membership is accounted for when it is accepted.
(f) Income from Assignment :
In case of assignment of receivables, the assets are derecognised as all the rights, titles, future receivables and interest thereof are assigned to the purchaser. On derecognising, the difference between book value of the receivables assigned and consideration received as reduced by the estimated provision for loss/expense and incidental expenses related to the transaction is recognised as gain or loss arising on assignment.
(g) Dividends from investments are recognised in the Statement of Profit and Loss when the right to receive payment is established.
(J) Government Grants :
The Company, directly or indirectly through a consortium of Mahindra Group Companies, is entitled to various incentives from government authorities in respect of manufacturing units located in developing regions. The Company accounts for its entitlement as income on accrual basis.
(K) Employee Benefits :
In respect of Defined Contribution Plan/Defined Benefit Plan/Long term Compensated Absences.
Group’s contributions paid/payable during the year to Superannuation Fund, ESIC and Labour Welfare Fund are recognised in the Statement of Profit and Loss.
Contributions to Provident Fund are made to Trusts administered by group companies or Regional Provident Fund Commissioners and are charged to Statement of Profit and Loss as incurred. The Company is liable for the contribution and any shortfall in interest between the amount of interest realised by the investment and the interest payable to members at the rate declared by the Government of India.
Company’s liability towards gratuity, long term compensated absences, post retirement medical benefit and post retirement housing allowance schemes are determined by independent actuaries, using the projected unit credit method. Past services are recognised on a straight line basis over the average period until the benefits become vested. Actuarial gains and losses are recognised immediately in the Statement of Profit and Loss as income or expense. Obligation is measured at the present value of estimated future cash flows using a discounted rate that is determined by reference to the market yields at the Balance Sheet date on Government Bonds where the currency and terms of the Government Bonds are consistent with the currency and estimated terms of the defined benefit obligation.
In respect of Employee Stock Option Scheme :
The compensation cost of stock options granted to employees is measured by the Intrinsic Value Method. The intrinsic value, which is the excess of the market price of the underlying equity shares as of the date of the grant over the exercise price of the option, is recognised and amortised on straight line basis over the vesting period.
(L) Borrowing Costs :
All borrowing costs are charged to the Statement of Profit and Loss except :
(i) Borrowing costs that are attributable to the acquisition or construction of assets that necessarily take a substantial period of time to get ready for their intended use, which are capitalised as part of the cost of such assets.
(ii) Expenses incurred on raising long term borrowings are amortised over the period of borrowings. On early buyback, conversion or repayment of borrowings, any unamortised expenditure is fully written off in that year.
(M) Product Warranty :
In respect of warranties given by the Company on sale of certain products, the estimated costs of these warranties are accrued at the time of sale. The estimates for accounting of warranties are reviewed and revisions are made as required.
160
(N) Leases :
The Company’s significant leasing arrangements are in respect of operating leases for premises (residential, office, stores, godowns, computer hardware etc.). The leasing arrangements, which are not non-cancellable, range between eleven months and five years generally, and are usually renewable by mutual consent on agreed terms. The aggregate lease rentals payable are charged as rent.
(O) Taxes on Income :
Current Tax is determined as the amount of tax payable in respect of taxable income for the year. Deferred Tax is recognised, subject to consideration of prudence, on timing differences, being the difference between taxable income and accounting income that originate in one period and are capable of reversal in one or more subsequent periods. Deferred Tax Assets arising on account of unabsorbed depreciation or carry forward of tax losses are recognised only to the extent that there is virtual certainty supported by convincing evidence that sufficient future taxable income will be available against which such Deferred Tax Assets can be realised.
Minimum Alternate Tax (MAT) paid in accordance with the tax laws, which gives future economic benefits in the form of adjustment to future income tax liability, is considered as an asset if there is convincing evidence that the Company will pay normal income tax against which the MAT paid will be adjusted.
(P) Segment Reporting :
The accounting policies adopted for segment reporting are in line with the accounting policies of the Group. Segments are identified having regard to the dominant source and nature of risks and returns and internal organisation and management structure.
Revenues and expenses have been identified to the segments based on their relationship to the business activity of the segment.
Income/Expenses relating to the enterprise as a whole and not allocable on a reasonable basis to business segments are reflected as unallocated corporate income/expenses. Inter-segment transfers are at prices which are generally market led.
3. Certain changes in Group Structure : During the year ended 31st March, 2013, the following changes in Group structure have taken place and the same have been appropriately dealt with in the Consolidated Financial Statements.
(i) Mahindra & Mahindra Financial Services Limited (MMFSL) : MMFSL, a subsidiary came out with a Qualified Institutional Placement (QIP) wherein they placed 97,50,257 shares of Rs. 10/- each with Qualified Institutional Buyers (QIBs) at a premium of Rs. 879/- per share. This has led to a dilution of the M&M’s holding in MMFSL from 56.72 % to 51.72%.
(ii) Tech Mahindra Limited (TML) : During the year, pursuant to the sale of shares by the JV partner in TML leading to the partners shareholding falling below 10%, the Joint Venture agreement between the Company and the Joint Venture partner stood terminated thereby making TML an Associate company from a Joint Venture Company.
During the year TML has been proportionately consolidated line by line as a jointly controlled entity for five months and subsequently for the balance seven months only the Share of Profit/(Loss) in it was considered as an Associate under the equity accounting method.
(iii) Mahindra Navistar Automotives Limited (MNAL) : The company had in November 2005 entered into an agreement with a Joint Venture Partner to manufacture Light Commercial Vehicles and Heavy Commercial Vehicles. During the year, the Joint Venture partner decided to exit the Joint Venture and M&M acquired the entire stake of its Joint Venture partner thereby increasing its stake in MNAL from 51% to 100% thereby making MNAL a wholly owned subsidiary of the Company.
(iv) Mahindra Navistar Engines Private Limited (MNEPL) : The company had in November 2007 entered into an agreement with a Joint Venture Partner to manufacture engines for both on-highway and off-highway applications including for the medium and heavy commercial vehicle segment of MNAL products. During the year the Joint Venture partner decided to exit the Joint Venture and M&M acquired the entire stake of its Joint Venture partner thereby increasing its stake in MNEPL from 51% to 100% thereby making MNEPL a wholly owned subsidiary of the Company.
(v) Mahindra Holidays and Resorts India Limited (MHRIL) : The Department of Economic Affairs of the Ministry of Finance by its notifications dated June 4, 2010 and August 9, 2010, had decided to increase the minimum public holding requirement for listed companies from 10% to 25% of their total paid-up capital by June 2013.
To comply with the same the Company sold 34,00,000 equity shares of Rs. 10/- thereby reducing its holding in MHRIL to 79.38%.
(vi) EPC Industrié Limited (EPCI) : EPC Industrié Limited, engaged in the business of manufacturing and marketing micro irrigation system successfully completed its Rights Issue. As a result of the same, M&M’s holding in EPC increased from 38.10% to 54.81%.
The previous year’s figures are to that extent not strictly comparable to those of the current year.
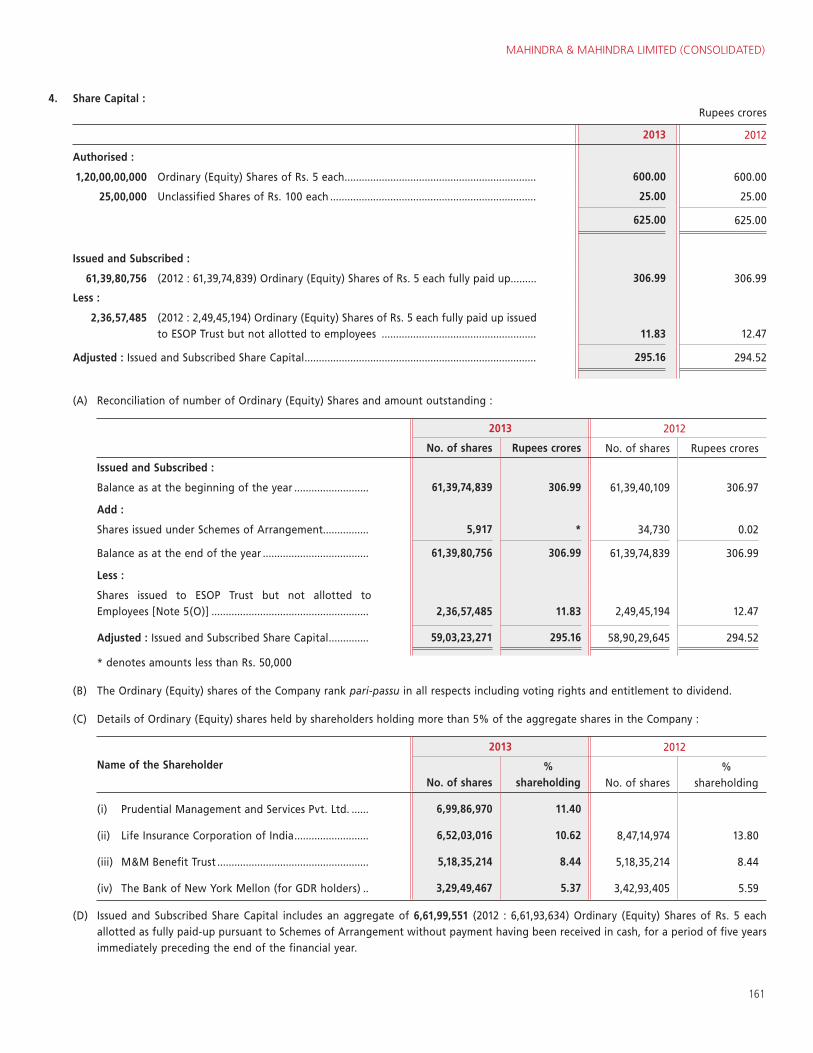
MAHINDRA & MAHINDRA LIMITED (CONSOLIDATED)
161
4. Share Capital :Rupees crores
2013 2012
Authorised :
1,20,00,00,000 Ordinary (Equity) Shares of Rs. 5 each ................................................................... 600.00 600.00
25,00,000 Unclassified Shares of Rs. 100 each ........................................................................ 25.00 25.00
625.00 625.00
Issued and Subscribed :
61,39,80,756 (2012 : 61,39,74,839) Ordinary (Equity) Shares of Rs. 5 each fully paid up......... 306.99 306.99
Less :
2,36,57,485 (2012 : 2,49,45,194) Ordinary (Equity) Shares of Rs. 5 each fully paid up issued to ESOP Trust but not allotted to employees ...................................................... 11.83 12.47
Adjusted : Issued and Subscribed Share Capital ................................................................................. 295.16 294.52
(A) Reconciliation of number of Ordinary (Equity) Shares and amount outstanding :
2013 2012
No. of shares Rupees crores No. of shares Rupees crores
Issued and Subscribed :
Balance as at the beginning of the year .......................... 61,39,74,839 306.99 61,39,40,109 306.97
Add :
Shares issued under Schemes of Arrangement................ 5,917 * 34,730 0.02
Balance as at the end of the year ..................................... 61,39,80,756 306.99 61,39,74,839 306.99
Less :
Shares issued to ESOP Trust but not allotted to Employees [Note 5(O)] ....................................................... 2,36,57,485 11.83 2,49,45,194 12.47
Adjusted : Issued and Subscribed Share Capital .............. 59,03,23,271 295.16 58,90,29,645 294.52
* denotes amounts less than Rs. 50,000
(B) The Ordinary (Equity) shares of the Company rank pari-passu in all respects including voting rights and entitlement to dividend.
(C) Details of Ordinary (Equity) shares held by shareholders holding more than 5% of the aggregate shares in the Company :
Name of the Shareholder
2013 2012
No. of shares
% shareholding
No. of shares
% shareholding
(i) Prudential Management and Services Pvt. Ltd. ...... 6,99,86,970 11.40
(ii) Life Insurance Corporation of India .......................... 6,52,03,016 10.62 8,47,14,974 13.80
(iii) M&M Benefit Trust ..................................................... 5,18,35,214 8.44 5,18,35,214 8.44
(iv) The Bank of New York Mellon (for GDR holders) .. 3,29,49,467 5.37 3,42,93,405 5.59
(D) Issued and Subscribed Share Capital includes an aggregate of 6,61,99,551 (2012 : 6,61,93,634) Ordinary (Equity) Shares of Rs. 5 each allotted as fully paid-up pursuant to Schemes of Arrangement without payment having been received in cash, for a period of five years immediately preceding the end of the financial year.
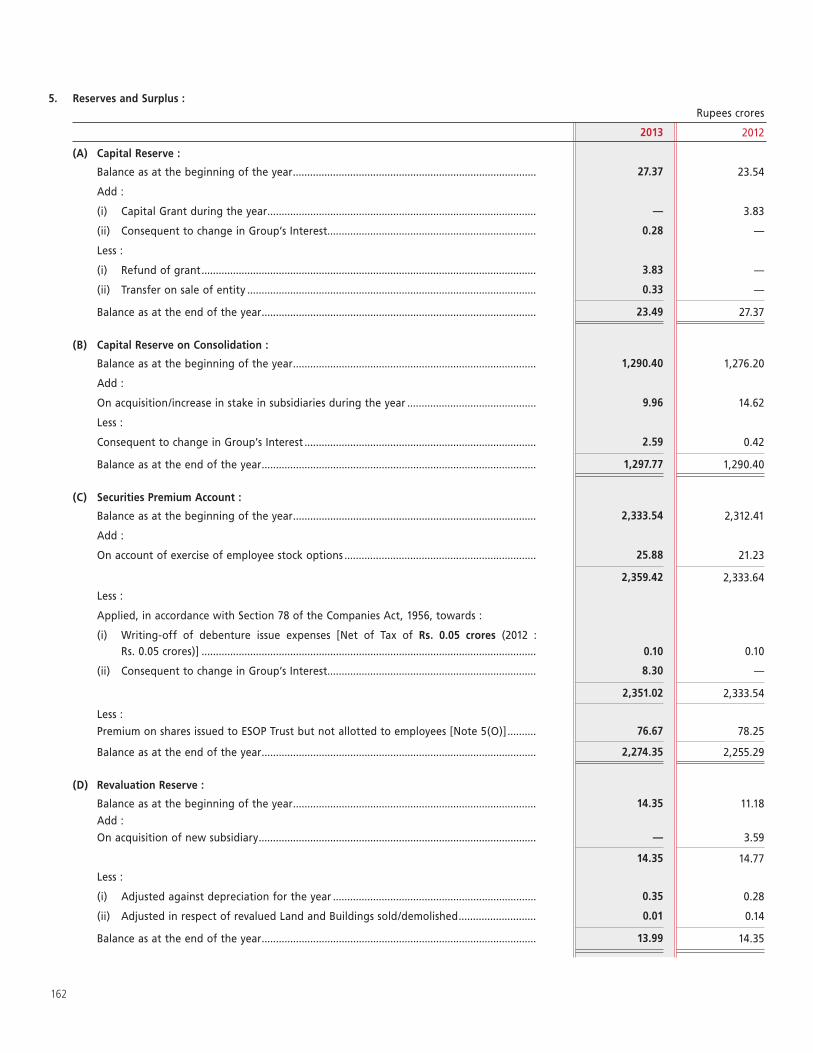
162
5. Reserves and Surplus : (contd.)Rupees crores
2013 2012
(A) Capital Reserve :
Balance as at the beginning of the year ..................................................................................... 27.37 23.54
Add :
(i) Capital Grant during the year .............................................................................................. — 3.83
(ii) Consequent to change in Group’s Interest......................................................................... 0.28 —
Less :
(i) Refund of grant ..................................................................................................................... 3.83 —
(ii) Transfer on sale of entity ..................................................................................................... 0.33 —
Balance as at the end of the year ................................................................................................ 23.49 27.37
(B) Capital Reserve on Consolidation :
Balance as at the beginning of the year ..................................................................................... 1,290.40 1,276.20
Add :
On acquisition/increase in stake in subsidiaries during the year ............................................. 9.96 14.62
Less :
Consequent to change in Group’s Interest ................................................................................. 2.59 0.42
Balance as at the end of the year ................................................................................................ 1,297.77 1,290.40
(C) Securities Premium Account :
Balance as at the beginning of the year ..................................................................................... 2,333.54 2,312.41
Add :
On account of exercise of employee stock options ................................................................... 25.88 21.23
2,359.42 2,333.64
Less :
Applied, in accordance with Section 78 of the Companies Act, 1956, towards :
(i) Writing-off of debenture issue expenses [Net of Tax of Rs. 0.05 crores (2012 : Rs. 0.05 crores)] ..................................................................................................................... 0.10 0.10
(ii) Consequent to change in Group’s Interest......................................................................... 8.30 —
2,351.02 2,333.54
Less :
Premium on shares issued to ESOP Trust but not allotted to employees [Note 5(O)] .......... 76.67 78.25
Balance as at the end of the year ................................................................................................ 2,274.35 2,255.29
(D) Revaluation Reserve :
Balance as at the beginning of the year ..................................................................................... 14.35 11.18
Add :
On acquisition of new subsidiary ................................................................................................. — 3.59
14.35 14.77
Less :
(i) Adjusted against depreciation for the year ....................................................................... 0.35 0.28
(ii) Adjusted in respect of revalued Land and Buildings sold/demolished ........................... 0.01 0.14
Balance as at the end of the year ................................................................................................ 13.99 14.35
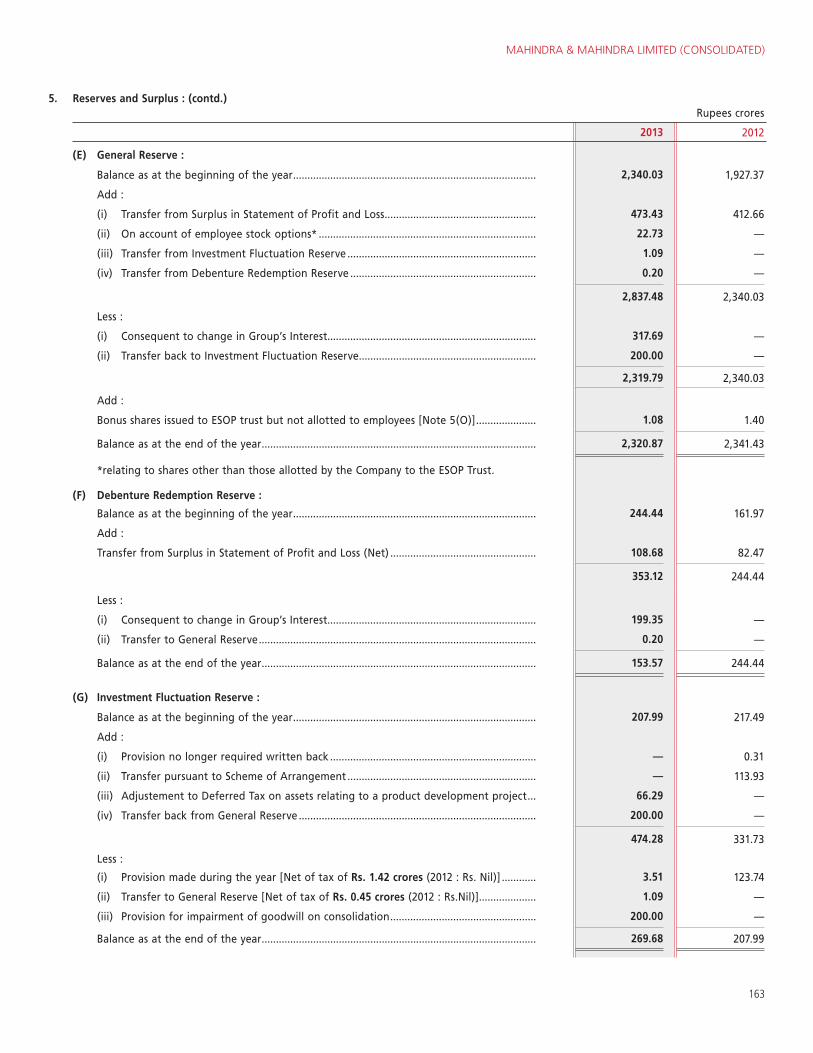
MAHINDRA & MAHINDRA LIMITED (CONSOLIDATED)
163
5. Reserves and Surplus : (contd.)Rupees crores
2013 2012
(E) General Reserve :
Balance as at the beginning of the year ..................................................................................... 2,340.03 1,927.37
Add :
(i) Transfer from Surplus in Statement of Profit and Loss ..................................................... 473.43 412.66
(ii) On account of employee stock options* ............................................................................ 22.73 —
(iii) Transfer from Investment Fluctuation Reserve .................................................................. 1.09 —
(iv) Transfer from Debenture Redemption Reserve ................................................................. 0.20 —
2,837.48 2,340.03
Less :
(i) Consequent to change in Group’s Interest......................................................................... 317.69 —
(ii) Transfer back to Investment Fluctuation Reserve .............................................................. 200.00 —
2,319.79 2,340.03
Add :
Bonus shares issued to ESOP trust but not allotted to employees [Note 5(O)] ..................... 1.08 1.40
Balance as at the end of the year ................................................................................................ 2,320.87 2,341.43
*relating to shares other than those allotted by the Company to the ESOP Trust.
(F) Debenture Redemption Reserve :
Balance as at the beginning of the year ..................................................................................... 244.44 161.97
Add :
Transfer from Surplus in Statement of Profit and Loss (Net) ................................................... 108.68 82.47
353.12 244.44
Less :
(i) Consequent to change in Group’s Interest......................................................................... 199.35 —
(ii) Transfer to General Reserve ................................................................................................. 0.20 —
Balance as at the end of the year ................................................................................................ 153.57 244.44
(G) Investment Fluctuation Reserve :
Balance as at the beginning of the year ..................................................................................... 207.99 217.49
Add :
(i) Provision no longer required written back ........................................................................ — 0.31
(ii) Transfer pursuant to Scheme of Arrangement .................................................................. — 113.93
(iii) Adjustement to Deferred Tax on assets relating to a product development project ... 66.29 —
(iv) Transfer back from General Reserve ................................................................................... 200.00 —
474.28 331.73
Less :
(i) Provision made during the year [Net of tax of Rs. 1.42 crores (2012 : Rs. Nil)] ............ 3.51 123.74
(ii) Transfer to General Reserve [Net of tax of Rs. 0.45 crores (2012 : Rs.Nil)] .................... 1.09 —
(iii) Provision for impairment of goodwill on consolidation ................................................... 200.00 —
Balance as at the end of the year ................................................................................................ 269.68 207.99
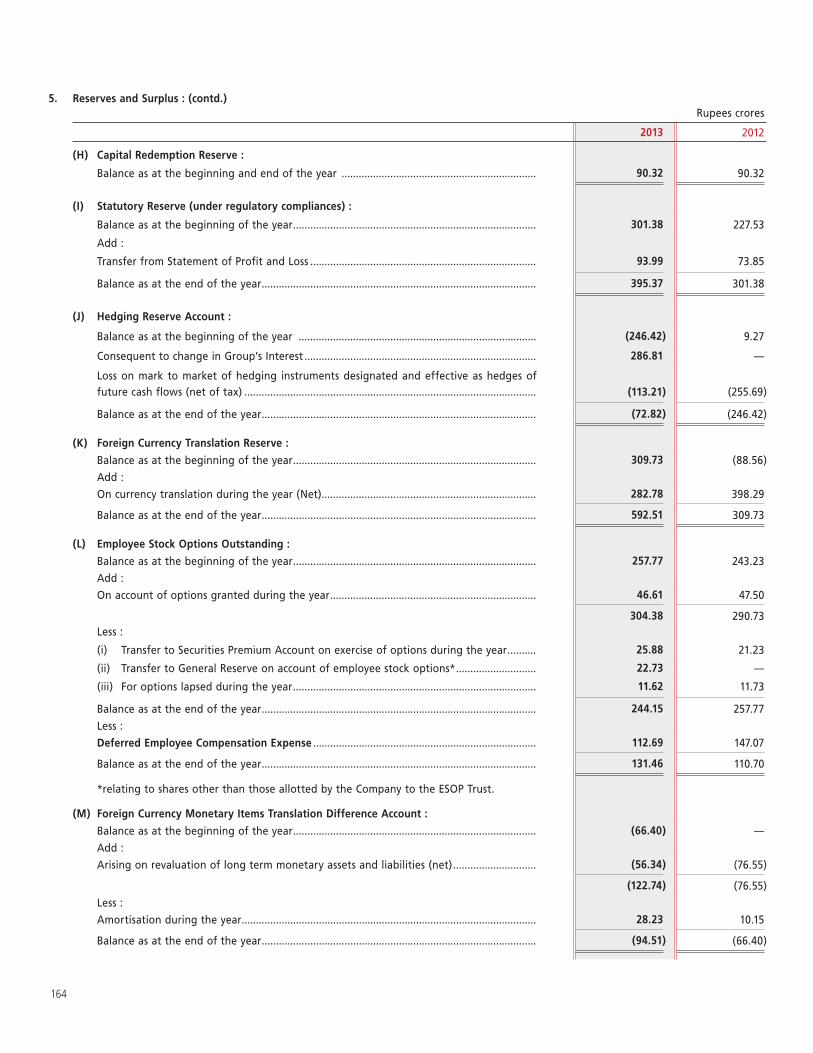
164
5. Reserves and Surplus : (contd.)Rupees crores
2013 2012
(H) Capital Redemption Reserve :
Balance as at the beginning and end of the year .................................................................... 90.32 90.32
(I) Statutory Reserve (under regulatory compliances) :
Balance as at the beginning of the year ..................................................................................... 301.38 227.53
Add :
Transfer from Statement of Profit and Loss ............................................................................... 93.99 73.85
Balance as at the end of the year ................................................................................................ 395.37 301.38
(J) Hedging Reserve Account :
Balance as at the beginning of the year ................................................................................... (246.42) 9.27
Consequent to change in Group’s Interest ................................................................................. 286.81 —
Loss on mark to market of hedging instruments designated and effective as hedges of future cash flows (net of tax) ...................................................................................................... (113.21) (255.69)
Balance as at the end of the year ................................................................................................ (72.82) (246.42)
(K) Foreign Currency Translation Reserve :
Balance as at the beginning of the year ..................................................................................... 309.73 (88.56)
Add :
On currency translation during the year (Net)........................................................................... 282.78 398.29
Balance as at the end of the year ................................................................................................ 592.51 309.73
(L) Employee Stock Options Outstanding :
Balance as at the beginning of the year ..................................................................................... 257.77 243.23
Add :
On account of options granted during the year ........................................................................ 46.61 47.50
304.38 290.73 Less :
(i) Transfer to Securities Premium Account on exercise of options during the year .......... 25.88 21.23
(ii) Transfer to General Reserve on account of employee stock options* ............................ 22.73 —
(iii) For options lapsed during the year ..................................................................................... 11.62 11.73
Balance as at the end of the year ................................................................................................ 244.15 257.77
Less :
Deferred Employee Compensation Expense .............................................................................. 112.69 147.07
Balance as at the end of the year ................................................................................................ 131.46 110.70
*relating to shares other than those allotted by the Company to the ESOP Trust.
(M) Foreign Currency Monetary Items Translation Difference Account :
Balance as at the beginning of the year ..................................................................................... (66.40) —
Add :
Arising on revaluation of long term monetary assets and liabilities (net) ............................. (56.34) (76.55)
(122.74) (76.55)
Less :
Amortisation during the year ....................................................................................................... 28.23 10.15
Balance as at the end of the year ................................................................................................ (94.51) (66.40)
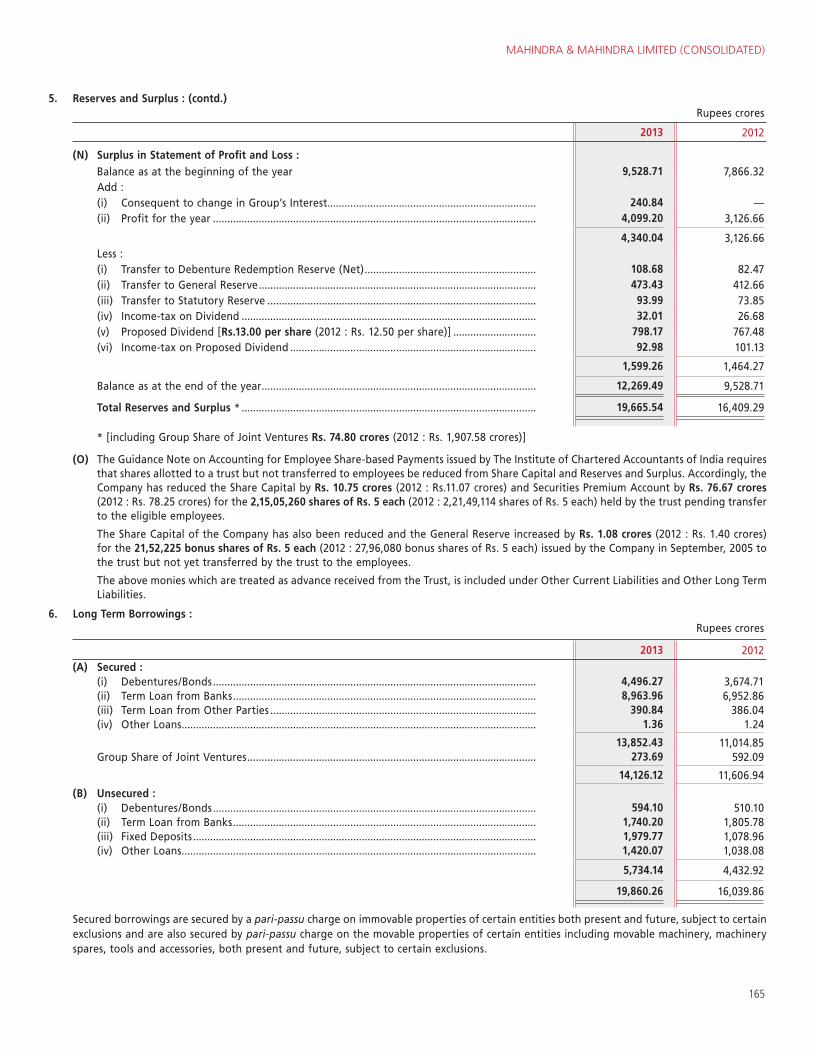
MAHINDRA & MAHINDRA LIMITED (CONSOLIDATED)
165
5. Reserves and Surplus : (contd.)Rupees crores
2013 2012
(N) Surplus in Statement of Profit and Loss : Balance as at the beginning of the year 9,528.71 7,866.32 Add : (i) Consequent to change in Group’s Interest......................................................................... 240.84 — (ii) Profit for the year ................................................................................................................. 4,099.20 3,126.66
4,340.04 3,126.66 Less : (i) Transfer to Debenture Redemption Reserve (Net) ............................................................ 108.68 82.47 (ii) Transfer to General Reserve ................................................................................................. 473.43 412.66 (iii) Transfer to Statutory Reserve .............................................................................................. 93.99 73.85 (iv) Income-tax on Dividend ....................................................................................................... 32.01 26.68 (v) Proposed Dividend [Rs.13.00 per share (2012 : Rs. 12.50 per share)] ............................. 798.17 767.48 (vi) Income-tax on Proposed Dividend ...................................................................................... 92.98 101.13
1,599.26 1,464.27
Balance as at the end of the year ................................................................................................ 12,269.49 9,528.71
Total Reserves and Surplus * ....................................................................................................... 19,665.54 16,409.29
* [including Group Share of Joint Ventures Rs. 74.80 crores (2012 : Rs. 1,907.58 crores)]
(O) The Guidance Note on Accounting for Employee Share-based Payments issued by The Institute of Chartered Accountants of India requires that shares allotted to a trust but not transferred to employees be reduced from Share Capital and Reserves and Surplus. Accordingly, the Company has reduced the Share Capital by Rs. 10.75 crores (2012 : Rs.11.07 crores) and Securities Premium Account by Rs. 76.67 crores (2012 : Rs. 78.25 crores) for the 2,15,05,260 shares of Rs. 5 each (2012 : 2,21,49,114 shares of Rs. 5 each) held by the trust pending transfer to the eligible employees.
The Share Capital of the Company has also been reduced and the General Reserve increased by Rs. 1.08 crores (2012 : Rs. 1.40 crores) for the 21,52,225 bonus shares of Rs. 5 each (2012 : 27,96,080 bonus shares of Rs. 5 each) issued by the Company in September, 2005 to the trust but not yet transferred by the trust to the employees.
The above monies which are treated as advance received from the Trust, is included under Other Current Liabilities and Other Long Term Liabilities.
6. Long Term Borrowings : (contd.)Rupees crores
2013 2012 (A) Secured : (i) Debentures/Bonds ................................................................................................................. 4,496.27 3,674.71 (ii) Term Loan from Banks .......................................................................................................... 8,963.96 6,952.86 (iii) Term Loan from Other Parties ............................................................................................. 390.84 386.04 (iv) Other Loans ............................................................................................................................ 1.36 1.24
13,852.43 11,014.85 Group Share of Joint Ventures ..................................................................................................... 273.69 592.09
14,126.12 11,606.94
(B) Unsecured : (i) Debentures/Bonds ................................................................................................................. 594.10 510.10 (ii) Term Loan from Banks .......................................................................................................... 1,740.20 1,805.78 (iii) Fixed Deposits ........................................................................................................................ 1,979.77 1,078.96 (iv) Other Loans ............................................................................................................................ 1,420.07 1,038.08
5,734.14 4,432.92
19,860.26 16,039.86
Secured borrowings are secured by a pari-passu charge on immovable properties of certain entities both present and future, subject to certain exclusions and are also secured by pari-passu charge on the movable properties of certain entities including movable machinery, machinery spares, tools and accessories, both present and future, subject to certain exclusions.
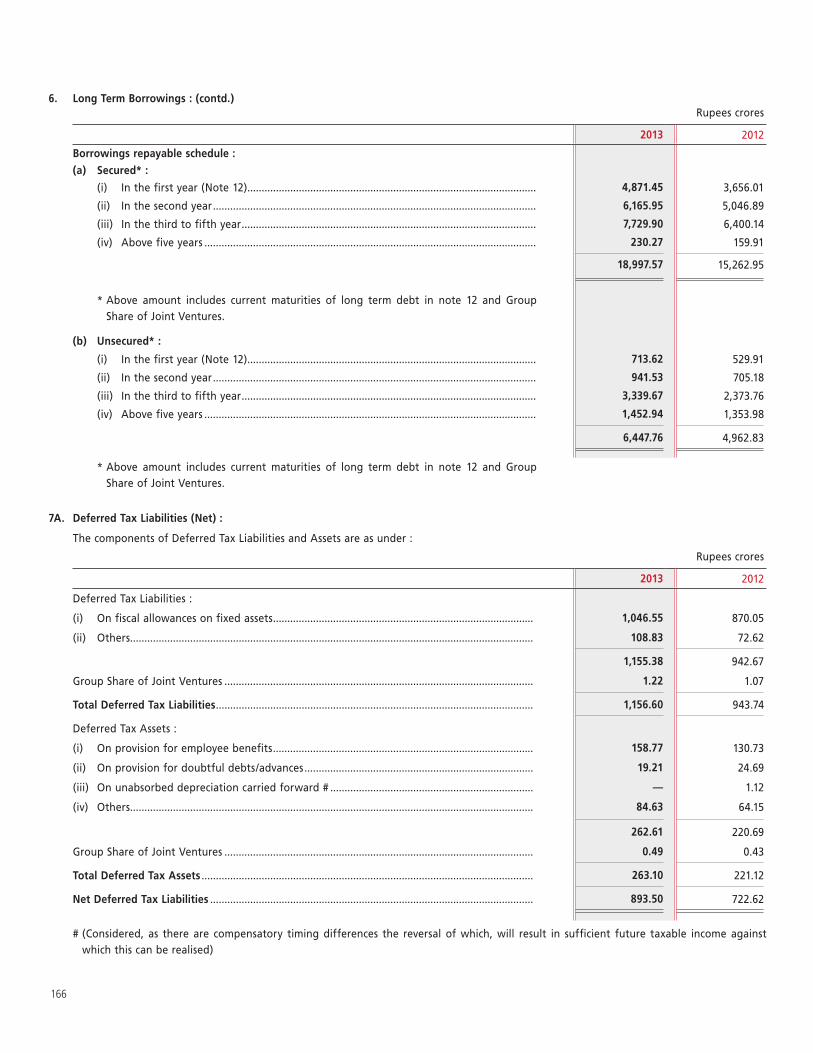
166
6. Long Term Borrowings : (contd.)Rupees crores
2013 2012
Borrowings repayable schedule :
(a) Secured* :
(i) In the first year (Note 12) ..................................................................................................... 4,871.45 3,656.01
(ii) In the second year ................................................................................................................. 6,165.95 5,046.89
(iii) In the third to fifth year ....................................................................................................... 7,729.90 6,400.14
(iv) Above five years .................................................................................................................... 230.27 159.91
18,997.57 15,262.95
* Above amount includes current maturities of long term debt in note 12 and Group Share of Joint Ventures.
(b) Unsecured* :
(i) In the first year (Note 12) ..................................................................................................... 713.62 529.91
(ii) In the second year ................................................................................................................. 941.53 705.18
(iii) In the third to fifth year ....................................................................................................... 3,339.67 2,373.76
(iv) Above five years .................................................................................................................... 1,452.94 1,353.98
6,447.76 4,962.83
* Above amount includes current maturities of long term debt in note 12 and Group Share of Joint Ventures.
7A. Deferred Tax Liabilities (Net) :
The components of Deferred Tax Liabilities and Assets are as under :
Rupees crores
2013 2012
Deferred Tax Liabilities :
(i) On fiscal allowances on fixed assets ........................................................................................... 1,046.55 870.05
(ii) Others ............................................................................................................................................. 108.83 72.62
1,155.38 942.67
Group Share of Joint Ventures ............................................................................................................ 1.22 1.07
Total Deferred Tax Liabilities ............................................................................................................... 1,156.60 943.74
Deferred Tax Assets :
(i) On provision for employee benefits ........................................................................................... 158.77 130.73
(ii) On provision for doubtful debts/advances ................................................................................ 19.21 24.69
(iii) On unabsorbed depreciation carried forward # ....................................................................... — 1.12
(iv) Others ............................................................................................................................................. 84.63 64.15
262.61 220.69
Group Share of Joint Ventures ............................................................................................................ 0.49 0.43
Total Deferred Tax Assets .................................................................................................................... 263.10 221.12
Net Deferred Tax Liabilities ................................................................................................................. 893.50 722.62
# (Considered, as there are compensatory timing differences the reversal of which, will result in sufficient future taxable income against which this can be realised)
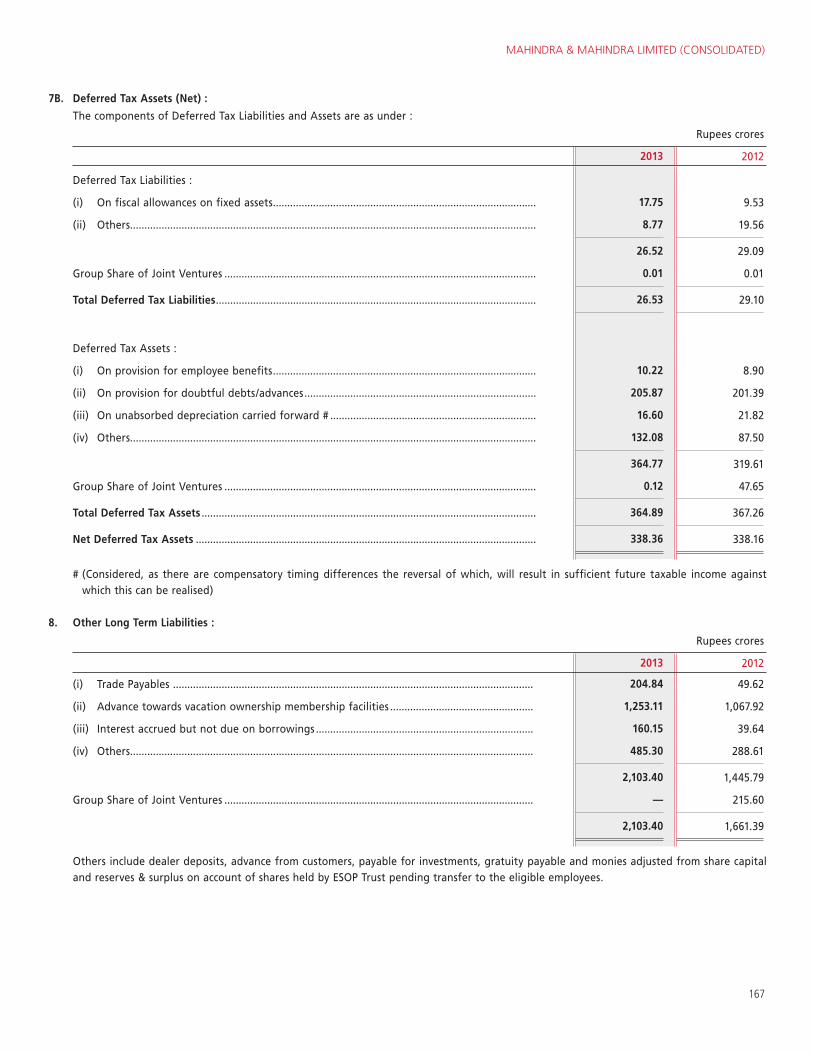
MAHINDRA & MAHINDRA LIMITED (CONSOLIDATED)
167
7B. Deferred Tax Assets (Net) :
The components of Deferred Tax Liabilities and Assets are as under :
Rupees crores
2013 2012
Deferred Tax Liabilities :
(i) On fiscal allowances on fixed assets ............................................................................................ 17.75 9.53
(ii) Others .............................................................................................................................................. 8.77 19.56
26.52 29.09
Group Share of Joint Ventures ............................................................................................................. 0.01 0.01
Total Deferred Tax Liabilities ................................................................................................................ 26.53 29.10
Deferred Tax Assets :
(i) On provision for employee benefits ............................................................................................ 10.22 8.90
(ii) On provision for doubtful debts/advances ................................................................................. 205.87 201.39
(iii) On unabsorbed depreciation carried forward # ........................................................................ 16.60 21.82
(iv) Others .............................................................................................................................................. 132.08 87.50
364.77 319.61
Group Share of Joint Ventures ............................................................................................................. 0.12 47.65
Total Deferred Tax Assets ..................................................................................................................... 364.89 367.26
Net Deferred Tax Assets ....................................................................................................................... 338.36 338.16
# (Considered, as there are compensatory timing differences the reversal of which, will result in sufficient future taxable income against which this can be realised)
8. Other Long Term Liabilities :
Rupees crores
2013 2012
(i) Trade Payables .............................................................................................................................. 204.84 49.62
(ii) Advance towards vacation ownership membership facilities .................................................. 1,253.11 1,067.92
(iii) Interest accrued but not due on borrowings ............................................................................ 160.15 39.64
(iv) Others ............................................................................................................................................. 485.30 288.61
2,103.40 1,445.79
Group Share of Joint Ventures ............................................................................................................ — 215.60
2,103.40 1,661.39
Others include dealer deposits, advance from customers, payable for investments, gratuity payable and monies adjusted from share capital and reserves & surplus on account of shares held by ESOP Trust pending transfer to the eligible employees.
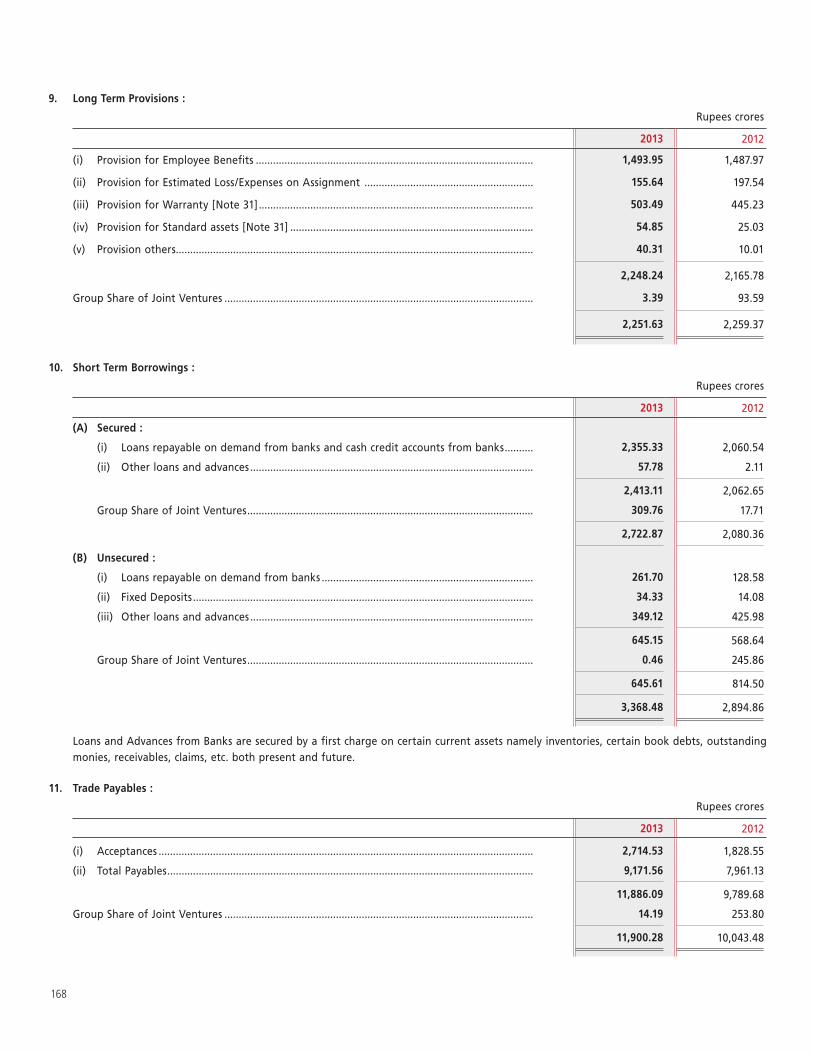
168
9. Long Term Provisions :
Rupees crores
2013 2012
(i) Provision for Employee Benefits ................................................................................................. 1,493.95 1,487.97
(ii) Provision for Estimated Loss/Expenses on Assignment ........................................................... 155.64 197.54
(iii) Provision for Warranty [Note 31] ................................................................................................ 503.49 445.23
(iv) Provision for Standard assets [Note 31] ..................................................................................... 54.85 25.03
(v) Provision others ............................................................................................................................. 40.31 10.01
2,248.24 2,165.78
Group Share of Joint Ventures ............................................................................................................ 3.39 93.59
2,251.63 2,259.37
10. Short Term Borrowings :
Rupees crores
2013 2012
(A) Secured :
(i) Loans repayable on demand from banks and cash credit accounts from banks .......... 2,355.33 2,060.54
(ii) Other loans and advances ................................................................................................... 57.78 2.11
2,413.11 2,062.65
Group Share of Joint Ventures .................................................................................................... 309.76 17.71
2,722.87 2,080.36
(B) Unsecured :
(i) Loans repayable on demand from banks .......................................................................... 261.70 128.58
(ii) Fixed Deposits ....................................................................................................................... 34.33 14.08
(iii) Other loans and advances ................................................................................................... 349.12 425.98
645.15 568.64
Group Share of Joint Ventures .................................................................................................... 0.46 245.86
645.61 814.50
3,368.48 2,894.86
Loans and Advances from Banks are secured by a first charge on certain current assets namely inventories, certain book debts, outstanding monies, receivables, claims, etc. both present and future.
11. Trade Payables :
Rupees crores
2013 2012
(i) Acceptances ................................................................................................................................... 2,714.53 1,828.55
(ii) Total Payables ................................................................................................................................ 9,171.56 7,961.13
11,886.09 9,789.68
Group Share of Joint Ventures ............................................................................................................ 14.19 253.80
11,900.28 10,043.48
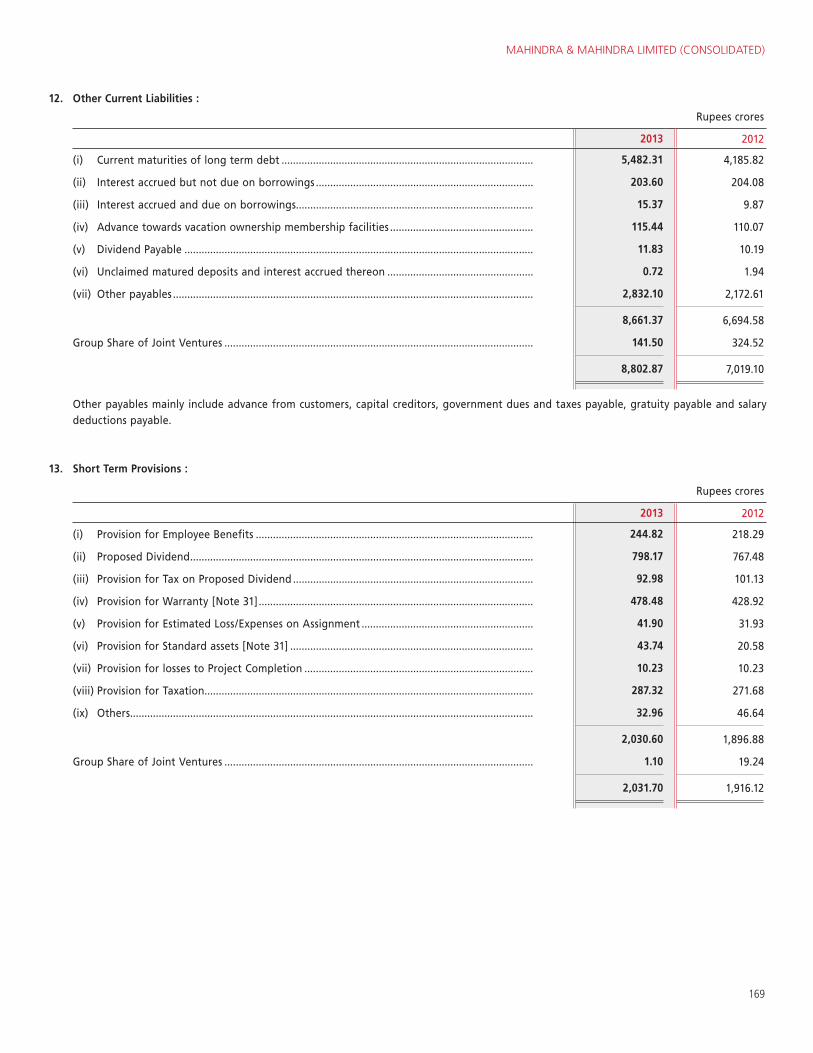
MAHINDRA & MAHINDRA LIMITED (CONSOLIDATED)
169
12. Other Current Liabilities :
Rupees crores
2013 2012
(i) Current maturities of long term debt ........................................................................................ 5,482.31 4,185.82
(ii) Interest accrued but not due on borrowings ............................................................................ 203.60 204.08
(iii) Interest accrued and due on borrowings ................................................................................... 15.37 9.87
(iv) Advance towards vacation ownership membership facilities .................................................. 115.44 110.07
(v) Dividend Payable .......................................................................................................................... 11.83 10.19
(vi) Unclaimed matured deposits and interest accrued thereon ................................................... 0.72 1.94
(vii) Other payables .............................................................................................................................. 2,832.10 2,172.61
8,661.37 6,694.58
Group Share of Joint Ventures ............................................................................................................ 141.50 324.52
8,802.87 7,019.10
Other payables mainly include advance from customers, capital creditors, government dues and taxes payable, gratuity payable and salary deductions payable.
13. Short Term Provisions :
Rupees crores
2013 2012
(i) Provision for Employee Benefits ................................................................................................. 244.82 218.29
(ii) Proposed Dividend ........................................................................................................................ 798.17 767.48
(iii) Provision for Tax on Proposed Dividend .................................................................................... 92.98 101.13
(iv) Provision for Warranty [Note 31] ................................................................................................ 478.48 428.92
(v) Provision for Estimated Loss/Expenses on Assignment ............................................................ 41.90 31.93
(vi) Provision for Standard assets [Note 31] ..................................................................................... 43.74 20.58
(vii) Provision for losses to Project Completion ................................................................................ 10.23 10.23
(viii) Provision for Taxation................................................................................................................... 287.32 271.68
(ix) Others ............................................................................................................................................. 32.96 46.64
2,030.60 1,896.88
Group Share of Joint Ventures ............................................................................................................ 1.10 19.24
2,031.70 1,916.12
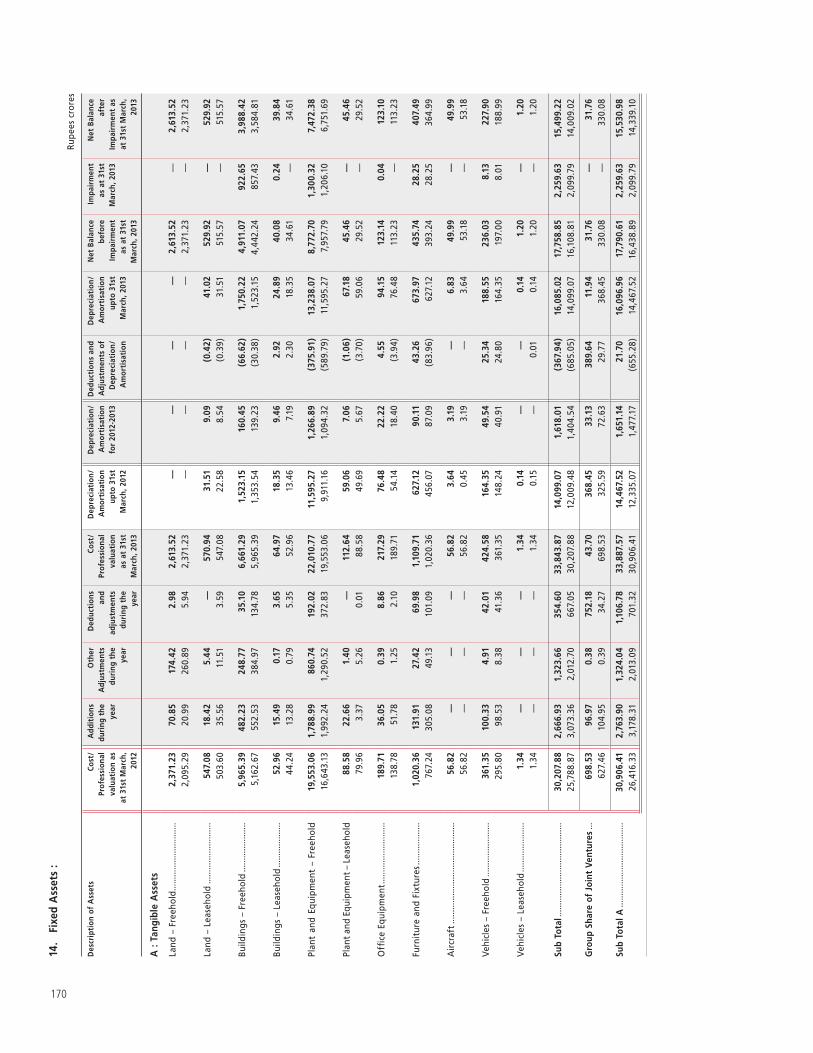
170
14.
Fixe
d A
sset
s :
Rupe
es c
rore
s
Des
crip
tion
of
Ass
ets
Cost
/ Pr
ofes
sion
al
valu
atio
n as
at
31s
t M
arch
, 20
12
Add
itio
ns
duri
ng t
he
year
Oth
er
Adj
ustm
ents
du
ring
the
ye
ar
Ded
ucti
ons
and
adju
stm
ents
du
ring
the
ye
ar
Cost
/ Pr
ofes
sion
al
valu
atio
n as
at
31st
M
arch
, 201
3
Dep
reci
atio
n/
Am
orti
sati
on
upto
31s
t M
arch
, 201
2
Dep
reci
atio
n/
Am
orti
sati
on
for
2012
-201
3
Ded
ucti
ons
and
Adj
ustm
ents
of
Dep
reci
atio
n/
Am
orti
sati
on
Dep
reci
atio
n/
Am
orti
sati
on
upto
31s
t M
arch
, 201
3
Net
Bal
ance
be
fore
Im
pair
men
t as
at
31st
M
arch
, 201
3
Impa
irm
ent
as a
t 31
st
Mar
ch, 2
013
Net
Bal
ance
af
ter
Impa
irm
ent
as
at 3
1st
Mar
ch,
2013
A :
Tang
ible
Ass
ets
Land
– F
reeh
old .
......
......
......
......
....
2,3
71.2
3 7
0.85
1
74.4
2 2
.98
2,6
13.5
2 —
——
— 2
,613
.52
— 2
,613
.52
2,0
95.2
9 2
0.99
2
60.8
9 5
.94
2,3
71.2
3 —
——
— 2
,371
.23
— 2
,371
.23
Land
– L
ease
hold
.....
......
......
......
... 5
47.0
8 1
8.42
5
.44
— 5
70.9
4 3
1.51
9
.09
(0.
42)
41.
02
529
.92
— 5
29.9
2 5
03.6
0 3
5.56
1
1.51
3
.59
547
.08
22.
58
8.5
4 (
0.39
) 3
1.51
5
15.5
7 —
515
.57
Build
ings
– F
reeh
old
......
......
......
... 5
,965
.39
482
.23
248
.77
35.
10
6,6
61.2
9 1
,523
.15
160
.45
(66
.62)
1,7
50.2
2 4
,911
.07
922
.65
3,9
88.4
2 5
,162
.67
552
.53
384
.97
134
.78
5,9
65.3
9 1
,353
.54
139
.23
(30
.38)
1,5
23.1
5 4
,442
.24
857
.43
3,5
84.8
1
Build
ings
– L
ease
hold
.....
......
......
.. 5
2.96
1
5.49
0
.17
3.6
5 6
4.97
1
8.35
9
.46
2.9
2 2
4.89
4
0.08
0
.24
39.
84
44.
24
13.
28
0.7
9 5
.35
52.
96
13.
46
7.1
9 2
.30
18.
35
34.
61
— 3
4.61
Plan
t an
d Eq
uipm
ent
– Fr
eeho
ld 1
9,55
3.06
1
,788
.99
860
.74
192
.02
22,
010.
77
11,
595.
27
1,2
66.8
9 (
375.
91)
13,
238.
07
8,7
72.7
0 1
,300
.32
7,4
72.3
8 1
6,64
3.13
1
,992
.24
1,2
90.5
2 3
72.8
3 1
9,55
3.06
9
,911
.16
1,0
94.3
2 (
589.
79)
11,
595.
27
7,9
57.7
9 1
,206
.10
6,7
51.6
9
Plan
t and
Equ
ipm
ent –
Lea
seho
ld 8
8.58
2
2.66
1
.40
— 1
12.6
4 5
9.06
7
.06
(1.
06)
67.
18
45.
46
— 4
5.46
7
9.96
3
.37
5.2
6 0
.01
88.
58
49.
69
5.6
7 (
3.70
) 5
9.06
2
9.52
—
29.
52
Offi
ce E
quip
men
t ....
......
......
......
....
189
.71
36.
05
0.3
9 8
.86
217
.29
76.
48
22.
22
4.5
5 9
4.15
1
23.1
4 0
.04
123
.10
138
.78
51.
78
1.2
5 2
.10
189
.71
54.
14
18.
40
(3.
94)
76.
48
113
.23
— 1
13.2
3
Furn
itur
e an
d Fi
xtur
es ..
......
......
....
1,0
20.3
6 1
31.9
1 2
7.42
6
9.98
1
,109
.71
627
.12
90.
11
43.
26
673
.97
435
.74
28.
25
407
.49
767
.24
305
.08
49.
13
101
.09
1,0
20.3
6 4
56.0
7 8
7.09
(
83.9
6) 6
27.1
2 3
93.2
4 2
8.25
3
64.9
9
Air
craf
t ....
......
......
......
......
......
......
... 5
6.82
—
——
56.
82
3.6
4 3
.19
— 6
.83
49.
99
— 4
9.99
5
6.82
—
——
56.
82
0.4
5 3
.19
— 3
.64
53.
18
— 5
3.18
Vehi
cles
– F
reeh
old
......
......
......
.....
361
.35
100
.33
4.9
1 4
2.01
4
24.5
8 1
64.3
5 4
9.54
2
5.34
1
88.5
5 2
36.0
3 8
.13
227
.90
295
.80
98.
53
8.3
8 4
1.36
3
61.3
5 1
48.2
4 4
0.91
2
4.80
1
64.3
5 1
97.0
0 8
.01
188
.99
Vehi
cles
– L
ease
hold
.....
......
......
....
1.3
4 —
——
1.3
4 0
.14
——
0.1
4 1
.20
— 1
.20
1.3
4 —
——
1.3
4 0
.15
— 0
.01
0.1
4 1
.20
— 1
.20
Sub
Tota
l ....
......
......
......
......
......
......
30,
207.
88
2,6
66.9
3 1
,323
.66
354
.60
33,
843.
87
14,
099.
07
1,6
18.0
1 (
367.
94)
16,
085.
02
17,
758.
85
2,2
59.6
3 1
5,49
9.22
2
5,78
8.87
3
,073
.36
2,0
12.7
0 6
67.0
5 3
0,20
7.88
1
2,00
9.48
1
,404
.54
(68
5.05
) 1
4,09
9.07
1
6,10
8.81
2
,099
.79
14,
009.
02
Gro
up S
hare
of
Join
t Ve
ntur
es ..
. 6
98.5
3 9
6.97
0
.38
752
.18
43.
70
368
.45
33.
13
389
.64
11.
94
31.
76
— 3
1.76
6
27.4
6 1
04.9
5 0
.39
34.
27
698
.53
325
.59
72.
63
29.
77
368
.45
330
.08
— 3
30.0
8
Sub
Tota
l A ..
......
......
......
......
......
....
30,
906.
41
2,7
63.9
0 1
,324
.04
1,1
06.7
8 3
3,88
7.57
1
4,46
7.52
1
,651
.14
21.
70
16,
096.
96
17,
790.
61
2,2
59.6
3 1
5,53
0.98
2
6,41
6.33
3
,178
.31
2,0
13.0
9 7
01.3
2 3
0,90
6.41
1
2,33
5.07
1
,477
.17
(65
5.28
) 1
4,46
7.52
1
6,43
8.89
2
,099
.79
14,
339.
10
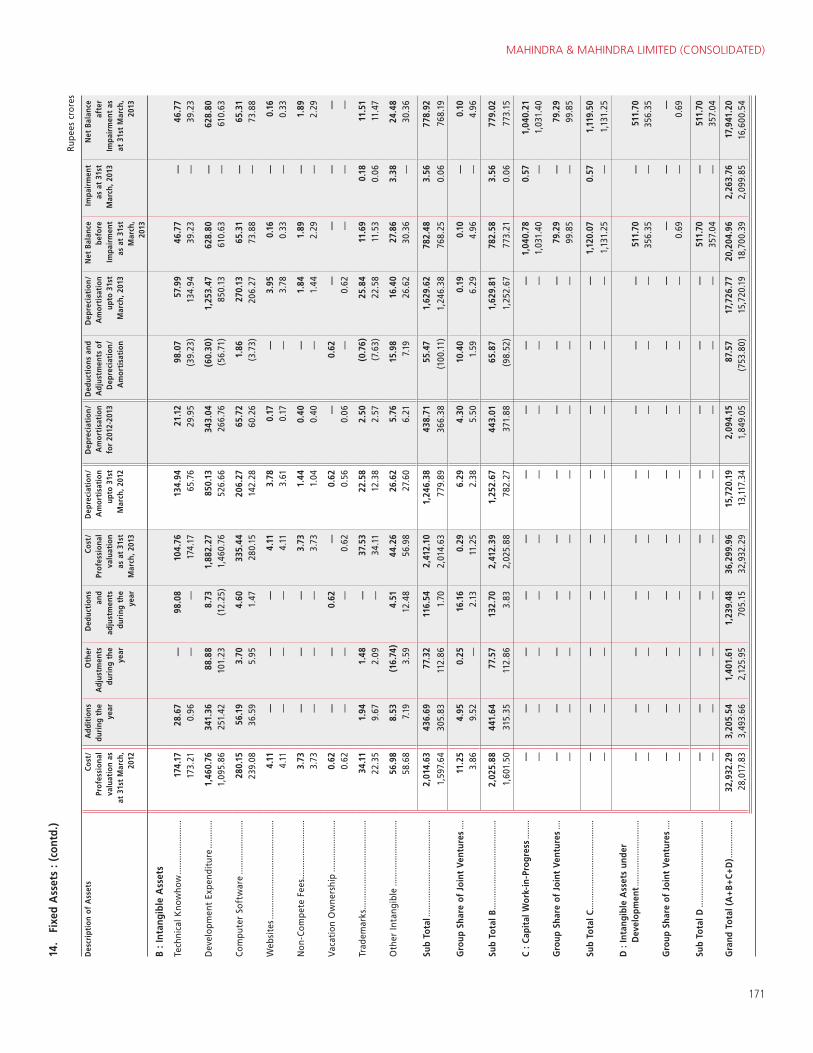
MAHINDRA & MAHINDRA LIMITED (CONSOLIDATED)
171
14.
Fixe
d A
sset
s : (
cont
d.)
Rupe
es c
rore
s
Des
crip
tion
of
Ass
ets
Cost
/ Pr
ofes
sion
al
valu
atio
n as
at
31s
t M
arch
, 20
12
Add
itio
ns
duri
ng t
he
year
Oth
er
Adj
ustm
ents
du
ring
the
ye
ar
Ded
ucti
ons
and
adju
stm
ents
du
ring
the
ye
ar
Cost
/ Pr
ofes
sion
al
valu
atio
n as
at
31st
M
arch
, 201
3
Dep
reci
atio
n/
Am
orti
sati
on
upto
31s
t M
arch
, 201
2
Dep
reci
atio
n/
Am
orti
sati
on
for
2012
-201
3
Ded
ucti
ons
and
Adj
ustm
ents
of
Dep
reci
atio
n/
Am
orti
sati
on
Dep
reci
atio
n/
Am
orti
sati
on
upto
31s
t M
arch
, 201
3
Net
Bal
ance
be
fore
Im
pair
men
t as
at
31st
M
arch
, 20
13
Impa
irm
ent
as a
t 31
st
Mar
ch, 2
013
Net
Bal
ance
af
ter
Impa
irm
ent
as
at 3
1st
Mar
ch,
2013
B : I
ntan
gibl
e A
sset
s
Tech
nica
l Kno
who
w ...
......
......
......
.. 1
74.1
7 2
8.67
—
98.
08
104
.76
134
.94
21.
12
98.
07
57.
99
46.
77
— 4
6.77
1
73.2
1 0
.96
——
174
.17
65.
76
29.
95
(39
.23)
134
.94
39.
23
— 3
9.23
Dev
elop
men
t Ex
pend
itur
e ...
......
... 1
,460
.76
341
.36
88.
88
8.7
3 1
,882
.27
850
.13
343
.04
(60
.30)
1,2
53.4
7 6
28.8
0 —
628
.80
1,0
95.8
6 2
51.4
2 1
01.2
3 (
12.2
5) 1
,460
.76
526
.66
266
.76
(56
.71)
850
.13
610
.63
— 6
10.6
3
Com
pute
r So
ftw
are
......
......
......
.....
280
.15
56.
19
3.7
0 4
.60
335
.44
206
.27
65.
72
1.8
6 2
70.1
3 6
5.31
—
65.
31
239
.08
36.
59
5.9
5 1
.47
280
.15
142
.28
60.
26
(3.
73)
206
.27
73.
88
— 7
3.88
Web
site
s ....
......
......
......
......
......
......
.. 4
.11
——
— 4
.11
3.7
8 0
.17
— 3
.95
0.1
6 —
0.1
6 4
.11
——
— 4
.11
3.6
1 0
.17
— 3
.78
0.3
3 —
0.3
3
Non
-Com
pete
Fee
s ....
......
......
......
... 3
.73
——
— 3
.73
1.4
4 0
.40
— 1
.84
1.8
9 —
1.8
9 3
.73
——
— 3
.73
1.0
4 0
.40
— 1
.44
2.2
9 —
2.2
9
Vaca
tion
Ow
ners
hip
......
......
......
....
0.6
2 —
— 0
.62
— 0
.62
— 0
.62
——
——
0.6
2 —
——
0.6
2 0
.56
0.0
6 —
0.6
2 —
——
Trad
emar
ks ...
......
......
......
......
......
.....
34.
11
1.9
4 1
.48
— 3
7.53
2
2.58
2
.50
(0.
76)
25.
84
11.
69
0.1
8 1
1.51
2
2.35
9
.67
2.0
9 —
34.
11
12.
38
2.5
7 (
7.63
) 2
2.58
1
1.53
0
.06
11.
47
Oth
er In
tang
ible
.....
......
......
......
.....
56.
98
8.5
3 (
16.7
4) 4
.51
44.
26
26.
62
5.7
6 1
5.98
1
6.40
2
7.86
3
.38
24.
48
58.
68
7.1
9 3
.59
12.
48
56.
98
27.
60
6.2
1 7
.19
26.
62
30.
36
— 3
0.36
Sub
Tota
l ....
......
......
......
......
......
......
. 2
,014
.63
436
.69
77.
32
116
.54
2,4
12.1
0 1
,246
.38
438
.71
55.
47
1,6
29.6
2 7
82.4
8 3
.56
778
.92
1,5
97.6
4 3
05.8
3 1
12.8
6 1
.70
2,0
14.6
3 7
79.8
9 3
66.3
8 (
100.
11)
1,2
46.3
8 7
68.2
5 0
.06
768
.19
Gro
up S
hare
of
Join
t Ve
ntur
es ..
.. 1
1.25
4
.95
0.2
5 1
6.16
0
.29
6.2
9 4
.30
10.
40
0.1
9 0
.10
— 0
.10
3.8
6 9
.52
— 2
.13
11.
25
2.3
8 5
.50
1.5
9 6
.29
4.9
6 —
4.9
6
Sub
Tota
l B ...
......
......
......
......
......
.....
2,0
25.8
8 4
41.6
4 7
7.57
1
32.7
0 2
,412
.39
1,2
52.6
7 4
43.0
1 6
5.87
1
,629
.81
782
.58
3.5
6 7
79.0
2
1,60
1.50
3
15.3
5 1
12.8
6 3
.83
2,0
25.8
8 7
82.2
7 3
71.8
8 (
98.5
2) 1
,252
.67
773
.21
0.0
6 7
73.1
5
C : C
apit
al W
ork-
in-P
rogr
ess .
......
.—
——
——
——
——
1,0
40.7
8 0.
57
1,0
40.2
1 —
——
——
——
——
1,0
31.4
0 —
1
,031
.40
Gro
up S
hare
of
Join
t Ve
ntur
es ..
..—
——
——
——
——
79.
29
—
79.
29
——
——
——
——
— 9
9.85
—
9
9.85
Sub
Tota
l C ...
......
......
......
......
......
.....
——
——
——
——
— 1
,120
.07
0.57
1
,119
.50
——
——
——
——
— 1
,131
.25
—
1,1
31.2
5
D :
Inta
ngib
le A
sset
s un
der
Dev
elop
men
t ....
......
......
......
......
——
——
——
——
— 5
11.7
0 —
5
11.7
0 —
——
——
——
——
356
.35
—
356
.35
Gro
up S
hare
of
Join
t Ve
ntur
es ..
..—
——
——
——
——
——
—
——
——
——
——
— 0
.69
—
0.6
9
Sub
Tota
l D ..
......
......
......
......
......
.....
——
——
——
——
— 5
11.7
0 —
5
11.7
0 —
——
——
——
——
357
.04
—
357
.04
Gra
nd T
otal
(A
+B
+C+
D) .
......
......
... 3
2,93
2.29
3
,205
.54
1,4
01.6
1 1
,239
.48
36,
299.
96
15,
720.
19
2,0
94.1
5 8
7.57
1
7,72
6.77
2
0,20
4.96
2
,263
.76
17,
941.
20
28,
017.
83
3,4
93.6
6 2
,125
.95
705
.15
32,
932.
29
13,
117.
34
1,8
49.0
5 (
753.
80)
15,
720.
19
18,
700.
39
2,0
99.8
5 1
6,60
0.54
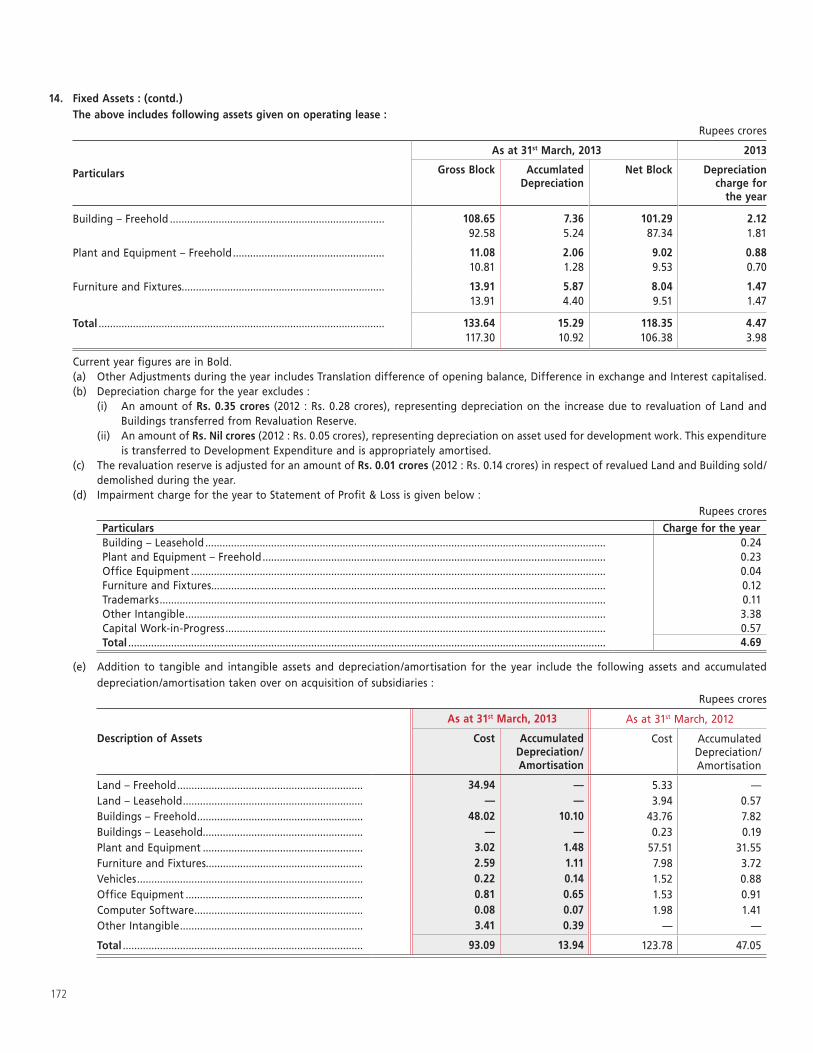
172
14. Fixed Assets : (contd.) The above includes following assets given on operating lease :
Rupees crores
Particulars
As at 31st March, 2013 2013
Gross Block Accumlated Depreciation
Net Block Depreciation charge for
the year
Building – Freehold ........................................................................... 108.65 7.36 101.29 2.12 92.58 5.24 87.34 1.81
Plant and Equipment – Freehold ..................................................... 11.08 2.06 9.02 0.88 10.81 1.28 9.53 0.70
Furniture and Fixtures....................................................................... 13.91 5.87 8.04 1.47 13.91 4.40 9.51 1.47
Total .................................................................................................... 133.64 15.29 118.35 4.47 117.30 10.92 106.38 3.98
Current year figures are in Bold. (a) Other Adjustments during the year includes Translation difference of opening balance, Difference in exchange and Interest capitalised. (b) Depreciation charge for the year excludes : (i) An amount of Rs. 0.35 crores (2012 : Rs. 0.28 crores), representing depreciation on the increase due to revaluation of Land and
Buildings transferred from Revaluation Reserve. (ii) An amount of Rs. Nil crores (2012 : Rs. 0.05 crores), representing depreciation on asset used for development work. This expenditure
is transferred to Development Expenditure and is appropriately amortised. (c) The revaluation reserve is adjusted for an amount of Rs. 0.01 crores (2012 : Rs. 0.14 crores) in respect of revalued Land and Building sold/
demolished during the year. (d) Impairment charge for the year to Statement of Profit & Loss is given below :
Rupees crores
Particulars Charge for the year Building – Leasehold ............................................................................................................................................ 0.24 Plant and Equipment – Freehold ........................................................................................................................ 0.23 Office Equipment ................................................................................................................................................. 0.04 Furniture and Fixtures.......................................................................................................................................... 0.12 Trademarks ............................................................................................................................................................ 0.11 Other Intangible ................................................................................................................................................... 3.38 Capital Work-in-Progress ..................................................................................................................................... 0.57 Total ....................................................................................................................................................................... 4.69
(e) Addition to tangible and intangible assets and depreciation/amortisation for the year include the following assets and accumulated depreciation/amortisation taken over on acquisition of subsidiaries :
Rupees crores
As at 31st March, 2013 As at 31st March, 2012
Description of Assets Cost Accumulated Depreciation/ Amortisation
Cost Accumulated Depreciation/ Amortisation
Land – Freehold ................................................................. 34.94 — 5.33 —Land – Leasehold ............................................................... — — 3.94 0.57 Buildings – Freehold .......................................................... 48.02 10.10 43.76 7.82 Buildings – Leasehold........................................................ — — 0.23 0.19 Plant and Equipment ........................................................ 3.02 1.48 57.51 31.55 Furniture and Fixtures....................................................... 2.59 1.11 7.98 3.72 Vehicles ............................................................................... 0.22 0.14 1.52 0.88 Office Equipment .............................................................. 0.81 0.65 1.53 0.91 Computer Software ........................................................... 0.08 0.07 1.98 1.41 Other Intangible ................................................................ 3.41 0.39 — —
Total .................................................................................... 93.09 13.94 123.78 47.05
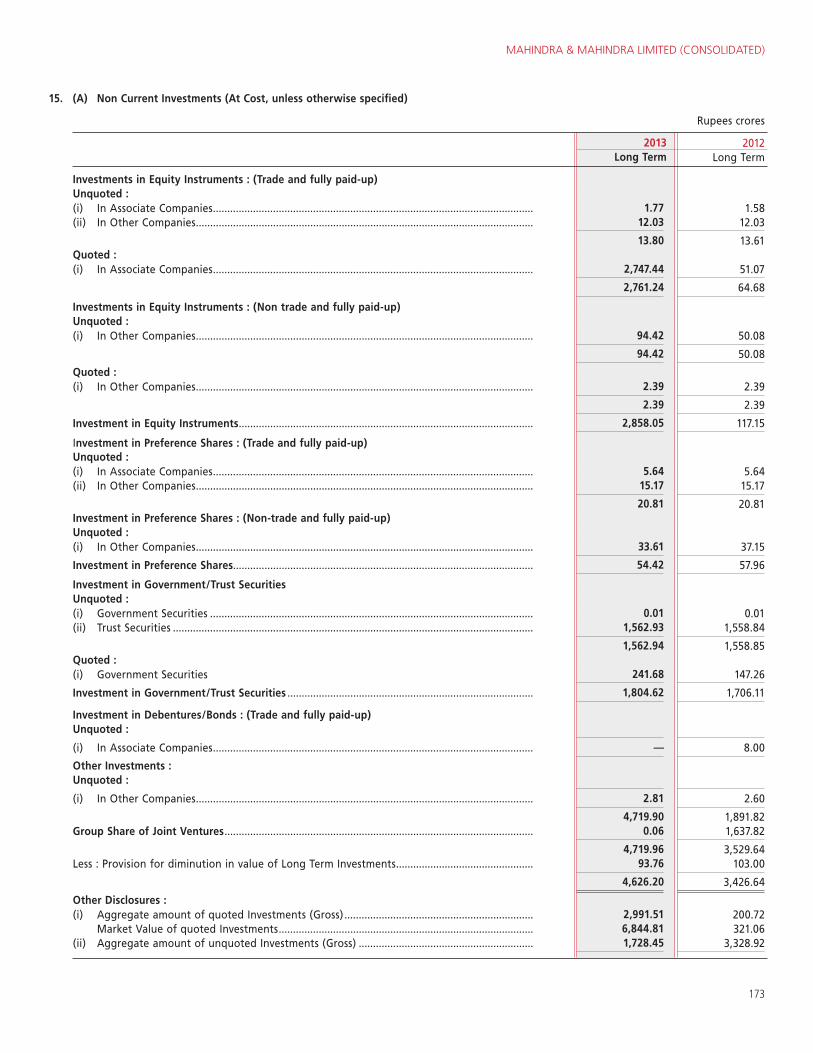
MAHINDRA & MAHINDRA LIMITED (CONSOLIDATED)
173
15. (A) Non Current Investments (At Cost, unless otherwise specified)
Rupees crores
2013 2012Long Term Long Term
Investments in Equity Instruments : (Trade and fully paid-up)Unquoted :(i) In Associate Companies ................................................................................................................ 1.77 1.58 (ii) In Other Companies ...................................................................................................................... 12.03 12.03
13.80 13.61 Quoted :(i) In Associate Companies ................................................................................................................ 2,747.44 51.07
2,761.24 64.68
Investments in Equity Instruments : (Non trade and fully paid-up)Unquoted :(i) In Other Companies ...................................................................................................................... 94.42 50.08
94.42 50.08
Quoted :(i) In Other Companies ...................................................................................................................... 2.39 2.39
2.39 2.39
Investment in Equity Instruments ....................................................................................................... 2,858.05 117.15
Investment in Preference Shares : (Trade and fully paid-up)Unquoted :(i) In Associate Companies ................................................................................................................ 5.64 5.64 (ii) In Other Companies ...................................................................................................................... 15.17 15.17
20.81 20.81 Investment in Preference Shares : (Non-trade and fully paid-up)Unquoted :(i) In Other Companies ...................................................................................................................... 33.61 37.15
Investment in Preference Shares ......................................................................................................... 54.42 57.96
Investment in Government/Trust SecuritiesUnquoted :(i) Government Securities ................................................................................................................. 0.01 0.01 (ii) Trust Securities .............................................................................................................................. 1,562.93 1,558.84
1,562.94 1,558.85 Quoted :(i) Government Securities 241.68 147.26
Investment in Government/Trust Securities ...................................................................................... 1,804.62 1,706.11
Investment in Debentures/Bonds : (Trade and fully paid-up)Unquoted :
(i) In Associate Companies ................................................................................................................ — 8.00
Other Investments :Unquoted :
(i) In Other Companies ...................................................................................................................... 2.81 2.60
4,719.90 1,891.82 Group Share of Joint Ventures ............................................................................................................ 0.06 1,637.82
4,719.96 3,529.64 Less : Provision for diminution in value of Long Term Investments ................................................ 93.76 103.00
4,626.20 3,426.64
Other Disclosures :(i) Aggregate amount of quoted Investments (Gross) .................................................................. 2,991.51 200.72 Market Value of quoted Investments ......................................................................................... 6,844.81 321.06 (ii) Aggregate amount of unquoted Investments (Gross) ............................................................. 1,728.45 3,328.92
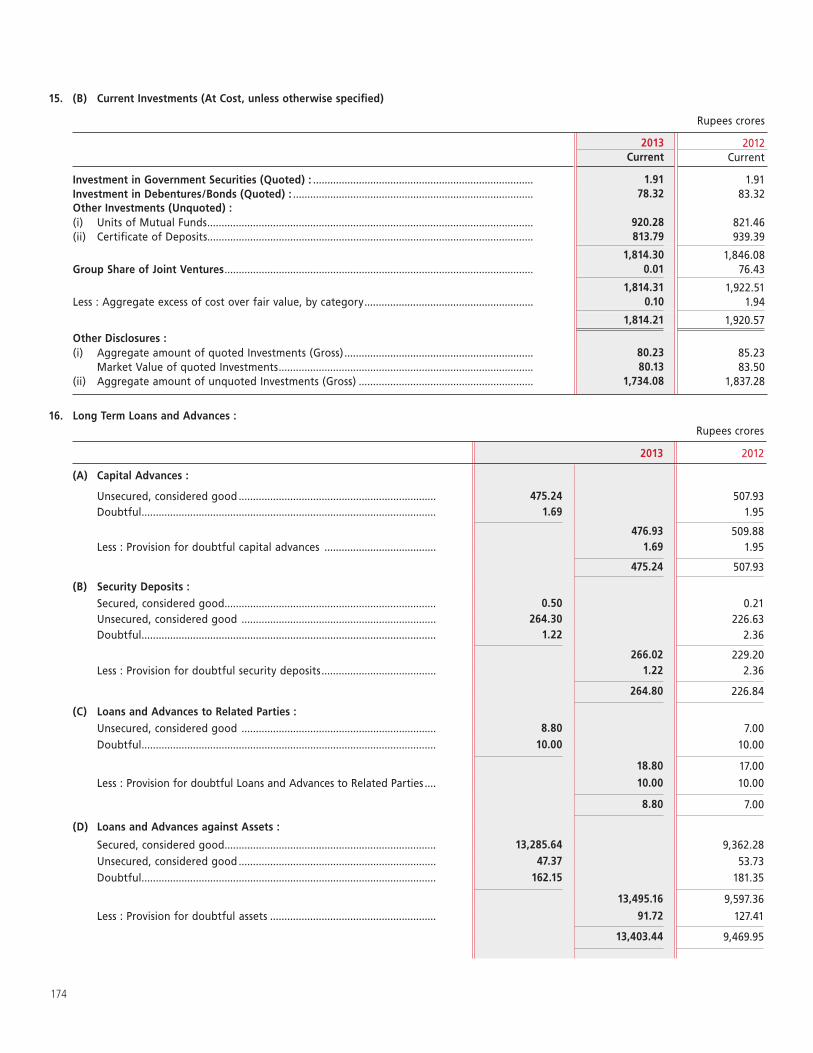
174
15. (B) Current Investments (At Cost, unless otherwise specified)
Rupees crores
2013 2012Current Current
Investment in Government Securities (Quoted) : ............................................................................. 1.91 1.91Investment in Debentures/Bonds (Quoted) : .................................................................................... 78.32 83.32 Other Investments (Unquoted) :(i) Units of Mutual Funds .................................................................................................................. 920.28 821.46 (ii) Certificate of Deposits .................................................................................................................. 813.79 939.39
1,814.30 1,846.08 Group Share of Joint Ventures ............................................................................................................ 0.01 76.43
1,814.31 1,922.51 Less : Aggregate excess of cost over fair value, by category ........................................................... 0.10 1.94
1,814.21 1,920.57
Other Disclosures :(i) Aggregate amount of quoted Investments (Gross) .................................................................. 80.23 85.23 Market Value of quoted Investments ......................................................................................... 80.13 83.50 (ii) Aggregate amount of unquoted Investments (Gross) ............................................................. 1,734.08 1,837.28
16. Long Term Loans and Advances : (contd.)Rupees crores
2013 2012
(A) Capital Advances :
Unsecured, considered good ..................................................................... 475.24 507.93 Doubtful ....................................................................................................... 1.69 1.95
476.93 509.88 Less : Provision for doubtful capital advances ....................................... 1.69 1.95
475.24 507.93
(B) Security Deposits : Secured, considered good .......................................................................... 0.50 0.21 Unsecured, considered good .................................................................... 264.30 226.63 Doubtful ....................................................................................................... 1.22 2.36
266.02 229.20 Less : Provision for doubtful security deposits ........................................ 1.22 2.36
264.80 226.84
(C) Loans and Advances to Related Parties : Unsecured, considered good .................................................................... 8.80 7.00 Doubtful ....................................................................................................... 10.00 10.00
18.80 17.00
Less : Provision for doubtful Loans and Advances to Related Parties .... 10.00 10.00
8.80 7.00
(D) Loans and Advances against Assets :
Secured, considered good .......................................................................... 13,285.64 9,362.28 Unsecured, considered good ..................................................................... 47.37 53.73 Doubtful ....................................................................................................... 162.15 181.35
13,495.16 9,597.36
Less : Provision for doubtful assets .......................................................... 91.72 127.41
13,403.44 9,469.95
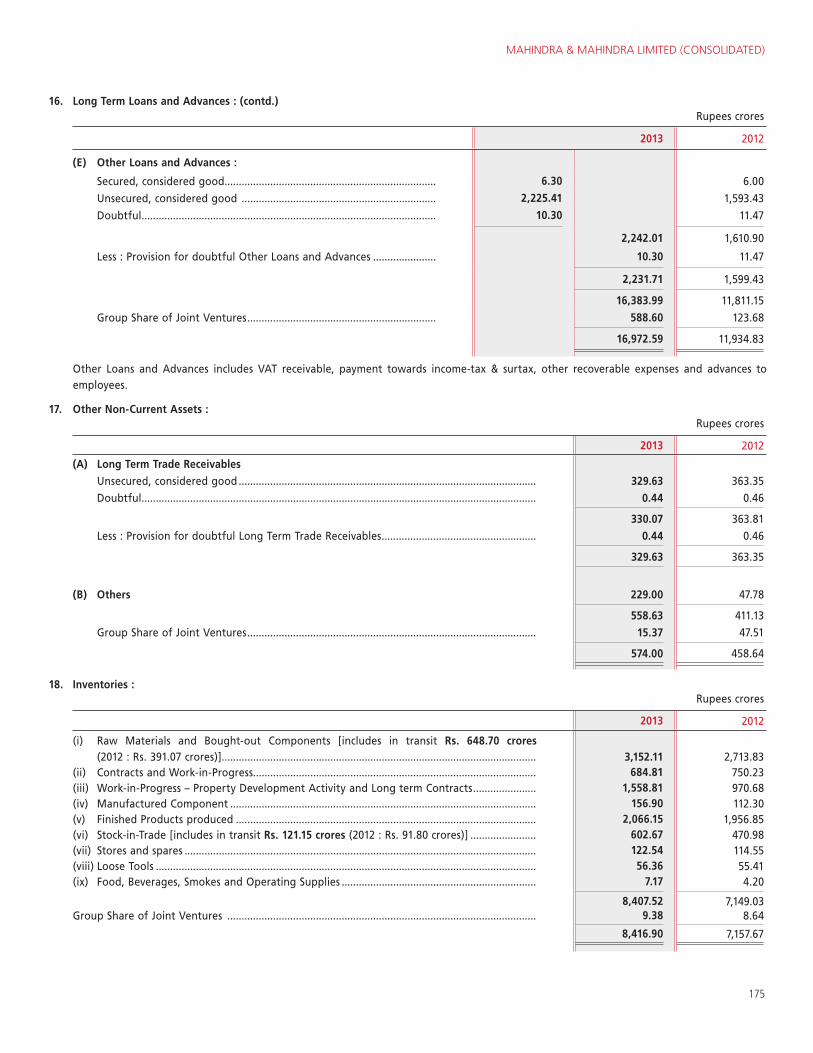
MAHINDRA & MAHINDRA LIMITED (CONSOLIDATED)
175
16. Long Term Loans and Advances : (contd.)Rupees crores
2013 2012
(E) Other Loans and Advances :
Secured, considered good .......................................................................... 6.30 6.00
Unsecured, considered good .................................................................... 2,225.41 1,593.43
Doubtful ....................................................................................................... 10.30 11.47
2,242.01 1,610.90
Less : Provision for doubtful Other Loans and Advances ...................... 10.30 11.47
2,231.71 1,599.43
16,383.99 11,811.15
Group Share of Joint Ventures .................................................................. 588.60 123.68
16,972.59 11,934.83
Other Loans and Advances includes VAT receivable, payment towards income-tax & surtax, other recoverable expenses and advances to employees.
17. Other Non-Current Assets :Rupees crores
2013 2012
(A) Long Term Trade Receivables
Unsecured, considered good ........................................................................................................ 329.63 363.35
Doubtful .......................................................................................................................................... 0.44 0.46
330.07 363.81
Less : Provision for doubtful Long Term Trade Receivables ...................................................... 0.44 0.46
329.63 363.35
(B) Others 229.00 47.78
558.63 411.13
Group Share of Joint Ventures ..................................................................................................... 15.37 47.51
574.00 458.64
18. Inventories :Rupees crores
2013 2012
(i) Raw Materials and Bought-out Components [includes in transit Rs. 648.70 crores (2012 : Rs. 391.07 crores)] .............................................................................................................. 3,152.11 2,713.83
(ii) Contracts and Work-in-Progress................................................................................................... 684.81 750.23 (iii) Work-in-Progress – Property Development Activity and Long term Contracts ...................... 1,558.81 970.68 (iv) Manufactured Component ........................................................................................................... 156.90 112.30 (v) Finished Products produced ......................................................................................................... 2,066.15 1,956.85 (vi) Stock-in-Trade [includes in transit Rs. 121.15 crores (2012 : Rs. 91.80 crores)] ....................... 602.67 470.98 (vii) Stores and spares ........................................................................................................................... 122.54 114.55 (viii) Loose Tools ..................................................................................................................................... 56.36 55.41 (ix) Food, Beverages, Smokes and Operating Supplies .................................................................... 7.17 4.20
8,407.52 7,149.03 Group Share of Joint Ventures ............................................................................................................ 9.38 8.64
8,416.90 7,157.67
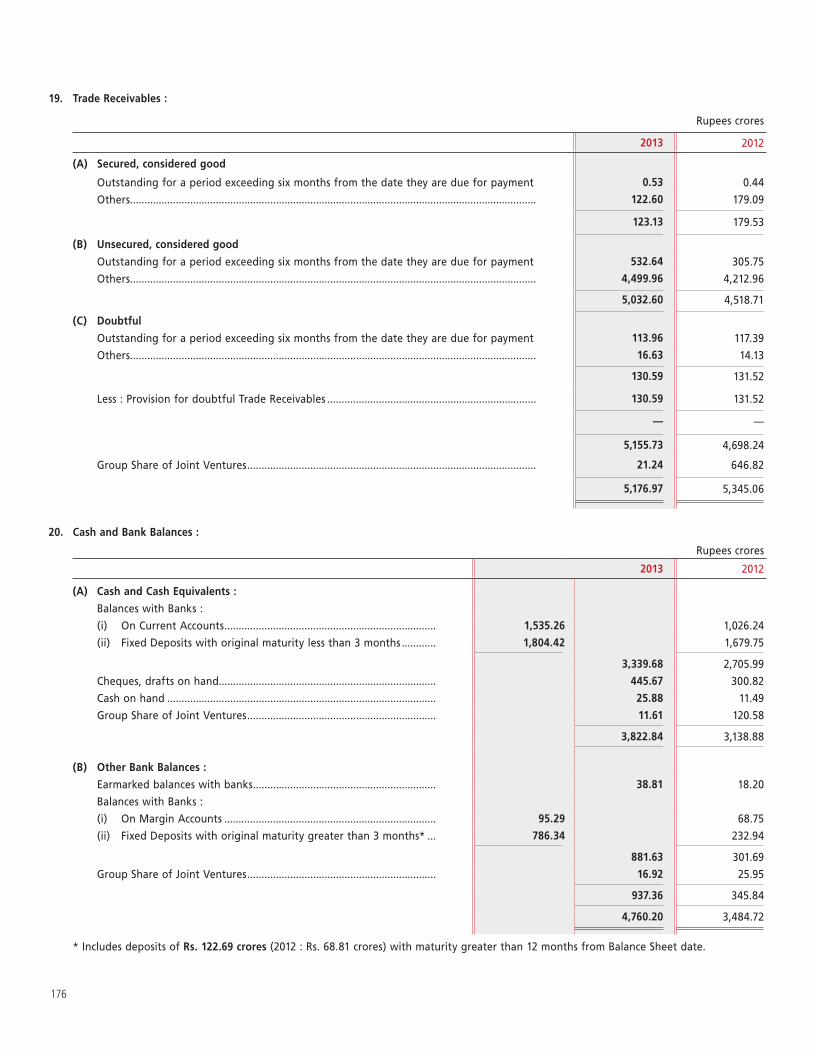
176
19. Trade Receivables :
Rupees crores
2013 2012
(A) Secured, considered good
Outstanding for a period exceeding six months from the date they are due for payment 0.53 0.44
Others .............................................................................................................................................. 122.60 179.09
123.13 179.53
(B) Unsecured, considered good
Outstanding for a period exceeding six months from the date they are due for payment 532.64 305.75
Others .............................................................................................................................................. 4,499.96 4,212.96
5,032.60 4,518.71
(C) Doubtful
Outstanding for a period exceeding six months from the date they are due for payment 113.96 117.39
Others .............................................................................................................................................. 16.63 14.13
130.59 131.52
Less : Provision for doubtful Trade Receivables ......................................................................... 130.59 131.52
— —
5,155.73 4,698.24
Group Share of Joint Ventures ..................................................................................................... 21.24 646.82
5,176.97 5,345.06
20. Cash and Bank Balances :
Rupees crores
2013 2012
(A) Cash and Cash Equivalents :
Balances with Banks :
(i) On Current Accounts .......................................................................... 1,535.26 1,026.24
(ii) Fixed Deposits with original maturity less than 3 months ............ 1,804.42 1,679.75
3,339.68 2,705.99
Cheques, drafts on hand............................................................................ 445.67 300.82
Cash on hand .............................................................................................. 25.88 11.49
Group Share of Joint Ventures .................................................................. 11.61 120.58
3,822.84 3,138.88
(B) Other Bank Balances :
Earmarked balances with banks ................................................................ 38.81 18.20
Balances with Banks :
(i) On Margin Accounts .......................................................................... 95.29 68.75
(ii) Fixed Deposits with original maturity greater than 3 months* ... 786.34 232.94
881.63 301.69
Group Share of Joint Ventures .................................................................. 16.92 25.95
937.36 345.84
4,760.20 3,484.72
* Includes deposits of Rs. 122.69 crores (2012 : Rs. 68.81 crores) with maturity greater than 12 months from Balance Sheet date.
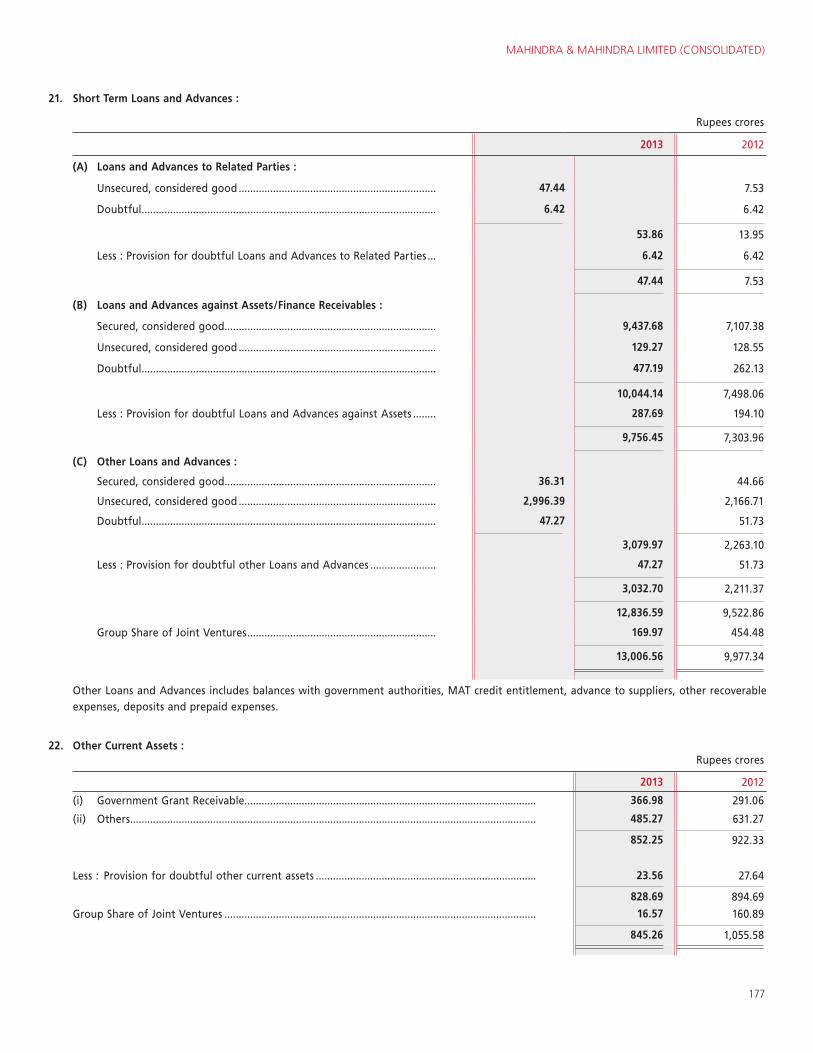
MAHINDRA & MAHINDRA LIMITED (CONSOLIDATED)
177
21. Short Term Loans and Advances :
Rupees crores
2013 2012
(A) Loans and Advances to Related Parties :
Unsecured, considered good ..................................................................... 47.44 7.53
Doubtful ....................................................................................................... 6.42 6.42
53.86 13.95
Less : Provision for doubtful Loans and Advances to Related Parties ... 6.42 6.42
47.44 7.53
(B) Loans and Advances against Assets/Finance Receivables :
Secured, considered good .......................................................................... 9,437.68 7,107.38
Unsecured, considered good ..................................................................... 129.27 128.55
Doubtful ....................................................................................................... 477.19 262.13
10,044.14 7,498.06
Less : Provision for doubtful Loans and Advances against Assets ........ 287.69 194.10
9,756.45 7,303.96
(C) Other Loans and Advances :
Secured, considered good .......................................................................... 36.31 44.66
Unsecured, considered good ..................................................................... 2,996.39 2,166.71
Doubtful ....................................................................................................... 47.27 51.73
3,079.97 2,263.10
Less : Provision for doubtful other Loans and Advances ....................... 47.27 51.73
3,032.70 2,211.37
12,836.59 9,522.86
Group Share of Joint Ventures .................................................................. 169.97 454.48
13,006.56 9,977.34
Other Loans and Advances includes balances with government authorities, MAT credit entitlement, advance to suppliers, other recoverable expenses, deposits and prepaid expenses.
22. Other Current Assets :Rupees crores
2013 2012
(i) Government Grant Receivable...................................................................................................... 366.98 291.06
(ii) Others .............................................................................................................................................. 485.27 631.27
852.25 922.33
Less : Provision for doubtful other current assets ............................................................................. 23.56 27.64
828.69 894.69
Group Share of Joint Ventures ............................................................................................................. 16.57 160.89
845.26 1,055.58
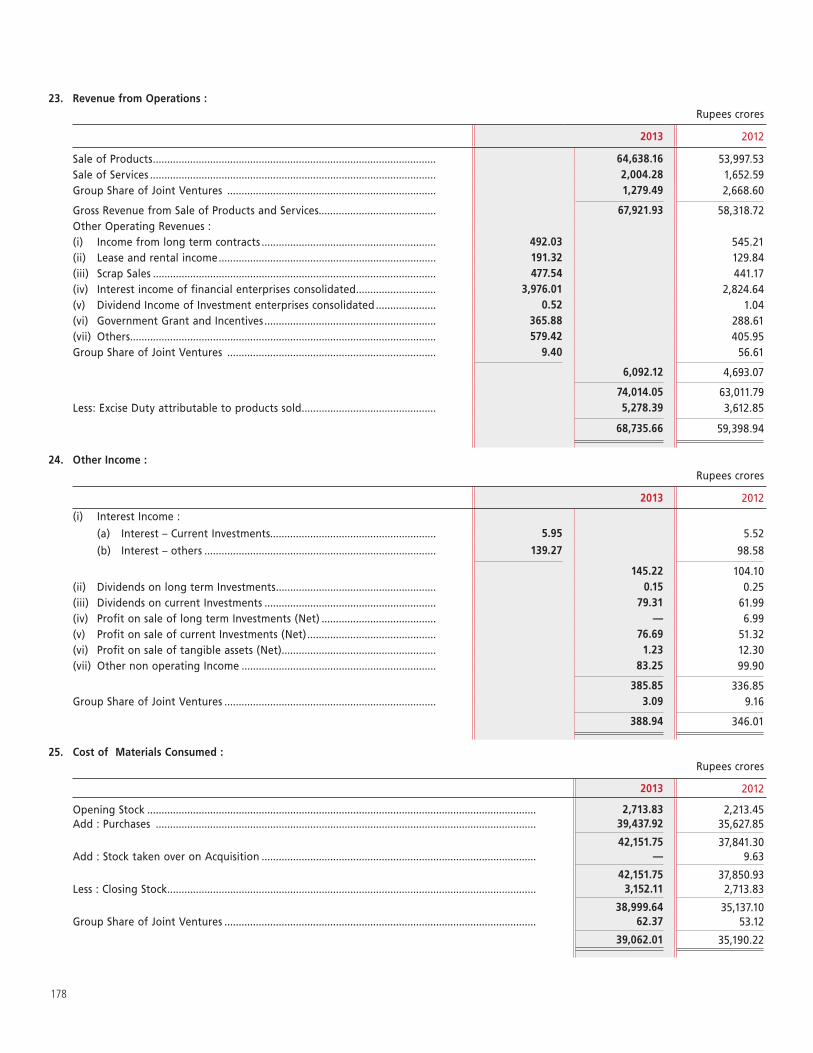
178
23. Revenue from Operations :Rupees crores
2013 2012
Sale of Products ................................................................................................... 64,638.16 53,997.53 Sale of Services .................................................................................................... 2,004.28 1,652.59 Group Share of Joint Ventures ......................................................................... 1,279.49 2,668.60
Gross Revenue from Sale of Products and Services......................................... 67,921.93 58,318.72 Other Operating Revenues :(i) Income from long term contracts ............................................................. 492.03 545.21 (ii) Lease and rental income ............................................................................ 191.32 129.84 (iii) Scrap Sales ................................................................................................... 477.54 441.17 (iv) Interest income of financial enterprises consolidated ............................ 3,976.01 2,824.64 (v) Dividend Income of Investment enterprises consolidated ..................... 0.52 1.04 (vi) Government Grant and Incentives ............................................................ 365.88 288.61 (vii) Others ........................................................................................................... 579.42 405.95 Group Share of Joint Ventures ......................................................................... 9.40 56.61
6,092.12 4,693.07
74,014.05 63,011.79 Less: Excise Duty attributable to products sold ............................................... 5,278.39 3,612.85
68,735.66 59,398.94
24. Other Income :Rupees crores
2013 2012
(i) Interest Income :
(a) Interest – Current Investments.......................................................... 5.95 5.52
(b) Interest – others ................................................................................. 139.27 98.58
145.22 104.10 (ii) Dividends on long term Investments ........................................................ 0.15 0.25 (iii) Dividends on current Investments ............................................................ 79.31 61.99 (iv) Profit on sale of long term Investments (Net) ........................................ — 6.99 (v) Profit on sale of current Investments (Net) ............................................. 76.69 51.32 (vi) Profit on sale of tangible assets (Net)...................................................... 1.23 12.30 (vii) Other non operating Income .................................................................... 83.25 99.90
385.85 336.85 Group Share of Joint Ventures .......................................................................... 3.09 9.16
388.94 346.01
25. Cost of Materials Consumed :Rupees crores
2013 2012
Opening Stock ........................................................................................................................................ 2,713.83 2,213.45 Add : Purchases ..................................................................................................................................... 39,437.92 35,627.85
42,151.75 37,841.30 Add : Stock taken over on Acquisition ................................................................................................ — 9.63
42,151.75 37,850.93 Less : Closing Stock ................................................................................................................................. 3,152.11 2,713.83
38,999.64 35,137.10 Group Share of Joint Ventures ............................................................................................................. 62.37 53.12
39,062.01 35,190.22
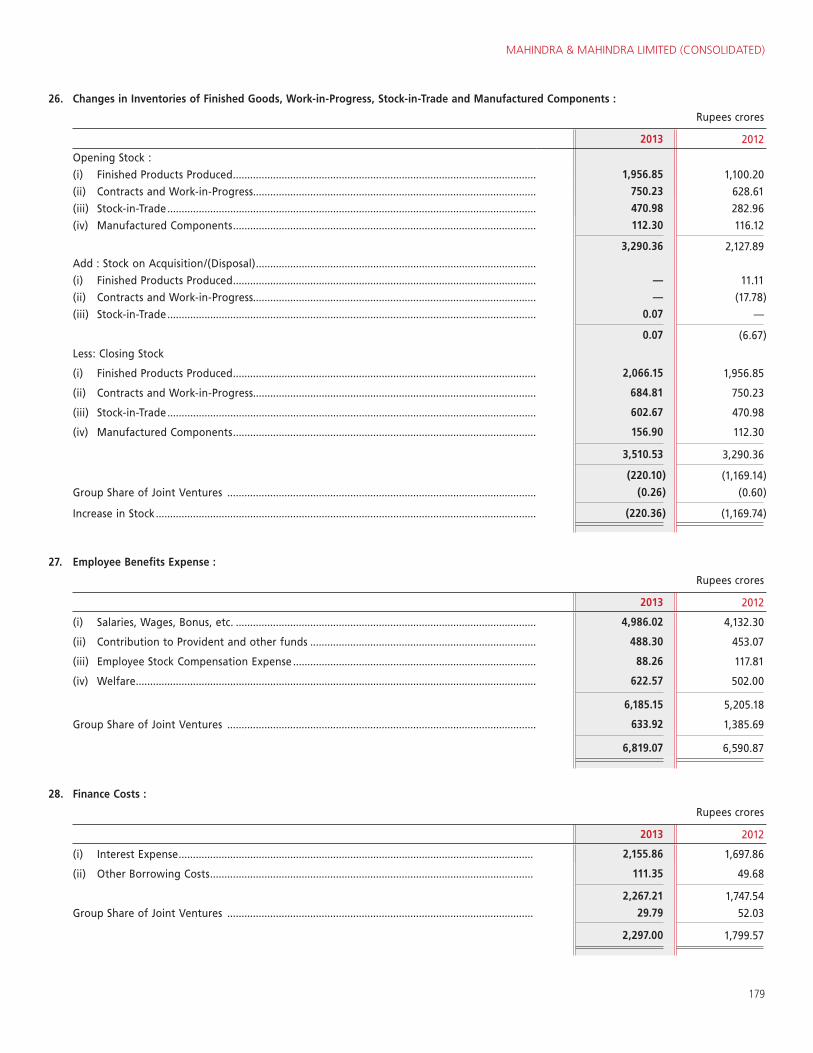
MAHINDRA & MAHINDRA LIMITED (CONSOLIDATED)
179
26. Changes in Inventories of Finished Goods, Work-in-Progress, Stock-in-Trade and Manufactured Components :
Rupees crores
2013 2012
Opening Stock :
(i) Finished Products Produced .......................................................................................................... 1,956.85 1,100.20
(ii) Contracts and Work-in-Progress................................................................................................... 750.23 628.61
(iii) Stock-in-Trade ................................................................................................................................. 470.98 282.96
(iv) Manufactured Components .......................................................................................................... 112.30 116.12
3,290.36 2,127.89
Add : Stock on Acquisition/(Disposal) ..................................................................................................
(i) Finished Products Produced .......................................................................................................... — 11.11
(ii) Contracts and Work-in-Progress................................................................................................... — (17.78)
(iii) Stock-in-Trade ................................................................................................................................. 0.07 —
0.07 (6.67)
Less: Closing Stock
(i) Finished Products Produced .......................................................................................................... 2,066.15 1,956.85
(ii) Contracts and Work-in-Progress................................................................................................... 684.81 750.23
(iii) Stock-in-Trade ................................................................................................................................. 602.67 470.98
(iv) Manufactured Components .......................................................................................................... 156.90 112.30
3,510.53 3,290.36
(220.10) (1,169.14)
Group Share of Joint Ventures ............................................................................................................ (0.26) (0.60)
Increase in Stock ..................................................................................................................................... (220.36) (1,169.74)
27. Employee Benefits Expense :
Rupees crores
2013 2012
(i) Salaries, Wages, Bonus, etc. ......................................................................................................... 4,986.02 4,132.30
(ii) Contribution to Provident and other funds ............................................................................... 488.30 453.07
(iii) Employee Stock Compensation Expense ..................................................................................... 88.26 117.81
(iv) Welfare ............................................................................................................................................ 622.57 502.00
6,185.15 5,205.18
Group Share of Joint Ventures ............................................................................................................ 633.92 1,385.69
6,819.07 6,590.87
28. Finance Costs :
Rupees crores
2013 2012
(i) Interest Expense ............................................................................................................................ 2,155.86 1,697.86
(ii) Other Borrowing Costs ................................................................................................................. 111.35 49.68
2,267.21 1,747.54
Group Share of Joint Ventures ........................................................................................................... 29.79 52.03
2,297.00 1,799.57
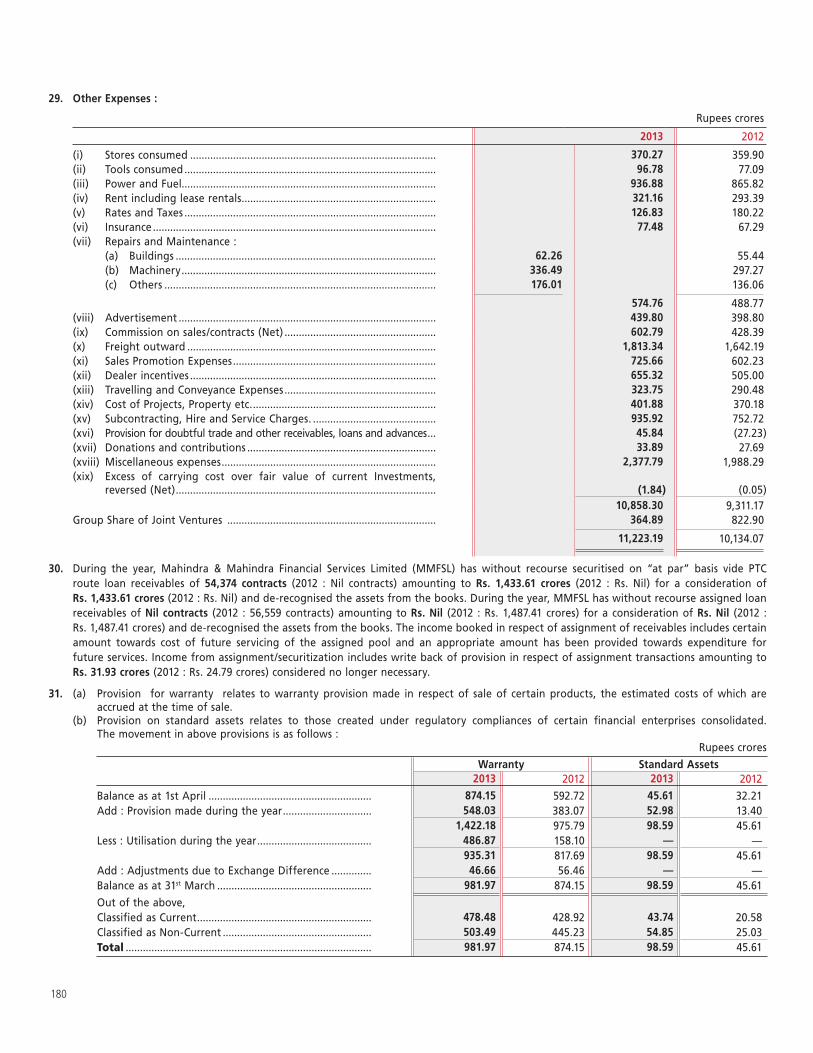
180
29. Other Expenses :
Rupees crores
2013 2012
(i) Stores consumed ...................................................................................... 370.27 359.90 (ii) Tools consumed ........................................................................................ 96.78 77.09 (iii) Power and Fuel......................................................................................... 936.88 865.82 (iv) Rent including lease rentals .................................................................... 321.16 293.39 (v) Rates and Taxes ........................................................................................ 126.83 180.22 (vi) Insurance ................................................................................................... 77.48 67.29 (vii) Repairs and Maintenance : (a) Buildings ........................................................................................... 62.26 55.44 (b) Machinery ......................................................................................... 336.49 297.27 (c) Others ............................................................................................... 176.01 136.06
574.76 488.77 (viii) Advertisement .......................................................................................... 439.80 398.80 (ix) Commission on sales/contracts (Net) ..................................................... 602.79 428.39 (x) Freight outward ....................................................................................... 1,813.34 1,642.19 (xi) Sales Promotion Expenses ....................................................................... 725.66 602.23 (xii) Dealer incentives ...................................................................................... 655.32 505.00 (xiii) Travelling and Conveyance Expenses ..................................................... 323.75 290.48 (xiv) Cost of Projects, Property etc. ................................................................ 401.88 370.18 (xv) Subcontracting, Hire and Service Charges. ........................................... 935.92 752.72 (xvi) Provision for doubtful trade and other receivables, loans and advances ... 45.84 (27.23)(xvii) Donations and contributions .................................................................. 33.89 27.69 (xviii) Miscellaneous expenses ........................................................................... 2,377.79 1,988.29 (xix) Excess of carrying cost over fair value of current Investments,
reversed (Net) ........................................................................................... (1.84) (0.05) 10,858.30 9,311.17
Group Share of Joint Ventures ......................................................................... 364.89 822.90
11,223.19 10,134.07
30. During the year, Mahindra & Mahindra Financial Services Limited (MMFSL) has without recourse securitised on “at par” basis vide PTC route loan receivables of 54,374 contracts (2012 : Nil contracts) amounting to Rs. 1,433.61 crores (2012 : Rs. Nil) for a consideration of Rs. 1,433.61 crores (2012 : Rs. Nil) and de-recognised the assets from the books. During the year, MMFSL has without recourse assigned loan receivables of Nil contracts (2012 : 56,559 contracts) amounting to Rs. Nil (2012 : Rs. 1,487.41 crores) for a consideration of Rs. Nil (2012 : Rs. 1,487.41 crores) and de-recognised the assets from the books. The income booked in respect of assignment of receivables includes certain amount towards cost of future servicing of the assigned pool and an appropriate amount has been provided towards expenditure for future services. Income from assignment/securitization includes write back of provision in respect of assignment transactions amounting to Rs. 31.93 crores (2012 : Rs. 24.79 crores) considered no longer necessary.
31. (a) Provision for warranty relates to warranty provision made in respect of sale of certain products, the estimated costs of which are accrued at the time of sale.
(b) Provision on standard assets relates to those created under regulatory compliances of certain financial enterprises consolidated. The movement in above provisions is as follows :
Rupees crores
Warranty Standard Assets2013 2012 2013 2012
Balance as at 1st April ......................................................... 874.15 592.72 45.61 32.21Add : Provision made during the year ............................... 548.03 383.07 52.98 13.40
1,422.18 975.79 98.59 45.61Less : Utilisation during the year ........................................ 486.87 158.10 — —
935.31 817.69 98.59 45.61Add : Adjustments due to Exchange Difference .............. 46.66 56.46 — —Balance as at 31st March ...................................................... 981.97 874.15 98.59 45.61
Out of the above,Classified as Current ............................................................. 478.48 428.92 43.74 20.58 Classified as Non-Current .................................................... 503.49 445.23 54.85 25.03 Total ...................................................................................... 981.97 874.15 98.59 45.61
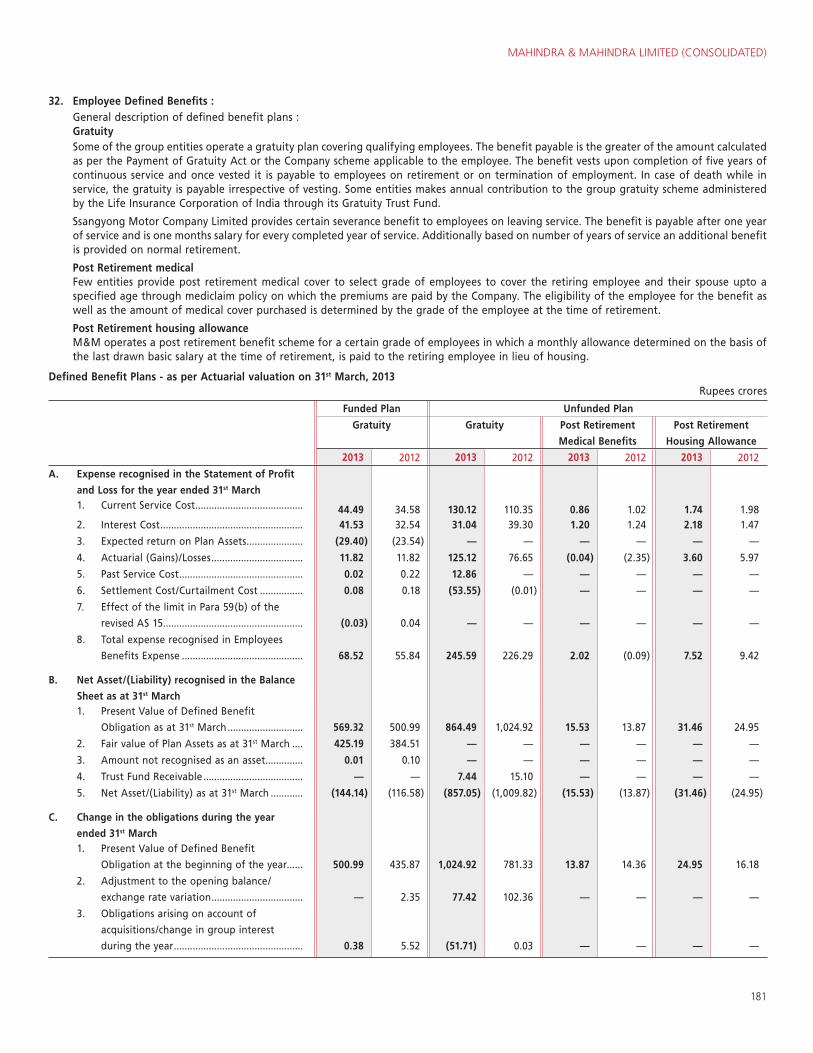
MAHINDRA & MAHINDRA LIMITED (CONSOLIDATED)
181
32. Employee Defined Benefits : General description of defined benefit plans : Gratuity Some of the group entities operate a gratuity plan covering qualifying employees. The benefit payable is the greater of the amount calculated
as per the Payment of Gratuity Act or the Company scheme applicable to the employee. The benefit vests upon completion of five years of continuous service and once vested it is payable to employees on retirement or on termination of employment. In case of death while in service, the gratuity is payable irrespective of vesting. Some entities makes annual contribution to the group gratuity scheme administered by the Life Insurance Corporation of India through its Gratuity Trust Fund.
Ssangyong Motor Company Limited provides certain severance benefit to employees on leaving service. The benefit is payable after one year of service and is one months salary for every completed year of service. Additionally based on number of years of service an additional benefit is provided on normal retirement.
Post Retirement medical Few entities provide post retirement medical cover to select grade of employees to cover the retiring employee and their spouse upto a
specified age through mediclaim policy on which the premiums are paid by the Company. The eligibility of the employee for the benefit as well as the amount of medical cover purchased is determined by the grade of the employee at the time of retirement.
Post Retirement housing allowance M&M operates a post retirement benefit scheme for a certain grade of employees in which a monthly allowance determined on the basis of
the last drawn basic salary at the time of retirement, is paid to the retiring employee in lieu of housing.
Defined Benefit Plans - as per Actuarial valuation on 31st March, 2013Rupees crores
Funded Plan Unfunded Plan
Gratuity Gratuity Post Retirement
Medical Benefits
Post Retirement
Housing Allowance
2013 2012 2013 2012 2013 2012 2013 2012
A. Expense recognised in the Statement of Profit
and Loss for the year ended 31st March1. Current Service Cost ........................................ 44.49 34.58 130.12 110.35 0.86 1.02 1.74 1.98 2. Interest Cost ..................................................... 41.53 32.54 31.04 39.30 1.20 1.24 2.18 1.47
3. Expected return on Plan Assets ..................... (29.40) (23.54) — — — — — —
4. Actuarial (Gains)/Losses .................................. 11.82 11.82 125.12 76.65 (0.04) (2.35) 3.60 5.97
5. Past Service Cost .............................................. 0.02 0.22 12.86 — — — — —
6. Settlement Cost/Curtailment Cost ................ 0.08 0.18 (53.55) (0.01) — — — —
7. Effect of the limit in Para 59(b) of the
revised AS 15 .................................................... (0.03) 0.04 — — — — — —
8. Total expense recognised in Employees
Benefits Expense ............................................. 68.52 55.84 245.59 226.29 2.02 (0.09) 7.52 9.42
B. Net Asset/(Liability) recognised in the Balance
Sheet as at 31st March1. Present Value of Defined Benefit
Obligation as at 31st March ............................ 569.32 500.99 864.49 1,024.92 15.53 13.87 31.46 24.95
2. Fair value of Plan Assets as at 31st March .... 425.19 384.51 — — — — — —
3. Amount not recognised as an asset.............. 0.01 0.10 — — — — — —
4. Trust Fund Receivable ..................................... — — 7.44 15.10 — — — —
5. Net Asset/(Liability) as at 31st March ............ (144.14) (116.58) (857.05) (1,009.82) (15.53) (13.87) (31.46) (24.95)
C. Change in the obligations during the year
ended 31st March1. Present Value of Defined Benefit
Obligation at the beginning of the year...... 500.99 435.87 1,024.92 781.33 13.87 14.36 24.95 16.18
2. Adjustment to the opening balance/
exchange rate variation .................................. — 2.35 77.42 102.36 — — — —
3. Obligations arising on account of
acquisitions/change in group interest
during the year ................................................ 0.38 5.52 (51.71) 0.03 — — — —
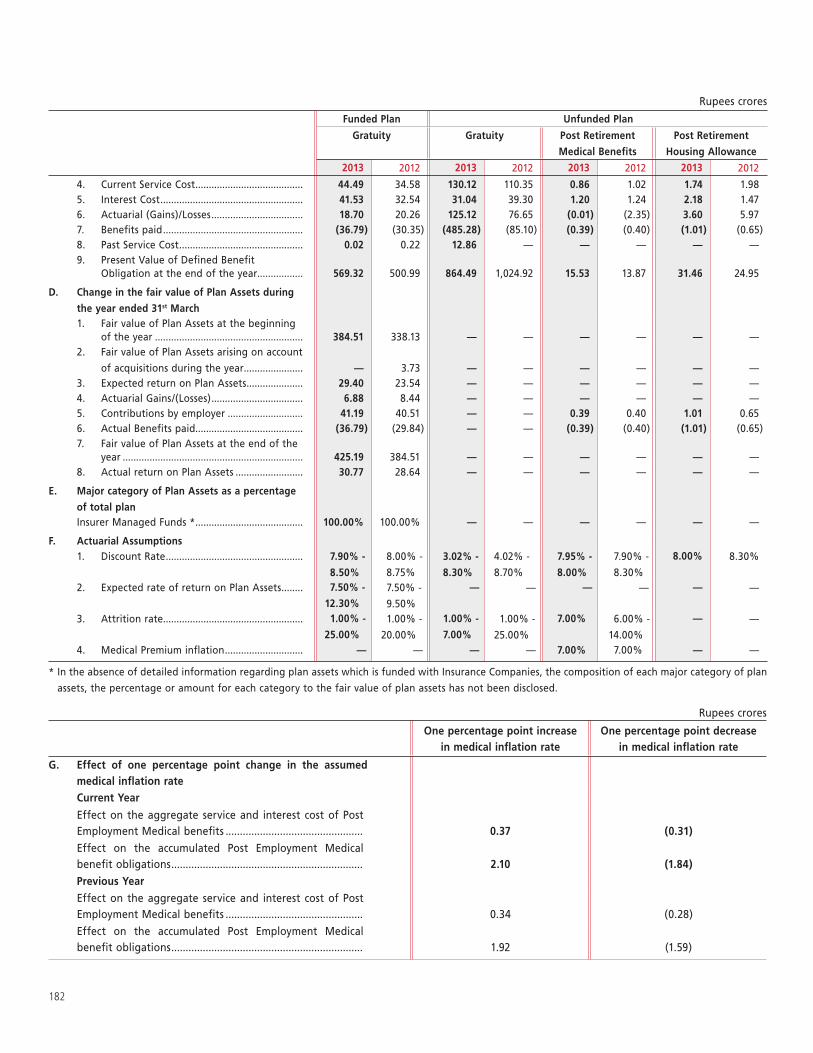
182
Rupees crores
Funded Plan Unfunded Plan
Gratuity Gratuity Post Retirement
Medical Benefits
Post Retirement
Housing Allowance
2013 2012 2013 2012 2013 2012 2013 2012
4. Current Service Cost ........................................ 44.49 34.58 130.12 110.35 0.86 1.02 1.74 1.98 5. Interest Cost ..................................................... 41.53 32.54 31.04 39.30 1.20 1.24 2.18 1.47 6. Actuarial (Gains)/Losses .................................. 18.70 20.26 125.12 76.65 (0.01) (2.35) 3.60 5.97 7. Benefits paid .................................................... (36.79) (30.35) (485.28) (85.10) (0.39) (0.40) (1.01) (0.65)8. Past Service Cost .............................................. 0.02 0.22 12.86 — — — — — 9. Present Value of Defined Benefit
Obligation at the end of the year................. 569.32 500.99 864.49 1,024.92 15.53 13.87 31.46 24.95
D. Change in the fair value of Plan Assets during
the year ended 31st March1. Fair value of Plan Assets at the beginning
of the year ....................................................... 384.51 338.13 — — — — — — 2. Fair value of Plan Assets arising on account
of acquisitions during the year ...................... — 3.73 — — — — — — 3. Expected return on Plan Assets ..................... 29.40 23.54 — — — — — — 4. Actuarial Gains/(Losses) .................................. 6.88 8.44 — — — — — — 5. Contributions by employer ............................ 41.19 40.51 — — 0.39 0.40 1.01 0.65 6. Actual Benefits paid........................................ (36.79) (29.84) — — (0.39) (0.40) (1.01) (0.65)7. Fair value of Plan Assets at the end of the
year ................................................................... 425.19 384.51 — — — — — — 8. Actual return on Plan Assets ......................... 30.77 28.64 — — — — — —
E. Major category of Plan Assets as a percentage
of total planInsurer Managed Funds * ........................................ 100.00% 100.00% — — — — — —
F. Actuarial Assumptions1. Discount Rate ................................................... 7.90% -
8.50%
8.00% -
8.75%
3.02% -
8.30%
4.02% -
8.70%
7.95% -
8.00%
7.90% -
8.30%
8.00% 8.30%
2. Expected rate of return on Plan Assets ........ 7.50% -
12.30% 7.50% -
9.50%
— — — — — —
3. Attrition rate .................................................... 1.00% -
25.00% 1.00% -
20.00%
1.00% -
7.00% 1.00% -
25.00%
7.00% 6.00% -
14.00%
— —
4. Medical Premium inflation ............................. — — — — 7.00% 7.00% — —
* In the absence of detailed information regarding plan assets which is funded with Insurance Companies, the composition of each major category of plan
assets, the percentage or amount for each category to the fair value of plan assets has not been disclosed.
Rupees crores
One percentage point increase in medical inflation rate
One percentage point decrease in medical inflation rate
G. Effect of one percentage point change in the assumed medical inflation rateCurrent Year
Effect on the aggregate service and interest cost of Post Employment Medical benefits ................................................ 0.37 (0.31)
Effect on the accumulated Post Employment Medical benefit obligations ................................................................... 2.10 (1.84)
Previous Year
Effect on the aggregate service and interest cost of Post Employment Medical benefits ................................................ 0.34 (0.28)
Effect on the accumulated Post Employment Medical benefit obligations ................................................................... 1.92 (1.59)
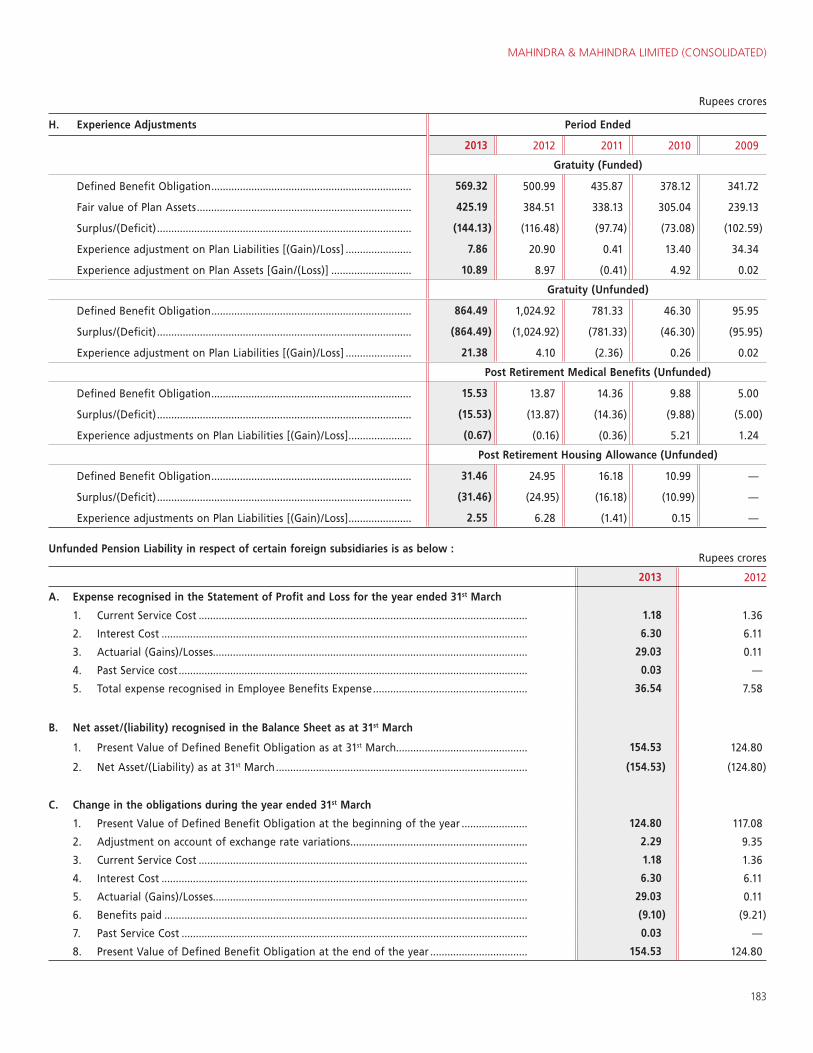
MAHINDRA & MAHINDRA LIMITED (CONSOLIDATED)
183
Rupees crores
H. Experience Adjustments Period Ended
2013 2012 2011 2010 2009
Gratuity (Funded)
Defined Benefit Obligation ...................................................................... 569.32 500.99 435.87 378.12 341.72
Fair value of Plan Assets ........................................................................... 425.19 384.51 338.13 305.04 239.13
Surplus/(Deficit) ......................................................................................... (144.13) (116.48) (97.74) (73.08) (102.59)
Experience adjustment on Plan Liabilities [(Gain)/Loss] ....................... 7.86 20.90 0.41 13.40 34.34
Experience adjustment on Plan Assets [Gain/(Loss)] ............................ 10.89 8.97 (0.41) 4.92 0.02
Gratuity (Unfunded)
Defined Benefit Obligation ...................................................................... 864.49 1,024.92 781.33 46.30 95.95
Surplus/(Deficit) ......................................................................................... (864.49) (1,024.92) (781.33) (46.30) (95.95)
Experience adjustment on Plan Liabilities [(Gain)/Loss] ....................... 21.38 4.10 (2.36) 0.26 0.02
Post Retirement Medical Benefits (Unfunded)
Defined Benefit Obligation ...................................................................... 15.53 13.87 14.36 9.88 5.00
Surplus/(Deficit) ......................................................................................... (15.53) (13.87) (14.36) (9.88) (5.00)
Experience adjustments on Plan Liabilities [(Gain)/Loss] ...................... (0.67) (0.16) (0.36) 5.21 1.24
Post Retirement Housing Allowance (Unfunded)
Defined Benefit Obligation ...................................................................... 31.46 24.95 16.18 10.99 —
Surplus/(Deficit) ......................................................................................... (31.46) (24.95) (16.18) (10.99) —
Experience adjustments on Plan Liabilities [(Gain)/Loss] ...................... 2.55 6.28 (1.41) 0.15 —
Unfunded Pension Liability in respect of certain foreign subsidiaries is as below : Rupees crores
2013 2012
A. Expense recognised in the Statement of Profit and Loss for the year ended 31st March
1. Current Service Cost ................................................................................................................... 1.18 1.36
2. Interest Cost ................................................................................................................................ 6.30 6.11
3. Actuarial (Gains)/Losses.............................................................................................................. 29.03 0.11
4. Past Service cost .......................................................................................................................... 0.03 —
5. Total expense recognised in Employee Benefits Expense ...................................................... 36.54 7.58
B. Net asset/(liability) recognised in the Balance Sheet as at 31st March
1. Present Value of Defined Benefit Obligation as at 31st March.............................................. 154.53 124.80
2. Net Asset/(Liability) as at 31st March ........................................................................................ (154.53) (124.80)
C. Change in the obligations during the year ended 31st March
1. Present Value of Defined Benefit Obligation at the beginning of the year ....................... 124.80 117.08
2. Adjustment on account of exchange rate variations .............................................................. 2.29 9.35
3. Current Service Cost ................................................................................................................... 1.18 1.36
4. Interest Cost ................................................................................................................................ 6.30 6.11
5. Actuarial (Gains)/Losses.............................................................................................................. 29.03 0.11
6. Benefits paid ............................................................................................................................... (9.10) (9.21)
7. Past Service Cost ......................................................................................................................... 0.03 —
8. Present Value of Defined Benefit Obligation at the end of the year .................................. 154.53 124.80
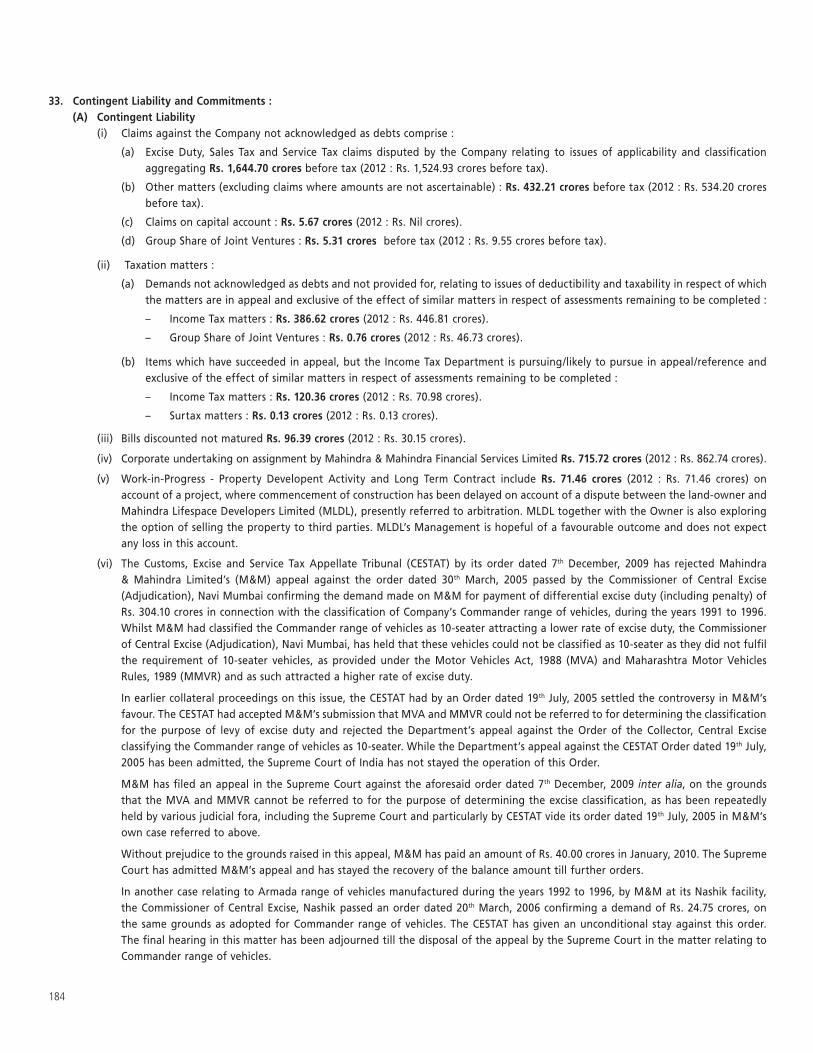
184
33. Contingent Liability and Commitments : (A) Contingent Liability (i) Claims against the Company not acknowledged as debts comprise :
(a) Excise Duty, Sales Tax and Service Tax claims disputed by the Company relating to issues of applicability and classification aggregating Rs. 1,644.70 crores before tax (2012 : Rs. 1,524.93 crores before tax).
(b) Other matters (excluding claims where amounts are not ascertainable) : Rs. 432.21 crores before tax (2012 : Rs. 534.20 crores before tax).
(c) Claims on capital account : Rs. 5.67 crores (2012 : Rs. Nil crores).
(d) Group Share of Joint Ventures : Rs. 5.31 crores before tax (2012 : Rs. 9.55 crores before tax).
(ii) Taxation matters :
(a) Demands not acknowledged as debts and not provided for, relating to issues of deductibility and taxability in respect of which the matters are in appeal and exclusive of the effect of similar matters in respect of assessments remaining to be completed :
– Income Tax matters : Rs. 386.62 crores (2012 : Rs. 446.81 crores).
– Group Share of Joint Ventures : Rs. 0.76 crores (2012 : Rs. 46.73 crores).
(b) Items which have succeeded in appeal, but the Income Tax Department is pursuing/likely to pursue in appeal/reference and exclusive of the effect of similar matters in respect of assessments remaining to be completed :
– Income Tax matters : Rs. 120.36 crores (2012 : Rs. 70.98 crores).
– Surtax matters : Rs. 0.13 crores (2012 : Rs. 0.13 crores).
(iii) Bills discounted not matured Rs. 96.39 crores (2012 : Rs. 30.15 crores).
(iv) Corporate undertaking on assignment by Mahindra & Mahindra Financial Services Limited Rs. 715.72 crores (2012 : Rs. 862.74 crores).
(v) Work-in-Progress - Property Developent Activity and Long Term Contract include Rs. 71.46 crores (2012 : Rs. 71.46 crores) on account of a project, where commencement of construction has been delayed on account of a dispute between the land-owner and Mahindra Lifespace Developers Limited (MLDL), presently referred to arbitration. MLDL together with the Owner is also exploring the option of selling the property to third parties. MLDL’s Management is hopeful of a favourable outcome and does not expect any loss in this account.
(vi) The Customs, Excise and Service Tax Appellate Tribunal (CESTAT) by its order dated 7th December, 2009 has rejected Mahindra & Mahindra Limited’s (M&M) appeal against the order dated 30th March, 2005 passed by the Commissioner of Central Excise (Adjudication), Navi Mumbai confirming the demand made on M&M for payment of differential excise duty (including penalty) of Rs. 304.10 crores in connection with the classification of Company’s Commander range of vehicles, during the years 1991 to 1996. Whilst M&M had classified the Commander range of vehicles as 10-seater attracting a lower rate of excise duty, the Commissioner of Central Excise (Adjudication), Navi Mumbai, has held that these vehicles could not be classified as 10-seater as they did not fulfil the requirement of 10-seater vehicles, as provided under the Motor Vehicles Act, 1988 (MVA) and Maharashtra Motor Vehicles Rules, 1989 (MMVR) and as such attracted a higher rate of excise duty.
In earlier collateral proceedings on this issue, the CESTAT had by an Order dated 19th July, 2005 settled the controversy in M&M’s favour. The CESTAT had accepted M&M’s submission that MVA and MMVR could not be referred to for determining the classification for the purpose of levy of excise duty and rejected the Department’s appeal against the Order of the Collector, Central Excise classifying the Commander range of vehicles as 10-seater. While the Department’s appeal against the CESTAT Order dated 19th July, 2005 has been admitted, the Supreme Court of India has not stayed the operation of this Order.
M&M has filed an appeal in the Supreme Court against the aforesaid order dated 7th December, 2009 inter alia, on the grounds that the MVA and MMVR cannot be referred to for the purpose of determining the excise classification, as has been repeatedly held by various judicial fora, including the Supreme Court and particularly by CESTAT vide its order dated 19th July, 2005 in M&M’s own case referred to above.
Without prejudice to the grounds raised in this appeal, M&M has paid an amount of Rs. 40.00 crores in January, 2010. The Supreme Court has admitted M&M’s appeal and has stayed the recovery of the balance amount till further orders.
In another case relating to Armada range of vehicles manufactured during the years 1992 to 1996, by M&M at its Nashik facility, the Commissioner of Central Excise, Nashik passed an order dated 20th March, 2006 confirming a demand of Rs. 24.75 crores, on the same grounds as adopted for Commander range of vehicles. The CESTAT has given an unconditional stay against this order. The final hearing in this matter has been adjourned till the disposal of the appeal by the Supreme Court in the matter relating to Commander range of vehicles.
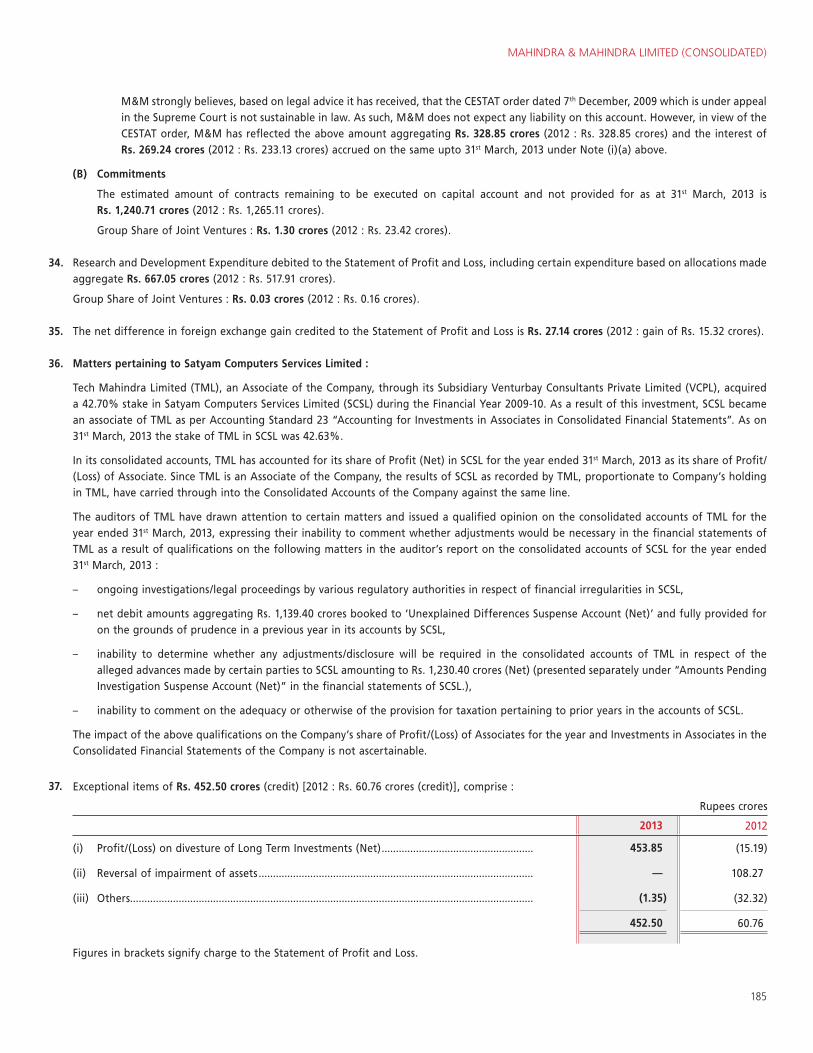
MAHINDRA & MAHINDRA LIMITED (CONSOLIDATED)
185
M&M strongly believes, based on legal advice it has received, that the CESTAT order dated 7th December, 2009 which is under appeal in the Supreme Court is not sustainable in law. As such, M&M does not expect any liability on this account. However, in view of the CESTAT order, M&M has reflected the above amount aggregating Rs. 328.85 crores (2012 : Rs. 328.85 crores) and the interest of Rs. 269.24 crores (2012 : Rs. 233.13 crores) accrued on the same upto 31st March, 2013 under Note (i)(a) above.
(B) Commitments
The estimated amount of contracts remaining to be executed on capital account and not provided for as at 31st March, 2013 is Rs. 1,240.71 crores (2012 : Rs. 1,265.11 crores).
Group Share of Joint Ventures : Rs. 1.30 crores (2012 : Rs. 23.42 crores).
34. Research and Development Expenditure debited to the Statement of Profit and Loss, including certain expenditure based on allocations made aggregate Rs. 667.05 crores (2012 : Rs. 517.91 crores).
Group Share of Joint Ventures : Rs. 0.03 crores (2012 : Rs. 0.16 crores).
35. The net difference in foreign exchange gain credited to the Statement of Profit and Loss is Rs. 27.14 crores (2012 : gain of Rs. 15.32 crores).
36. Matters pertaining to Satyam Computers Services Limited :
Tech Mahindra Limited (TML), an Associate of the Company, through its Subsidiary Venturbay Consultants Private Limited (VCPL), acquired a 42.70% stake in Satyam Computers Services Limited (SCSL) during the Financial Year 2009-10. As a result of this investment, SCSL became an associate of TML as per Accounting Standard 23 “Accounting for Investments in Associates in Consolidated Financial Statements”. As on 31st March, 2013 the stake of TML in SCSL was 42.63%.
In its consolidated accounts, TML has accounted for its share of Profit (Net) in SCSL for the year ended 31st March, 2013 as its share of Profit/ (Loss) of Associate. Since TML is an Associate of the Company, the results of SCSL as recorded by TML, proportionate to Company’s holding in TML, have carried through into the Consolidated Accounts of the Company against the same line.
The auditors of TML have drawn attention to certain matters and issued a qualified opinion on the consolidated accounts of TML for the year ended 31st March, 2013, expressing their inability to comment whether adjustments would be necessary in the financial statements of TML as a result of qualifications on the following matters in the auditor’s report on the consolidated accounts of SCSL for the year ended 31st March, 2013 :
– ongoing investigations/legal proceedings by various regulatory authorities in respect of financial irregularities in SCSL,
– net debit amounts aggregating Rs. 1,139.40 crores booked to ‘Unexplained Differences Suspense Account (Net)’ and fully provided for on the grounds of prudence in a previous year in its accounts by SCSL,
– inability to determine whether any adjustments/disclosure will be required in the consolidated accounts of TML in respect of the alleged advances made by certain parties to SCSL amounting to Rs. 1,230.40 crores (Net) (presented separately under “Amounts Pending Investigation Suspense Account (Net)” in the financial statements of SCSL.),
– inability to comment on the adequacy or otherwise of the provision for taxation pertaining to prior years in the accounts of SCSL.
The impact of the above qualifications on the Company’s share of Profit/(Loss) of Associates for the year and Investments in Associates in the Consolidated Financial Statements of the Company is not ascertainable.
37. Exceptional items of Rs. 452.50 crores (credit) [2012 : Rs. 60.76 crores (credit)], comprise :
Rupees crores
2013 2012
(i) Profit/(Loss) on divesture of Long Term Investments (Net) ..................................................... 453.85 (15.19)
(ii) Reversal of impairment of assets ................................................................................................ — 108.27
(iii) Others ............................................................................................................................................. (1.35) (32.32)
452.50 60.76
Figures in brackets signify charge to the Statement of Profit and Loss.
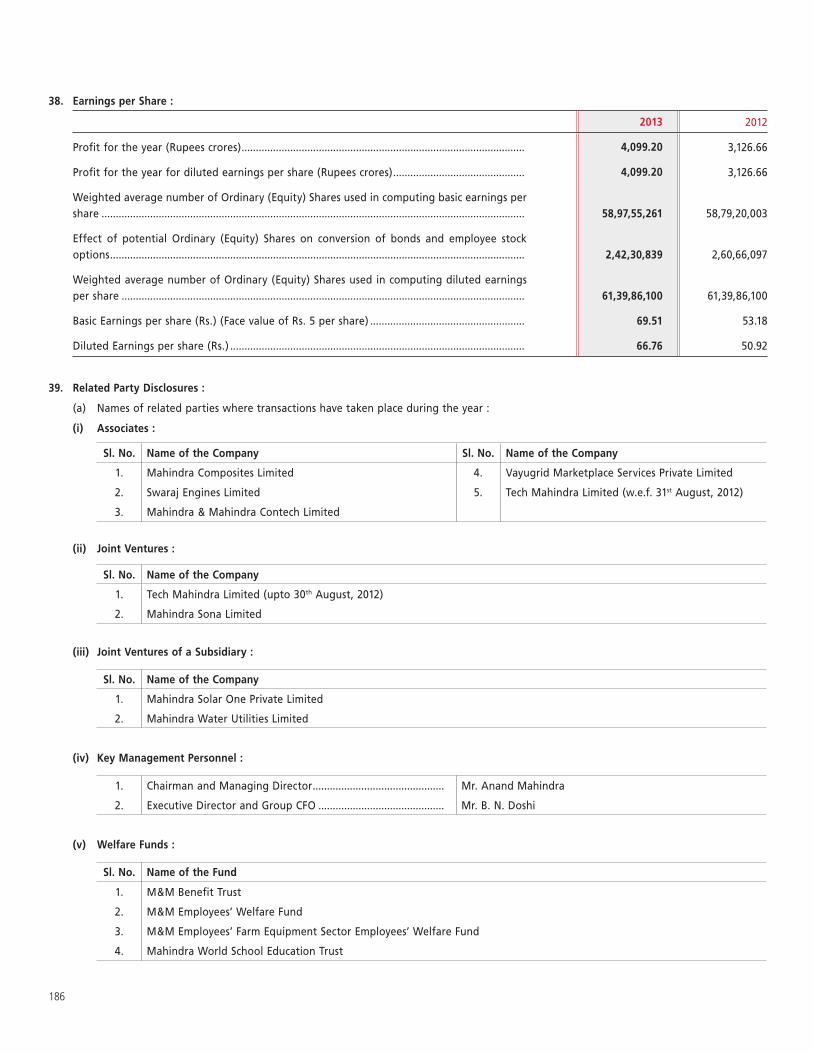
186
38. Earnings per Share :
2013 2012
Profit for the year (Rupees crores) ................................................................................................... 4,099.20 3,126.66
Profit for the year for diluted earnings per share (Rupees crores) .............................................. 4,099.20 3,126.66
Weighted average number of Ordinary (Equity) Shares used in computing basic earnings per share .................................................................................................................................................... 58,97,55,261 58,79,20,003
Effect of potential Ordinary (Equity) Shares on conversion of bonds and employee stock options ................................................................................................................................................. 2,42,30,839 2,60,66,097
Weighted average number of Ordinary (Equity) Shares used in computing diluted earnings per share ............................................................................................................................................. 61,39,86,100 61,39,86,100
Basic Earnings per share (Rs.) (Face value of Rs. 5 per share) ...................................................... 69.51 53.18
Diluted Earnings per share (Rs.) ....................................................................................................... 66.76 50.92
39. Related Party Disclosures :
(a) Names of related parties where transactions have taken place during the year :
(i) Associates :
Sl. No. Name of the Company Sl. No. Name of the Company
1. Mahindra Composites Limited 4. Vayugrid Marketplace Services Private Limited
2. Swaraj Engines Limited 5. Tech Mahindra Limited (w.e.f. 31st August, 2012)
3. Mahindra & Mahindra Contech Limited
(ii) Joint Ventures :
Sl. No. Name of the Company
1. Tech Mahindra Limited (upto 30th August, 2012)
2. Mahindra Sona Limited
(iii) Joint Ventures of a Subsidiary :
Sl. No. Name of the Company
1. Mahindra Solar One Private Limited
2. Mahindra Water Utilities Limited
(iv) Key Management Personnel :
1. Chairman and Managing Director .............................................. Mr. Anand Mahindra
2. Executive Director and Group CFO ............................................ Mr. B. N. Doshi
(v) Welfare Funds :
Sl. No. Name of the Fund
1. M&M Benefit Trust
2. M&M Employees’ Welfare Fund
3. M&M Employees’ Farm Equipment Sector Employees’ Welfare Fund
4. Mahindra World School Education Trust
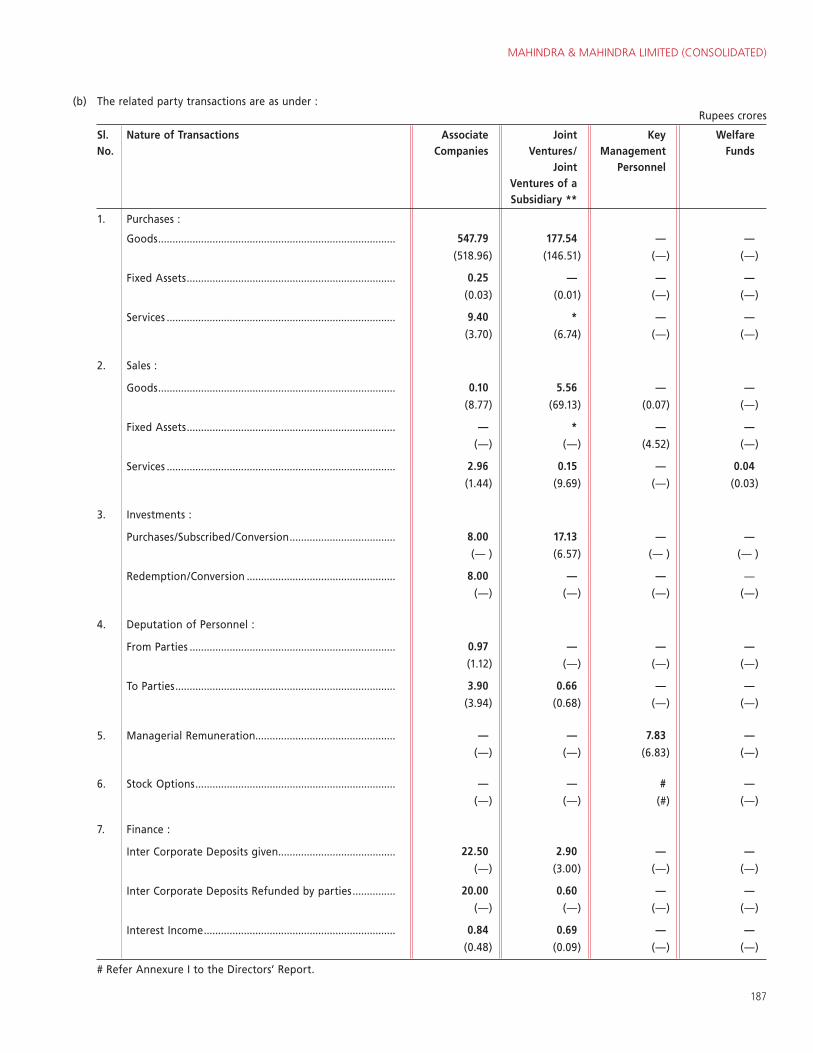
MAHINDRA & MAHINDRA LIMITED (CONSOLIDATED)
187
(b) The related party transactions are as under : (Contd.)Rupees crores
Sl. No.
Nature of Transactions Associate Companies
Joint Ventures/
Joint Ventures of a Subsidiary **
Key Management
Personnel
Welfare Funds
1. Purchases :
Goods ................................................................................... 547.79 177.54 — —
(518.96) (146.51) (—) (—)
Fixed Assets ......................................................................... 0.25 — — —
(0.03) (0.01) (—) (—)
Services ................................................................................ 9.40 * — —
(3.70) (6.74) (—) (—)
2. Sales :
Goods ................................................................................... 0.10 5.56 — —
(8.77) (69.13) (0.07) (—)
Fixed Assets ......................................................................... — * — —
(—) (—) (4.52) (—)
Services ................................................................................ 2.96 0.15 — 0.04
(1.44) (9.69) (—) (0.03)
3. Investments :
Purchases/Subscribed/Conversion ..................................... 8.00 17.13 — —
(— ) (6.57) (— ) (— )
Redemption/Conversion .................................................... 8.00 — — —
(—) (—) (—) (—)
4. Deputation of Personnel :
From Parties ........................................................................ 0.97 — — —
(1.12) (—) (—) (—)
To Parties ............................................................................. 3.90 0.66 — —
(3.94) (0.68) (—) (—)
5. Managerial Remuneration................................................. — — 7.83 —
(—) (—) (6.83) (—)
6. Stock Options ...................................................................... — — # —
(—) (—) (#) (—)
7. Finance :
Inter Corporate Deposits given......................................... 22.50 2.90 — —
(—) (3.00) (—) (—)
Inter Corporate Deposits Refunded by parties ............... 20.00 0.60 — —
(—) (—) (—) (—)
Interest Income ................................................................... 0.84 0.69 — —
(0.48) (0.09) (—) (—)
# Refer Annexure I to the Directors’ Report.
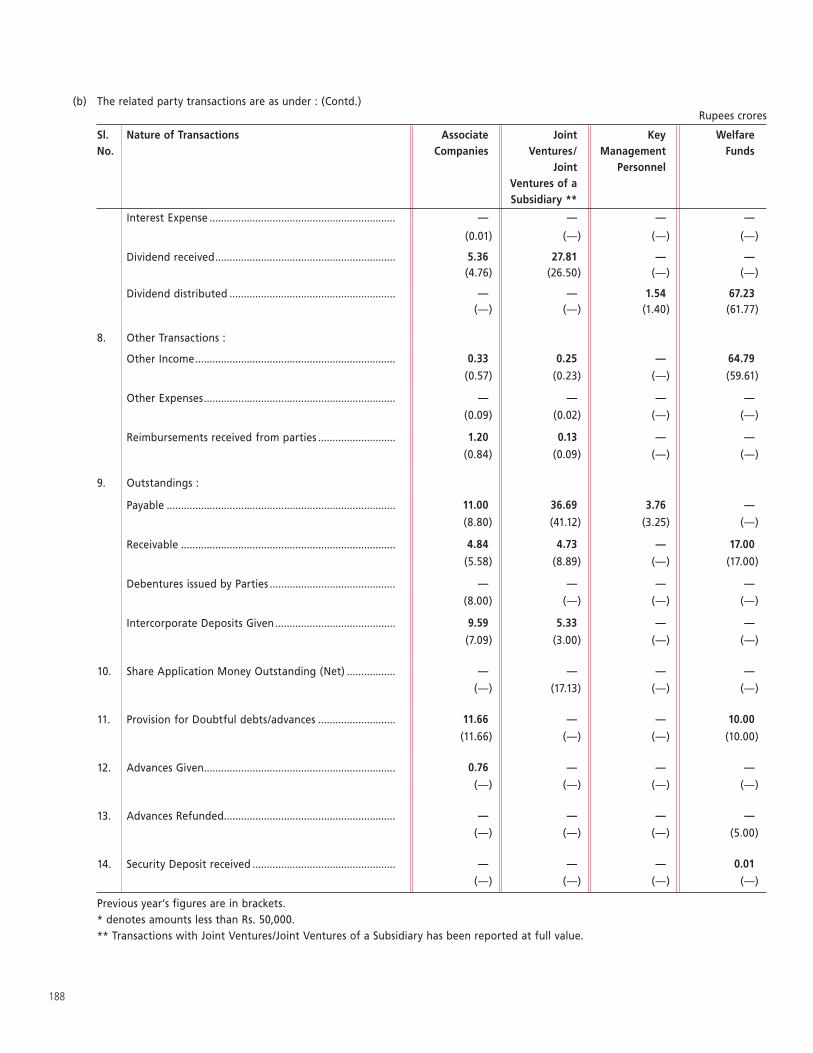
188
(b) The related party transactions are as under : (Contd.)Rupees crores
Sl. No.
Nature of Transactions Associate Companies
Joint Ventures/
Joint Ventures of a Subsidiary **
Key Management
Personnel
Welfare Funds
Interest Expense ................................................................. — — — —
(0.01) (—) (—) (—)
Dividend received ............................................................... 5.36 27.81 — — (4.76) (26.50) (—) (—)
Dividend distributed .......................................................... — — 1.54 67.23 (—) (—) (1.40) (61.77)
8. Other Transactions :
Other Income ...................................................................... 0.33 0.25 — 64.79
(0.57) (0.23) (—) (59.61)
Other Expenses ................................................................... — — — —
(0.09) (0.02) (—) (—)
Reimbursements received from parties ........................... 1.20 0.13 — —
(0.84) (0.09) (—) (—)
9. Outstandings :
Payable ................................................................................ 11.00 36.69 3.76 —
(8.80) (41.12) (3.25) (—)
Receivable ........................................................................... 4.84 4.73 — 17.00
(5.58) (8.89) (—) (17.00)
Debentures issued by Parties ............................................ — — — —
(8.00) (—) (—) (—)
Intercorporate Deposits Given .......................................... 9.59 5.33 — —
(7.09) (3.00) (—) (—)
10. Share Application Money Outstanding (Net) ................. — — — —
(—) (17.13) (—) (—)
11. Provision for Doubtful debts/advances ........................... 11.66 — — 10.00
(11.66) (—) (—) (10.00)
12. Advances Given ................................................................... 0.76 — — —
(—) (—) (—) (—)
13. Advances Refunded ............................................................ — — — —
(—) (—) (—) (5.00)
14. Security Deposit received .................................................. — — — 0.01
(—) (—) (—) (—)
Previous year’s figures are in brackets.* denotes amounts less than Rs. 50,000.** Transactions with Joint Ventures/Joint Ventures of a Subsidiary has been reported at full value.
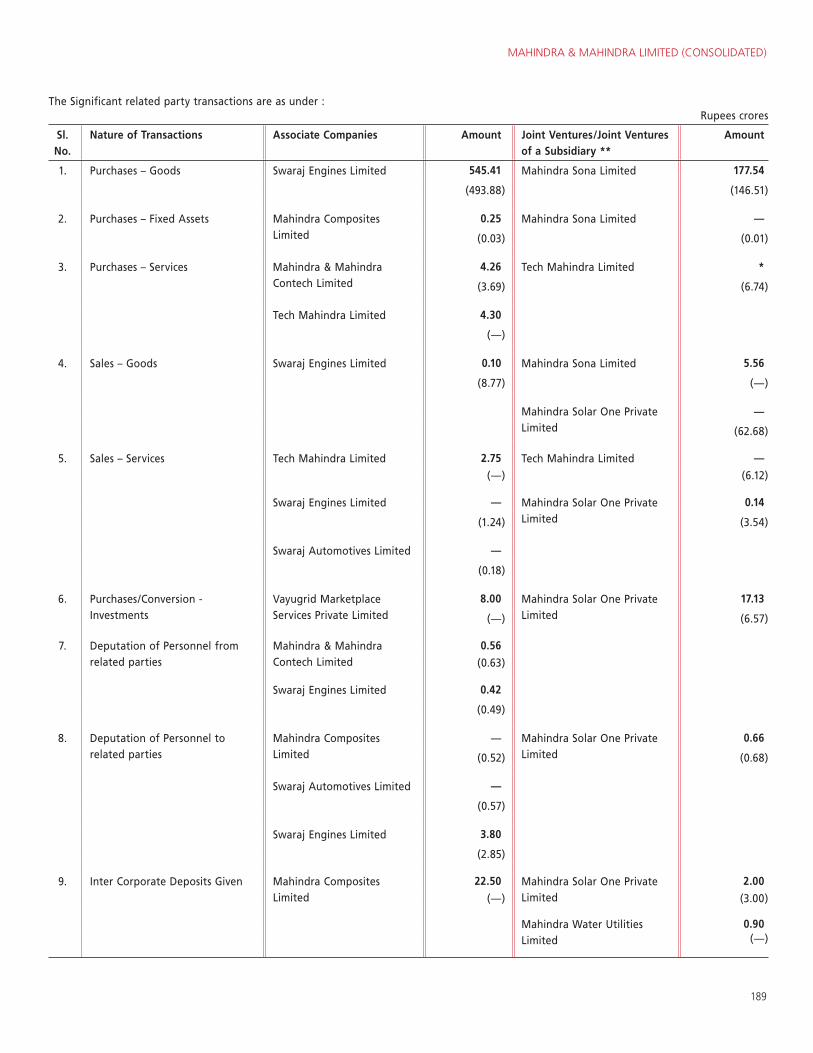
MAHINDRA & MAHINDRA LIMITED (CONSOLIDATED)
189
The Significant related party transactions are as under : (Contd.)Rupees crores
Sl. No.
Nature of Transactions Associate Companies Amount Joint Ventures/Joint Ventures of a Subsidiary **
Amount
1. Purchases – Goods Swaraj Engines Limited 545.41 Mahindra Sona Limited 177.54
(493.88) (146.51)
2. Purchases – Fixed Assets Mahindra Composites Limited
0.25 Mahindra Sona Limited —
(0.03) (0.01)
3. Purchases – Services Mahindra & Mahindra Contech Limited
4.26 Tech Mahindra Limited *
(3.69) (6.74)
Tech Mahindra Limited 4.30
(—)
4. Sales – Goods Swaraj Engines Limited 0.10 Mahindra Sona Limited 5.56
(8.77) (—)
Mahindra Solar One Private Limited
—
(62.68)
5. Sales – Services Tech Mahindra Limited 2.75 Tech Mahindra Limited —
(—) (6.12)
Swaraj Engines Limited — Mahindra Solar One Private Limited
0.14
(1.24) (3.54)
Swaraj Automotives Limited —
(0.18)
6. Purchases/Conversion - Investments
Vayugrid Marketplace Services Private Limited
8.00 Mahindra Solar One Private Limited
17.13
(—) (6.57)
7. Deputation of Personnel from related parties
Mahindra & Mahindra Contech Limited
0.56
(0.63)
Swaraj Engines Limited 0.42
(0.49)
8. Deputation of Personnel to related parties
Mahindra Composites Limited
— Mahindra Solar One Private Limited
0.66
(0.52) (0.68)
Swaraj Automotives Limited —
(0.57)
Swaraj Engines Limited 3.80
(2.85)
9. Inter Corporate Deposits Given Mahindra Composites Limited
22.50 Mahindra Solar One Private Limited
2.00
(—) (3.00)
Mahindra Water Utilities Limited
0.90 (—)
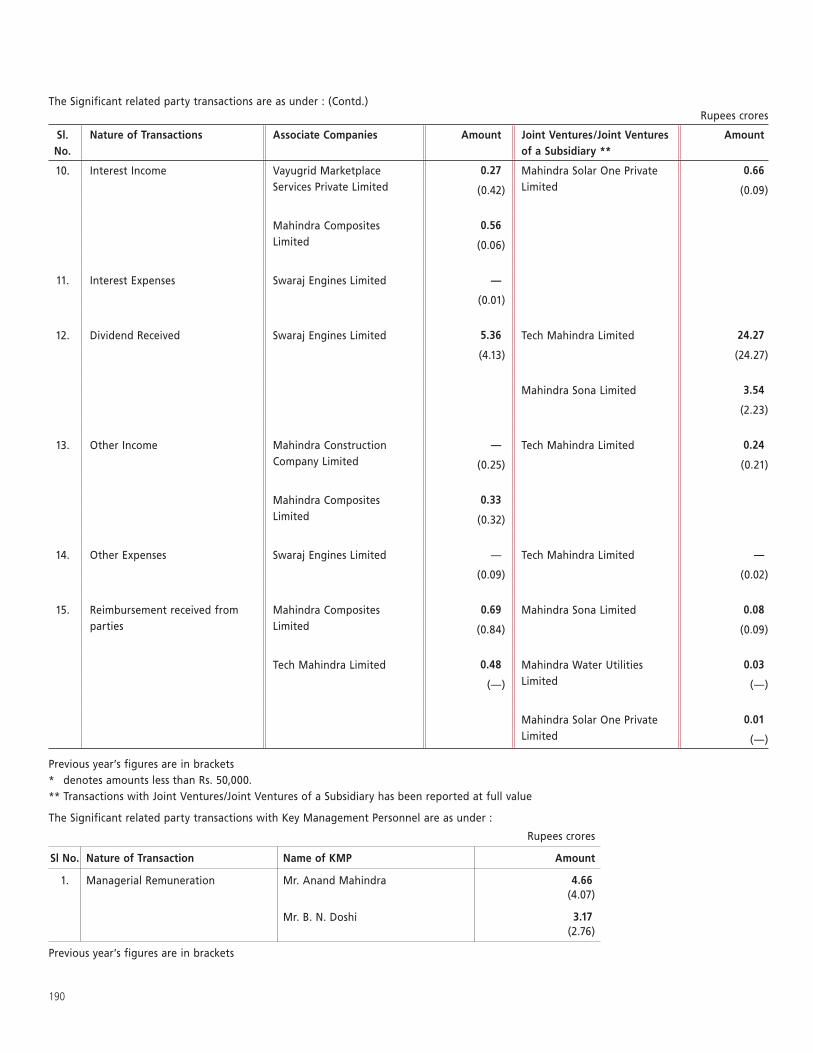
190
The Significant related party transactions are as under : (Contd.)Rupees crores
Sl. No.
Nature of Transactions Associate Companies Amount Joint Ventures/Joint Ventures of a Subsidiary **
Amount
10. Interest Income Vayugrid Marketplace Services Private Limited
0.27 Mahindra Solar One Private Limited
0.66
(0.42) (0.09)
Mahindra Composites Limited
0.56
(0.06)
11. Interest Expenses Swaraj Engines Limited —
(0.01)
12. Dividend Received Swaraj Engines Limited 5.36 Tech Mahindra Limited 24.27
(4.13) (24.27)
Mahindra Sona Limited 3.54
(2.23)
13. Other Income Mahindra Construction Company Limited
— Tech Mahindra Limited 0.24
(0.25) (0.21)
Mahindra Composites Limited
0.33
(0.32)
14. Other Expenses Swaraj Engines Limited — Tech Mahindra Limited —
(0.09) (0.02)
15. Reimbursement received from parties
Mahindra Composites Limited
0.69 Mahindra Sona Limited 0.08
(0.84) (0.09)
Tech Mahindra Limited 0.48 Mahindra Water Utilities Limited
0.03
(—) (—)
Mahindra Solar One Private Limited
0.01
(—)
Previous year’s figures are in brackets* denotes amounts less than Rs. 50,000.** Transactions with Joint Ventures/Joint Ventures of a Subsidiary has been reported at full value
The Significant related party transactions with Key Management Personnel are as under :
Rupees crores
Sl No. Nature of Transaction Name of KMP Amount
1. Managerial Remuneration Mr. Anand Mahindra 4.66 (4.07)
Mr. B. N. Doshi 3.17 (2.76)
Previous year’s figures are in brackets
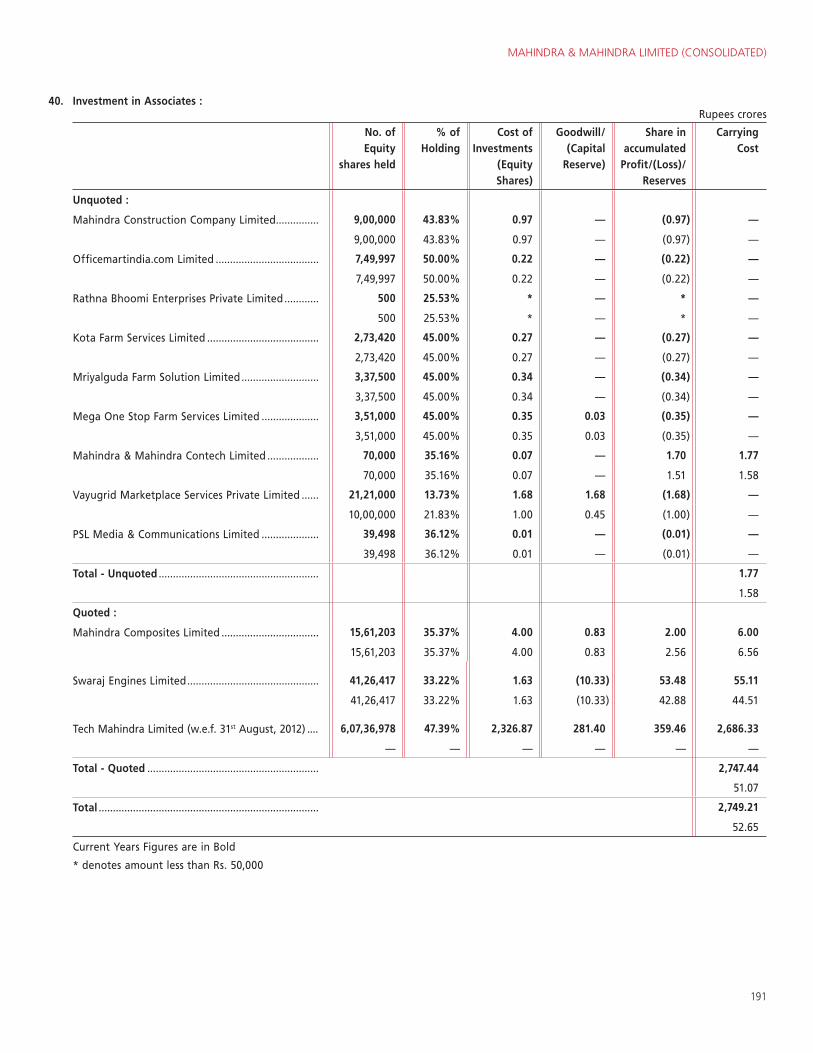
MAHINDRA & MAHINDRA LIMITED (CONSOLIDATED)
191
40. Investment in Associates :Rupees crores
No. of Equity
shares held
% of Holding
Cost of Investments
(Equity Shares)
Goodwill/ (Capital
Reserve)
Share in accumulated
Profit/(Loss)/Reserves
Carrying Cost
Unquoted :
Mahindra Construction Company Limited............... 9,00,000 43.83% 0.97 — (0.97) —
9,00,000 43.83% 0.97 — (0.97) —
Officemartindia.com Limited .................................... 7,49,997 50.00% 0.22 — (0.22) —
7,49,997 50.00% 0.22 — (0.22) —
Rathna Bhoomi Enterprises Private Limited ............ 500 25.53% * — * —
500 25.53% * — * —
Kota Farm Services Limited ....................................... 2,73,420 45.00% 0.27 — (0.27) —
2,73,420 45.00% 0.27 — (0.27) —
Mriyalguda Farm Solution Limited ........................... 3,37,500 45.00% 0.34 — (0.34) —
3,37,500 45.00% 0.34 — (0.34) —
Mega One Stop Farm Services Limited .................... 3,51,000 45.00% 0.35 0.03 (0.35) —
3,51,000 45.00% 0.35 0.03 (0.35) —
Mahindra & Mahindra Contech Limited .................. 70,000 35.16% 0.07 — 1.70 1.77
70,000 35.16% 0.07 — 1.51 1.58
Vayugrid Marketplace Services Private Limited ...... 21,21,000 13.73% 1.68 1.68 (1.68) —
10,00,000 21.83% 1.00 0.45 (1.00) —
PSL Media & Communications Limited .................... 39,498 36.12% 0.01 — (0.01) —
39,498 36.12% 0.01 — (0.01) —
Total - Unquoted ........................................................ 1.77
1.58
Quoted :
Mahindra Composites Limited .................................. 15,61,203 35.37% 4.00 0.83 2.00 6.00
15,61,203 35.37% 4.00 0.83 2.56 6.56
Swaraj Engines Limited .............................................. 41,26,417 33.22% 1.63 (10.33) 53.48 55.11
41,26,417 33.22% 1.63 (10.33) 42.88 44.51
Tech Mahindra Limited (w.e.f. 31st August, 2012) .... 6,07,36,978 47.39% 2,326.87 281.40 359.46 2,686.33
— — — — — —
Total - Quoted ............................................................ 2,747.44
51.07
Total ............................................................................. 2,749.21
52.65
Current Years Figures are in Bold
* denotes amount less than Rs. 50,000
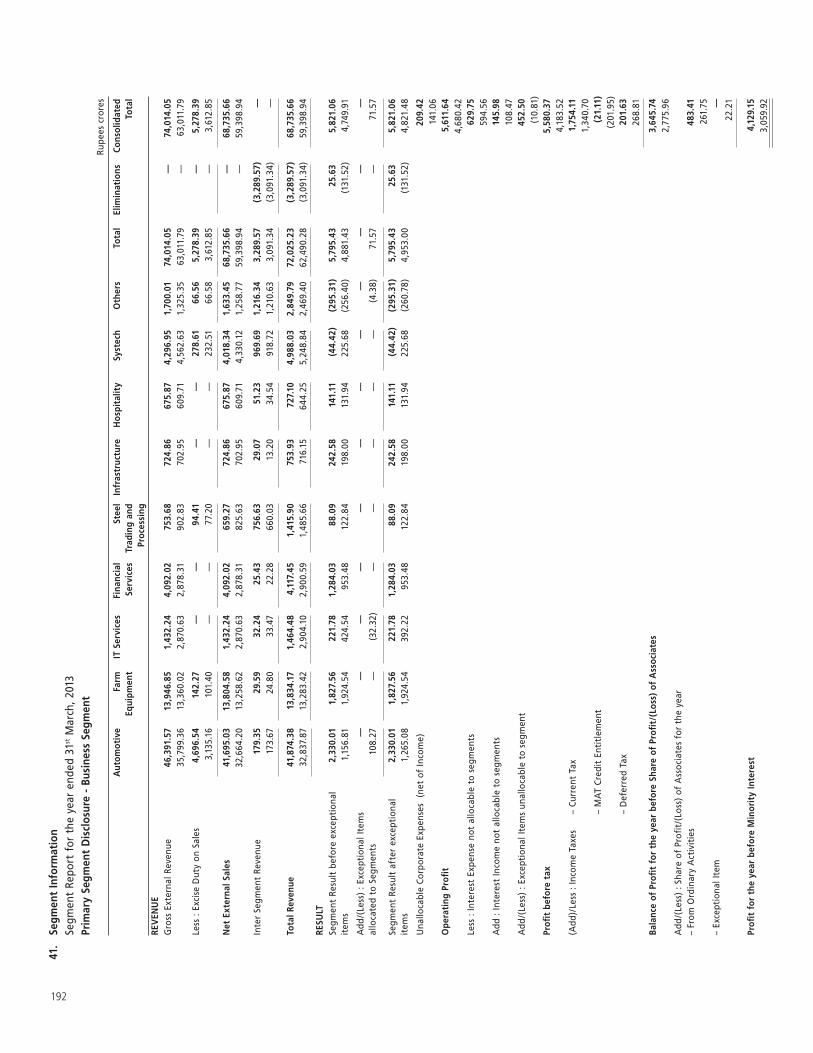
192
41.
Segm
ent
Info
rmat
ion
Se
gmen
t Re
port
for
the
yea
r en
ded
31st M
arch
, 201
3
Prim
ary
Segm
ent
Dis
clos
ure
- Bu
sine
ss S
egm
ent
Rup
ees
cror
es
Aut
omot
ive
Far
m
Equi
pmen
t IT
Ser
vice
s F
inan
cial
Se
rvic
es
Ste
el
Trad
ing
and
Proc
essi
ng
Infr
astr
uctu
re
Hos
pita
lity
Sys
tech
O
ther
s T
otal
El
imin
atio
ns
Cons
olid
ated
To
tal
REV
ENU
EG
ross
Ext
erna
l Rev
enue
46,
391.
57
13,
946.
85
1,4
32.2
4 4
,092
.02
753
.68
724
.86
675
.87
4,2
96.9
5 1
,700
.01
74,
014.
05
—
74,
014.
05
35,
799.
36
13,
360.
02
2,8
70.6
3 2
,878
.31
902
.83
702
.95
609
.71
4,5
62.6
3 1
,325
.35
63,
011.
79
—
63,
011.
79
Less
: Ex
cise
Dut
y on
Sal
es 4
,696
.54
142
.27
—
—
94.
41
—
—
278
.61
66.
56
5,2
78.3
9 —
5
,278
.39
3,1
35.1
6 1
01.4
0 —
—
7
7.20
—
—
2
32.5
1 6
6.58
3
,612
.85
—
3,6
12.8
5
Net
Ext
erna
l Sal
es 4
1,69
5.03
1
3,80
4.58
1
,432
.24
4,0
92.0
2 6
59.2
7 7
24.8
6 6
75.8
7 4
,018
.34
1,6
33.4
5 6
8,73
5.66
—
6
8,73
5.66
3
2,66
4.20
1
3,25
8.62
2
,870
.63
2,8
78.3
1 8
25.6
3 7
02.9
5 6
09.7
1 4
,330
.12
1,2
58.7
7 5
9,39
8.94
—
5
9,39
8.94
Inte
r Se
gmen
t Re
venu
e 1
79.3
5 2
9.59
3
2.24
2
5.43
7
56.6
3 2
9.07
5
1.23
9
69.6
9 1
,216
.34
3,2
89.5
7 (
3,28
9.57
) —
1
73.6
7 2
4.80
3
3.47
2
2.28
6
60.0
3 1
3.20
3
4.54
9
18.7
2 1
,210
.63
3,0
91.3
4 (
3,09
1.34
) —
Tota
l Rev
enue
41,
874.
38
13,
834.
17
1,4
64.4
8 4
,117
.45
1,4
15.9
0 7
53.9
3 7
27.1
0 4
,988
.03
2,8
49.7
9 7
2,02
5.23
(
3,28
9.57
) 6
8,73
5.66
3
2,83
7.87
1
3,28
3.42
2
,904
.10
2,9
00.5
9 1
,485
.66
716
.15
644
.25
5,2
48.8
4 2
,469
.40
62,
490.
28
(3,
091.
34)
59,
398.
94
RESU
LTSe
gmen
t Re
sult
bef
ore
exce
ptio
nal
item
s 2
,330
.01
1,8
27.5
6 2
21.7
8 1
,284
.03
88.
09
242
.58
141
.11
(44
.42)
(29
5.31
) 5
,795
.43
25.
63
5,8
21.0
6 1
,156
.81
1,9
24.5
4 4
24.5
4 9
53.4
8 1
22.8
4 1
98.0
0 1
31.9
4 2
25.6
8 (
256.
40)
4,8
81.4
3 (
131.
52)
4,7
49.9
1
Add
/(Le
ss)
: Exc
epti
onal
Item
s al
loca
ted
to S
egm
ents
—
—
—
—
—
—
—
—
—
—
—
—
108
.27
—
(32
.32)
—
—
—
—
—
(4.
38)
71.
57
—
71.
57
Segm
ent
Resu
lt a
fter
exc
epti
onal
it
ems
2,3
30.0
1 1
,827
.56
221
.78
1,2
84.0
3 8
8.09
2
42.5
8 1
41.1
1 (
44.4
2) (
295.
31)
5,7
95.4
3 2
5.63
5
,821
.06
1,2
65.0
8 1
,924
.54
392
.22
953
.48
122
.84
198
.00
131
.94
225
.68
(26
0.78
) 4
,953
.00
(13
1.52
) 4
,821
.48
Una
lloca
ble
Corp
orat
e Ex
pens
es
(net
of
Inco
me)
2
09.4
2
1
41.0
6 O
pera
ting
Pro
fit
5,6
11.6
4
4,6
80.4
2 Le
ss :
Inte
rest
Exp
ense
not
allo
cabl
e to
seg
men
ts
6
29.7
5
594
.56
Add
: In
tere
st In
com
e no
t al
loca
ble
to s
egm
ents
1
45.9
8
1
08.4
7 A
dd/(
Less
) : E
xcep
tion
al It
ems
unal
loca
ble
to s
egm
ent
4
52.5
0
(10
.81)
Profi
t be
fore
tax
5
,580
.37
4
,183
.52
(Add
)/Le
ss :
Inco
me
Taxe
s
– Cu
rren
t Ta
x
1,7
54.1
1
1
,340
.70
– M
AT
Cred
it E
ntit
lem
ent
(21
.11)
(20
1.95
)
–
Def
erre
d Ta
x
2
01.6
3
2
68.8
1
Bala
nce
of P
rofi
t fo
r th
e ye
ar b
efor
e Sh
are
of P
rofi
t/(L
oss)
of
Ass
ocia
tes
3,6
45.7
4
2
,775
.96
Add
/(Le
ss)
: Sha
re o
f Pr
ofit/
(Los
s) o
f A
ssoc
iate
s fo
r th
e ye
ar
– Fr
om O
rdin
ary
Act
ivit
ies
483
.41
2
61.7
5 –
Exce
ptio
nal I
tem
—
2
2.21
Profi
t fo
r th
e ye
ar b
efor
e M
inor
ity
Inte
rest
4,1
29.1
5 3
,059
.92
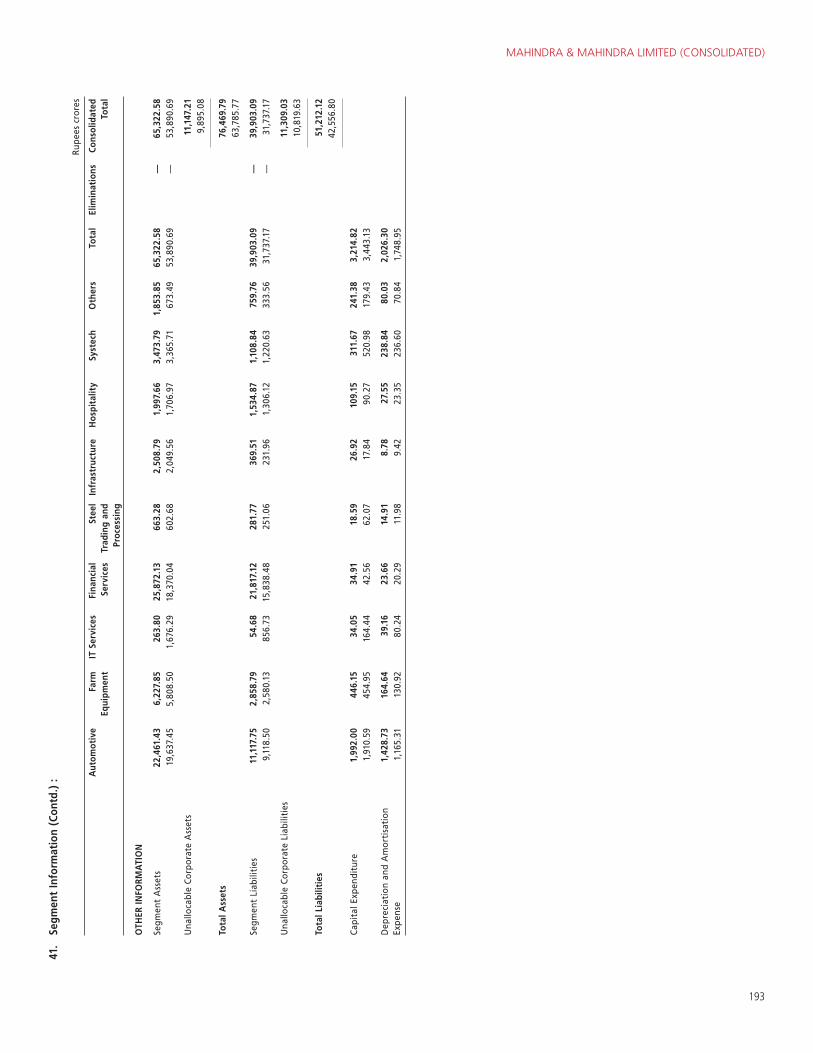
MAHINDRA & MAHINDRA LIMITED (CONSOLIDATED)
193
Rup
ees
cror
es
Aut
omot
ive
Far
m
Equi
pmen
t IT
Ser
vice
s F
inan
cial
Se
rvic
es
Ste
el
Trad
ing
and
Proc
essi
ng
Infr
astr
uctu
re
Hos
pita
lity
Sys
tech
O
ther
s T
otal
El
imin
atio
ns
Cons
olid
ated
To
tal
OTH
ER IN
FORM
ATI
ON
Segm
ent
Ass
ets
22,
461.
43
6,2
27.8
5 2
63.8
0 2
5,87
2.13
6
63.2
8 2
,508
.79
1,9
97.6
6 3
,473
.79
1,8
53.8
5 65
,322
.58
—
65,
322.
58
19,
637.
45
5,8
08.5
0 1
,676
.29
18,
370.
04
602
.68
2,0
49.5
6 1
,706
.97
3,3
65.7
1 6
73.4
9 53
,890
.69
—
53,
890.
69
Una
lloca
ble
Corp
orat
e A
sset
s
11,
147.
21
9
,895
.08
Tota
l Ass
ets
7
6,46
9.79
63,
785.
77
Segm
ent
Liab
iliti
es 1
1,11
7.75
2
,858
.79
54.
68
21,
817.
12
281
.77
369
.51
1,5
34.8
7 1
,108
.84
759
.76
39,
903.
09
—
39,
903.
09
9,1
18.5
0 2
,580
.13
856
.73
15,8
38.4
8 2
51.0
6 2
31.9
6 1
,306
.12
1,2
20.6
3 3
33.5
6 31
,737
.17
—
31,
737.
17
Una
lloca
ble
Corp
orat
e Li
abili
ties
1
1,30
9.03
10,
819.
63
Tota
l Lia
bilit
ies
5
1,21
2.12
42,
556.
80
Capi
tal E
xpen
ditu
re1,
992.
0044
6.15
34.0
534
.91
18.5
926
.92
109.
1531
1.67
241.
38 3
,214
.82
1,91
0.59
454.
9516
4.44
42.5
662
.07
17.8
490
.27
520.
9817
9.43
3,4
43.1
3
Dep
reci
atio
n an
d A
mor
tisa
tion
Ex
pens
e1,
428.
7316
4.64
39.1
623
.66
14.9
18.
7827
.55
238.
8480
.03
2,0
26.3
0
1,
165.
3113
0.92
80.2
420
.29
11.9
89.
4223
.35
236.
6070
.84
1,74
8.95
41.
Segm
ent
Info
rmat
ion
(Con
td.)
:
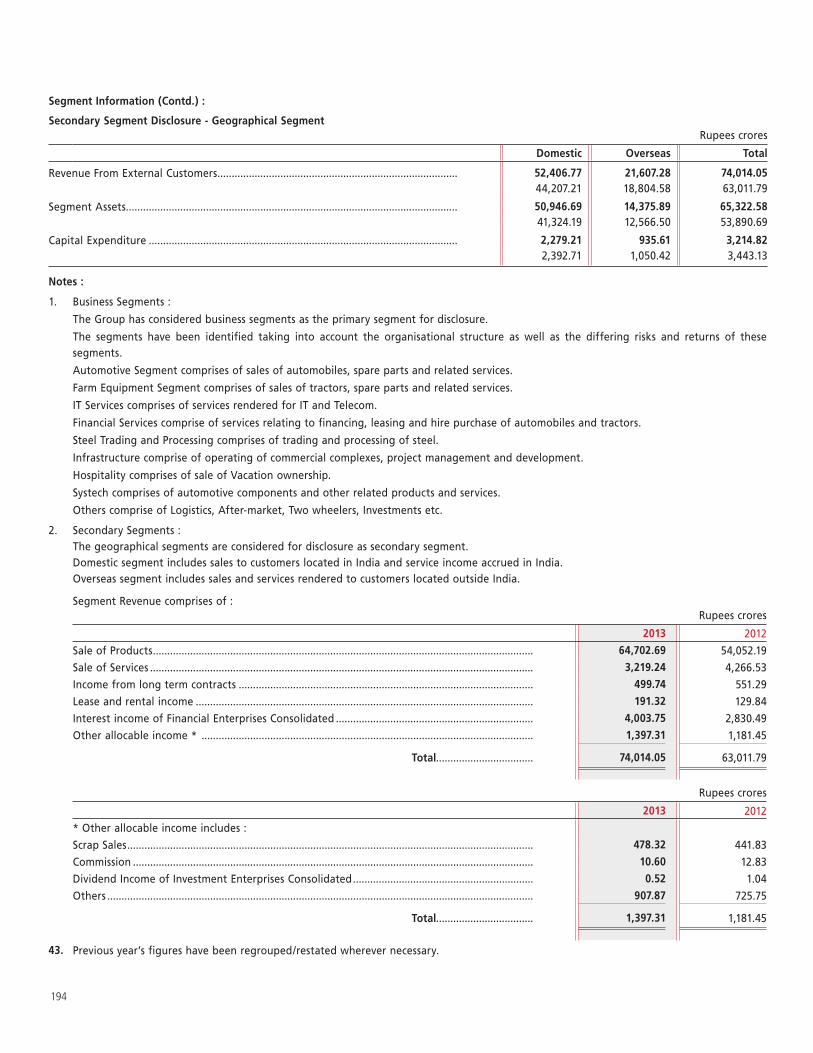
194
Segment Information (Contd.) :
Secondary Segment Disclosure - Geographical SegmentRupees crores
Domestic Overseas Total
Revenue From External Customers .................................................................................... 52,406.77 21,607.28 74,014.0544,207.21 18,804.58 63,011.79
Segment Assets .................................................................................................................... 50,946.69 14,375.89 65,322.5841,324.19 12,566.50 53,890.69
Capital Expenditure ............................................................................................................ 2,279.21 935.61 3,214.822,392.71 1,050.42 3,443.13
Notes :
1. Business Segments :
The Group has considered business segments as the primary segment for disclosure.
The segments have been identified taking into account the organisational structure as well as the differing risks and returns of these segments.
Automotive Segment comprises of sales of automobiles, spare parts and related services.
Farm Equipment Segment comprises of sales of tractors, spare parts and related services.
IT Services comprises of services rendered for IT and Telecom.
Financial Services comprise of services relating to financing, leasing and hire purchase of automobiles and tractors.
Steel Trading and Processing comprises of trading and processing of steel.
Infrastructure comprise of operating of commercial complexes, project management and development.
Hospitality comprises of sale of Vacation ownership.
Systech comprises of automotive components and other related products and services.
Others comprise of Logistics, After-market, Two wheelers, Investments etc.
2. Secondary Segments : The geographical segments are considered for disclosure as secondary segment. Domestic segment includes sales to customers located in India and service income accrued in India. Overseas segment includes sales and services rendered to customers located outside India.
Segment Revenue comprises of : Rupees crores
2013 2012
Sale of Products ..................................................................................................................................... 64,702.69 54,052.19
Sale of Services ...................................................................................................................................... 3,219.24 4,266.53
Income from long term contracts ....................................................................................................... 499.74 551.29
Lease and rental income ...................................................................................................................... 191.32 129.84
Interest income of Financial Enterprises Consolidated ..................................................................... 4,003.75 2,830.49
Other allocable income * .................................................................................................................... 1,397.31 1,181.45
Total.................................. 74,014.05 63,011.79
Rupees crores
2013 2012
* Other allocable income includes :
Scrap Sales .............................................................................................................................................. 478.32 441.83
Commission ............................................................................................................................................ 10.60 12.83
Dividend Income of Investment Enterprises Consolidated ............................................................... 0.52 1.04
Others ..................................................................................................................................................... 907.87 725.75
Total.................................. 1,397.31 1,181.45
43. Previous year’s figures have been regrouped/restated wherever necessary.
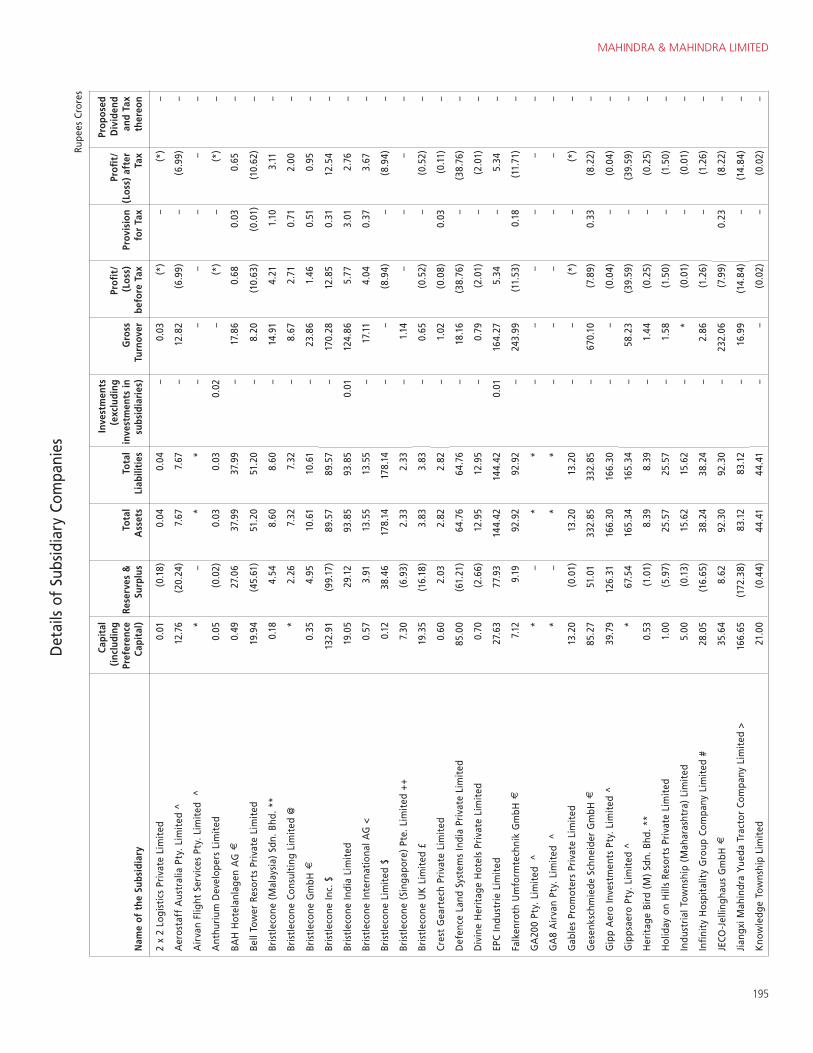
MAHINDRA & MAHINDRA LIMITED
195
Det
ails
of
Subs
idia
ry C
ompa
nies
(Con
td.)
Rup
ees
Cror
es
Nam
e of
the
Sub
sidi
ary
Capi
tal
(incl
udin
g Pr
efer
ence
Ca
pita
l)Re
serv
es &
Su
rplu
sTo
tal
Ass
ets
Tota
l Li
abili
ties
Inve
stm
ents
(e
xclu
ding
in
vest
men
ts in
su
bsid
iari
es)
Gro
ss
Turn
over
Profi
t/(L
oss)
be
fore
Tax
Prov
isio
n fo
r Ta
x
Profi
t/(L
oss)
aft
er
Tax
Prop
osed
D
ivid
end
and
Tax
ther
eon
2 x
2 Lo
gist
ics
Priv
ate
Lim
ited
0.0
1 (
0.18
) 0
.04
0.0
4 –
0.0
3 (
*) –
(*)
–
Aer
osta
ff A
ustr
alia
Pty
. Lim
ited
^ 1
2.76
(
20.2
4) 7
.67
7.6
7 –
12.
82
(6.
99)
– (
6.99
) –
Air
van
Flig
ht S
ervi
ces
Pty.
Lim
ited
^
*
– *
*
–
– –
– –
–
Ant
huri
um D
evel
oper
s Li
mit
ed 0
.05
(0.
02)
0.0
3 0
.03
0.0
2 –
(*)
– (
*) –
BAH
Hot
elan
lage
n A
G
0.4
9 2
7.06
3
7.99
3
7.99
–
17.
86
0.6
8 0
.03
0.6
5 –
Bell
Tow
er R
esor
ts P
riva
te L
imit
ed 1
9.94
(
45.6
1) 5
1.20
5
1.20
–
8.2
0 (
10.6
3) (
0.01
) (
10.6
2) –
Bris
tlec
one
(Mal
aysi
a) S
dn. B
hd. *
* 0
.18
4.5
4 8
.60
8.6
0 –
14.
91
4.2
1 1
.10
3.1
1 –
Bris
tlec
one
Cons
ulti
ng L
imit
ed @
*
2.2
6 7
.32
7.3
2 –
8.6
7 2
.71
0.7
1 2
.00
–
Bris
tlec
one
Gm
bH
0.3
5 4
.95
10.
61
10.
61
– 2
3.86
1
.46
0.5
1 0
.95
–
Bris
tlec
one
Inc.
$ 1
32.9
1 (
99.1
7) 8
9.57
8
9.57
–
170
.28
12.
85
0.3
1 1
2.54
–
Bris
tlec
one
Indi
a Li
mit
ed 1
9.05
2
9.12
9
3.85
9
3.85
0
.01
124
.86
5.7
7 3
.01
2.7
6 –
Bris
tlec
one
Inte
rnat
iona
l AG
< 0
.57
3.9
1 1
3.55
1
3.55
–
17.
11
4.0
4 0
.37
3.6
7 –
Bris
tlec
one
Lim
ited
$ 0
.12
38.
46
178
.14
178
.14
– –
(8.
94)
– (
8.94
) –
Bris
tlec
one
(Sin
gapo
re)
Pte.
Lim
ited
++
7.3
0 (
6.93
) 2
.33
2.3
3 –
1.1
4 –
– –
–
Bris
tlec
one
UK
Lim
ited
£ 1
9.35
(
16.1
8) 3
.83
3.8
3 –
0.6
5 (
0.52
) –
(0.
52)
–
Cres
t G
eart
ech
Priv
ate
Lim
ited
0.6
0 2
.03
2.8
2 2
.82
– 1
.02
(0.
08)
0.0
3 (
0.11
) –
Def
ence
Lan
d Sy
stem
s In
dia
Priv
ate
Lim
ited
85.
00
(61
.21)
64.
76
64.
76
– 1
8.16
(
38.7
6) –
(38
.76)
–
Div
ine
Her
itag
e H
otel
s Pr
ivat
e Li
mit
ed 0
.70
(2.
66)
12.
95
12.
95
– 0
.79
(2.
01)
– (
2.01
) –
EPC
Indu
stri
e Li
mit
ed 2
7.63
7
7.93
1
44.4
2 1
44.4
2 0
.01
164
.27
5.3
4 –
5.3
4 –
Falk
enro
th U
mfo
rmte
chni
k G
mbH
7
.12
9.1
9 9
2.92
9
2.92
–
243
.99
(11
.53)
0.1
8 (
11.7
1) –
GA
200
Pty.
Lim
ited
^
*
– *
*
–
– –
– –
–
GA
8 A
irva
n Pt
y. L
imit
ed
^ *
–
*
*
– –
– –
– –
Gab
les
Prom
oter
s Pr
ivat
e Li
mit
ed 1
3.20
(
0.01
) 1
3.20
1
3.20
–
– (
*) –
(*)
–
Ges
enks
chm
iede
Sch
neid
er G
mbH
8
5.27
5
1.01
3
32.8
5 3
32.8
5 –
670
.10
(7.
89)
0.3
3 (
8.22
) –
Gip
p A
ero
Inve
stm
ents
Pty
. Lim
ited
^ 3
9.79
1
26.3
1 1
66.3
0 1
66.3
0 –
– (
0.04
) –
(0.
04)
–
Gip
psae
ro P
ty. L
imit
ed ^
*
67.
54
165
.34
165
.34
– 5
8.23
(
39.5
9) –
(39
.59)
–
Her
itag
e Bi
rd (
M)
Sdn.
Bhd
. **
0.5
3 (
1.01
) 8
.39
8.3
9 –
1.4
4 (
0.25
) –
(0.
25)
–
Hol
iday
on
Hill
s Re
sort
s Pr
ivat
e Li
mit
ed 1
.00
(5.
97)
25.
57
25.
57
– 1
.58
(1.
50)
– (
1.50
) –
Indu
stri
al T
owns
hip
(Mah
aras
htra
) Li
mit
ed 5
.00
(0.
13)
15.
62
15.
62
– *
(
0.01
) –
(0.
01)
–
Infi
nity
Hos
pita
lity
Gro
up C
ompa
ny L
imit
ed #
28.
05
(16
.65)
38.
24
38.
24
– 2
.86
(1.
26)
– (
1.26
) –
JECO
-Jel
lingh
aus
Gm
bH
35.
64
8.6
2 9
2.30
9
2.30
–
232
.06
(7.
99)
0.2
3 (
8.22
) –
Jian
gxi M
ahin
dra
Yued
a Tr
acto
r Co
mpa
ny L
imit
ed >
166
.65
(17
2.38
) 8
3.12
8
3.12
–
16.
99
(14
.84)
– (
14.8
4) –
Kno
wle
dge
Tow
nshi
p Li
mit
ed 2
1.00
(
0.44
) 4
4.41
4
4.41
–
– (
0.02
) –
(0.
02)
–
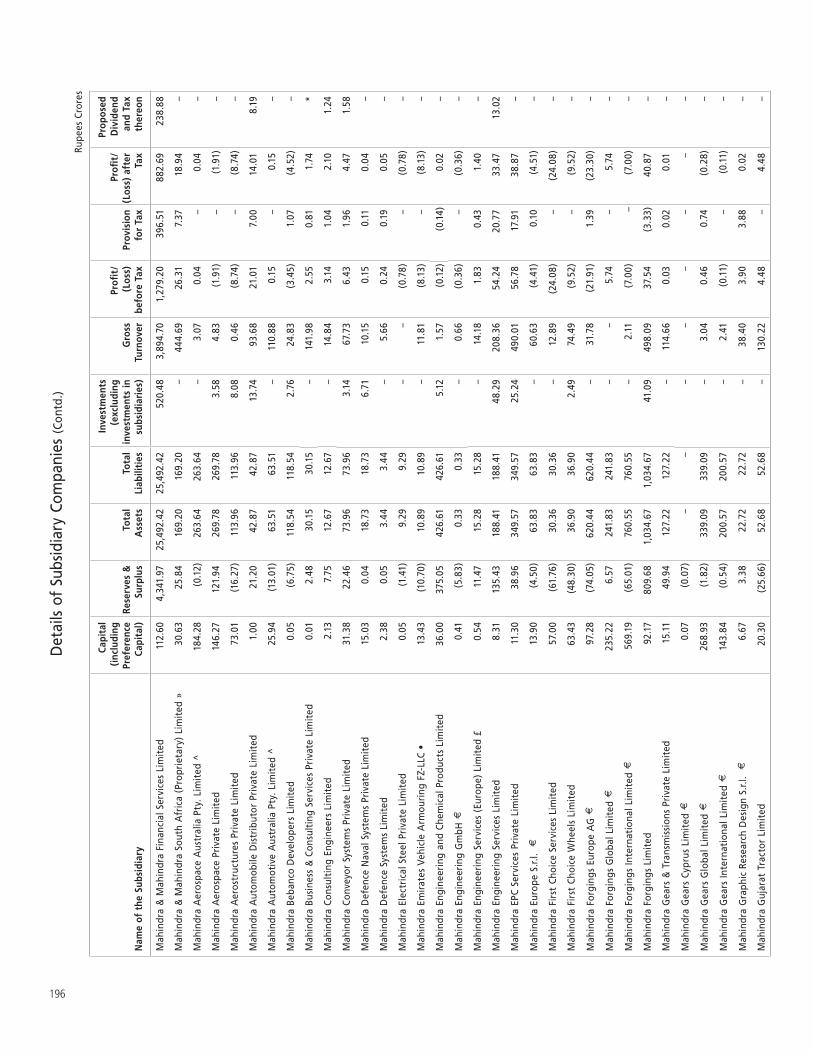
196
Det
ails
of
Subs
idia
ry C
ompa
nies
(Con
td.)
Rup
ees
Cror
es
Nam
e of
the
Sub
sidi
ary
Capi
tal
(incl
udin
g Pr
efer
ence
Ca
pita
l)Re
serv
es &
Su
rplu
sTo
tal
Ass
ets
Tota
l Li
abili
ties
Inve
stm
ents
(e
xclu
ding
in
vest
men
ts in
su
bsid
iari
es)
Gro
ss
Turn
over
Profi
t/(L
oss)
be
fore
Tax
Prov
isio
n fo
r Ta
x
Profi
t/(L
oss)
aft
er
Tax
Prop
osed
D
ivid
end
and
Tax
ther
eon
Mah
indr
a &
Mah
indr
a Fi
nanc
ial S
ervi
ces
Lim
ited
112
.60
4,3
41.9
7 2
5,49
2.42
2
5,49
2.42
5
20.4
8 3
,894
.70
1,2
79.2
0 3
96.5
1 8
82.6
9 2
38.8
8
Mah
indr
a &
Mah
indr
a So
uth
Afr
ica
(Pro
prie
tary
) Li
mit
ed »
30.
63
25.
84
169
.20
169
.20
– 4
44.6
9 2
6.31
7
.37
18.
94
–
Mah
indr
a A
eros
pace
Aus
tral
ia P
ty. L
imit
ed ^
184
.28
(0.
12)
263
.64
263
.64
– 3
.07
0.0
4 –
0.0
4 –
Mah
indr
a A
eros
pace
Pri
vate
Lim
ited
146
.27
121
.94
269
.78
269
.78
3.5
8 4
.83
(1.
91)
– (
1.91
) –
Mah
indr
a A
eros
truc
ture
s Pr
ivat
e Li
mit
ed 7
3.01
(
16.2
7) 1
13.9
6 1
13.9
6 8
.08
0.4
6 (
8.74
) –
(8.
74)
–
Mah
indr
a A
utom
obile
Dis
trib
utor
Pri
vate
Lim
ited
1.0
0 2
1.20
4
2.87
4
2.87
1
3.74
9
3.68
2
1.01
7
.00
14.
01
8.1
9
Mah
indr
a A
utom
otiv
e A
ustr
alia
Pty
. Lim
ited
^ 2
5.94
(
13.0
1) 6
3.51
6
3.51
–
110
.88
0.1
5 –
0.1
5 –
Mah
indr
a Be
banc
o D
evel
oper
s Li
mit
ed 0
.05
(6.
75)
118
.54
118
.54
2.7
6 2
4.83
(
3.45
) 1
.07
(4.
52)
–
Mah
indr
a Bu
sine
ss &
Con
sult
ing
Serv
ices
Pri
vate
Lim
ited
0.0
1 2
.48
30.
15
30.
15
– 1
41.9
8 2
.55
0.8
1 1
.74
*
Mah
indr
a Co
nsul
ting
Eng
inee
rs L
imit
ed 2
.13
7.7
5 1
2.67
1
2.67
–
14.
84
3.1
4 1
.04
2.1
0 1
.24
Mah
indr
a Co
nvey
or S
yste
ms
Priv
ate
Lim
ited
31.
38
22.
46
73.
96
73.
96
3.1
4 6
7.73
6
.43
1.9
6 4
.47
1.5
8
Mah
indr
a D
efen
ce N
aval
Sys
tem
s Pr
ivat
e Li
mit
ed 1
5.03
0
.04
18.
73
18.
73
6.7
1 1
0.15
0
.15
0.1
1 0
.04
–
Mah
indr
a D
efen
ce S
yste
ms
Lim
ited
2.3
8 0
.05
3.4
4 3
.44
– 5
.66
0.2
4 0
.19
0.0
5 –
Mah
indr
a El
ectr
ical
Ste
el P
riva
te L
imit
ed 0
.05
(1.
41)
9.2
9 9
.29
– –
(0.
78)
– (
0.78
) –
13.
43
(10
.70)
10.
89
10.
89
– 1
1.81
(
8.13
) –
(8.
13)
–
Mah
indr
a En
gine
erin
g an
d Ch
emic
al P
rodu
cts
Lim
ited
36.
00
375
.05
426
.61
426
.61
5.1
2 1
.57
(0.
12)
(0.
14)
0.0
2 –
Mah
indr
a En
gine
erin
g G
mbH
0
.41
(5.
83)
0.3
3 0
.33
– 0
.66
(0.
36)
– (
0.36
) –
Mah
indr
a En
gine
erin
g Se
rvic
es (
Euro
pe)
Lim
ited
£ 0
.54
11.
47
15.
28
15.
28
– 1
4.18
1
.83
0.4
3 1
.40
–
Mah
indr
a En
gine
erin
g Se
rvic
es L
imit
ed 8
.31
135
.43
188
.41
188
.41
48.
29
208
.36
54.
24
20.
77
33.
47
13.
02
Mah
indr
a EP
C Se
rvic
es P
riva
te L
imit
ed 1
1.30
3
8.96
3
49.5
7 3
49.5
7 2
5.24
4
90.0
1 5
6.78
1
7.91
3
8.87
–
Mah
indr
a Eu
rope
S.r.
l.
13.
90
(4.
50)
63.
83
63.
83
– 6
0.63
(
4.41
) 0
.10
(4.
51)
–
Mah
indr
a Fi
rst
Choi
ce S
ervi
ces
Lim
ited
57.
00
(61
.76)
30.
36
30.
36
– 1
2.89
(
24.0
8) –
(24
.08)
–
Mah
indr
a Fi
rst
Choi
ce W
heel
s Li
mit
ed 6
3.43
(
48.3
0) 3
6.90
3
6.90
2
.49
74.
49
(9.
52)
– (
9.52
) –
Mah
indr
a Fo
rgin
gs E
urop
e A
G
97.
28
(74
.05)
620
.44
620
.44
– 3
1.78
(
21.9
1)1.
39 (
23.3
0) –
Mah
indr
a Fo
rgin
gs G
loba
l Lim
ited
2
35.2
2 6
.57
241
.83
241
.83
– –
5.7
4 –
5.7
4 –
Mah
indr
a Fo
rgin
gs In
tern
atio
nal L
imit
ed
569
.19
(65
.01)
760
.55
760
.55
– 2
.11
(7.
00)
– (
7.00
) –
Mah
indr
a Fo
rgin
gs L
imit
ed 9
2.17
8
09.6
8 1
,034
.67
1,0
34.6
7 4
1.09
4
98.0
9 3
7.54
(
3.33
) 4
0.87
–
Mah
indr
a G
ears
& T
rans
mis
sion
s Pr
ivat
e Li
mit
ed 1
5.11
4
9.94
1
27.2
2 1
27.2
2 –
114
.66
0.0
3 0
.02
0.0
1 –
Mah
indr
a G
ears
Cyp
rus
Lim
ited
0
.07
(0.
07)
– –
– –
– –
– –
Mah
indr
a G
ears
Glo
bal L
imit
ed
268
.93
(1.
82)
339
.09
339
.09
– 3
.04
0.4
6 0
.74
(0.
28)
–
Mah
indr
a G
ears
Inte
rnat
iona
l Lim
ited
1
43.8
4 (
0.54
) 2
00.5
7 2
00.5
7 –
2.4
1 (
0.11
) –
(0.
11)
–
Mah
indr
a G
raph
ic R
esea
rch
Des
ign
S.r.l
. 6
.67
3.3
8 2
2.72
2
2.72
–
38.
40
3.9
0 3
.88
0.0
2 –
Mah
indr
a G
ujar
at T
ract
or L
imit
ed 2
0.30
(
25.6
6) 5
2.68
5
2.68
–
130
.22
4.4
8 –
4.4
8 –
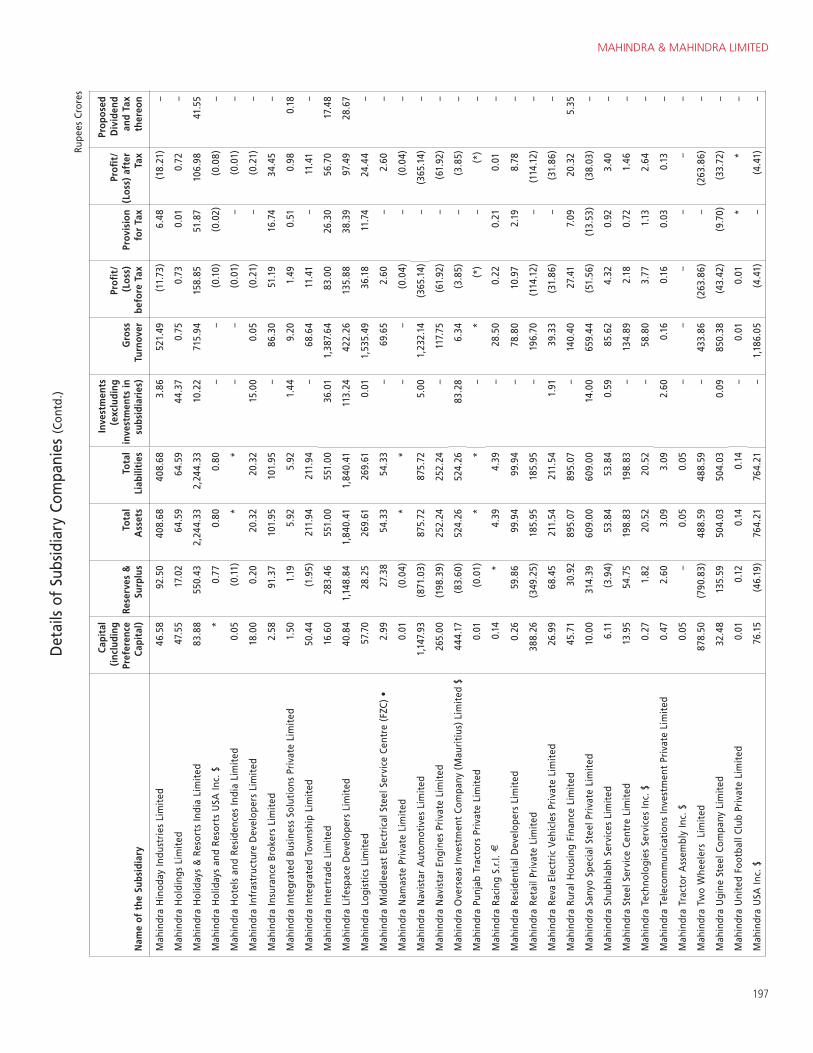
MAHINDRA & MAHINDRA LIMITED
197
Det
ails
of
Subs
idia
ry C
ompa
nies
(Con
td.)
Rup
ees
Cror
es
Nam
e of
the
Sub
sidi
ary
Capi
tal
(incl
udin
g Pr
efer
ence
Ca
pita
l)Re
serv
es &
Su
rplu
sTo
tal
Ass
ets
Tota
l Li
abili
ties
Inve
stm
ents
(e
xclu
ding
in
vest
men
ts in
su
bsid
iari
es)
Gro
ss
Turn
over
Profi
t/(L
oss)
be
fore
Tax
Prov
isio
n fo
r Ta
x
Profi
t/(L
oss)
aft
er
Tax
Prop
osed
D
ivid
end
and
Tax
ther
eon
Mah
indr
a H
inod
ay In
dust
ries
Lim
ited
46.
58
92.
50
408
.68
408
.68
3.8
6 5
21.4
9 (
11.7
3) 6
.48
(18
.21)
–
Mah
indr
a H
oldi
ngs
Lim
ited
47.
55
17.
02
64.
59
64.
59
44.
37
0.7
5 0
.73
0.0
1 0
.72
–
Mah
indr
a H
olid
ays
& R
esor
ts In
dia
Lim
ited
83.
88
550
.43
2,2
44.3
3 2
,244
.33
10.
22
715
.94
158
.85
51.
87
106
.98
41.
55
Mah
indr
a H
olid
ays
and
Reso
rts
USA
Inc.
$ *
0
.77
0.8
0 0
.80
– –
(0.
10)
(0.
02)
(0.
08)
–
Mah
indr
a H
otel
s an
d Re
side
nces
Indi
a Li
mit
ed 0
.05
(0.
11)
*
*
– –
(0.
01)
– (
0.01
) –
Mah
indr
a In
fras
truc
ture
Dev
elop
ers
Lim
ited
18.
00
0.2
0 2
0.32
2
0.32
1
5.00
0
.05
(0.
21)
– (
0.21
) –
Mah
indr
a In
sura
nce
Brok
ers
Lim
ited
2.5
8 9
1.37
1
01.9
5 1
01.9
5 –
86.
30
51.
19
16.
74
34.
45
–
Mah
indr
a In
tegr
ated
Bus
ines
s So
luti
ons
Priv
ate
Lim
ited
1.5
0 1
.19
5.9
2 5
.92
1.4
4 9
.20
1.4
9 0
.51
0.9
8 0
.18
Mah
indr
a In
tegr
ated
Tow
nshi
p Li
mit
ed 5
0.44
(
1.95
) 2
11.9
4 2
11.9
4 –
68.
64
11.
41
– 1
1.41
–
Mah
indr
a In
tert
rade
Lim
ited
16.
60
283
.46
551
.00
551
.00
36.
01
1,3
87.6
4 8
3.00
2
6.30
5
6.70
1
7.48
Mah
indr
a Li
fesp
ace
Dev
elop
ers
Lim
ited
40.
84
1,1
48.8
4 1
,840
.41
1,8
40.4
1 1
13.2
4 4
22.2
6 1
35.8
8 3
8.39
9
7.49
2
8.67
Mah
indr
a Lo
gist
ics
Lim
ited
57.
70
28.
25
269
.61
269
.61
0.0
1 1
,535
.49
36.
18
11.
74
24.
44
–
2.9
9 2
7.38
5
4.33
5
4.33
–
69.
65
2.6
0 –
2.6
0 –
Mah
indr
a N
amas
te P
riva
te L
imit
ed 0
.01
(0.
04)
*
*
– –
(0.
04)
– (
0.04
) –
Mah
indr
a N
avis
tar
Aut
omot
ives
Lim
ited
1,1
47.9
3 (
871.
03)
875
.72
875
.72
5.0
0 1
,232
.14
(36
5.14
) –
(36
5.14
) –
Mah
indr
a N
avis
tar
Engi
nes
Priv
ate
Lim
ited
265
.00
(19
8.39
) 2
52.2
4 2
52.2
4 –
117
.75
(61
.92)
– (
61.9
2) –
Mah
indr
a O
vers
eas
Inve
stm
ent
Com
pany
(M
auri
tius
) Lim
ited
$ 4
44.1
7 (
83.6
0) 5
24.2
6 5
24.2
6 8
3.28
6
.34
(3.
85)
– (
3.85
) –
Mah
indr
a Pu
njab
Tra
ctor
s Pr
ivat
e Li
mit
ed 0
.01
(0.
01)
*
*
– *
(
*)
– (
*) –
Mah
indr
a Ra
cing
S.r.
l. 0
.14
*
4.3
9 4
.39
– 2
8.50
0
.22
0.2
1 0
.01
–
Mah
indr
a Re
side
ntia
l Dev
elop
ers
Lim
ited
0.2
6 5
9.86
9
9.94
9
9.94
–
78.
80
10.
97
2.1
9 8
.78
–
Mah
indr
a Re
tail
Priv
ate
Lim
ited
388
.26
(34
9.25
) 1
85.9
5 1
85.9
5 –
196
.70
(11
4.12
) –
(11
4.12
) –
Mah
indr
a Re
va E
lect
ric
Vehi
cles
Pri
vate
Lim
ited
26.
99
68.
45
211
.54
211
.54
1.9
1 3
9.33
(
31.8
6) –
(31
.86)
–
Mah
indr
a Ru
ral H
ousi
ng F
inan
ce L
imit
ed 4
5.71
3
0.92
8
95.0
7 8
95.0
7 –
140
.40
27.
41
7.0
9 2
0.32
5
.35
Mah
indr
a Sa
nyo
Spec
ial S
teel
Pri
vate
Lim
ited
10.
00
314
.39
609
.00
609
.00
14.
00
659
.44
(51
.56)
(13
.53)
(38
.03)
–
Mah
indr
a Sh
ubhl
abh
Serv
ices
Lim
ited
6.1
1 (
3.94
) 5
3.84
5
3.84
0
.59
85.
62
4.3
2 0
.92
3.4
0 –
Mah
indr
a St
eel S
ervi
ce C
entr
e Li
mit
ed 1
3.95
5
4.75
1
98.8
3 1
98.8
3 –
134
.89
2.1
8 0
.72
1.4
6 –
Mah
indr
a Te
chno
logi
es S
ervi
ces
Inc.
$ 0
.27
1.8
2 2
0.52
2
0.52
–
58.
80
3.7
7 1
.13
2.6
4 –
Mah
indr
a Te
leco
mm
unic
atio
ns In
vest
men
t Pr
ivat
e Li
mit
ed 0
.47
2.6
0 3
.09
3.0
9 2
.60
0.1
6 0
.16
0.0
3 0
.13
–
Mah
indr
a Tr
acto
r A
ssem
bly
Inc.
$ 0
.05
– 0
.05
0.0
5 –
– –
– –
–
Mah
indr
a Tw
o W
heel
ers
Lim
ited
878
.50
(79
0.83
) 4
88.5
9 4
88.5
9 –
433
.86
(26
3.86
) –
(26
3.86
) –
Mah
indr
a U
gine
Ste
el C
ompa
ny L
imit
ed 3
2.48
1
35.5
9 5
04.0
3 5
04.0
3 0
.09
850
.38
(43
.42)
(9.
70)
(33
.72)
–
Mah
indr
a U
nite
d Fo
otba
ll Cl
ub P
riva
te L
imit
ed 0
.01
0.1
2 0
.14
0.1
4 –
0.0
1 0
.01
*
*
–
Mah
indr
a U
SA In
c. $
76.
15
(46
.19)
764
.21
764
.21
– 1
,186
.05
(4.
41)
– (
4.41
) –
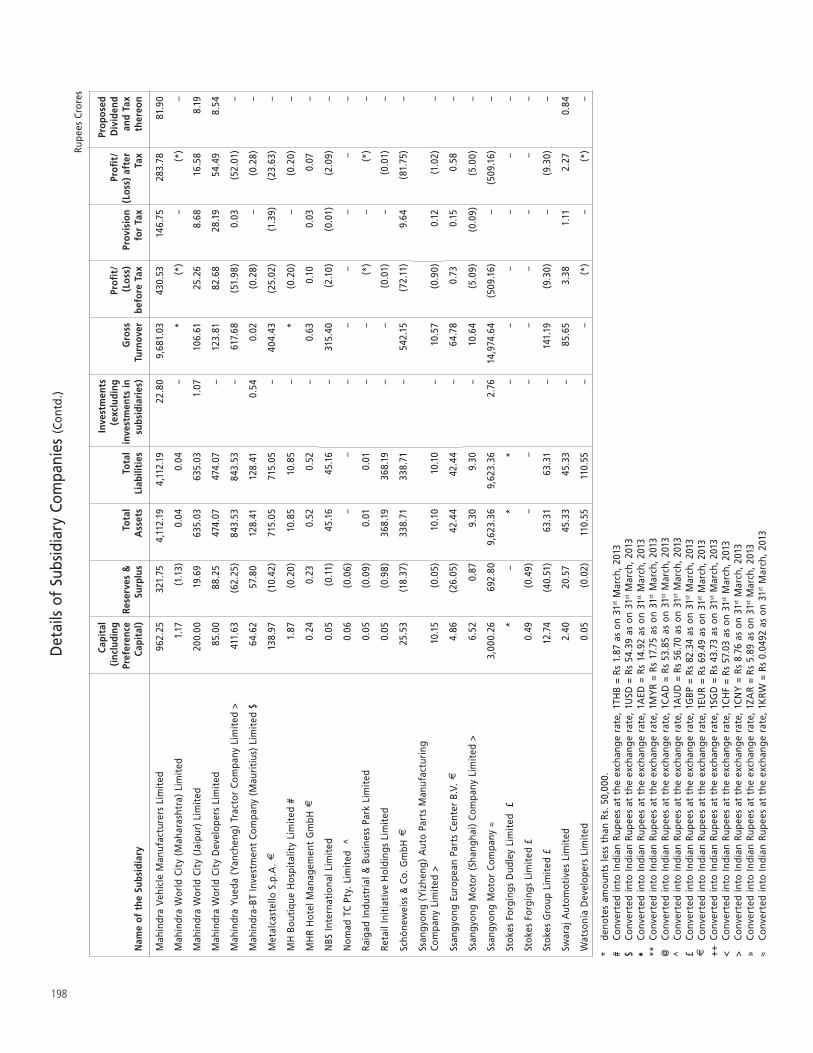
198
Det
ails
of
Subs
idia
ry C
ompa
nies
(Con
td.)
Rup
ees
Cror
es
Nam
e of
the
Sub
sidi
ary
Capi
tal
(incl
udin
g Pr
efer
ence
Ca
pita
l)Re
serv
es &
Su
rplu
sTo
tal
Ass
ets
Tota
l Li
abili
ties
Inve
stm
ents
(e
xclu
ding
in
vest
men
ts in
su
bsid
iari
es)
Gro
ss
Turn
over
Profi
t/(L
oss)
be
fore
Tax
Prov
isio
n fo
r Ta
x
Profi
t/(L
oss)
aft
er
Tax
Prop
osed
D
ivid
end
and
Tax
ther
eon
Mah
indr
a Ve
hicl
e M
anuf
actu
rers
Lim
ited
962
.25
321
.75
4,1
12.1
9 4
,112
.19
22.
80
9,6
81.0
3 4
30.5
3 1
46.7
5 2
83.7
8 8
1.90
Mah
indr
a W
orld
Cit
y (M
ahar
asht
ra)
Lim
ited
1.1
7 (
1.13
) 0
.04
0.0
4 –
*
(*)
– (
*)
–
Mah
indr
a W
orld
Cit
y (J
aipu
r) L
imit
ed 2
00.0
0 1
9.69
6
35.0
3 6
35.0
3 1
.07
106
.61
25.
26
8.6
8 1
6.58
8
.19
Mah
indr
a W
orld
Cit
y D
evel
oper
s Li
mit
ed 8
5.00
8
8.25
4
74.0
7 4
74.0
7 –
123
.81
82.
68
28.
19
54.
49
8.5
4
Mah
indr
a Yu
eda
(Yan
chen
g) T
ract
or C
ompa
ny L
imit
ed >
411
.63
(62
.25)
843
.53
843
.53
– 6
17.6
8 (
51.9
8) 0
.03
(52
.01)
–
Mah
indr
a-BT
Inve
stm
ent
Com
pany
(M
auri
tius
) Li
mit
ed $
64.
62
57.
80
128
.41
128
.41
0.5
4 0
.02
(0.
28)
– (
0.28
) –
Met
alca
stel
lo S
.p.A
. 1
38.9
7 (
10.4
2) 7
15.0
5 7
15.0
5 –
404
.43
(25
.02)
(1.
39)
(23
.63)
–
MH
Bou
tiqu
e H
ospi
talit
y Li
mit
ed #
1.8
7 (
0.20
) 1
0.85
1
0.85
–
*
(0.
20)
– (
0.20
) –
MH
R H
otel
Man
agem
ent
Gm
bH
0.2
4 0
.23
0.5
2 0
.52
– 0
.63
0.1
0 0
.03
0.0
7 –
NBS
Inte
rnat
iona
l Lim
ited
0.0
5 (
0.11
) 4
5.16
4
5.16
–
315
.40
(2.
10)
(0.
01)
(2.
09)
–
Nom
ad T
C Pt
y. L
imit
ed
^ 0
.06
(0.
06)
– –
– –
– –
– –
Raig
ad In
dust
rial
& B
usin
ess
Park
Lim
ited
0.0
5 (
0.09
) 0
.01
0.0
1 –
– (
*) –
(*)
–
Reta
il In
itia
tive
Hol
ding
s Li
mit
ed 0
.05
(0.
98)
368
.19
368
.19
– –
(0.
01)
– (
0.01
) –
Schö
new
eiss
& C
o. G
mbH
2
5.53
(
18.3
7) 3
38.7
1 3
38.7
1 –
542
.15
(72
.11)
9.6
4 (
81.7
5) –
Ssan
gyon
g (Y
izhe
ng)
Aut
o Pa
rts
Man
ufac
turi
ng
Com
pany
Lim
ited
> 1
0.15
(
0.05
) 1
0.10
1
0.10
–
10.
57
(0.
90)
0.1
2 (
1.02
) –
Ssan
gyon
g Eu
rope
an P
arts
Cen
ter
B.V.
4
.86
(26
.05)
42.
44
42.
44
– 6
4.78
0
.73
0.1
5 0
.58
–
Ssan
gyon
g M
otor
(Sh
angh
ai)
Com
pany
Lim
ited
> 6
.52
0.8
7 9
.30
9.3
0 –
10.
64
(5.
09)
(0.
09)
(5.
00)
–
Ssan
gyon
g M
otor
Com
pany
3
,000
.26
692
.80
9,6
23.3
6 9
,623
.36
2.7
6 1
4,97
4.64
(
509.
16)
– (
509.
16)
–
Stok
es F
orgi
ngs
Dud
ley
Lim
ited
£
*
– *
*
–
– –
– –
–
Stok
es F
orgi
ngs
Lim
ited
£ 0
.49
(0.
49)
– –
– –
– –
– –
Stok
es G
roup
Lim
ited
£ 1
2.74
(
40.5
1) 6
3.31
6
3.31
–
141
.19
(9.
30)
– (
9.30
) –
Swar
aj A
utom
otiv
es L
imit
ed 2
.40
20.
57
45.
33
45.
33
– 8
5.65
3
.38
1.1
1 2
.27
0.8
4
Wat
soni
a D
evel
oper
s Li
mit
ed 0
.05
(0.
02)
110
.55
110
.55
– –
(*)
– (
*)
–
* de
note
s am
ount
s le
ss t
han
Rs. 5
0,00
0.#
Conv
erte
d in
to In
dian
Rup
ees
at t
he e
xcha
nge
rate
, 1TH
B =
Rs 1
.87
as o
n 31
st M
arch
, 201
3
$ Co
nver
ted
into
Indi
an R
upee
s at
the
exc
hang
e ra
te, 1
USD
= R
s 54
.39
as o
n 31
st M
arch
, 201
3
st M
arch
, 201
3
**
Conv
erte
d in
to In
dian
Rup
ees
at t
he e
xcha
nge
rate
, 1M
YR
= Rs
17.
75 a
s on
31st
Mar
ch, 2
013
@
Co
nver
ted
into
Indi
an R
upee
s at
the
exc
hang
e ra
te, 1
CA
D =
Rs
53.8
5 as
on
31st M
arch
, 201
3
^ Co
nver
ted
into
Indi
an R
upee
s at
the
exc
hang
e ra
te, 1
AU
D =
Rs
56.7
0 as
on
31st M
arch
, 201
3
£ Co
nver
ted
into
Indi
an R
upee
s at
the
exc
hang
e ra
te, 1
GBP
= R
s 82
.34
as o
n 31
st M
arch
, 201
3
Co
nver
ted
into
Indi
an R
upee
s at
the
exc
hang
e ra
te, 1
EUR
= Rs
69.
49 a
s on
31st
Mar
ch, 2
013
++
Con
vert
ed in
to In
dian
Rup
ees
at t
he e
xcha
nge
rate
, 1SG
D =
Rs
43.7
3 as
on
31st M
arch
, 201
3
< Co
nver
ted
into
Indi
an R
upee
s at
the
exc
hang
e ra
te, 1
CHF
= Rs
57.
03 a
s on
31st
Mar
ch, 2
013
>
Conv
erte
d in
to In
dian
Rup
ees
at t
he e
xcha
nge
rate
, 1CN
Y =
Rs
8.76
as
on 3
1st M
arch
, 201
3
» Co
nver
ted
into
Indi
an R
upee
s at
the
exc
hang
e ra
te, 1
ZAR
= Rs
5.8
9 as
on
31st M
arch
, 201
3
Co
nver
ted
into
Indi
an R
upee
s at
the
exc
hang
e ra
te, 1
KRW
= R
s 0.
0492
as
on 3
1st M
arch
, 201
3

MAHINDRA & MAHINDRA LIMITED
199
Notes

200
Notes

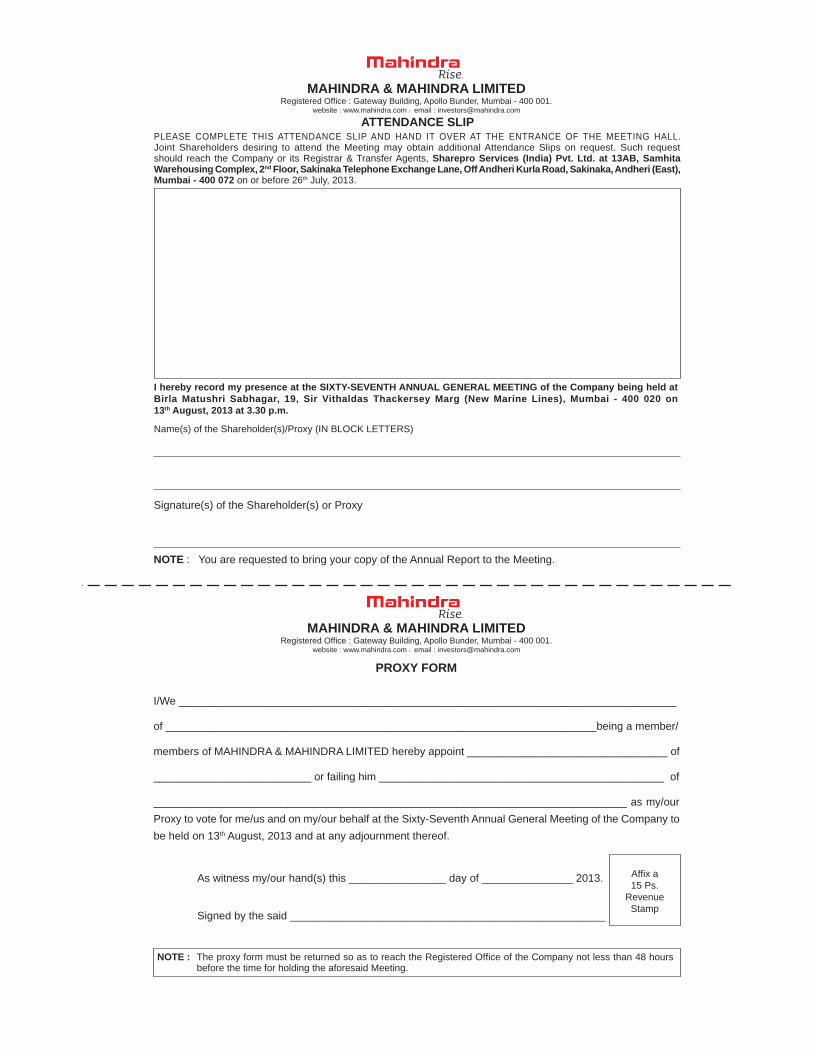
MAHINDRA & MAHINDRA LIMITEDRegistered Of ce : Gateway Building, Apollo Bunder, Mumbai - 400 001.
website : www.mahindra.com l email : [email protected]
PLEASE COMPLETE THIS ATTENDANCE SLIP AND HAND IT OVER AT THE ENTRANCE OF THE MEETING HALL. Joint Shareholders desiring to attend the Meeting may obtain additional Attendance Slips on request. Such request should reach the Company or its Registrar & Transfer Agents, Sharepro Services (India) Pvt. Ltd. at 13AB, Samhita Warehousing Complex, 2nd Floor, Sakinaka Telephone Exchange Lane, Off Andheri Kurla Road, Sakinaka, Andheri (East), Mumbai - 400 072 on or before 26th July, 2013.
I hereby record my presence at the SIXTY-SEVENTH ANNUAL GENERAL MEETING of the Company being held at Birla Matushri Sabhagar, 19, Sir Vithaldas Thackersey Marg (New Marine Lines), Mumbai - 400 020 on 13th August, 2013 at 3.30 p.m.
Name(s) of the Shareholder(s)/Proxy (IN BLOCK LETTERS)
Signature(s) of the Shareholder(s) or Proxy
NOTE : You are requested to bring your copy of the Annual Report to the Meeting.
I/We __________________________________________________________________________________
of _______________________________________________________________________being a member/
members of MAHINDRA & MAHINDRA LIMITED hereby appoint _________________________________ of
__________________________ or failing him _______________________________________________ of
______________________________________________________________________________ as my/our
Proxy to vote for me/us and on my/our behalf at the Sixty-Seventh Annual General Meeting of the Company to
be held on 13th August, 2013 and at any adjournment thereof.
As witness my/our hand(s) this ________________ day of _______________ 2013.
Signed by the said ____________________________________________________
Af x a15 Ps.
RevenueStamp
NOTE : The proxy form must be returned so as to reach the Registered Of ce of the Company not less than 48 hours before the time for holding the aforesaid Meeting.
ATTENDANCE SLIP
PROXY FORM
MAHINDRA & MAHINDRA LIMITEDRegistered Of ce : Gateway Building, Apollo Bunder, Mumbai - 400 001.
website : www.mahindra.com l email : [email protected]