Los Form CB - Edl · SACS Financial Reporting Software - 2016.1.0 File: cb (Rev 04/12/2016) ......
186
Manhattan Beach Unified Los Angeles County July 1 Budget FINANCIAL REPORTS 2016-17 Budget School District Certification 19 75333 0000000 Form CB X ANNUAL BUDGET REPORT: July 1, 201ô Budget Adoption lnsert "X" in applicable boxes This budget was developed using the state-adopted Criteria and Standards. lt includes the expenditures necessary to implement the Local Control and Accountability Plan (LCAP) or annual update to the LCAP that will be effective for the budget year. The budget was filed and adopted subsequent to a public hearing by the governing board of the schooldistrict pursuantto Education Code sections 33129, 42127,52060, 52061, and 52062. lf the budget includes a combined assigned and unassigned ending fund balance above the minimum recommended reserve for economic uncertainties, at its public hearing, the school district complied with the requirements of subparagraphs (B) and (C) of paragraph (2) of subdivision (a) of Education Code Section 42127. Budget available for inspection at: Place: Manhattan Beach USD Education Center Date: June 10 2016 Adoption Date: Jun 2016 Signed ClerUSecretary Goveming (Original signature Public Hearing: Place: Manhattan Beach USD Date: June 14,2016 Time: 06:30 PM X Contact person for additional information on the budget reports Name: Dawnalyn Murakawa-Leopard Title: Deputy Superintendent, Business Services Telephone: 310-318-7345 Ext 5943 E-mail: dmurakawa-leopgrd@rnþggd.org Griteria and Standards Review Summary The following summary is automatically completed based on data provided in the Criteria and Standards Review (Form 01CS). Criteria and standards that are "Not Met," and supplemental information and additional fiscal indicators that are "Yes," may indicate areas of potential concern for fiscal solvency purposes and should be carefully reviewed. CRITERIAAND STANDARDS Met Not Met 1 Average Daily Attendance Budgeted (funded) ADA has not been overestimated by more than the standard for the prior fiscal year, or two or more of the previous three fiscal years. X California Dept of Education SACS Financial Reporting Software - 2016.1.0 File: cb (Rev 041'1?2016) Page 1 of4 Printed: 611012016 12:09 PM
Transcript of Los Form CB - Edl · SACS Financial Reporting Software - 2016.1.0 File: cb (Rev 04/12/2016) ......

Manhattan Beach UnifiedLos Angeles County
July 1 BudgetFINANCIAL REPORTS
2016-17 BudgetSchool District Certification
19 75333 0000000Form CB
X
ANNUAL BUDGET REPORT:July 1, 201ô Budget Adoption
lnsert "X" in applicable boxes
This budget was developed using the state-adopted Criteria and Standards. lt includes the expendituresnecessary to implement the Local Control and Accountability Plan (LCAP) or annual update to the LCAP thatwill be effective for the budget year. The budget was filed and adopted subsequent to a public hearing by thegoverning board of the schooldistrict pursuantto Education Code sections 33129, 42127,52060, 52061, and52062.
lf the budget includes a combined assigned and unassigned ending fund balance above the minimumrecommended reserve for economic uncertainties, at its public hearing, the school district complied withthe requirements of subparagraphs (B) and (C) of paragraph (2) of subdivision (a) of Education CodeSection 42127.
Budget available for inspection at:
Place: Manhattan Beach USD Education CenterDate: June 10 2016
Adoption Date: Jun 2016
SignedClerUSecretary Goveming
(Original signature
Public Hearing:
Place: Manhattan Beach USDDate: June 14,2016Time: 06:30 PM
X
Contact person for additional information on the budget reports
Name: Dawnalyn Murakawa-Leopard
Title: Deputy Superintendent, Business Services
Telephone: 310-318-7345 Ext 5943
E-mail: dmurakawa-leopgrd@rnþggd.org
Griteria and Standards Review Summary
The following summary is automatically completed based on data provided in the Criteria and Standards Review(Form 01CS). Criteria and standards that are "Not Met," and supplemental information and additional fiscalindicators that are "Yes," may indicate areas of potential concern for fiscal solvency purposes and should becarefully reviewed.
CRITERIAAND STANDARDS MetNotMet
1 Average Daily Attendance Budgeted (funded) ADA has not been overestimated by more than thestandard for the prior fiscal year, or two or more of the previous threefiscal years.
X
California Dept of EducationSACS Financial Reporting Software - 2016.1.0File: cb (Rev 041'1?2016) Page 1 of4 Printed: 611012016 12:09 PM
Manhattan Beach UnifiedLos Angeles County
July 1 BudgetFINANCIAL REPORTS
2016-17 BudgetSchool District Certification
19 75333 0000000Form CB
California Dept of EducationSACS Financial Reporting Software - 2016.1.0File: cb (Rev 04/12/2016) Page 2 of 4 Printed: 6/10/2016 4:22 PM
CRITERIA AND STANDARDS (continued) MetNotMet
2 Enrollment Enrollment has not been overestimated by more than the standardfor the prior fiscal year, or two or more of the previous three fiscalyears.
X
3 ADA to Enrollment Projected second period (P-2) ADA to enrollment ratio is consistent withhistorical ratios for the budget and two subsequent fiscal years. X
4 Local Control FundingFormula (LCFF)
Projected change in LCFF is within the standard for the budget andtwo subsequent fiscal years. X
5 Salaries and Benefits Projected ratios of total unrestricted salaries and benefits to totalunrestricted general fund expenditures are consistent with historicalratios for the budget and two subsequent fiscal years.
X
6a Other Revenues Projected operating revenues (e.g., federal, other state, and otherlocal) are within the standard for the budget and two subsequentfiscal years.
X
6b Other Expenditures Projected operating expenditures (e.g., books and supplies, andservices and other operating) are within the standard for the budgetand two subsequent fiscal years.
X
7 Ongoing and MajorMaintenance Account
If applicable, required contribution to the ongoing and majormaintenance account (i.e., restricted maintenance account) isincluded in the budget.
X
8 Deficit Spending Unrestricted deficit spending, if any, has not exceeded the standardfor two or more of the last three fiscal years. X
9 Fund Balance Unrestricted general fund beginning balance has not beenoverestimated by more than the standard for two or more of the lastthree fiscal years.
X
10 Reserves Projected available reserves (e.g., reserve for economicuncertainties, unassigned/unappropriated amounts) meet minimumrequirements for the budget and two subsequent fiscal years.
X
SUPPLEMENTAL INFORMATION No YesS1 Contingent Liabilities Are there known or contingent liabilities (e.g., financial or program
audits, litigation, state compliance reviews) that may impact thebudget?
X
S2 Using One-time Revenuesto Fund OngoingExpenditures
Are there ongoing general fund expenditures in excess of onepercent of the total general fund expenditures that are funded withone-time resources?
X
S3 Using Ongoing Revenuesto Fund One-timeExpenditures
Are there large non-recurring general fund expenditures that arefunded with ongoing general fund revenues? X
S4 Contingent Revenues Are any projected revenues for the budget or two subsequent fiscalyears contingent on reauthorization by the local government, speciallegislation, or other definitive act (e.g., parcel taxes, forest reserves)? X
S5 Contributions Have contributions from unrestricted to restricted resources, ortransfers to or from the general fund to cover operating deficits,changed by more than the standard for the budget or twosubsequent fiscal years?
X

Manhattan Beach UnifiedLos Angeles County
July 1 BudgetFINANCIAL REPORTS
2016-17 BudgetSchool District Certification
19 75333 0000000Form CB
California Dept of EducationSACS Financial Reporting Software - 2016.1.0File: cb (Rev 04/12/2016) Page 3 of 4 Printed: 6/10/2016 4:22 PM
SUPPLEMENTAL INFORMATION (continued) No YesS6 Long-term Commitments Does the district have long-term (multiyear) commitments or debt
agreements? X
• If yes, have annual payments for the budget or two subsequentfiscal years increased over prior year's (2015-16) annualpayment?
X
S7a Postemployment BenefitsOther than Pensions
Does the district provide postemployment benefits other thanpensions (OPEB)? X
• If yes, are they lifetime benefits? X• If yes, do benefits continue beyond age 65? X• If yes, are benefits funded by pay-as-you-go? X
S7b Other Self-insuranceBenefits
Does the district provide other self-insurance benefits (e.g., workers'compensation)? X
S8 Status of Labor Are salary and benefit negotiations still open for:Agreements • Certificated? (Section S8A, Line 1) X
• Classified? (Section S8B, Line 1) X• Management/supervisor/confidential? (Section S8C, Line 1) X
S9 Local Control andAccountability Plan (LCAP)
• Did or will the school district's governing board adopt an LCAP orapprove an update to the LCAP effective for the budget year? X
• Approval date for adoption of the LCAP or approval of an updateto the LCAP: Jun 14, 2016Jun 14, 2016
S10 LCAP Expenditures Does the school district's budget include the expenditures necessaryto implement the LCAP or annual update to the LCAP as describedin the Local Control and Accountability Plan and Annual UpdateTemplate, Section 3: Actions, Services, and Expenditures?
X
ADDITIONAL FISCAL INDICATORS No YesA1 Negative Cash Flow Do cash flow projections show that the district will end the budget
year with a negative cash balance in the general fund? X
A2 Independent PositionControl
Is personnel position control independent from the payroll system?X
A3 Declining Enrollment Is enrollment decreasing in both the prior fiscal year and budgetyear? X
A4 New Charter SchoolsImpacting DistrictEnrollment
Are any new charter schools operating in district boundaries that areimpacting the district's enrollment, either in the prior fiscal year orbudget year?
X
A5 Salary Increases ExceedCOLA
Has the district entered into a bargaining agreement where any of thebudget or subsequent fiscal years of the agreement would result insalary increases that are expected to exceed the projected statefunded cost-of-living adjustment?
X

Manhattan Beach UnifiedLos Angeles County
July 1 BudgetFINANCIAL REPORTS
2016-17 BudgetSchool District Certification
19 75333 0000000Form CB
California Dept of EducationSACS Financial Reporting Software - 2016.1.0File: cb (Rev 04/12/2016) Page 4 of 4 Printed: 6/10/2016 4:22 PM
ADDITIONAL FISCAL INDICATORS (continued) No YesA6 Uncapped Health Benefits Does the district provide uncapped (100% employer paid) health
benefits for current or retired employees? X
A7 Independent FinancialSystem
Is the district’s financial system independent from the county officesystem? X
A8 Fiscal Distress Reports Does the district have any reports that indicate fiscal distress? If yes,provide copies to the COE, pursuant to EC 42127.6(a). X
A9 Change of CBO orSuperintendent
Have there been personnel changes in the superintendent or chiefbusiness official (CBO) positions within the last 12 months? X
Manhattan Beach UnifiedLos Angeles County
July 1 Budget2016-17 Budget
Workers' Compensation Certification19 75333 0000000
Form CC
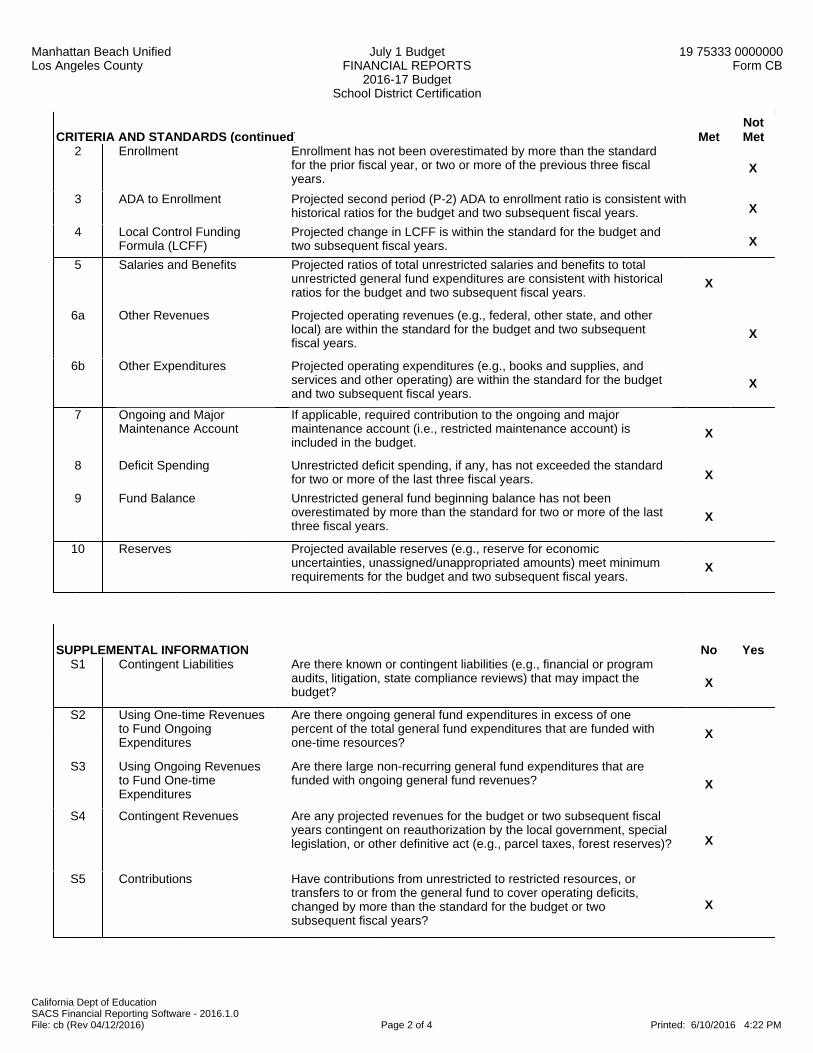
ANNUAL CERTI FICATION REGARDI NG SELF.INSURED WORKERS' COMPENSATION CLAIMS
Pursuant to EC Section 42141 , if a school district, either individually or as a member of a joint powers agency, is self-insured for workers' compensation claims, the superintendent of the school district annually shall provide information
to the governing board of the school district regarding the estímated accrued but unfunded cost of those claims. Thegoverníng board annually shall certiñ7 to the county superintendent of schools the amount of money, if any, that it has
decided to reserve in its budget for the cost of those claims.
To the County Superintendent of Schools:
( _ ) Our district is self-insured for workers' compensation claims as defined in Education CodeSection 42141(a):
Total liabilities actuarially determined:Less: Amount of total liabilities reserved in budget:Estimated accrued but unfunded liabilities:
$$$ 0.00
( X ) This school district is selÊinsured for workers' compensation claimsthrough a JPA, and offers the following information:We are insured throuqh ASCIP
(_)
Signed
for workers' compensation claims.
Date of Meeting: Jun 15 2016
(Original signature required
For additional information on this certification, please contact:
Name:
ïifle:
Dawnalyn Murakawa-Leopard
Deputy Superintendent
Telephone: 31 0-31 8-7345
E-mail: [email protected]
California Dept of EducationSACS FinancialReporting Sofh¡vare - 2016.1.0File: cc (Rev 0212212012) Page 1 of 1 Printed: 611012016 12:03 PM
Manhattan Beach UnifiedLos Angeles County
July 1 BudgetGeneral Fund
Multiyear ProjectionsUnrestricted
19 75333 0000000Form MYP
California Dept of EducationSACS Financial Reporting Software - 2016.1.0File: myp (Rev 03/30/2015) Page 1 Printed: 6/10/2016 4:23 PM
DescriptionObjectCodes
2016-17Budget
(Form 01)(A)
%Change
(Cols. C-A/A)(B)
2017-18Projection
(C)
%Change
(Cols. E-C/C)(D)
2018-19Projection
(E)
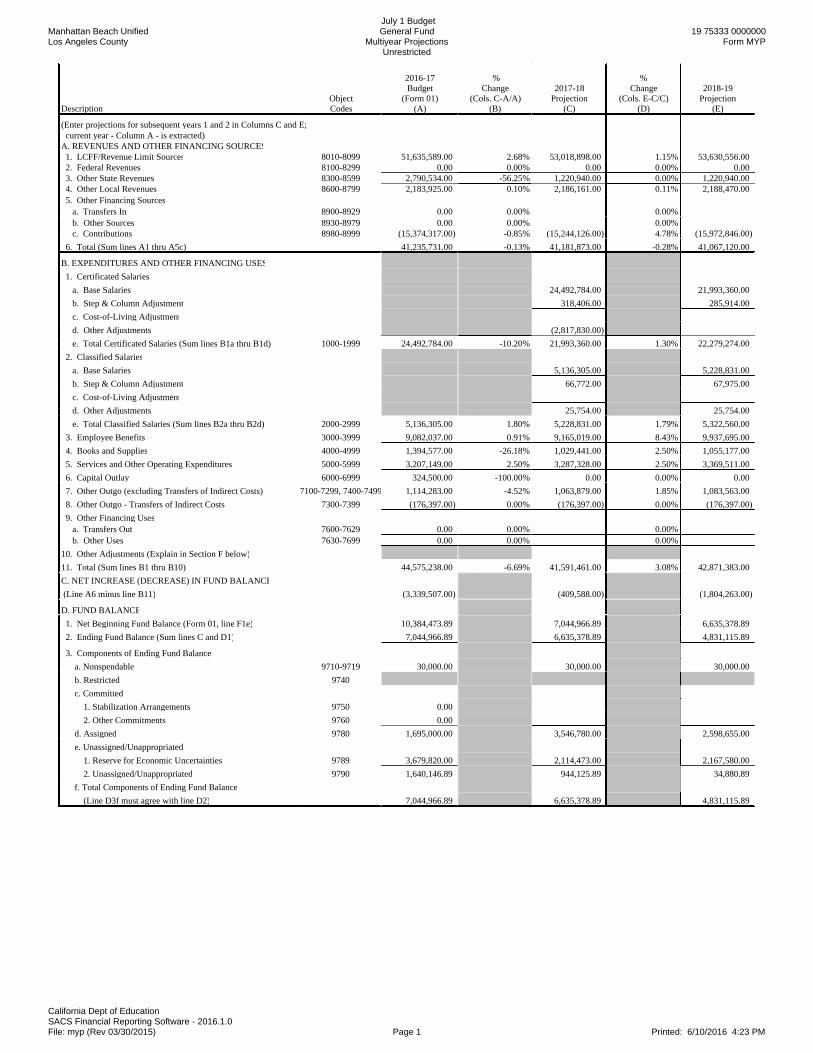
(Enter projections for subsequent years 1 and 2 in Columns C and E; current year - Column A - is extracted)A. REVENUES AND OTHER FINANCING SOURCES 1. LCFF/Revenue Limit Sources 8010-8099 51,635,589.00 2.68% 53,018,898.00 1.15% 53,630,556.00 2. Federal Revenues 8100-8299 0.00 0.00% 0.00 0.00% 0.00 3. Other State Revenues 8300-8599 2,790,534.00 -56.25% 1,220,940.00 0.00% 1,220,940.00 4. Other Local Revenues 8600-8799 2,183,925.00 0.10% 2,186,161.00 0.11% 2,188,470.00 5. Other Financing Sources a. Transfers In 8900-8929 0.00 0.00% 0.00% b. Other Sources 8930-8979 0.00 0.00% 0.00% c. Contributions 8980-8999 (15,374,317.00) -0.85% (15,244,126.00) 4.78% (15,972,846.00)
6. Total (Sum lines A1 thru A5c) 41,235,731.00 -0.13% 41,181,873.00 -0.28% 41,067,120.00
B. EXPENDITURES AND OTHER FINANCING USES
1. Certificated Salaries
a. Base Salaries 24,492,784.00 21,993,360.00
b. Step & Column Adjustment 318,406.00 285,914.00
c. Cost-of-Living Adjustment
d. Other Adjustments (2,817,830.00)
e. Total Certificated Salaries (Sum lines B1a thru B1d) 1000-1999 24,492,784.00 -10.20% 21,993,360.00 1.30% 22,279,274.00
2. Classified Salaries
a. Base Salaries 5,136,305.00 5,228,831.00
b. Step & Column Adjustment 66,772.00 67,975.00
c. Cost-of-Living Adjustment
d. Other Adjustments 25,754.00 25,754.00
e. Total Classified Salaries (Sum lines B2a thru B2d) 2000-2999 5,136,305.00 1.80% 5,228,831.00 1.79% 5,322,560.00
3. Employee Benefits 3000-3999 9,082,037.00 0.91% 9,165,019.00 8.43% 9,937,695.00
4. Books and Supplies 4000-4999 1,394,577.00 -26.18% 1,029,441.00 2.50% 1,055,177.00
5. Services and Other Operating Expenditures 5000-5999 3,207,149.00 2.50% 3,287,328.00 2.50% 3,369,511.00
6. Capital Outlay 6000-6999 324,500.00 -100.00% 0.00 0.00% 0.00
7. Other Outgo (excluding Transfers of Indirect Costs) 7100-7299, 7400-7499 1,114,283.00 -4.52% 1,063,879.00 1.85% 1,083,563.00
8. Other Outgo - Transfers of Indirect Costs 7300-7399 (176,397.00) 0.00% (176,397.00) 0.00% (176,397.00)
9. Other Financing Uses a. Transfers Out 7600-7629 0.00 0.00% 0.00% b. Other Uses 7630-7699 0.00 0.00% 0.00%
10. Other Adjustments (Explain in Section F below)
11. Total (Sum lines B1 thru B10) 44,575,238.00 -6.69% 41,591,461.00 3.08% 42,871,383.00
C. NET INCREASE (DECREASE) IN FUND BALANCE
(Line A6 minus line B11) (3,339,507.00) (409,588.00) (1,804,263.00)
D. FUND BALANCE
1. Net Beginning Fund Balance (Form 01, line F1e) 10,384,473.89 7,044,966.89 6,635,378.89
2. Ending Fund Balance (Sum lines C and D1) 7,044,966.89 6,635,378.89 4,831,115.89
3. Components of Ending Fund Balance
a. Nonspendable 9710-9719 30,000.00 30,000.00 30,000.00
b. Restricted 9740
c. Committed
1. Stabilization Arrangements 9750 0.00
2. Other Commitments 9760 0.00
d. Assigned 9780 1,695,000.00 3,546,780.00 2,598,655.00
e. Unassigned/Unappropriated
1. Reserve for Economic Uncertainties 9789 3,679,820.00 2,114,473.00 2,167,580.00
2. Unassigned/Unappropriated 9790 1,640,146.89 944,125.89 34,880.89
f. Total Components of Ending Fund Balance
(Line D3f must agree with line D2) 7,044,966.89 6,635,378.89 4,831,115.89
Manhattan Beach UnifiedLos Angeles County
July 1 BudgetGeneral Fund
Multiyear ProjectionsUnrestricted
19 75333 0000000Form MYP
California Dept of EducationSACS Financial Reporting Software - 2016.1.0File: myp (Rev 03/30/2015) Page 2 Printed: 6/10/2016 4:23 PM
DescriptionObjectCodes
2016-17Budget
(Form 01)(A)
%Change
(Cols. C-A/A)(B)
2017-18Projection
(C)
%Change
(Cols. E-C/C)(D)
2018-19Projection
(E)
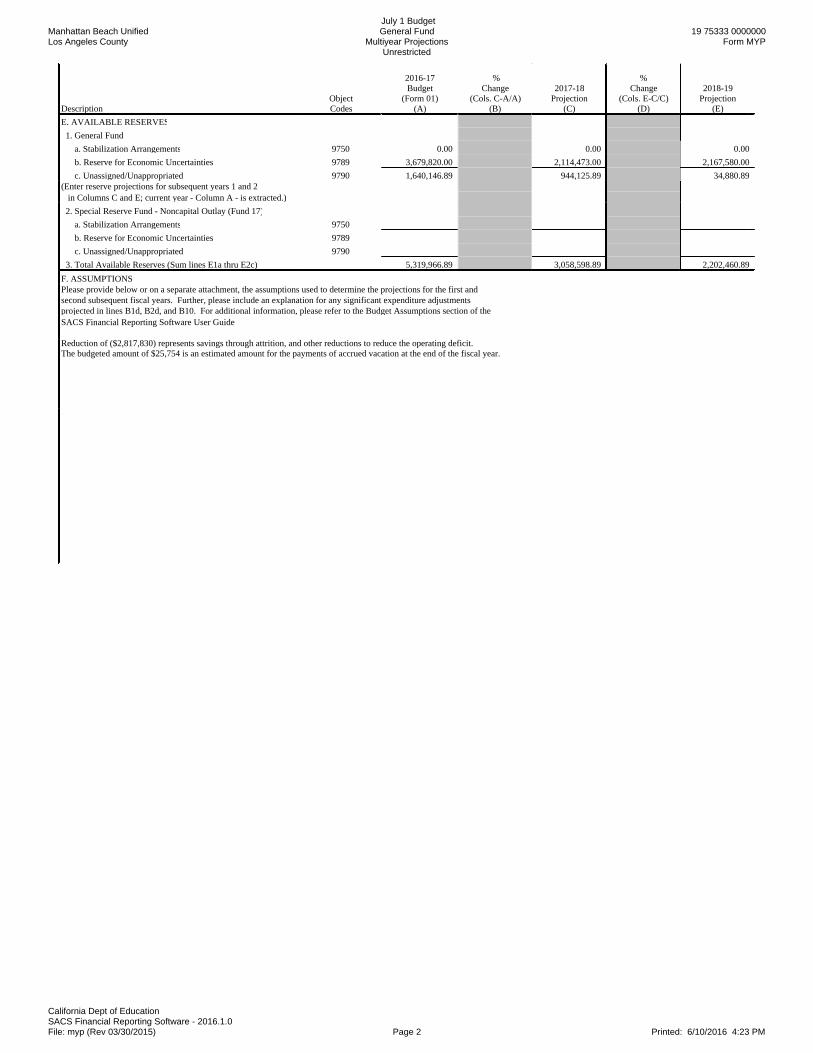
E. AVAILABLE RESERVES
1. General Fund
a. Stabilization Arrangements 9750 0.00 0.00 0.00
b. Reserve for Economic Uncertainties 9789 3,679,820.00 2,114,473.00 2,167,580.00
c. Unassigned/Unappropriated 9790 1,640,146.89 944,125.89 34,880.89(Enter reserve projections for subsequent years 1 and 2 in Columns C and E; current year - Column A - is extracted.)
2. Special Reserve Fund - Noncapital Outlay (Fund 17)
a. Stabilization Arrangements 9750
b. Reserve for Economic Uncertainties 9789
c. Unassigned/Unappropriated 9790
3. Total Available Reserves (Sum lines E1a thru E2c) 5,319,966.89 3,058,598.89 2,202,460.89
F. ASSUMPTIONSPlease provide below or on a separate attachment, the assumptions used to determine the projections for the first and second subsequent fiscal years. Further, please include an explanation for any significant expenditure adjustments projected in lines B1d, B2d, and B10. For additional information, please refer to the Budget Assumptions section of the SACS Financial Reporting Software User Guide.
Reduction of ($2,817,830) represents savings through attrition, and other reductions to reduce the operating deficit.The budgeted amount of $25,754 is an estimated amount for the payments of accrued vacation at the end of the fiscal year.Reduction of ($2,817,830) represents savings through attrition, and other reductions to reduce the operating deficit.The budgeted amount of $25,754 is an estimated amount for the payments of accrued vacation at the end of the fiscal year.

Manhattan Beach UnifiedLos Angeles County
July 1 BudgetGeneral Fund
Multiyear ProjectionsRestricted
19 75333 0000000Form MYP
California Dept of EducationSACS Financial Reporting Software - 2016.1.0File: myp (Rev 03/30/2015) Page 1 Printed: 6/10/2016 4:23 PM
DescriptionObjectCodes
2016-17Budget
(Form 01)(A)
%Change
(Cols. C-A/A)(B)
2017-18Projection
(C)
%Change
(Cols. E-C/C)(D)
2018-19Projection
(E)
(Enter projections for subsequent years 1 and 2 in Columns C and E; current year - Column A - is extracted)A. REVENUES AND OTHER FINANCING SOURCES 1. LCFF/Revenue Limit Sources 8010-8099 0.00 0.00% 0.00% 2. Federal Revenues 8100-8299 1,718,799.00 0.00% 1,718,799.00 0.00% 1,718,799.00 3. Other State Revenues 8300-8599 6,314,175.00 0.00% 6,314,176.00 -3.78% 6,075,781.00 4. Other Local Revenues 8600-8799 5,613,870.00 0.00% 5,613,870.00 0.00% 5,613,870.00 5. Other Financing Sources a. Transfers In 8900-8929 0.00 0.00% 0.00% b. Other Sources 8930-8979 0.00 0.00% 0.00% c. Contributions 8980-8999 15,374,317.00 -0.85% 15,244,126.00 4.78% 15,972,846.00
6. Total (Sum lines A1 thru A5c) 29,021,161.00 -0.45% 28,890,971.00 1.70% 29,381,296.00
B. EXPENDITURES AND OTHER FINANCING USES
1. Certificated Salaries
a. Base Salaries 8,906,622.00 8,297,632.00
b. Step & Column Adjustment 115,786.00 107,869.00
c. Cost-of-Living Adjustment
d. Other Adjustments (724,776.00)
e. Total Certificated Salaries (Sum lines B1a thru B1d) 1000-1999 8,906,622.00 -6.84% 8,297,632.00 1.30% 8,405,501.00
2. Classified Salaries
a. Base Salaries 5,850,391.00 5,783,274.00
b. Step & Column Adjustment 76,055.00 75,183.00
c. Cost-of-Living Adjustment
d. Other Adjustments (143,172.00)
e. Total Classified Salaries (Sum lines B2a thru B2d) 2000-2999 5,850,391.00 -1.15% 5,783,274.00 1.30% 5,858,457.00
3. Employee Benefits 3000-3999 7,066,958.00 5.47% 7,453,684.00 5.16% 7,838,634.00
4. Books and Supplies 4000-4999 1,143,472.00 2.50% 1,172,059.00 2.50% 1,201,360.00
5. Services and Other Operating Expenditures 5000-5999 5,155,653.00 2.53% 5,286,257.00 -2.02% 5,179,279.00
6. Capital Outlay 6000-6999 0.00 0.00% 0.00 0.00% 0.00
7. Other Outgo (excluding Transfers of Indirect Costs) 7100-7299, 7400-7499 823,668.00 0.00% 823,668.00 0.00% 823,668.00
8. Other Outgo - Transfers of Indirect Costs 7300-7399 74,397.00 0.00% 74,397.00 0.00% 74,397.00 9. Other Financing Uses a. Transfers Out 7600-7629 0.00 0.00% 0.00%
b. Other Uses 7630-7699 0.00 0.00% 0.00%
10. Other Adjustments (Explain in Section F below)
11. Total (Sum lines B1 thru B10) 29,021,161.00 -0.45% 28,890,971.00 1.70% 29,381,296.00
C. NET INCREASE (DECREASE) IN FUND BALANCE
(Line A6 minus line B11) 0.00 0.00 0.00
D. FUND BALANCE
1. Net Beginning Fund Balance (Form 01, line F1e) 0.05 0.05 0.05
2. Ending Fund Balance (Sum lines C and D1) 0.05 0.05 0.05 3. Components of Ending Fund Balance a. Nonspendable 9710-9719 0.00
b. Restricted 9740 0.42 0.05 0.05
c. Committed
1. Stabilization Arrangements 9750
2. Other Commitments 9760
d. Assigned 9780
e. Unassigned/Unappropriated
1. Reserve for Economic Uncertainties 9789
2. Unassigned/Unappropriated 9790 (0.37) 0.00 0.00
f. Total Components of Ending Fund Balance
(Line D3f must agree with line D2) 0.05 0.05 0.05

Manhattan Beach UnifiedLos Angeles County
July 1 BudgetGeneral Fund
Multiyear ProjectionsRestricted
19 75333 0000000Form MYP
California Dept of EducationSACS Financial Reporting Software - 2016.1.0File: myp (Rev 03/30/2015) Page 2 Printed: 6/10/2016 4:23 PM
DescriptionObjectCodes
2016-17Budget
(Form 01)(A)
%Change
(Cols. C-A/A)(B)
2017-18Projection
(C)
%Change
(Cols. E-C/C)(D)
2018-19Projection
(E)
E. AVAILABLE RESERVES
1. General Fund
a. Stabilization Arrangements 9750 b. Reserve for Economic Uncertainties 9789
c. Unassigned/Unappropriated 9790
(Enter reserve projections for subsequent years 1 and 2
in Columns C and E; current year - Column A - is extracted.)
2. Special Reserve Fund - Noncapital Outlay (Fund 17)
a. Stabilization Arrangements 9750
b. Reserve for Economic Uncertainties 9789
c. Unassigned/Unappropriated 9790
3. Total Available Reserves (Sum lines E1a thru E2c)F. ASSUMPTIONSPlease provide below or on a separate attachment, the assumptions used to determine the projections for the first andsecond subsequent fiscal years. Further, please include an explanation for any significant expenditure adjustmentsprojected in lines B1d, B2d, and B10. For additional information, please refer to the Budget Assumptions section of the SACS Financial Reporting Software User Guide.
Certificated reductions of ($724,776) and classified reduction of ($143,172) represents savings through attrition, and other reductions to reduce the operational deficit.Certificated reductions of ($724,776) and classified reduction of ($143,172) represents savings through attrition, and other reductions to reduce the operational deficit.

Manhattan Beach UnifiedLos Angeles County
July 1 BudgetGeneral Fund
Multiyear ProjectionsUnrestricted/Restricted
19 75333 0000000Form MYP
California Dept of EducationSACS Financial Reporting Software - 2016.1.0File: myp (Rev 03/09/2016) Page 1 Printed: 6/10/2016 4:23 PM
DescriptionObjectCodes
2016-17Budget
(Form 01)(A)
%Change
(Cols. C-A/A)(B)
2017-18Projection
(C)
%Change
(Cols. E-C/C)(D)
2018-19Projection
(E)(Enter projections for subsequent years 1 and 2 in Columns C and E; current year - Column A - is extracted)A. REVENUES AND OTHER FINANCING SOURCES 1. LCFF/Revenue Limit Sources 8010-8099 51,635,589.00 2.68% 53,018,898.00 1.15% 53,630,556.00 2. Federal Revenues 8100-8299 1,718,799.00 0.00% 1,718,799.00 0.00% 1,718,799.00 3. Other State Revenues 8300-8599 9,104,709.00 -17.24% 7,535,116.00 -3.16% 7,296,721.00 4. Other Local Revenues 8600-8799 7,797,795.00 0.03% 7,800,031.00 0.03% 7,802,340.00 5. Other Financing Sources a. Transfers In 8900-8929 0.00 0.00% 0.00 0.00% 0.00 b. Other Sources 8930-8979 0.00 0.00% 0.00 0.00% 0.00 c. Contributions 8980-8999 0.00 0.00% 0.00 0.00% 0.00
6. Total (Sum lines A1 thru A5c) 70,256,892.00 -0.26% 70,072,844.00 0.54% 70,448,416.00
B. EXPENDITURES AND OTHER FINANCING USES
1. Certificated Salaries
a. Base Salaries 33,399,406.00 30,290,992.00
b. Step & Column Adjustment 434,192.00 393,783.00
c. Cost-of-Living Adjustment 0.00 0.00
d. Other Adjustments (3,542,606.00) 0.00
e. Total Certificated Salaries (Sum lines B1a thru B1d) 1000-1999 33,399,406.00 -9.31% 30,290,992.00 1.30% 30,684,775.00
2. Classified Salaries
a. Base Salaries 10,986,696.00 11,012,105.00
b. Step & Column Adjustment 142,827.00 143,158.00
c. Cost-of-Living Adjustment 0.00 0.00
d. Other Adjustments (117,418.00) 25,754.00
e. Total Classified Salaries (Sum lines B2a thru B2d) 2000-2999 10,986,696.00 0.23% 11,012,105.00 1.53% 11,181,017.00
3. Employee Benefits 3000-3999 16,148,995.00 2.91% 16,618,703.00 6.97% 17,776,329.00
4. Books and Supplies 4000-4999 2,538,049.00 -13.26% 2,201,500.00 2.50% 2,256,537.00
5. Services and Other Operating Expenditures 5000-5999 8,362,802.00 2.52% 8,573,585.00 -0.29% 8,548,790.00
6. Capital Outlay 6000-6999 324,500.00 -100.00% 0.00 0.00% 0.00
7. Other Outgo (excluding Transfers of Indirect Costs) 7100-7299, 7400-7499 1,937,951.00 -2.60% 1,887,547.00 1.04% 1,907,231.00
8. Other Outgo - Transfers of Indirect Costs 7300-7399 (102,000.00) 0.00% (102,000.00) 0.00% (102,000.00) 9. Other Financing Uses a. Transfers Out 7600-7629 0.00 0.00% 0.00 0.00% 0.00
b. Other Uses 7630-7699 0.00 0.00% 0.00 0.00% 0.00
10. Other Adjustments 0.00 0.00
11. Total (Sum lines B1 thru B10) 73,596,399.00 -4.23% 70,482,432.00 2.51% 72,252,679.00
C. NET INCREASE (DECREASE) IN FUND BALANCE
(Line A6 minus line B11) (3,339,507.00) (409,588.00) (1,804,263.00)
D. FUND BALANCE
1. Net Beginning Fund Balance (Form 01, line F1e) 10,384,473.94 7,044,966.94 6,635,378.94 2. Ending Fund Balance (Sum lines C and D1) 7,044,966.94 6,635,378.94 4,831,115.94 3. Components of Ending Fund Balance
a. Nonspendable 9710-9719 30,000.00 30,000.00 30,000.00 b. Restricted 9740 0.42 0.05 0.05 c. Committed 1. Stabilization Arrangements 9750 0.00 0.00 0.00 2. Other Commitments 9760 0.00 0.00 0.00 d. Assigned 9780 1,695,000.00 3,546,780.00 2,598,655.00
e. Unassigned/Unappropriated 1. Reserve for Economic Uncertainties 9789 3,679,820.00 2,114,473.00 2,167,580.00 2. Unassigned/Unappropriated 9790 1,640,146.52 944,125.89 34,880.89 f. Total Components of Ending Fund Balance
(Line D3f must agree with line D2) 7,044,966.94 6,635,378.94 4,831,115.94
Manhattan Beach UnifiedLos Angeles County
July 1 BudgetGeneral Fund
Multiyear ProjectionsUnrestricted/Restricted
19 75333 0000000Form MYP
California Dept of EducationSACS Financial Reporting Software - 2016.1.0File: myp (Rev 03/09/2016) Page 2 Printed: 6/10/2016 4:23 PM
DescriptionObjectCodes
2016-17Budget
(Form 01)(A)
%Change
(Cols. C-A/A)(B)
2017-18Projection
(C)
%Change
(Cols. E-C/C)(D)
2018-19Projection
(E)
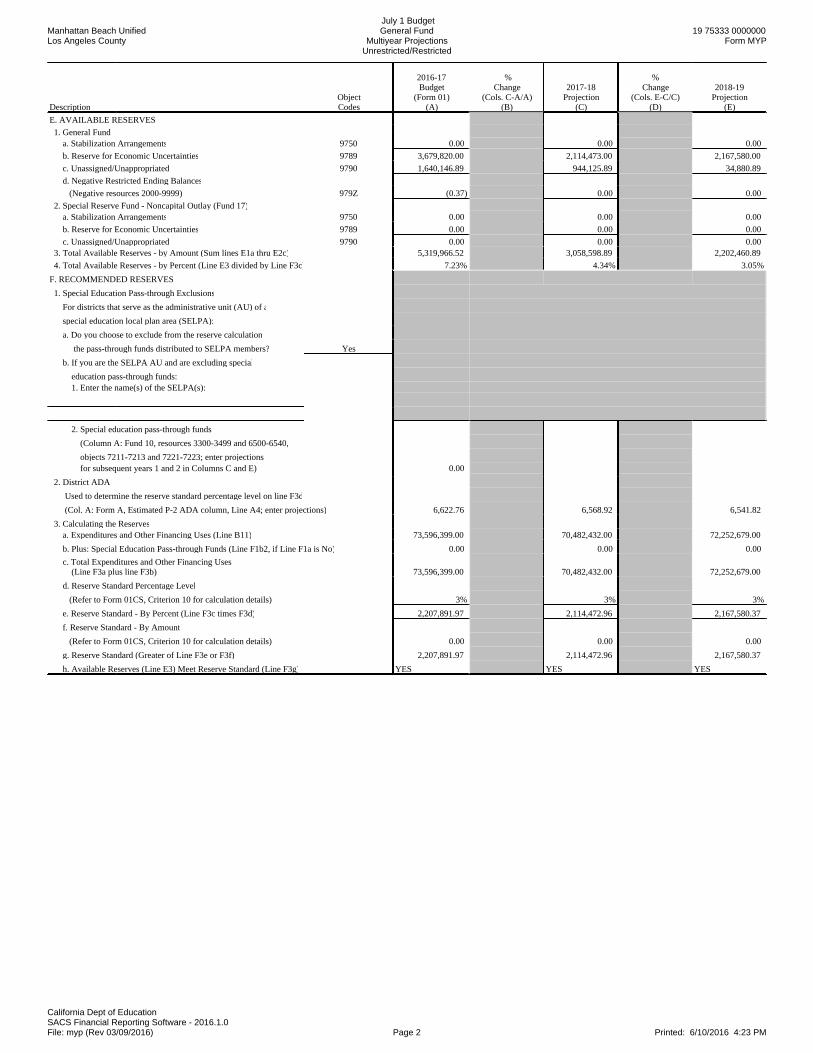
E. AVAILABLE RESERVES
1. General Fund a. Stabilization Arrangements 9750 0.00 0.00 0.00
b. Reserve for Economic Uncertainties 9789 3,679,820.00 2,114,473.00 2,167,580.00
c. Unassigned/Unappropriated 9790 1,640,146.89 944,125.89 34,880.89
d. Negative Restricted Ending Balances
(Negative resources 2000-9999) 979Z (0.37) 0.00 0.00
2. Special Reserve Fund - Noncapital Outlay (Fund 17) a. Stabilization Arrangements 9750 0.00 0.00 0.00
b. Reserve for Economic Uncertainties 9789 0.00 0.00 0.00
c. Unassigned/Unappropriated 9790 0.00 0.00 0.00 3. Total Available Reserves - by Amount (Sum lines E1a thru E2c) 5,319,966.52 3,058,598.89 2,202,460.89
4. Total Available Reserves - by Percent (Line E3 divided by Line F3c) 7.23% 4.34% 3.05%
F. RECOMMENDED RESERVES
1. Special Education Pass-through Exclusions
For districts that serve as the administrative unit (AU) of a
special education local plan area (SELPA):
a. Do you choose to exclude from the reserve calculation
the pass-through funds distributed to SELPA members? Yes
b. If you are the SELPA AU and are excluding special
education pass-through funds: 1. Enter the name(s) of the SELPA(s):
2. Special education pass-through funds
(Column A: Fund 10, resources 3300-3499 and 6500-6540,
objects 7211-7213 and 7221-7223; enter projections for subsequent years 1 and 2 in Columns C and E) 0.00
2. District ADA
Used to determine the reserve standard percentage level on line F3d
(Col. A: Form A, Estimated P-2 ADA column, Line A4; enter projections) 6,622.76 6,568.92 6,541.82
3. Calculating the Reserves a. Expenditures and Other Financing Uses (Line B11) 73,596,399.00 70,482,432.00 72,252,679.00
b. Plus: Special Education Pass-through Funds (Line F1b2, if Line F1a is No) 0.00 0.00 0.00
c. Total Expenditures and Other Financing Uses (Line F3a plus line F3b) 73,596,399.00 70,482,432.00 72,252,679.00
d. Reserve Standard Percentage Level
(Refer to Form 01CS, Criterion 10 for calculation details) 3% 3% 3%
e. Reserve Standard - By Percent (Line F3c times F3d) 2,207,891.97 2,114,472.96 2,167,580.37
f. Reserve Standard - By Amount
(Refer to Form 01CS, Criterion 10 for calculation details) 0.00 0.00 0.00
g. Reserve Standard (Greater of Line F3e or F3f) 2,207,891.97 2,114,472.96 2,167,580.37
h. Available Reserves (Line E3) Meet Reserve Standard (Line F3g) YES YES YES

This Page is Blank.

Manhattan Beach UnifiedLos Angeles County
July 1 BudgetGeneral Fund
Unrestricted and RestrictedExpenditures by Object
19 75333 0000000Form 01
California Dept of EducationSACS Financial Reporting Software - 2016.1.0File: fund-a (Rev 03/22/2016) Page 1 Printed: 6/10/2016 4:20 PM
2015-16 Estimated Actuals 2016-17 Budget
Description Resource CodesObjectCodes
Unrestricted(A)
Restricted(B)
Total Fundcol. A + B
(C)Unrestricted
(D)Restricted
(E)
Total Fundcol. D + E
(F)
% DiffColumnC & F
A. REVENUES
1) LCFF Sources 8010-8099 49,944,100.00 0.00 49,944,100.00 51,635,589.00 0.00 51,635,589.00 3.4%
2) Federal Revenue 8100-8299 2,419.00 1,791,317.00 1,793,736.00 0.00 1,718,799.00 1,718,799.00 -4.2%
3) Other State Revenue 8300-8599 4,803,666.00 4,462,222.00 9,265,888.00 2,790,534.00 6,314,175.00 9,104,709.00 -1.7%
4) Other Local Revenue 8600-8799 2,767,404.00 8,657,245.00 11,424,649.00 2,183,925.00 5,613,870.00 7,797,795.00 -31.7%
5) TOTAL, REVENUES 57,517,589.00 14,910,784.00 72,428,373.00 56,610,048.00 13,646,844.00 70,256,892.00 -3.0%
B. EXPENDITURES
1) Certificated Salaries 1000-1999 24,437,239.00 8,624,757.00 33,061,996.00 24,492,784.00 8,906,622.00 33,399,406.00 1.0%
2) Classified Salaries 2000-2999 5,146,604.00 5,935,781.00 11,082,385.00 5,136,305.00 5,850,391.00 10,986,696.00 -0.9%
3) Employee Benefits 3000-3999 8,677,778.00 4,318,189.00 12,995,967.00 9,082,037.00 7,066,958.00 16,148,995.00 24.3%
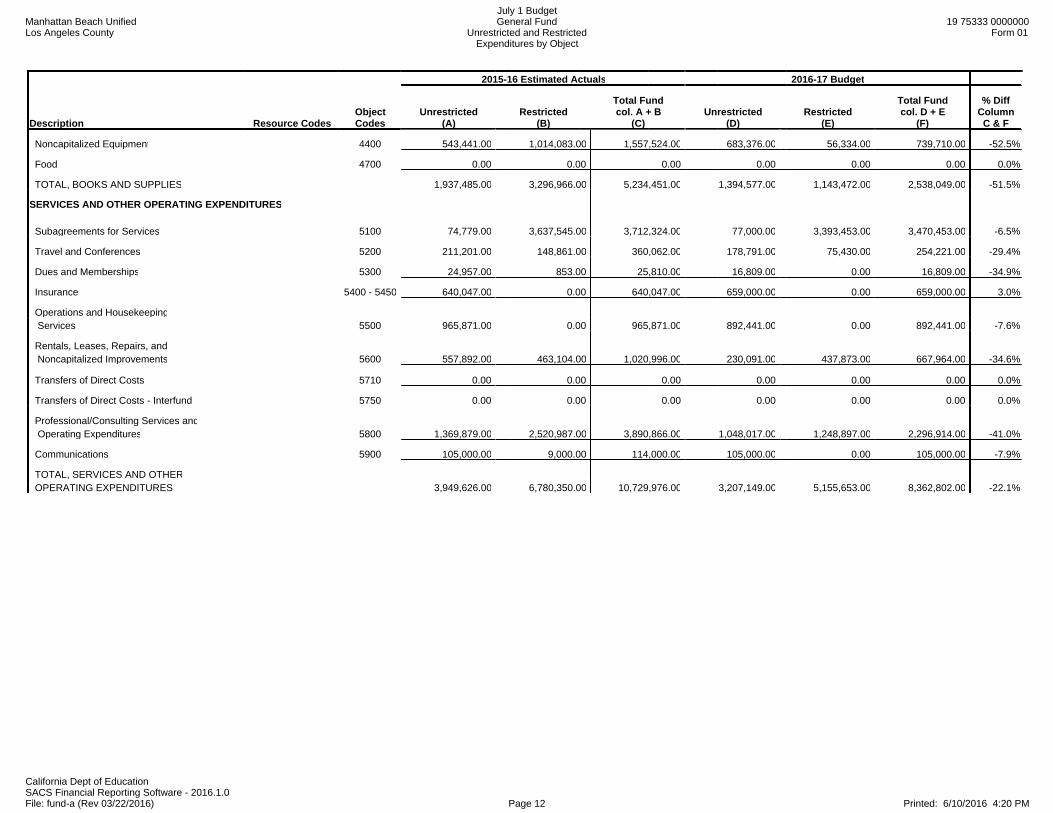
4) Books and Supplies 4000-4999 1,937,485.00 3,296,966.00 5,234,451.00 1,394,577.00 1,143,472.00 2,538,049.00 -51.5%
5) Services and Other Operating Expenditures 5000-5999 3,949,626.00 6,780,350.00 10,729,976.00 3,207,149.00 5,155,653.00 8,362,802.00 -22.1%
6) Capital Outlay 6000-6999 58,324.00 69,966.00 128,290.00 324,500.00 0.00 324,500.00 152.9%
7) Other Outgo (excluding Transfers of Indirect 7100-7299 Costs) 7400-7499 1,277,993.00 941,150.00 2,219,143.00 1,114,283.00 823,668.00 1,937,951.00 -12.7%
8) Other Outgo - Transfers of Indirect Costs 7300-7399 (176,397.00) 74,397.00 (102,000.00) (176,397.00) 74,397.00 (102,000.00) 0.0%
9) TOTAL, EXPENDITURES 45,308,652.00 30,041,556.00 75,350,208.00 44,575,238.00 29,021,161.00 73,596,399.00 -2.3%
C. EXCESS (DEFICIENCY) OF REVENUES OVER EXPENDITURES BEFORE OTHER FINANCING SOURCES AND USES (A5 - B9) 12,208,937.00 (15,130,772.00) (2,921,835.00) 12,034,810.00 (15,374,317.00) (3,339,507.00) 14.3%
D. OTHER FINANCING SOURCES/USES 1) Interfund Transfers a) Transfers In 8900-8929 0.00 0.00 0.00 0.00 0.00 0.00 0.0%
b) Transfers Out 7600-7629 0.00 0.00 0.00 0.00 0.00 0.00 0.0%
2) Other Sources/Uses a) Sources 8930-8979 0.00 0.00 0.00 0.00 0.00 0.00 0.0%
b) Uses 7630-7699 0.00 0.00 0.00 0.00 0.00 0.00 0.0%
3) Contributions 8980-8999 (14,513,210.00) 14,513,210.00 0.00 (15,374,317.00) 15,374,317.00 0.00 0.0%
4) TOTAL, OTHER FINANCING SOURCES/USES (14,513,210.00) 14,513,210.00 0.00 (15,374,317.00) 15,374,317.00 0.00 0.0%

Manhattan Beach UnifiedLos Angeles County
July 1 BudgetGeneral Fund
Unrestricted and RestrictedExpenditures by Object
19 75333 0000000Form 01
California Dept of EducationSACS Financial Reporting Software - 2016.1.0File: fund-a (Rev 03/22/2016) Page 2 Printed: 6/10/2016 4:20 PM
2015-16 Estimated Actuals 2016-17 Budget
Description Resource CodesObjectCodes
Unrestricted(A)
Restricted(B)
Total Fundcol. A + B
(C)Unrestricted
(D)Restricted
(E)
Total Fundcol. D + E
(F)
% DiffColumnC & F
E. NET INCREASE (DECREASE) IN FUND BALANCE (C + D4) (2,304,273.00) (617,562.00) (2,921,835.00) (3,339,507.00) 0.00 (3,339,507.00) 14.3%
F. FUND BALANCE, RESERVES 1) Beginning Fund Balance a) As of July 1 - Unaudited 9791 12,818,599.89 617,562.05 13,436,161.94 10,384,473.89 0.05 10,384,473.94 -22.7%
b) Audit Adjustments 9793 (129,853.00) 0.00 (129,853.00) 0.00 0.00 0.00 -100.0%
c) As of July 1 - Audited (F1a + F1b) 12,688,746.89 617,562.05 13,306,308.94 10,384,473.89 0.05 10,384,473.94 -22.0%
d) Other Restatements 9795 0.00 0.00 0.00 0.00 0.00 0.00 0.0%
e) Adjusted Beginning Balance (F1c + F1d) 12,688,746.89 617,562.05 13,306,308.94 10,384,473.89 0.05 10,384,473.94 -22.0%
2) Ending Balance, June 30 (E + F1e) 10,384,473.89 0.05 10,384,473.94 7,044,966.89 0.05 7,044,966.94 -32.2%
Components of Ending Fund Balance a) Nonspendable Revolving Cash 9711 10,000.00 0.00 10,000.00 10,000.00 0.00 10,000.00 0.0%
Stores 9712 20,000.00 0.00 20,000.00 20,000.00 0.00 20,000.00 0.0%
Prepaid Expenditures 9713 0.00 0.00 0.00 0.00 0.00 0.00 0.0%
All Others 9719 0.00 0.00 0.00 0.00 0.00 0.00 0.0%
b) Restricted 9740 0.00 0.42 0.42 0.00 0.42 0.42 0.0%
c) Committed Stabilization Arrangements 9750 0.00 0.00 0.00 0.00 0.00 0.00 0.0%
Other Commitments 9760 0.00 0.00 0.00 0.00 0.00 0.00 0.0%
d) Assigned
Other Assignments 9780 1,500,000.00 0.00 1,500,000.00 1,695,000.00 0.00 1,695,000.00 13.0%Escrow account 0000 9780 1,695,000.00 1,695,000.00Escrow Account 0000 9780 1,500,000.00 1,500,000.00
e) Unassigned/unappropriated
Reserve for Economic Uncertainties 9789 3,767,510.00 0.00 3,767,510.00 3,679,820.00 0.00 3,679,820.00 -2.3%
Unassigned/Unappropriated Amount 9790 5,086,963.89 (0.37) 5,086,963.52 1,640,146.89 (0.37) 1,640,146.52 -67.8%
Manhattan Beach UnifiedLos Angeles County
July 1 BudgetGeneral Fund
Unrestricted and RestrictedExpenditures by Object
19 75333 0000000Form 01
California Dept of EducationSACS Financial Reporting Software - 2016.1.0File: fund-a (Rev 03/22/2016) Page 3 Printed: 6/10/2016 4:20 PM
2015-16 Estimated Actuals 2016-17 Budget
Description Resource CodesObjectCodes
Unrestricted(A)
Restricted(B)
Total Fundcol. A + B
(C)Unrestricted
(D)Restricted
(E)
Total Fundcol. D + E
(F)
% DiffColumnC & F
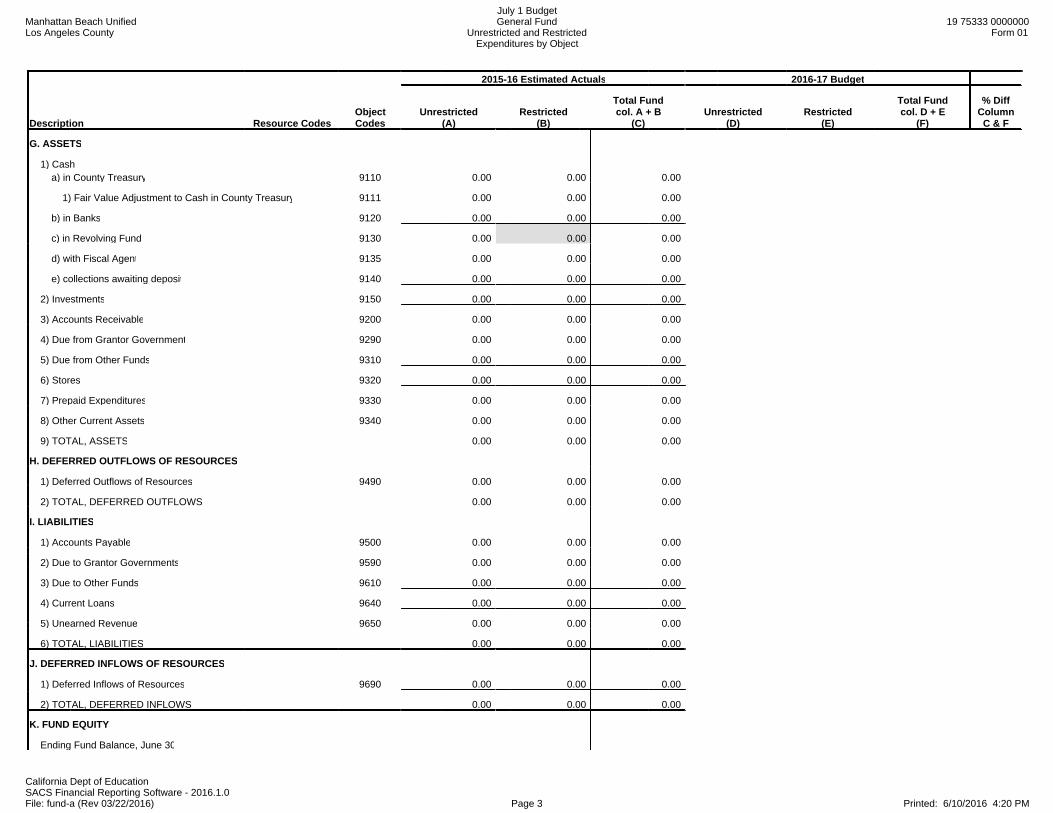
G. ASSETS
1) Cash a) in County Treasury 9110 0.00 0.00 0.00
1) Fair Value Adjustment to Cash in County Treasury 9111 0.00 0.00 0.00
b) in Banks 9120 0.00 0.00 0.00
c) in Revolving Fund 9130 0.00 0.00 0.00
d) with Fiscal Agent 9135 0.00 0.00 0.00
e) collections awaiting deposit 9140 0.00 0.00 0.00
2) Investments 9150 0.00 0.00 0.00
3) Accounts Receivable 9200 0.00 0.00 0.00
4) Due from Grantor Government 9290 0.00 0.00 0.00
5) Due from Other Funds 9310 0.00 0.00 0.00
6) Stores 9320 0.00 0.00 0.00
7) Prepaid Expenditures 9330 0.00 0.00 0.00
8) Other Current Assets 9340 0.00 0.00 0.00
9) TOTAL, ASSETS 0.00 0.00 0.00
H. DEFERRED OUTFLOWS OF RESOURCES
1) Deferred Outflows of Resources 9490 0.00 0.00 0.00
2) TOTAL, DEFERRED OUTFLOWS 0.00 0.00 0.00
I. LIABILITIES
1) Accounts Payable 9500 0.00 0.00 0.00
2) Due to Grantor Governments 9590 0.00 0.00 0.00
3) Due to Other Funds 9610 0.00 0.00 0.00
4) Current Loans 9640 0.00 0.00 0.00
5) Unearned Revenue 9650 0.00 0.00 0.00
6) TOTAL, LIABILITIES 0.00 0.00 0.00
J. DEFERRED INFLOWS OF RESOURCES
1) Deferred Inflows of Resources 9690 0.00 0.00 0.00
2) TOTAL, DEFERRED INFLOWS 0.00 0.00 0.00
K. FUND EQUITY
Ending Fund Balance, June 30

Manhattan Beach UnifiedLos Angeles County
July 1 BudgetGeneral Fund
Unrestricted and RestrictedExpenditures by Object
19 75333 0000000Form 01
California Dept of EducationSACS Financial Reporting Software - 2016.1.0File: fund-a (Rev 03/22/2016) Page 4 Printed: 6/10/2016 4:20 PM
2015-16 Estimated Actuals 2016-17 Budget
Description Resource CodesObjectCodes
Unrestricted(A)
Restricted(B)
Total Fundcol. A + B
(C)Unrestricted
(D)Restricted
(E)
Total Fundcol. D + E
(F)
% DiffColumnC & F
(G9 + H2) - (I6 + J2) 0.00 0.00 0.00

Manhattan Beach UnifiedLos Angeles County
July 1 BudgetGeneral Fund
Unrestricted and RestrictedExpenditures by Object
19 75333 0000000Form 01
California Dept of EducationSACS Financial Reporting Software - 2016.1.0File: fund-a (Rev 03/22/2016) Page 5 Printed: 6/10/2016 4:20 PM
2015-16 Estimated Actuals 2016-17 Budget
Description Resource CodesObjectCodes
Unrestricted(A)
Restricted(B)
Total Fundcol. A + B
(C)Unrestricted
(D)Restricted
(E)
Total Fundcol. D + E
(F)
% DiffColumnC & F
LCFF SOURCES Principal Apportionment State Aid - Current Year 8011 8,976,873.00 0.00 8,976,873.00 10,668,362.00 0.00 10,668,362.00 18.8%
Education Protection Account State Aid - Current Year 8012 8,055,865.00 0.00 8,055,865.00 8,055,865.00 0.00 8,055,865.00 0.0%
State Aid - Prior Years 8019 0.00 0.00 0.00 0.00 0.00 0.00 0.0%
Tax Relief Subventions Homeowners' Exemptions 8021 0.00 0.00 0.00 209,384.00 0.00 209,384.00 New
Timber Yield Tax 8022 0.00 0.00 0.00 0.00 0.00 0.00 0.0%
Other Subventions/In-Lieu Taxes 8029 0.00 0.00 0.00 0.00 0.00 0.00 0.0%
County & District Taxes Secured Roll Taxes 8041 32,911,362.00 0.00 32,911,362.00 29,392,206.00 0.00 29,392,206.00 -10.7%
Unsecured Roll Taxes 8042 0.00 0.00 0.00 1,141,828.00 0.00 1,141,828.00 New
Prior Years' Taxes 8043 0.00 0.00 0.00 634,846.00 0.00 634,846.00 New
Supplemental Taxes 8044 0.00 0.00 0.00 268,326.00 0.00 268,326.00 New
Education Revenue Augmentation Fund (ERAF) 8045 0.00 0.00 0.00 1,264,772.00 0.00 1,264,772.00 New
Community Redevelopment Funds (SB 617/699/1992) 8047 0.00 0.00 0.00 0.00 0.00 0.00 0.0%
Penalties and Interest from Delinquent Taxes 8048 0.00 0.00 0.00 0.00 0.00 0.00 0.0%
Miscellaneous Funds (EC 41604) Royalties and Bonuses 8081 0.00 0.00 0.00 0.00 0.00 0.00 0.0%
Other In-Lieu Taxes 8082 0.00 0.00 0.00 0.00 0.00 0.00 0.0%
Less: Non-LCFF (50%) Adjustment 8089 0.00 0.00 0.00 0.00 0.00 0.00 0.0%
Subtotal, LCFF Sources 49,944,100.00 0.00 49,944,100.00 51,635,589.00 0.00 51,635,589.00 3.4% LCFF Transfers
Unrestricted LCFF Transfers - Current Year 0000 8091 0.00 0.00 0.00 0.00 0.0%
All Other LCFF Transfers - Current Year All Other 8091 0.00 0.00 0.00 0.00 0.00 0.00 0.0%
Transfers to Charter Schools in Lieu of Property Taxes 8096 0.00 0.00 0.00 0.00 0.00 0.00 0.0%
Property Taxes Transfers 8097 0.00 0.00 0.00 0.00 0.00 0.00 0.0%

Manhattan Beach UnifiedLos Angeles County
July 1 BudgetGeneral Fund
Unrestricted and RestrictedExpenditures by Object
19 75333 0000000Form 01
California Dept of EducationSACS Financial Reporting Software - 2016.1.0File: fund-a (Rev 03/22/2016) Page 6 Printed: 6/10/2016 4:20 PM
2015-16 Estimated Actuals 2016-17 Budget
Description Resource CodesObjectCodes
Unrestricted(A)
Restricted(B)
Total Fundcol. A + B
(C)Unrestricted
(D)Restricted
(E)
Total Fundcol. D + E
(F)
% DiffColumnC & F
LCFF/Revenue Limit Transfers - Prior Years 8099 0.00 0.00 0.00 0.00 0.00 0.00 0.0%
TOTAL, LCFF SOURCES 49,944,100.00 0.00 49,944,100.00 51,635,589.00 0.00 51,635,589.00 3.4%
FEDERAL REVENUE
Maintenance and Operations 8110 0.00 0.00 0.00 0.00 0.00 0.00 0.0%
Special Education Entitlement 8181 0.00 940,373.00 940,373.00 0.00 940,373.00 940,373.00 0.0%
Special Education Discretionary Grants 8182 0.00 479,786.00 479,786.00 0.00 479,786.00 479,786.00 0.0%
Child Nutrition Programs 8220 0.00 0.00 0.00 0.00 0.00 0.00 0.0%
Donated Food Commodities 8221 0.00 0.00 0.00 0.00 0.00 0.00 0.0%
Forest Reserve Funds 8260 0.00 0.00 0.00 0.00 0.00 0.00 0.0%
Flood Control Funds 8270 0.00 0.00 0.00 0.00 0.00 0.00 0.0%
Wildlife Reserve Funds 8280 0.00 0.00 0.00 0.00 0.00 0.00 0.0%
FEMA 8281 0.00 0.00 0.00 0.00 0.00 0.00 0.0%
Interagency Contracts Between LEAs 8285 0.00 0.00 0.00 0.00 0.00 0.00 0.0%
Pass-Through Revenues from Federal Sources 8287 0.00 0.00 0.00 0.00 0.00 0.00 0.0%
NCLB: Title I, Part A, Basic Grants Low- Income and Neglected 3010 8290 288,783.00 288,783.00 217,013.00 217,013.00 -24.9%
NCLB: Title I, Part D, Local Delinquent Programs 3025 8290 0.00 0.00 0.00 0.00 0.0%
NCLB: Title II, Part A, Teacher Quality 4035 8290 82,375.00 82,375.00 81,627.00 81,627.00 -0.9%
NCLB: Title III, Immigrant Education Program 4201 8290 0.00 0.00 0.00 0.00 0.0%

Manhattan Beach UnifiedLos Angeles County
July 1 BudgetGeneral Fund
Unrestricted and RestrictedExpenditures by Object
19 75333 0000000Form 01
California Dept of EducationSACS Financial Reporting Software - 2016.1.0File: fund-a (Rev 03/22/2016) Page 7 Printed: 6/10/2016 4:20 PM
2015-16 Estimated Actuals 2016-17 Budget
Description Resource CodesObjectCodes
Unrestricted(A)
Restricted(B)
Total Fundcol. A + B
(C)Unrestricted
(D)Restricted
(E)
Total Fundcol. D + E
(F)
% DiffColumnC & F
NCLB: Title III, Limited English Proficient (LEP) Student Program 4203 8290 0.00 0.00 0.00 0.00 0.0%
NCLB: Title V, Part B, Public Charter Schools Grant Program (PCSGP) 4610 8290 0.00 0.00 0.00 0.00 0.0%
Other No Child Left Behind
3012-3020, 3030-3199, 4036-4126,
5510 8290 0.00 0.00 0.00 0.00 0.0%
Vocational and Applied Technology Education 3500-3699 8290 0.00 0.00 0.00 0.00 0.0%
Safe and Drug Free Schools 3700-3799 8290 0.00 0.00 0.00 0.00 0.0%
All Other Federal Revenue All Other 8290 2,419.00 0.00 2,419.00 0.00 0.00 0.00 -100.0%
TOTAL, FEDERAL REVENUE 2,419.00 1,791,317.00 1,793,736.00 0.00 1,718,799.00 1,718,799.00 -4.2%
OTHER STATE REVENUE
Other State Apportionments
ROC/P Entitlement Prior Years 6360 8319 0.00 0.00 0.00 0.00 0.0%
Special Education Master Plan Current Year 6500 8311 2,376,803.00 2,376,803.00 2,376,803.00 2,376,803.00 0.0%
Prior Years 6500 8319 0.00 0.00 0.00 0.00 0.0%
All Other State Apportionments - Current Year All Other 8311 0.00 0.00 0.00 0.00 0.00 0.00 0.0%
All Other State Apportionments - Prior Years All Other 8319 0.00 0.00 0.00 0.00 0.00 0.00 0.0%
Child Nutrition Programs 8520 0.00 0.00 0.00 0.00 0.00 0.00 0.0%
Mandated Costs Reimbursements 8550 3,813,566.00 0.00 3,813,566.00 1,822,125.00 0.00 1,822,125.00 -52.2%
Lottery - Unrestricted and Instructional Materials 8560 972,943.00 284,933.00 1,257,876.00 968,409.00 283,605.00 1,252,014.00 -0.5%
Tax Relief Subventions Restricted Levies - Other
Homeowners' Exemptions 8575 0.00 0.00 0.00 0.00 0.00 0.00 0.0%
Other Subventions/In-Lieu Taxes 8576 0.00 0.00 0.00 0.00 0.00 0.00 0.0%
Pass-Through Revenues from State Sources 8587 0.00 0.00 0.00 0.00 0.00 0.00 0.0%
School Based Coordination Program 7250 8590 0.00 0.00 0.00 0.00 0.0%
After School Education and Safety (ASES) 6010 8590 0.00 0.00 0.00 0.00 0.0%
Charter School Facility Grant 6030 8590 0.00 0.00 0.00 0.00 0.0%
Drug/Alcohol/Tobacco Funds 6650, 6690 8590 0.00 0.00 0.00 0.00 0.0%

Manhattan Beach UnifiedLos Angeles County
July 1 BudgetGeneral Fund
Unrestricted and RestrictedExpenditures by Object
19 75333 0000000Form 01
California Dept of EducationSACS Financial Reporting Software - 2016.1.0File: fund-a (Rev 03/22/2016) Page 8 Printed: 6/10/2016 4:20 PM
2015-16 Estimated Actuals 2016-17 Budget
Description Resource CodesObjectCodes
Unrestricted(A)
Restricted(B)
Total Fundcol. A + B
(C)Unrestricted
(D)Restricted
(E)
Total Fundcol. D + E
(F)
% DiffColumnC & F
California Clean Energy Jobs Act 6230 8590 238,395.00 238,395.00 238,395.00 238,395.00 0.0%
Career Technical Education Incentive Grant Program 6387 8590 0.00 0.00 0.00 0.00 0.0%
American Indian Early Childhood Education 7210 8590 0.00 0.00 0.00 0.00 0.0%
Specialized Secondary 7370 8590 0.00 0.00 0.00 0.00 0.0%
Quality Education Investment Act 7400 8590 0.00 0.00 0.00 0.00 0.0%
Common Core State Standards Implementation 7405 8590 0.00 0.00 0.00 0.00 0.0%
All Other State Revenue All Other 8590 17,157.00 1,562,091.00 1,579,248.00 0.00 3,415,372.00 3,415,372.00 116.3%
TOTAL, OTHER STATE REVENUE 4,803,666.00 4,462,222.00 9,265,888.00 2,790,534.00 6,314,175.00 9,104,709.00 -1.7%

Manhattan Beach UnifiedLos Angeles County
July 1 BudgetGeneral Fund
Unrestricted and RestrictedExpenditures by Object
19 75333 0000000Form 01
California Dept of EducationSACS Financial Reporting Software - 2016.1.0File: fund-a (Rev 03/22/2016) Page 9 Printed: 6/10/2016 4:20 PM
2015-16 Estimated Actuals 2016-17 Budget
Description Resource CodesObjectCodes
Unrestricted(A)
Restricted(B)
Total Fundcol. A + B
(C)Unrestricted
(D)Restricted
(E)
Total Fundcol. D + E
(F)
% DiffColumnC & F
OTHER LOCAL REVENUE
Other Local Revenue County and District Taxes
Other Restricted Levies Secured Roll 8615 0.00 0.00 0.00 0.00 0.00 0.00 0.0%
Unsecured Roll 8616 0.00 0.00 0.00 0.00 0.00 0.00 0.0%
Prior Years' Taxes 8617 0.00 0.00 0.00 0.00 0.00 0.00 0.0%
Supplemental Taxes 8618 0.00 0.00 0.00 0.00 0.00 0.00 0.0%
Non-Ad Valorem Taxes Parcel Taxes 8621 0.00 0.00 0.00 0.00 0.00 0.00 0.0%
Other 8622 0.00 0.00 0.00 0.00 0.00 0.00 0.0%
Community Redevelopment Funds Not Subject to LCFF Deduction 8625 0.00 0.00 0.00 0.00 0.00 0.00 0.0%
Penalties and Interest from Delinquent Non-LCFF Taxes 8629 0.00 0.00 0.00 0.00 0.00 0.00 0.0%
Sales Sale of Equipment/Supplies 8631 0.00 0.00 0.00 0.00 0.00 0.00 0.0%
Sale of Publications 8632 0.00 0.00 0.00 0.00 0.00 0.00 0.0%
Food Service Sales 8634 0.00 0.00 0.00 0.00 0.00 0.00 0.0%
All Other Sales 8639 0.00 0.00 0.00 0.00 0.00 0.00 0.0%
Leases and Rentals 8650 2,133,880.00 0.00 2,133,880.00 1,519,425.00 0.00 1,519,425.00 -28.8%
Interest 8660 53,524.00 0.00 53,524.00 50,000.00 0.00 50,000.00 -6.6%
Net Increase (Decrease) in the Fair Value of Investments 8662 0.00 0.00 0.00 0.00 0.00 0.00 0.0%
Fees and Contracts Adult Education Fees 8671 0.00 0.00 0.00 0.00 0.00 0.00 0.0%
Non-Resident Students 8672 0.00 0.00 0.00 0.00 0.00 0.00 0.0%
Transportation Fees From Individuals 8675 0.00 0.00 0.00 0.00 0.00 0.00 0.0%
Interagency Services 8677 0.00 75,000.00 75,000.00 0.00 65,000.00 65,000.00 -13.3%
Mitigation/Developer Fees 8681 0.00 0.00 0.00 0.00 0.00 0.00 0.0%
All Other Fees and Contracts 8689 53,000.00 0.00 53,000.00 54,500.00 0.00 54,500.00 2.8%
Other Local Revenue Plus: Misc Funds Non-LCFF

Manhattan Beach UnifiedLos Angeles County
July 1 BudgetGeneral Fund
Unrestricted and RestrictedExpenditures by Object
19 75333 0000000Form 01
California Dept of EducationSACS Financial Reporting Software - 2016.1.0File: fund-a (Rev 03/22/2016) Page 10 Printed: 6/10/2016 4:20 PM
2015-16 Estimated Actuals 2016-17 Budget
Description Resource CodesObjectCodes
Unrestricted(A)
Restricted(B)
Total Fundcol. A + B
(C)Unrestricted
(D)Restricted
(E)
Total Fundcol. D + E
(F)
% DiffColumnC & F
(50%) Adjustment 8691 0.00 0.00 0.00 0.00 0.00 0.00 0.0%
Pass-Through Revenues From Local Sources 8697 0.00 0.00 0.00 0.00 0.00 0.00 0.0%
All Other Local Revenue 8699 527,000.00 8,582,245.00 9,109,245.00 560,000.00 5,548,870.00 6,108,870.00 -32.9%
Tuition 8710 0.00 0.00 0.00 0.00 0.00 0.00 0.0%
All Other Transfers In 8781-8783 0.00 0.00 0.00 0.00 0.00 0.00 0.0%
Transfers of Apportionments Special Education SELPA Transfers From Districts or Charter Schools 6500 8791 0.00 0.00 0.00 0.00 0.0%
From County Offices 6500 8792 0.00 0.00 0.00 0.00 0.0%
From JPAs 6500 8793 0.00 0.00 0.00 0.00 0.0%
ROC/P Transfers From Districts or Charter Schools 6360 8791 0.00 0.00 0.00 0.00 0.0%
From County Offices 6360 8792 0.00 0.00 0.00 0.00 0.0%
From JPAs 6360 8793 0.00 0.00 0.00 0.00 0.0%
Other Transfers of Apportionments From Districts or Charter Schools All Other 8791 0.00 0.00 0.00 0.00 0.00 0.00 0.0%
From County Offices All Other 8792 0.00 0.00 0.00 0.00 0.00 0.00 0.0%
From JPAs All Other 8793 0.00 0.00 0.00 0.00 0.00 0.00 0.0%
All Other Transfers In from All Others 8799 0.00 0.00 0.00 0.00 0.00 0.00 0.0%
TOTAL, OTHER LOCAL REVENUE 2,767,404.00 8,657,245.00 11,424,649.00 2,183,925.00 5,613,870.00 7,797,795.00 -31.7%
TOTAL, REVENUES 57,517,589.00 14,910,784.00 72,428,373.00 56,610,048.00 13,646,844.00 70,256,892.00 -3.0%

Manhattan Beach UnifiedLos Angeles County
July 1 BudgetGeneral Fund
Unrestricted and RestrictedExpenditures by Object
19 75333 0000000Form 01
California Dept of EducationSACS Financial Reporting Software - 2016.1.0File: fund-a (Rev 03/22/2016) Page 11 Printed: 6/10/2016 4:20 PM
2015-16 Estimated Actuals 2016-17 Budget
Description Resource CodesObjectCodes
Unrestricted(A)
Restricted(B)
Total Fundcol. A + B
(C)Unrestricted
(D)Restricted
(E)
Total Fundcol. D + E
(F)
% DiffColumnC & F
CERTIFICATED SALARIES
Certificated Teachers' Salaries 1100 21,724,664.00 6,058,347.00 27,783,011.00 21,713,298.00 6,385,478.00 28,098,776.00 1.1%
Certificated Pupil Support Salaries 1200 435,482.00 1,913,618.00 2,349,100.00 422,730.00 1,976,600.00 2,399,330.00 2.1%
Certificated Supervisors' and Administrators' Salaries 1300 2,110,464.00 592,792.00 2,703,256.00 2,262,323.00 489,544.00 2,751,867.00 1.8%
Other Certificated Salaries 1900 166,629.00 60,000.00 226,629.00 94,433.00 55,000.00 149,433.00 -34.1%
TOTAL, CERTIFICATED SALARIES 24,437,239.00 8,624,757.00 33,061,996.00 24,492,784.00 8,906,622.00 33,399,406.00 1.0%
CLASSIFIED SALARIES
Classified Instructional Salaries 2100 434,759.00 4,308,951.00 4,743,710.00 415,679.00 4,320,163.00 4,735,842.00 -0.2%
Classified Support Salaries 2200 2,206,086.00 1,258,226.00 3,464,312.00 2,173,663.00 1,186,332.00 3,359,995.00 -3.0%
Classified Supervisors' and Administrators' Salaries 2300 375,670.00 100,013.00 475,683.00 427,281.00 101,513.00 528,794.00 11.2%
Clerical, Technical and Office Salaries 2400 2,125,387.00 268,591.00 2,393,978.00 2,116,528.00 242,383.00 2,358,911.00 -1.5%
Other Classified Salaries 2900 4,702.00 0.00 4,702.00 3,154.00 0.00 3,154.00 -32.9%
TOTAL, CLASSIFIED SALARIES 5,146,604.00 5,935,781.00 11,082,385.00 5,136,305.00 5,850,391.00 10,986,696.00 -0.9%
EMPLOYEE BENEFITS
STRS 3101-3102 2,699,626.00 837,598.00 3,537,224.00 3,224,282.00 3,714,029.00 6,938,311.00 96.2%
PERS 3201-3202 556,148.00 689,373.00 1,245,521.00 674,616.00 782,751.00 1,457,367.00 17.0%
OASDI/Medicare/Alternative 3301-3302 748,585.00 553,159.00 1,301,744.00 787,586.00 558,474.00 1,346,060.00 3.4%
Health and Welfare Benefits 3401-3402 3,884,149.00 1,895,192.00 5,779,341.00 3,378,981.00 1,642,224.00 5,021,205.00 -13.1%
Unemployment Insurance 3501-3502 15,376.00 7,215.00 22,591.00 16,918.00 6,769.00 23,687.00 4.9%
Workers' Compensation 3601-3602 740,894.00 335,652.00 1,076,546.00 710,191.00 362,711.00 1,072,902.00 -0.3%
OPEB, Allocated 3701-3702 33,000.00 0.00 33,000.00 24,000.00 0.00 24,000.00 -27.3%
OPEB, Active Employees 3751-3752 0.00 0.00 0.00 0.00 0.00 0.00 0.0%
Other Employee Benefits 3901-3902 0.00 0.00 0.00 265,463.00 0.00 265,463.00 New
TOTAL, EMPLOYEE BENEFITS 8,677,778.00 4,318,189.00 12,995,967.00 9,082,037.00 7,066,958.00 16,148,995.00 24.3%
BOOKS AND SUPPLIES
Approved Textbooks and Core Curricula Materials 4100 390,413.00 281,827.00 672,240.00 225,383.00 253,790.00 479,173.00 -28.7%
Books and Other Reference Materials 4200 63,109.00 1,135.00 64,244.00 49,231.00 0.00 49,231.00 -23.4%
Materials and Supplies 4300 940,522.00 1,999,921.00 2,940,443.00 436,587.00 833,348.00 1,269,935.00 -56.8%
Manhattan Beach UnifiedLos Angeles County
July 1 BudgetGeneral Fund
Unrestricted and RestrictedExpenditures by Object
19 75333 0000000Form 01
California Dept of EducationSACS Financial Reporting Software - 2016.1.0File: fund-a (Rev 03/22/2016) Page 12 Printed: 6/10/2016 4:20 PM
2015-16 Estimated Actuals 2016-17 Budget
Description Resource CodesObjectCodes
Unrestricted(A)
Restricted(B)
Total Fundcol. A + B
(C)Unrestricted
(D)Restricted
(E)
Total Fundcol. D + E
(F)
% DiffColumnC & F
Noncapitalized Equipment 4400 543,441.00 1,014,083.00 1,557,524.00 683,376.00 56,334.00 739,710.00 -52.5%
Food 4700 0.00 0.00 0.00 0.00 0.00 0.00 0.0%
TOTAL, BOOKS AND SUPPLIES 1,937,485.00 3,296,966.00 5,234,451.00 1,394,577.00 1,143,472.00 2,538,049.00 -51.5%
SERVICES AND OTHER OPERATING EXPENDITURES
Subagreements for Services 5100 74,779.00 3,637,545.00 3,712,324.00 77,000.00 3,393,453.00 3,470,453.00 -6.5%
Travel and Conferences 5200 211,201.00 148,861.00 360,062.00 178,791.00 75,430.00 254,221.00 -29.4%
Dues and Memberships 5300 24,957.00 853.00 25,810.00 16,809.00 0.00 16,809.00 -34.9%
Insurance 5400 - 5450 640,047.00 0.00 640,047.00 659,000.00 0.00 659,000.00 3.0%
Operations and Housekeeping Services 5500 965,871.00 0.00 965,871.00 892,441.00 0.00 892,441.00 -7.6%
Rentals, Leases, Repairs, and Noncapitalized Improvements 5600 557,892.00 463,104.00 1,020,996.00 230,091.00 437,873.00 667,964.00 -34.6%
Transfers of Direct Costs 5710 0.00 0.00 0.00 0.00 0.00 0.00 0.0%
Transfers of Direct Costs - Interfund 5750 0.00 0.00 0.00 0.00 0.00 0.00 0.0%
Professional/Consulting Services and Operating Expenditures 5800 1,369,879.00 2,520,987.00 3,890,866.00 1,048,017.00 1,248,897.00 2,296,914.00 -41.0%
Communications 5900 105,000.00 9,000.00 114,000.00 105,000.00 0.00 105,000.00 -7.9%
TOTAL, SERVICES AND OTHER OPERATING EXPENDITURES 3,949,626.00 6,780,350.00 10,729,976.00 3,207,149.00 5,155,653.00 8,362,802.00 -22.1%

Manhattan Beach UnifiedLos Angeles County
July 1 BudgetGeneral Fund
Unrestricted and RestrictedExpenditures by Object
19 75333 0000000Form 01
California Dept of EducationSACS Financial Reporting Software - 2016.1.0File: fund-a (Rev 03/22/2016) Page 13 Printed: 6/10/2016 4:20 PM
2015-16 Estimated Actuals 2016-17 Budget
Description Resource CodesObjectCodes
Unrestricted(A)
Restricted(B)
Total Fundcol. A + B
(C)Unrestricted
(D)Restricted
(E)
Total Fundcol. D + E
(F)
% DiffColumnC & F
CAPITAL OUTLAY
Land 6100 0.00 0.00 0.00 0.00 0.00 0.00 0.0%
Land Improvements 6170 0.00 0.00 0.00 0.00 0.00 0.00 0.0%
Buildings and Improvements of Buildings 6200 0.00 0.00 0.00 199,500.00 0.00 199,500.00 New
Books and Media for New School Libraries or Major Expansion of School Libraries 6300 0.00 0.00 0.00 0.00 0.00 0.00 0.0%
Equipment 6400 58,324.00 69,966.00 128,290.00 125,000.00 0.00 125,000.00 -2.6%
Equipment Replacement 6500 0.00 0.00 0.00 0.00 0.00 0.00 0.0%
TOTAL, CAPITAL OUTLAY 58,324.00 69,966.00 128,290.00 324,500.00 0.00 324,500.00 152.9%
OTHER OUTGO (excluding Transfers of Indirect Costs)
Tuition Tuition for Instruction Under Interdistrict Attendance Agreements 7110 0.00 0.00 0.00 0.00 0.00 0.00 0.0%
State Special Schools 7130 0.00 14,596.00 14,596.00 0.00 14,596.00 14,596.00 0.0%
Tuition, Excess Costs, and/or Deficit Payments Payments to Districts or Charter Schools 7141 0.00 0.00 0.00 0.00 0.00 0.00 0.0%
Payments to County Offices 7142 50,000.00 926,554.00 976,554.00 50,000.00 809,072.00 859,072.00 -12.0%
Payments to JPAs 7143 0.00 0.00 0.00 0.00 0.00 0.00 0.0%
Transfers of Pass-Through Revenues To Districts or Charter Schools 7211 0.00 0.00 0.00 0.00 0.00 0.00 0.0%
To County Offices 7212 0.00 0.00 0.00 0.00 0.00 0.00 0.0%
To JPAs 7213 0.00 0.00 0.00 0.00 0.00 0.00 0.0%
Special Education SELPA Transfers of Apportionments To Districts or Charter Schools 6500 7221 0.00 0.00 0.00 0.00 0.0%
To County Offices 6500 7222 0.00 0.00 0.00 0.00 0.0%
To JPAs 6500 7223 0.00 0.00 0.00 0.00 0.0%
ROC/P Transfers of Apportionments To Districts or Charter Schools 6360 7221 0.00 0.00 0.00 0.00 0.0%
To County Offices 6360 7222 0.00 0.00 0.00 0.00 0.0%
To JPAs 6360 7223 0.00 0.00 0.00 0.00 0.0%
Other Transfers of Apportionments All Other 7221-7223 278,606.00 0.00 278,606.00 262,174.00 0.00 262,174.00 -5.9%
All Other Transfers 7281-7283 0.00 0.00 0.00 0.00 0.00 0.00 0.0%

Manhattan Beach UnifiedLos Angeles County
July 1 BudgetGeneral Fund
Unrestricted and RestrictedExpenditures by Object
19 75333 0000000Form 01
California Dept of EducationSACS Financial Reporting Software - 2016.1.0File: fund-a (Rev 03/22/2016) Page 14 Printed: 6/10/2016 4:20 PM
2015-16 Estimated Actuals 2016-17 Budget
Description Resource CodesObjectCodes
Unrestricted(A)
Restricted(B)
Total Fundcol. A + B
(C)Unrestricted
(D)Restricted
(E)
Total Fundcol. D + E
(F)
% DiffColumnC & F
All Other Transfers Out to All Others 7299 0.00 0.00 0.00 0.00 0.00 0.00 0.0%
Debt Service Debt Service - Interest 7438 356,675.00 0.00 356,675.00 335,159.00 0.00 335,159.00 -6.0%
Other Debt Service - Principal 7439 592,712.00 0.00 592,712.00 466,950.00 0.00 466,950.00 -21.2%
TOTAL, OTHER OUTGO (excluding Transfers of Indirect Costs) 1,277,993.00 941,150.00 2,219,143.00 1,114,283.00 823,668.00 1,937,951.00 -12.7%
OTHER OUTGO - TRANSFERS OF INDIRECT COSTS
Transfers of Indirect Costs 7310 (74,397.00) 74,397.00 0.00 (74,397.00) 74,397.00 0.00 0.0%
Transfers of Indirect Costs - Interfund 7350 (102,000.00) 0.00 (102,000.00) (102,000.00) 0.00 (102,000.00) 0.0%
TOTAL, OTHER OUTGO - TRANSFERS OF INDIRECT COSTS (176,397.00) 74,397.00 (102,000.00) (176,397.00) 74,397.00 (102,000.00) 0.0%
TOTAL, EXPENDITURES 45,308,652.00 30,041,556.00 75,350,208.00 44,575,238.00 29,021,161.00 73,596,399.00 -2.3%

Manhattan Beach UnifiedLos Angeles County
July 1 BudgetGeneral Fund
Unrestricted and RestrictedExpenditures by Object
19 75333 0000000Form 01
California Dept of EducationSACS Financial Reporting Software - 2016.1.0File: fund-a (Rev 03/22/2016) Page 15 Printed: 6/10/2016 4:20 PM
2015-16 Estimated Actuals 2016-17 Budget
Description Resource CodesObjectCodes
Unrestricted(A)
Restricted(B)
Total Fundcol. A + B
(C)Unrestricted
(D)Restricted
(E)
Total Fundcol. D + E
(F)
% DiffColumnC & F
INTERFUND TRANSFERS
INTERFUND TRANSFERS IN
From: Special Reserve Fund 8912 0.00 0.00 0.00 0.00 0.00 0.00 0.0%
From: Bond Interest and Redemption Fund 8914 0.00 0.00 0.00 0.00 0.00 0.00 0.0%
Other Authorized Interfund Transfers In 8919 0.00 0.00 0.00 0.00 0.00 0.00 0.0%
(a) TOTAL, INTERFUND TRANSFERS IN 0.00 0.00 0.00 0.00 0.00 0.00 0.0%
INTERFUND TRANSFERS OUT
To: Child Development Fund 7611 0.00 0.00 0.00 0.00 0.00 0.00 0.0%
To: Special Reserve Fund 7612 0.00 0.00 0.00 0.00 0.00 0.00 0.0%
To: State School Building Fund/ County School Facilities Fund 7613 0.00 0.00 0.00 0.00 0.00 0.00 0.0%
To: Cafeteria Fund 7616 0.00 0.00 0.00 0.00 0.00 0.00 0.0%
Other Authorized Interfund Transfers Out 7619 0.00 0.00 0.00 0.00 0.00 0.00 0.0%
(b) TOTAL, INTERFUND TRANSFERS OUT 0.00 0.00 0.00 0.00 0.00 0.00 0.0%
OTHER SOURCES/USES
SOURCES State Apportionments Emergency Apportionments 8931 0.00 0.00 0.00 0.00 0.00 0.00 0.0%
Proceeds
Proceeds from Sale/Lease- Purchase of Land/Buildings 8953 0.00 0.00 0.00 0.00 0.00 0.00 0.0%
Other Sources
Transfers from Funds of Lapsed/Reorganized LEAs 8965 0.00 0.00 0.00 0.00 0.00 0.00 0.0%
Long-Term Debt Proceeds Proceeds from Certificates of Participation 8971 0.00 0.00 0.00 0.00 0.00 0.00 0.0%
Proceeds from Capital Leases 8972 0.00 0.00 0.00 0.00 0.00 0.00 0.0%
Proceeds from Lease Revenue Bonds 8973 0.00 0.00 0.00 0.00 0.00 0.00 0.0%
All Other Financing Sources 8979 0.00 0.00 0.00 0.00 0.00 0.00 0.0%

Manhattan Beach UnifiedLos Angeles County
July 1 BudgetGeneral Fund
Unrestricted and RestrictedExpenditures by Object
19 75333 0000000Form 01
California Dept of EducationSACS Financial Reporting Software - 2016.1.0File: fund-a (Rev 03/22/2016) Page 16 Printed: 6/10/2016 4:20 PM
2015-16 Estimated Actuals 2016-17 Budget
Description Resource CodesObjectCodes
Unrestricted(A)
Restricted(B)
Total Fundcol. A + B
(C)Unrestricted
(D)Restricted
(E)
Total Fundcol. D + E
(F)
% DiffColumnC & F
(c) TOTAL, SOURCES 0.00 0.00 0.00 0.00 0.00 0.00 0.0%
USES
Transfers of Funds from Lapsed/Reorganized LEAs 7651 0.00 0.00 0.00 0.00 0.00 0.00 0.0%
All Other Financing Uses 7699 0.00 0.00 0.00 0.00 0.00 0.00 0.0%
(d) TOTAL, USES 0.00 0.00 0.00 0.00 0.00 0.00 0.0%
CONTRIBUTIONS
Contributions from Unrestricted Revenues 8980 (14,513,210.00) 14,513,210.00 0.00 (15,374,317.00) 15,374,317.00 0.00 0.0%
Contributions from Restricted Revenues 8990 0.00 0.00 0.00 0.00 0.00 0.00 0.0%
(e) TOTAL, CONTRIBUTIONS (14,513,210.00) 14,513,210.00 0.00 (15,374,317.00) 15,374,317.00 0.00 0.0%
TOTAL, OTHER FINANCING SOURCES/USES (a - b + c - d + e) (14,513,210.00) 14,513,210.00 0.00 (15,374,317.00) 15,374,317.00 0.00 0.0%

Manhattan Beach UnifiedLos Angeles County
July 1 BudgetGeneral Fund
Unrestricted and RestrictedExpenditures by Function
19 75333 0000000Form 01
California Dept of EducationSACS Financial Reporting Software - 2016.1.0File: fund-a (Rev 04/02/2015) Page 1 Printed: 6/10/2016 4:20 PM
2015-16 Estimated Actuals 2016-17 Budget
Description Function CodesObjectCodes
Unrestricted(A)
Restricted(B)
Total Fundcol. A + B
(C)Unrestricted
(D)Restricted
(E)
Total Fundcol. D + E
(F)
% DiffColumnC & F
A. REVENUES
1) LCFF Sources 8010-8099 49,944,100.00 0.00 49,944,100.00 51,635,589.00 0.00 51,635,589.00 3.4%
2) Federal Revenue 8100-8299 2,419.00 1,791,317.00 1,793,736.00 0.00 1,718,799.00 1,718,799.00 -4.2%
3) Other State Revenue 8300-8599 4,803,666.00 4,462,222.00 9,265,888.00 2,790,534.00 6,314,175.00 9,104,709.00 -1.7%
4) Other Local Revenue 8600-8799 2,767,404.00 8,657,245.00 11,424,649.00 2,183,925.00 5,613,870.00 7,797,795.00 -31.7%
5) TOTAL, REVENUES 57,517,589.00 14,910,784.00 72,428,373.00 56,610,048.00 13,646,844.00 70,256,892.00 -3.0%
B. EXPENDITURES (Objects 1000-7999)
1) Instruction 1000-1999 29,283,764.00 19,005,849.00 48,289,613.00 28,850,574.00 20,045,821.00 48,896,395.00 1.3%
2) Instruction - Related Services 2000-2999 4,812,716.00 2,523,294.00 7,336,010.00 4,915,240.00 1,520,348.00 6,435,588.00 -12.3%
3) Pupil Services 3000-3999 968,375.00 3,783,230.00 4,751,605.00 991,767.00 3,518,752.00 4,510,519.00 -5.1%
4) Ancillary Services 4000-4999 339,583.00 14,926.00 354,509.00 359,733.00 0.00 359,733.00 1.5%
5) Community Services 5000-5999 0.00 0.00 0.00 0.00 0.00 0.00 0.0%
6) Enterprise 6000-6999 0.00 0.00 0.00 0.00 0.00 0.00 0.0%
7) General Administration 7000-7999 4,010,033.00 701,416.00 4,711,449.00 3,925,581.00 666,177.00 4,591,758.00 -2.5%
8) Plant Services 8000-8999 4,616,188.00 3,071,691.00 7,687,879.00 4,418,060.00 2,446,395.00 6,864,455.00 -10.7%
9) Other Outgo 9000-9999Except
7600-7699 1,277,993.00 941,150.00 2,219,143.00 1,114,283.00 823,668.00 1,937,951.00 -12.7%
10) TOTAL, EXPENDITURES 45,308,652.00 30,041,556.00 75,350,208.00 44,575,238.00 29,021,161.00 73,596,399.00 -2.3%
C. EXCESS (DEFICIENCY) OF REVENUES OVER EXPENDITURES BEFORE OTHER FINANCING SOURCES AND USES (A5 - B10) 12,208,937.00 (15,130,772.00) (2,921,835.00) 12,034,810.00 (15,374,317.00) (3,339,507.00) 14.3%
D. OTHER FINANCING SOURCES/USES 1) Interfund Transfers a) Transfers In 8900-8929 0.00 0.00 0.00 0.00 0.00 0.00 0.0%
b) Transfers Out 7600-7629 0.00 0.00 0.00 0.00 0.00 0.00 0.0%
2) Other Sources/Uses a) Sources 8930-8979 0.00 0.00 0.00 0.00 0.00 0.00 0.0%
b) Uses 7630-7699 0.00 0.00 0.00 0.00 0.00 0.00 0.0%
3) Contributions 8980-8999 (14,513,210.00) 14,513,210.00 0.00 (15,374,317.00) 15,374,317.00 0.00 0.0%
4) TOTAL, OTHER FINANCING SOURCES/USES (14,513,210.00) 14,513,210.00 0.00 (15,374,317.00) 15,374,317.00 0.00 0.0%

Manhattan Beach UnifiedLos Angeles County
July 1 BudgetGeneral Fund
Unrestricted and RestrictedExpenditures by Function
19 75333 0000000Form 01
California Dept of EducationSACS Financial Reporting Software - 2016.1.0File: fund-a (Rev 04/02/2015) Page 2 Printed: 6/10/2016 4:20 PM
2015-16 Estimated Actuals 2016-17 Budget
Description Function CodesObjectCodes
Unrestricted(A)
Restricted(B)
Total Fundcol. A + B
(C)Unrestricted
(D)Restricted
(E)
Total Fundcol. D + E
(F)
% DiffColumnC & F
E. NET INCREASE (DECREASE) IN FUND BALANCE (C + D4) (2,304,273.00) (617,562.00) (2,921,835.00) (3,339,507.00) 0.00 (3,339,507.00) 14.3%
F. FUND BALANCE, RESERVES 1) Beginning Fund Balance a) As of July 1 - Unaudited 9791 12,818,599.89 617,562.05 13,436,161.94 10,384,473.89 0.05 10,384,473.94 -22.7%
b) Audit Adjustments 9793 (129,853.00) 0.00 (129,853.00) 0.00 0.00 0.00 -100.0%
c) As of July 1 - Audited (F1a + F1b) 12,688,746.89 617,562.05 13,306,308.94 10,384,473.89 0.05 10,384,473.94 -22.0%
d) Other Restatements 9795 0.00 0.00 0.00 0.00 0.00 0.00 0.0%
e) Adjusted Beginning Balance (F1c + F1d) 12,688,746.89 617,562.05 13,306,308.94 10,384,473.89 0.05 10,384,473.94 -22.0%
2) Ending Balance, June 30 (E + F1e) 10,384,473.89 0.05 10,384,473.94 7,044,966.89 0.05 7,044,966.94 -32.2%
Components of Ending Fund Balance a) Nonspendable Revolving Cash 9711 10,000.00 0.00 10,000.00 10,000.00 0.00 10,000.00 0.0%
Stores 9712 20,000.00 0.00 20,000.00 20,000.00 0.00 20,000.00 0.0%
Prepaid Expenditures 9713 0.00 0.00 0.00 0.00 0.00 0.00 0.0%
All Others 9719 0.00 0.00 0.00 0.00 0.00 0.00 0.0%
b) Restricted 9740 0.00 0.42 0.42 0.00 0.42 0.42 0.0%
c) Committed Stabilization Arrangements 9750 0.00 0.00 0.00 0.00 0.00 0.00 0.0%
Other Commitments (by Resource/Object) 9760 0.00 0.00 0.00 0.00 0.00 0.00 0.0%
d) Assigned
Other Assignments (by Resource/Object) 9780 1,500,000.00 0.00 1,500,000.00 1,695,000.00 0.00 1,695,000.00 13.0%Escrow account 0000 9780 1,695,000.00 1,695,000.00Escrow Account 0000 9780 1,500,000.00 1,500,000.00
e) Unassigned/unappropriated
Reserve for Economic Uncertainties 9789 3,767,510.00 0.00 3,767,510.00 3,679,820.00 0.00 3,679,820.00 -2.3%
Unassigned/Unappropriated Amount 9790 5,086,963.89 (0.37) 5,086,963.52 1,640,146.89 (0.37) 1,640,146.52 -67.8%

Manhattan Beach UnifiedLos Angeles County
July 1 BudgetGeneral Fund
Exhibit: Restricted Balance Detail19 75333 0000000
Form 01
California Dept of EducationSACS Financial Reporting Software - 2016.1.0File: fund-a (Rev 04/06/2011) Page 1 Printed: 6/10/2016 4:20 PM
2015-16 2016-17Resource Description Estimated Actuals Budget
6230 California Clean Energy Jobs Act 0.42 0.42
Total, Restricted Balance 0.42 0.42

This Page is Blank.
Manhattan Beach UnifiedLos Angeles County
July 1 BudgetCafeteria Special Revenue Fund
Expenditures by Object19 75333 0000000
Form 13
California Dept of EducationSACS Financial Reporting Software - 2016.1.0File: fund-b (Rev 03/08/2016) Page 1 Printed: 6/10/2016 4:20 PM
Description Resource Codes Object Codes2015-16
Estimated Actuals2016-17Budget
PercentDifference
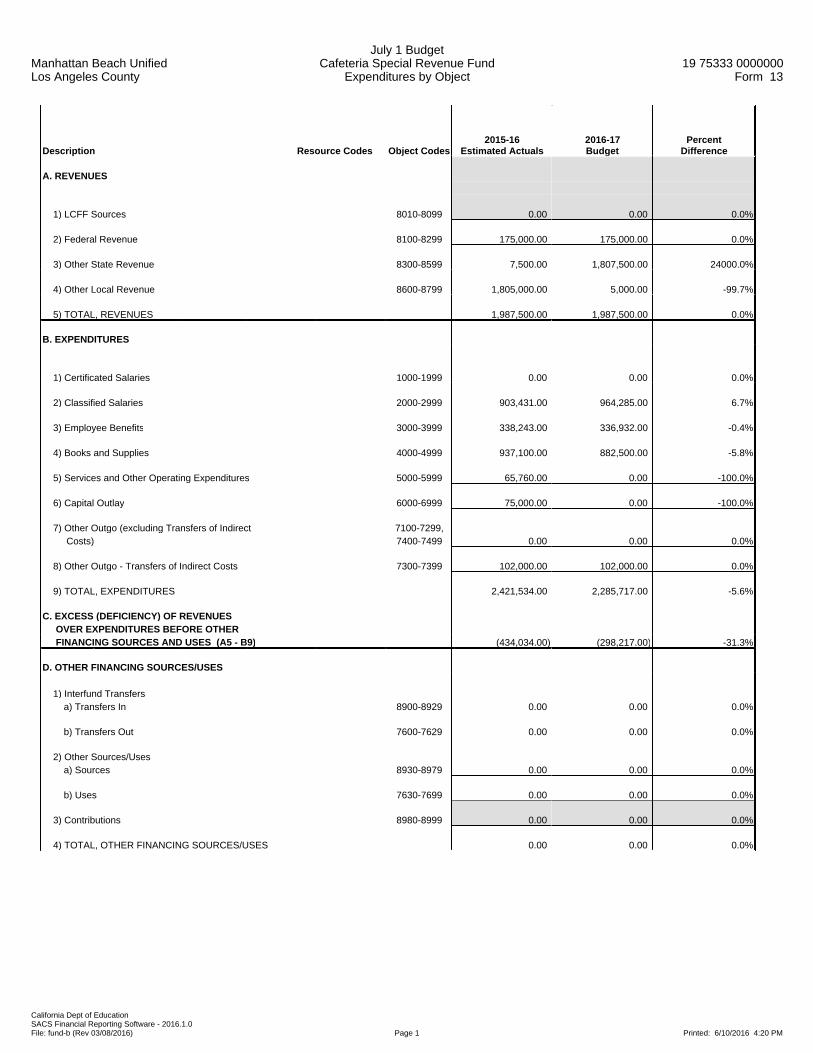
A. REVENUES
1) LCFF Sources 8010-8099 0.00 0.00 0.0%
2) Federal Revenue 8100-8299 175,000.00 175,000.00 0.0%
3) Other State Revenue 8300-8599 7,500.00 1,807,500.00 24000.0%
4) Other Local Revenue 8600-8799 1,805,000.00 5,000.00 -99.7%
5) TOTAL, REVENUES 1,987,500.00 1,987,500.00 0.0%
B. EXPENDITURES
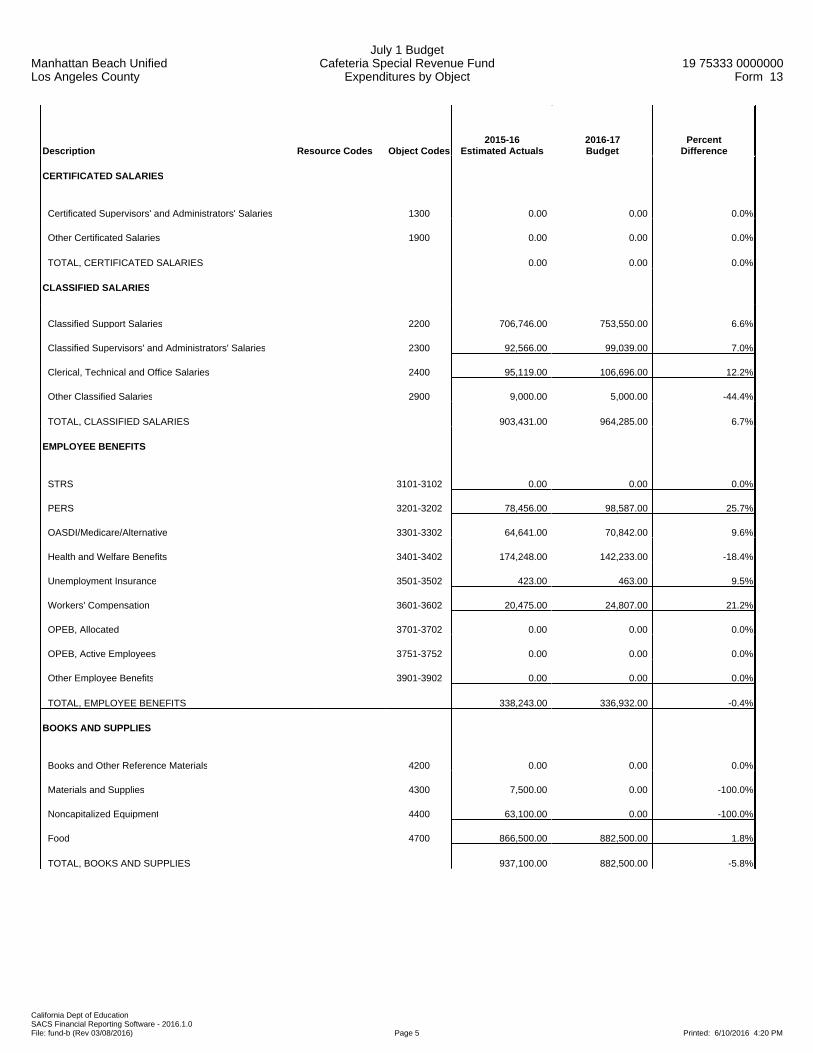
1) Certificated Salaries 1000-1999 0.00 0.00 0.0%
2) Classified Salaries 2000-2999 903,431.00 964,285.00 6.7%
3) Employee Benefits 3000-3999 338,243.00 336,932.00 -0.4%
4) Books and Supplies 4000-4999 937,100.00 882,500.00 -5.8%
5) Services and Other Operating Expenditures 5000-5999 65,760.00 0.00 -100.0%
6) Capital Outlay 6000-6999 75,000.00 0.00 -100.0%
7) Other Outgo (excluding Transfers of Indirect 7100-7299, Costs) 7400-7499 0.00 0.00 0.0%
8) Other Outgo - Transfers of Indirect Costs 7300-7399 102,000.00 102,000.00 0.0%
9) TOTAL, EXPENDITURES 2,421,534.00 2,285,717.00 -5.6%
C. EXCESS (DEFICIENCY) OF REVENUES OVER EXPENDITURES BEFORE OTHER FINANCING SOURCES AND USES (A5 - B9) (434,034.00) (298,217.00) -31.3%
D. OTHER FINANCING SOURCES/USES 1) Interfund Transfers a) Transfers In 8900-8929 0.00 0.00 0.0%
b) Transfers Out 7600-7629 0.00 0.00 0.0%
2) Other Sources/Uses a) Sources 8930-8979 0.00 0.00 0.0%
b) Uses 7630-7699 0.00 0.00 0.0%
3) Contributions 8980-8999 0.00 0.00 0.0%
4) TOTAL, OTHER FINANCING SOURCES/USES 0.00 0.00 0.0%

Manhattan Beach UnifiedLos Angeles County
July 1 BudgetCafeteria Special Revenue Fund
Expenditures by Object19 75333 0000000
Form 13
California Dept of EducationSACS Financial Reporting Software - 2016.1.0File: fund-b (Rev 03/08/2016) Page 2 Printed: 6/10/2016 4:20 PM
Description Resource Codes Object Codes2015-16
Estimated Actuals2016-17Budget
PercentDifference
E. NET INCREASE (DECREASE) IN FUND BALANCE (C + D4) (434,034.00) (298,217.00) -31.3%
F. FUND BALANCE, RESERVES 1) Beginning Fund Balance a) As of July 1 - Unaudited 9791 1,614,380.36 1,180,346.36 -26.9%
b) Audit Adjustments 9793 0.00 0.00 0.0%
c) As of July 1 - Audited (F1a + F1b) 1,614,380.36 1,180,346.36 -26.9%
d) Other Restatements 9795 0.00 0.00 0.0%
e) Adjusted Beginning Balance (F1c + F1d) 1,614,380.36 1,180,346.36 -26.9%
2) Ending Balance, June 30 (E + F1e) 1,180,346.36 882,129.36 -25.3% Components of Ending Fund Balance a) Nonspendable Revolving Cash 9711 0.00 0.00 0.0%
Stores 9712 0.00 0.00 0.0%
Prepaid Expenditures 9713 0.00 0.00 0.0%
All Others 9719 0.00 0.00 0.0%
b) Restricted 9740 0.00 0.00 0.0%
c) Committed Stabilization Arrangements 9750 0.00 0.00 0.0%
Other Commitments 9760 0.00 0.00 0.0%
d) Assigned Other Assignments 9780 1,180,346.36 882,129.36 -25.3%
e) Unassigned/Unappropriated Reserve for Economic Uncertainties 9789 0.00 0.00 0.0%
Unassigned/Unappropriated Amount 9790 0.00 0.00 0.0%
Manhattan Beach UnifiedLos Angeles County
July 1 BudgetCafeteria Special Revenue Fund
Expenditures by Object19 75333 0000000
Form 13
California Dept of EducationSACS Financial Reporting Software - 2016.1.0File: fund-b (Rev 03/08/2016) Page 3 Printed: 6/10/2016 4:20 PM
Description Resource Codes Object Codes2015-16
Estimated Actuals2016-17Budget
PercentDifference
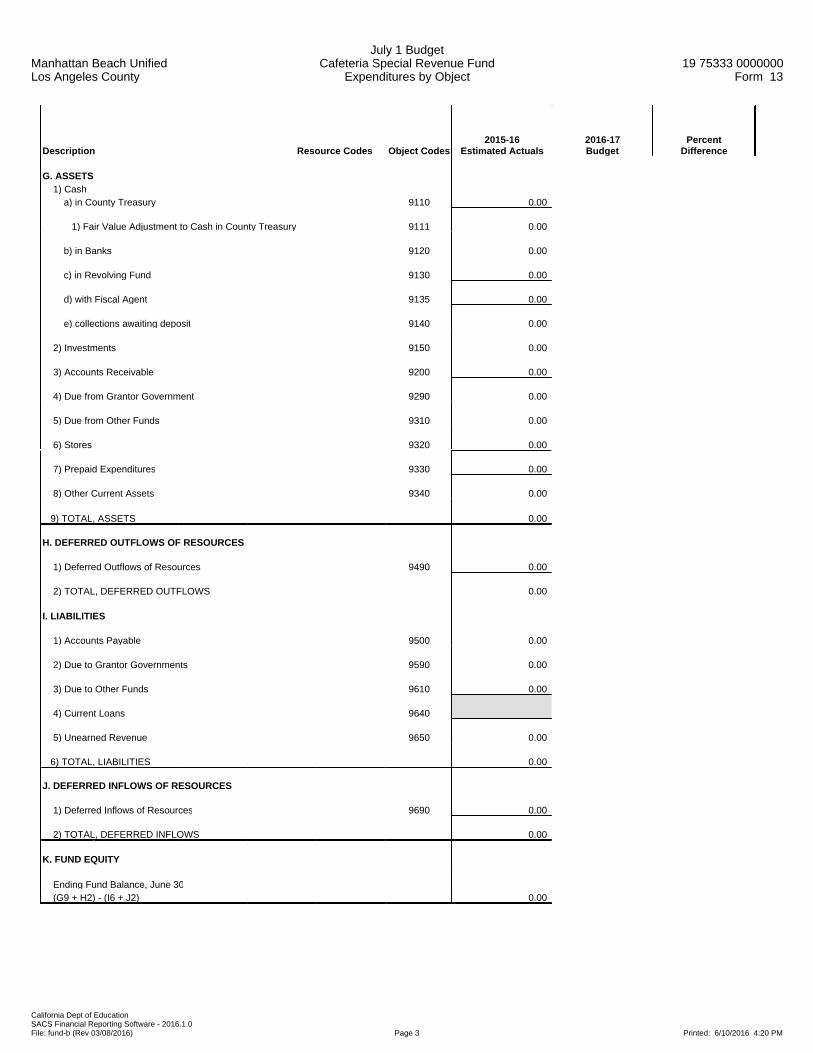
G. ASSETS 1) Cash a) in County Treasury 9110 0.00
1) Fair Value Adjustment to Cash in County Treasury 9111 0.00
b) in Banks 9120 0.00
c) in Revolving Fund 9130 0.00
d) with Fiscal Agent 9135 0.00
e) collections awaiting deposit 9140 0.00
2) Investments 9150 0.00
3) Accounts Receivable 9200 0.00
4) Due from Grantor Government 9290 0.00
5) Due from Other Funds 9310 0.00
6) Stores 9320 0.00
7) Prepaid Expenditures 9330 0.00
8) Other Current Assets 9340 0.00
9) TOTAL, ASSETS 0.00
H. DEFERRED OUTFLOWS OF RESOURCES
1) Deferred Outflows of Resources 9490 0.00
2) TOTAL, DEFERRED OUTFLOWS 0.00
I. LIABILITIES
1) Accounts Payable 9500 0.00
2) Due to Grantor Governments 9590 0.00
3) Due to Other Funds 9610 0.00
4) Current Loans 9640
5) Unearned Revenue 9650 0.00
6) TOTAL, LIABILITIES 0.00
J. DEFERRED INFLOWS OF RESOURCES
1) Deferred Inflows of Resources 9690 0.00
2) TOTAL, DEFERRED INFLOWS 0.00
K. FUND EQUITY
Ending Fund Balance, June 30 (G9 + H2) - (I6 + J2) 0.00
Manhattan Beach UnifiedLos Angeles County
July 1 BudgetCafeteria Special Revenue Fund
Expenditures by Object19 75333 0000000
Form 13
California Dept of EducationSACS Financial Reporting Software - 2016.1.0File: fund-b (Rev 03/08/2016) Page 4 Printed: 6/10/2016 4:20 PM
Description Resource Codes Object Codes2015-16
Estimated Actuals2016-17Budget
PercentDifference
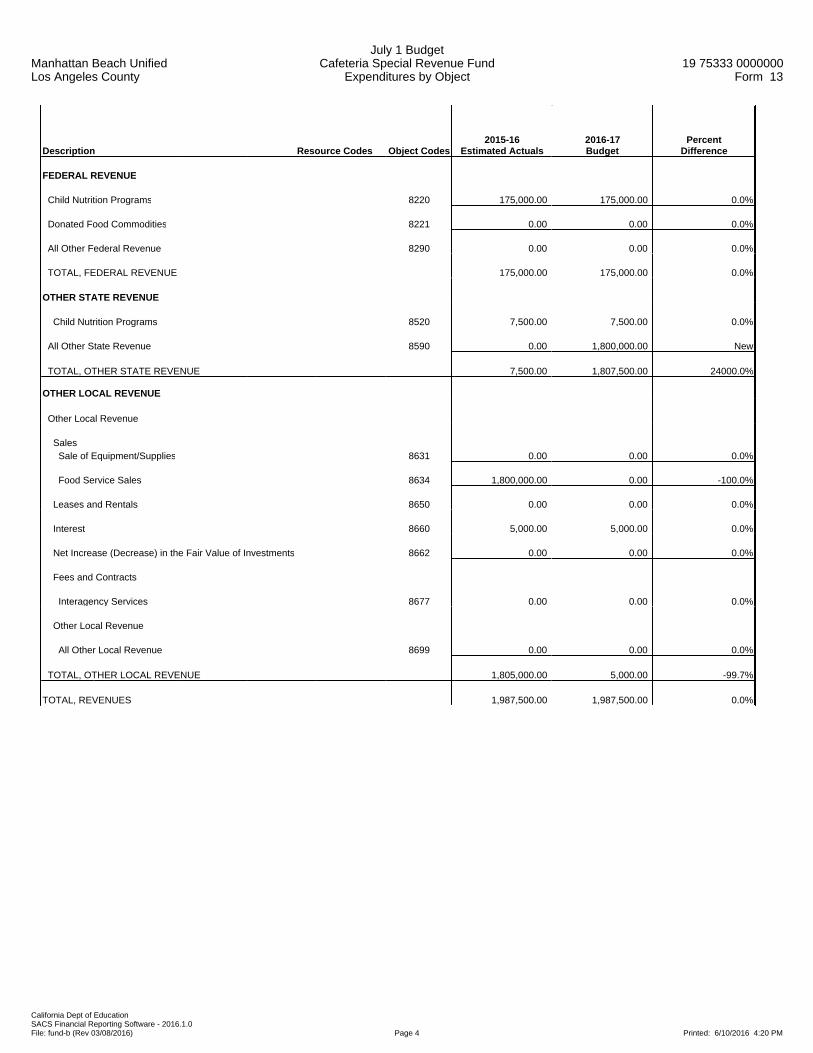
FEDERAL REVENUE
Child Nutrition Programs 8220 175,000.00 175,000.00 0.0%
Donated Food Commodities 8221 0.00 0.00 0.0%
All Other Federal Revenue 8290 0.00 0.00 0.0%
TOTAL, FEDERAL REVENUE 175,000.00 175,000.00 0.0%
OTHER STATE REVENUE
Child Nutrition Programs 8520 7,500.00 7,500.00 0.0%
All Other State Revenue 8590 0.00 1,800,000.00 New
TOTAL, OTHER STATE REVENUE 7,500.00 1,807,500.00 24000.0%
OTHER LOCAL REVENUE
Other Local Revenue
Sales Sale of Equipment/Supplies 8631 0.00 0.00 0.0%
Food Service Sales 8634 1,800,000.00 0.00 -100.0%
Leases and Rentals 8650 0.00 0.00 0.0%
Interest 8660 5,000.00 5,000.00 0.0%
Net Increase (Decrease) in the Fair Value of Investments 8662 0.00 0.00 0.0%
Fees and Contracts
Interagency Services 8677 0.00 0.00 0.0%
Other Local Revenue
All Other Local Revenue 8699 0.00 0.00 0.0%
TOTAL, OTHER LOCAL REVENUE 1,805,000.00 5,000.00 -99.7%
TOTAL, REVENUES 1,987,500.00 1,987,500.00 0.0%
Manhattan Beach UnifiedLos Angeles County
July 1 BudgetCafeteria Special Revenue Fund
Expenditures by Object19 75333 0000000
Form 13
California Dept of EducationSACS Financial Reporting Software - 2016.1.0File: fund-b (Rev 03/08/2016) Page 5 Printed: 6/10/2016 4:20 PM
Description Resource Codes Object Codes2015-16
Estimated Actuals2016-17Budget
PercentDifference
CERTIFICATED SALARIES
Certificated Supervisors' and Administrators' Salaries 1300 0.00 0.00 0.0%
Other Certificated Salaries 1900 0.00 0.00 0.0%
TOTAL, CERTIFICATED SALARIES 0.00 0.00 0.0%
CLASSIFIED SALARIES
Classified Support Salaries 2200 706,746.00 753,550.00 6.6%
Classified Supervisors' and Administrators' Salaries 2300 92,566.00 99,039.00 7.0%
Clerical, Technical and Office Salaries 2400 95,119.00 106,696.00 12.2%
Other Classified Salaries 2900 9,000.00 5,000.00 -44.4%
TOTAL, CLASSIFIED SALARIES 903,431.00 964,285.00 6.7%
EMPLOYEE BENEFITS
STRS 3101-3102 0.00 0.00 0.0%
PERS 3201-3202 78,456.00 98,587.00 25.7%
OASDI/Medicare/Alternative 3301-3302 64,641.00 70,842.00 9.6%
Health and Welfare Benefits 3401-3402 174,248.00 142,233.00 -18.4%
Unemployment Insurance 3501-3502 423.00 463.00 9.5%
Workers' Compensation 3601-3602 20,475.00 24,807.00 21.2%
OPEB, Allocated 3701-3702 0.00 0.00 0.0%
OPEB, Active Employees 3751-3752 0.00 0.00 0.0%
Other Employee Benefits 3901-3902 0.00 0.00 0.0%
TOTAL, EMPLOYEE BENEFITS 338,243.00 336,932.00 -0.4%
BOOKS AND SUPPLIES
Books and Other Reference Materials 4200 0.00 0.00 0.0%
Materials and Supplies 4300 7,500.00 0.00 -100.0%
Noncapitalized Equipment 4400 63,100.00 0.00 -100.0%
Food 4700 866,500.00 882,500.00 1.8%
TOTAL, BOOKS AND SUPPLIES 937,100.00 882,500.00 -5.8%

Manhattan Beach UnifiedLos Angeles County
July 1 BudgetCafeteria Special Revenue Fund
Expenditures by Object19 75333 0000000
Form 13
California Dept of EducationSACS Financial Reporting Software - 2016.1.0File: fund-b (Rev 03/08/2016) Page 6 Printed: 6/10/2016 4:20 PM
Description Resource Codes Object Codes2015-16
Estimated Actuals2016-17Budget
PercentDifference
SERVICES AND OTHER OPERATING EXPENDITURES
Subagreements for Services 5100 0.00 0.00 0.0%
Travel and Conferences 5200 2,000.00 0.00 -100.0%
Dues and Memberships 5300 0.00 0.00 0.0%
Insurance 5400-5450 0.00 0.00 0.0%
Operations and Housekeeping Services 5500 0.00 0.00 0.0%
Rentals, Leases, Repairs, and Noncapitalized Improvements 5600 38,000.00 0.00 -100.0%
Transfers of Direct Costs 5710 0.00 0.00 0.0%
Transfers of Direct Costs - Interfund 5750 0.00 0.00 0.0%
Professional/Consulting Services and Operating Expenditures 5800 25,760.00 0.00 -100.0%
Communications 5900 0.00 0.00 0.0%
TOTAL, SERVICES AND OTHER OPERATING EXPENDITURES 65,760.00 0.00 -100.0%
CAPITAL OUTLAY
Buildings and Improvements of Buildings 6200 0.00 0.00 0.0%
Equipment 6400 75,000.00 0.00 -100.0%
Equipment Replacement 6500 0.00 0.00 0.0%
TOTAL, CAPITAL OUTLAY 75,000.00 0.00 -100.0%
OTHER OUTGO (excluding Transfers of Indirect Costs)
Debt Service
Debt Service - Interest 7438 0.00 0.00 0.0%
Other Debt Service - Principal 7439 0.00 0.00 0.0%
TOTAL, OTHER OUTGO (excluding Transfers of Indirect Costs) 0.00 0.00 0.0%
OTHER OUTGO - TRANSFERS OF INDIRECT COSTS
Transfers of Indirect Costs - Interfund 7350 102,000.00 102,000.00 0.0%
TOTAL, OTHER OUTGO - TRANSFERS OF INDIRECT COSTS 102,000.00 102,000.00 0.0%
TOTAL, EXPENDITURES 2,421,534.00 2,285,717.00 -5.6%

Manhattan Beach UnifiedLos Angeles County
July 1 BudgetCafeteria Special Revenue Fund
Expenditures by Object19 75333 0000000
Form 13
California Dept of EducationSACS Financial Reporting Software - 2016.1.0File: fund-b (Rev 03/08/2016) Page 7 Printed: 6/10/2016 4:20 PM
Description Resource Codes Object Codes2015-16
Estimated Actuals2016-17Budget
PercentDifference
INTERFUND TRANSFERS
INTERFUND TRANSFERS IN
From: General Fund 8916 0.00 0.00 0.0%
Other Authorized Interfund Transfers In 8919 0.00 0.00 0.0%
(a) TOTAL, INTERFUND TRANSFERS IN 0.00 0.00 0.0%
INTERFUND TRANSFERS OUT
Other Authorized Interfund Transfers Out 7619 0.00 0.00 0.0%
(b) TOTAL, INTERFUND TRANSFERS OUT 0.00 0.00 0.0%
OTHER SOURCES/USES
SOURCES
Other Sources
Transfers from Funds of Lapsed/Reorganized LEAs 8965 0.00 0.00 0.0%
Long-Term Debt Proceeds
Proceeds from Capital Leases 8972 0.00 0.00 0.0%
All Other Financing Sources 8979 0.00 0.00 0.0%
(c) TOTAL, SOURCES 0.00 0.00 0.0%
USES
Transfers of Funds from Lapsed/Reorganized LEAs 7651 0.00 0.00 0.0%
All Other Financing Uses 7699 0.00 0.00 0.0%
(d) TOTAL, USES 0.00 0.00 0.0%
CONTRIBUTIONS
Contributions from Unrestricted Revenues 8980 0.00 0.00 0.0%
Contributions from Restricted Revenues 8990 0.00 0.00 0.0%
(e) TOTAL, CONTRIBUTIONS 0.00 0.00 0.0%
TOTAL, OTHER FINANCING SOURCES/USES (a - b + c - d + e) 0.00 0.00 0.0%

Manhattan Beach UnifiedLos Angeles County
July 1 BudgetCafeteria Special Revenue Fund
Expenditures by Function19 75333 0000000
Form 13
California Dept of EducationSACS Financial Reporting Software - 2016.1.0File: fund-b (Rev 03/08/2016) Page 1 Printed: 6/10/2016 4:20 PM
Description Function Codes Object Codes2015-16
Estimated Actuals2016-17Budget
PercentDifference
A. REVENUES
1) LCFF Sources 8010-8099 0.00 0.00 0.0%
2) Federal Revenue 8100-8299 175,000.00 175,000.00 0.0%
3) Other State Revenue 8300-8599 7,500.00 1,807,500.00 24000.0%
4) Other Local Revenue 8600-8799 1,805,000.00 5,000.00 -99.7%
5) TOTAL, REVENUES 1,987,500.00 1,987,500.00 0.0%
B. EXPENDITURES (Objects 1000-7999)
1) Instruction 1000-1999 0.00 0.00 0.0%
2) Instruction - Related Services 2000-2999 0.00 0.00 0.0%
3) Pupil Services 3000-3999 2,319,534.00 2,183,717.00 -5.9%
4) Ancillary Services 4000-4999 0.00 0.00 0.0%
5) Community Services 5000-5999 0.00 0.00 0.0%
6) Enterprise 6000-6999 0.00 0.00 0.0%
7) General Administration 7000-7999 102,000.00 102,000.00 0.0%
8) Plant Services 8000-8999 0.00 0.00 0.0%
9) Other Outgo 9000-9999Except
7600-7699 0.00 0.00 0.0%
10) TOTAL, EXPENDITURES 2,421,534.00 2,285,717.00 -5.6%
C. EXCESS (DEFICIENCY) OF REVENUES OVER EXPENDITURES BEFORE OTHER FINANCING SOURCES AND USES (A5 - B10) (434,034.00) (298,217.00) -31.3%
D. OTHER FINANCING SOURCES/USES 1) Interfund Transfers a) Transfers In 8900-8929 0.00 0.00 0.0%
b) Transfers Out 7600-7629 0.00 0.00 0.0%
2) Other Sources/Uses a) Sources 8930-8979 0.00 0.00 0.0%
b) Uses 7630-7699 0.00 0.00 0.0%
3) Contributions 8980-8999 0.00 0.00 0.0%
4) TOTAL, OTHER FINANCING SOURCES/USES 0.00 0.00 0.0%

Manhattan Beach UnifiedLos Angeles County
July 1 BudgetCafeteria Special Revenue Fund
Expenditures by Function19 75333 0000000
Form 13
California Dept of EducationSACS Financial Reporting Software - 2016.1.0File: fund-b (Rev 03/08/2016) Page 2 Printed: 6/10/2016 4:20 PM
Description Function Codes Object Codes2015-16
Estimated Actuals2016-17Budget
PercentDifference
E. NET INCREASE (DECREASE) IN FUND BALANCE (C + D4) (434,034.00) (298,217.00) -31.3%
F. FUND BALANCE, RESERVES 1) Beginning Fund Balance
a) As of July 1 - Unaudited 9791 1,614,380.36 1,180,346.36 -26.9%
b) Audit Adjustments 9793 0.00 0.00 0.0%
c) As of July 1 - Audited (F1a + F1b) 1,614,380.36 1,180,346.36 -26.9%
d) Other Restatements 9795 0.00 0.00 0.0%
e) Adjusted Beginning Balance (F1c + F1d) 1,614,380.36 1,180,346.36 -26.9%
2) Ending Balance, June 30 (E + F1e) 1,180,346.36 882,129.36 -25.3%
Components of Ending Fund Balance a) Nonspendable Revolving Cash 9711 0.00 0.00 0.0%
Stores 9712 0.00 0.00 0.0%
Prepaid Expenditures 9713 0.00 0.00 0.0%
All Others 9719 0.00 0.00 0.0%
b) Restricted 9740 0.00 0.00 0.0%
c) Committed Stabilization Arrangements 9750 0.00 0.00 0.0%
Other Commitments (by Resource/Object) 9760 0.00 0.00 0.0%
d) Assigned Other Assignments (by Resource/Object) 9780 1,180,346.36 882,129.36 -25.3%
e) Unassigned/Unappropriated Reserve for Economic Uncertainties 9789 0.00 0.00 0.0%
Unassigned/Unappropriated Amount 9790 0.00 0.00 0.0%

Manhattan Beach UnifiedLos Angeles County
July 1 BudgetCafeteria Special Revenue FundExhibit: Restricted Balance Detail
19 75333 0000000Form 13
California Dept of EducationSACS Financial Reporting Software - 2016.1.0File: fund-b (Rev 11/14/2012) Page 1 Printed: 6/10/2016 4:20 PM
2015-16 2016-17Resource Description Estimated Actuals Budget
Total, Restricted Balance 0.00 0.00

Manhattan Beach UnifiedLos Angeles County
July 1 BudgetDeferred Maintenance Fund
Expenditures by Object19 75333 0000000
Form 14
California Dept of EducationSACS Financial Reporting Software - 2016.1.0File: fund-b (Rev 03/08/2016) Page 1 Printed: 6/10/2016 4:20 PM
Description Resource Codes Object Codes2015-16
Estimated Actuals2016-17Budget
PercentDifference
A. REVENUES
1) LCFF Sources 8010-8099 0.00 0.00 0.0%
2) Federal Revenue 8100-8299 0.00 0.00 0.0%
3) Other State Revenue 8300-8599 0.00 0.00 0.0%
4) Other Local Revenue 8600-8799 490.00 10.00 -98.0%
5) TOTAL, REVENUES 490.00 10.00 -98.0%
B. EXPENDITURES
1) Certificated Salaries 1000-1999 0.00 0.00 0.0%
2) Classified Salaries 2000-2999 0.00 0.00 0.0%
3) Employee Benefits 3000-3999 0.00 0.00 0.0%
4) Books and Supplies 4000-4999 0.00 0.00 0.0%
5) Services and Other Operating Expenditures 5000-5999 5,000.00 5,000.00 0.0%
6) Capital Outlay 6000-6999 0.00 0.00 0.0%
7) Other Outgo (excluding Transfers of Indirect 7100-7299, Costs) 7400-7499 0.00 0.00 0.0%
8) Other Outgo - Transfers of Indirect Costs 7300-7399 0.00 0.00 0.0%
9) TOTAL, EXPENDITURES 5,000.00 5,000.00 0.0%
C. EXCESS (DEFICIENCY) OF REVENUES OVER EXPENDITURES BEFORE OTHER FINANCING SOURCES AND USES (A5 - B9) (4,510.00) (4,990.00) 10.6%
D. OTHER FINANCING SOURCES/USES 1) Interfund Transfers a) Transfers In 8900-8929 0.00 0.00 0.0%
b) Transfers Out 7600-7629 0.00 0.00 0.0%
2) Other Sources/Uses a) Sources 8930-8979 0.00 0.00 0.0%
b) Uses 7630-7699 0.00 0.00 0.0%
3) Contributions 8980-8999 0.00 0.00 0.0%
4) TOTAL, OTHER FINANCING SOURCES/USES 0.00 0.00 0.0%

Manhattan Beach UnifiedLos Angeles County
July 1 BudgetDeferred Maintenance Fund
Expenditures by Object19 75333 0000000
Form 14
California Dept of EducationSACS Financial Reporting Software - 2016.1.0File: fund-b (Rev 03/08/2016) Page 2 Printed: 6/10/2016 4:20 PM
Description Resource Codes Object Codes2015-16
Estimated Actuals2016-17Budget
PercentDifference
E. NET INCREASE (DECREASE) IN FUND BALANCE (C + D4) (4,510.00) (4,990.00) 10.6%
F. FUND BALANCE, RESERVES 1) Beginning Fund Balance a) As of July 1 - Unaudited 9791 88,658.53 84,148.53 -5.1%
b) Audit Adjustments 9793 0.00 0.00 0.0%
c) As of July 1 - Audited (F1a + F1b) 88,658.53 84,148.53 -5.1%
d) Other Restatements 9795 0.00 0.00 0.0%
e) Adjusted Beginning Balance (F1c + F1d) 88,658.53 84,148.53 -5.1%
2) Ending Balance, June 30 (E + F1e) 84,148.53 79,158.53 -5.9% Components of Ending Fund Balance a) Nonspendable Revolving Cash 9711 0.00 0.00 0.0%
Stores 9712 0.00 0.00 0.0%
Prepaid Expenditures 9713 0.00 0.00 0.0%
All Others 9719 0.00 0.00 0.0%
b) Restricted 9740 0.00 0.00 0.0%
c) Committed Stabilization Arrangements 9750 0.00 0.00 0.0%
Other Commitments 9760 0.00 0.00 0.0%
d) Assigned Other Assignments 9780 84,148.53 79,158.53 -5.9%
e) Unassigned/Unappropriated Reserve for Economic Uncertainties 9789 0.00 0.00 0.0%
Unassigned/Unappropriated Amount 9790 0.00 0.00 0.0%

Manhattan Beach UnifiedLos Angeles County
July 1 BudgetDeferred Maintenance Fund
Expenditures by Object19 75333 0000000
Form 14
California Dept of EducationSACS Financial Reporting Software - 2016.1.0File: fund-b (Rev 03/08/2016) Page 3 Printed: 6/10/2016 4:20 PM
Description Resource Codes Object Codes2015-16
Estimated Actuals2016-17Budget
PercentDifference
G. ASSETS 1) Cash a) in County Treasury 9110 0.00
1) Fair Value Adjustment to Cash in County Treasury 9111 0.00
b) in Banks 9120 0.00
c) in Revolving Fund 9130 0.00
d) with Fiscal Agent 9135 0.00
e) collections awaiting deposit 9140 0.00
2) Investments 9150 0.00
3) Accounts Receivable 9200 0.00
4) Due from Grantor Government 9290 0.00
5) Due from Other Funds 9310 0.00
6) Stores 9320 0.00
7) Prepaid Expenditures 9330 0.00
8) Other Current Assets 9340 0.00
9) TOTAL, ASSETS 0.00
H. DEFERRED OUTFLOWS OF RESOURCES
1) Deferred Outflows of Resources 9490 0.00
2) TOTAL, DEFERRED OUTFLOWS 0.00
I. LIABILITIES
1) Accounts Payable 9500 0.00
2) Due to Grantor Governments 9590 0.00
3) Due to Other Funds 9610 0.00
4) Current Loans 9640
5) Unearned Revenue 9650 0.00
6) TOTAL, LIABILITIES 0.00
J. DEFERRED INFLOWS OF RESOURCES
1) Deferred Inflows of Resources 9690 0.00
2) TOTAL, DEFERRED INFLOWS 0.00
K. FUND EQUITY
Ending Fund Balance, June 30 (G9 + H2) - (I6 + J2) 0.00

Manhattan Beach UnifiedLos Angeles County
July 1 BudgetDeferred Maintenance Fund
Expenditures by Object19 75333 0000000
Form 14
California Dept of EducationSACS Financial Reporting Software - 2016.1.0File: fund-b (Rev 03/08/2016) Page 4 Printed: 6/10/2016 4:20 PM
Description Resource Codes Object Codes2015-16
Estimated Actuals2016-17Budget
PercentDifference
LCFF SOURCES
LCFF Transfers
LCFF Transfers - Current Year 8091 0.00 0.00 0.0%
LCFF/Revenue Limit Transfers - Prior Years 8099 0.00 0.00 0.0%
TOTAL, LCFF SOURCES 0.00 0.00 0.0%
OTHER STATE REVENUE
All Other State Revenue 8590 0.00 0.00 0.0%
TOTAL, OTHER STATE REVENUE 0.00 0.00 0.0%
OTHER LOCAL REVENUE
Other Local Revenue
Community Redevelopment Funds Not Subject to LCFF Deduction 8625 0.00 0.00 0.0%
Sales Sale of Equipment/Supplies 8631 0.00 0.00 0.0%
Interest 8660 490.00 10.00 -98.0%
Net Increase (Decrease) in the Fair Value of Investments 8662 0.00 0.00 0.0%
Other Local Revenue
All Other Local Revenue 8699 0.00 0.00 0.0%
All Other Transfers In from All Others 8799 0.00 0.00 0.0%
TOTAL, OTHER LOCAL REVENUE 490.00 10.00 -98.0%
TOTAL, REVENUES 490.00 10.00 -98.0%

Manhattan Beach UnifiedLos Angeles County
July 1 BudgetDeferred Maintenance Fund
Expenditures by Object19 75333 0000000
Form 14
California Dept of EducationSACS Financial Reporting Software - 2016.1.0File: fund-b (Rev 03/08/2016) Page 5 Printed: 6/10/2016 4:20 PM
Description Resource Codes Object Codes2015-16
Estimated Actuals2016-17Budget
PercentDifference
CLASSIFIED SALARIES
Classified Support Salaries 2200 0.00 0.00 0.0%
Other Classified Salaries 2900 0.00 0.00 0.0%
TOTAL, CLASSIFIED SALARIES 0.00 0.00 0.0%
EMPLOYEE BENEFITS
STRS 3101-3102 0.00 0.00 0.0%
PERS 3201-3202 0.00 0.00 0.0%
OASDI/Medicare/Alternative 3301-3302 0.00 0.00 0.0%
Health and Welfare Benefits 3401-3402 0.00 0.00 0.0%
Unemployment Insurance 3501-3502 0.00 0.00 0.0%
Workers' Compensation 3601-3602 0.00 0.00 0.0%
OPEB, Allocated 3701-3702 0.00 0.00 0.0%
OPEB, Active Employees 3751-3752 0.00 0.00 0.0%
Other Employee Benefits 3901-3902 0.00 0.00 0.0%
TOTAL, EMPLOYEE BENEFITS 0.00 0.00 0.0%
BOOKS AND SUPPLIES
Books and Other Reference Materials 4200 0.00 0.00 0.0%
Materials and Supplies 4300 0.00 0.00 0.0%
Noncapitalized Equipment 4400 0.00 0.00 0.0%
TOTAL, BOOKS AND SUPPLIES 0.00 0.00 0.0%

Manhattan Beach UnifiedLos Angeles County
July 1 BudgetDeferred Maintenance Fund
Expenditures by Object19 75333 0000000
Form 14
California Dept of EducationSACS Financial Reporting Software - 2016.1.0File: fund-b (Rev 03/08/2016) Page 6 Printed: 6/10/2016 4:20 PM
Description Resource Codes Object Codes2015-16
Estimated Actuals2016-17Budget
PercentDifference
SERVICES AND OTHER OPERATING EXPENDITURES
Subagreements for Services 5100 0.00 0.00 0.0%
Travel and Conferences 5200 0.00 0.00 0.0%
Rentals, Leases, Repairs, and Noncapitalized Improvements 5600 5,000.00 5,000.00 0.0%
Transfers of Direct Costs 5710 0.00 0.00 0.0%
Transfers of Direct Costs - Interfund 5750 0.00 0.00 0.0%
Professional/Consulting Services and Operating Expenditures 5800 0.00 0.00 0.0%
TOTAL, SERVICES AND OTHER OPERATING EXPENDITURES 5,000.00 5,000.00 0.0%
CAPITAL OUTLAY
Land Improvements 6170 0.00 0.00 0.0%
Buildings and Improvements of Buildings 6200 0.00 0.00 0.0%
Equipment 6400 0.00 0.00 0.0%
Equipment Replacement 6500 0.00 0.00 0.0%
TOTAL, CAPITAL OUTLAY 0.00 0.00 0.0%
OTHER OUTGO (excluding Transfers of Indirect Costs)
Debt Service
Debt Service - Interest 7438 0.00 0.00 0.0%
Other Debt Service - Principal 7439 0.00 0.00 0.0%
TOTAL, OTHER OUTGO (excluding Transfers of Indirect Costs) 0.00 0.00 0.0%
TOTAL, EXPENDITURES 5,000.00 5,000.00 0.0%

Manhattan Beach UnifiedLos Angeles County
July 1 BudgetDeferred Maintenance Fund
Expenditures by Object19 75333 0000000
Form 14
California Dept of EducationSACS Financial Reporting Software - 2016.1.0File: fund-b (Rev 03/08/2016) Page 7 Printed: 6/10/2016 4:20 PM
Description Resource Codes Object Codes2015-16
Estimated Actuals2016-17Budget
PercentDifference
INTERFUND TRANSFERS
INTERFUND TRANSFERS IN
Other Authorized Interfund Transfers In 8919 0.00 0.00 0.0%
(a) TOTAL, INTERFUND TRANSFERS IN 0.00 0.00 0.0%
INTERFUND TRANSFERS OUT
Other Authorized Interfund Transfers Out 7619 0.00 0.00 0.0%
(b) TOTAL, INTERFUND TRANSFERS OUT 0.00 0.00 0.0%
OTHER SOURCES/USES
SOURCES
Other Sources
Transfers from Funds of Lapsed/Reorganized LEAs 8965 0.00 0.00 0.0%
Long-Term Debt Proceeds
Proceeds from Capital Leases 8972 0.00 0.00 0.0%
All Other Financing Sources 8979 0.00 0.00 0.0%
(c) TOTAL, SOURCES 0.00 0.00 0.0%
USES
Transfers of Funds from Lapsed/Reorganized LEAs 7651 0.00 0.00 0.0%
All Other Financing Uses 7699 0.00 0.00 0.0%
(d) TOTAL, USES 0.00 0.00 0.0%
CONTRIBUTIONS
Contributions from Unrestricted Revenues 8980 0.00 0.00 0.0%
Contributions from Restricted Revenues 8990 0.00 0.00 0.0%
(e) TOTAL, CONTRIBUTIONS 0.00 0.00 0.0%
TOTAL, OTHER FINANCING SOURCES/USES (a - b + c - d + e) 0.00 0.00 0.0%
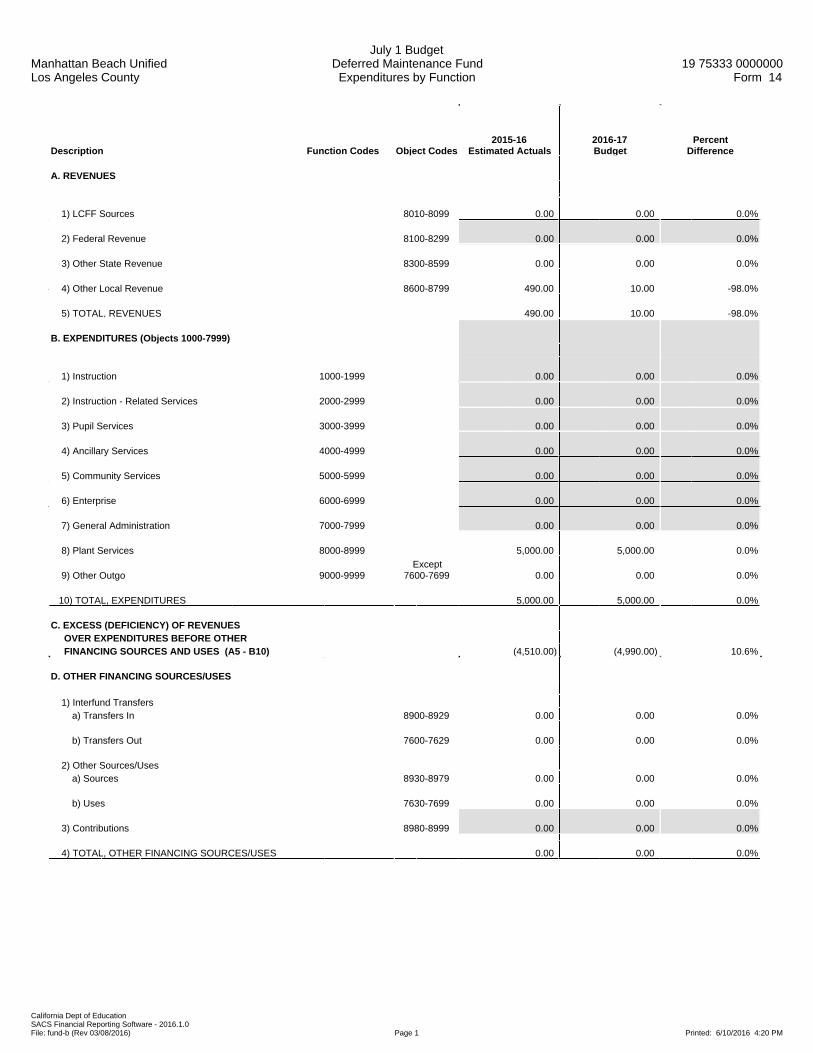
Manhattan Beach UnifiedLos Angeles County
July 1 BudgetDeferred Maintenance FundExpenditures by Function
19 75333 0000000Form 14
California Dept of EducationSACS Financial Reporting Software - 2016.1.0File: fund-b (Rev 03/08/2016) Page 1 Printed: 6/10/2016 4:20 PM
Description Function Codes Object Codes2015-16
Estimated Actuals2016-17Budget
PercentDifference
A. REVENUES
1) LCFF Sources 8010-8099 0.00 0.00 0.0%
2) Federal Revenue 8100-8299 0.00 0.00 0.0%
3) Other State Revenue 8300-8599 0.00 0.00 0.0%
4) Other Local Revenue 8600-8799 490.00 10.00 -98.0%
5) TOTAL, REVENUES 490.00 10.00 -98.0%
B. EXPENDITURES (Objects 1000-7999)
1) Instruction 1000-1999 0.00 0.00 0.0%
2) Instruction - Related Services 2000-2999 0.00 0.00 0.0%
3) Pupil Services 3000-3999 0.00 0.00 0.0%
4) Ancillary Services 4000-4999 0.00 0.00 0.0%
5) Community Services 5000-5999 0.00 0.00 0.0%
6) Enterprise 6000-6999 0.00 0.00 0.0%
7) General Administration 7000-7999 0.00 0.00 0.0%
8) Plant Services 8000-8999 5,000.00 5,000.00 0.0%
9) Other Outgo 9000-9999Except
7600-7699 0.00 0.00 0.0%
10) TOTAL, EXPENDITURES 5,000.00 5,000.00 0.0%
C. EXCESS (DEFICIENCY) OF REVENUES OVER EXPENDITURES BEFORE OTHER FINANCING SOURCES AND USES (A5 - B10) (4,510.00) (4,990.00) 10.6%
D. OTHER FINANCING SOURCES/USES 1) Interfund Transfers a) Transfers In 8900-8929 0.00 0.00 0.0%
b) Transfers Out 7600-7629 0.00 0.00 0.0%
2) Other Sources/Uses a) Sources 8930-8979 0.00 0.00 0.0%
b) Uses 7630-7699 0.00 0.00 0.0%
3) Contributions 8980-8999 0.00 0.00 0.0%
4) TOTAL, OTHER FINANCING SOURCES/USES 0.00 0.00 0.0%
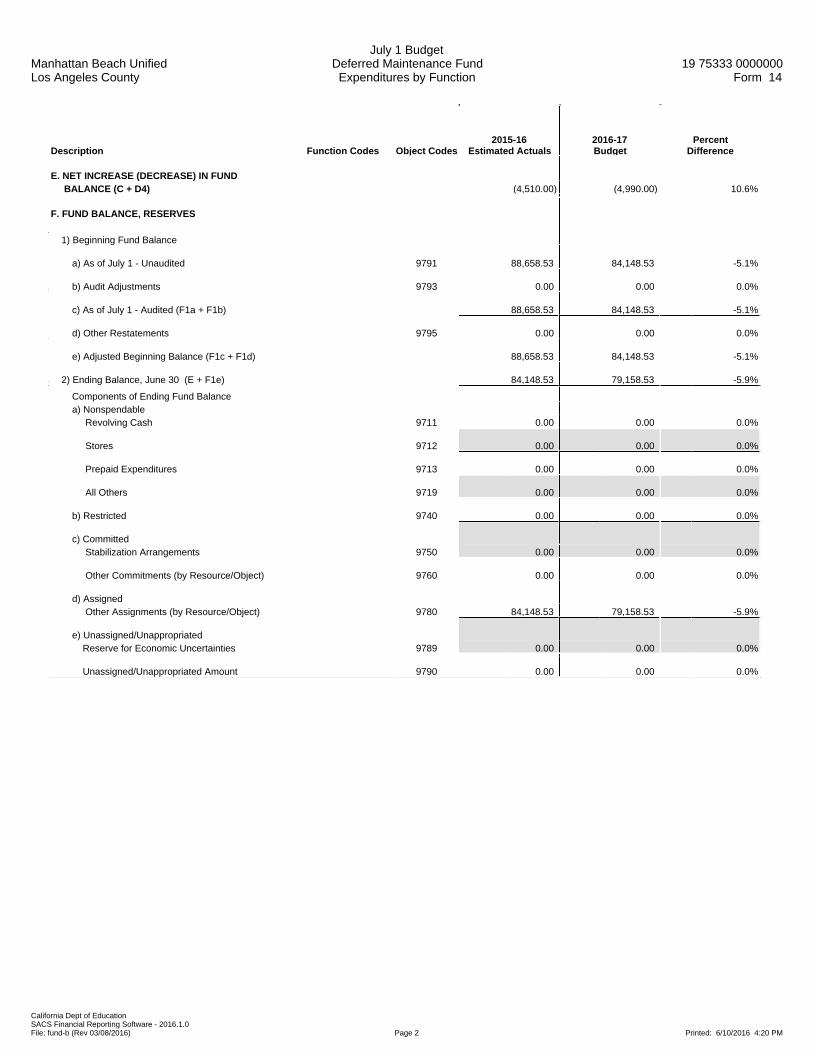
Manhattan Beach UnifiedLos Angeles County
July 1 BudgetDeferred Maintenance FundExpenditures by Function
19 75333 0000000Form 14
California Dept of EducationSACS Financial Reporting Software - 2016.1.0File: fund-b (Rev 03/08/2016) Page 2 Printed: 6/10/2016 4:20 PM
Description Function Codes Object Codes2015-16
Estimated Actuals2016-17Budget
PercentDifference
E. NET INCREASE (DECREASE) IN FUND BALANCE (C + D4) (4,510.00) (4,990.00) 10.6%
F. FUND BALANCE, RESERVES 1) Beginning Fund Balance
a) As of July 1 - Unaudited 9791 88,658.53 84,148.53 -5.1%
b) Audit Adjustments 9793 0.00 0.00 0.0%
c) As of July 1 - Audited (F1a + F1b) 88,658.53 84,148.53 -5.1%
d) Other Restatements 9795 0.00 0.00 0.0%
e) Adjusted Beginning Balance (F1c + F1d) 88,658.53 84,148.53 -5.1%
2) Ending Balance, June 30 (E + F1e) 84,148.53 79,158.53 -5.9%
Components of Ending Fund Balance a) Nonspendable Revolving Cash 9711 0.00 0.00 0.0%
Stores 9712 0.00 0.00 0.0%
Prepaid Expenditures 9713 0.00 0.00 0.0%
All Others 9719 0.00 0.00 0.0%
b) Restricted 9740 0.00 0.00 0.0%
c) Committed Stabilization Arrangements 9750 0.00 0.00 0.0%
Other Commitments (by Resource/Object) 9760 0.00 0.00 0.0%
d) Assigned Other Assignments (by Resource/Object) 9780 84,148.53 79,158.53 -5.9%
e) Unassigned/Unappropriated Reserve for Economic Uncertainties 9789 0.00 0.00 0.0%
Unassigned/Unappropriated Amount 9790 0.00 0.00 0.0%
Manhattan Beach UnifiedLos Angeles County
July 1 BudgetDeferred Maintenance Fund
Exhibit: Restricted Balance Detail19 75333 0000000
Form 14
California Dept of EducationSACS Financial Reporting Software - 2016.1.0File: fund-b (Rev 11/14/2012) Page 1 Printed: 6/10/2016 4:20 PM
2015-16 2016-17Resource Description Estimated Actuals Budget
Total, Restricted Balance 0.00 0.00

Manhattan Beach UnifiedLos Angeles County
July 1 BudgetBuilding Fund
Expenditures by Object19 75333 0000000
Form 21
California Dept of EducationSACS Financial Reporting Software - 2016.1.0File: fund-d (Rev 02/02/2016) Page 1 Printed: 6/10/2016 4:20 PM
Description Resource Codes Object Codes2015-16
Estimated Actuals2016-17Budget
PercentDifference
A. REVENUES
1) LCFF Sources 8010-8099 0.00 0.00 0.0%
2) Federal Revenue 8100-8299 0.00 0.00 0.0%
3) Other State Revenue 8300-8599 0.00 0.00 0.0%
4) Other Local Revenue 8600-8799 500.00 0.00 -100.0%
5) TOTAL, REVENUES 500.00 0.00 -100.0%
B. EXPENDITURES
1) Certificated Salaries 1000-1999 0.00 0.00 0.0%
2) Classified Salaries 2000-2999 0.00 0.00 0.0%
3) Employee Benefits 3000-3999 0.00 0.00 0.0%
4) Books and Supplies 4000-4999 33,169.00 0.00 -100.0%
5) Services and Other Operating Expenditures 5000-5999 7,560.00 0.00 -100.0%
6) Capital Outlay 6000-6999 914,423.00 490,000.00 -46.4%
7) Other Outgo (excluding Transfers of Indirect 7100-7299, Costs) 7400-7499 0.00 0.00 0.0%
8) Other Outgo - Transfers of Indirect Costs 7300-7399 0.00 0.00 0.0%
9) TOTAL, EXPENDITURES 955,152.00 490,000.00 -48.7%
C. EXCESS (DEFICIENCY) OF REVENUES OVER EXPENDITURES BEFORE OTHER FINANCING SOURCES AND USES (A5 - B9) (954,652.00) (490,000.00) -48.7%
D. OTHER FINANCING SOURCES/USES 1) Interfund Transfers a) Transfers In 8900-8929 0.00 0.00 0.0%
b) Transfers Out 7600-7629 0.00 0.00 0.0%
2) Other Sources/Uses a) Sources 8930-8979 0.00 0.00 0.0%
b) Uses 7630-7699 0.00 0.00 0.0%
3) Contributions 8980-8999 0.00 0.00 0.0%
4) TOTAL, OTHER FINANCING SOURCES/USES 0.00 0.00 0.0%

Manhattan Beach UnifiedLos Angeles County
July 1 BudgetBuilding Fund
Expenditures by Object19 75333 0000000
Form 21
California Dept of EducationSACS Financial Reporting Software - 2016.1.0File: fund-d (Rev 02/02/2016) Page 2 Printed: 6/10/2016 4:20 PM
Description Resource Codes Object Codes2015-16
Estimated Actuals2016-17Budget
PercentDifference
E. NET INCREASE (DECREASE) IN FUND BALANCE (C + D4) (954,652.00) (490,000.00) -48.7%
F. FUND BALANCE, RESERVES 1) Beginning Fund Balance a) As of July 1 - Unaudited 9791 1,457,637.10 502,985.10 -65.5%
b) Audit Adjustments 9793 0.00 0.00 0.0%
c) As of July 1 - Audited (F1a + F1b) 1,457,637.10 502,985.10 -65.5%
d) Other Restatements 9795 0.00 0.00 0.0%
e) Adjusted Beginning Balance (F1c + F1d) 1,457,637.10 502,985.10 -65.5%
2) Ending Balance, June 30 (E + F1e) 502,985.10 12,985.10 -97.4% Components of Ending Fund Balance a) Nonspendable Revolving Cash 9711 0.00 0.00 0.0%
Stores 9712 0.00 0.00 0.0%
Prepaid Expenditures 9713 0.00 0.00 0.0%
All Others 9719 0.00 0.00 0.0%
b) Restricted 9740 7,488.59 7,488.59 0.0%
c) Committed Stabilization Arrangements 9750 0.00 0.00 0.0%
Other Commitments 9760 0.00 0.00 0.0%
d) Assigned Other Assignments 9780 495,496.51 5,496.51 -98.9%
e) Unassigned/Unappropriated Reserve for Economic Uncertainties 9789 0.00 0.00 0.0%
Unassigned/Unappropriated Amount 9790 0.00 0.00 0.0%
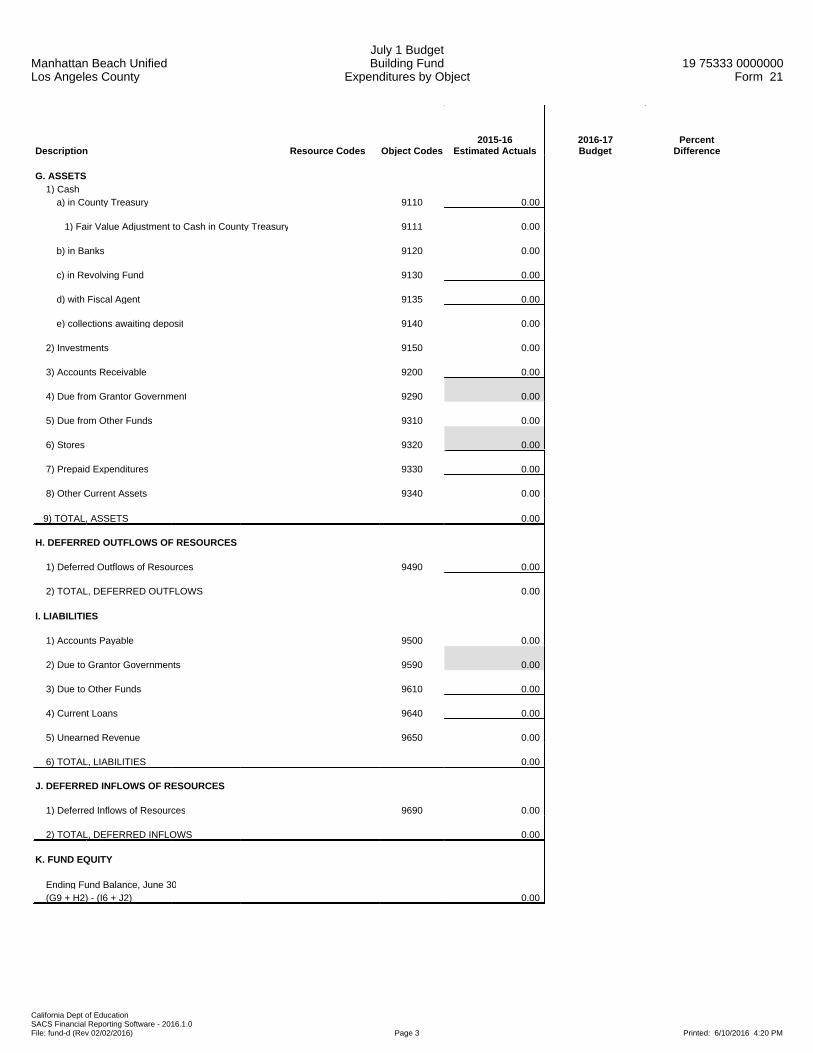
Manhattan Beach UnifiedLos Angeles County
July 1 BudgetBuilding Fund
Expenditures by Object19 75333 0000000
Form 21
California Dept of EducationSACS Financial Reporting Software - 2016.1.0File: fund-d (Rev 02/02/2016) Page 3 Printed: 6/10/2016 4:20 PM
Description Resource Codes Object Codes2015-16
Estimated Actuals2016-17Budget
PercentDifference
G. ASSETS 1) Cash a) in County Treasury 9110 0.00
1) Fair Value Adjustment to Cash in County Treasury 9111 0.00
b) in Banks 9120 0.00
c) in Revolving Fund 9130 0.00
d) with Fiscal Agent 9135 0.00
e) collections awaiting deposit 9140 0.00
2) Investments 9150 0.00
3) Accounts Receivable 9200 0.00
4) Due from Grantor Government 9290 0.00
5) Due from Other Funds 9310 0.00
6) Stores 9320 0.00
7) Prepaid Expenditures 9330 0.00
8) Other Current Assets 9340 0.00
9) TOTAL, ASSETS 0.00
H. DEFERRED OUTFLOWS OF RESOURCES
1) Deferred Outflows of Resources 9490 0.00
2) TOTAL, DEFERRED OUTFLOWS 0.00
I. LIABILITIES
1) Accounts Payable 9500 0.00
2) Due to Grantor Governments 9590 0.00
3) Due to Other Funds 9610 0.00
4) Current Loans 9640 0.00
5) Unearned Revenue 9650 0.00
6) TOTAL, LIABILITIES 0.00
J. DEFERRED INFLOWS OF RESOURCES
1) Deferred Inflows of Resources 9690 0.00
2) TOTAL, DEFERRED INFLOWS 0.00
K. FUND EQUITY
Ending Fund Balance, June 30 (G9 + H2) - (I6 + J2) 0.00
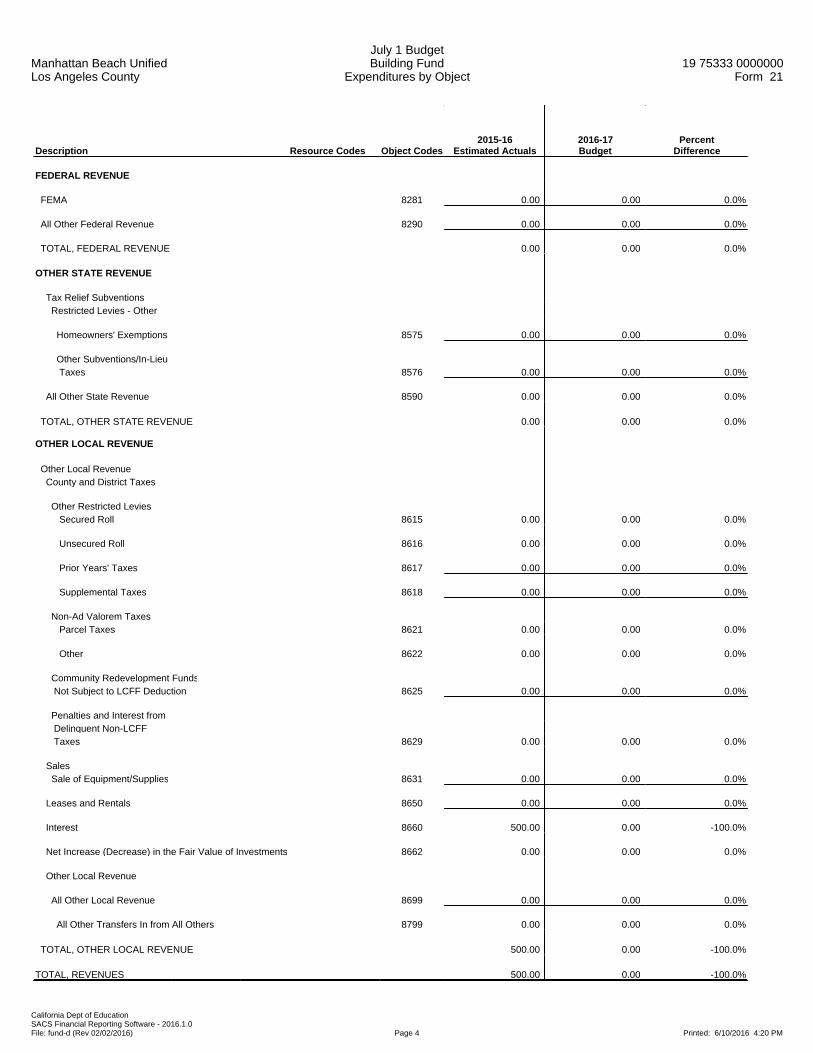
Manhattan Beach UnifiedLos Angeles County
July 1 BudgetBuilding Fund
Expenditures by Object19 75333 0000000
Form 21
California Dept of EducationSACS Financial Reporting Software - 2016.1.0File: fund-d (Rev 02/02/2016) Page 4 Printed: 6/10/2016 4:20 PM
Description Resource Codes Object Codes2015-16
Estimated Actuals2016-17Budget
PercentDifference
FEDERAL REVENUE
FEMA 8281 0.00 0.00 0.0%
All Other Federal Revenue 8290 0.00 0.00 0.0%
TOTAL, FEDERAL REVENUE 0.00 0.00 0.0%
OTHER STATE REVENUE
Tax Relief Subventions Restricted Levies - Other
Homeowners' Exemptions 8575 0.00 0.00 0.0%
Other Subventions/In-Lieu Taxes 8576 0.00 0.00 0.0%
All Other State Revenue 8590 0.00 0.00 0.0%
TOTAL, OTHER STATE REVENUE 0.00 0.00 0.0%
OTHER LOCAL REVENUE
Other Local Revenue County and District Taxes
Other Restricted Levies Secured Roll 8615 0.00 0.00 0.0%
Unsecured Roll 8616 0.00 0.00 0.0%
Prior Years' Taxes 8617 0.00 0.00 0.0%
Supplemental Taxes 8618 0.00 0.00 0.0%
Non-Ad Valorem Taxes Parcel Taxes 8621 0.00 0.00 0.0%
Other 8622 0.00 0.00 0.0%
Community Redevelopment Funds Not Subject to LCFF Deduction 8625 0.00 0.00 0.0%
Penalties and Interest from Delinquent Non-LCFF Taxes 8629 0.00 0.00 0.0%
Sales Sale of Equipment/Supplies 8631 0.00 0.00 0.0%
Leases and Rentals 8650 0.00 0.00 0.0%
Interest 8660 500.00 0.00 -100.0%
Net Increase (Decrease) in the Fair Value of Investments 8662 0.00 0.00 0.0%
Other Local Revenue
All Other Local Revenue 8699 0.00 0.00 0.0%
All Other Transfers In from All Others 8799 0.00 0.00 0.0%
TOTAL, OTHER LOCAL REVENUE 500.00 0.00 -100.0%
TOTAL, REVENUES 500.00 0.00 -100.0%

Manhattan Beach UnifiedLos Angeles County
July 1 BudgetBuilding Fund
Expenditures by Object19 75333 0000000
Form 21
California Dept of EducationSACS Financial Reporting Software - 2016.1.0File: fund-d (Rev 02/02/2016) Page 5 Printed: 6/10/2016 4:20 PM
Description Resource Codes Object Codes2015-16
Estimated Actuals2016-17Budget
PercentDifference
CLASSIFIED SALARIES
Classified Support Salaries 2200 0.00 0.00 0.0%
Classified Supervisors' and Administrators' Salaries 2300 0.00 0.00 0.0%
Clerical, Technical and Office Salaries 2400 0.00 0.00 0.0%
Other Classified Salaries 2900 0.00 0.00 0.0%
TOTAL, CLASSIFIED SALARIES 0.00 0.00 0.0%
EMPLOYEE BENEFITS
STRS 3101-3102 0.00 0.00 0.0%
PERS 3201-3202 0.00 0.00 0.0%
OASDI/Medicare/Alternative 3301-3302 0.00 0.00 0.0%
Health and Welfare Benefits 3401-3402 0.00 0.00 0.0%
Unemployment Insurance 3501-3502 0.00 0.00 0.0%
Workers' Compensation 3601-3602 0.00 0.00 0.0%
OPEB, Allocated 3701-3702 0.00 0.00 0.0%
OPEB, Active Employees 3751-3752 0.00 0.00 0.0%
Other Employee Benefits 3901-3902 0.00 0.00 0.0%
TOTAL, EMPLOYEE BENEFITS 0.00 0.00 0.0%
BOOKS AND SUPPLIES
Books and Other Reference Materials 4200 0.00 0.00 0.0%
Materials and Supplies 4300 0.00 0.00 0.0%
Noncapitalized Equipment 4400 33,169.00 0.00 -100.0%
TOTAL, BOOKS AND SUPPLIES 33,169.00 0.00 -100.0%
SERVICES AND OTHER OPERATING EXPENDITURES
Subagreements for Services 5100 0.00 0.00 0.0%
Travel and Conferences 5200 0.00 0.00 0.0%
Insurance 5400-5450 0.00 0.00 0.0%
Operations and Housekeeping Services 5500 0.00 0.00 0.0%
Rentals, Leases, Repairs, and Noncapitalized Improvements 5600 0.00 0.00 0.0%
Transfers of Direct Costs 5710 0.00 0.00 0.0%
Transfers of Direct Costs - Interfund 5750 0.00 0.00 0.0%

Manhattan Beach UnifiedLos Angeles County
July 1 BudgetBuilding Fund
Expenditures by Object19 75333 0000000
Form 21
California Dept of EducationSACS Financial Reporting Software - 2016.1.0File: fund-d (Rev 02/02/2016) Page 6 Printed: 6/10/2016 4:20 PM
Description Resource Codes Object Codes2015-16
Estimated Actuals2016-17Budget
PercentDifference
Professional/Consulting Services and Operating Expenditures 5800 7,560.00 0.00 -100.0%
Communications 5900 0.00 0.00 0.0%
TOTAL, SERVICES AND OTHER OPERATING EXPENDITURES 7,560.00 0.00 -100.0%
CAPITAL OUTLAY
Land 6100 0.00 0.00 0.0%
Land Improvements 6170 0.00 0.00 0.0%
Buildings and Improvements of Buildings 6200 881,440.00 490,000.00 -44.4%
Books and Media for New School Libraries or Major Expansion of School Libraries 6300 0.00 0.00 0.0%
Equipment 6400 32,983.00 0.00 -100.0%
Equipment Replacement 6500 0.00 0.00 0.0%
TOTAL, CAPITAL OUTLAY 914,423.00 490,000.00 -46.4%
OTHER OUTGO (excluding Transfers of Indirect Costs)
Other Transfers Out
All Other Transfers Out to All Others 7299 0.00 0.00 0.0%
Debt Service
Repayment of State School Building Fund Aid - Proceeds from Bonds 7435 0.00 0.00 0.0%
Debt Service - Interest 7438 0.00 0.00 0.0%
Other Debt Service - Principal 7439 0.00 0.00 0.0%
TOTAL, OTHER OUTGO (excluding Transfers of Indirect Costs) 0.00 0.00 0.0%
TOTAL, EXPENDITURES 955,152.00 490,000.00 -48.7%

Manhattan Beach UnifiedLos Angeles County
July 1 BudgetBuilding Fund
Expenditures by Object19 75333 0000000
Form 21
California Dept of EducationSACS Financial Reporting Software - 2016.1.0File: fund-d (Rev 02/02/2016) Page 7 Printed: 6/10/2016 4:21 PM
Description Resource Codes Object Codes2015-16
Estimated Actuals2016-17Budget
PercentDifference
INTERFUND TRANSFERS
INTERFUND TRANSFERS IN
Other Authorized Interfund Transfers In 8919 0.00 0.00 0.0%
(a) TOTAL, INTERFUND TRANSFERS IN 0.00 0.00 0.0%
INTERFUND TRANSFERS OUT
To: State School Building Fund/ County School Facilities Fund 7613 0.00 0.00 0.0%
Other Authorized Interfund Transfers Out 7619 0.00 0.00 0.0%
(b) TOTAL, INTERFUND TRANSFERS OUT 0.00 0.00 0.0%

Manhattan Beach UnifiedLos Angeles County
July 1 BudgetBuilding Fund
Expenditures by Object19 75333 0000000
Form 21
California Dept of EducationSACS Financial Reporting Software - 2016.1.0File: fund-d (Rev 02/02/2016) Page 8 Printed: 6/10/2016 4:21 PM
Description Resource Codes Object Codes2015-16
Estimated Actuals2016-17Budget
PercentDifference
OTHER SOURCES/USES
SOURCES
Proceeds Proceeds from Sale of Bonds 8951 0.00 0.00 0.0%
Proceeds from Sale/Lease- Purchase of Land/Buildings 8953 0.00 0.00 0.0%
Other Sources County School Bldg Aid 8961 0.00 0.00 0.0%
Transfers from Funds of Lapsed/Reorganized LEAs 8965 0.00 0.00 0.0%
Long-Term Debt Proceeds Proceeds from Certificates of Participation 8971 0.00 0.00 0.0%
Proceeds from Capital Leases 8972 0.00 0.00 0.0%
Proceeds from Lease Revenue Bonds 8973 0.00 0.00 0.0%
All Other Financing Sources 8979 0.00 0.00 0.0%
(c) TOTAL, SOURCES 0.00 0.00 0.0%
USES
Transfers of Funds from Lapsed/Reorganized LEAs 7651 0.00 0.00 0.0%
All Other Financing Uses 7699 0.00 0.00 0.0%
(d) TOTAL, USES 0.00 0.00 0.0%
CONTRIBUTIONS
Contributions from Unrestricted Revenues 8980 0.00 0.00 0.0%
Contributions from Restricted Revenues 8990 0.00 0.00 0.0%
(e) TOTAL, CONTRIBUTIONS 0.00 0.00 0.0%
TOTAL, OTHER FINANCING SOURCES/USES (a - b + c - d + e) 0.00 0.00 0.0%

Manhattan Beach UnifiedLos Angeles County
July 1 BudgetBuilding Fund
Expenditures by Function19 75333 0000000
Form 21
California Dept of EducationSACS Financial Reporting Software - 2016.1.0File: fund-d (Rev 02/02/2016) Page 1 Printed: 6/10/2016 4:21 PM
Description Function Codes Object Codes2015-16
Estimated Actuals2016-17Budget
PercentDifference
A. REVENUES
1) LCFF Sources 8010-8099 0.00 0.00 0.0%
2) Federal Revenue 8100-8299 0.00 0.00 0.0%
3) Other State Revenue 8300-8599 0.00 0.00 0.0%
4) Other Local Revenue 8600-8799 500.00 0.00 -100.0%
5) TOTAL, REVENUES 500.00 0.00 -100.0%
B. EXPENDITURES (Objects 1000-7999)
1) Instruction 1000-1999 0.00 0.00 0.0%
2) Instruction - Related Services 2000-2999 0.00 0.00 0.0%
3) Pupil Services 3000-3999 0.00 0.00 0.0%
4) Ancillary Services 4000-4999 0.00 0.00 0.0%
5) Community Services 5000-5999 0.00 0.00 0.0%
6) Enterprise 6000-6999 0.00 0.00 0.0%
7) General Administration 7000-7999 0.00 0.00 0.0%
8) Plant Services 8000-8999 955,152.00 490,000.00 -48.7%
9) Other Outgo 9000-9999Except
7600-7699 0.00 0.00 0.0%
10) TOTAL, EXPENDITURES 955,152.00 490,000.00 -48.7%
C. EXCESS (DEFICIENCY) OF REVENUES OVER EXPENDITURES BEFORE OTHER FINANCING SOURCES AND USES (A5 - B10) (954,652.00) (490,000.00) -48.7%
D. OTHER FINANCING SOURCES/USES 1) Interfund Transfers a) Transfers In 8900-8929 0.00 0.00 0.0%
b) Transfers Out 7600-7629 0.00 0.00 0.0%
2) Other Sources/Uses a) Sources 8930-8979 0.00 0.00 0.0%
b) Uses 7630-7699 0.00 0.00 0.0%
3) Contributions 8980-8999 0.00 0.00 0.0%
4) TOTAL, OTHER FINANCING SOURCES/USES 0.00 0.00 0.0%

Manhattan Beach UnifiedLos Angeles County
July 1 BudgetBuilding Fund
Expenditures by Function19 75333 0000000
Form 21
California Dept of EducationSACS Financial Reporting Software - 2016.1.0File: fund-d (Rev 02/02/2016) Page 2 Printed: 6/10/2016 4:21 PM
Description Function Codes Object Codes2015-16
Estimated Actuals2016-17Budget
PercentDifference
E. NET INCREASE (DECREASE) IN FUND BALANCE (C + D4) (954,652.00) (490,000.00) -48.7%
F. FUND BALANCE, RESERVES 1) Beginning Fund Balance
a) As of July 1 - Unaudited 9791 1,457,637.10 502,985.10 -65.5%
b) Audit Adjustments 9793 0.00 0.00 0.0%
c) As of July 1 - Audited (F1a + F1b) 1,457,637.10 502,985.10 -65.5%
d) Other Restatements 9795 0.00 0.00 0.0%
e) Adjusted Beginning Balance (F1c + F1d) 1,457,637.10 502,985.10 -65.5%
2) Ending Balance, June 30 (E + F1e) 502,985.10 12,985.10 -97.4% Components of Ending Fund Balance a) Nonspendable Revolving Cash 9711 0.00 0.00 0.0%
Stores 9712 0.00 0.00 0.0%
Prepaid Expenditures 9713 0.00 0.00 0.0%
All Others 9719 0.00 0.00 0.0%
b) Restricted 9740 7,488.59 7,488.59 0.0%
c) Committed Stabilization Arrangements 9750 0.00 0.00 0.0%
Other Commitments (by Resource/Object) 9760 0.00 0.00 0.0%
d) Assigned Other Assignments (by Resource/Object) 9780 495,496.51 5,496.51 -98.9%
e) Unassigned/Unappropriated Reserve for Economic Uncertainties 9789 0.00 0.00 0.0%
Unassigned/Unappropriated Amount 9790 0.00 0.00 0.0%
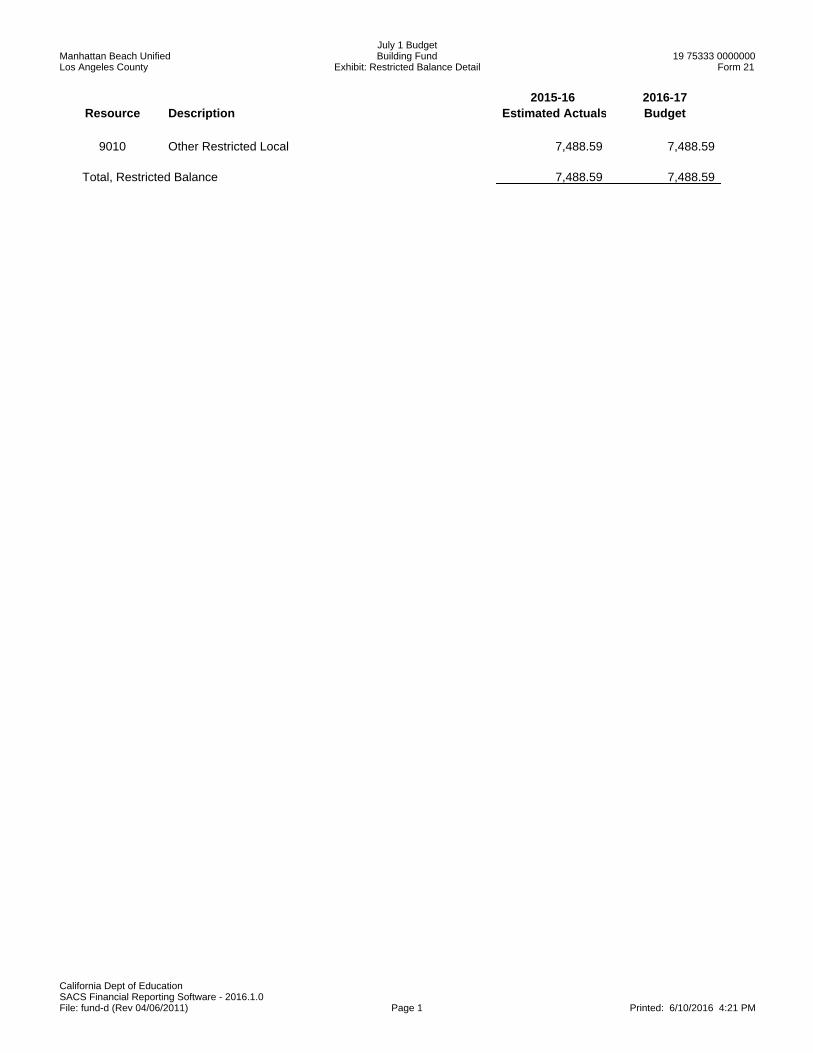
Manhattan Beach UnifiedLos Angeles County
July 1 BudgetBuilding Fund
Exhibit: Restricted Balance Detail19 75333 0000000
Form 21
California Dept of EducationSACS Financial Reporting Software - 2016.1.0File: fund-d (Rev 04/06/2011) Page 1 Printed: 6/10/2016 4:21 PM
2015-16 2016-17Resource Description Estimated Actuals Budget
9010 Other Restricted Local 7,488.59 7,488.59
Total, Restricted Balance 7,488.59 7,488.59

This Page is Blank.
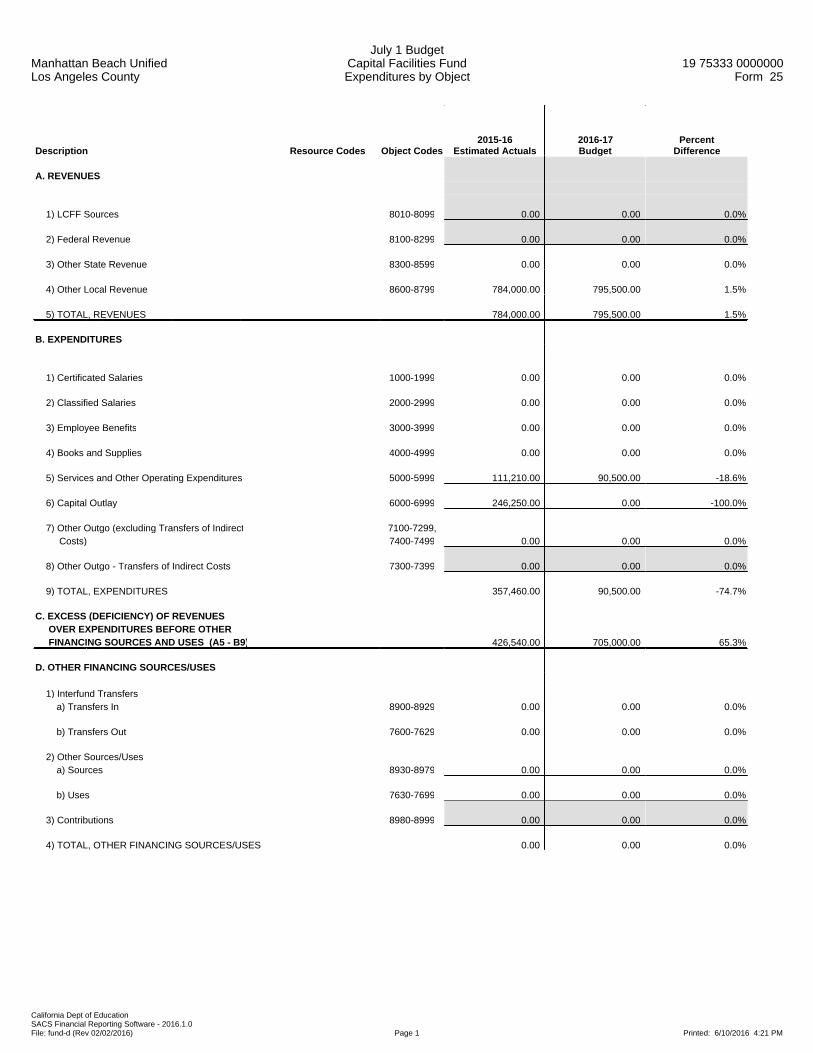
Manhattan Beach UnifiedLos Angeles County
July 1 BudgetCapital Facilities FundExpenditures by Object
19 75333 0000000Form 25
California Dept of EducationSACS Financial Reporting Software - 2016.1.0File: fund-d (Rev 02/02/2016) Page 1 Printed: 6/10/2016 4:21 PM
Description Resource Codes Object Codes2015-16
Estimated Actuals2016-17Budget
PercentDifference
A. REVENUES
1) LCFF Sources 8010-8099 0.00 0.00 0.0%
2) Federal Revenue 8100-8299 0.00 0.00 0.0%
3) Other State Revenue 8300-8599 0.00 0.00 0.0%
4) Other Local Revenue 8600-8799 784,000.00 795,500.00 1.5%
5) TOTAL, REVENUES 784,000.00 795,500.00 1.5%
B. EXPENDITURES
1) Certificated Salaries 1000-1999 0.00 0.00 0.0%
2) Classified Salaries 2000-2999 0.00 0.00 0.0%
3) Employee Benefits 3000-3999 0.00 0.00 0.0%
4) Books and Supplies 4000-4999 0.00 0.00 0.0%
5) Services and Other Operating Expenditures 5000-5999 111,210.00 90,500.00 -18.6%
6) Capital Outlay 6000-6999 246,250.00 0.00 -100.0%
7) Other Outgo (excluding Transfers of Indirect 7100-7299, Costs) 7400-7499 0.00 0.00 0.0%
8) Other Outgo - Transfers of Indirect Costs 7300-7399 0.00 0.00 0.0%
9) TOTAL, EXPENDITURES 357,460.00 90,500.00 -74.7%
C. EXCESS (DEFICIENCY) OF REVENUES OVER EXPENDITURES BEFORE OTHER FINANCING SOURCES AND USES (A5 - B9) 426,540.00 705,000.00 65.3%
D. OTHER FINANCING SOURCES/USES 1) Interfund Transfers a) Transfers In 8900-8929 0.00 0.00 0.0%
b) Transfers Out 7600-7629 0.00 0.00 0.0%
2) Other Sources/Uses a) Sources 8930-8979 0.00 0.00 0.0%
b) Uses 7630-7699 0.00 0.00 0.0%
3) Contributions 8980-8999 0.00 0.00 0.0%
4) TOTAL, OTHER FINANCING SOURCES/USES 0.00 0.00 0.0%

Manhattan Beach UnifiedLos Angeles County
July 1 BudgetCapital Facilities FundExpenditures by Object
19 75333 0000000Form 25
California Dept of EducationSACS Financial Reporting Software - 2016.1.0File: fund-d (Rev 02/02/2016) Page 2 Printed: 6/10/2016 4:21 PM
Description Resource Codes Object Codes2015-16
Estimated Actuals2016-17Budget
PercentDifference
E. NET INCREASE (DECREASE) IN FUND BALANCE (C + D4) 426,540.00 705,000.00 65.3%
F. FUND BALANCE, RESERVES 1) Beginning Fund Balance a) As of July 1 - Unaudited 9791 993,183.99 1,549,576.99 56.0%
b) Audit Adjustments 9793 129,853.00 0.00 -100.0%
c) As of July 1 - Audited (F1a + F1b) 1,123,036.99 1,549,576.99 38.0%
d) Other Restatements 9795 0.00 0.00 0.0%
e) Adjusted Beginning Balance (F1c + F1d) 1,123,036.99 1,549,576.99 38.0%
2) Ending Balance, June 30 (E + F1e) 1,549,576.99 2,254,576.99 45.5% Components of Ending Fund Balance a) Nonspendable Revolving Cash 9711 0.00 0.00 0.0%
Stores 9712 0.00 0.00 0.0%
Prepaid Expenditures 9713 0.00 0.00 0.0%
All Others 9719 0.00 0.00 0.0%
b) Restricted 9740 0.00 0.00 0.0%
c) Committed Stabilization Arrangements 9750 0.00 0.00 0.0%
Other Commitments 9760 0.00 0.00 0.0%
d) Assigned Other Assignments 9780 1,549,576.99 2,254,576.99 45.5%
e) Unassigned/Unappropriated Reserve for Economic Uncertainties 9789 0.00 0.00 0.0%
Unassigned/Unappropriated Amount 9790 0.00 0.00 0.0%

Manhattan Beach UnifiedLos Angeles County
July 1 BudgetCapital Facilities FundExpenditures by Object
19 75333 0000000Form 25
California Dept of EducationSACS Financial Reporting Software - 2016.1.0File: fund-d (Rev 02/02/2016) Page 3 Printed: 6/10/2016 4:21 PM
Description Resource Codes Object Codes2015-16
Estimated Actuals2016-17Budget
PercentDifference
G. ASSETS 1) Cash a) in County Treasury 9110 0.00
1) Fair Value Adjustment to Cash in County Treasury 9111 0.00
b) in Banks 9120 0.00
c) in Revolving Fund 9130 0.00
d) with Fiscal Agent 9135 0.00
e) collections awaiting deposit 9140 0.00
2) Investments 9150 0.00
3) Accounts Receivable 9200 0.00
4) Due from Grantor Government 9290 0.00
5) Due from Other Funds 9310 0.00
6) Stores 9320 0.00
7) Prepaid Expenditures 9330 0.00
8) Other Current Assets 9340 0.00
9) TOTAL, ASSETS 0.00
H. DEFERRED OUTFLOWS OF RESOURCES
1) Deferred Outflows of Resources 9490 0.00
2) TOTAL, DEFERRED OUTFLOWS 0.00
I. LIABILITIES
1) Accounts Payable 9500 0.00
2) Due to Grantor Governments 9590 0.00
3) Due to Other Funds 9610 0.00
4) Current Loans 9640 0.00
5) Unearned Revenue 9650 0.00
6) TOTAL, LIABILITIES 0.00
J. DEFERRED INFLOWS OF RESOURCES
1) Deferred Inflows of Resources 9690 0.00
2) TOTAL, DEFERRED INFLOWS 0.00
K. FUND EQUITY
Ending Fund Balance, June 30 (G9 + H2) - (I6 + J2) 0.00
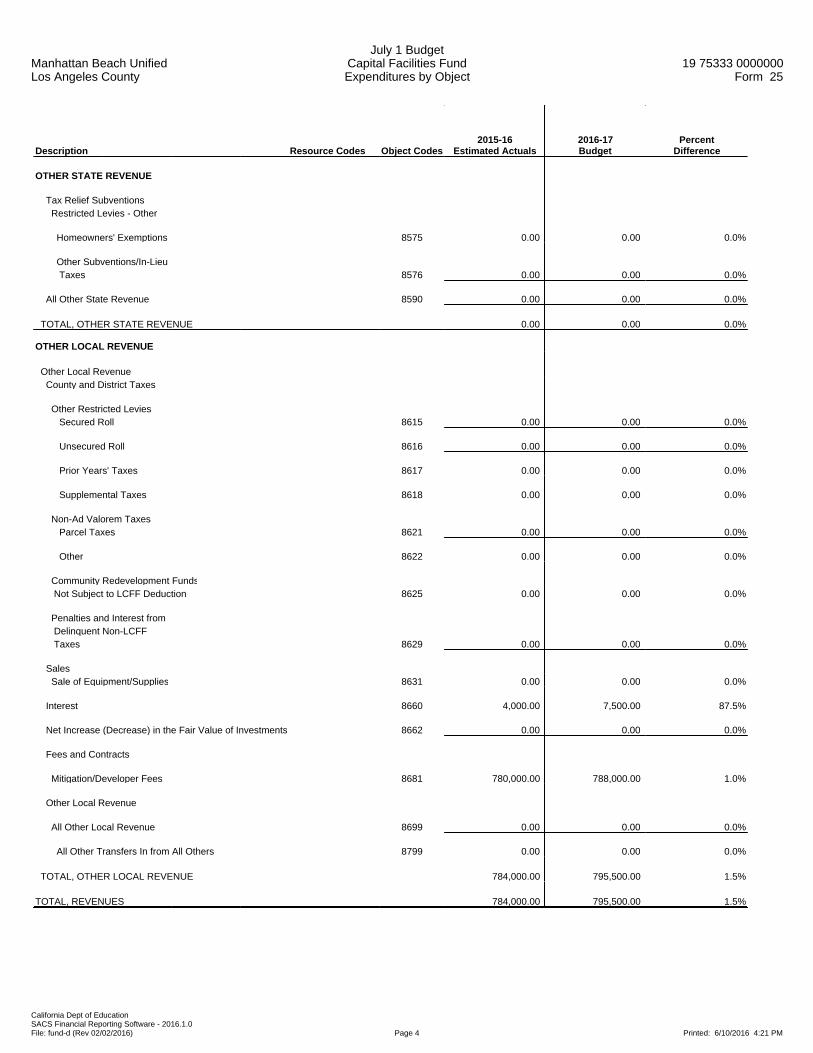
Manhattan Beach UnifiedLos Angeles County
July 1 BudgetCapital Facilities FundExpenditures by Object
19 75333 0000000Form 25
California Dept of EducationSACS Financial Reporting Software - 2016.1.0File: fund-d (Rev 02/02/2016) Page 4 Printed: 6/10/2016 4:21 PM
Description Resource Codes Object Codes2015-16
Estimated Actuals2016-17Budget
PercentDifference
OTHER STATE REVENUE
Tax Relief Subventions Restricted Levies - Other
Homeowners' Exemptions 8575 0.00 0.00 0.0%
Other Subventions/In-Lieu Taxes 8576 0.00 0.00 0.0%
All Other State Revenue 8590 0.00 0.00 0.0%
TOTAL, OTHER STATE REVENUE 0.00 0.00 0.0%
OTHER LOCAL REVENUE
Other Local Revenue County and District Taxes
Other Restricted Levies Secured Roll 8615 0.00 0.00 0.0%
Unsecured Roll 8616 0.00 0.00 0.0%
Prior Years' Taxes 8617 0.00 0.00 0.0%
Supplemental Taxes 8618 0.00 0.00 0.0%
Non-Ad Valorem Taxes Parcel Taxes 8621 0.00 0.00 0.0%
Other 8622 0.00 0.00 0.0%
Community Redevelopment Funds Not Subject to LCFF Deduction 8625 0.00 0.00 0.0%
Penalties and Interest from Delinquent Non-LCFF Taxes 8629 0.00 0.00 0.0%
Sales Sale of Equipment/Supplies 8631 0.00 0.00 0.0%
Interest 8660 4,000.00 7,500.00 87.5%
Net Increase (Decrease) in the Fair Value of Investments 8662 0.00 0.00 0.0%
Fees and Contracts
Mitigation/Developer Fees 8681 780,000.00 788,000.00 1.0%
Other Local Revenue
All Other Local Revenue 8699 0.00 0.00 0.0%
All Other Transfers In from All Others 8799 0.00 0.00 0.0%
TOTAL, OTHER LOCAL REVENUE 784,000.00 795,500.00 1.5%
TOTAL, REVENUES 784,000.00 795,500.00 1.5%

Manhattan Beach UnifiedLos Angeles County
July 1 BudgetCapital Facilities FundExpenditures by Object
19 75333 0000000Form 25
California Dept of EducationSACS Financial Reporting Software - 2016.1.0File: fund-d (Rev 02/02/2016) Page 5 Printed: 6/10/2016 4:21 PM
Description Resource Codes Object Codes2015-16
Estimated Actuals2016-17Budget
PercentDifference
CERTIFICATED SALARIES
Other Certificated Salaries 1900 0.00 0.00 0.0%
TOTAL, CERTIFICATED SALARIES 0.00 0.00 0.0%
CLASSIFIED SALARIES
Classified Support Salaries 2200 0.00 0.00 0.0%
Classified Supervisors' and Administrators' Salaries 2300 0.00 0.00 0.0%
Clerical, Technical and Office Salaries 2400 0.00 0.00 0.0%
Other Classified Salaries 2900 0.00 0.00 0.0%
TOTAL, CLASSIFIED SALARIES 0.00 0.00 0.0%
EMPLOYEE BENEFITS
STRS 3101-3102 0.00 0.00 0.0%
PERS 3201-3202 0.00 0.00 0.0%
OASDI/Medicare/Alternative 3301-3302 0.00 0.00 0.0%
Health and Welfare Benefits 3401-3402 0.00 0.00 0.0%
Unemployment Insurance 3501-3502 0.00 0.00 0.0%
Workers' Compensation 3601-3602 0.00 0.00 0.0%
OPEB, Allocated 3701-3702 0.00 0.00 0.0%
OPEB, Active Employees 3751-3752 0.00 0.00 0.0%
Other Employee Benefits 3901-3902 0.00 0.00 0.0%
TOTAL, EMPLOYEE BENEFITS 0.00 0.00 0.0%
BOOKS AND SUPPLIES
Approved Textbooks and Core Curricula Materials 4100 0.00 0.00 0.0%
Books and Other Reference Materials 4200 0.00 0.00 0.0%
Materials and Supplies 4300 0.00 0.00 0.0%
Noncapitalized Equipment 4400 0.00 0.00 0.0%
TOTAL, BOOKS AND SUPPLIES 0.00 0.00 0.0%
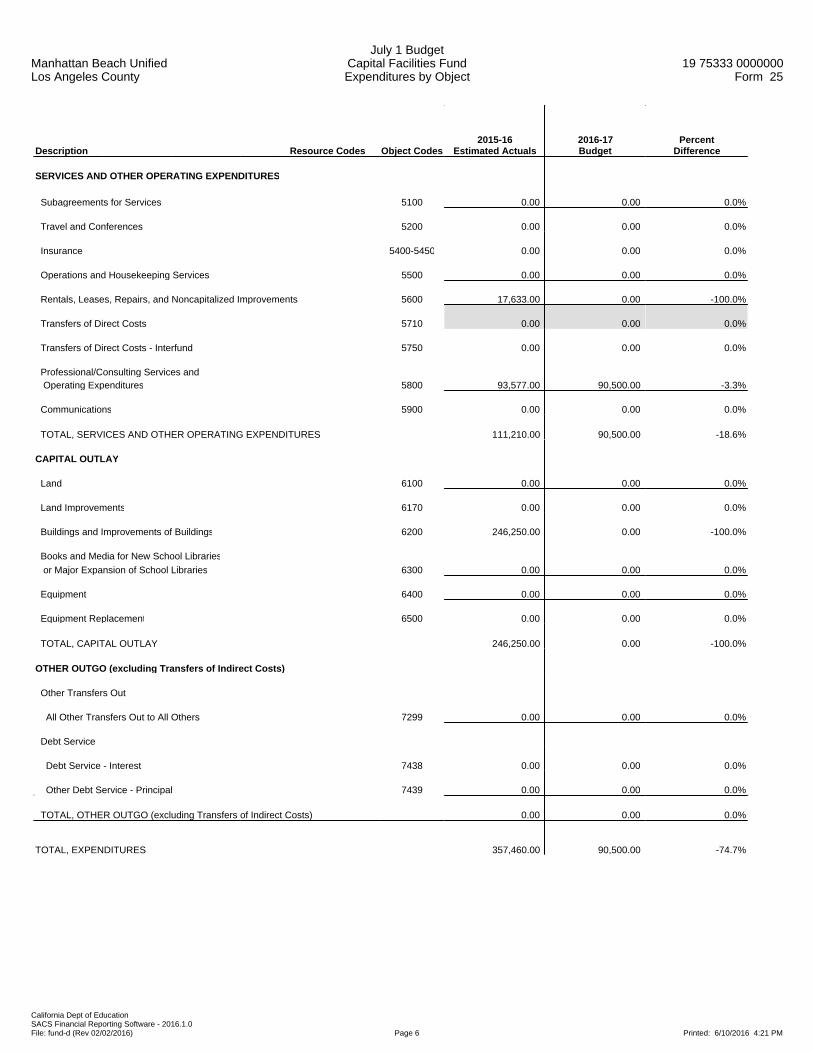
Manhattan Beach UnifiedLos Angeles County
July 1 BudgetCapital Facilities FundExpenditures by Object
19 75333 0000000Form 25
California Dept of EducationSACS Financial Reporting Software - 2016.1.0File: fund-d (Rev 02/02/2016) Page 6 Printed: 6/10/2016 4:21 PM
Description Resource Codes Object Codes2015-16
Estimated Actuals2016-17Budget
PercentDifference
SERVICES AND OTHER OPERATING EXPENDITURES
Subagreements for Services 5100 0.00 0.00 0.0%
Travel and Conferences 5200 0.00 0.00 0.0%
Insurance 5400-5450 0.00 0.00 0.0%
Operations and Housekeeping Services 5500 0.00 0.00 0.0%
Rentals, Leases, Repairs, and Noncapitalized Improvements 5600 17,633.00 0.00 -100.0%
Transfers of Direct Costs 5710 0.00 0.00 0.0%
Transfers of Direct Costs - Interfund 5750 0.00 0.00 0.0%
Professional/Consulting Services and Operating Expenditures 5800 93,577.00 90,500.00 -3.3%
Communications 5900 0.00 0.00 0.0%
TOTAL, SERVICES AND OTHER OPERATING EXPENDITURES 111,210.00 90,500.00 -18.6%
CAPITAL OUTLAY
Land 6100 0.00 0.00 0.0%
Land Improvements 6170 0.00 0.00 0.0%
Buildings and Improvements of Buildings 6200 246,250.00 0.00 -100.0%
Books and Media for New School Libraries or Major Expansion of School Libraries 6300 0.00 0.00 0.0%
Equipment 6400 0.00 0.00 0.0%
Equipment Replacement 6500 0.00 0.00 0.0%
TOTAL, CAPITAL OUTLAY 246,250.00 0.00 -100.0%
OTHER OUTGO (excluding Transfers of Indirect Costs)
Other Transfers Out
All Other Transfers Out to All Others 7299 0.00 0.00 0.0%
Debt Service
Debt Service - Interest 7438 0.00 0.00 0.0%
Other Debt Service - Principal 7439 0.00 0.00 0.0%
TOTAL, OTHER OUTGO (excluding Transfers of Indirect Costs) 0.00 0.00 0.0%
TOTAL, EXPENDITURES 357,460.00 90,500.00 -74.7%

Manhattan Beach UnifiedLos Angeles County
July 1 BudgetCapital Facilities FundExpenditures by Object
19 75333 0000000Form 25
California Dept of EducationSACS Financial Reporting Software - 2016.1.0File: fund-d (Rev 02/02/2016) Page 7 Printed: 6/10/2016 4:21 PM
Description Resource Codes Object Codes2015-16
Estimated Actuals2016-17Budget
PercentDifference
INTERFUND TRANSFERS
INTERFUND TRANSFERS IN
Other Authorized Interfund Transfers In 8919 0.00 0.00 0.0%
(a) TOTAL, INTERFUND TRANSFERS IN 0.00 0.00 0.0%
INTERFUND TRANSFERS OUT
To: State School Building Fund/ County School Facilities Fund 7613 0.00 0.00 0.0%
Other Authorized Interfund Transfers Out 7619 0.00 0.00 0.0%
(b) TOTAL, INTERFUND TRANSFERS OUT 0.00 0.00 0.0%
OTHER SOURCES/USES
SOURCES
Proceeds
Proceeds from Sale/Lease- Purchase of Land/Buildings 8953 0.00 0.00 0.0%
Other Sources
Transfers from Funds of Lapsed/Reorganized LEAs 8965 0.00 0.00 0.0%
Long-Term Debt Proceeds Proceeds from Certificates of Participation 8971 0.00 0.00 0.0%
Proceeds from Capital Leases 8972 0.00 0.00 0.0%
Proceeds from Lease Revenue Bonds 8973 0.00 0.00 0.0%
All Other Financing Sources 8979 0.00 0.00 0.0%
(c) TOTAL, SOURCES 0.00 0.00 0.0%
USES
Transfers of Funds from Lapsed/Reorganized LEAs 7651 0.00 0.00 0.0%
All Other Financing Uses 7699 0.00 0.00 0.0%
(d) TOTAL, USES 0.00 0.00 0.0%
CONTRIBUTIONS
Contributions from Unrestricted Revenues 8980 0.00 0.00 0.0%
Contributions from Restricted Revenues 8990 0.00 0.00 0.0%
(e) TOTAL, CONTRIBUTIONS 0.00 0.00 0.0%
TOTAL, OTHER FINANCING SOURCES/USES (a - b + c - d + e) 0.00 0.00 0.0%
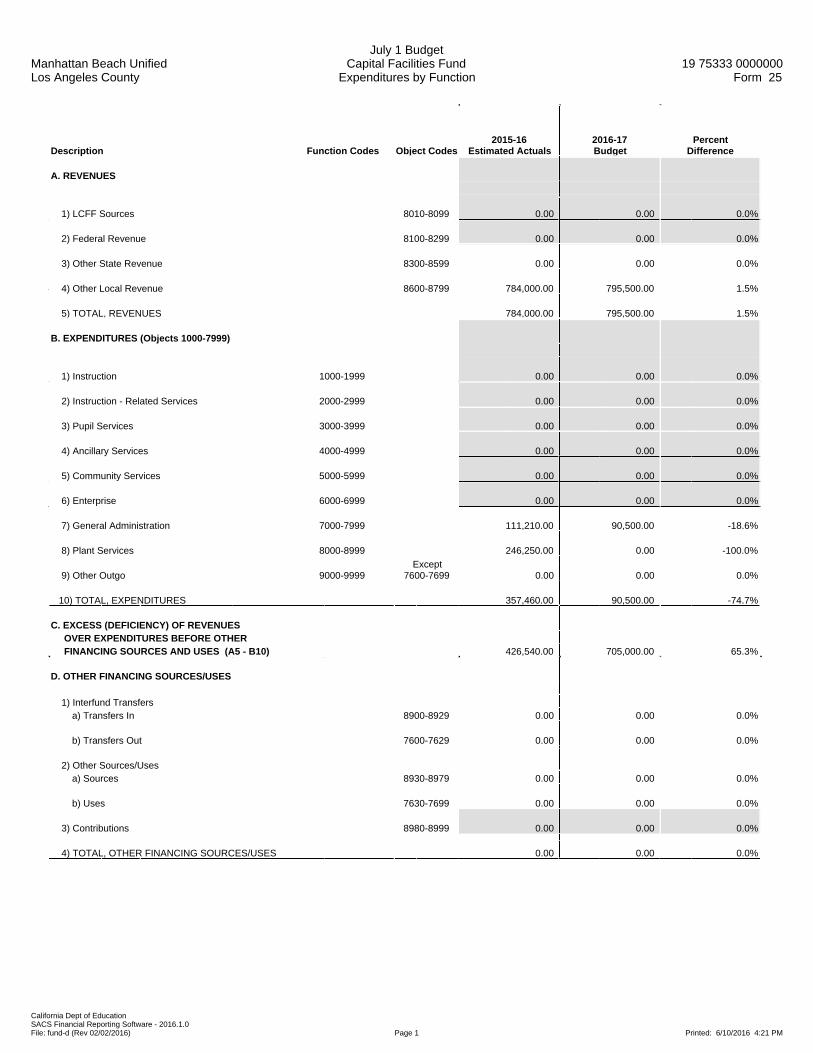
Manhattan Beach UnifiedLos Angeles County
July 1 BudgetCapital Facilities Fund
Expenditures by Function19 75333 0000000
Form 25
California Dept of EducationSACS Financial Reporting Software - 2016.1.0File: fund-d (Rev 02/02/2016) Page 1 Printed: 6/10/2016 4:21 PM
Description Function Codes Object Codes2015-16
Estimated Actuals2016-17Budget
PercentDifference
A. REVENUES
1) LCFF Sources 8010-8099 0.00 0.00 0.0%
2) Federal Revenue 8100-8299 0.00 0.00 0.0%
3) Other State Revenue 8300-8599 0.00 0.00 0.0%
4) Other Local Revenue 8600-8799 784,000.00 795,500.00 1.5%
5) TOTAL, REVENUES 784,000.00 795,500.00 1.5%
B. EXPENDITURES (Objects 1000-7999)
1) Instruction 1000-1999 0.00 0.00 0.0%
2) Instruction - Related Services 2000-2999 0.00 0.00 0.0%
3) Pupil Services 3000-3999 0.00 0.00 0.0%
4) Ancillary Services 4000-4999 0.00 0.00 0.0%
5) Community Services 5000-5999 0.00 0.00 0.0%
6) Enterprise 6000-6999 0.00 0.00 0.0%
7) General Administration 7000-7999 111,210.00 90,500.00 -18.6%
8) Plant Services 8000-8999 246,250.00 0.00 -100.0%
9) Other Outgo 9000-9999Except
7600-7699 0.00 0.00 0.0%
10) TOTAL, EXPENDITURES 357,460.00 90,500.00 -74.7%
C. EXCESS (DEFICIENCY) OF REVENUES OVER EXPENDITURES BEFORE OTHER FINANCING SOURCES AND USES (A5 - B10) 426,540.00 705,000.00 65.3%
D. OTHER FINANCING SOURCES/USES 1) Interfund Transfers a) Transfers In 8900-8929 0.00 0.00 0.0%
b) Transfers Out 7600-7629 0.00 0.00 0.0%
2) Other Sources/Uses a) Sources 8930-8979 0.00 0.00 0.0%
b) Uses 7630-7699 0.00 0.00 0.0%
3) Contributions 8980-8999 0.00 0.00 0.0%
4) TOTAL, OTHER FINANCING SOURCES/USES 0.00 0.00 0.0%

Manhattan Beach UnifiedLos Angeles County
July 1 BudgetCapital Facilities Fund
Expenditures by Function19 75333 0000000
Form 25
California Dept of EducationSACS Financial Reporting Software - 2016.1.0File: fund-d (Rev 02/02/2016) Page 2 Printed: 6/10/2016 4:21 PM
Description Function Codes Object Codes2015-16
Estimated Actuals2016-17Budget
PercentDifference
E. NET INCREASE (DECREASE) IN FUND BALANCE (C + D4) 426,540.00 705,000.00 65.3%
F. FUND BALANCE, RESERVES 1) Beginning Fund Balance
a) As of July 1 - Unaudited 9791 993,183.99 1,549,576.99 56.0%
b) Audit Adjustments 9793 129,853.00 0.00 -100.0%
c) As of July 1 - Audited (F1a + F1b) 1,123,036.99 1,549,576.99 38.0%
d) Other Restatements 9795 0.00 0.00 0.0%
e) Adjusted Beginning Balance (F1c + F1d) 1,123,036.99 1,549,576.99 38.0%
2) Ending Balance, June 30 (E + F1e) 1,549,576.99 2,254,576.99 45.5% Components of Ending Fund Balance a) Nonspendable Revolving Cash 9711 0.00 0.00 0.0%
Stores 9712 0.00 0.00 0.0%
Prepaid Expenditures 9713 0.00 0.00 0.0%
All Others 9719 0.00 0.00 0.0%
b) Restricted 9740 0.00 0.00 0.0%
c) Committed Stabilization Arrangements 9750 0.00 0.00 0.0%
Other Commitments (by Resource/Object) 9760 0.00 0.00 0.0%
d) Assigned Other Assignments (by Resource/Object) 9780 1,549,576.99 2,254,576.99 45.5%
e) Unassigned/Unappropriated Reserve for Economic Uncertainties 9789 0.00 0.00 0.0%
Unassigned/Unappropriated Amount 9790 0.00 0.00 0.0%

Manhattan Beach UnifiedLos Angeles County
July 1 BudgetCapital Facilities Fund
Exhibit: Restricted Balance Detail19 75333 0000000
Form 25
California Dept of EducationSACS Financial Reporting Software - 2016.1.0File: fund-d (Rev 04/06/2011) Page 1 Printed: 6/10/2016 4:21 PM
2015-16 2016-17Resource Description Estimated Actuals Budget
Total, Restricted Balance 0.00 0.00

Manhattan Beach UnifiedLos Angeles County
July 1 BudgetSpecial Reserve Fund for Capital Outlay Projects
Expenditures by Object19 75333 0000000
Form 40
California Dept of EducationSACS Financial Reporting Software - 2016.1.0File: fund-d (Rev 02/02/2016) Page 1 Printed: 6/10/2016 4:21 PM
Description Resource Codes Object Codes2015-16
Estimated Actuals2016-17Budget
PercentDifference
A. REVENUES
1) LCFF Sources 8010-8099 0.00 0.00 0.0%
2) Federal Revenue 8100-8299 0.00 0.00 0.0%
3) Other State Revenue 8300-8599 0.00 0.00 0.0%
4) Other Local Revenue 8600-8799 15,000.00 40,000.00 166.7%
5) TOTAL, REVENUES 15,000.00 40,000.00 166.7%
B. EXPENDITURES
1) Certificated Salaries 1000-1999 0.00 0.00 0.0%
2) Classified Salaries 2000-2999 0.00 0.00 0.0%
3) Employee Benefits 3000-3999 0.00 0.00 0.0%
4) Books and Supplies 4000-4999 577,443.00 0.00 -100.0%
5) Services and Other Operating Expenditures 5000-5999 111,281.00 0.00 -100.0%
6) Capital Outlay 6000-6999 6,725,596.00 3,900,000.00 -42.0%
7) Other Outgo (excluding Transfers of Indirect 7100-7299, Costs) 7400-7499 0.00 0.00 0.0%
8) Other Outgo - Transfers of Indirect Costs 7300-7399 0.00 0.00 0.0%
9) TOTAL, EXPENDITURES 7,414,320.00 3,900,000.00 -47.4%
C. EXCESS (DEFICIENCY) OF REVENUES OVER EXPENDITURES BEFORE OTHER FINANCING SOURCES AND USES (A5 - B9) (7,399,320.00) (3,860,000.00) -47.8%
D. OTHER FINANCING SOURCES/USES 1) Interfund Transfers a) Transfers In 8900-8929 0.00 0.00 0.0%
b) Transfers Out 7600-7629 0.00 0.00 0.0%
2) Other Sources/Uses a) Sources 8930-8979 0.00 0.00 0.0%
b) Uses 7630-7699 0.00 0.00 0.0%
3) Contributions 8980-8999 0.00 0.00 0.0%
4) TOTAL, OTHER FINANCING SOURCES/USES 0.00 0.00 0.0%
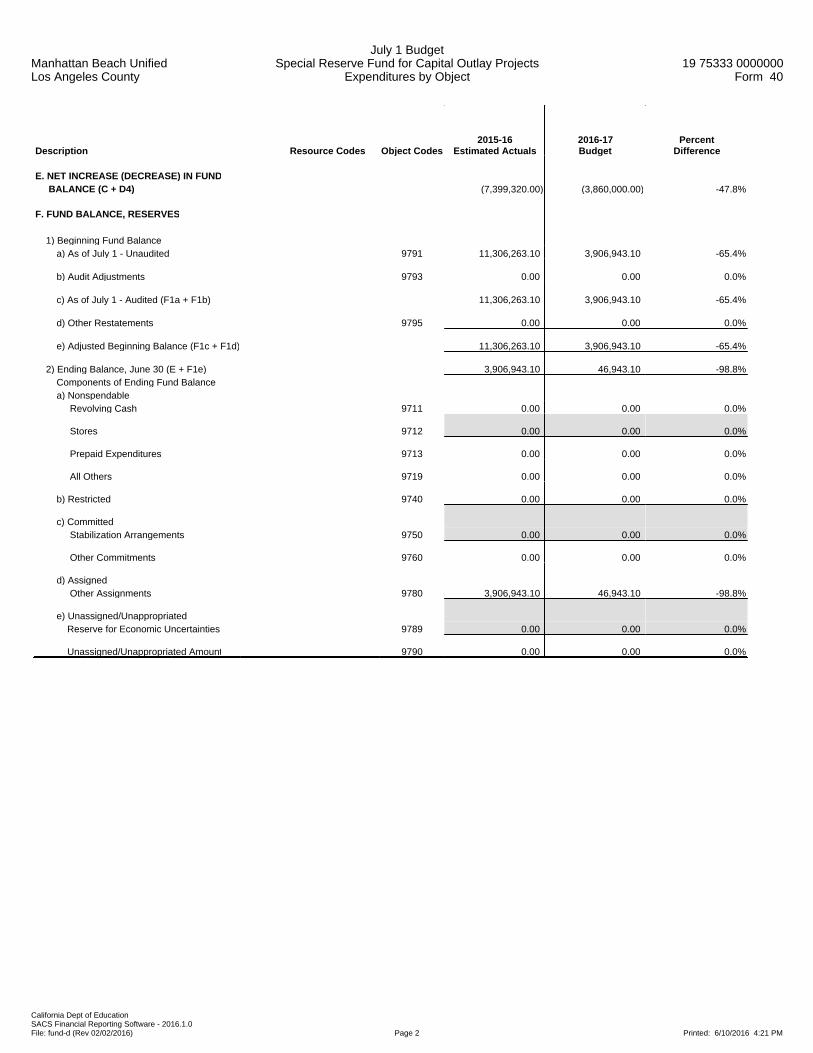
Manhattan Beach UnifiedLos Angeles County
July 1 BudgetSpecial Reserve Fund for Capital Outlay Projects
Expenditures by Object19 75333 0000000
Form 40
California Dept of EducationSACS Financial Reporting Software - 2016.1.0File: fund-d (Rev 02/02/2016) Page 2 Printed: 6/10/2016 4:21 PM
Description Resource Codes Object Codes2015-16
Estimated Actuals2016-17Budget
PercentDifference
E. NET INCREASE (DECREASE) IN FUND BALANCE (C + D4) (7,399,320.00) (3,860,000.00) -47.8%
F. FUND BALANCE, RESERVES 1) Beginning Fund Balance a) As of July 1 - Unaudited 9791 11,306,263.10 3,906,943.10 -65.4%
b) Audit Adjustments 9793 0.00 0.00 0.0%
c) As of July 1 - Audited (F1a + F1b) 11,306,263.10 3,906,943.10 -65.4%
d) Other Restatements 9795 0.00 0.00 0.0%
e) Adjusted Beginning Balance (F1c + F1d) 11,306,263.10 3,906,943.10 -65.4%
2) Ending Balance, June 30 (E + F1e) 3,906,943.10 46,943.10 -98.8% Components of Ending Fund Balance a) Nonspendable Revolving Cash 9711 0.00 0.00 0.0%
Stores 9712 0.00 0.00 0.0%
Prepaid Expenditures 9713 0.00 0.00 0.0%
All Others 9719 0.00 0.00 0.0%
b) Restricted 9740 0.00 0.00 0.0%
c) Committed Stabilization Arrangements 9750 0.00 0.00 0.0%
Other Commitments 9760 0.00 0.00 0.0%
d) Assigned Other Assignments 9780 3,906,943.10 46,943.10 -98.8%
e) Unassigned/Unappropriated Reserve for Economic Uncertainties 9789 0.00 0.00 0.0%
Unassigned/Unappropriated Amount 9790 0.00 0.00 0.0%

Manhattan Beach UnifiedLos Angeles County
July 1 BudgetSpecial Reserve Fund for Capital Outlay Projects
Expenditures by Object19 75333 0000000
Form 40
California Dept of EducationSACS Financial Reporting Software - 2016.1.0File: fund-d (Rev 02/02/2016) Page 3 Printed: 6/10/2016 4:21 PM
Description Resource Codes Object Codes2015-16
Estimated Actuals2016-17Budget
PercentDifference
G. ASSETS 1) Cash a) in County Treasury 9110 0.00
1) Fair Value Adjustment to Cash in County Treasury 9111 0.00
b) in Banks 9120 0.00
c) in Revolving Fund 9130 0.00
d) with Fiscal Agent 9135 0.00
e) collections awaiting deposit 9140 0.00
2) Investments 9150 0.00
3) Accounts Receivable 9200 0.00
4) Due from Grantor Government 9290 0.00
5) Due from Other Funds 9310 0.00
6) Stores 9320 0.00
7) Prepaid Expenditures 9330 0.00
8) Other Current Assets 9340 0.00
9) TOTAL, ASSETS 0.00
H. DEFERRED OUTFLOWS OF RESOURCES
1) Deferred Outflows of Resources 9490 0.00
2) TOTAL, DEFERRED OUTFLOWS 0.00
I. LIABILITIES
1) Accounts Payable 9500 0.00
2) Due to Grantor Governments 9590 0.00
3) Due to Other Funds 9610 0.00
4) Current Loans 9640 0.00
5) Unearned Revenue 9650 0.00
6) TOTAL, LIABILITIES 0.00
J. DEFERRED INFLOWS OF RESOURCES
1) Deferred Inflows of Resources 9690 0.00
2) TOTAL, DEFERRED INFLOWS 0.00
K. FUND EQUITY
Ending Fund Balance, June 30 (G9 + H2) - (I6 + J2) 0.00

Manhattan Beach UnifiedLos Angeles County
July 1 BudgetSpecial Reserve Fund for Capital Outlay Projects
Expenditures by Object19 75333 0000000
Form 40
California Dept of EducationSACS Financial Reporting Software - 2016.1.0File: fund-d (Rev 02/02/2016) Page 4 Printed: 6/10/2016 4:21 PM
Description Resource Codes Object Codes2015-16
Estimated Actuals2016-17Budget
PercentDifference
FEDERAL REVENUE
FEMA 8281 0.00 0.00 0.0%
All Other Federal Revenue 8290 0.00 0.00 0.0%
TOTAL, FEDERAL REVENUE 0.00 0.00 0.0%
OTHER STATE REVENUE
Pass-Through Revenues from State Sources 8587 0.00 0.00 0.0%
California Clean Energy Jobs Act 6230 8590 0.00 0.00 0.0%
All Other State Revenue All Other 8590 0.00 0.00 0.0%
TOTAL, OTHER STATE REVENUE 0.00 0.00 0.0%
OTHER LOCAL REVENUE
Other Local Revenue
Community Redevelopment Funds Not Subject to LCFF Deduction 8625 0.00 0.00 0.0%
Sales Sale of Equipment/Supplies 8631 0.00 0.00 0.0%
Leases and Rentals 8650 0.00 0.00 0.0%
Interest 8660 15,000.00 40,000.00 166.7%
Net Increase (Decrease) in the Fair Value of Investments 8662 0.00 0.00 0.0%
Other Local Revenue
All Other Local Revenue 8699 0.00 0.00 0.0%
All Other Transfers In from All Others 8799 0.00 0.00 0.0%
TOTAL, OTHER LOCAL REVENUE 15,000.00 40,000.00 166.7%
TOTAL, REVENUES 15,000.00 40,000.00 166.7%

Manhattan Beach UnifiedLos Angeles County
July 1 BudgetSpecial Reserve Fund for Capital Outlay Projects
Expenditures by Object19 75333 0000000
Form 40
California Dept of EducationSACS Financial Reporting Software - 2016.1.0File: fund-d (Rev 02/02/2016) Page 5 Printed: 6/10/2016 4:21 PM
Description Resource Codes Object Codes2015-16
Estimated Actuals2016-17Budget
PercentDifference
CLASSIFIED SALARIES
Classified Support Salaries 2200 0.00 0.00 0.0%
Classified Supervisors' and Administrators' Salaries 2300 0.00 0.00 0.0%
Clerical, Technical and Office Salaries 2400 0.00 0.00 0.0%
Other Classified Salaries 2900 0.00 0.00 0.0%
TOTAL, CLASSIFIED SALARIES 0.00 0.00 0.0%
EMPLOYEE BENEFITS
STRS 3101-3102 0.00 0.00 0.0%
PERS 3201-3202 0.00 0.00 0.0%
OASDI/Medicare/Alternative 3301-3302 0.00 0.00 0.0%
Health and Welfare Benefits 3401-3402 0.00 0.00 0.0%
Unemployment Insurance 3501-3502 0.00 0.00 0.0%
Workers' Compensation 3601-3602 0.00 0.00 0.0%
OPEB, Allocated 3701-3702 0.00 0.00 0.0%
OPEB, Active Employees 3751-3752 0.00 0.00 0.0%
Other Employee Benefits 3901-3902 0.00 0.00 0.0%
TOTAL, EMPLOYEE BENEFITS 0.00 0.00 0.0%
BOOKS AND SUPPLIES
Books and Other Reference Materials 4200 0.00 0.00 0.0%
Materials and Supplies 4300 577,443.00 0.00 -100.0%
Noncapitalized Equipment 4400 0.00 0.00 0.0%
TOTAL, BOOKS AND SUPPLIES 577,443.00 0.00 -100.0%

Manhattan Beach UnifiedLos Angeles County
July 1 BudgetSpecial Reserve Fund for Capital Outlay Projects
Expenditures by Object19 75333 0000000
Form 40
California Dept of EducationSACS Financial Reporting Software - 2016.1.0File: fund-d (Rev 02/02/2016) Page 6 Printed: 6/10/2016 4:21 PM
Description Resource Codes Object Codes2015-16
Estimated Actuals2016-17Budget
PercentDifference
SERVICES AND OTHER OPERATING EXPENDITURES
Subagreements for Services 5100 0.00 0.00 0.0%
Travel and Conferences 5200 0.00 0.00 0.0%
Insurance 5400-5450 0.00 0.00 0.0%
Operations and Housekeeping Services 5500 0.00 0.00 0.0%
Rentals, Leases, Repairs, and Noncapitalized Improvements 5600 0.00 0.00 0.0%
Transfers of Direct Costs 5710 0.00 0.00 0.0%
Transfers of Direct Costs - Interfund 5750 0.00 0.00 0.0%
Professional/Consulting Services and Operating Expenditures 5800 111,281.00 0.00 -100.0%
Communications 5900 0.00 0.00 0.0%
TOTAL, SERVICES AND OTHER OPERATING EXPENDITURES 111,281.00 0.00 -100.0%
CAPITAL OUTLAY
Land 6100 0.00 0.00 0.0%
Land Improvements 6170 0.00 0.00 0.0%
Buildings and Improvements of Buildings 6200 6,725,596.00 3,900,000.00 -42.0%
Books and Media for New School Libraries or Major Expansion of School Libraries 6300 0.00 0.00 0.0%
Equipment 6400 0.00 0.00 0.0%
Equipment Replacement 6500 0.00 0.00 0.0%
TOTAL, CAPITAL OUTLAY 6,725,596.00 3,900,000.00 -42.0%
OTHER OUTGO (excluding Transfers of Indirect Costs)
Other Transfers Out
Transfers of Pass-Through Revenues To Districts or Charter Schools 7211 0.00 0.00 0.0%
To County Offices 7212 0.00 0.00 0.0%
To JPAs 7213 0.00 0.00 0.0%
All Other Transfers Out to All Others 7299 0.00 0.00 0.0%
Debt Service
Debt Service - Interest 7438 0.00 0.00 0.0%
Other Debt Service - Principal 7439 0.00 0.00 0.0%
TOTAL, OTHER OUTGO (excluding Transfers of Indirect Costs) 0.00 0.00 0.0%
TOTAL, EXPENDITURES 7,414,320.00 3,900,000.00 -47.4%
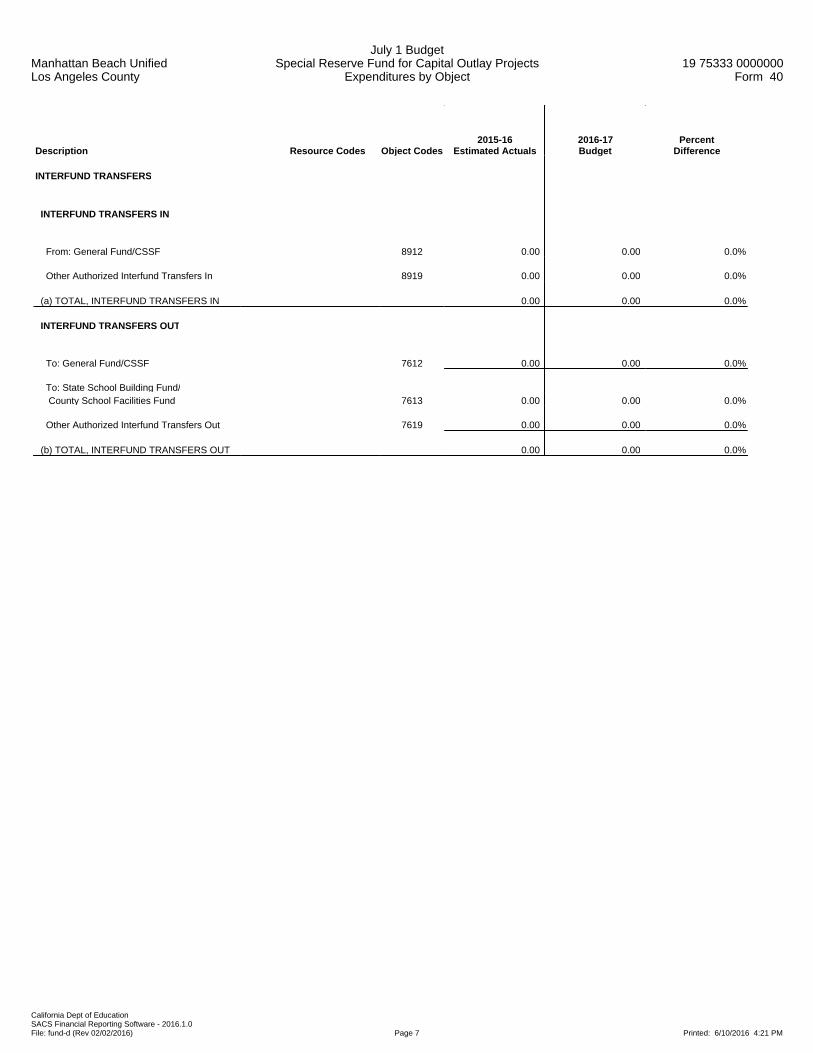
Manhattan Beach UnifiedLos Angeles County
July 1 BudgetSpecial Reserve Fund for Capital Outlay Projects
Expenditures by Object19 75333 0000000
Form 40
California Dept of EducationSACS Financial Reporting Software - 2016.1.0File: fund-d (Rev 02/02/2016) Page 7 Printed: 6/10/2016 4:21 PM
Description Resource Codes Object Codes2015-16
Estimated Actuals2016-17Budget
PercentDifference
INTERFUND TRANSFERS
INTERFUND TRANSFERS IN
From: General Fund/CSSF 8912 0.00 0.00 0.0%
Other Authorized Interfund Transfers In 8919 0.00 0.00 0.0%
(a) TOTAL, INTERFUND TRANSFERS IN 0.00 0.00 0.0%
INTERFUND TRANSFERS OUT
To: General Fund/CSSF 7612 0.00 0.00 0.0%
To: State School Building Fund/ County School Facilities Fund 7613 0.00 0.00 0.0%
Other Authorized Interfund Transfers Out 7619 0.00 0.00 0.0%
(b) TOTAL, INTERFUND TRANSFERS OUT 0.00 0.00 0.0%

Manhattan Beach UnifiedLos Angeles County
July 1 BudgetSpecial Reserve Fund for Capital Outlay Projects
Expenditures by Object19 75333 0000000
Form 40
California Dept of EducationSACS Financial Reporting Software - 2016.1.0File: fund-d (Rev 02/02/2016) Page 8 Printed: 6/10/2016 4:21 PM
Description Resource Codes Object Codes2015-16
Estimated Actuals2016-17Budget
PercentDifference
OTHER SOURCES/USES
SOURCES
Proceeds
Proceeds from Sale/Lease- Purchase of Land/Buildings 8953 0.00 0.00 0.0%
Other Sources
Transfers from Funds of Lapsed/Reorganized LEAs 8965 0.00 0.00 0.0%
Long-Term Debt Proceeds Proceeds from Certificates of Participation 8971 0.00 0.00 0.0%
Proceeds from Capital Leases 8972 0.00 0.00 0.0%
Proceeds from Lease Revenue Bonds 8973 0.00 0.00 0.0%
All Other Financing Sources 8979 0.00 0.00 0.0%
(c) TOTAL, SOURCES 0.00 0.00 0.0%
USES
Transfers of Funds from Lapsed/Reorganized LEAs 7651 0.00 0.00 0.0%
All Other Financing Uses 7699 0.00 0.00 0.0%
(d) TOTAL, USES 0.00 0.00 0.0%
CONTRIBUTIONS
Contributions from Unrestricted Revenues 8980 0.00 0.00 0.0%
Contributions from Restricted Revenues 8990 0.00 0.00 0.0%
(e) TOTAL, CONTRIBUTIONS 0.00 0.00 0.0%
TOTAL, OTHER FINANCING SOURCES/USES (a - b + c - d + e) 0.00 0.00 0.0%

Manhattan Beach UnifiedLos Angeles County
July 1 BudgetSpecial Reserve Fund for Capital Outlay Projects
Expenditures by Function19 75333 0000000
Form 40
California Dept of EducationSACS Financial Reporting Software - 2016.1.0File: fund-d (Rev 02/02/2016) Page 1 Printed: 6/10/2016 4:21 PM
Description Function Codes Object Codes2015-16
Estimated Actuals2016-17Budget
PercentDifference
A. REVENUES
1) LCFF Sources 8010-8099 0.00 0.00 0.0%
2) Federal Revenue 8100-8299 0.00 0.00 0.0%
3) Other State Revenue 8300-8599 0.00 0.00 0.0%
4) Other Local Revenue 8600-8799 15,000.00 40,000.00 166.7%
5) TOTAL, REVENUES 15,000.00 40,000.00 166.7%
B. EXPENDITURES (Objects 1000-7999)
1) Instruction 1000-1999 0.00 0.00 0.0%
2) Instruction - Related Services 2000-2999 0.00 0.00 0.0%
3) Pupil Services 3000-3999 0.00 0.00 0.0%
4) Ancillary Services 4000-4999 0.00 0.00 0.0%
5) Community Services 5000-5999 0.00 0.00 0.0%
6) Enterprise 6000-6999 0.00 0.00 0.0%
7) General Administration 7000-7999 0.00 0.00 0.0%
8) Plant Services 8000-8999 7,414,320.00 3,900,000.00 -47.4%
9) Other Outgo 9000-9999Except
7600-7699 0.00 0.00 0.0%
10) TOTAL, EXPENDITURES 7,414,320.00 3,900,000.00 -47.4%
C. EXCESS (DEFICIENCY) OF REVENUES OVER EXPENDITURES BEFORE OTHER FINANCING SOURCES AND USES (A5 - B10) (7,399,320.00) (3,860,000.00) -47.8%
D. OTHER FINANCING SOURCES/USES 1) Interfund Transfers a) Transfers In 8900-8929 0.00 0.00 0.0%
b) Transfers Out 7600-7629 0.00 0.00 0.0%
2) Other Sources/Uses a) Sources 8930-8979 0.00 0.00 0.0%
b) Uses 7630-7699 0.00 0.00 0.0%
3) Contributions 8980-8999 0.00 0.00 0.0%
4) TOTAL, OTHER FINANCING SOURCES/USES 0.00 0.00 0.0%

Manhattan Beach UnifiedLos Angeles County
July 1 BudgetSpecial Reserve Fund for Capital Outlay Projects
Expenditures by Function19 75333 0000000
Form 40
California Dept of EducationSACS Financial Reporting Software - 2016.1.0File: fund-d (Rev 02/02/2016) Page 2 Printed: 6/10/2016 4:21 PM
Description Function Codes Object Codes2015-16
Estimated Actuals2016-17Budget
PercentDifference
E. NET INCREASE (DECREASE) IN FUND BALANCE (C + D4) (7,399,320.00) (3,860,000.00) -47.8%
F. FUND BALANCE, RESERVES 1) Beginning Fund Balance
a) As of July 1 - Unaudited 9791 11,306,263.10 3,906,943.10 -65.4%
b) Audit Adjustments 9793 0.00 0.00 0.0%
c) As of July 1 - Audited (F1a + F1b) 11,306,263.10 3,906,943.10 -65.4%
d) Other Restatements 9795 0.00 0.00 0.0%
e) Adjusted Beginning Balance (F1c + F1d) 11,306,263.10 3,906,943.10 -65.4%
2) Ending Balance, June 30 (E + F1e) 3,906,943.10 46,943.10 -98.8% Components of Ending Fund Balance a) Nonspendable Revolving Cash 9711 0.00 0.00 0.0%
Stores 9712 0.00 0.00 0.0%
Prepaid Expenditures 9713 0.00 0.00 0.0%
All Others 9719 0.00 0.00 0.0%
b) Restricted 9740 0.00 0.00 0.0%
c) Committed Stabilization Arrangements 9750 0.00 0.00 0.0%
Other Commitments (by Resource/Object) 9760 0.00 0.00 0.0%
d) Assigned Other Assignments (by Resource/Object) 9780 3,906,943.10 46,943.10 -98.8%
e) Unassigned/Unappropriated Reserve for Economic Uncertainties 9789 0.00 0.00 0.0%
Unassigned/Unappropriated Amount 9790 0.00 0.00 0.0%
Manhattan Beach UnifiedLos Angeles County
July 1 BudgetSpecial Reserve Fund for Capital Outlay Projects
Exhibit: Restricted Balance Detail19 75333 0000000
Form 40
California Dept of EducationSACS Financial Reporting Software - 2016.1.0File: fund-d (Rev 04/06/2011) Page 1 Printed: 6/10/2016 4:21 PM
2015-16 2016-17Resource Description Estimated Actuals Budget
Total, Restricted Balance 0.00 0.00

This Page is Blank.

Manhattan Beach UnifiedLos Angeles County
July 1 BudgetBond Interest and Redemption Fund
Expenditures by Object19 75333 0000000
Form 51
California Dept of EducationSACS Financial Reporting Software - 2016.1.0File: fund-d (Rev 02/02/2016) Page 1 Printed: 6/10/2016 4:21 PM
Description Resource Codes Object Codes2015-16
Estimated Actuals2016-17Budget
PercentDifference
A. REVENUES
1) LCFF Sources 8010-8099 0.00 0.00 0.0%
2) Federal Revenue 8100-8299 0.00 0.00 0.0%
3) Other State Revenue 8300-8599 0.00 0.00 0.0%
4) Other Local Revenue 8600-8799 10,218,407.00 0.00 -100.0%
5) TOTAL, REVENUES 10,218,407.00 0.00 -100.0%
B. EXPENDITURES
1) Certificated Salaries 1000-1999 0.00 0.00 0.0%
2) Classified Salaries 2000-2999 0.00 0.00 0.0%
3) Employee Benefits 3000-3999 0.00 0.00 0.0%
4) Books and Supplies 4000-4999 0.00 0.00 0.0%
5) Services and Other Operating Expenditures 5000-5999 0.00 0.00 0.0%
6) Capital Outlay 6000-6999 0.00 0.00 0.0%
7) Other Outgo (excluding Transfers of Indirect 7100-7299, Costs) 7400-7499 10,972,832.00 0.00 -100.0%
8) Other Outgo - Transfers of Indirect Costs 7300-7399 0.00 0.00 0.0%
9) TOTAL, EXPENDITURES 10,972,832.00 0.00 -100.0%
C. EXCESS (DEFICIENCY) OF REVENUES OVER EXPENDITURES BEFORE OTHER FINANCING SOURCES AND USES (A5 - B9) (754,425.00) 0.00 -100.0%
D. OTHER FINANCING SOURCES/USES 1) Interfund Transfers a) Transfers In 8900-8929 0.00 0.00 0.0%
b) Transfers Out 7600-7629 0.00 0.00 0.0%
2) Other Sources/Uses a) Sources 8930-8979 0.00 0.00 0.0%
b) Uses 7630-7699 0.00 0.00 0.0%
3) Contributions 8980-8999 0.00 0.00 0.0%
4) TOTAL, OTHER FINANCING SOURCES/USES 0.00 0.00 0.0%

Manhattan Beach UnifiedLos Angeles County
July 1 BudgetBond Interest and Redemption Fund
Expenditures by Object19 75333 0000000
Form 51
California Dept of EducationSACS Financial Reporting Software - 2016.1.0File: fund-d (Rev 02/02/2016) Page 2 Printed: 6/10/2016 4:21 PM
Description Resource Codes Object Codes2015-16
Estimated Actuals2016-17Budget
PercentDifference
E. NET INCREASE (DECREASE) IN FUND BALANCE (C + D4) (754,425.00) 0.00 -100.0%
F. FUND BALANCE, RESERVES 1) Beginning Fund Balance a) As of July 1 - Unaudited 9791 11,095,334.00 10,340,909.00 -6.8%
b) Audit Adjustments 9793 0.00 0.00 0.0%
c) As of July 1 - Audited (F1a + F1b) 11,095,334.00 10,340,909.00 -6.8%
d) Other Restatements 9795 0.00 0.00 0.0%
e) Adjusted Beginning Balance (F1c + F1d) 11,095,334.00 10,340,909.00 -6.8%
2) Ending Balance, June 30 (E + F1e) 10,340,909.00 10,340,909.00 0.0% Components of Ending Fund Balance a) Nonspendable Revolving Cash 9711 0.00 0.00 0.0%
Stores 9712 0.00 0.00 0.0%
Prepaid Expenditures 9713 0.00 0.00 0.0%
All Others 9719 0.00 0.00 0.0%
b) Restricted 9740 0.00 0.00 0.0%
c) Committed Stabilization Arrangements 9750 0.00 0.00 0.0%
Other Commitments 9760 0.00 0.00 0.0%
d) Assigned Other Assignments 9780 10,340,909.00 10,340,909.00 0.0%
e) Unassigned/Unappropriated Reserve for Economic Uncertainties 9789 0.00 0.00 0.0%
Unassigned/Unappropriated Amount 9790 0.00 0.00 0.0%

Manhattan Beach UnifiedLos Angeles County
July 1 BudgetBond Interest and Redemption Fund
Expenditures by Object19 75333 0000000
Form 51
California Dept of EducationSACS Financial Reporting Software - 2016.1.0File: fund-d (Rev 02/02/2016) Page 3 Printed: 6/10/2016 4:21 PM
Description Resource Codes Object Codes2015-16
Estimated Actuals2016-17Budget
PercentDifference
G. ASSETS 1) Cash a) in County Treasury 9110 11,095,334.00
1) Fair Value Adjustment to Cash in County Treasury 9111 0.00
b) in Banks 9120 0.00
c) in Revolving Fund 9130 0.00
d) with Fiscal Agent 9135 0.00
e) collections awaiting deposit 9140 0.00
2) Investments 9150 0.00
3) Accounts Receivable 9200 0.00
4) Due from Grantor Government 9290 0.00
5) Due from Other Funds 9310 0.00
6) Stores 9320 0.00
7) Prepaid Expenditures 9330 0.00
8) Other Current Assets 9340 0.00
9) TOTAL, ASSETS 11,095,334.00
H. DEFERRED OUTFLOWS OF RESOURCES
1) Deferred Outflows of Resources 9490 0.00
2) TOTAL, DEFERRED OUTFLOWS 0.00
I. LIABILITIES
1) Accounts Payable 9500 0.00
2) Due to Grantor Governments 9590 0.00
3) Due to Other Funds 9610 0.00
4) Current Loans 9640 0.00
5) Unearned Revenue 9650 0.00
6) TOTAL, LIABILITIES 0.00
J. DEFERRED INFLOWS OF RESOURCES
1) Deferred Inflows of Resources 9690 0.00
2) TOTAL, DEFERRED INFLOWS 0.00
K. FUND EQUITY
Ending Fund Balance, June 30 (G9 + H2) - (I6 + J2) 11,095,334.00
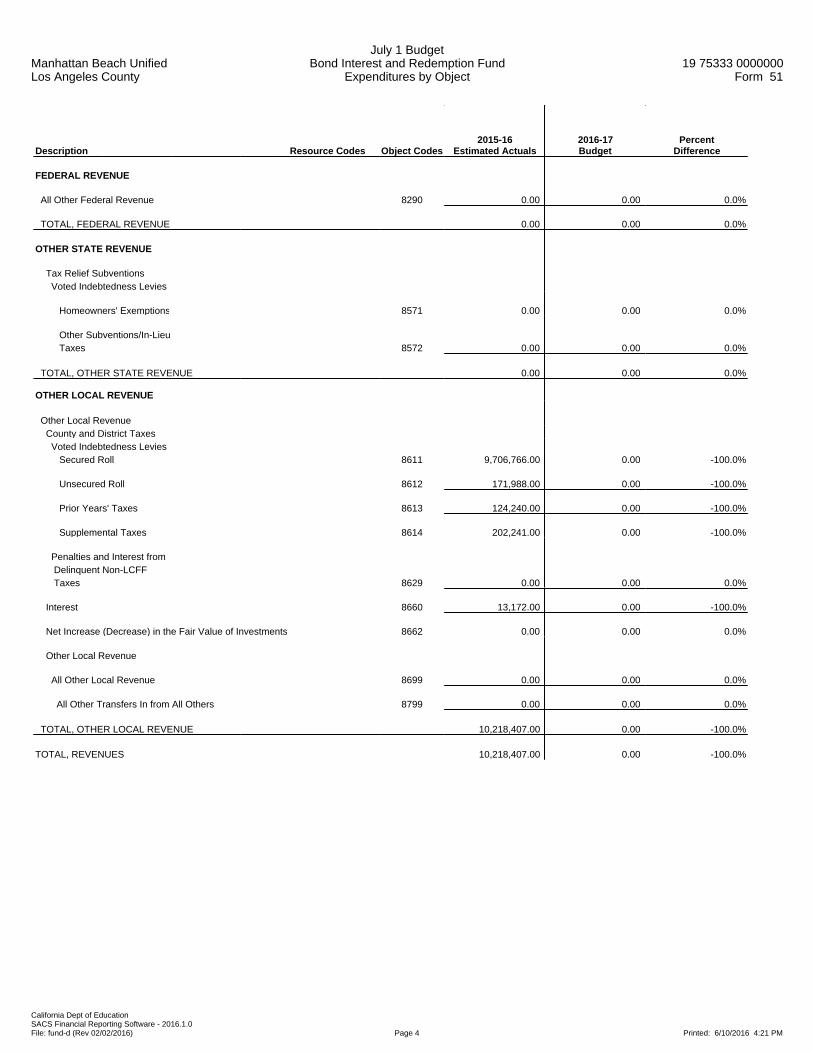
Manhattan Beach UnifiedLos Angeles County
July 1 BudgetBond Interest and Redemption Fund
Expenditures by Object19 75333 0000000
Form 51
California Dept of EducationSACS Financial Reporting Software - 2016.1.0File: fund-d (Rev 02/02/2016) Page 4 Printed: 6/10/2016 4:21 PM
Description Resource Codes Object Codes2015-16
Estimated Actuals2016-17Budget
PercentDifference
FEDERAL REVENUE
All Other Federal Revenue 8290 0.00 0.00 0.0%
TOTAL, FEDERAL REVENUE 0.00 0.00 0.0%
OTHER STATE REVENUE
Tax Relief Subventions Voted Indebtedness Levies
Homeowners' Exemptions 8571 0.00 0.00 0.0%
Other Subventions/In-Lieu Taxes 8572 0.00 0.00 0.0%
TOTAL, OTHER STATE REVENUE 0.00 0.00 0.0%
OTHER LOCAL REVENUE
Other Local Revenue County and District Taxes Voted Indebtedness Levies Secured Roll 8611 9,706,766.00 0.00 -100.0%
Unsecured Roll 8612 171,988.00 0.00 -100.0%
Prior Years' Taxes 8613 124,240.00 0.00 -100.0%
Supplemental Taxes 8614 202,241.00 0.00 -100.0%
Penalties and Interest from Delinquent Non-LCFF Taxes 8629 0.00 0.00 0.0%
Interest 8660 13,172.00 0.00 -100.0%
Net Increase (Decrease) in the Fair Value of Investments 8662 0.00 0.00 0.0%
Other Local Revenue
All Other Local Revenue 8699 0.00 0.00 0.0%
All Other Transfers In from All Others 8799 0.00 0.00 0.0%
TOTAL, OTHER LOCAL REVENUE 10,218,407.00 0.00 -100.0%
TOTAL, REVENUES 10,218,407.00 0.00 -100.0%

Manhattan Beach UnifiedLos Angeles County
July 1 BudgetBond Interest and Redemption Fund
Expenditures by Object19 75333 0000000
Form 51
California Dept of EducationSACS Financial Reporting Software - 2016.1.0File: fund-d (Rev 02/02/2016) Page 5 Printed: 6/10/2016 4:21 PM
Description Resource Codes Object Codes2015-16
Estimated Actuals2016-17Budget
PercentDifference
OTHER OUTGO (excluding Transfers of Indirect Costs)
Debt Service
Bond Redemptions 7433 6,992,251.00 0.00 -100.0%
Bond Interest and Other Service Charges 7434 3,980,581.00 0.00 -100.0%
Debt Service - Interest 7438 0.00 0.00 0.0%
Other Debt Service - Principal 7439 0.00 0.00 0.0%
TOTAL, OTHER OUTGO (excluding Transfers of Indirect Costs) 10,972,832.00 0.00 -100.0%
TOTAL, EXPENDITURES 10,972,832.00 0.00 -100.0%

Manhattan Beach UnifiedLos Angeles County
July 1 BudgetBond Interest and Redemption Fund
Expenditures by Object19 75333 0000000
Form 51
California Dept of EducationSACS Financial Reporting Software - 2016.1.0File: fund-d (Rev 02/02/2016) Page 6 Printed: 6/10/2016 4:21 PM
Description Resource Codes Object Codes2015-16
Estimated Actuals2016-17Budget
PercentDifference
INTERFUND TRANSFERS
INTERFUND TRANSFERS IN
Other Authorized Interfund Transfers In 8919 0.00 0.00 0.0%
(a) TOTAL, INTERFUND TRANSFERS IN 0.00 0.00 0.0%
INTERFUND TRANSFERS OUT
To: General Fund 7614 0.00 0.00 0.0%
Other Authorized Interfund Transfers Out 7619 0.00 0.00 0.0%
(b) TOTAL, INTERFUND TRANSFERS OUT 0.00 0.00 0.0%
OTHER SOURCES/USES
SOURCES
Other Sources
Transfers from Funds of Lapsed/Reorganized LEAs 8965 0.00 0.00 0.0%
All Other Financing Sources 8979 0.00 0.00 0.0%
(c) TOTAL, SOURCES 0.00 0.00 0.0%
USES
Transfers of Funds from Lapsed/Reorganized LEAs 7651 0.00 0.00 0.0%
All Other Financing Uses 7699 0.00 0.00 0.0%
(d) TOTAL, USES 0.00 0.00 0.0%
CONTRIBUTIONS
Contributions from Unrestricted Revenues 8980 0.00 0.00 0.0%
Contributions from Restricted Revenues 8990 0.00 0.00 0.0%
(e) TOTAL, CONTRIBUTIONS 0.00 0.00 0.0%
TOTAL, OTHER FINANCING SOURCES/USES (a - b + c - d + e) 0.00 0.00 0.0%

Manhattan Beach UnifiedLos Angeles County
July 1 BudgetBond Interest and Redemption Fund
Expenditures by Function19 75333 0000000
Form 51
California Dept of EducationSACS Financial Reporting Software - 2016.1.0File: fund-d (Rev 02/02/2016) Page 1 Printed: 6/10/2016 4:21 PM
Description Function Codes Object Codes2015-16
Estimated Actuals2016-17Budget
PercentDifference
A. REVENUES
1) LCFF Sources 8010-8099 0.00 0.00 0.0%
2) Federal Revenue 8100-8299 0.00 0.00 0.0%
3) Other State Revenue 8300-8599 0.00 0.00 0.0%
4) Other Local Revenue 8600-8799 10,218,407.00 0.00 -100.0%
5) TOTAL, REVENUES 10,218,407.00 0.00 -100.0%
B. EXPENDITURES (Objects 1000-7999)
1) Instruction 1000-1999 0.00 0.00 0.0%
2) Instruction - Related Services 2000-2999 0.00 0.00 0.0%
3) Pupil Services 3000-3999 0.00 0.00 0.0%
4) Ancillary Services 4000-4999 0.00 0.00 0.0%
5) Community Services 5000-5999 0.00 0.00 0.0%
6) Enterprise 6000-6999 0.00 0.00 0.0%
7) General Administration 7000-7999 0.00 0.00 0.0%
8) Plant Services 8000-8999 0.00 0.00 0.0%
9) Other Outgo 9000-9999Except
7600-7699 10,972,832.00 0.00 -100.0%
10) TOTAL, EXPENDITURES 10,972,832.00 0.00 -100.0%
C. EXCESS (DEFICIENCY) OF REVENUES OVER EXPENDITURES BEFORE OTHER FINANCING SOURCES AND USES (A5 - B10) (754,425.00) 0.00 -100.0%
D. OTHER FINANCING SOURCES/USES 1) Interfund Transfers a) Transfers In 8900-8929 0.00 0.00 0.0%
b) Transfers Out 7600-7629 0.00 0.00 0.0%
2) Other Sources/Uses a) Sources 8930-8979 0.00 0.00 0.0%
b) Uses 7630-7699 0.00 0.00 0.0%
3) Contributions 8980-8999 0.00 0.00 0.0%
4) TOTAL, OTHER FINANCING SOURCES/USES 0.00 0.00 0.0%
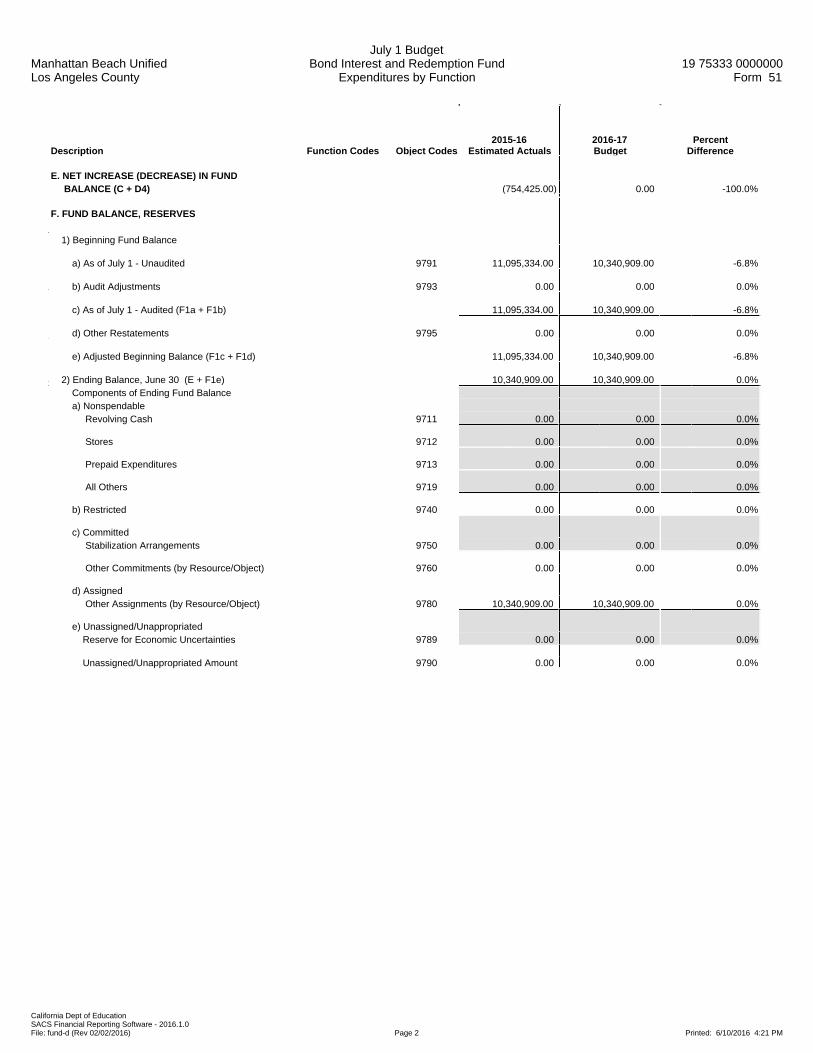
Manhattan Beach UnifiedLos Angeles County
July 1 BudgetBond Interest and Redemption Fund
Expenditures by Function19 75333 0000000
Form 51
California Dept of EducationSACS Financial Reporting Software - 2016.1.0File: fund-d (Rev 02/02/2016) Page 2 Printed: 6/10/2016 4:21 PM
Description Function Codes Object Codes2015-16
Estimated Actuals2016-17Budget
PercentDifference
E. NET INCREASE (DECREASE) IN FUND BALANCE (C + D4) (754,425.00) 0.00 -100.0%
F. FUND BALANCE, RESERVES 1) Beginning Fund Balance
a) As of July 1 - Unaudited 9791 11,095,334.00 10,340,909.00 -6.8%
b) Audit Adjustments 9793 0.00 0.00 0.0%
c) As of July 1 - Audited (F1a + F1b) 11,095,334.00 10,340,909.00 -6.8%
d) Other Restatements 9795 0.00 0.00 0.0%
e) Adjusted Beginning Balance (F1c + F1d) 11,095,334.00 10,340,909.00 -6.8%
2) Ending Balance, June 30 (E + F1e) 10,340,909.00 10,340,909.00 0.0% Components of Ending Fund Balance a) Nonspendable Revolving Cash 9711 0.00 0.00 0.0%
Stores 9712 0.00 0.00 0.0%
Prepaid Expenditures 9713 0.00 0.00 0.0%
All Others 9719 0.00 0.00 0.0%
b) Restricted 9740 0.00 0.00 0.0%
c) Committed Stabilization Arrangements 9750 0.00 0.00 0.0%
Other Commitments (by Resource/Object) 9760 0.00 0.00 0.0%
d) Assigned Other Assignments (by Resource/Object) 9780 10,340,909.00 10,340,909.00 0.0%
e) Unassigned/Unappropriated Reserve for Economic Uncertainties 9789 0.00 0.00 0.0%
Unassigned/Unappropriated Amount 9790 0.00 0.00 0.0%

Manhattan Beach UnifiedLos Angeles County
July 1 BudgetBond Interest and Redemption Fund
Exhibit: Restricted Balance Detail19 75333 0000000
Form 51
California Dept of EducationSACS Financial Reporting Software - 2016.1.0File: fund-d (Rev 04/06/2011) Page 1 Printed: 6/10/2016 4:21 PM
2015-16 2016-17Resource Description Estimated Actuals Budget
Total, Restricted Balance 0.00 0.00

This Page is Blank.

Manhattan Beach UnifiedLos Angeles County
July 1 BudgetOther Enterprise FundExpenses by Object
19 75333 0000000Form 63
California Dept of EducationSACS Financial Reporting Software - 2016.1.0File: fund-e (Rev 03/09/2016) Page 1 Printed: 6/10/2016 4:21 PM
Description Resource Codes Object Codes2015-16
Estimated Actuals2016-17Budget
PercentDifference
A. REVENUES
1) LCFF Sources 8010-8099 0.00 0.00 0.0%
2) Federal Revenue 8100-8299 0.00 0.00 0.0%
3) Other State Revenue 8300-8599 0.00 8,381.00 New
4) Other Local Revenue 8600-8799 4,588,000.00 4,700,000.00 2.4%
5) TOTAL, REVENUES 4,588,000.00 4,708,381.00 2.6%
B. EXPENSES
1) Certificated Salaries 1000-1999 1,390,276.00 1,401,633.00 0.8%
2) Classified Salaries 2000-2999 901,207.00 873,947.00 -3.0%
3) Employee Benefits 3000-3999 923,645.00 882,885.00 -4.4%
4) Books and Supplies 4000-4999 318,035.00 297,483.00 -6.5%
5) Services and Other Operating Expenses 5000-5999 1,302,929.00 1,205,140.00 -7.5%
6) Depreciation 6000-6999 0.00 0.00 0.0%
7) Other Outgo (excluding Transfers of Indirect 7100-7299, Costs) 7400-7499 0.00 0.00 0.0%
8) Other Outgo - Transfers of Indirect Costs 7300-7399 0.00 0.00 0.0%
9) TOTAL, EXPENSES 4,836,092.00 4,661,088.00 -3.6%
C. EXCESS (DEFICIENCY) OF REVENUES OVER EXPENSES BEFORE OTHER FINANCING SOURCES AND USES (A5 - B9) (248,092.00) 47,293.00 -119.1%
D. OTHER FINANCING SOURCES/USES 1) Interfund Transfers a) Transfers In 8900-8929 0.00 0.00 0.0%
b) Transfers Out 7600-7629 0.00 0.00 0.0%
2) Other Sources/Uses a) Sources 8930-8979 0.00 0.00 0.0%
b) Uses 7630-7699 0.00 0.00 0.0%
3) Contributions 8980-8999 0.00 0.00 0.0%
4) TOTAL, OTHER FINANCING SOURCES/USES 0.00 0.00 0.0%

Manhattan Beach UnifiedLos Angeles County
July 1 BudgetOther Enterprise FundExpenses by Object
19 75333 0000000Form 63
California Dept of EducationSACS Financial Reporting Software - 2016.1.0File: fund-e (Rev 03/09/2016) Page 2 Printed: 6/10/2016 4:21 PM
Description Resource Codes Object Codes2015-16
Estimated Actuals2016-17Budget
PercentDifference
E. NET INCREASE (DECREASE) IN NET POSITION (C + D4) (248,092.00) 47,293.00 -119.1%
F. NET POSITION 1) Beginning Net Position a) As of July 1 - Unaudited 9791 1,687,181.58 1,439,089.58 -14.7%
b) Audit Adjustments 9793 0.00 0.00 0.0%
c) As of July 1 - Audited (F1a + F1b) 1,687,181.58 1,439,089.58 -14.7%
d) Other Restatements 9795 0.00 0.00 0.0%
e) Adjusted Beginning Net Position (F1c + F1d) 1,687,181.58 1,439,089.58 -14.7%
2) Ending Net Position, June 30 (E + F1e) 1,439,089.58 1,486,382.58 3.3% Components of Ending Net Position a) Net Investment in Capital Assets 9796 0.00 0.00 0.0%
b) Restricted Net Position 9797 0.00 0.00 0.0%
c) Unrestricted Net Position 9790 1,439,089.58 1,486,382.58 3.3%

Manhattan Beach UnifiedLos Angeles County
July 1 BudgetOther Enterprise FundExpenses by Object
19 75333 0000000Form 63
California Dept of EducationSACS Financial Reporting Software - 2016.1.0File: fund-e (Rev 03/09/2016) Page 3 Printed: 6/10/2016 4:21 PM
Description Resource Codes Object Codes2015-16
Estimated Actuals2016-17Budget
PercentDifference
G. ASSETS 1) Cash a) in County Treasury 9110 0.00
1) Fair Value Adjustment to Cash in County Treasury 9111 0.00
b) in Banks 9120 0.00
c) in Revolving Fund 9130 0.00
d) with Fiscal Agent 9135 0.00
e) collections awaiting deposit 9140 0.00
2) Investments 9150 0.00
3) Accounts Receivable 9200 0.00
4) Due from Grantor Government 9290 0.00
5) Due from Other Funds 9310 0.00
6) Stores 9320 0.00
7) Prepaid Expenditures 9330 0.00
8) Other Current Assets 9340 0.00
9) Fixed Assets a) Land 9410 0.00
b) Land Improvements 9420 0.00
c) Accumulated Depreciation - Land Improvements 9425 0.00
d) Buildings 9430 0.00
e) Accumulated Depreciation - Buildings 9435 0.00
f) Equipment 9440 0.00
g) Accumulated Depreciation - Equipment 9445 0.00
h) Work in Progress 9450 0.00
10) TOTAL, ASSETS 0.00
H. DEFERRED OUTFLOWS OF RESOURCES
1) Deferred Outflows of Resources 9490 0.00
2) TOTAL, DEFERRED OUTFLOWS 0.00

Manhattan Beach UnifiedLos Angeles County
July 1 BudgetOther Enterprise FundExpenses by Object
19 75333 0000000Form 63
California Dept of EducationSACS Financial Reporting Software - 2016.1.0File: fund-e (Rev 03/09/2016) Page 4 Printed: 6/10/2016 4:21 PM
Description Resource Codes Object Codes2015-16
Estimated Actuals2016-17Budget
PercentDifference
I. LIABILITIES
1) Accounts Payable 9500 0.00
2) Due to Grantor Governments 9590 0.00
3) Due to Other Funds 9610 0.00
4) Current Loans 9640
5) Unearned Revenue 9650 0.00
6) Long-Term Liabilities a) Net Pension Liability 9663 0.00
b) Net OPEB Obligation 9664 0.00
c) Compensated Absences 9665 0.00
d) COPs Payable 9666 0.00
e) Capital Leases Payable 9667 0.00
f) Lease Revenue Bonds Payable 9668 0.00
g) Other General Long-Term Liabilities 9669 0.00
7) TOTAL, LIABILITIES 0.00
J. DEFERRED INFLOWS OF RESOURCES
1) Deferred Inflows of Resources 9690 0.00
2) TOTAL, DEFERRED INFLOWS 0.00
K. NET POSITION
Net Position, June 30 (G10 + H2) - (I7 + J2) 0.00

Manhattan Beach UnifiedLos Angeles County
July 1 BudgetOther Enterprise FundExpenses by Object
19 75333 0000000Form 63
California Dept of EducationSACS Financial Reporting Software - 2016.1.0File: fund-e (Rev 03/09/2016) Page 5 Printed: 6/10/2016 4:21 PM
Description Resource Codes Object Codes2015-16
Estimated Actuals2016-17Budget
PercentDifference
OTHER STATE REVENUE
STRS On-Behalf Pension Contributions 7690 8590 0.00 8,381.00 New
All Other State Revenue All Other 8590 0.00 0.00 0.0%
TOTAL, OTHER STATE REVENUE 0.00 8,381.00 New
OTHER LOCAL REVENUE
Other Local Revenue
Sales
All Other Sales 8639 0.00 0.00 0.0%
Leases and Rentals 8650 0.00 0.00 0.0%
Interest 8660 10,000.00 10,000.00 0.0%
Net Increase (Decrease) in the Fair Value of Investments 8662 0.00 0.00 0.0%
Fees and Contracts
All Other Fees and Contracts 8689 4,578,000.00 4,690,000.00 2.4%
Other Local Revenue
All Other Local Revenue 8699 0.00 0.00 0.0%
TOTAL, OTHER LOCAL REVENUE 4,588,000.00 4,700,000.00 2.4%
TOTAL, REVENUES 4,588,000.00 4,708,381.00 2.6%

Manhattan Beach UnifiedLos Angeles County
July 1 BudgetOther Enterprise FundExpenses by Object
19 75333 0000000Form 63
California Dept of EducationSACS Financial Reporting Software - 2016.1.0File: fund-e (Rev 03/09/2016) Page 6 Printed: 6/10/2016 4:21 PM
Description Resource Codes Object Codes2015-16
Estimated Actuals2016-17Budget
PercentDifference
CERTIFICATED SALARIES
Certificated Teachers' Salaries 1100 1,263,170.00 1,273,129.00 0.8%
Certificated Pupil Support Salaries 1200 0.00 0.00 0.0%
Certificated Supervisors' and Administrators' Salaries 1300 127,106.00 128,504.00 1.1%
Other Certificated Salaries 1900 0.00 0.00 0.0%
TOTAL, CERTIFICATED SALARIES 1,390,276.00 1,401,633.00 0.8%
CLASSIFIED SALARIES
Classified Instructional Salaries 2100 528,745.00 533,126.00 0.8%
Classified Support Salaries 2200 199,933.00 162,292.00 -18.8%
Classified Supervisors' and Administrators' Salaries 2300 0.00 0.00 0.0%
Clerical, Technical and Office Salaries 2400 172,529.00 178,529.00 3.5%
Other Classified Salaries 2900 0.00 0.00 0.0%
TOTAL, CLASSIFIED SALARIES 901,207.00 873,947.00 -3.0%
EMPLOYEE BENEFITS
STRS 3101-3102 79,581.00 100,885.00 26.8%
PERS 3201-3202 173,257.00 202,007.00 16.6%
OASDI/Medicare/Alternative 3301-3302 125,770.00 125,186.00 -0.5%
Health and Welfare Benefits 3401-3402 489,794.00 393,863.00 -19.6%
Unemployment Insurance 3501-3502 1,101.00 1,116.00 1.4%
Workers' Compensation 3601-3602 54,142.00 59,828.00 10.5%
OPEB, Allocated 3701-3702 0.00 0.00 0.0%
OPEB, Active Employees 3751-3752 0.00 0.00 0.0%
Other Employee Benefits 3901-3902 0.00 0.00 0.0%
TOTAL, EMPLOYEE BENEFITS 923,645.00 882,885.00 -4.4%
BOOKS AND SUPPLIES
Approved Textbooks and Core Curricula Materials 4100 0.00 0.00 0.0%
Books and Other Reference Materials 4200 1,026.00 1,000.00 -2.5%
Materials and Supplies 4300 149,017.00 122,000.00 -18.1%
Noncapitalized Equipment 4400 13,919.00 14,100.00 1.3%
Food 4700 154,073.00 160,383.00 4.1%
TOTAL, BOOKS AND SUPPLIES 318,035.00 297,483.00 -6.5%

Manhattan Beach UnifiedLos Angeles County
July 1 BudgetOther Enterprise FundExpenses by Object
19 75333 0000000Form 63
California Dept of EducationSACS Financial Reporting Software - 2016.1.0File: fund-e (Rev 03/09/2016) Page 7 Printed: 6/10/2016 4:21 PM
Description Resource Codes Object Codes2015-16
Estimated Actuals2016-17Budget
PercentDifference
SERVICES AND OTHER OPERATING EXPENSES
Subagreements for Services 5100 0.00 0.00 0.0%
Travel and Conferences 5200 5,379.00 3,000.00 -44.2%
Dues and Memberships 5300 2,400.00 0.00 -100.0%
Insurance 5400-5450 0.00 0.00 0.0%
Operations and Housekeeping Services 5500 0.00 0.00 0.0%
Rentals, Leases, Repairs, and Noncapitalized Improvements 5600 1,285,612.00 1,197,500.00 -6.9%
Transfers of Direct Costs 5710 0.00 0.00 0.0%
Transfers of Direct Costs - Interfund 5750 0.00 0.00 0.0%
Professional/Consulting Services and Operating Expenditures 5800 8,038.00 3,640.00 -54.7%
Communications 5900 1,500.00 1,000.00 -33.3%
TOTAL, SERVICES AND OTHER OPERATING EXPENSES 1,302,929.00 1,205,140.00 -7.5%
DEPRECIATION
Depreciation Expense 6900 0.00 0.00 0.0%
TOTAL, DEPRECIATION 0.00 0.00 0.0%
OTHER OUTGO (excluding Transfers of Indirect Costs)
Other Transfers Out
All Other Transfers Out to All Others 7299 0.00 0.00 0.0%
TOTAL, OTHER OUTGO (excluding Transfers of Indirect Costs) 0.00 0.00 0.0%
TOTAL, EXPENSES 4,836,092.00 4,661,088.00 -3.6%

Manhattan Beach UnifiedLos Angeles County
July 1 BudgetOther Enterprise FundExpenses by Object
19 75333 0000000Form 63
California Dept of EducationSACS Financial Reporting Software - 2016.1.0File: fund-e (Rev 03/09/2016) Page 8 Printed: 6/10/2016 4:21 PM
Description Resource Codes Object Codes2015-16
Estimated Actuals2016-17Budget
PercentDifference
INTERFUND TRANSFERS
INTERFUND TRANSFERS IN
Other Authorized Interfund Transfers In 8919 0.00 0.00 0.0%
(a) TOTAL, INTERFUND TRANSFERS IN 0.00 0.00 0.0%
INTERFUND TRANSFERS OUT
Other Authorized Interfund Transfers Out 7619 0.00 0.00 0.0%
(b) TOTAL, INTERFUND TRANSFERS OUT 0.00 0.00 0.0%
OTHER SOURCES/USES
SOURCES
Other Sources
Transfers from Funds of Lapsed/Reorganized LEAs 8965 0.00 0.00 0.0%
(c) TOTAL, SOURCES 0.00 0.00 0.0%
USES
Transfers of Funds from Lapsed/Reorganized LEAs 7651 0.00 0.00 0.0%
(d) TOTAL, USES 0.00 0.00 0.0%
CONTRIBUTIONS
Contributions from Unrestricted Revenues 8980 0.00 0.00 0.0%
Contributions from Restricted Revenues 8990 0.00 0.00 0.0%
(e) TOTAL, CONTRIBUTIONS 0.00 0.00 0.0%
TOTAL, OTHER FINANCING SOURCES/USES (a - b + c - d + e) 0.00 0.00 0.0%
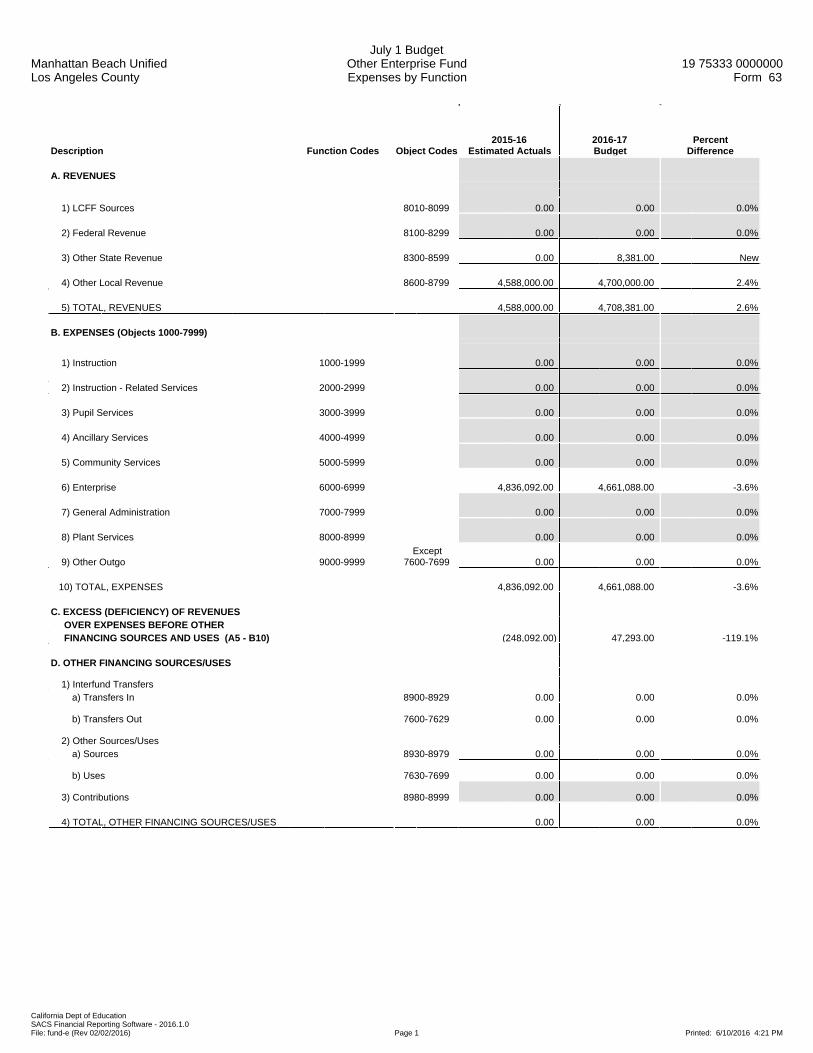
Manhattan Beach UnifiedLos Angeles County
July 1 BudgetOther Enterprise FundExpenses by Function
19 75333 0000000Form 63
California Dept of EducationSACS Financial Reporting Software - 2016.1.0File: fund-e (Rev 02/02/2016) Page 1 Printed: 6/10/2016 4:21 PM
Description Function Codes Object Codes2015-16
Estimated Actuals2016-17Budget
PercentDifference
A. REVENUES
1) LCFF Sources 8010-8099 0.00 0.00 0.0%
2) Federal Revenue 8100-8299 0.00 0.00 0.0%
3) Other State Revenue 8300-8599 0.00 8,381.00 New
4) Other Local Revenue 8600-8799 4,588,000.00 4,700,000.00 2.4%
5) TOTAL, REVENUES 4,588,000.00 4,708,381.00 2.6%
B. EXPENSES (Objects 1000-7999)
1) Instruction 1000-1999 0.00 0.00 0.0%
2) Instruction - Related Services 2000-2999 0.00 0.00 0.0%
3) Pupil Services 3000-3999 0.00 0.00 0.0%
4) Ancillary Services 4000-4999 0.00 0.00 0.0%
5) Community Services 5000-5999 0.00 0.00 0.0%
6) Enterprise 6000-6999 4,836,092.00 4,661,088.00 -3.6%
7) General Administration 7000-7999 0.00 0.00 0.0%
8) Plant Services 8000-8999 0.00 0.00 0.0%
9) Other Outgo 9000-9999Except
7600-7699 0.00 0.00 0.0%
10) TOTAL, EXPENSES 4,836,092.00 4,661,088.00 -3.6%
C. EXCESS (DEFICIENCY) OF REVENUES OVER EXPENSES BEFORE OTHER FINANCING SOURCES AND USES (A5 - B10) (248,092.00) 47,293.00 -119.1%
D. OTHER FINANCING SOURCES/USES 1) Interfund Transfers a) Transfers In 8900-8929 0.00 0.00 0.0%
b) Transfers Out 7600-7629 0.00 0.00 0.0%
2) Other Sources/Uses a) Sources 8930-8979 0.00 0.00 0.0%
b) Uses 7630-7699 0.00 0.00 0.0%
3) Contributions 8980-8999 0.00 0.00 0.0%
4) TOTAL, OTHER FINANCING SOURCES/USES 0.00 0.00 0.0%

Manhattan Beach UnifiedLos Angeles County
July 1 BudgetOther Enterprise FundExpenses by Function
19 75333 0000000Form 63
California Dept of EducationSACS Financial Reporting Software - 2016.1.0File: fund-e (Rev 02/02/2016) Page 2 Printed: 6/10/2016 4:21 PM
Description Function Codes Object Codes2015-16
Estimated Actuals2016-17Budget
PercentDifference
E. NET INCREASE (DECREASE) IN NET POSITION (C + D4) (248,092.00) 47,293.00 -119.1%
F. NET POSITION 1) Beginning Net Position
a) As of July 1 - Unaudited 9791 1,687,181.58 1,439,089.58 -14.7%
b) Audit Adjustments 9793 0.00 0.00 0.0%
c) As of July 1 - Audited (F1a + F1b) 1,687,181.58 1,439,089.58 -14.7%
d) Other Restatements 9795 0.00 0.00 0.0%
e) Adjusted Beginning Net Position (F1c + F1d) 1,687,181.58 1,439,089.58 -14.7%
2) Ending Net Position, June 30 (E + F1e) 1,439,089.58 1,486,382.58 3.3% Components of Ending Net Position a) Net Investment in Capital Assets 9796 0.00 0.00 0.0%
b) Restricted Net Position 9797 0.00 0.00 0.0%
c) Unrestricted Net Position 9790 1,439,089.58 1,486,382.58 3.3%

Manhattan Beach UnifiedLos Angeles County
July 1 BudgetOther Enterprise Fund
Exhibit: Restricted Net Position Detail19 75333 0000000
Form 63
California Dept of EducationSACS Financial Reporting Software - 2016.1.0File: fund-e (Rev 11/30/2012) Page 1 Printed: 6/10/2016 4:21 PM
2015-16 2016-17Resource Description Estimated Actuals Budget
Total, Restricted Net Position 0.00 0.00

This Page is Blank.

Manhattan Beach UnifiedLos Angeles County
July 1 BudgetSelf-Insurance FundExpenses by Object
19 75333 0000000Form 67
California Dept of EducationSACS Financial Reporting Software - 2016.1.0File: fund-e (Rev 03/09/2016) Page 1 Printed: 6/10/2016 4:22 PM
Description Resource Codes Object Codes2015-16
Estimated Actuals2016-17Budget
PercentDifference
A. REVENUES
1) LCFF Sources 8010-8099 0.00 0.00 0.0%
2) Federal Revenue 8100-8299 0.00 0.00 0.0%
3) Other State Revenue 8300-8599 0.00 0.00 0.0%
4) Other Local Revenue 8600-8799 30,300.00 50.00 -99.8%
5) TOTAL, REVENUES 30,300.00 50.00 -99.8%
B. EXPENSES
1) Certificated Salaries 1000-1999 0.00 0.00 0.0%
2) Classified Salaries 2000-2999 0.00 0.00 0.0%
3) Employee Benefits 3000-3999 0.00 0.00 0.0%
4) Books and Supplies 4000-4999 33,472.00 7,000.00 -79.1%
5) Services and Other Operating Expenses 5000-5999 0.00 0.00 0.0%
6) Depreciation 6000-6999 0.00 0.00 0.0%
7) Other Outgo (excluding Transfers of Indirect 7100-7299, Costs) 7400-7499 0.00 0.00 0.0%
8) Other Outgo - Transfers of Indirect Costs 7300-7399 0.00 0.00 0.0%
9) TOTAL, EXPENSES 33,472.00 7,000.00 -79.1%
C. EXCESS (DEFICIENCY) OF REVENUES OVER EXPENSES BEFORE OTHER FINANCING SOURCES AND USES (A5 - B9) (3,172.00) (6,950.00) 119.1%
D. OTHER FINANCING SOURCES/USES 1) Interfund Transfers a) Transfers In 8900-8929 0.00 0.00 0.0%
b) Transfers Out 7600-7629 0.00 0.00 0.0%
2) Other Sources/Uses a) Sources 8930-8979 0.00 0.00 0.0%
b) Uses 7630-7699 0.00 0.00 0.0%
3) Contributions 8980-8999 0.00 0.00 0.0%
4) TOTAL, OTHER FINANCING SOURCES/USES 0.00 0.00 0.0%

Manhattan Beach UnifiedLos Angeles County
July 1 BudgetSelf-Insurance FundExpenses by Object
19 75333 0000000Form 67
California Dept of EducationSACS Financial Reporting Software - 2016.1.0File: fund-e (Rev 03/09/2016) Page 2 Printed: 6/10/2016 4:22 PM
Description Resource Codes Object Codes2015-16
Estimated Actuals2016-17Budget
PercentDifference
E. NET INCREASE (DECREASE) IN NET POSITION (C + D4) (3,172.00) (6,950.00) 119.1%
F. NET POSITION 1) Beginning Net Position a) As of July 1 - Unaudited 9791 73,397.91 70,225.91 -4.3%
b) Audit Adjustments 9793 0.00 0.00 0.0%
c) As of July 1 - Audited (F1a + F1b) 73,397.91 70,225.91 -4.3%
d) Other Restatements 9795 0.00 0.00 0.0%
e) Adjusted Beginning Net Position (F1c + F1d) 73,397.91 70,225.91 -4.3%
2) Ending Net Position, June 30 (E + F1e) 70,225.91 63,275.91 -9.9% Components of Ending Net Position a) Net Investment in Capital Assets 9796 0.00 0.00 0.0%
b) Restricted Net Position 9797 0.00 0.00 0.0%
c) Unrestricted Net Position 9790 70,225.91 63,275.91 -9.9%

Manhattan Beach UnifiedLos Angeles County
July 1 BudgetSelf-Insurance FundExpenses by Object
19 75333 0000000Form 67
California Dept of EducationSACS Financial Reporting Software - 2016.1.0File: fund-e (Rev 03/09/2016) Page 3 Printed: 6/10/2016 4:22 PM
Description Resource Codes Object Codes2015-16
Estimated Actuals2016-17Budget
PercentDifference
G. ASSETS 1) Cash a) in County Treasury 9110 0.00
1) Fair Value Adjustment to Cash in County Treasury 9111 0.00
b) in Banks 9120 0.00
c) in Revolving Fund 9130 0.00
d) with Fiscal Agent 9135 0.00
e) collections awaiting deposit 9140 0.00
2) Investments 9150 0.00
3) Accounts Receivable 9200 0.00
4) Due from Grantor Government 9290 0.00
5) Due from Other Funds 9310 0.00
6) Stores 9320 0.00
7) Prepaid Expenditures 9330 0.00
8) Other Current Assets 9340 0.00
9) Fixed Assets a) Land 9410 0.00
b) Land Improvements 9420 0.00
c) Accumulated Depreciation - Land Improvements 9425 0.00
d) Buildings 9430 0.00
e) Accumulated Depreciation - Buildings 9435 0.00
f) Equipment 9440 0.00
g) Accumulated Depreciation - Equipment 9445 0.00
h) Work in Progress 9450 0.00
10) TOTAL, ASSETS 0.00
H. DEFERRED OUTFLOWS OF RESOURCES
1) Deferred Outflows of Resources 9490 0.00
2) TOTAL, DEFERRED OUTFLOWS 0.00
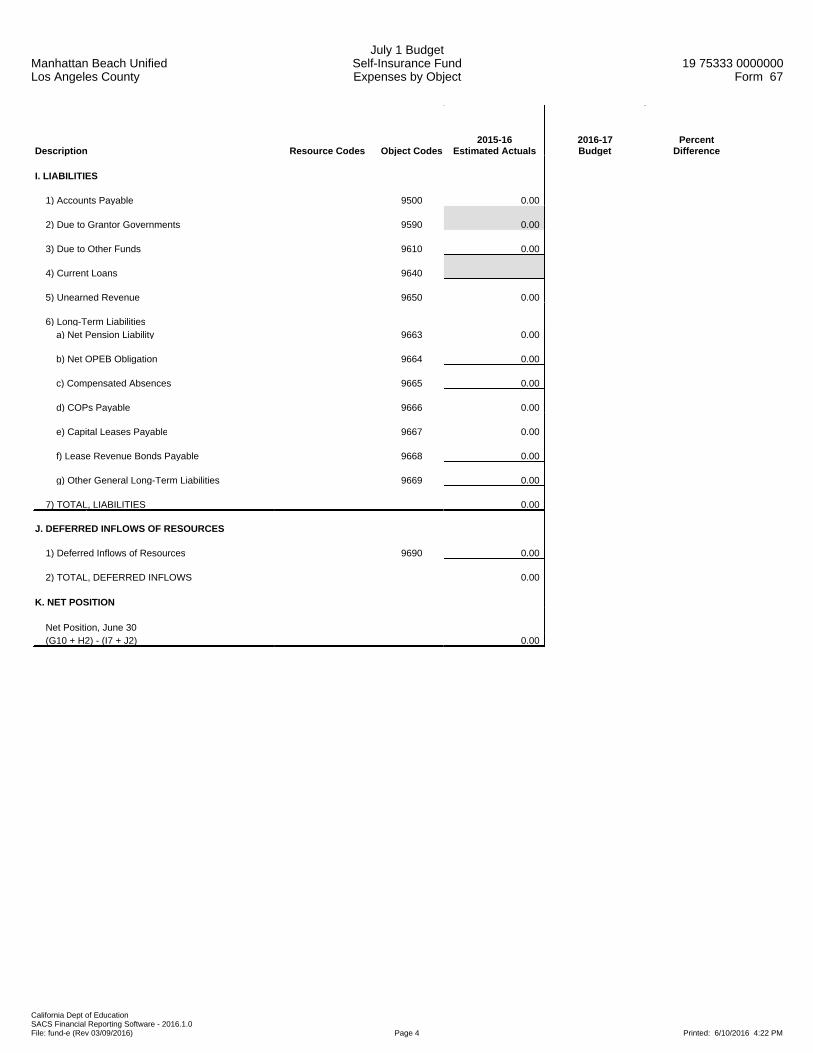
Manhattan Beach UnifiedLos Angeles County
July 1 BudgetSelf-Insurance FundExpenses by Object
19 75333 0000000Form 67
California Dept of EducationSACS Financial Reporting Software - 2016.1.0File: fund-e (Rev 03/09/2016) Page 4 Printed: 6/10/2016 4:22 PM
Description Resource Codes Object Codes2015-16
Estimated Actuals2016-17Budget
PercentDifference
I. LIABILITIES
1) Accounts Payable 9500 0.00
2) Due to Grantor Governments 9590 0.00
3) Due to Other Funds 9610 0.00
4) Current Loans 9640
5) Unearned Revenue 9650 0.00
6) Long-Term Liabilities a) Net Pension Liability 9663 0.00
b) Net OPEB Obligation 9664 0.00
c) Compensated Absences 9665 0.00
d) COPs Payable 9666 0.00
e) Capital Leases Payable 9667 0.00
f) Lease Revenue Bonds Payable 9668 0.00
g) Other General Long-Term Liabilities 9669 0.00
7) TOTAL, LIABILITIES 0.00
J. DEFERRED INFLOWS OF RESOURCES
1) Deferred Inflows of Resources 9690 0.00
2) TOTAL, DEFERRED INFLOWS 0.00
K. NET POSITION
Net Position, June 30 (G10 + H2) - (I7 + J2) 0.00

Manhattan Beach UnifiedLos Angeles County
July 1 BudgetSelf-Insurance FundExpenses by Object
19 75333 0000000Form 67
California Dept of EducationSACS Financial Reporting Software - 2016.1.0File: fund-e (Rev 03/09/2016) Page 5 Printed: 6/10/2016 4:22 PM
Description Resource Codes Object Codes2015-16
Estimated Actuals2016-17Budget
PercentDifference
OTHER STATE REVENUE
STRS On-Behalf Pension Contributions 7690 8590 0.00 0.00 0.0%
All Other State Revenue All Other 8590 0.00 0.00 0.0%
TOTAL, OTHER STATE REVENUE 0.00 0.00 0.0%
OTHER LOCAL REVENUE
Other Local Revenue
Sales Sale of Equipment/Supplies 8631 0.00 0.00 0.0%
Interest 8660 300.00 50.00 -83.3%
Net Increase (Decrease) in the Fair Value of Investments 8662 0.00 0.00 0.0%
Fees and Contracts
In-District Premiums/ Contributions 8674 0.00 0.00 0.0%
All Other Fees and Contracts 8689 0.00 0.00 0.0%
Other Local Revenue
All Other Local Revenue 8699 30,000.00 0.00 -100.0%
All Other Transfers In from All Others 8799 0.00 0.00 0.0%
TOTAL, OTHER LOCAL REVENUE 30,300.00 50.00 -99.8%
TOTAL, REVENUES 30,300.00 50.00 -99.8%

Manhattan Beach UnifiedLos Angeles County
July 1 BudgetSelf-Insurance FundExpenses by Object
19 75333 0000000Form 67
California Dept of EducationSACS Financial Reporting Software - 2016.1.0File: fund-e (Rev 03/09/2016) Page 6 Printed: 6/10/2016 4:22 PM
Description Resource Codes Object Codes2015-16
Estimated Actuals2016-17Budget
PercentDifference
CERTIFICATED SALARIES
Certificated Pupil Support Salaries 1200 0.00 0.00 0.0%
Certificated Supervisors' and Administrators' Salaries 1300 0.00 0.00 0.0%
TOTAL, CERTIFICATED SALARIES 0.00 0.00 0.0%
CLASSIFIED SALARIES
Classified Support Salaries 2200 0.00 0.00 0.0%
Classified Supervisors' and Administrators' Salaries 2300 0.00 0.00 0.0%
Clerical, Technical and Office Salaries 2400 0.00 0.00 0.0%
Other Classified Salaries 2900 0.00 0.00 0.0%
TOTAL, CLASSIFIED SALARIES 0.00 0.00 0.0%
EMPLOYEE BENEFITS
STRS 3101-3102 0.00 0.00 0.0%
PERS 3201-3202 0.00 0.00 0.0%
OASDI/Medicare/Alternative 3301-3302 0.00 0.00 0.0%
Health and Welfare Benefits 3401-3402 0.00 0.00 0.0%
Unemployment Insurance 3501-3502 0.00 0.00 0.0%
Workers' Compensation 3601-3602 0.00 0.00 0.0%
OPEB, Allocated 3701-3702 0.00 0.00 0.0%
OPEB, Active Employees 3751-3752 0.00 0.00 0.0%
Other Employee Benefits 3901-3902 0.00 0.00 0.0%
TOTAL, EMPLOYEE BENEFITS 0.00 0.00 0.0%
BOOKS AND SUPPLIES
Books and Other Reference Materials 4200 0.00 0.00 0.0%
Materials and Supplies 4300 2,563.00 2,000.00 -22.0%
Noncapitalized Equipment 4400 30,909.00 5,000.00 -83.8%
TOTAL, BOOKS AND SUPPLIES 33,472.00 7,000.00 -79.1%
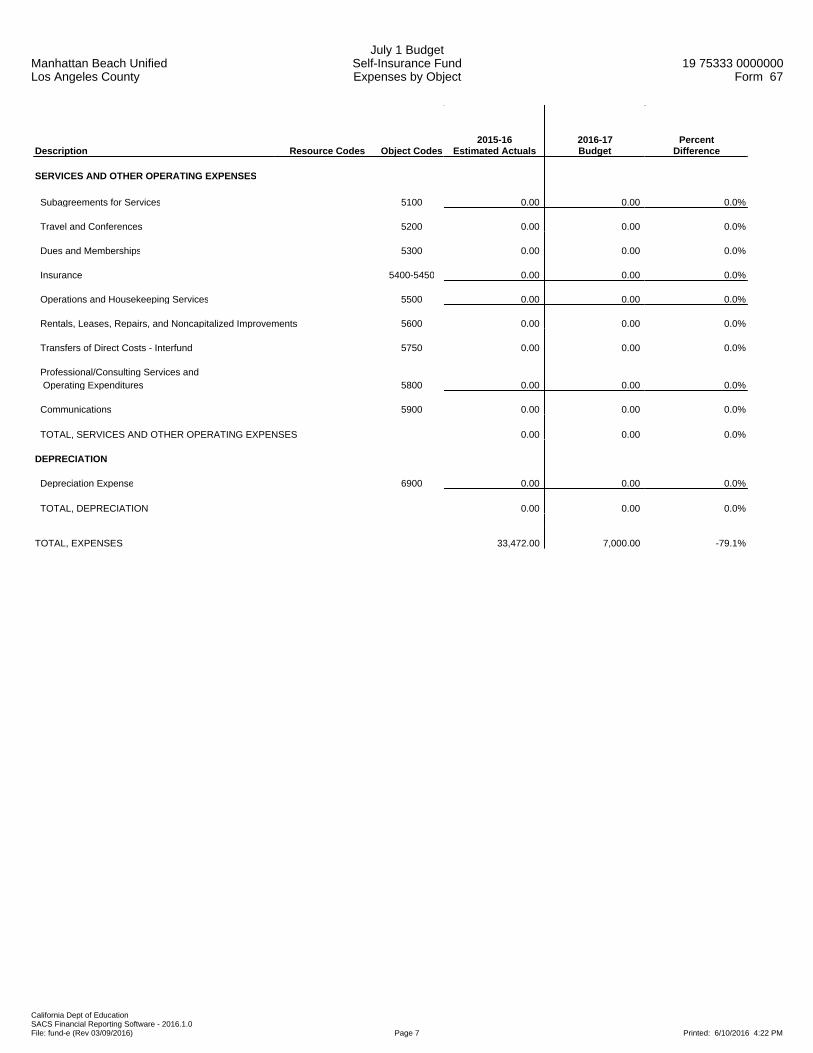
Manhattan Beach UnifiedLos Angeles County
July 1 BudgetSelf-Insurance FundExpenses by Object
19 75333 0000000Form 67
California Dept of EducationSACS Financial Reporting Software - 2016.1.0File: fund-e (Rev 03/09/2016) Page 7 Printed: 6/10/2016 4:22 PM
Description Resource Codes Object Codes2015-16
Estimated Actuals2016-17Budget
PercentDifference
SERVICES AND OTHER OPERATING EXPENSES
Subagreements for Services 5100 0.00 0.00 0.0%
Travel and Conferences 5200 0.00 0.00 0.0%
Dues and Memberships 5300 0.00 0.00 0.0%
Insurance 5400-5450 0.00 0.00 0.0%
Operations and Housekeeping Services 5500 0.00 0.00 0.0%
Rentals, Leases, Repairs, and Noncapitalized Improvements 5600 0.00 0.00 0.0%
Transfers of Direct Costs - Interfund 5750 0.00 0.00 0.0%
Professional/Consulting Services and Operating Expenditures 5800 0.00 0.00 0.0%
Communications 5900 0.00 0.00 0.0%
TOTAL, SERVICES AND OTHER OPERATING EXPENSES 0.00 0.00 0.0%
DEPRECIATION
Depreciation Expense 6900 0.00 0.00 0.0%
TOTAL, DEPRECIATION 0.00 0.00 0.0%
TOTAL, EXPENSES 33,472.00 7,000.00 -79.1%
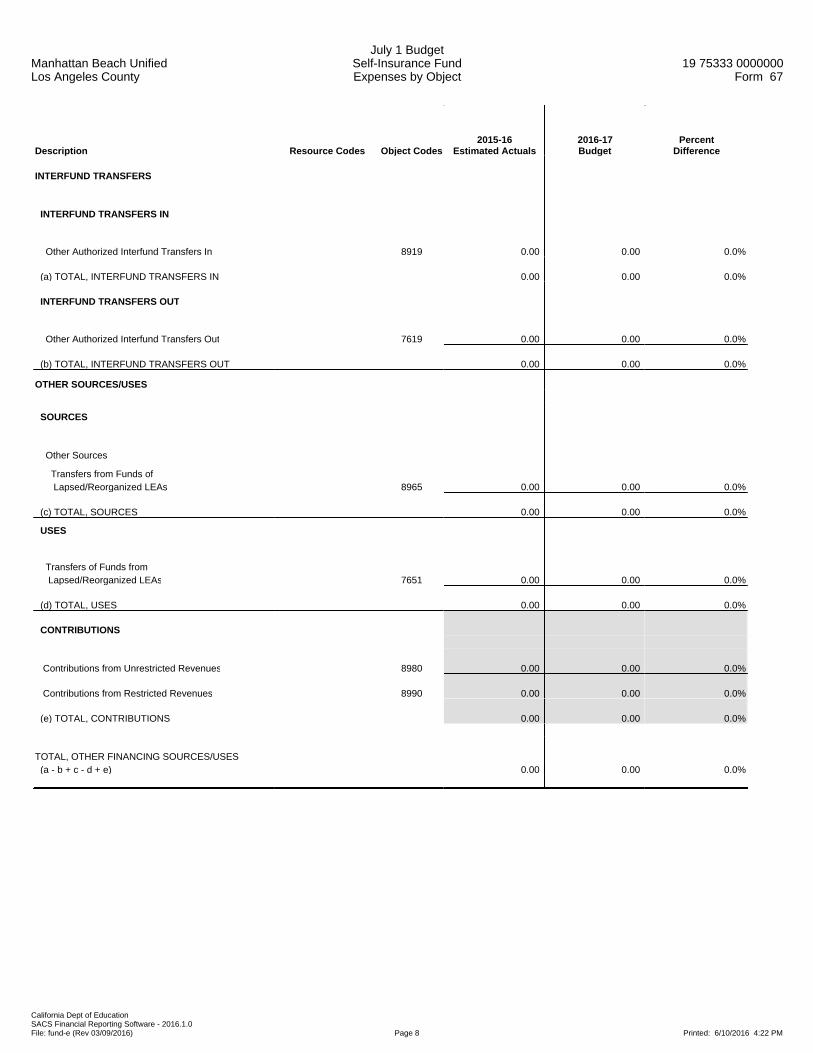
Manhattan Beach UnifiedLos Angeles County
July 1 BudgetSelf-Insurance FundExpenses by Object
19 75333 0000000Form 67
California Dept of EducationSACS Financial Reporting Software - 2016.1.0File: fund-e (Rev 03/09/2016) Page 8 Printed: 6/10/2016 4:22 PM
Description Resource Codes Object Codes2015-16
Estimated Actuals2016-17Budget
PercentDifference
INTERFUND TRANSFERS
INTERFUND TRANSFERS IN
Other Authorized Interfund Transfers In 8919 0.00 0.00 0.0%
(a) TOTAL, INTERFUND TRANSFERS IN 0.00 0.00 0.0%
INTERFUND TRANSFERS OUT
Other Authorized Interfund Transfers Out 7619 0.00 0.00 0.0%
(b) TOTAL, INTERFUND TRANSFERS OUT 0.00 0.00 0.0%
OTHER SOURCES/USES
SOURCES
Other Sources
Transfers from Funds of Lapsed/Reorganized LEAs 8965 0.00 0.00 0.0%
(c) TOTAL, SOURCES 0.00 0.00 0.0%
USES
Transfers of Funds from Lapsed/Reorganized LEAs 7651 0.00 0.00 0.0%
(d) TOTAL, USES 0.00 0.00 0.0%
CONTRIBUTIONS
Contributions from Unrestricted Revenues 8980 0.00 0.00 0.0%
Contributions from Restricted Revenues 8990 0.00 0.00 0.0%
(e) TOTAL, CONTRIBUTIONS 0.00 0.00 0.0%
TOTAL, OTHER FINANCING SOURCES/USES (a - b + c - d + e) 0.00 0.00 0.0%
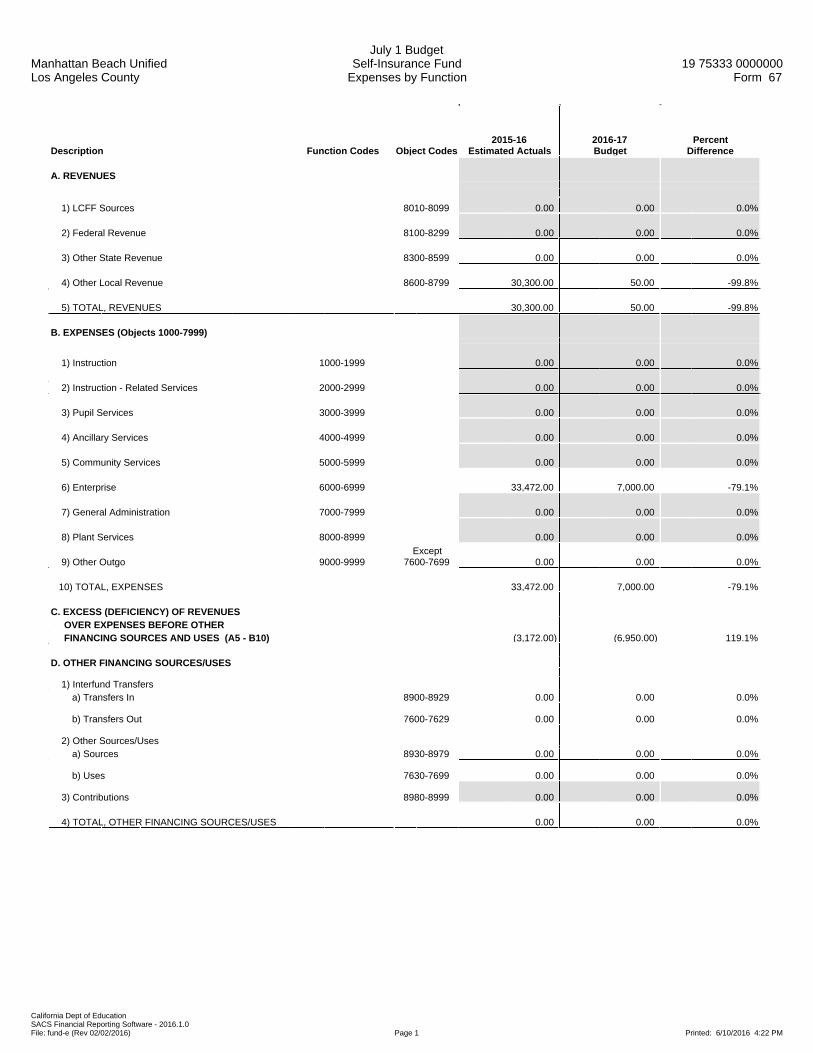
Manhattan Beach UnifiedLos Angeles County
July 1 BudgetSelf-Insurance Fund
Expenses by Function19 75333 0000000
Form 67
California Dept of EducationSACS Financial Reporting Software - 2016.1.0File: fund-e (Rev 02/02/2016) Page 1 Printed: 6/10/2016 4:22 PM
Description Function Codes Object Codes2015-16
Estimated Actuals2016-17Budget
PercentDifference
A. REVENUES
1) LCFF Sources 8010-8099 0.00 0.00 0.0%
2) Federal Revenue 8100-8299 0.00 0.00 0.0%
3) Other State Revenue 8300-8599 0.00 0.00 0.0%
4) Other Local Revenue 8600-8799 30,300.00 50.00 -99.8%
5) TOTAL, REVENUES 30,300.00 50.00 -99.8%
B. EXPENSES (Objects 1000-7999)
1) Instruction 1000-1999 0.00 0.00 0.0%
2) Instruction - Related Services 2000-2999 0.00 0.00 0.0%
3) Pupil Services 3000-3999 0.00 0.00 0.0%
4) Ancillary Services 4000-4999 0.00 0.00 0.0%
5) Community Services 5000-5999 0.00 0.00 0.0%
6) Enterprise 6000-6999 33,472.00 7,000.00 -79.1%
7) General Administration 7000-7999 0.00 0.00 0.0%
8) Plant Services 8000-8999 0.00 0.00 0.0%
9) Other Outgo 9000-9999Except
7600-7699 0.00 0.00 0.0%
10) TOTAL, EXPENSES 33,472.00 7,000.00 -79.1%
C. EXCESS (DEFICIENCY) OF REVENUES OVER EXPENSES BEFORE OTHER FINANCING SOURCES AND USES (A5 - B10) (3,172.00) (6,950.00) 119.1%
D. OTHER FINANCING SOURCES/USES 1) Interfund Transfers a) Transfers In 8900-8929 0.00 0.00 0.0%
b) Transfers Out 7600-7629 0.00 0.00 0.0%
2) Other Sources/Uses a) Sources 8930-8979 0.00 0.00 0.0%
b) Uses 7630-7699 0.00 0.00 0.0%
3) Contributions 8980-8999 0.00 0.00 0.0%
4) TOTAL, OTHER FINANCING SOURCES/USES 0.00 0.00 0.0%

Manhattan Beach UnifiedLos Angeles County
July 1 BudgetSelf-Insurance Fund
Expenses by Function19 75333 0000000
Form 67
California Dept of EducationSACS Financial Reporting Software - 2016.1.0File: fund-e (Rev 02/02/2016) Page 2 Printed: 6/10/2016 4:22 PM
Description Function Codes Object Codes2015-16
Estimated Actuals2016-17Budget
PercentDifference
E. NET INCREASE (DECREASE) IN NET POSITION (C + D4) (3,172.00) (6,950.00) 119.1%
F. NET POSITION 1) Beginning Net Position
a) As of July 1 - Unaudited 9791 73,397.91 70,225.91 -4.3%
b) Audit Adjustments 9793 0.00 0.00 0.0%
c) As of July 1 - Audited (F1a + F1b) 73,397.91 70,225.91 -4.3%
d) Other Restatements 9795 0.00 0.00 0.0%
e) Adjusted Beginning Net Position (F1c + F1d) 73,397.91 70,225.91 -4.3%
2) Ending Net Position, June 30 (E + F1e) 70,225.91 63,275.91 -9.9% Components of Ending Net Position a) Net Investment in Capital Assets 9796 0.00 0.00 0.0%
b) Restricted Net Position 9797 0.00 0.00 0.0%
c) Unrestricted Net Position 9790 70,225.91 63,275.91 -9.9%

Manhattan Beach UnifiedLos Angeles County
July 1 BudgetSelf-Insurance Fund
Exhibit: Restricted Net Position Detail19 75333 0000000
Form 67
California Dept of EducationSACS Financial Reporting Software - 2016.1.0File: fund-e (Rev 11/30/2012) Page 1 Printed: 6/10/2016 4:22 PM
2015-16 2016-17Resource Description Estimated Actuals Budget
Total, Restricted Net Position 0.00 0.00

This Page is Blank.
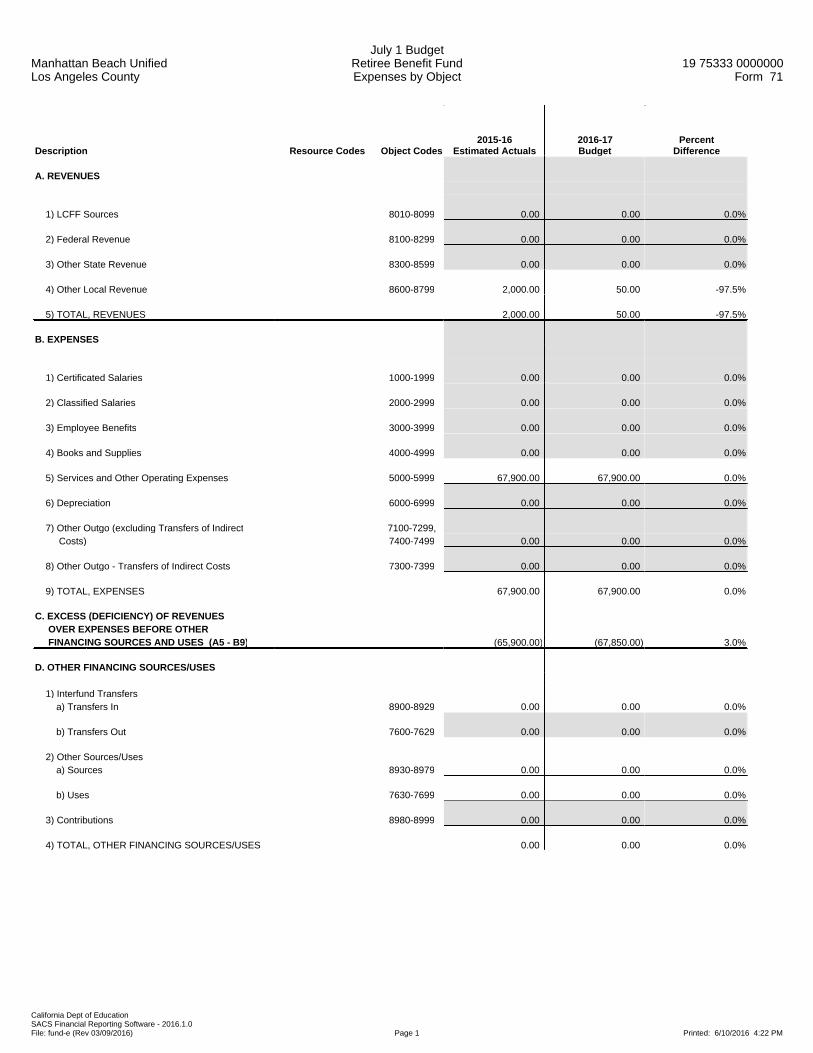
Manhattan Beach UnifiedLos Angeles County
July 1 BudgetRetiree Benefit FundExpenses by Object
19 75333 0000000Form 71
California Dept of EducationSACS Financial Reporting Software - 2016.1.0File: fund-e (Rev 03/09/2016) Page 1 Printed: 6/10/2016 4:22 PM
Description Resource Codes Object Codes2015-16
Estimated Actuals2016-17Budget
PercentDifference
A. REVENUES
1) LCFF Sources 8010-8099 0.00 0.00 0.0%
2) Federal Revenue 8100-8299 0.00 0.00 0.0%
3) Other State Revenue 8300-8599 0.00 0.00 0.0%
4) Other Local Revenue 8600-8799 2,000.00 50.00 -97.5%
5) TOTAL, REVENUES 2,000.00 50.00 -97.5%
B. EXPENSES
1) Certificated Salaries 1000-1999 0.00 0.00 0.0%
2) Classified Salaries 2000-2999 0.00 0.00 0.0%
3) Employee Benefits 3000-3999 0.00 0.00 0.0%
4) Books and Supplies 4000-4999 0.00 0.00 0.0%
5) Services and Other Operating Expenses 5000-5999 67,900.00 67,900.00 0.0%
6) Depreciation 6000-6999 0.00 0.00 0.0%
7) Other Outgo (excluding Transfers of Indirect 7100-7299, Costs) 7400-7499 0.00 0.00 0.0%
8) Other Outgo - Transfers of Indirect Costs 7300-7399 0.00 0.00 0.0%
9) TOTAL, EXPENSES 67,900.00 67,900.00 0.0%
C. EXCESS (DEFICIENCY) OF REVENUES OVER EXPENSES BEFORE OTHER FINANCING SOURCES AND USES (A5 - B9) (65,900.00) (67,850.00) 3.0%
D. OTHER FINANCING SOURCES/USES 1) Interfund Transfers a) Transfers In 8900-8929 0.00 0.00 0.0%
b) Transfers Out 7600-7629 0.00 0.00 0.0%
2) Other Sources/Uses a) Sources 8930-8979 0.00 0.00 0.0%
b) Uses 7630-7699 0.00 0.00 0.0%
3) Contributions 8980-8999 0.00 0.00 0.0%
4) TOTAL, OTHER FINANCING SOURCES/USES 0.00 0.00 0.0%

Manhattan Beach UnifiedLos Angeles County
July 1 BudgetRetiree Benefit FundExpenses by Object
19 75333 0000000Form 71
California Dept of EducationSACS Financial Reporting Software - 2016.1.0File: fund-e (Rev 03/09/2016) Page 2 Printed: 6/10/2016 4:22 PM
Description Resource Codes Object Codes2015-16
Estimated Actuals2016-17Budget
PercentDifference
E. NET INCREASE (DECREASE) IN NET POSITION (C + D4) (65,900.00) (67,850.00) 3.0%
F. NET POSITION 1) Beginning Net Position a) As of July 1 - Unaudited 9791 342,752.85 276,852.85 -19.2%
b) Audit Adjustments 9793 0.00 0.00 0.0%
c) As of July 1 - Audited (F1a + F1b) 342,752.85 276,852.85 -19.2%
d) Other Restatements 9795 0.00 0.00 0.0%
e) Adjusted Beginning Net Position (F1c + F1d) 342,752.85 276,852.85 -19.2%
2) Ending Net Position, June 30 (E + F1e) 276,852.85 209,002.85 -24.5% Components of Ending Net Position a) Net Investment in Capital Assets 9796 0.00 0.00 0.0%
b) Restricted Net Position 9797 0.00 0.00 0.0%
c) Unrestricted Net Position 9790 276,852.85 209,002.85 -24.5%

Manhattan Beach UnifiedLos Angeles County
July 1 BudgetRetiree Benefit FundExpenses by Object
19 75333 0000000Form 71
California Dept of EducationSACS Financial Reporting Software - 2016.1.0File: fund-e (Rev 03/09/2016) Page 3 Printed: 6/10/2016 4:22 PM
Description Resource Codes Object Codes2015-16
Estimated Actuals2016-17Budget
PercentDifference
G. ASSETS 1) Cash a) in County Treasury 9110 0.00
1) Fair Value Adjustment to Cash in County Treasury 9111 0.00
b) in Banks 9120 0.00
c) in Revolving Fund 9130 0.00
d) with Fiscal Agent 9135 0.00
e) collections awaiting deposit 9140 0.00
2) Investments 9150 0.00
3) Accounts Receivable 9200 0.00
4) Due from Grantor Government 9290 0.00
5) Due from Other Funds 9310 0.00
6) Stores 9320 0.00
7) Prepaid Expenditures 9330 0.00
8) Other Current Assets 9340 0.00
9) Fixed Assets 9400
10) TOTAL, ASSETS 0.00
H. DEFERRED OUTFLOWS OF RESOURCES
1) Deferred Outflows of Resources 9490 0.00
2) TOTAL, DEFERRED OUTFLOWS 0.00

Manhattan Beach UnifiedLos Angeles County
July 1 BudgetRetiree Benefit FundExpenses by Object
19 75333 0000000Form 71
California Dept of EducationSACS Financial Reporting Software - 2016.1.0File: fund-e (Rev 03/09/2016) Page 4 Printed: 6/10/2016 4:22 PM
Description Resource Codes Object Codes2015-16
Estimated Actuals2016-17Budget
PercentDifference
I. LIABILITIES
1) Accounts Payable 9500 0.00
2) Due to Grantor Governments 9590 0.00
3) Due to Other Funds 9610 0.00
4) Current Loans 9640
5) Unearned Revenue 9650 0.00
6) Long-Term Liabilities a) Net Pension Liability 9663 0.00
b) Net OPEB Obligation 9664 0.00
c) Compensated Absences 9665 0.00
d) COPs Payable 9666 0.00
e) Capital Leases Payable 9667 0.00
f) Lease Revenue Bonds Payable 9668 0.00
g) Other General Long-Term Liabilities 9669 0.00
7) TOTAL, LIABILITIES 0.00
J. DEFERRED INFLOWS OF RESOURCES
1) Deferred Inflows of Resources 9690 0.00
2) TOTAL, DEFERRED INFLOWS 0.00
K. NET POSITION
Net Position, June 30 (G10 + H2) - (I7 + J2) 0.00

Manhattan Beach UnifiedLos Angeles County
July 1 BudgetRetiree Benefit FundExpenses by Object
19 75333 0000000Form 71
California Dept of EducationSACS Financial Reporting Software - 2016.1.0File: fund-e (Rev 03/09/2016) Page 5 Printed: 6/10/2016 4:22 PM
Description Resource Codes Object Codes2015-16
Estimated Actuals2016-17Budget
PercentDifference
OTHER LOCAL REVENUE
Other Local Revenue
Interest 8660 2,000.00 50.00 -97.5%
Net Increase (Decrease) in the Fair Value of Investments 8662 0.00 0.00 0.0%
Fees and Contracts
In-District Premiums/ Contributions 8674 0.00 0.00 0.0%
Other Local Revenue
All Other Local Revenue 8699 0.00 0.00 0.0%
TOTAL, OTHER LOCAL REVENUE 2,000.00 50.00 -97.5%
TOTAL, REVENUES 2,000.00 50.00 -97.5%
SERVICES AND OTHER OPERATING EXPENSES
Subagreements for Services 5100 0.00 0.00 0.0%
Professional/Consulting Services and Operating Expenditures 5800 67,900.00 67,900.00 0.0%
TOTAL, SERVICES AND OTHER OPERATING EXPENSES 67,900.00 67,900.00 0.0%
TOTAL, EXPENSES 67,900.00 67,900.00 0.0%

Manhattan Beach UnifiedLos Angeles County
July 1 BudgetRetiree Benefit FundExpenses by Object
19 75333 0000000Form 71
California Dept of EducationSACS Financial Reporting Software - 2016.1.0File: fund-e (Rev 03/09/2016) Page 6 Printed: 6/10/2016 4:22 PM
Description Resource Codes Object Codes2015-16
Estimated Actuals2016-17Budget
PercentDifference
INTERFUND TRANSFERS
INTERFUND TRANSFERS IN
Other Authorized Interfund Transfers In 8919 0.00 0.00 0.0%
(a) TOTAL, INTERFUND TRANSFERS IN 0.00 0.00 0.0%
OTHER SOURCES/USES
SOURCES
Other Sources
Transfers from Funds of Lapsed/Reorganized LEAs 8965 0.00 0.00 0.0%
All Other Financing Sources 8979 0.00 0.00 0.0%
(c) TOTAL, SOURCES 0.00 0.00 0.0%
USES
Transfers of Funds from Lapsed/Reorganized LEAs 7651 0.00 0.00 0.0%
All Other Financing Uses 7699 0.00 0.00 0.0%
(d) TOTAL, USES 0.00 0.00 0.0%
CONTRIBUTIONS
Contributions from Unrestricted Revenues 8980 0.00 0.00 0.0%
Contributions from Restricted Revenues 8990 0.00 0.00 0.0%
(e) TOTAL, CONTRIBUTIONS 0.00 0.00 0.0%
TOTAL, OTHER FINANCING SOURCES/USES (a + c - d + e) 0.00 0.00 0.0%

Manhattan Beach UnifiedLos Angeles County
July 1 BudgetRetiree Benefit Fund
Expenses by Function19 75333 0000000
Form 71
California Dept of EducationSACS Financial Reporting Software - 2016.1.0File: fund-e (Rev 02/02/2016) Page 1 Printed: 6/10/2016 4:22 PM
Description Function Codes Object Codes2015-16
Estimated Actuals2016-17Budget
PercentDifference
A. REVENUES
1) LCFF Sources 8010-8099 0.00 0.00 0.0%
2) Federal Revenue 8100-8299 0.00 0.00 0.0%
3) Other State Revenue 8300-8599 0.00 0.00 0.0%
4) Other Local Revenue 8600-8799 2,000.00 50.00 -97.5%
5) TOTAL, REVENUES 2,000.00 50.00 -97.5%
B. EXPENSES (Objects 1000-7999)
1) Instruction 1000-1999 0.00 0.00 0.0%
2) Instruction - Related Services 2000-2999 0.00 0.00 0.0%
3) Pupil Services 3000-3999 0.00 0.00 0.0%
4) Ancillary Services 4000-4999 0.00 0.00 0.0%
5) Community Services 5000-5999 0.00 0.00 0.0%
6) Enterprise 6000-6999 67,900.00 67,900.00 0.0%
7) General Administration 7000-7999 0.00 0.00 0.0%
8) Plant Services 8000-8999 0.00 0.00 0.0%
9) Other Outgo 9000-9999Except
7600-7699 0.00 0.00 0.0%
10) TOTAL, EXPENSES 67,900.00 67,900.00 0.0%
C. EXCESS (DEFICIENCY) OF REVENUES OVER EXPENSES BEFORE OTHER FINANCING SOURCES AND USES (A5 - B10) (65,900.00) (67,850.00) 3.0%
D. OTHER FINANCING SOURCES/USES 1) Interfund Transfers a) Transfers In 8900-8929 0.00 0.00 0.0%
b) Transfers Out 7600-7629 0.00 0.00 0.0%
2) Other Sources/Uses a) Sources 8930-8979 0.00 0.00 0.0%
b) Uses 7630-7699 0.00 0.00 0.0%
3) Contributions 8980-8999 0.00 0.00 0.0%
4) TOTAL, OTHER FINANCING SOURCES/USES 0.00 0.00 0.0%

Manhattan Beach UnifiedLos Angeles County
July 1 BudgetRetiree Benefit Fund
Expenses by Function19 75333 0000000
Form 71
California Dept of EducationSACS Financial Reporting Software - 2016.1.0File: fund-e (Rev 02/02/2016) Page 2 Printed: 6/10/2016 4:22 PM
Description Function Codes Object Codes2015-16
Estimated Actuals2016-17Budget
PercentDifference
E. NET INCREASE (DECREASE) IN NET POSITION (C + D4) (65,900.00) (67,850.00) 3.0%
F. NET POSITION 1) Beginning Net Position
a) As of July 1 - Unaudited 9791 342,752.85 276,852.85 -19.2%
b) Audit Adjustments 9793 0.00 0.00 0.0%
c) As of July 1 - Audited (F1a + F1b) 342,752.85 276,852.85 -19.2%
d) Other Restatements 9795 0.00 0.00 0.0%
e) Adjusted Beginning Net Position (F1c + F1d) 342,752.85 276,852.85 -19.2%
2) Ending Net Position, June 30 (E + F1e) 276,852.85 209,002.85 -24.5% Components of Ending Net Position a) Net Investment in Capital Assets 9796 0.00 0.00 0.0%
b) Restricted Net Position 9797 0.00 0.00 0.0%
c) Unrestricted Net Position 9790 276,852.85 209,002.85 -24.5%

Manhattan Beach UnifiedLos Angeles County
July 1 BudgetRetiree Benefit Fund
Exhibit: Restricted Net Position Detail19 75333 0000000
Form 71
California Dept of EducationSACS Financial Reporting Software - 2016.1.0File: fund-e (Rev 11/30/2012) Page 1 Printed: 6/10/2016 4:22 PM
2015-16 2016-17Resource Description Estimated Actuals Budget
Total, Restricted Net Position 0.00 0.00

This Page is Blank.

Manhattan Beach UnifiedLos Angeles County
2016-17 July 1 BudgetAVERAGE DAILY ATTENDANCE 19 75333 0000000
Form A
California Dept of EducationSACS Financial Reporting Software - 2016.1.0File: ada (Rev 02/03/2016) Page 1 of 1 Printed: 6/10/2016 4:22 PM
2015-16 Estimated Actuals 2016-17 Budget2016-17 Budget
Description P-2 ADA Annual ADA Funded ADAEstimated P-2
ADAEstimated
Annual ADAEstimated
Funded ADA
A. DISTRICT 1. Total District Regular ADA Includes Opportunity Classes, Home & Hospital, Special Day Class, Continuation Education, Special Education NPS/LCI and Extended Year, and Community Day School (includes Necessary Small School ADA) 6,622.76 6,622.76 6,680.38 6,622.76 6,622.76 6,622.76 2. Total Basic Aid Choice/Court Ordered Voluntary Pupil Transfer Regular ADA Includes Opportunity Classes, Home & Hospital, Special Day Class, Continuation Education, Special Education NPS/LCI and Extended Year, and Community Day School (ADA not included in Line A1 above) 3. Total Basic Aid Open Enrollment Regular ADA Includes Opportunity Classes, Home & Hospital, Special Day Class, Continuation Education, Special Education NPS/LCI and Extended Year, and Community Day School (ADA not included in Line A1 above) 4. Total, District Regular ADA (Sum of Lines A1 through A3) 6,622.76 6,622.76 6,680.38 6,622.76 6,622.76 6,622.76 5. District Funded County Program ADA a. County Community Schools 5.15 5.15 5.15 5.15 5.15 5.15 b. Special Education-Special Day Class c. Special Education-NPS/LCI d. Special Education Extended Year e. Other County Operated Programs: Opportunity Schools and Full Day Opportunity Classes, Specialized Secondary Schools, Technical, Agricultural, and Natura Resource Conservation Schools f. County School Tuition Fund (Out of State Tuition) [EC 2000 and 46380] g. Total, District Funded County Program ADA (Sum of Lines A5a through A5f) 5.15 5.15 5.15 5.15 5.15 5.15 6. TOTAL DISTRICT ADA (Sum of Line A4 and Line A5g) 6,627.91 6,627.91 6,685.53 6,627.91 6,627.91 6,627.91 7. Adults in Correctional Facilities 8. Charter School ADA (Enter Charter School ADA using Tab C. Charter School ADA)
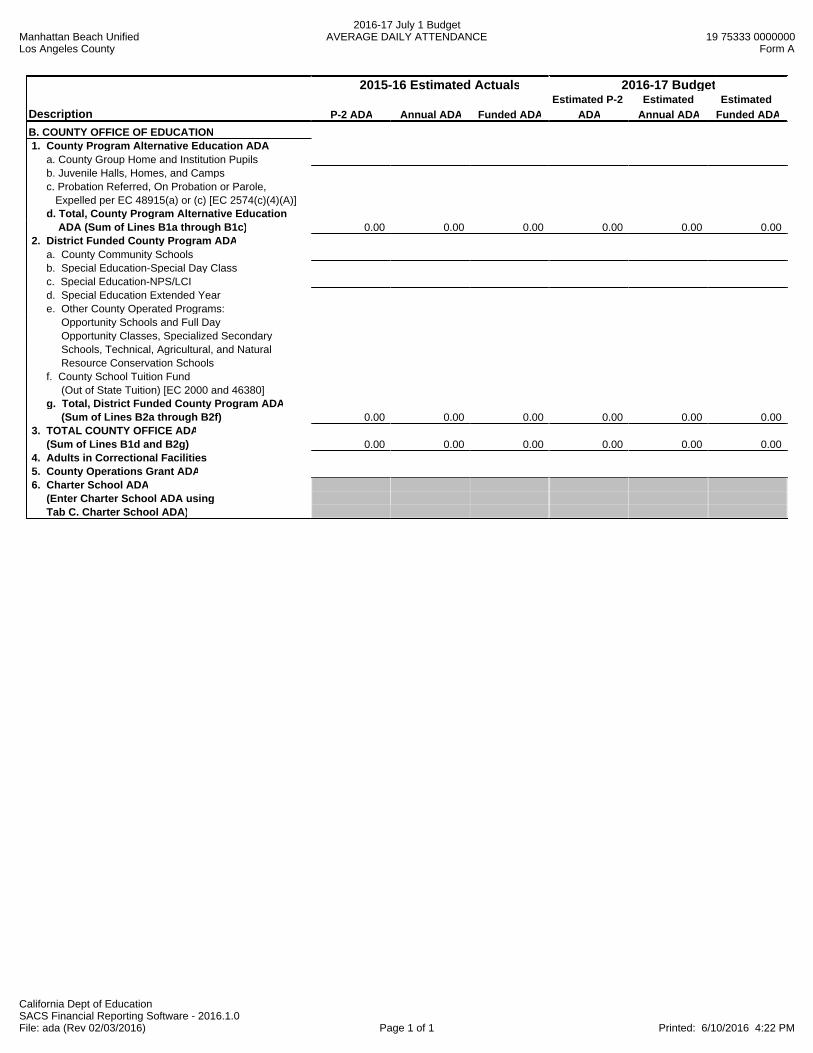
Manhattan Beach UnifiedLos Angeles County
2016-17 July 1 BudgetAVERAGE DAILY ATTENDANCE 19 75333 0000000
Form A
California Dept of EducationSACS Financial Reporting Software - 2016.1.0File: ada (Rev 02/03/2016) Page 1 of 1 Printed: 6/10/2016 4:22 PM
2015-16 Estimated Actuals 2016-17 Budget2016-17 BudgetEstimated P-2 Estimated Estimated
Description P-2 ADA Annual ADA Funded ADA ADA Annual ADA Funded ADAB. COUNTY OFFICE OF EDUCATION 1. County Program Alternative Education ADA a. County Group Home and Institution Pupils b. Juvenile Halls, Homes, and Camps c. Probation Referred, On Probation or Parole, Expelled per EC 48915(a) or (c) [EC 2574(c)(4)(A)] d. Total, County Program Alternative Education ADA (Sum of Lines B1a through B1c) 0.00 0.00 0.00 0.00 0.00 0.00 2. District Funded County Program ADA a. County Community Schools b. Special Education-Special Day Class c. Special Education-NPS/LCI d. Special Education Extended Year e. Other County Operated Programs: Opportunity Schools and Full Day Opportunity Classes, Specialized Secondary Schools, Technical, Agricultural, and Natural Resource Conservation Schools f. County School Tuition Fund (Out of State Tuition) [EC 2000 and 46380] g. Total, District Funded County Program ADA (Sum of Lines B2a through B2f) 0.00 0.00 0.00 0.00 0.00 0.00 3. TOTAL COUNTY OFFICE ADA (Sum of Lines B1d and B2g) 0.00 0.00 0.00 0.00 0.00 0.00 4. Adults in Correctional Facilities 5. County Operations Grant ADA 6. Charter School ADA (Enter Charter School ADA using Tab C. Charter School ADA)

Manhattan Beach UnifiedLos Angeles County
2016-17 July 1 BudgetAVERAGE DAILY ATTENDANCE 19 75333 0000000
Form A
California Dept of EducationSACS Financial Reporting Software - 2016.1.0File: ada (Rev 02/03/2016) Page 1 of 1 Printed: 6/10/2016 4:22 PM
2015-16 Estimated Actuals 2016-17 Budget2016-17 Budget
Description P-2 ADA Annual ADA Funded ADAEstimated P-2
ADAEstimated
Annual ADAEstimated
Funded ADAC. CHARTER SCHOOL ADA Authorizing LEAs reporting charter school SACS financial data in their Fund 01, 09, or 62 use this worksheet to report ADA for those charter schools Authorizing LEAs reporting charter school SACS financial data in their Fund 01, 09, or 62 use this worksheet to report ADA for those charter schools Charter schools reporting SACS financial data separately from their authorizing LEAs in Fund 01 or Fund 62 use this worksheet to report their ADA Charter schools reporting SACS financial data separately from their authorizing LEAs in Fund 01 or Fund 62 use this worksheet to report their ADA
FUND 01: Charter School ADA corresponding to SACS financial data reported in Fund 01 FUND 01: Charter School ADA corresponding to SACS financial data reported in Fund 01
1. Total Charter School Regular ADA 2. Charter School County Program Alternative Education ADA a. County Group Home and Institution Pupils b. Juvenile Halls, Homes, and Camps c. Probation Referred, On Probation or Parole, Expelled per EC 48915(a) or (c) [EC 2574(c)(4)(A)] d. Total, Charter School County Program Alternative Education ADA (Sum of Lines C2a through C2c) 0.00 0.00 0.00 0.00 0.00 0.00 3. Charter School Funded County Program ADA a. County Community Schools b. Special Education-Special Day Class c. Special Education-NPS/LCI d. Special Education Extended Year e. Other County Operated Programs: Opportunity Schools and Full Day Opportunity Classes, Specialized Secondary Schools, Technical, Agricultural, and Natura Resource Conservation Schools f. Total, Charter School Funded County Program ADA (Sum of Lines C3a through C3e) 0.00 0.00 0.00 0.00 0.00 0.00 4. TOTAL CHARTER SCHOOL ADA (Sum of Lines C1, C2d, and C3f) 0.00 0.00 0.00 0.00 0.00 0.00
FUND 09 or 62: Charter School ADA corresponding to SACS financial data reported in Fund 09 or Fund 62
5. Total Charter School Regular ADA 6. Charter School County Program Alternative Education ADA a. County Group Home and Institution Pupils b. Juvenile Halls, Homes, and Camps c. Probation Referred, On Probation or Parole, Expelled per EC 48915(a) or (c) [EC 2574(c)(4)(A)] d. Total, Charter School County Program Alternative Education ADA (Sum of Lines C6a through C6c) 0.00 0.00 0.00 0.00 0.00 0.00 7. Charter School Funded County Program ADA a. County Community Schools b. Special Education-Special Day Class c. Special Education-NPS/LCI d. Special Education Extended Year e. Other County Operated Programs: Opportunity Schools and Full Day Opportunity Classes, Specialized Secondary Schools, Technical, Agricultural, and Natura Resource Conservation Schools f. Total, Charter School Funded County Program ADA (Sum of Lines C7a through C7e) 0.00 0.00 0.00 0.00 0.00 0.00 8. TOTAL CHARTER SCHOOL ADA (Sum of Lines C5, C6d, and C7f) 0.00 0.00 0.00 0.00 0.00 0.00 9. TOTAL CHARTER SCHOOL ADA Reported in Fund 01, 09, or 62 (Sum of Lines C4 and C8) 0.00 0.00 0.00 0.00 0.00 0.00

This Page is Blank.
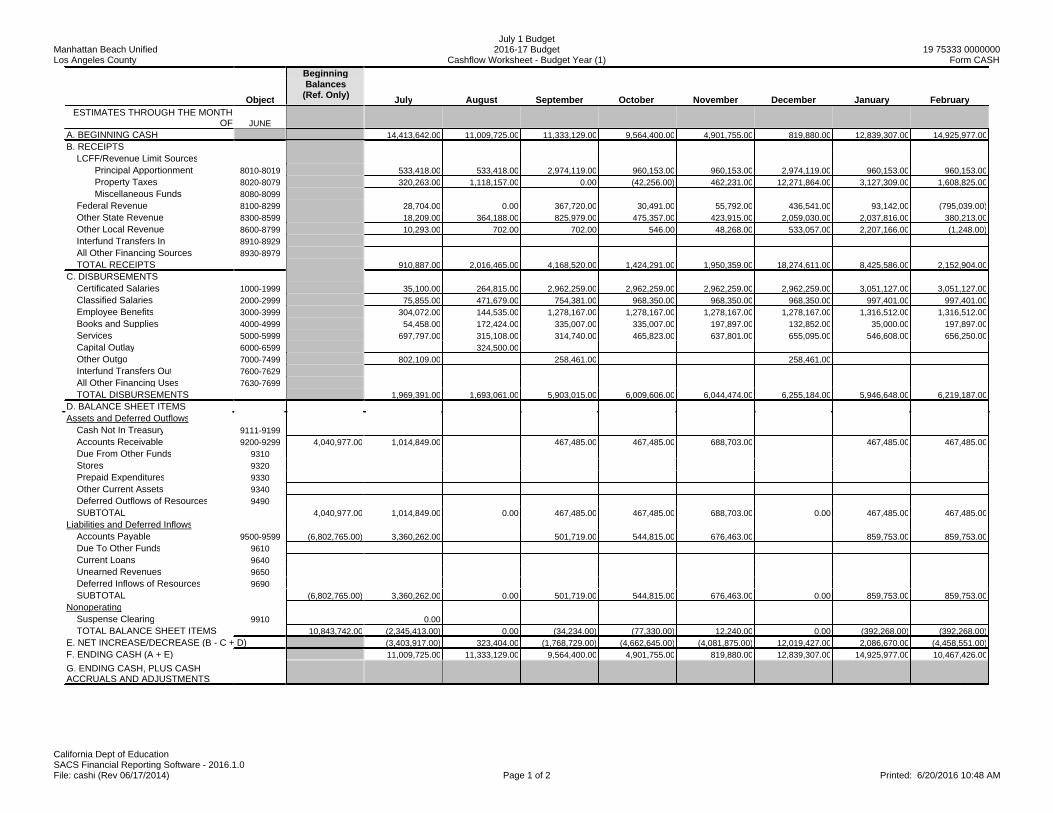
Manhattan Beach UnifiedLos Angeles County
July 1 Budget2016-17 Budget
Cashflow Worksheet - Budget Year (1)19 75333 0000000
Form CASH
California Dept of EducationSACS Financial Reporting Software - 2016.1.0File: cashi (Rev 06/17/2014) Page 1 of 2 Printed: 6/20/2016 10:48 AM
Beginning
ObjectBalances
(Ref. Only) July August September October November December January FebruaryESTIMATES THROUGH THE MONTH
OF JUNEA. BEGINNING CASH 14,413,642.00 11,009,725.00 11,333,129.00 9,564,400.00 4,901,755.00 819,880.00 12,839,307.00 14,925,977.00B. RECEIPTS LCFF/Revenue Limit Sources Principal Apportionment 8010-8019 533,418.00 533,418.00 2,974,119.00 960,153.00 960,153.00 2,974,119.00 960,153.00 960,153.00 Property Taxes 8020-8079 320,263.00 1,118,157.00 0.00 (42,256.00) 462,231.00 12,271,864.00 3,127,309.00 1,608,825.00 Miscellaneous Funds 8080-8099 Federal Revenue 8100-8299 28,704.00 0.00 367,720.00 30,491.00 55,792.00 436,541.00 93,142.00 (795,039.00) Other State Revenue 8300-8599 18,209.00 364,188.00 825,979.00 475,357.00 423,915.00 2,059,030.00 2,037,816.00 380,213.00 Other Local Revenue 8600-8799 10,293.00 702.00 702.00 546.00 48,268.00 533,057.00 2,207,166.00 (1,248.00) Interfund Transfers In 8910-8929 All Other Financing Sources 8930-8979 TOTAL RECEIPTS 910,887.00 2,016,465.00 4,168,520.00 1,424,291.00 1,950,359.00 18,274,611.00 8,425,586.00 2,152,904.00C. DISBURSEMENTS Certificated Salaries 1000-1999 35,100.00 264,815.00 2,962,259.00 2,962,259.00 2,962,259.00 2,962,259.00 3,051,127.00 3,051,127.00 Classified Salaries 2000-2999 75,855.00 471,679.00 754,381.00 968,350.00 968,350.00 968,350.00 997,401.00 997,401.00 Employee Benefits 3000-3999 304,072.00 144,535.00 1,278,167.00 1,278,167.00 1,278,167.00 1,278,167.00 1,316,512.00 1,316,512.00 Books and Supplies 4000-4999 54,458.00 172,424.00 335,007.00 335,007.00 197,897.00 132,852.00 35,000.00 197,897.00 Services 5000-5999 697,797.00 315,108.00 314,740.00 465,823.00 637,801.00 655,095.00 546,608.00 656,250.00 Capital Outlay 6000-6599 324,500.00 Other Outgo 7000-7499 802,109.00 258,461.00 258,461.00 Interfund Transfers Out 7600-7629 All Other Financing Uses 7630-7699 TOTAL DISBURSEMENTS 1,969,391.00 1,693,061.00 5,903,015.00 6,009,606.00 6,044,474.00 6,255,184.00 5,946,648.00 6,219,187.00D. BALANCE SHEET ITEMSAssets and Deferred Outflows Cash Not In Treasury 9111-9199 Accounts Receivable 9200-9299 4,040,977.00 1,014,849.00 467,485.00 467,485.00 688,703.00 467,485.00 467,485.00 Due From Other Funds 9310 Stores 9320 Prepaid Expenditures 9330 Other Current Assets 9340 Deferred Outflows of Resources 9490 SUBTOTAL 4,040,977.00 1,014,849.00 0.00 467,485.00 467,485.00 688,703.00 0.00 467,485.00 467,485.00Liabilities and Deferred Inflows Accounts Payable 9500-9599 (6,802,765.00) 3,360,262.00 501,719.00 544,815.00 676,463.00 859,753.00 859,753.00 Due To Other Funds 9610 Current Loans 9640 Unearned Revenues 9650 Deferred Inflows of Resources 9690 SUBTOTAL (6,802,765.00) 3,360,262.00 0.00 501,719.00 544,815.00 676,463.00 0.00 859,753.00 859,753.00Nonoperating Suspense Clearing 9910 0.00 TOTAL BALANCE SHEET ITEMS 10,843,742.00 (2,345,413.00) 0.00 (34,234.00) (77,330.00) 12,240.00 0.00 (392,268.00) (392,268.00)E. NET INCREASE/DECREASE (B - C + D) (3,403,917.00) 323,404.00 (1,768,729.00) (4,662,645.00) (4,081,875.00) 12,019,427.00 2,086,670.00 (4,458,551.00)F. ENDING CASH (A + E) 11,009,725.00 11,333,129.00 9,564,400.00 4,901,755.00 819,880.00 12,839,307.00 14,925,977.00 10,467,426.00G. ENDING CASH, PLUS CASHACCRUALS AND ADJUSTMENTS

Manhattan Beach UnifiedLos Angeles County
July 1 Budget2016-17 Budget
Cashflow Worksheet - Budget Year (1)19 75333 0000000
Form CASH
California Dept of EducationSACS Financial Reporting Software - 2016.1.0File: cashi (Rev 06/17/2014) Page 2 of 2 Printed: 6/20/2016 10:48 AM
ObjectESTIMATES THROUGH THE MONTH
OF JUNEA. BEGINNING CASHB. RECEIPTS LCFF/Revenue Limit Sources Principal Apportionment 8010-8019 Property Taxes 8020-8079 Miscellaneous Funds 8080-8099 Federal Revenue 8100-8299 Other State Revenue 8300-8599 Other Local Revenue 8600-8799 Interfund Transfers In 8910-8929 All Other Financing Sources 8930-8979 TOTAL RECEIPTSC. DISBURSEMENTS Certificated Salaries 1000-1999 Classified Salaries 2000-2999 Employee Benefits 3000-3999 Books and Supplies 4000-4999 Services 5000-5999 Capital Outlay 6000-6599 Other Outgo 7000-7499 Interfund Transfers Out 7600-7629 All Other Financing Uses 7630-7699 TOTAL DISBURSEMENTSD. BALANCE SHEET ITEMSAssets and Deferred Outflows Cash Not In Treasury 9111-9199 Accounts Receivable 9200-9299 Due From Other Funds 9310 Stores 9320 Prepaid Expenditures 9330 Other Current Assets 9340 Deferred Outflows of Resources 9490 SUBTOTALLiabilities and Deferred Inflows Accounts Payable 9500-9599 Due To Other Funds 9610 Current Loans 9640 Unearned Revenues 9650 Deferred Inflows of Resources 9690 SUBTOTAL Nonoperating Suspense Clearing 9910 TOTAL BALANCE SHEET ITEMSE. NET INCREASE/DECREASE (B - C + D)F. ENDING CASH (A + E)G. ENDING CASH, PLUS CASHACCRUALS AND ADJUSTMENTS
March April May June Accruals Adjustments TOTAL BUDGET
10,467,426.00 7,133,231.00 12,364,984.00 11,180,393.00
2,974,119.00 960,153.00 960,153.00 2,974,116.00 18,724,227.00 18,724,227.00110,487.00 8,980,925.00 3,643,061.00 1,310,496.00 32,911,362.00 32,911,362.00
0.00 0.00(118,700.00) 0.00 431,711.00 617,788.00 570,649.00 1,718,799.00 1,718,799.00(425,736.00) 1,232,413.00 261,760.00 261,760.00 1,189,805.00 9,104,709.00 9,104,709.00
184,262.00 251,479.00 (1,404.00) 3,018,838.00 1,545,134.00 7,797,795.00 7,797,795.00 0.00 0.00 0.00 0.00
2,724,432.00 11,424,970.00 5,295,281.00 8,182,998.00 3,305,588.00 0.00 70,256,892.00 70,256,892.00
3,051,127.00 3,051,127.00 3,051,127.00 3,051,127.00 2,943,693.00 33,399,406.00 33,399,406.00997,401.00 997,401.00 997,401.00 997,401.00 795,325.00 10,986,696.00 10,986,696.00
1,316,512.00 1,316,512.00 1,416,512.00 1,558,163.00 2,346,997.00 16,148,995.00 16,148,995.00197,897.00 197,897.00 278,328.00 286,678.00 116,707.00 2,538,049.00 2,538,049.00704,714.00 630,280.00 736,504.00 923,048.00 1,079,034.00 8,362,802.00 8,362,802.00
324,500.00 324,500.00258,461.00 258,459.00 1,835,951.00 1,835,951.00
0.00 0.00 0.00 0.00
6,526,112.00 6,193,217.00 6,479,872.00 6,816,417.00 7,540,215.00 0.00 73,596,399.00 73,596,399.00
0.00467,485.00 4,040,977.00
0.00 0.00 0.00 0.00
0.00 0.00467,485.00 0.00 0.00 0.00 0.00 0.00 4,040,977.00
6,802,765.00 0.00 0.00 0.00
0.000.00 0.00 0.00 0.00 0.00 0.00 6,802,765.00
0.00467,485.00 0.00 0.00 0.00 0.00 0.00 (2,761,788.00)
(3,334,195.00) 5,231,753.00 (1,184,591.00) 1,366,581.00 (4,234,627.00) 0.00 (6,101,295.00) (3,339,507.00)7,133,231.00 12,364,984.00 11,180,393.00 12,546,974.00
8,312,347.00

Manhattan Beach UnifiedLos Angeles County
July 1 Budget2016-17 Budget
Cashflow Worksheet - Budget Year (2)19 75333 0000000
Form CASH
California Dept of EducationSACS Financial Reporting Software - 2016.1.0File: cashi (Rev 06/17/2014) Page 1 of 2 Printed: 6/20/2016 10:48 AM
Beginning
ObjectBalances
(Ref. Only) July August September October November December January FebruaryESTIMATES THROUGH THE MONTH
OF JUNEA. BEGINNING CASH 12,546,974.00 8,748,304.00 8,629,382.00 6,815,980.00 2,987,748.00 411,647.00 11,081,237.00 13,617,531.00B. RECEIPTS LCFF/Revenue Limit Sources Principal Apportionment 8010-8019 602,583.00 602,583.00 3,098,617.00 1,084,650.00 1,084,650.00 3,098,617.00 1,084,650.00 1,084,650.00 Property Taxes 8020-8079 320,263.00 1,118,157.00 0.00 (42,256.00) 462,231.00 12,271,865.00 3,127,309.00 1,608,825.00 Miscellaneous Funds 8080-8099 Federal Revenue 8100-8299 28,704.00 367,720.00 30,491.00 55,792.00 436,541.00 93,142.00 (795,039.00) Other State Revenue 8300-8599 18,209.00 364,188.00 825,979.00 475,357.00 423,915.00 1,259,030.00 2,037,816.00 380,213.00 Other Local Revenue 8600-8799 10,293.00 702.00 702.00 546.00 48,268.00 533,057.00 2,207,166.00 (1,248.00) Interfund Transfers In 8910-8929 All Other Financing Sources 8930-8979 TOTAL RECEIPTS 980,052.00 2,085,630.00 4,293,018.00 1,548,788.00 2,074,856.00 17,599,110.00 8,550,083.00 2,277,401.00C. DISBURSEMENTS Certificated Salaries 1000-1999 35,100.00 264,815.00 2,862,259.00 2,862,259.00 2,862,259.00 2,862,259.00 2,862,259.00 2,862,259.00 Classified Salaries 2000-2999 75,855.00 471,679.00 754,381.00 968,350.00 968,350.00 968,350.00 968,350.00 968,350.00 Employee Benefits 3000-3999 304,072.00 144,535.00 1,316,512.00 1,316,512.00 1,316,512.00 1,316,512.00 1,316,512.00 1,316,512.00 Books and Supplies 4000-4999 54,458.00 172,424.00 315,007.00 315,007.00 167,897.00 132,852.00 35,000.00 167,897.00 Services 5000-5999 697,797.00 315,108.00 314,740.00 465,823.00 437,801.00 555,095.00 546,608.00 656,250.00 Capital Outlay 6000-6599 Other Outgo 7000-7499 802,109.00 258,461.00 258,461.00 Interfund Transfers Out 7600-7629 All Other Financing Uses 7630-7699 TOTAL DISBURSEMENTS 1,969,391.00 1,368,561.00 5,821,360.00 5,927,951.00 5,752,819.00 6,093,529.00 5,728,729.00 5,971,268.00D. BALANCE SHEET ITEMSAssets and Deferred Outflows Cash Not In Treasury 9111-9199 Accounts Receivable 9200-9299 3,305,588.00 550,931.00 550,931.00 550,931.00 1,101,862.00 550,931.00 Due From Other Funds 9310 Stores 9320 Prepaid Expenditures 9330 Other Current Assets 9340 Deferred Outflows of Resources 9490 SUBTOTAL 3,305,588.00 550,931.00 0.00 550,931.00 550,931.00 1,101,862.00 0.00 550,931.00 0.00Liabilities and Deferred Inflows Accounts Payable 9500-9599 (7,540,215.00) 3,360,262.00 835,991.00 835,991.00 835,991.00 835,991.00 Due To Other Funds 9610 Current Loans 9640 Unearned Revenues 9650 Deferred Inflows of Resources 9690 SUBTOTAL (7,540,215.00) 3,360,262.00 835,991.00 835,991.00 0.00 0.00 835,991.00 835,991.00 0.00Nonoperating Suspense Clearing 9910 TOTAL BALANCE SHEET ITEMS 10,845,803.00 (2,809,331.00) (835,991.00) (285,060.00) 550,931.00 1,101,862.00 (835,991.00) (285,060.00) 0.00E. NET INCREASE/DECREASE (B - C + D) (3,798,670.00) (118,922.00) (1,813,402.00) (3,828,232.00) (2,576,101.00) 10,669,590.00 2,536,294.00 (3,693,867.00)F. ENDING CASH (A + E) 8,748,304.00 8,629,382.00 6,815,980.00 2,987,748.00 411,647.00 11,081,237.00 13,617,531.00 9,923,664.00G. ENDING CASH, PLUS CASHACCRUALS AND ADJUSTMENTS

Manhattan Beach UnifiedLos Angeles County
July 1 Budget2016-17 Budget
Cashflow Worksheet - Budget Year (2)19 75333 0000000
Form CASH
California Dept of EducationSACS Financial Reporting Software - 2016.1.0File: cashi (Rev 06/17/2014) Page 2 of 2 Printed: 6/20/2016 10:49 AM
ObjectESTIMATES THROUGH THE MONTH
OF JUNEA. BEGINNING CASHB. RECEIPTS LCFF/Revenue Limit Sources Principal Apportionment 8010-8019 Property Taxes 8020-8079 Miscellaneous Funds 8080-8099 Federal Revenue 8100-8299 Other State Revenue 8300-8599 Other Local Revenue 8600-8799 Interfund Transfers In 8910-8929 All Other Financing Sources 8930-8979 TOTAL RECEIPTSC. DISBURSEMENTS Certificated Salaries 1000-1999 Classified Salaries 2000-2999 Employee Benefits 3000-3999 Books and Supplies 4000-4999 Services 5000-5999 Capital Outlay 6000-6599 Other Outgo 7000-7499 Interfund Transfers Out 7600-7629 All Other Financing Uses 7630-7699 TOTAL DISBURSEMENTSD. BALANCE SHEET ITEMSAssets and Deferred Outflows Cash Not In Treasury 9111-9199 Accounts Receivable 9200-9299 Due From Other Funds 9310 Stores 9320 Prepaid Expenditures 9330 Other Current Assets 9340 Deferred Outflows of Resources 9490 SUBTOTALLiabilities and Deferred Inflows Accounts Payable 9500-9599 Due To Other Funds 9610 Current Loans 9640 Unearned Revenues 9650 Deferred Inflows of Resources 9690 SUBTOTALNonoperating Suspense Clearing 9910 TOTAL BALANCE SHEET ITEMSE. NET INCREASE/DECREASE (B - C + D)F. ENDING CASH (A + E)G. ENDING CASH, PLUS CASHACCRUALS AND ADJUSTMENTS
March April May June Accruals Adjustments TOTAL BUDGET
9,923,664.00 5,658,409.00 11,262,578.00 10,630,834.00
3,098,617.00 1,084,650.00 1,084,650.00 3,098,619.00 20,107,536.00 20,107,536.00110,486.00 8,980,925.00 3,643,061.00 1,310,496.00 32,911,362.00 32,911,362.00
0.00(118,700.00) 431,711.00 617,788.00 570,649.00 1,718,799.00 1,718,799.00(425,736.00) 1,232,413.00 261,760.00 261,760.00 420,212.00 7,535,116.00 7,535,116.00
184,262.00 251,479.00 (1,404.00) 3,018,838.00 1,547,370.00 7,800,031.00 7,800,031.00 0.00 0.00
2,848,929.00 11,549,467.00 5,419,778.00 8,307,501.00 2,538,231.00 0.00 70,072,844.00 70,072,844.00
2,862,259.00 2,862,259.00 2,862,259.00 2,862,259.00 1,368,487.00 30,290,992.00 30,290,992.00968,350.00 968,350.00 968,350.00 968,350.00 995,040.00 11,012,105.00 11,012,105.00
1,316,512.00 1,316,512.00 1,316,512.00 1,316,512.00 3,004,976.00 16,618,703.00 16,618,703.00167,897.00 167,897.00 167,897.00 167,897.00 169,370.00 2,201,500.00 2,201,500.00704,714.00 630,280.00 736,504.00 923,048.00 1,589,817.00 8,573,585.00 8,573,585.00
0.00 0.00258,461.00 208,055.00 1,785,547.00 1,785,547.00
0.00 0.00
6,278,193.00 5,945,298.00 6,051,522.00 6,238,066.00 7,335,745.00 0.00 70,482,432.00 70,482,432.00
0.00 3,305,586.00 0.00 0.00
0.000.00
0.000.00 0.00 0.00 0.00 0.00 0.00 3,305,586.00
835,991.00 7,540,217.00 0.00 0.00 0.00
0.00835,991.00 0.00 0.00 0.00 0.00 0.00 7,540,217.00
0.00(835,991.00) 0.00 0.00 0.00 0.00 0.00 (4,234,631.00)
(4,265,255.00) 5,604,169.00 (631,744.00) 2,069,435.00 (4,797,514.00) 0.00 (4,644,219.00) (409,588.00)5,658,409.00 11,262,578.00 10,630,834.00 12,700,269.00
7,902,755.00

Manhattan Beach UnifiedLos Angeles County
July 1 Budget2015-16 Estimated Actuals
GENERAL FUNDCurrent Expense Formula/Minimum Classroom Compensation
19 75333 0000000Form CEA
California Dept of EducationSACS Financial Reporting Software - 2016.1.0File: cea (Rev 03/23/2016) Page 1 of 2 Printed: 6/10/2016 4:23 PM
PART I - CURRENTEXPENSE FORMULA
Total Expensefor Year
(1)EDPNo.
Reductions(See Note 1)
(2)EDPNo.
Current Expenseof Education(Col 1 - Col 2)
(3)EDPNo.
Reductions(Extracted)
(See Note 2)(4a)
Reductions(Overrides)*(See Note 2)
(4b)EDPNo.
Current Expense-Part II
(Col 3 - Col 4)(5)
EDPNo.
1000 - CertificatedSalaries 33,061,996.00 301 643.00 303 33,061,353.00 305 0.00 307 33,061,353.00 309
2000 - Classified Salaries 11,082,385.00 311 0.00 313 11,082,385.00 315 520,779.00 317 10,561,606.00 319
3000 - Employee Benefits 12,995,967.00 321 33,083.00 323 12,962,884.00 325 209,278.00 327 12,753,606.00 3294000 - Books, SuppliesEquip Replace. (6500) 5,234,451.00 331 0.00 333 5,234,451.00 335 1,150,736.00 337 4,083,715.00 3395000 - Services. . . &7300 - Indirect Costs 10,627,976.00 341 6,462.00 343 10,621,514.00 345 4,075,707.00 347 6,545,807.00 349
TOTAL 72,962,587.00 365 TOTAL 67,006,087.00 369
Note 1 - In Column 2, report expenditures for the following programs: Nonagency (Goals 7100-7199), Community Services (Goal 8100), Food Services (Function 3700), Fringe Benefits for Retired Persons (Objects 3701-3702), and Facilities Acquisition & Construction (Function 8500).
Note 2 - In Column 4, report expenditures for: Transportation (Function 3600), Lottery Expenditures (Resource 1100), Special Education Students in Nonpublic Schools (Function 1180), and other federal or state categorical aid in which funds were granted for expenditures in a program not incurring any teacher salary expenditures or requiring disbursement of the funds without regard to the requirements of EC Section 41372
* If an amount (even zero) is entered in any row of Column 4b or in Line 13b, the form uses only the values in Column 4b and Line 13b rather than the values in Column 4a and Line 13a.
PART II: MINIMUM CLASSROOM COMPENSATION (Instruction, Functions 1000-1999) ObjectEDPNo.
1. Teacher Salaries as Per EC 41011. . . . . . . . . . . . . . . . . . . . . . . . . . . . . . . . . . . . . . . . . . . . . . . . . . . . . . . . . . . . . . . . . . . . . . . 1100 27,505,989.00 3752. Salaries of Instructional Aides Per EC 41011. . . . . . . . . . . . . . . . . . . . . . . . . . . . . . . . . . . . . . . . . . . . . . . . . . . . . . . . . . . . . . . 2100 4,559,953.00 3803. STRS. . . . . . . . . . . . . . . . . . . . . . . . . . . . . . . . . . . . . . . . . . . . . . . . . . . . . . . . . . . . . . . . . . . . . . . . . . . . . . . . . . . . . . . . . . . . . . 3101 & 3102 2,932,013.00 3824. PERS. . . . . . . . . . . . . . . . . . . . . . . . . . . . . . . . . . . . . . . . . . . . . . . . . . . . . . . . . . . . . . . . . . . . . . . . . . . . . . . . . . . . . . . . . . . . . . 3201 & 3202 533,921.00 3835. OASDI - Regular, Medicare and Alternative. . . . . . . . . . . . . . . . . . . . . . . . . . . . . . . . . . . . . . . . . . . . . . . . . . . . . . . . . . . . . . . . 3301 & 3302 745,872.00 3846. Health & Welfare Benefits (EC 41372) (Include Health, Dental, Vision, Pharmaceutical, and Annuity Plans). . . . . . . . . . . . . . . . . . . . . . . . . . . . . . . . . . . . . . . . . . . . . . . . . . . . . . . . . . . . . . . . . . . . . . . . . . . . . . . . . . . . . . . 3401 & 3402 4,029,551.00 3857. Unemployment Insurance. . . . . . . . . . . . . . . . . . . . . . . . . . . . . . . . . . . . . . . . . . . . . . . . . . . . . . . . . . . . . . . . . . . . . . . . . . . . . . 3501 & 3502 16,688.00 3908. Workers' Compensation Insurance. . . . . . . . . . . . . . . . . . . . . . . . . . . . . . . . . . . . . . . . . . . . . . . . . . . . . . . . . . . . . . . . . . . . . . . 3601 & 3602 784,640.00 3929. OPEB, Active Employees (EC 41372). . . . . . . . . . . . . . . . . . . . . . . . . . . . . . . . . . . . . . . . . . . . . . . . . . . . . . . . . . . . . . . . . . . . 3751 & 3752 0.0010. Other Benefits (EC 22310). . . . . . . . . . . . . . . . . . . . . . . . . . . . . . . . . . . . . . . . . . . . . . . . . . . . . . . . . . . . . . . . . . . . . . . . . . . . . 3901 & 3902 0.00 39311. SUBTOTAL Salaries and Benefits (Sum Lines 1 - 10). . . . . . . . . . . . . . . . . . . . . . . . . . . . . . . . . . . . . . . . . . . . . . . . . . . . . . . . . . . . . . . . . . . . . . . . . . . . . . 41,108,627.00 39512. Less: Teacher and Instructional Aide Salaries and Benefits deducted in Column 2. . . . . . . . . . . . . . . . . . . . . . . . . . . . . . . . . . . . . . . . . . . . . . . . . . . . . . . . . . . . . . . . . . . . . . . . . . . . . . . . . . . . . . . . . . . . . . . . 726.0013a. Less: Teacher and Instructional Aide Salaries and Benefits (other than Lottery) deducted in Column 4a (Extracted). . . . . . . . . . . . . . . . . . . . . . . . . . . . . . . . . . . . . . . . . . . . . . . . . . . . . . . . . . . . . . . . . . . . . . 0.00 396 b. Less: Teacher and Instructional Aide Salaries and Benefits (other than Lottery) deducted in Column 4b (Overrides)*. . . . . . . . . . . . . . . . . . . . . . . . . . . . . . . . . . . . . . . . . . . . . . . . . . . . . . . . . . . . . . . . . . . . . 39614. TOTAL SALARIES AND BENEFITS. . . . . . . . . . . . . . . . . . . . . . . . . . . . . . . . . . . . . . . . . . . . . . . . . . . . . . . . . . . . . . . . . . . . . . . . . . . . . . . . . . . . . . . . . . . . 41,107,901.00 39715. Percent of Current Cost of Education Expended for Classroom Compensation (EDP 397 divided by EDP 369) Line 15 must equal or exceed 60% for elementary, 55% for unified and 50% for high school districts to avoid penalty under provisions of EC 41372. . . . . . . . . . . . . . . . . . . . . . . . . . . . . . . . . . . . . . . . . . . . . . . . . . . . . . . . . . . . . . . . . 61.35%16. District is exempt from EC 41372 because it meets the provisions of EC 41374. (If exempt, enter 'X') . . . . . . . . . . . . . . . . . . . . . . . . . . . . . . . . . . . . . . . . . . . . . . . . . . . . . . . . . . . . . . . . . . . . . . . . . . . . . . . . . . . . . . . . . . . .
PART III: DEFICIENCY AMOUNT
A deficiency amount (Line 5) is only applicable to districts not meeting the minimum classroom compensation percentage required under EC 41372 and not exempt under thprovisions of EC 41374.A deficiency amount (Line 5) is only applicable to districts not meeting the minimum classroom compensation percentage required under EC 41372 and not exempt under thprovisions of EC 41374.1. Minimum percentage required (60% elementary, 55% unified, 50% high) . . . . . . . . . . . . . . . . . . . . . . . . . . . . . . . . . . . . . . . . . . . . . . . . . . . . . . . . . . . . . . 55.00%2. Percentage spent by this district (Part II, Line 15) . . . . . . . . . . . . . . . . . . . . . . . . . . . . . . . . . . . . . . . . . . . . . . . . . . . . . . . . . . . . . . . . . . . . . . . . . . . . . . . . . 61.35%3. Percentage below the minimum (Part III, Line 1 minus Line 2) . . . . . . . . . . . . . . . . . . . . . . . . . . . . . . . . . . . . . . . . . . . . . . . . . . . . . . . . . . . . . . . . . . . . . . . 0.00%4. District's Current Expense of Education after reductions in columns 4a or 4b (Part I, EDP 369). . . . . . . . . . . . . . . . . . . . . . . . . . . . . . . . . . . . . . . . . . . . . . 67,006,087.005. Deficiency Amount (Part III, Line 3 times Line 4) . . . . . . . . . . . . . . . . . . . . . . . . . . . . . . . . . . . . . . . . . . . . . . . . . . . . . . . . . . . . . . . . . . . . . . . . . . . . . . . . . 0.00
PART IV: Explanation for adjustments entered in Part I, Column 4b (required)

Manhattan Beach UnifiedLos Angeles County
July 1 Budget2015-16 Estimated Actuals
GENERAL FUNDCurrent Expense Formula/Minimum Classroom Compensation
19 75333 0000000Form CEA
California Dept of EducationSACS Financial Reporting Software - 2016.1.0File: cea (Rev 03/23/2016) Page 2 of 2 Printed: 6/10/2016 4:23 PM

Manhattan Beach UnifiedLos Angeles County
July 1 Budget2016-17 Budget
GENERAL FUNDCurrent Expense Formula/Minimum Classroom Compensation
19 75333 0000000Form CEB
California Dept of EducationSACS Financial Reporting Software - 2016.1.0File: ceb (Rev 03/23/2016) Page 1 of 2 Printed: 6/10/2016 4:23 PM
PART I - CURRENTEXPENSE FORMULA
Total Expensefor Year
(1)EDPNo.
Reductions(See Note 1)
(2)EDPNo.
Current Expenseof Education(Col 1 - Col 2)
(3)EDPNo.
Reductions(Extracted)
(See Note 2)(4a)
Reductions(Overrides)*(See Note 2)
(4b)EDPNo.
Current Expense-Part II
(Col 3 - Col 4)(5)
EDPNo.
1000 - CertificatedSalaries 33,399,406.00 301 0.00 303 33,399,406.00 305 0.00 307 33,399,406.00 309
2000 - Classified Salaries 10,986,696.00 311 0.00 313 10,986,696.00 315 0.00 317 10,986,696.00 319
3000 - Employee Benefits 16,148,995.00 321 24,000.00 323 16,124,995.00 325 0.00 327 16,124,995.00 3294000 - Books, SuppliesEquip Replace. (6500) 2,538,049.00 331 0.00 333 2,538,049.00 335 739,843.00 337 1,798,206.00 3395000 - Services. . . &7300 - Indirect Costs 8,260,802.00 341 500.00 343 8,260,302.00 345 3,895,610.00 347 4,364,692.00 349
TOTAL 71,309,448.00 365 TOTAL 66,673,995.00 369
Note 1 - In Column 2, report expenditures for the following programs: Nonagency (Goals 7100-7199), Community Services (Goal 8100), Food Services (Function 3700), Fringe Benefits for Retired Persons (Objects 3701-3702), and Facilities Acquisition & Construction (Function 8500).
Note 2 - In Column 4, report expenditures for: Transportation (Function 3600), Lottery Expenditures (Resource 1100), Special Education Students in Nonpublic Schools (Function 1180), and other federal or state categorical aid in which funds were granted for expenditures in a program not incurring any teacher salary expenditures or requiring disbursement of the funds without regard to the requirements of EC Section 41372
* If an amount (even zero) is entered in any row of Column 4b or in Line 13b, the form uses only the values in Column 4b and Line 13b rather than the values in Column 4a and Line 13a.
PART II: MINIMUM CLASSROOM COMPENSATION (Instruction, Functions 1000-1999) ObjectEDPNo.
1. Teacher Salaries as Per EC 41011. . . . . . . . . . . . . . . . . . . . . . . . . . . . . . . . . . . . . . . . . . . . . . . . . . . . . . . . . . . . . . . . . . . . . . . 1100 27,788,130.00 3752. Salaries of Instructional Aides Per EC 41011. . . . . . . . . . . . . . . . . . . . . . . . . . . . . . . . . . . . . . . . . . . . . . . . . . . . . . . . . . . . . . . 2100 4,565,842.00 3803. STRS. . . . . . . . . . . . . . . . . . . . . . . . . . . . . . . . . . . . . . . . . . . . . . . . . . . . . . . . . . . . . . . . . . . . . . . . . . . . . . . . . . . . . . . . . . . . . . 3101 & 3102 6,226,361.00 3824. PERS. . . . . . . . . . . . . . . . . . . . . . . . . . . . . . . . . . . . . . . . . . . . . . . . . . . . . . . . . . . . . . . . . . . . . . . . . . . . . . . . . . . . . . . . . . . . . . 3201 & 3202 610,646.00 3835. OASDI - Regular, Medicare and Alternative. . . . . . . . . . . . . . . . . . . . . . . . . . . . . . . . . . . . . . . . . . . . . . . . . . . . . . . . . . . . . . . . 3301 & 3302 768,881.00 3846. Health & Welfare Benefits (EC 41372) (Include Health, Dental, Vision, Pharmaceutical, and Annuity Plans). . . . . . . . . . . . . . . . . . . . . . . . . . . . . . . . . . . . . . . . . . . . . . . . . . . . . . . . . . . . . . . . . . . . . . . . . . . . . . . . . . . . . . . 3401 & 3402 3,484,746.00 3857. Unemployment Insurance. . . . . . . . . . . . . . . . . . . . . . . . . . . . . . . . . . . . . . . . . . . . . . . . . . . . . . . . . . . . . . . . . . . . . . . . . . . . . . 3501 & 3502 16,304.00 3908. Workers' Compensation Insurance. . . . . . . . . . . . . . . . . . . . . . . . . . . . . . . . . . . . . . . . . . . . . . . . . . . . . . . . . . . . . . . . . . . . . . . 3601 & 3602 763,855.00 3929. OPEB, Active Employees (EC 41372). . . . . . . . . . . . . . . . . . . . . . . . . . . . . . . . . . . . . . . . . . . . . . . . . . . . . . . . . . . . . . . . . . . . 3751 & 3752 0.0010. Other Benefits (EC 22310). . . . . . . . . . . . . . . . . . . . . . . . . . . . . . . . . . . . . . . . . . . . . . . . . . . . . . . . . . . . . . . . . . . . . . . . . . . . . 3901 & 3902 0.00 39311. SUBTOTAL Salaries and Benefits (Sum Lines 1 - 10). . . . . . . . . . . . . . . . . . . . . . . . . . . . . . . . . . . . . . . . . . . . . . . . . . . . . . . . . . . . . . . . . . . . . . . . . . . . . . 44,224,765.00 39512. Less: Teacher and Instructional Aide Salaries and Benefits deducted in Column 2. . . . . . . . . . . . . . . . . . . . . . . . . . . . . . . . . . . . . . . . . . . . . . . . . . . . . . . . . . . . . . . . . . . . . . . . . . . . . . . . . . . . . . . . . . . . . . . . 0.0013a. Less: Teacher and Instructional Aide Salaries and Benefits (other than Lottery) deducted in Column 4a (Extracted). . . . . . . . . . . . . . . . . . . . . . . . . . . . . . . . . . . . . . . . . . . . . . . . . . . . . . . . . . . . . . . . . . . . . . 0.00 396 b. Less: Teacher and Instructional Aide Salaries and Benefits (other than Lottery) deducted in Column 4b (Overrides)*. . . . . . . . . . . . . . . . . . . . . . . . . . . . . . . . . . . . . . . . . . . . . . . . . . . . . . . . . . . . . . . . . . . . . 39614. TOTAL SALARIES AND BENEFITS. . . . . . . . . . . . . . . . . . . . . . . . . . . . . . . . . . . . . . . . . . . . . . . . . . . . . . . . . . . . . . . . . . . . . . . . . . . . . . . . . . . . . . . . . . . . 44,224,765.00 39715. Percent of Current Cost of Education Expended for Classroom Compensation (EDP 397 divided by EDP 369) Line 15 must equal or exceed 60% for elementary, 55% for unified and 50% for high school districts to avoid penalty under provisions of EC 41372. . . . . . . . . . . . . . . . . . . . . . . . . . . . . . . . . . . . . . . . . . . . . . . . . . . . . . . . . . . . . . . . . 66.33%16. District is exempt from EC 41372 because it meets the provisions of EC 41374. (If exempt, enter 'X') . . . . . . . . . . . . . . . . . . . . . . . . . . . . . . . . . . . . . . . . . . . . . . . . . . . . . . . . . . . . . . . . . . . . . . . . . . . . . . . . . . . . . . . . . . . .
PART III: DEFICIENCY AMOUNT
A deficiency amount (Line 5) is only applicable to districts not meeting the minimum classroom compensation percentage required under EC 41372 and not exempt under thprovisions of EC 41374.A deficiency amount (Line 5) is only applicable to districts not meeting the minimum classroom compensation percentage required under EC 41372 and not exempt under thprovisions of EC 41374.1. Minimum percentage required (60% elementary, 55% unified, 50% high) . . . . . . . . . . . . . . . . . . . . . . . . . . . . . . . . . . . . . . . . . . . . . . . . . . . . . . . . . . . . . . 55.00%2. Percentage spent by this district (Part II, Line 15) . . . . . . . . . . . . . . . . . . . . . . . . . . . . . . . . . . . . . . . . . . . . . . . . . . . . . . . . . . . . . . . . . . . . . . . . . . . . . . . . . 66.33%3. Percentage below the minimum (Part III, Line 1 minus Line 2) . . . . . . . . . . . . . . . . . . . . . . . . . . . . . . . . . . . . . . . . . . . . . . . . . . . . . . . . . . . . . . . . . . . . . . . 0.00%4. District's Current Expense of Education after reductions in columns 4a or 4b (Part I, EDP 369). . . . . . . . . . . . . . . . . . . . . . . . . . . . . . . . . . . . . . . . . . . . . . 66,673,995.005. Deficiency Amount (Part III, Line 3 times Line 4) . . . . . . . . . . . . . . . . . . . . . . . . . . . . . . . . . . . . . . . . . . . . . . . . . . . . . . . . . . . . . . . . . . . . . . . . . . . . . . . . . 0.00
PART IV: Explanation for adjustments entered in Part I, Column 4b (required)
Manhattan Beach UnifiedLos Angeles County
July 1 Budget2016-17 Budget
GENERAL FUNDCurrent Expense Formula/Minimum Classroom Compensation
19 75333 0000000Form CEB
California Dept of EducationSACS Financial Reporting Software - 2016.1.0File: ceb (Rev 03/23/2016) Page 2 of 2 Printed: 6/10/2016 4:23 PM

Manhattan Beach UnifiedLos Angeles County
July 1 Budget2015-16 Estimated Actuals
Indirect Cost Rate Worksheet19 75333 0000000
Form ICR
California Dept of EducationSACS Financial Reporting Software - 2016.1.0File: icr (Rev 11/22/2013) Page 1 of 3 Printed: 6/10/2016 4:23 PM
Part I - General Administrative Share of Plant Services Costs California's indirect cost plan allows that the general administrative costs in the indirect cost pool may include that portion of plant services costs (maintenance and operations costs and facilities rents and leases costs) attributable to the general administrative offices. The calculation of the plant services costs attributed to general administration and included in the pool is standardized and automated using the percentage of salaries and benefits relating to general administration as proxy for the percentage of square footage occupied by general administration.
A. Salaries and Benefits - Other General Administration and Centralized Data Processing 1. Salaries and benefits paid through payroll (Funds 01, 09, and 62, objects 1000-3999 except 3701-3702) (Functions 7200-7700, goals 0000 and 9000) 2,225,488.00 2. Contracted general administrative positions not paid through payroll a. Enter the costs, if any, of general administrative positions performing services ON SITE but paid through a contract, rather than through payroll, in functions 7200-7700, goals 0000 and 9000, Object 5800. b. If an amount is entered on Line A2a, provide the title, duties, and approximate FTE of each general administrative position paid through a contract. Retain supporting documentation in case of audit.
B. Salaries and Benefits - All Other Activities 1. Salaries and benefits paid through payroll (Funds 01, 09, and 62, objects 1000-3999 except 3701-3702) (Functions 1000-6999, 7100-7180, & 8100-8400; Functions 7200-7700, all goals except 0000 & 9000) 54,881,860.00 C. Percentage of Plant Services Costs Attributable to General Administration (Line A1 plus Line A2a, divided by Line B1; zero if negative) (See Part III, Lines A5 and A6) 4.06%
Part II - Adjustments for Employment Separation Costs When an employee separates from service, the local educational agency (LEA) may incur costs associated with the separation in addition to the employee's regular salary and benefits for the final pay period. These additional costs can be categorized as "normal" or "abnormal or mass" separation costs.
Normal separation costs include items such as pay for accumulated unused leave or routine severance pay authorized by governing board policy. Normal separation costs are not allowable as direct costs to federal programs, but are allowable as indirect costs. State programs may have similar restrictions. Where federal or state program guidelines required that the LEA charge an employee's normal separation costs to an unrestricted resource rather than to the restricted program in which the employee worked, the LEA may identify and enter these costs on Line A for inclusion in the indirect cost pool.
Abnormal or mass separation costs are those costs resulting from actions taken by an LEA to influence employees to terminate their employment earlier than they normally would have. Abnormal or mass separation costs include retirement incentives such as a Golden Handshake or severance packages negotiated to effect termination. Abnormal or mass separation costs may not be charged to federal programs as either direct costs or indirect costs. Where an LEA paid abnormal or mass separation costs on behalf of positions in general administrative functions included in the indirect cost pool, the LEA must identify and enter these costs on Line B for exclusion from the pool.
A. Normal Separation Costs (optional) Enter any normal separation costs paid on behalf of employees of restricted state or federal programs that were charged to an unrestricted resource (0000-1999) in funds 01, 09, and 62 with functions 1000-6999 or 8100-8400 rather than to the restricted program. These costs will be moved in Part III from base costs to the indirect cost pool. Retain supporting documentation.
B. Abnormal or Mass Separation Costs (required) Enter any abnormal or mass separation costs paid on behalf of general administrative positions charged to Entry required unrestricted resources (0000-1999) in funds 01, 09, and 62 with functions 7200-7700. These costs will be moved in Part III from the indirect cost pool to base costs. If none, enter zero.

Manhattan Beach UnifiedLos Angeles County
July 1 Budget2015-16 Estimated Actuals
Indirect Cost Rate Worksheet19 75333 0000000
Form ICR
California Dept of EducationSACS Financial Reporting Software - 2016.1.0File: icr (Rev 11/22/2013) Page 2 of 3 Printed: 6/10/2016 4:23 PM
Part III - Indirect Cost Rate Calculation (Funds 01, 09, and 62, unless indicated otherwise)
A. Indirect Costs 1. Other General Administration, less portion charged to restricted resources or specific goals (Functions 7200-7600, objects 1000-5999, minus Line B9) 2,485,988.00 2. Centralized Data Processing, less portion charged to restricted resources or specific goals (Function 7700, objects 1000-5999, minus Line B10) 792,287.00 3. External Financial Audit - Single Audit (Function 7190, resources 0000-1999, goals 0000 and 9000, objects 5000-5999)
78,501.00 4. Staff Relations and Negotiations (Function 7120, resources 0000-1999, goals 0000 and 9000, objects 1000-5999) 0.00 5. Plant Maintenance and Operations (portion relating to general administrative offices only) (Functions 8100-8400, objects 1000-5999 except 5100, times Part I, Line C) 310,439.01 6. Facilities Rents and Leases (portion relating to general administrative offices only) (Function 8700, resources 0000-1999, objects 1000-5999 except 5100, times Part I, Line C) 0.00 7. Adjustment for Employment Separation Costs a. Plus: Normal Separation Costs (Part II, Line A) 0.00 b. Less: Abnormal or Mass Separation Costs (Part II, Line B) 0.00 8. Total Indirect Costs (Lines A1 through A7a, minus Line A7b) 3,667,215.01 9. Carry-Forward Adjustment (Part IV, Line F) (285,559.01) 10. Total Adjusted Indirect Costs (Line A8 plus Line A9) 3,381,656.00
B. Base Costs 1. Instruction (Functions 1000-1999, objects 1000-5999 except 5100) 44,858,708.00 2. Instruction-Related Services (Functions 2000-2999, objects 1000-5999 except 5100) 7,297,562.00 3. Pupil Services (Functions 3000-3999, objects 1000-5999 except 5100) 4,415,480.00 4. Ancillary Services (Functions 4000-4999, objects 1000-5999 except 5100) 354,509.00 5. Community Services (Functions 5000-5999, objects 1000-5999 except 5100) 0.00 6. Enterprise (Function 6000, objects 1000-5999 except 5100) 0.00 7. Board and Superintendent (Functions 7100-7180, objects 1000-5999, minus Part III, Line A4) 1,456,673.00 8. External Financial Audit - Single Audit and Other (Functions 7190-7191, objects 5000-5999, minus Part III, Line A3) 0.00 9. Other General Administration (portion charged to restricted resources or specific goals only) (Functions 7200-7600, resources 2000-9999, objects 1000-5999; Functions 7200-7600, resources 0000-1999, all goals except 0000 and 9000, objects 1000-5999) 0.00 10. Centralized Data Processing (portion charged to restricted resources or specific goals only) (Function 7700, resources 2000-9999, objects 1000-5999; Function 7700, resources 0000-1999, all goals except 0000 and 9000, objects 1000-5999) 0.00 11. Plant Maintenance and Operations (all except portion relating to general administrative offices) (Functions 8100-8400, objects 1000-5999 except 5100, minus Part III, Line A5) 7,335,841.99 12. Facilities Rents and Leases (all except portion relating to general administrative offices) (Function 8700, objects 1000-5999 except 5100, minus Part III, Line A6) 0.00 13. Adjustment for Employment Separation Costs a. Less: Normal Separation Costs (Part II, Line A) 0.00 b. Plus: Abnormal or Mass Separation Costs (Part II, Line B) 0.00 14. Adult Education (Fund 11, functions 1000-6999, 8100-8400, and 8700, objects 1000-5999 except 5100) 0.00 15. Child Development (Fund 12, functions 1000-6999, 8100-8400, and 8700, objects 1000-5999 except 5100) 0.00 16. Cafeteria (Funds 13 and 61, functions 1000-6999, 8100-8400, and 8700, objects 1000-5999 except 5100) 2,244,534.00 17. Foundation (Funds 19 and 57, functions 1000-6999, 8100-8400, and 8700, objects 1000-5999 except 5100) 0.00 18. Total Base Costs (Lines B1 through B12 and Lines B13b through B17, minus Line B13a) 67,963,307.99
C. Straight Indirect Cost Percentage Before Carry-Forward Adjustment (For information only - not for use when claiming/recovering indirect costs) (Line A8 divided by Line B18) 5.40%
D. Preliminary Proposed Indirect Cost Rate (For final approved fixed-with-carry-forward rate for use in 2017-18 see www.cde.ca.gov/fg/ac/ic) (Line A10 divided by Line B18) 4.98%

Manhattan Beach UnifiedLos Angeles County
July 1 Budget2015-16 Estimated Actuals
Indirect Cost Rate Worksheet19 75333 0000000
Form ICR
California Dept of EducationSACS Financial Reporting Software - 2016.1.0File: icr (Rev 11/22/2013) Page 3 of 3 Printed: 6/10/2016 4:23 PM
Part IV - Carry-forward Adjustment
The carry-forward adjustment is an after-the-fact adjustment for the difference between indirect costs recoverable using the indirect cost rate approved for use in a given year, and the actual indirect costs incurred in that year. The carry-forward adjustment eliminates the need for LEAs to file amended federal reports when their actual indirect costs vary from the estimated indirect costs on which the approved rate was based.
Where the ratio of indirect costs incurred in the current year is less than the estimated ratio of indirect costs on which the approved rate for use in the current year was based, the carry-forward adjustment is limited by using either the approved rate times current year base costs, or the highest rate actually used to recover costs from any program times current year base costs, if the highest rate used was less than the approved rate. Rates used to recover costs from programs are displayed in Exhibit A.
A. Indirect costs incurred in the current year (Part III, Line A8) 3,667,215.01
B. Carry-forward adjustment from prior year(s)
1. Carry-forward adjustment from the second prior year 220,173.09
2. Carry-forward adjustment amount deferred from prior year(s), if any 0.00
C. Carry-forward adjustment for under- or over-recovery in the current year
1. Under-recovery: Part III, Line A8, plus carry-forward adjustment from prior years, minus (approved indirect cost rate (6.14%) times Part III, Line B18); zero if negative 0.00
2. Over-recovery: Part III, Line A8, plus carry-forward adjustment from prior years, minus the lesser of (approved indirect cost rate (6.14%) times Part III, Line B18) or (the highest rate used to recover costs from any program (6.14%) times Part III, Line B18); zero if positive (285,559.01)
D. Preliminary carry-forward adjustment (Line C1 or C2) (285,559.01)
E. Optional allocation of negative carry-forward adjustment over more than one year
Where a negative carry-forward adjustment causes the proposed approved rate to fall below zero or would reduce the rate at which the LEA could recover indirect costs to such an extent that it would cause the LEA significant fiscal harm, the LEA may request that the carry-forward adjustment be allocated over more than one year. Where allocation of a negative carry-forward adjustment over more than one year does not resolve a negative rate, the CDE will work with the LEA on a case-by-case basis to establish an approved rate.
Option 1. Preliminary proposed approved rate (Part III, Line D) if entire negative carry-forward adjustment is applied to the current year calculation: 4.98%
Option 2. Preliminary proposed approved rate (Part III, Line D) if one-half of negative carry-forward adjustment ($-142,779.51) is applied to the current year calculation and the remainder ($-142,779.50) is deferred to one or more future years: 5.19%
Option 3. Preliminary proposed approved rate (Part III, Line D) if one-third of negative carry-forward adjustment ($-95,186.34) is applied to the current year calculation and the remainder ($-190,372.67) is deferred to one or more future years: 5.26%
LEA request for Option 1, Option 2, or Option 3
1
F. Carry-forward adjustment used in Part III, Line A9 (Line D minus amount deferred if Option 2 or Option 3 is selected) (285,559.01)
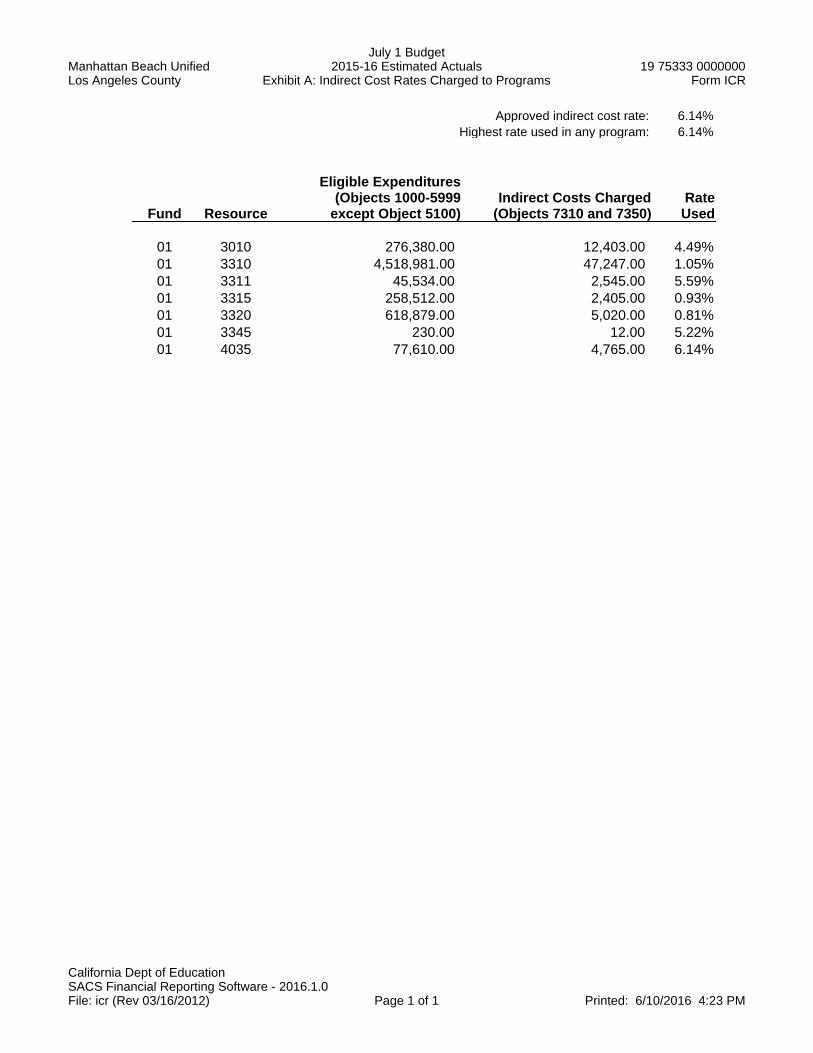
Manhattan Beach UnifiedLos Angeles County
July 1 Budget2015-16 Estimated Actuals
Exhibit A: Indirect Cost Rates Charged to Programs19 75333 0000000
Form ICR
California Dept of EducationSACS Financial Reporting Software - 2016.1.0File: icr (Rev 03/16/2012) Page 1 of 1 Printed: 6/10/2016 4:23 PM
Approved indirect cost rate: 6.14%Highest rate used in any program: 6.14%
Fund Resource
Eligible Expenditures(Objects 1000-5999
except Object 5100)Indirect Costs Charged
(Objects 7310 and 7350)RateUsed
01 3010 276,380.00 12,403.00 4.49%01 3310 4,518,981.00 47,247.00 1.05%01 3311 45,534.00 2,545.00 5.59%01 3315 258,512.00 2,405.00 0.93%01 3320 618,879.00 5,020.00 0.81%01 3345 230.00 12.00 5.22%01 4035 77,610.00 4,765.00 6.14%

Manhattan Beach UnifiedLos Angeles County
July 1 Budget2015-16 Estimated Actuals
LOTTERY REPORTRevenues, Expenditures andEnding Balances - All Funds
19 75333 0000000Form L
California Dept of EducationSACS Financial Reporting Software - 2016.1.0File: lot (Rev 02/24/2016) Page 1 of 1 Printed: 6/10/2016 4:23 PM
Description Object Codes
Lottery:Unrestricted
(Resource 1100)
Transferred toOther
Resources forExpenditure
Lottery:Instructional
Materials(Resource 6300)* Totals
A. AMOUNT AVAILABLE FOR THIS FISCAL YEAR 1. Adjusted Beginning Fund Balance 9791-9795 0.00 0.00 0.00 2. State Lottery Revenue 8560 972,943.00 284,933.00 1,257,876.00 3. Other Local Revenue 8600-8799 0.00 0.00 0.00 4. Transfers from Funds of Lapsed/Reorganized Districts 8965 0.00 0.00 0.00 5. Contributions from Unrestricted Resources (Total must be zero) 8980 0.00 0.00 6. Total Available (Sum Lines A1 through A5) 972,943.00 0.00 284,933.00 1,257,876.00
B. EXPENDITURES AND OTHER FINANCING USES 1. Certificated Salaries 1000-1999 0.00 0.00 2. Classified Salaries 2000-2999 520,779.00 520,779.00 3. Employee Benefits 3000-3999 209,278.00 209,278.00 4. Books and Supplies 4000-4999 142,659.00 271,191.00 413,850.00 5. a. Services and Other Operating Expenditures (Resource 1100) 5000-5999 100,226.00 100,226.00 b. Services and Other Operating Expenditures (Resource 6300)
5000-5999, except5100, 5710, 5800
c. Duplicating Costs for Instructional Materials (Resource 6300) 5100, 5710, 5800 13,742.00 13,742.00 6. Capital Outlay 6000-6999 0.00 0.00 7. Tuition 7100-7199 0.00 0.00 8. Interagency Transfers Out a. To Other Districts, County Offices, and Charter Schools 7211,7212,7221,
7222,7281,7282 0.00 0.00 b. To JPAs and All Others 7213,7223,
7283,7299 0.00 0.00 9. Transfers of Indirect Costs 7300-7399 10. Debt Service 7400-7499 0.00 0.00 11. All Other Financing Uses 7630-7699 0.00 0.00 12. Total Expenditures and Other Financing Uses (Sum Lines B1 through B11 ) 972,942.00 0.00 284,933.00 1,257,875.00
C. ENDING BALANCE (Must equal Line A6 minus Line B12) 979Z 1.00 0.00 0.00 1.00D. COMMENTS:
Expenditures budgeted for instructional technology.
Data from this report will be used to prepare a report to the Legislature as required by Control Section 24.60 of the Budget A
*Pursuant to Government Code Section 8880.4(a)(2)(B) and the definition in Education Code Section 60010(h), Resource 6300 funds are to be used for purchase of instructional materials only. Any amounts in the shaded cells of this column should be reviewed for appropriatene

This Page is Blank.

Manhattan Beach UnifiedLos Angeles County
July 1 Budget2015-16 Estimated Actuals
No Child Left Behind Maintenance of Effort Expenditures19 75333 0000000
Form NCMOE
California Dept of EducationSACS Financial Reporting Software - 2016.1.0File: ncmoe (Rev 03/18/2015) Page 1 Printed: 6/10/2016 4:24 PM
Funds 01, 09, and 62Section I - Expenditures Goals Functions Objects
2015-16Expenditures
A. Total state, federal, and local expenditures (all resources) All All 1000-7999 75,350,208.00
B. Less all federal expenditures not allowed for MOE(Resources 3000-5999, except 3385) All All 1000-7999 6,202,734.00
C. Less state and local expenditures not allowed for MOE:(All resources, except federal as identified in Line B)1. Community Services All 5000-5999 1000-7999 0.00
2. Capital OutlayAll except7100-7199
All except5000-5999 6000-6999 128,290.00
3. Debt Service All 9100
5400-5450,5800, 7430-
7439 949,387.00
4. Other Transfers Out All 9200 7200-7299 278,606.00
5. Interfund Transfers Out All 9300 7600-7629 0.00
9100 76996. All Other Financing Uses All 9200 7651 0.00
7. Nonagency 7100-7199
All except5000-5999,9000-9999 1000-7999 726.00
8. Tuition (Revenue, in lieu of expenditures, to approximatecosts of services for which tuition is received)
All All 8710 0.00
9. Supplemental expenditures made as a result of aPresidentially declared disaster
Manually entered. Must not includeexpenditures in lines B, C1-C8, D1, or
D2.
10. Total state and local expenditures not allowed for MOE calculation(Sum lines C1 through C9) 1,357,009.00
1000-7143,D. Plus additional MOE expenditures: 7300-7439
1. Expenditures to cover deficits for food services(Funds 13 and 61) (If negative, then zero) All All
minus8000-8699 434,034.00
2. Expenditures to cover deficits for student body activitiesManually entered. Must not include
expenditures in lines A or D1.
E. Total expenditures subject to MOE(Line A minus lines B and C10, plus lines D1 and D2) 68,224,499.00

Manhattan Beach UnifiedLos Angeles County
July 1 Budget2015-16 Estimated Actuals
No Child Left Behind Maintenance of Effort Expenditures19 75333 0000000
Form NCMOE
California Dept of EducationSACS Financial Reporting Software - 2016.1.0File: ncmoe (Rev 03/18/2015) Page 2 Printed: 6/10/2016 4:24 PM
Section II - Expenditures Per ADA
2015-16Annual ADA/
Exps. Per ADA
A. Average Daily Attendance(Form A, Annual ADA column, sum of lines A6 and C9)
6,627.91B. Expenditures per ADA (Line I.E divided by Line II.A) 10,293.52
Section III - MOE Calculation (For data collection only. Finaldetermination will be done by CDE) Total Per ADA
A. Base expenditures (Preloaded expenditures from prior year official CDEMOE calculation). (Note: If the prior year MOE was not met, CDE hasadjusted the prior year base to 90 percent of the preceding prior yearamount rather than the actual prior year expenditure amount.)
61,588,658.84 9,194.091. Adjustment to base expenditure and expenditure per ADA amounts for
LEAs failing prior year MOE calculation (From Section IV) 0.00 0.002. Total adjusted base expenditure amounts (Line A plus Line A.1) 61,588,658.84 9,194.09
B. Required effort (Line A.2 times 90%) 55,429,792.96 8,274.68
C. Current year expenditures (Line I.E and Line II.B) 68,224,499.00 10,293.52
D. MOE deficiency amount, if any (Line B minus Line C)(If negative, then zero) 0.00 0.00
E. MOE determination(If one or both of the amounts in line D are zero, the MOE requirement MOE Metis met; if both amounts are positive, the MOE requirement is not met. Ifeither column in Line A.2 or Line C equals zero, the MOE calculation isincomplete.)
F. MOE deficiency percentage, if MOE not met; otherwise, zero(Line D divided by Line B)(Funding under NCLB covered programs in FY 2017-18 maybe reduced by the lower of the two percentages) 0.00% 0.00%

Manhattan Beach UnifiedLos Angeles County
July 1 Budget2015-16 Estimated Actuals
No Child Left Behind Maintenance of Effort Expenditures19 75333 0000000
Form NCMOE
California Dept of EducationSACS Financial Reporting Software - 2016.1.0File: ncmoe (Rev 03/18/2015) Page 3 Printed: 6/10/2016 4:24 PM
SECTION IV - Detail of Adjustments to Base Expenditures (used in Section III, Line A.1)
Description of AdjustmentsTotal
ExpendituresExpenditures
Per ADA
Total adjustments to base expenditures 0.00 0.00

This Page is Blank.

Manhattan Beach UnifiedLos Angeles County
July 1 BudgetGeneral Fund
Special Education Revenue Allocations(Optional)
19 75333 0000000Form SEA
California Dept of EducationSACS Financial Reporting Software - 2016.1.0File: sea (Rev12/05/2014) Page 1 of 2 Printed: 6/10/2016 4:24 PM
Description 2015-16 Actual 2016-17 Budget % Diff.
SELPA Name: Southwest (DG)
Date allocation plan approved by SELPA governance:
I. TOTAL SELPA REVENUESA. Base Plus Taxes and Excess ERAF
1. Base Apportionment 27,983,349.00 27,767,880.00 -0.77%2. Local Special Education Property Taxes 25,966,023.00 25,966,023.00 0.00%3. Applicable Excess ERAF 15,969,376.00 15,969,376.00 0.00%4. Total Base Apportionment, Taxes, and Excess ERAF 69,918,748.00 69,703,279.00 -0.31%
B. COLA Apportionment 558,893.00 0.00 -100.00%C. Growth Apportionment or Declining ADA Adjustment (1,200,714.00) (647,641.00) -46.06%D. Subtotal (Sum lines A.4, B, and C) 69,276,927.00 69,055,638.00 -0.32%E. Program Specialist/Regionalized Services for NSS Apportionment 0.00 0.00 0.00%F. Low Incidence Apportionment 240,638.00 240,638.00 0.00%G. Out of Home Care Apportionment 1,427,662.00 1,427,662.00 0.00%H. Extraordinary Cost Pool for NPS/LCI and NSS Mental Health
Services Apportionment 0.00%I. Adjustment for NSS with Declining Enrollment 0.00%J. Grand Total Apportionment, Taxes and Excess ERAF
(Sum lines D through I) 70,945,227.00 70,723,938.00 -0.31%K. Mental Health Apportionment 7,473,567.00 7,473,567.00 0.00%L. Federal IDEA Local Assistance Grants - Preschool 2,079,656.00 2,079,656.00 0.00%M. Federal IDEA - Section 619 Preschool 1,016,731.00 1,016,731.00 0.00%N. Other Federal Discretionary Grants 286,820.00 246,820.00 -13.95%O. Other Adjustments 488,793.00 488,793.00 0.00%P. Total SELPA Revenues (Sum lines J through O) 82,290,794.00 82,029,505.00 -0.32%

Manhattan Beach UnifiedLos Angeles County
July 1 BudgetGeneral Fund
Special Education Revenue Allocations(Optional)
19 75333 0000000Form SEA
California Dept of EducationSACS Financial Reporting Software - 2016.1.0File: sea (Rev12/05/2014) Page 2 of 2 Printed: 6/10/2016 4:24 PM
Description 2015-16 Actual 2016-17 Budget % Diff.
II. ALLOCATION TO SELPA MEMBERS
Los Angeles County Office of Education (DG00) 22,331,825.00 22,260,916.00 -0.32%
Centinela Valley Union High (DG01) 4,623,408.00 4,608,728.00 -0.32%
El Segundo Unified (DG02) 1,736,955.00 1,731,440.00 -0.32%
Hawthorne Elementary (DG03) 4,117,558.00 4,104,484.00 -0.32%
Hermosa Beach City Elementary (DG04) 707,607.00 705,360.00 -0.32%
Inglewood Unified (DG05) 6,767,609.00 6,746,121.00 -0.32%
Lawndale Elementary (DG06) 3,310,656.00 3,300,144.00 -0.32%
Lennox Elementary (DG07) 2,966,414.00 2,956,995.00 -0.32%
Palos Verdes Peninsula Unified (DG09) 6,168,945.00 6,149,357.00 -0.32%
Torrance Unified (DG12) 15,563,455.00 15,514,037.00 -0.32%
Manhattan Beach Unified (DG14) 4,764,127.00 4,749,000.00 -0.32%
Redondo Beach Unified (DG15) 5,969,030.00 5,950,077.00 -0.32%
Wiseburn Unified (DG32) 1,412,220.00 1,407,736.00 -0.32%
New West Charter (DGA01) 487,273.00 485,726.00 -0.32%
Los Angeles International Charter High (DGA03) 83,742.00 83,476.00 -0.32%
Da Vinci Design (DGA05) 251,425.00 250,627.00 -0.32%
Da Vinci Science (DGA06) 179,555.00 178,985.00 -0.32%
ICEF Inglewood Elementary Charter Academy (DGA07) 81,763.00 81,503.00 -0.32%
ICEF Inglewood Middle Charter Academy (DGA08) 93,207.00 92,911.00 -0.32%
Environmental Charter Middle (DGA11) 157,242.00 156,743.00 -0.32%
Children of Promise Preparatory Academy (DGA12) 58,641.00 58,455.00 -0.32%
Opportunities for Learning - Capistrano (DGA13) 33,017.00 32,912.00 -0.32%
Today's Fresh Start Charter School Inglewood (DGA14) 121,318.00 120,933.00 -0.32%
Wilder's Preparatory Academy Charter Middle (DGA15) 46,400.00 46,253.00 -0.32%
Environmental Charter Middle - Inglewood (DGA16) 44,547.00 44,406.00 -0.32%
Lennox Mathematics, Science and Technology Academy (DGA17) 147,822.00 147,353.00 -0.32%
Da Vinci Innovation Academy (DGA18) 65,033.00 64,827.00 -0.32%Total Allocations (Sum all lines in Section II) (Amount mustequal Line I.P ) 82,290,794.00 82,029,505.00 -0.32%
PreparerName:Title:Phone:

Manhattan Beach UnifiedLos Angeles County
July 1 Budget2015-16 Estimated Actuals
SUMMARY OF INTERFUND ACTIVITIESFOR ALL FUNDS
19 75333 0000000Form SIAA
California Dept of EducationSACS Financial Reporting Software - 2016.1.0File: siaa (Rev 03/23/2016) Page 1 of 2 Printed: 6/10/2016 4:24 PM
Direct Costs - Interfund Indirect Costs - Interfund Interfund Interfund Due From Due To
DescriptionTransfers In
5750Transfers Out
5750Transfers In
7350Transfers Out
7350Transfers In8900-8929
Transfers Out7600-7629
Other Funds9310
Other Funds9610
01 GENERAL FUND Expenditure Detail 0.00 0.00 0.00 (102,000.00) Other Sources/Uses Detail 0.00 0.00 Fund Reconciliation 0.00 0.0009 CHARTER SCHOOLS SPECIAL REVENUE FUND Expenditure Detail 0.00 0.00 0.00 0.00 Other Sources/Uses Detail 0.00 0.00 Fund Reconciliation 0.00 0.0010 SPECIAL EDUCATION PASS-THROUGH FUND Expenditure Detail Other Sources/Uses Detail Fund Reconciliation 0.00 0.0011 ADULT EDUCATION FUND Expenditure Detail 0.00 0.00 0.00 0.00 Other Sources/Uses Detail 0.00 0.00 Fund Reconciliation 0.00 0.0012 CHILD DEVELOPMENT FUND Expenditure Detail 0.00 0.00 0.00 0.00 Other Sources/Uses Detail 0.00 0.00 Fund Reconciliation 0.00 0.0013 CAFETERIA SPECIAL REVENUE FUND Expenditure Detail 0.00 0.00 102,000.00 0.00 Other Sources/Uses Detail 0.00 0.00 Fund Reconciliation 0.00 0.0014 DEFERRED MAINTENANCE FUND Expenditure Detail 0.00 0.00 Other Sources/Uses Detail 0.00 0.00 Fund Reconciliation 0.00 0.0015 PUPIL TRANSPORTATION EQUIPMENT FUND Expenditure Detail 0.00 0.00 Other Sources/Uses Detail 0.00 0.00 Fund Reconciliation 0.00 0.0017 SPECIAL RESERVE FUND FOR OTHER THAN CAPITAL OUTLAY Expenditure Detail Other Sources/Uses Detail 0.00 0.00 Fund Reconciliation 0.00 0.0018 SCHOOL BUS EMISSIONS REDUCTION FUND Expenditure Detail 0.00 0.00 Other Sources/Uses Detail 0.00 0.00 Fund Reconciliation 0.00 0.0019 FOUNDATION SPECIAL REVENUE FUND Expenditure Detail 0.00 0.00 0.00 0.00 Other Sources/Uses Detail 0.00 Fund Reconciliation 0.00 0.0020 SPECIAL RESERVE FUND FOR POSTEMPLOYMENT BENEFITS Expenditure Detail Other Sources/Uses Detail 0.00 0.00 Fund Reconciliation 0.00 0.0021 BUILDING FUND Expenditure Detail 0.00 0.00 Other Sources/Uses Detail 0.00 0.00 Fund Reconciliation 0.00 0.0025 CAPITAL FACILITIES FUND Expenditure Detail 0.00 0.00 Other Sources/Uses Detail 0.00 0.00 Fund Reconciliation 0.00 0.0030 STATE SCHOOL BUILDING LEASE/PURCHASE FUND Expenditure Detail 0.00 0.00 Other Sources/Uses Detail 0.00 0.00 Fund Reconciliation 0.00 0.0035 COUNTY SCHOOL FACILITIES FUND Expenditure Detail 0.00 0.00 Other Sources/Uses Detail 0.00 0.00 Fund Reconciliation 0.00 0.0040 SPECIAL RESERVE FUND FOR CAPITAL OUTLAY PROJECTS Expenditure Detail 0.00 0.00 Other Sources/Uses Detail 0.00 0.00 Fund Reconciliation 0.00 0.0049 CAP PROJ FUND FOR BLENDED COMPONENT UNITS Expenditure Detail 0.00 0.00 Other Sources/Uses Detail 0.00 0.00 Fund Reconciliation 0.00 0.0051 BOND INTEREST AND REDEMPTION FUND Expenditure Detail Other Sources/Uses Detail 0.00 0.00 Fund Reconciliation 0.00 0.0052 DEBT SVC FUND FOR BLENDED COMPONENT UNITS Expenditure Detail Other Sources/Uses Detail 0.00 0.00 Fund Reconciliation 0.00 0.0053 TAX OVERRIDE FUND Expenditure Detail Other Sources/Uses Detail 0.00 0.00 Fund Reconciliation 0.00 0.0056 DEBT SERVICE FUND Expenditure Detail Other Sources/Uses Detail 0.00 0.00 Fund Reconciliation 0.00 0.0057 FOUNDATION PERMANENT FUND Expenditure Detail 0.00 0.00 0.00 0.00 Other Sources/Uses Detail 0.00 Fund Reconciliation 0.00 0.0061 CAFETERIA ENTERPRISE FUND Expenditure Detail 0.00 0.00 0.00 0.00 Other Sources/Uses Detail 0.00 0.00 Fund Reconciliation 0.00 0.00

Manhattan Beach UnifiedLos Angeles County
July 1 Budget2015-16 Estimated Actuals
SUMMARY OF INTERFUND ACTIVITIESFOR ALL FUNDS
19 75333 0000000Form SIAA
California Dept of EducationSACS Financial Reporting Software - 2016.1.0File: siaa (Rev 03/23/2016) Page 2 of 2 Printed: 6/10/2016 4:24 PM
Direct Costs - Interfund Indirect Costs - Interfund Interfund Interfund Due From Due To
DescriptionTransfers In
5750Transfers Out
5750Transfers In
7350Transfers Out
7350Transfers In8900-8929
Transfers Out7600-7629
Other Funds9310
Other Funds9610
62 CHARTER SCHOOLS ENTERPRISE FUND Expenditure Detail 0.00 0.00 0.00 0.00 Other Sources/Uses Detail 0.00 0.00 Fund Reconciliation 0.00 0.0063 OTHER ENTERPRISE FUND Expenditure Detail 0.00 0.00 Other Sources/Uses Detail 0.00 0.00 Fund Reconciliation 0.00 0.0066 WAREHOUSE REVOLVING FUND Expenditure Detail 0.00 0.00 Other Sources/Uses Detail 0.00 0.00 Fund Reconciliation 0.00 0.0067 SELF-INSURANCE FUND Expenditure Detail 0.00 0.00 Other Sources/Uses Detail 0.00 0.00 Fund Reconciliation 0.00 0.0071 RETIREE BENEFIT FUND Expenditure Detail Other Sources/Uses Detail 0.00 Fund Reconciliation 0.00 0.0073 FOUNDATION PRIVATE-PURPOSE TRUST FUND Expenditure Detail 0.00 0.00 Other Sources/Uses Detail 0.00 Fund Reconciliation 0.00 0.0076 WARRANT/PASS-THROUGH FUND Expenditure Detail Other Sources/Uses Detail Fund Reconciliation 0.00 0.0095 STUDENT BODY FUND Expenditure Detail Other Sources/Uses Detail Fund Reconciliation 0.00 0.00 TOTALS 0.00 0.00 102,000.00 (102,000.00) 0.00 0.00 0.00 0.00

Manhattan Beach UnifiedLos Angeles County
July 1 Budget2016-17 Budget
SUMMARY OF INTERFUND ACTIVITIESFOR ALL FUNDS
19 75333 0000000Form SIAB
California Dept of EducationSACS Financial Reporting Software - 2016.1.0File: siab (Rev 03/23/2016) Page 1 of 2 Printed: 6/10/2016 4:24 PM
Direct Costs - Interfund Indirect Costs - Interfund Interfund Interfund Due From Due To
DescriptionTransfers In
5750Transfers Out
5750Transfers In
7350Transfers Out
7350Transfers In8900-8929
Transfers Out7600-7629
Other Funds9310
Other Funds9610
01 GENERAL FUND Expenditure Detail 0.00 0.00 0.00 (102,000.00) Other Sources/Uses Detail 0.00 0.00 Fund Reconciliation09 CHARTER SCHOOLS SPECIAL REVENUE FUND Expenditure Detail 0.00 0.00 0.00 0.00 Other Sources/Uses Detail 0.00 0.00 Fund Reconciliation10 SPECIAL EDUCATION PASS-THROUGH FUND Expenditure Detail Other Sources/Uses Detail Fund Reconciliation11 ADULT EDUCATION FUND Expenditure Detail 0.00 0.00 0.00 0.00 Other Sources/Uses Detail 0.00 0.00 Fund Reconciliation12 CHILD DEVELOPMENT FUND Expenditure Detail 0.00 0.00 0.00 0.00 Other Sources/Uses Detail 0.00 0.00 Fund Reconciliation13 CAFETERIA SPECIAL REVENUE FUND Expenditure Detail 0.00 0.00 102,000.00 0.00 Other Sources/Uses Detail 0.00 0.00 Fund Reconciliation14 DEFERRED MAINTENANCE FUND Expenditure Detail 0.00 0.00 Other Sources/Uses Detail 0.00 0.00 Fund Reconciliation15 PUPIL TRANSPORTATION EQUIPMENT FUND Expenditure Detail 0.00 0.00 Other Sources/Uses Detail 0.00 0.00 Fund Reconciliation17 SPECIAL RESERVE FUND FOR OTHER THAN CAPITAL OUTLAY Expenditure Detail Other Sources/Uses Detail 0.00 0.00 Fund Reconciliation18 SCHOOL BUS EMISSIONS REDUCTION FUND Expenditure Detail 0.00 0.00 Other Sources/Uses Detail 0.00 0.00 Fund Reconciliation19 FOUNDATION SPECIAL REVENUE FUND Expenditure Detail 0.00 0.00 0.00 0.00 Other Sources/Uses Detail 0.00 Fund Reconciliation20 SPECIAL RESERVE FUND FOR POSTEMPLOYMENT BENEFITS Expenditure Detail Other Sources/Uses Detail 0.00 0.00 Fund Reconciliation21 BUILDING FUND Expenditure Detail 0.00 0.00 Other Sources/Uses Detail 0.00 0.00 Fund Reconciliation25 CAPITAL FACILITIES FUND Expenditure Detail 0.00 0.00 Other Sources/Uses Detail 0.00 0.00 Fund Reconciliation30 STATE SCHOOL BUILDING LEASE/PURCHASE FUND Expenditure Detail 0.00 0.00 Other Sources/Uses Detail 0.00 0.00 Fund Reconciliation35 COUNTY SCHOOL FACILITIES FUND Expenditure Detail 0.00 0.00 Other Sources/Uses Detail 0.00 0.00 Fund Reconciliation40 SPECIAL RESERVE FUND FOR CAPITAL OUTLAY PROJECTS Expenditure Detail 0.00 0.00 Other Sources/Uses Detail 0.00 0.00 Fund Reconciliation49 CAP PROJ FUND FOR BLENDED COMPONENT UNITS Expenditure Detail 0.00 0.00 Other Sources/Uses Detail 0.00 0.00 Fund Reconciliation51 BOND INTEREST AND REDEMPTION FUND Expenditure Detail Other Sources/Uses Detail 0.00 0.00 Fund Reconciliation52 DEBT SVC FUND FOR BLENDED COMPONENT UNITS Expenditure Detail Other Sources/Uses Detail 0.00 0.00 Fund Reconciliation53 TAX OVERRIDE FUND Expenditure Detail Other Sources/Uses Detail 0.00 0.00 Fund Reconciliation56 DEBT SERVICE FUND Expenditure Detail Other Sources/Uses Detail 0.00 0.00 Fund Reconciliation57 FOUNDATION PERMANENT FUND Expenditure Detail 0.00 0.00 0.00 0.00 Other Sources/Uses Detail 0.00 Fund Reconciliation61 CAFETERIA ENTERPRISE FUND Expenditure Detail 0.00 0.00 0.00 0.00 Other Sources/Uses Detail 0.00 0.00 Fund Reconciliation
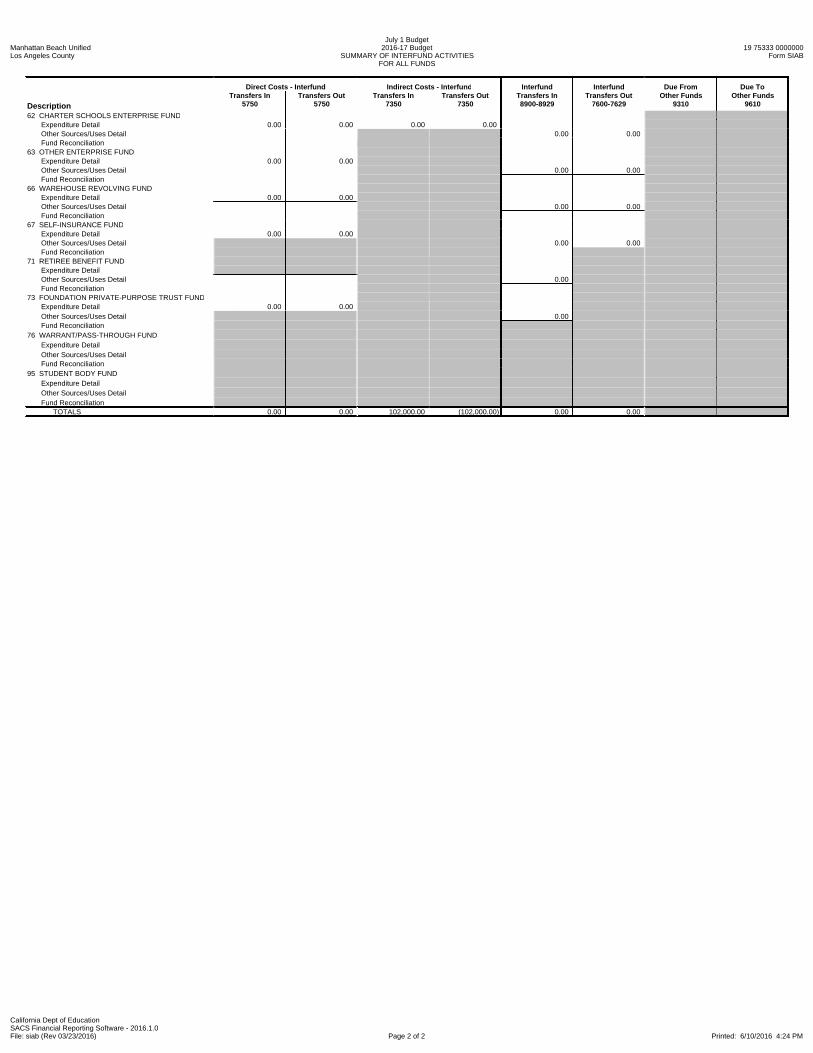
Manhattan Beach UnifiedLos Angeles County
July 1 Budget2016-17 Budget
SUMMARY OF INTERFUND ACTIVITIESFOR ALL FUNDS
19 75333 0000000Form SIAB
California Dept of EducationSACS Financial Reporting Software - 2016.1.0File: siab (Rev 03/23/2016) Page 2 of 2 Printed: 6/10/2016 4:24 PM
Direct Costs - Interfund Indirect Costs - Interfund Interfund Interfund Due From Due To
DescriptionTransfers In
5750Transfers Out
5750Transfers In
7350Transfers Out
7350Transfers In8900-8929
Transfers Out7600-7629
Other Funds9310
Other Funds9610
62 CHARTER SCHOOLS ENTERPRISE FUND Expenditure Detail 0.00 0.00 0.00 0.00 Other Sources/Uses Detail 0.00 0.00 Fund Reconciliation63 OTHER ENTERPRISE FUND Expenditure Detail 0.00 0.00 Other Sources/Uses Detail 0.00 0.00 Fund Reconciliation66 WAREHOUSE REVOLVING FUND Expenditure Detail 0.00 0.00 Other Sources/Uses Detail 0.00 0.00 Fund Reconciliation67 SELF-INSURANCE FUND Expenditure Detail 0.00 0.00 Other Sources/Uses Detail 0.00 0.00 Fund Reconciliation71 RETIREE BENEFIT FUND Expenditure Detail Other Sources/Uses Detail 0.00 Fund Reconciliation73 FOUNDATION PRIVATE-PURPOSE TRUST FUND Expenditure Detail 0.00 0.00 Other Sources/Uses Detail 0.00 Fund Reconciliation76 WARRANT/PASS-THROUGH FUND Expenditure Detail Other Sources/Uses Detail Fund Reconciliation95 STUDENT BODY FUND Expenditure Detail Other Sources/Uses Detail Fund Reconciliation TOTALS 0.00 0.00 102,000.00 (102,000.00) 0.00 0.00

Manhattan Beach UnifiedLos Angeles County
2016-17 July 1 BudgetGeneral Fund
School District Criteria and Standards Review19 75333 0000000
Form 01CS
California Dept of EducationSACS Financial Reporting Software - 2016.1.0File: cs-a (Rev 03/17/2016) Page 1 of 28 Printed: 6/10/2016 4:25 PM
Provide methodology and assumptions used to estimate ADA, enrollment, revenues, expenditures, reserves and fund balance, and multiyear commitments (including cost-of-living adjustments).
Deviations from the standards must be explained and may affect the approval of the budget.
CRITERIA AND STANDARDS
1. CRITERION: Average Daily Attendance
STANDARD: Funded average daily attendance (ADA) has not been overestimated in 1) the first prior fiscal year OR in 2) two or more of the previous three fiscal years by more than the following percentage levels:
Percentage Level District ADA3.0% 0 to 3002.0% 301 to 1,0001.0% 1,001 and over
District ADA (Form A, Estimated P-2 ADA column, lines A4 and C4): 6,623
District's ADA Standard Percentage Level: 1.0%
1A. Calculating the District's ADA Variances
DATA ENTRY: For the Third Prior Year, enter Revenue Limit ADA data in the Original Budget Funded ADA column. For the Second and First Prior Years, enter Estimated Funded ADA in theOriginal Budget Funded ADA column; enter district regular ADA and charter school ADA corresponding to financial data reported in the General Fund, only, for the Second and First Prior Years.All other data are extracted.
*Please note for FY 2013-14 estimated/unaudited actuals and 2014-15 original budget: Line C4 in Form A reflects total charter school ADA corresponding to financial data reported in funds 01,09, and 62. Please adjust charter school ADA or explain accordingly.
Original Budget Estimated/Unaudited Actuals ADA Variance LevelFunded ADA Funded ADA
(Form RL, Line 5c) (Form A, Lines A4 and C4)*(Form A, Lines A4 and C4)* (Form A, Lines A4 and C4)(Form A, Lines A4 and C4) (Form A, Lines A4 and C4) (If Budget is greater
Fiscal Year (Form A, Lines A4 and C4) than Actuals, else N/A) Status
Third Prior Year (2013-14) 6,520.33 6,685.10 N/A MetSecond Prior Year (2014-15)
District Regular 6,607.57 6,715.48 Charter School
Total ADA 6,607.57 6,715.48 N/A MetFirst Prior Year (2015-16)
District Regular 6,741.92 6,680.38 Charter School 0.00
Total ADA 6,741.92 6,680.38 0.9% MetBudget Year (2016-17)
District Regular 6,622.76 Charter School 0.00
Total ADA 6,622.76
1B. Comparison of District ADA to the Standard
DATA ENTRY: Enter an explanation if the standard is not met.
1a. STANDARD MET - Funded ADA has not been overestimated by more than the standard percentage level for the first prior year.
Explanation:(required if NOT met)
1b. STANDARD MET - Funded ADA has not been overestimated by more than the standard percentage level for two or more of the previous three years.
Explanation:(required if NOT met)

Manhattan Beach UnifiedLos Angeles County
2016-17 July 1 BudgetGeneral Fund
School District Criteria and Standards Review19 75333 0000000
Form 01CS
California Dept of EducationSACS Financial Reporting Software - 2016.1.0File: cs-a (Rev 03/17/2016) Page 2 of 28 Printed: 6/10/2016 4:25 PM

Manhattan Beach UnifiedLos Angeles County
2016-17 July 1 BudgetGeneral Fund
School District Criteria and Standards Review19 75333 0000000
Form 01CS
California Dept of EducationSACS Financial Reporting Software - 2016.1.0File: cs-a (Rev 03/17/2016) Page 3 of 28 Printed: 6/10/2016 4:25 PM
2. CRITERION: Enrollment
STANDARD: Projected enrollment has not been overestimated in 1) the first prior fiscal year OR in 2) two or more of the previous three fiscal years by more than the following percentage levels:
Percentage Level District ADA3.0% 0 to 3002.0% 301 to 1,0001.0% 1,001 and over
District ADA (Form A, Estimated P-2 ADA column, lines A4 and C4): 6,623
District's Enrollment Standard Percentage Level: 1.0%
2A. Calculating the District's Enrollment Variances
DATA ENTRY: Enter data in the Enrollment, Budget, column for all fiscal years and in the Enrollment, CBEDS Actual column for the First Prior Year; all other data are extracted or calculated.CBEDS Actual enrollment data preloaded in the District Regular lines will include both District Regular and Charter School enrollment. Districts will need to adjust the District Regular enrollmentlines and the Charter School enrollment lines accordingly. Enter district regular enrollment and charter school enrollment corresponding to financial data reported in the General Fund, only, forthe Budget, First and Second Prior Years.
Enrollment Variance Level
Enrollment (If Budget is greater
Fiscal Year Budget CBEDS Actual than Actual, else N/A) Status
Third Prior Year (2013-14) 6,608 6,832 N/A MetSecond Prior Year (2014-15)
District Regular 6,933 6,933 Charter School
Total Enrollment 6,933 6,933 0.0% MetFirst Prior Year (2015-16)
District Regular 6,950 6,774 Charter School
Total Enrollment 6,950 6,774 2.5% Not MetBudget Year (2016-17)
District Regular 6,734 Charter School
Total Enrollment 6,734
2B. Comparison of District Enrollment to the Standard
DATA ENTRY: Enter an explanation if the standard is not met.
1a. STANDARD NOT MET - Enrollment was estimated above the standard for the first prior year. Provide reasons for the overestimate, a description of the methods and assumptions usedin projecting enrollment, and what changes will be made to improve the accuracy of projections in this area.
Explanation:(required if NOT met)
The District is in declining enrollment and the projection was done during the budget development for the upcoming school.
1b. STANDARD MET - Enrollment has not been overestimated by more than the standard percentage level for two or more of the previous three years.
Explanation:(required if NOT met)

Manhattan Beach UnifiedLos Angeles County
2016-17 July 1 BudgetGeneral Fund
School District Criteria and Standards Review19 75333 0000000
Form 01CS
California Dept of EducationSACS Financial Reporting Software - 2016.1.0File: cs-a (Rev 03/17/2016) Page 4 of 28 Printed: 6/10/2016 4:25 PM
3. CRITERION: ADA to Enrollment
STANDARD: Projected second period (P-2) average daily attendance (ADA) to enrollment ratio for any of the budget year or two subsequent fiscal yearshas not increased from the historical average ratio from the three prior fiscal years by more than one half of one percent (0.5%).
3A. Calculating the District's ADA to Enrollment Standard
DATA ENTRY: All data are extracted or calculated. Data should reflect district regular and charter school ADA/enrollment corresponding to financial data reported in the General Fund, only, forall fiscal years.
*Please note for Fiscal Year 2013-14 estimated/unaudited actuals: Line C4 in Form A reflects total charter school ADA corresponding to financial data reported in funds 01, 09, and 62. Pleaseadjust charter school ADA or explain accordingly.
P-2 ADA
Estimated/Unaudited Actuals
(Form A, Lines A4 and C4)* Enrollment (Form A, Lines A4 and C4) CBEDS Actual Historical Ratio
Fiscal Year (Form A, Lines A4 and C4) (Criterion 2, Item 2A) of ADA to Enrollment
Third Prior Year (2013-14) 6,688 6,832 97.9%Second Prior Year (2014-15)
District Regular 6,715 6,933 Charter School
Total ADA/Enrollment 6,715 6,933 96.9%First Prior Year (2015-16)
District Regular 6,623 6,774 Charter School 0
Total ADA/Enrollment 6,623 6,774 97.8%Historical Average Ratio: 97.5%
District's ADA to Enrollment Standard (historical average ratio plus 0.5%): 98.0%
3B. Calculating the District's Projected Ratio of ADA to Enrollment
DATA ENTRY: Enter data in the Estimated P-2 ADA column for the two subsequent years. Enter data in the Enrollment column for the two subsequent years. Data should reflect district regularand charter school ADA/enrollment corresponding to financial data reported in the General Fund only, for all fiscal years. All other data are extracted or calculated.
Estimated P-2 ADA Enrollment
Budget Budget/Projected
Fiscal Year (Form A, Lines A4 and C4) (Criterion 2, Item 2A) Ratio of ADA to Enrollment StatusBudget Year (2016-17)
District Regular 6,623 6,734 Charter School 0
Total ADA/Enrollment 6,623 6,734 98.4% Not Met1st Subsequent Year (2017-18)
District Regular 6,569 6,706 Charter School
Total ADA/Enrollment 6,569 6,706 98.0% Met2nd Subsequent Year (2018-19)
District Regular 6,542 6,706 Charter School
Total ADA/Enrollment 6,542 6,706 97.6% Met
3C. Comparison of District ADA to Enrollment Ratio to the Standard
DATA ENTRY: Enter an explanation if the standard is not met.
1a. STANDARD NOT MET - Projected P-2 ADA to enrollment ratio is above the standard for one or more of the budget or two subsequent fiscal years. Provide reasons why the projectedratio exceeds the district's historical average ratio by more than 0.5%.
Explanation:(required if NOT met)
The District is in declining enrollment and projections are based on what we know now.

Manhattan Beach UnifiedLos Angeles County
2016-17 July 1 BudgetGeneral Fund
School District Criteria and Standards Review19 75333 0000000
Form 01CS
California Dept of EducationSACS Financial Reporting Software - 2016.1.0File: cs-a (Rev 03/17/2016) Page 5 of 28 Printed: 6/10/2016 4:25 PM
4. CRITERION: LCFF Revenue
STANDARD: Projected local control funding formula (LCFF) revenue for any of the budget year or two subsequent fiscal years has not changed from theprior fiscal year by more than the change in population, plus the district's gap funding or cost-of-living adjustment (COLA)¹ and its economic recoverytarget payment, plus or minus one percent.
For basic aid districts, projected LCFF revenue has not changed from the prior fiscal year by more than the percent change in property tax revenues plusor minus one percent.
For districts funded by necessary small school formulas, projected LCFF revenue has not changed from the prior fiscal year amount by more than thedistrict's gap funding or COLA¹ and its economic recovery target payment, plus or minus one percent.
¹Districts that are already at or above their LCFF target funding as described in Education Code Section 42238.03(d) receive no gap funding. These districts have a COLA applied totheir LCFF target, but their year-over-year revenue increase might be less than the statutory COLA due to certain local factors and components of the funding formula.
4A. District's LCFF Revenue Standard
Indicate which standard applies:
LCFF Revenue
Basic Aid
Necessary Small School
The District must select which LCFF revenue standard applies.LCFF Revenue Standard selected: LCFF Revenue
4A1. Calculating the District's LCFF Revenue Standard
DATA ENTRY: Enter LCFF Target amounts for the budget and two subsequent fiscal years.Enter data in Step 1a for the two subsequent fiscal years. All other data is extracted or calculated.Enter data for Steps 2a through 2d. All other data is calculated.
Projected LCFF Revenue
Has the District reached its LCFFIf Yes, then COLA amount in Line 2b2 is used in Line 2e Total calculation.If No, then Gap Funding in Line 2c is used in Line 2e Total calculation.
target funding level? No
Budget Year 1st Subsequent Year 2nd Subsequent Year(2016-17) (2017-18) (2018-19)
LCFF Target (Reference Only) 53,354,189.00 53,655,033.00 54,790,833.00
Prior Year Budget Year 1st Subsequent Year 2nd Subsequent YearStep 1 - Change in Population (2015-16) (2016-17) (2017-18) (2018-19)
a. ADA (Funded)
(Form A, lines A6 and C4) 6,685.53 6,627.91 6,568.92 6,541.82
b. Prior Year ADA (Funded) 6,685.53 6,627.91 6,568.92
c. Difference (Step 1a minus Step 1b) (57.62) (58.99) (27.10)
d. Percent Change Due to Population
(Step 1c divided by Step 1b) -0.86% -0.89% -0.41%
Step 2 - Change in Funding Level
a. Prior Year LCFF Funding 49,944,100.00 51,635,589.00 53,018,898.00b1. COLA percentage (if district is at target) Not Applicable
b2. COLA amount (proxy for purposes of thiscriterion) Not Applicable 0.00 0.00 0.00
c. Gap Funding (if district is not at target)d. Economic Recovery Target Funding
(current year increment)
e. Total (Lines 2b2 or 2c, as applicable, plus Line 2d) 0.00 0.00 0.00f. Percent Change Due to Funding Level
(Step 2e divided by Step 2a) 0.00% 0.00% 0.00%
Step 3 - Total Change in Population and Funding Level(Step 1d plus Step 2f) -0.86% -0.89% -0.41%
LCFF Revenue Standard (Step 3, plus/minus 1%): -1.86% to .14% -1.89% to .11% -1.41% to .59%
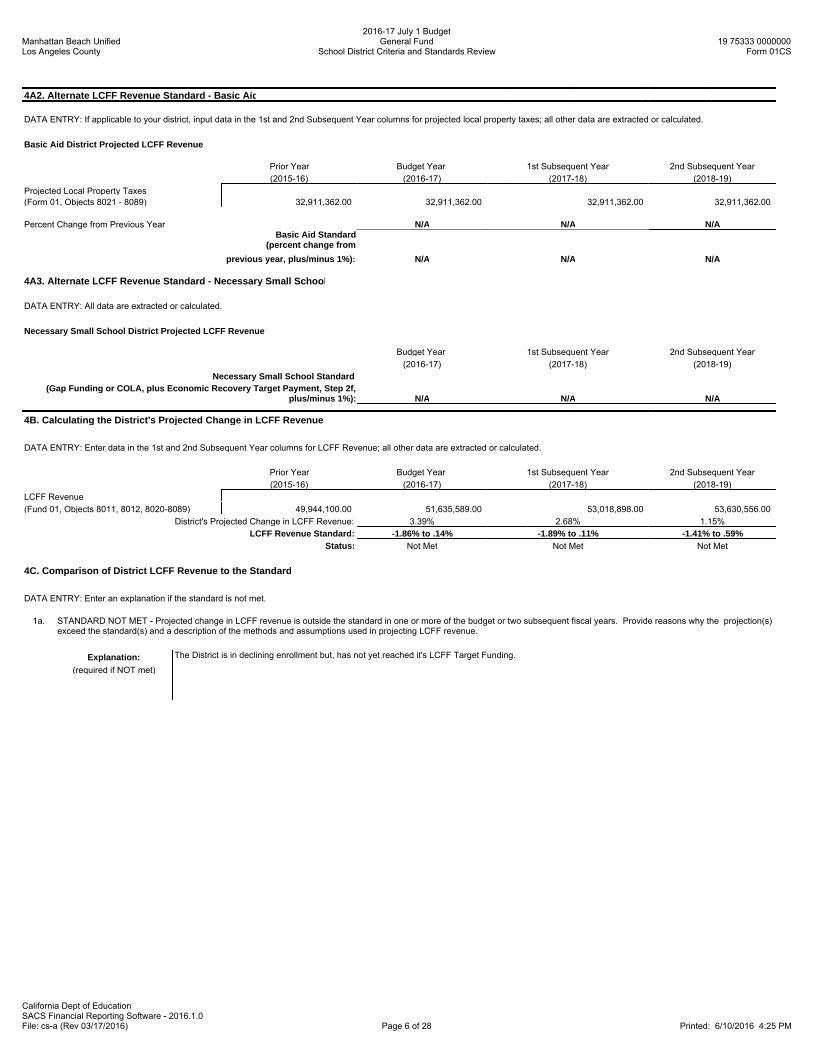
Manhattan Beach UnifiedLos Angeles County
2016-17 July 1 BudgetGeneral Fund
School District Criteria and Standards Review19 75333 0000000
Form 01CS
California Dept of EducationSACS Financial Reporting Software - 2016.1.0File: cs-a (Rev 03/17/2016) Page 6 of 28 Printed: 6/10/2016 4:25 PM
4A2. Alternate LCFF Revenue Standard - Basic Aid
DATA ENTRY: If applicable to your district, input data in the 1st and 2nd Subsequent Year columns for projected local property taxes; all other data are extracted or calculated.
Basic Aid District Projected LCFF Revenue
Prior Year Budget Year 1st Subsequent Year 2nd Subsequent Year
(2015-16) (2016-17) (2017-18) (2018-19)
Projected Local Property Taxes(Form 01, Objects 8021 - 8089) 32,911,362.00 32,911,362.00 32,911,362.00 32,911,362.00
Percent Change from Previous Year N/A N/A N/ABasic Aid Standard
(percent change fromprevious year, plus/minus 1%): N/A N/A N/A
4A3. Alternate LCFF Revenue Standard - Necessary Small School
DATA ENTRY: All data are extracted or calculated.
Necessary Small School District Projected LCFF Revenue
Budget Year 1st Subsequent Year 2nd Subsequent Year
(2016-17) (2017-18) (2018-19)Necessary Small School Standard
(Gap Funding or COLA, plus Economic Recovery Target Payment, Step 2f,plus/minus 1%): N/A N/A N/A
4B. Calculating the District's Projected Change in LCFF Revenue
DATA ENTRY: Enter data in the 1st and 2nd Subsequent Year columns for LCFF Revenue; all other data are extracted or calculated.
Prior Year Budget Year 1st Subsequent Year 2nd Subsequent Year
(2015-16) (2016-17) (2017-18) (2018-19)
LCFF Revenue
(Fund 01, Objects 8011, 8012, 8020-8089) 49,944,100.00 51,635,589.00 53,018,898.00 53,630,556.00
District's Projected Change in LCFF Revenue: 3.39% 2.68% 1.15%LCFF Revenue Standard: -1.86% to .14% -1.89% to .11% -1.41% to .59%
Status: Not Met Not Met Not Met
4C. Comparison of District LCFF Revenue to the Standard
DATA ENTRY: Enter an explanation if the standard is not met.
1a. STANDARD NOT MET - Projected change in LCFF revenue is outside the standard in one or more of the budget or two subsequent fiscal years. Provide reasons why the projection(s)exceed the standard(s) and a description of the methods and assumptions used in projecting LCFF revenue.
Explanation:(required if NOT met)
The District is in declining enrollment but, has not yet reached it's LCFF Target Funding.

Manhattan Beach UnifiedLos Angeles County
2016-17 July 1 BudgetGeneral Fund
School District Criteria and Standards Review19 75333 0000000
Form 01CS
California Dept of EducationSACS Financial Reporting Software - 2016.1.0File: cs-a (Rev 03/17/2016) Page 7 of 28 Printed: 6/10/2016 4:25 PM
5. CRITERION: Salaries and Benefits
STANDARD: Projected ratio of total unrestricted salaries and benefits to total unrestricted general fund expenditures for any of the budget year or twosubsequent fiscal years has not changed from the historical average ratio from the three prior fiscal years by more than the greater of three percent or thedistrict's required reserves percentage.
It is likely that for many districts the 2014-15 and 2015-16 change from the historical average ratio will exceed the standard because certain revenues thatwere restricted prior to the LCFF are now unrestricted within the LCFF.
5A. Calculating the District's Historical Average Ratio of Unrestricted Salaries and Benefits to Total Unrestricted General Fund Expenditures
DATA ENTRY: All data are extracted or calculated.
Estimated/Unaudited Actuals - Unrestricted(Resources 0000-1999) Ratio
Salaries and Benefits Total Expenditures of Unrestricted Salaries and Benefits
Fiscal Year (Form 01, Objects 1000-3999) (Form 01, Objects 1000-7499) to Total Unrestricted Expenditures
Third Prior Year (2013-14) 31,126,028.21 35,632,483.04 87.4%
Second Prior Year (2014-15) 34,335,835.31 40,420,551.24 84.9%
First Prior Year (2015-16) 38,261,621.00 45,308,652.00 84.4%
Historical Average Ratio: 85.6%
Budget Year 1st Subsequent Year 2nd Subsequent Year(2016-17) (2017-18) (2018-19)
District's Reserve Standard Percentage(Criterion 10B, Line 4): 3.0% 3.0% 3.0%
District's Salaries and Benefits Standard(historical average ratio, plus/minus the greater
of 3% or the district's reserve standard percentage): 82.6% to 88.6% 82.6% to 88.6% 82.6% to 88.6%
5B. Calculating the District's Projected Ratio of Unrestricted Salaries and Benefits to Total Unrestricted General Fund Expenditures
DATA ENTRY: If Form MYP exists, Unrestricted Salaries and Benefits, and Total Unrestricted Expenditures data for the 1st and 2nd Subsequent Years will be extracted; if not, enter data for the two subsequent years. All other data are extracted or calculated.
Budget - Unrestricted(Resources 0000-1999)
Salaries and Benefits Total Expenditures Ratio
(Form 01, Objects 1000-3999) (Form 01, Objects 1000-7499) of Unrestricted Salaries and BenefitsFiscal Year (Form MYP, Lines B1-B3) (Form MYP, Lines B1-B8, B10) to Total Unrestricted Expenditures Status
Budget Year (2016-17) 38,711,126.00 44,575,238.00 86.8% Met
1st Subsequent Year (2017-18) 36,387,210.00 41,591,461.00 87.5% Met
2nd Subsequent Year (2018-19) 37,539,529.00 42,871,383.00 87.6% Met
5C. Comparison of District Salaries and Benefits Ratio to the Standard
DATA ENTRY: Enter an explanation if the standard is not met.
1a. STANDARD MET - Ratio of total unrestricted salaries and benefits to total unrestricted expenditures has met the standard for the budget and two subsequent fiscal years.
Explanation:(required if NOT met)

Manhattan Beach UnifiedLos Angeles County
2016-17 July 1 BudgetGeneral Fund
School District Criteria and Standards Review19 75333 0000000
Form 01CS
California Dept of EducationSACS Financial Reporting Software - 2016.1.0File: cs-a (Rev 03/17/2016) Page 8 of 28 Printed: 6/10/2016 4:25 PM
6. CRITERION: Other Revenues and Expenditures
STANDARD: Projected operating revenues (including federal, other state, and other local) or expenditures (including books and supplies,and services and other operating), for any of the budget year or two subsequent fiscal years, have not changed from the prior fiscal year amount by morethan the percentage change in population and the funded cost-of-living adjustment (COLA) plus or minus ten percent.
For each major object category, changes that exceed the percentage change in population and the funded COLA plus or minus five percent must beexplained.
6A. Calculating the District's Other Revenues and Expenditures Standard Percentage Ranges
DATA ENTRY: All data are extracted or calculated.Budget Year 1st Subsequent Year 2nd Subsequent Year
(2016-17) (2017-18) (2018-19)1. District's Change in Population and Funding Level
(Criterion 4A1, Step 3): -0.86% -0.89% -0.41%2. District's Other Revenues and Expenditures
Standard Percentage Range (Line 1, plus/minus 10%): -10.86% to 9.14% -10.89% to 9.11% -10.41% to 9.59%3. District's Other Revenues and Expenditures
Explanation Percentage Range (Line 1, plus/minus 5%): -5.86% to 4.14% -5.89% to 4.11% -5.41% to 4.59%
6B. Calculating the District's Change by Major Object Category and Comparison to the Explanation Percentage Range (Section 6A, Line 3)
DATA ENTRY: If Form MYP exists, the 1st and 2nd Subsequent Year data for each revenue and expenditure section will be extracted; if not, enter data for the two subsequent years. All other data are extracted or calculated.
Explanations must be entered for each category if the percent change for any year exceeds the district's explanation percentage range.
Percent Change Change Is OutsideObject Range / Fiscal Year Amount Over Previous Year Explanation Range
Federal Revenue (Fund 01, Objects 8100-8299) (Form MYP, Line A2)First Prior Year (2015-16) 1,793,736.00
Budget Year (2016-17) 1,718,799.00 -4.18% No
1st Subsequent Year (2017-18) 1,718,799.00 0.00% No
2nd Subsequent Year (2018-19) 1,718,799.00 0.00% No
Explanation:(required if Yes)
Other State Revenue (Fund 01, Objects 8300-8599) (Form MYP, Line A3)First Prior Year (2015-16) 9,265,888.00
Budget Year (2016-17) 9,104,709.00 -1.74% No
1st Subsequent Year (2017-18) 7,535,116.00 -17.24% Yes
2nd Subsequent Year (2018-19) 7,296,721.00 -3.16% No
Explanation:(required if Yes)
State revenues were reduced by the one-time discretionary funds.
Other Local Revenue (Fund 01, Objects 8600-8799) (Form MYP, Line A4)First Prior Year (2015-16) 11,424,649.00
Budget Year (2016-17) 7,797,795.00 -31.75% Yes
1st Subsequent Year (2017-18) 7,800,031.00 0.03% No
2nd Subsequent Year (2018-19) 7,802,340.00 0.03% No
Explanation:(required if Yes)
Local revenues were reduced by donations and one-time grants.
Books and Supplies (Fund 01, Objects 4000-4999) (Form MYP, Line B4)First Prior Year (2015-16) 5,234,451.00
Budget Year (2016-17) 2,538,049.00 -51.51% Yes
1st Subsequent Year (2017-18) 2,201,500.00 -13.26% Yes
2nd Subsequent Year (2018-19) 2,256,537.00 2.50% No
Explanation:(required if Yes)
Budget cuts and reductions were applied across all sites and departments in an effort to reduce the operating deficit.
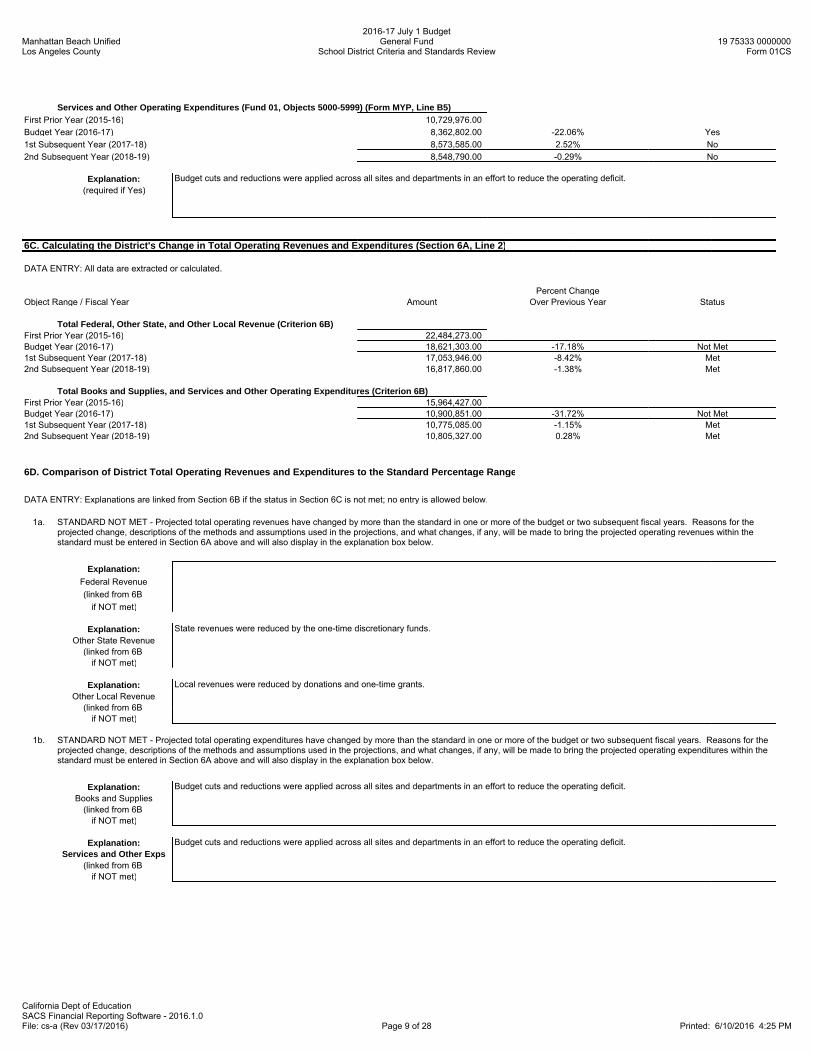
Manhattan Beach UnifiedLos Angeles County
2016-17 July 1 BudgetGeneral Fund
School District Criteria and Standards Review19 75333 0000000
Form 01CS
California Dept of EducationSACS Financial Reporting Software - 2016.1.0File: cs-a (Rev 03/17/2016) Page 9 of 28 Printed: 6/10/2016 4:25 PM
Services and Other Operating Expenditures (Fund 01, Objects 5000-5999) (Form MYP, Line B5)First Prior Year (2015-16) 10,729,976.00
Budget Year (2016-17) 8,362,802.00 -22.06% Yes
1st Subsequent Year (2017-18) 8,573,585.00 2.52% No
2nd Subsequent Year (2018-19) 8,548,790.00 -0.29% No
Explanation:(required if Yes)
Budget cuts and reductions were applied across all sites and departments in an effort to reduce the operating deficit.
6C. Calculating the District's Change in Total Operating Revenues and Expenditures (Section 6A, Line 2)
DATA ENTRY: All data are extracted or calculated.
Percent ChangeObject Range / Fiscal Year Amount Over Previous Year Status
Total Federal, Other State, and Other Local Revenue (Criterion 6B)First Prior Year (2015-16) 22,484,273.00Budget Year (2016-17) 18,621,303.00 -17.18% Not Met1st Subsequent Year (2017-18) 17,053,946.00 -8.42% Met2nd Subsequent Year (2018-19) 16,817,860.00 -1.38% Met
Total Books and Supplies, and Services and Other Operating Expenditures (Criterion 6B)First Prior Year (2015-16) 15,964,427.00Budget Year (2016-17) 10,900,851.00 -31.72% Not Met1st Subsequent Year (2017-18) 10,775,085.00 -1.15% Met2nd Subsequent Year (2018-19) 10,805,327.00 0.28% Met
6D. Comparison of District Total Operating Revenues and Expenditures to the Standard Percentage Range
DATA ENTRY: Explanations are linked from Section 6B if the status in Section 6C is not met; no entry is allowed below.
1a. STANDARD NOT MET - Projected total operating revenues have changed by more than the standard in one or more of the budget or two subsequent fiscal years. Reasons for theprojected change, descriptions of the methods and assumptions used in the projections, and what changes, if any, will be made to bring the projected operating revenues within thestandard must be entered in Section 6A above and will also display in the explanation box below.
Explanation:Federal Revenue
(linked from 6B
if NOT met)
Explanation:Other State Revenue
(linked from 6B if NOT met)
State revenues were reduced by the one-time discretionary funds.
Explanation:Other Local Revenue
(linked from 6B if NOT met)
Local revenues were reduced by donations and one-time grants.
1b. STANDARD NOT MET - Projected total operating expenditures have changed by more than the standard in one or more of the budget or two subsequent fiscal years. Reasons for theprojected change, descriptions of the methods and assumptions used in the projections, and what changes, if any, will be made to bring the projected operating expenditures within thestandard must be entered in Section 6A above and will also display in the explanation box below.
Explanation:Books and Supplies
(linked from 6B if NOT met)
Budget cuts and reductions were applied across all sites and departments in an effort to reduce the operating deficit.
Explanation:Services and Other Exps
(linked from 6B if NOT met)
Budget cuts and reductions were applied across all sites and departments in an effort to reduce the operating deficit.

Manhattan Beach UnifiedLos Angeles County
2016-17 July 1 BudgetGeneral Fund
School District Criteria and Standards Review19 75333 0000000
Form 01CS
California Dept of EducationSACS Financial Reporting Software - 2016.1.0File: cs-a (Rev 03/17/2016) Page 10 of 28 Printed: 6/10/2016 4:25 PM
7. CRITERION: Facilities Maintenance
STANDARD: Confirm that the annual contribution for facilities maintenance funding is not less than the amount required pursuant to Education CodeSection 17070.75, if applicable, and that the district is providing adequately to preserve the functionality of its facilities for their normal life in accordancewith Education Code sections 52060(d)(1) and 17002(d)(1).
Determining the District's Compliance with the Contribution Requirement for EC Section 17070.75 as amended by AB 104 (Chapter 13, Statutes of 2015), effective2015-16 and 2016-17 - Ongoing and Major Maintenance/Restricted Maintenance Account (OMMA/RMA)
NOTE: AB 104 (Chapter 13, Statutes of 2015) requires the district to deposit into the account, for the 2015-16 and 2016-17 fiscal years, a minimum amount that is the lesser of 3% of the totalgeneral fund expenditures and other financing uses for that fiscal year or the amount that the district deposited into the account for the 2014-15 fiscal year.
DATA ENTRY: Click the appropriate Yes or No button for special education local plan area (SELPA) administrative units (AUs); all other data are extracted or calculated. If standard is not met,enter an X in the appropriate box and enter an explanation, if applicable.
1. a. For districts that are the AU of a SELPA, do you choose to exclude revenues that are passed through to participating members of the SELPA from the OMMA/RMA required minimum contribution calculation?
b. Pass-through revenues and apportionments that may be excluded from the OMMA/RMA calculation per EC Section 17070.75(b)(2)(D) (Fund 10, resources 3300-3499 and 6500-6540, objects 7211-7213 and 7221-7223) 0.00
2. Ongoing and Major Maintenance/Restricted Maintenance Account
a. Budgeted Expenditures and Other Financing Uses (Form 01, objects 1000-7999) 73,596,399.00 3% of Total Current Year� Requiredb. Plus: Pass-through Revenues General Fund Expenditures Minimum Contribution/ and Apportionments and Other Financing Uses Amount Deposited¹ Lesser of Current Year or (Line 1b, if line 1a is No) (Line 2c times 3%) for 2014-15 Fiscal Year 2014-15 Fiscal Yearc. Net Budgeted Expenditures and Other Financing Uses 73,596,399.00 2,207,891.97 2,001,393.16 2,001,393.16
Budgeted Contribution ¹
to the Ongoing and Major
Maintenance Account Status
d. OMMA/RMA Contribution 2,208,000.00 Met
¹ Fund 01, Resource 8150, Objects 8900-8999
If standard is not met, enter an X in the box that best describes why the minimum required contribution was not made:
Not applicable (district does not participate in the Leroy F. Greene School Facilities Act of 1998)
Exempt (due to district's small size [EC Section 17070.75 (b)(2)(E)])
Other (explanation must be provided)
Explanation:(required if NOT met
and Other is marked)

Manhattan Beach UnifiedLos Angeles County
2016-17 July 1 BudgetGeneral Fund
School District Criteria and Standards Review19 75333 0000000
Form 01CS
California Dept of EducationSACS Financial Reporting Software - 2016.1.0File: cs-a (Rev 03/17/2016) Page 11 of 28 Printed: 6/10/2016 4:25 PM
8. CRITERION: Deficit Spending
STANDARD: Unrestricted deficit spending (total unrestricted expenditures and other financing uses is greater than total unrestricted revenues and otherfinancing sources) as a percentage of total unrestricted expenditures and other financing uses, has not exceeded one-third of the district's availablereserves¹ as a percentage of total expenditures and other financing uses² in two out of three prior fiscal years.
8A. Calculating the District's Deficit Spending Standard Percentage Levels
DATA ENTRY: All data are extracted or calculated.Third Prior Year Second Prior Year First Prior Year
(2013-14) (2014-15) (2015-16)1. District's Available Reserve Amounts (resources 0000-1999)
a. Reserve for Economic Uncertainties (Funds 01 and 17, Object 9789) 2,970,021.00 0.00 3,767,510.00b. Unassigned/Unappropriated (Funds 01 and 17, Object 9790) 9,830,247.44 11,248,861.87 5,086,963.89c. Negative General Fund Ending Balances in Restricted Resources (Fund 01, Object 979Z, if negative, for each of resources 2000-9999) 0.00 0.00 (0.37)d. Available Reserves (Lines 1a through 1c) 12,800,268.44 11,248,861.87 8,854,473.52
2. Expenditures and Other Financing Usesa. District's Total Expenditures and Other Financing Uses (Fund 01, objects 1000-7999) 59,400,411.75 67,381,623.68 75,350,208.00b. Plus: Special Education Pass-through Funds (Fund 10, resources 3300-3499 and 6500-6540, objects 7211-7213 and 7221-7223) 0.00c. Total Expenditures and Other Financing Uses (Line 2a plus Line 2b) 59,400,411.75 67,381,623.68 75,350,208.00
3. District's Available Reserve Percentage(Line 1d divided by Line 2c) 21.5% 16.7% 11.8%
District's Deficit Spending Standard Percentage Levels(Line 3 times 1/3): 7.2% 5.6% 3.9%
¹Available reserves are the unrestricted amounts in the Reserve for Economic Uncertaintiesand the Unassigned/Unappropriated accounts in the General Fund and the Special ReserveFund for Other Than Capital Outlay Projects. Available reserves will be reduced by any negativeending balances in restricted resources in the General Fund.
²A school district that is the Administrative Unit of a Special Education Local Plan Area (SELPA)may exclude from its expenditures the distribution of funds to its participating members.
8B. Calculating the District's Deficit Spending Percentages
DATA ENTRY: All data are extracted or calculated.
Net Change in Total Unrestricted Expenditures Deficit Spending Level
Unrestricted Fund Balance and Other Financing Uses (If Net Change in Unrestricted Fund
Fiscal Year (Form 01, Section E) (Form 01, Objects 1000-7999) Balance is negative, else N/A) Status
Third Prior Year (2013-14) 216,182.15 35,632,483.04 N/A Met
Second Prior Year (2014-15) (925,683.87) 40,420,551.24 2.3% Met
First Prior Year (2015-16) (2,304,273.00) 45,308,652.00 5.1% Not Met
Budget Year (2016-17) (Information only) (3,339,507.00) 44,575,238.00
8C. Comparison of District Deficit Spending to the Standard
DATA ENTRY: Enter an explanation if the standard is not met.
1a. STANDARD MET - Unrestricted deficit spending, if any, has not exceeded the standard percentage level in two or more of the three prior years.
Explanation:(required if NOT met)
The deficit spending is largerly due to the negotiated salary enhancement of 4% for all employees.

Manhattan Beach UnifiedLos Angeles County
2016-17 July 1 BudgetGeneral Fund
School District Criteria and Standards Review19 75333 0000000
Form 01CS
California Dept of EducationSACS Financial Reporting Software - 2016.1.0File: cs-a (Rev 03/17/2016) Page 12 of 28 Printed: 6/10/2016 4:25 PM
9. CRITERION: Fund Balance
STANDARD: Budgeted beginning unrestricted general fund balance has not been overestimated for two out of three prior fiscal years by more than thefollowing percentage levels:
Percentage Level ¹ District ADA 1.7% 0 to 3001.3% 301 to 1,0001.0% 1,001 to 30,0000.7% 30,001 to 400,0000.3% 400,001 and over
¹ Percentage levels equate to a rate of deficit spending which would eliminate recommended reserves foreconomic uncertainties over a three year period.
District Estimated P-2 ADA (Form A, Lines A6 and C4): 6,628
District's Fund Balance Standard Percentage Level: 1.0%
9A. Calculating the District's Unrestricted General Fund Beginning Balance Percentages
DATA ENTRY: Enter data in the Original Budget column for the First, Second, and Third Prior Years; all other data are extracted or calculated.
Unrestricted General Fund Beginning Balance ² Beginning Fund Balance
(Form 01, Line F1e, Unrestricted Column) Variance Level
Fiscal Year Original Budget Estimated/Unaudited Actuals (If overestimated, else N/A) Status
Third Prior Year (2013-14) 10,917,812.67 13,135,182.61 N/A Met
Second Prior Year (2014-15) 9,546,671.61 13,744,283.76 N/A Met
First Prior Year (2015-16) 10,010,402.76 12,688,746.89 N/A MetBudget Year (2016-17) (Information only) 10,384,473.89
² Adjusted beginning balance, including audit adjustments and other restatements (objects 9791-9795)
9B. Comparison of District Unrestricted Beginning Fund Balance to the Standard
DATA ENTRY: Enter an explanation if the standard is not met.
1a. STANDARD MET - Unrestricted general fund beginning fund balance has not been overestimated by more than the standard percentage level for two or more of the previous threeyears.
Explanation:(required if NOT met)

Manhattan Beach UnifiedLos Angeles County
2016-17 July 1 BudgetGeneral Fund
School District Criteria and Standards Review19 75333 0000000
Form 01CS
California Dept of EducationSACS Financial Reporting Software - 2016.1.0File: cs-a (Rev 03/17/2016) Page 13 of 28 Printed: 6/10/2016 4:25 PM
10. CRITERION: Reserves
STANDARD: Available reserves¹ for any of the budget year or two subsequent fiscal years are not less than the following percentages or amounts² asapplied to total expenditures and other financing uses³:
DATA ENTRY: Budget Year data are extracted. Enter district regular ADA corresponding to financial data reported in the General Fund, only, for the twosubsequent years.
Percentage Level District ADA 5% or $66,000 (greater of) 0 to 3004% or $66,000 (greater of) 301 to 1,000
3% 1,001 to 30,0002% 30,001 to 400,0001% 400,001 and over
¹ Available reserves are the unrestricted amounts in the Reserve for Economic Uncertainties and theUnassigned/Unappropriated accounts in the General Fund and the Special Reserve Fund for Other ThanCapital Outlay Projects. Available reserves will be reduced by any negative ending balances in restrictedresources in the General Fund.
² Dollar amounts to be adjusted annually by the prior year statutory cost-of-living adjustment (EducationCode Section 42238), rounded to the nearest thousand.
³ A school district that is the Administrative Unit (AU) of a Special Education Local Plan Area (SELPA) mayexclude from its expenditures the distribution of funds to its participating members.
Budget Year 1st Subsequent Year 2nd Subsequent Year(2016-17) (2017-18) (2018-19)
District Estimated P-2 ADA (Form A, Line A4): 6,623 6,569 6,542
District's Reserve Standard Percentage Level: 3% 3% 3%
10A. Calculating the District's Special Education Pass-through Exclusions (only for districts that serve as the AU of a SELPA)
DATA ENTRY: For SELPA AUs, if Form MYP exists, all data will be extracted including the Yes/No button selection. If not, click the appropriate Yes or No button for item 1 and, if Yes, enter data for item 2a and for the two subsequent years in item 2b; Budget Year data are extracted.
For districts that serve as the AU of a SELPA (Form MYP, Lines F1a, F1b1, and F1b2):
1. Do you choose to exclude from the reserve calculation the pass-through funds distributed to SELPA members? Yes2. If you are the SELPA AU and are excluding special education pass-through funds:
a. Enter the name(s) of the SELPA(s):
Budget Year 1st Subsequent Year 2nd Subsequent Year
(2016-17) (2017-18) (2018-19)b. Special Education Pass-through Funds (Fund 10, resources 3300-3499 and 6500-6540, objects 7211-7213 and 7221-7223) 0.00
10B. Calculating the District's Reserve Standard
DATA ENTRY: If Form MYP exists, 1st and 2nd Subsequent Year data for lines 1 and 2 will be extracted; if not, enter data for the two subsequent years. All other data are extracted or calculated.
Budget Year 1st Subsequent Year 2nd Subsequent Year
(2016-17) (2017-18) (2018-19)
1. Expenditures and Other Financing Uses
(Fund 01, objects 1000-7999) (Form MYP, Line B11) 73,596,399.00 70,482,432.00 72,252,679.00
2. Plus: Special Education Pass-through
(Criterion 10A, Line 2b, if Criterion 10A, Line 1 is No)
3. Total Expenditures and Other Financing Uses
(Line B1 plus Line B2) 73,596,399.00 70,482,432.00 72,252,679.00
4. Reserve Standard Percentage Level 3% 3% 3%
5. Reserve Standard - by Percent
(Line B3 times Line B4) 2,207,891.97 2,114,472.96 2,167,580.37
6. Reserve Standard - by Amount
($66,000 for districts with 0 to 1,000 ADA, else 0) 0.00 0.00 0.007. District's Reserve Standard
(Greater of Line B5 or Line B6) 2,207,891.97 2,114,472.96 2,167,580.37

Manhattan Beach UnifiedLos Angeles County
2016-17 July 1 BudgetGeneral Fund
School District Criteria and Standards Review19 75333 0000000
Form 01CS
California Dept of EducationSACS Financial Reporting Software - 2016.1.0File: cs-a (Rev 03/17/2016) Page 14 of 28 Printed: 6/10/2016 4:25 PM
10C. Calculating the District's Budgeted Reserve Amount
DATA ENTRY: If Form MYP exists, 1st and 2nd Subsequent Year data for lines 1 through 7 will be extracted; if not, enter data for the two subsequent years. All other data are extracted or calculated.
Reserve Amounts(Unrestricted resources 0000-1999 except Line 4):
Budget Year(2016-17)
1st Subsequent Year(2017-18)
2nd Subsequent Year(2018-19)
1. General Fund - Stabilization Arrangements(Fund 01, Object 9750) (Form MYP, Line E1a) 0.00
2. General Fund - Reserve for Economic Uncertainties
(Fund 01, Object 9789) (Form MYP, Line E1b) 3,679,820.00 2,114,473.00 2,167,580.00
3. General Fund - Unassigned/Unappropriated Amount
(Fund 01, Object 9790) (Form MYP, Line E1c) 1,640,146.89 944,125.89 34,880.894. General Fund - Negative Ending Balances in Restricted Resources
(Fund 01, Object 979Z, if negative, for each of resources 2000-9999)(Form MYP, Line E1d) (0.37) 0.00 0.00
5. Special Reserve Fund - Stabilization Arrangements
(Fund 17, Object 9750) (Form MYP, Line E2a) 0.006. Special Reserve Fund - Reserve for Economic Uncertainties
(Fund 17, Object 9789) (Form MYP, Line E2b) 0.00
7. Special Reserve Fund - Unassigned/Unappropriated Amount
(Fund 17, Object 9790) (Form MYP, Line E2c) 0.00
8. District's Budgeted Reserve Amount
(Lines C1 thru C7) 5,319,966.52 3,058,598.89 2,202,460.899. District's Budgeted Reserve Percentage (Information only)
(Line 8 divided by Section 10B, Line 3) 7.23% 4.34% 3.05%District's Reserve Standard
(Section 10B, Line 7): 2,207,891.97 2,114,472.96 2,167,580.37
Status: Met Met Met
10D. Comparison of District Reserve Amount to the Standard
DATA ENTRY: Enter an explanation if the standard is not met.
1a. STANDARD MET - Projected available reserves have met the standard for the budget and two subsequent fiscal years.
Explanation:(required if NOT met)

Manhattan Beach UnifiedLos Angeles County
2016-17 July 1 BudgetGeneral Fund
School District Criteria and Standards Review19 75333 0000000
Form 01CS
California Dept of EducationSACS Financial Reporting Software - 2016.1.0File: cs-a (Rev 03/17/2016) Page 15 of 28 Printed: 6/10/2016 4:25 PM
SUPPLEMENTAL INFORMATION
DATA ENTRY: Click the appropriate Yes or No button for items S1 through S4. Enter an explanation for each Yes answer.
S1. Contingent Liabilities
1a. Does your district have any known or contingent liabilities (e.g., financial or program audits, litigation,state compliance reviews) that may impact the budget? No
1b. If Yes, identify the liabilities and how they may impact the budget:
S2. Use of One-time Revenues for Ongoing Expenditures
1a. Does your district have ongoing general fund expenditures in the budget in excess of one percent ofthe total general fund expenditures that are funded with one-time resources? No
1b. If Yes, identify the expenditures and explain how the one-time resources will be replaced to continue funding the ongoing expenditures in the following fiscal years:
S3. Use of Ongoing Revenues for One-time Expenditures
1a. Does your district have large non-recurring general fund expenditures that are funded with ongoing
general fund revenues? No
1b. If Yes, identify the expenditures:
S4. Contingent Revenues
1a. Does your district have projected revenues for the budget year or either of the two subsequent fiscal yearscontingent on reauthorization by the local government, special legislation, or other definitive act (e.g., parcel taxes, forest reserves)? No
1b. If Yes, identify any of these revenues that are dedicated for ongoing expenses and explain how the revenues will be replaced or expenditures reduced:

Manhattan Beach UnifiedLos Angeles County
2016-17 July 1 BudgetGeneral Fund
School District Criteria and Standards Review19 75333 0000000
Form 01CS
California Dept of EducationSACS Financial Reporting Software - 2016.1.0File: cs-a (Rev 03/17/2016) Page 16 of 28 Printed: 6/10/2016 4:25 PM
S5. Contributions
Identify projected contributions from unrestricted resources in the general fund to restricted resources in the general fund for the budget year and two subsequent fiscal years. Providean explanation if contributions have changed from the prior fiscal year amounts by more than $20,000 and more than ten percent. Explanation should include whether contributions areongoing or one-time in nature.
Identify projected transfers to or from the general fund to cover operating deficits in either the general fund or any other fund for the budget year and two subsequent fiscal years.Provide an explanation if transfers have changed from the prior fiscal year amounts by more than $20,000 and more than ten percent. Explanation should include whether transfers areongoing or one-time in nature.
Estimate the impact of any capital projects on the general fund operational budget.
District's Contributions and Transfers Standard:-10.0% to +10.0%
or -$20,000 to +$20,000
S5A. Identification of the District's Projected Contributions, Transfers, and Capital Projects that may Impact the General Fund
DATA ENTRY: For Contributions, enter data in the Projection column for the 1st and 2nd Subsequent Years. Contributions for the First Prior Year and Budget Year will be extracted. ForTransfers In and Transfers Out, enter data in the First Prior Year. If Form MYP exists, the data will be extracted for the Budget Year, and 1st and 2nd Subsequent Years. If Form MYP does notexist, enter data in the Budget Year, 1st and 2nd subsequent Years. Click the appropriate button for item 1d; all other data will be calculated.
Description / Fiscal Year Projection Amount of Change Percent Change Status
1a. Contributions, Unrestricted General Fund (Fund 01, Resources 0000-1999, Object 8980)First Prior Year (2015-16) (14,513,210.00)Budget Year (2016-17) (15,374,317.00) 861,107.00 5.9% Met1st Subsequent Year (2017-18) (15,244,126.00) (130,191.00) -0.8% Met2nd Subsequent Year (2018-19) (15,972,846.00) 728,720.00 4.8% Met
1b. Transfers In, General Fund *First Prior Year (2015-16) 0.00Budget Year (2016-17) 0.00 0.00 0.0% Met1st Subsequent Year (2017-18) 0.00 0.00 0.0% Met2nd Subsequent Year (2018-19) 0.00 0.00 0.0% Met
1c. Transfers Out, General Fund *First Prior Year (2015-16) 0.00Budget Year (2016-17) 0.00 0.00 0.0% Met1st Subsequent Year (2017-18) 0.00 0.00 0.0% Met2nd Subsequent Year (2018-19) 0.00 0.00 0.0% Met
1d. Impact of Capital ProjectsDo you have any capital projects that may impact the general fund operational budget? No
* Include transfers used to cover operating deficits in either the general fund or any other fund.
S5B. Status of the District's Projected Contributions, Transfers, and Capital Projects
DATA ENTRY: Enter an explanation if Not Met for items 1a-1c or if Yes for item 1d.
1a. MET - Projected contributions have not changed by more than the standard for the budget and two subsequent fiscal years.
Explanation:(required if NOT met)
1b. MET - Projected transfers in have not changed by more than the standard for the budget and two subsequent fiscal years.
Explanation:(required if NOT met)

Manhattan Beach UnifiedLos Angeles County
2016-17 July 1 BudgetGeneral Fund
School District Criteria and Standards Review19 75333 0000000
Form 01CS
California Dept of EducationSACS Financial Reporting Software - 2016.1.0File: cs-a (Rev 03/17/2016) Page 17 of 28 Printed: 6/10/2016 4:25 PM
1c. MET - Projected transfers out have not changed by more than the standard for the budget and two subsequent fiscal years.
Explanation:(required if NOT met)
1d. NO - There are no capital projects that may impact the general fund operational budget.
Project Information:(required if YES)

Manhattan Beach UnifiedLos Angeles County
2016-17 July 1 BudgetGeneral Fund
School District Criteria and Standards Review19 75333 0000000
Form 01CS
California Dept of EducationSACS Financial Reporting Software - 2016.1.0File: cs-a (Rev 03/17/2016) Page 18 of 28 Printed: 6/10/2016 4:25 PM
S6. Long-term Commitments
Identify all existing and new multiyear commitments¹ and their annual required payments for the budget year and two subsequent fiscal years.
Explain how any increase in annual payments will be funded. Also explain how any decrease to funding sources used to pay long-term commitments will be replaced.
¹ Include multiyear commitments, multiyear debt agreements, and new programs or contracts that result in long-term obligations.
S6A. Identification of the District's Long-term Commitments
DATA ENTRY: Click the appropriate button in item 1 and enter data in all columns of item 2 for applicable long-term commitments; there are no extractions in this section.
1. Does your district have long-term (multiyear) commitments?(If No, skip item 2 and Sections S6B and S6C) Yes
2. If Yes to item 1, list all new and existing multiyear commitments and required annual debt service amounts. Do not include long-term commitments for postemployment benefits otherthan pensions (OPEB); OPEB is disclosed in item S7A.
# of Years SACS Fund and Object Codes Used For: Principal BalanceType of Commitment Remaining Funding Sources (Revenues) Debt Service (Expenditures) as of July 1, 2016
Capital Leases 16 01.0-8011 01.0-7438,7439 9,233,042Certificates of ParticipationGeneral Obligation Bonds 29 21.0-8951 51.0-7438,7439 137,831,433Supp Early Retirement Program 5 01.0-8011 01.0-3921,3922 1,327,315State School Building LoansCompensated Absences
Other Long-term Commitments (do not include OPEB):
TOTAL: 148,391,790
Prior Year Budget Year 1st Subsequent Year 2nd Subsequent Year
(2015-16) (2016-17) (2017-18) (2018-19)
Annual Payment Annual Payment Annual Payment Annual Payment
Type of Commitment (continued) (P & I) (P & I) (P & I) (P & I)
Capital Leases 949,387 802,109 820,879 840,563
Certificates of Participation
General Obligation Bonds 9,577,088 10,996,817 11,551,197 12,140,563
Supp Early Retirement Program 0 265,463 265,463 265,463
State School Building Loans
Compensated Absences
Other Long-term Commitments (continued):
Total Annual Payments: 10,526,475 12,064,389 12,637,539 13,246,589Has total annual payment increased over prior year (2015-16)? Yes Yes Yes

Manhattan Beach UnifiedLos Angeles County
2016-17 July 1 BudgetGeneral Fund
School District Criteria and Standards Review19 75333 0000000
Form 01CS
California Dept of EducationSACS Financial Reporting Software - 2016.1.0File: cs-a (Rev 03/17/2016) Page 19 of 28 Printed: 6/10/2016 4:25 PM
S6B. Comparison of the District's Annual Payments to Prior Year Annual Payment
DATA ENTRY: Enter an explanation if Yes.
1a. Yes - Annual payments for long-term commitments have increased in one or more of the budget or two subsequent fiscal years. Explain how the increase in annual payments will befunded.
Explanation:(required if Yes
to increase in totalannual payments)
The General Obligation Bonds are managed and paid by the County Office of Education and LA County. The Capital Lease and Supplemental EarlyRetirement is paid by the District's General Fund.
S6C. Identification of Decreases to Funding Sources Used to Pay Long-term Commitments
DATA ENTRY: Click the appropriate Yes or No button in item 1; if Yes, an explanation is required in item 2.
1. Will funding sources used to pay long-term commitments decrease or expire prior to the end of the commitment period, or are they one-time sources?
No
2.
No - Funding sources will not decrease or expire prior to the end of the commitment period, and one-time funds are not being used for long-term commitment annual payments.
Explanation:(required if Yes)

Manhattan Beach UnifiedLos Angeles County
2016-17 July 1 BudgetGeneral Fund
School District Criteria and Standards Review19 75333 0000000
Form 01CS
California Dept of EducationSACS Financial Reporting Software - 2016.1.0File: cs-a (Rev 03/17/2016) Page 20 of 28 Printed: 6/10/2016 4:25 PM
S7. Unfunded Liabilities
Estimate the unfunded liability for postemployment benefits other than pensions (OPEB) based on an actuarial valuation, if required, or other method; identify or estimate the annualrequired contribution; and indicate how the obligation is funded (pay-as-you-go, amortized over a specific period, etc.).
Estimate the unfunded liability for self-insurance programs such as workers' compensation based on an actuarial valuation, if required, or other method; identify or estimate the requiredcontribution; and indicate how the obligation is funded (level of risk retained, funding approach, etc.).
S7A. Identification of the District's Estimated Unfunded Liability for Postemployment Benefits Other than Pensions (OPEB)
DATA ENTRY: Click the appropriate button in item 1 and enter data in all other applicable items; there are no extractions in this section except the budget year data on line 5b.
1. Does your district provide postemployment benefits other
than pensions (OPEB)? (If No, skip items 2-5) Yes
2. For the district's OPEB:a. Are they lifetime benefits? No
b. Do benefits continue past age 65? No
c. Describe any other characteristics of the district's OPEB program including eligibility criteria and amounts, if any, that retirees are required to contribute toward their own benefits:
The District provides postemployment health care benefits, in accordance with District employment contracts, toall employees who retire from the District on or after attaining age 55 with at least 15 years of service. Currently,nine employees meetthose eligibility requirements. The District contributes $400 per year for premiums incurredby retirees and their dependents and the retiree contributes the remainder. Expenditures for postemploymentbenefits are recognized on a pay-as-you-go basis.During the year, expenditures of $2,900 were recognized forretirees' the District benefits, paid by their own Retiree Benefits Fund, separate from the District's General Fund. Membership of the Plan consists of20 retirees currently receiving benun30, 2015, the Retiree Benefit Fund contained $70,495.
3. a. Are OPEB financed on a pay-as-you-go, actuarial cost, or other method? Pay-as-you-go
b. Indicate any accumulated amounts earmarked for OPEB in a self-insurance or Self-Insurance Fund Governmental Fund governmental fund 0 0
4. OPEB Liabilitiesa. OPEB actuarial accrued liability (AAL) 4,336,899.00b. OPEB unfunded actuarial accrued liability (UAAL) 4,336,899.00c. Are AAL and UAAL based on the district's estimate or an actuarial valuation? Actuariald. If based on an actuarial valuation, indicate the date of the OPEB valuation Jul 01, 2014
Budget Year 1st Subsequent Year 2nd Subsequent Year
5. OPEB Contributions (2016-17) (2017-18) (2018-19)
a. OPEB annual required contribution (ARC) per actuarial valuation or Alternative Measurement Method 415,838.00 415,838.00 415,838.00b. OPEB amount contributed (for this purpose, include premiums paid to a self-insurance fund) (funds 01-70, objects 3701-3752) 24,000.00 24,000.00 24,000.00c. Cost of OPEB benefits (equivalent of "pay-as-you-go" amount) 24,000.00 24,000.00 24,000.00
d. Number of retirees receiving OPEB benefits 30 30 30
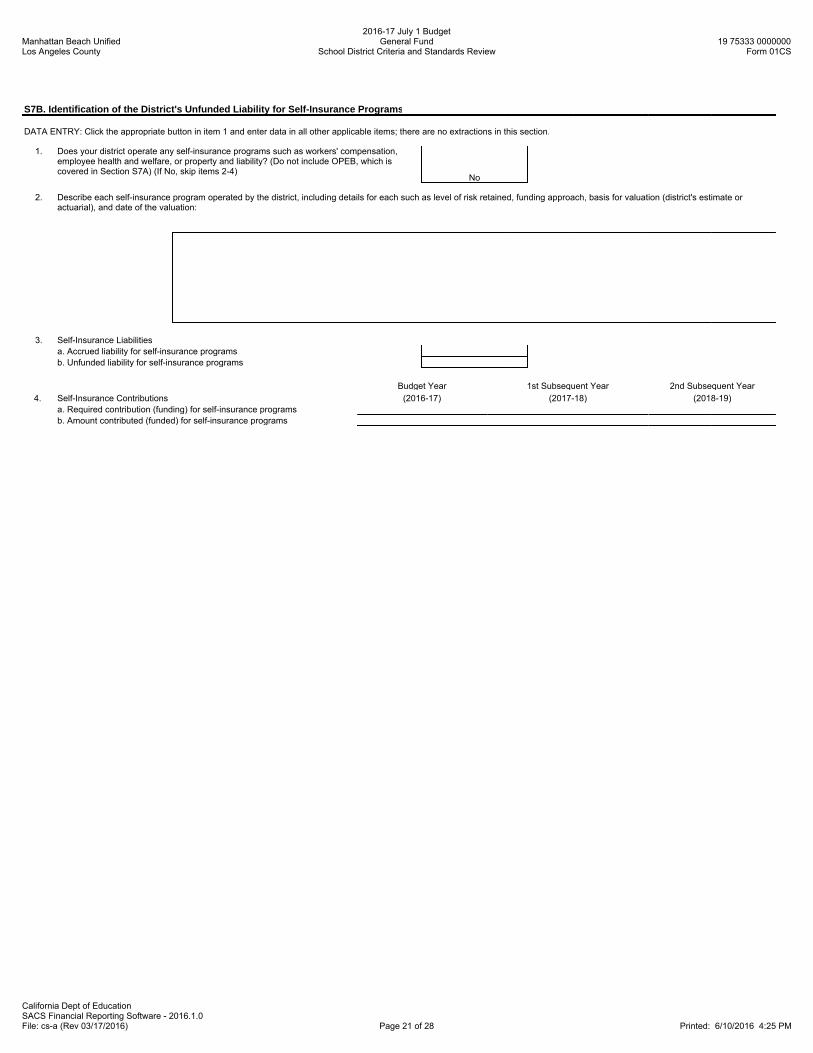
Manhattan Beach UnifiedLos Angeles County
2016-17 July 1 BudgetGeneral Fund
School District Criteria and Standards Review19 75333 0000000
Form 01CS
California Dept of EducationSACS Financial Reporting Software - 2016.1.0File: cs-a (Rev 03/17/2016) Page 21 of 28 Printed: 6/10/2016 4:25 PM
S7B. Identification of the District's Unfunded Liability for Self-Insurance Programs
DATA ENTRY: Click the appropriate button in item 1 and enter data in all other applicable items; there are no extractions in this section.
1. Does your district operate any self-insurance programs such as workers' compensation,employee health and welfare, or property and liability? (Do not include OPEB, which iscovered in Section S7A) (If No, skip items 2-4)
No
2. Describe each self-insurance program operated by the district, including details for each such as level of risk retained, funding approach, basis for valuation (district's estimate oractuarial), and date of the valuation:
3. Self-Insurance Liabilitiesa. Accrued liability for self-insurance programsb. Unfunded liability for self-insurance programs
Budget Year 1st Subsequent Year 2nd Subsequent Year
4. Self-Insurance Contributions (2016-17) (2017-18) (2018-19)a. Required contribution (funding) for self-insurance programsb. Amount contributed (funded) for self-insurance programs

Manhattan Beach UnifiedLos Angeles County
2016-17 July 1 BudgetGeneral Fund
School District Criteria and Standards Review19 75333 0000000
Form 01CS
California Dept of EducationSACS Financial Reporting Software - 2016.1.0File: cs-a (Rev 03/17/2016) Page 22 of 28 Printed: 6/10/2016 4:25 PM
S8. Status of Labor Agreements
Analyze the status of employee labor agreements. Identify new labor agreements, as well as new commitments provided as part of previously ratified multiyear agreements; and includeall contracts, including all administrator contracts (and including all compensation). For new agreements, indicate the date of the required board meeting. Compare the increase in newcommitments to the projected increase in ongoing revenues, and explain how these commitments will be funded in future fiscal years.
If salary and benefit negotiations are not finalized at budget adoption, upon settlement with certificated or classified staff:The school district must determine the cost of the settlement, including salaries, benefits, and any other agreements that change costs, and provide thecounty office of education (COE) with an analysis of the cost of the settlement and its impact on the operating budget.
The county superintendent shall review the analysis relative to the criteria and standards, and may provide written comments to the president of the districtgoverning board and superintendent.
S8A. Cost Analysis of District's Labor Agreements - Certificated (Non-management) Employees
DATA ENTRY: Enter all applicable data items; there are no extractions in this section.
Prior Year (2nd Interim) Budget Year 1st Subsequent Year 2nd Subsequent Year
(2015-16) (2016-17) (2017-18) (2018-19)
Number of certificated (non-management)full-time-equivalent (FTE) positions 352.5 347.0 318.0 318.0
Certificated (Non-management) Salary and Benefit Negotiations1. Are salary and benefit negotiations settled for the budget year? Yes
If Yes, and the corresponding public disclosure documentshave been filed with the COE, complete questions 2 and 3.
If Yes, and the corresponding public disclosure documentshave not been filed with the COE, complete questions 2-5.
If No, identify the unsettled negotiations including any prior year unsettled negotiations and then complete questions 6 and 7.
Negotiations Settled2a. Per Government Code Section 3547.5(a), date of public disclosure board meeting: May 18, 2016
2b. Per Government Code Section 3547.5(b), was the agreement certified
by the district superintendent and chief business official? Yes
If Yes, date of Superintendent and CBO certification: May 12, 2016
3. Per Government Code Section 3547.5(c), was a budget revision adopted
to meet the costs of the agreement? Yes
If Yes, date of budget revision board adoption: Jun 15, 2016
4. Period covered by the agreement: Begin Date: Jul 01, 2015 End Date: Jun 30, 2017
5. Salary settlement: Budget Year 1st Subsequent Year 2nd Subsequent Year
(2016-17) (2017-18) (2018-19)
Is the cost of salary settlement included in the budget and multiyear projections (MYPs)? Yes Yes Yes
One Year AgreementTotal cost of salary settlement 570,410 0 0
% change in salary schedule from prior year 0.2%
orMultiyear Agreement
Total cost of salary settlement
% change in salary schedule from prior year(may enter text, such as "Reopener")
Identify the source of funding that will be used to support multiyear salary commitments:

Manhattan Beach UnifiedLos Angeles County
2016-17 July 1 BudgetGeneral Fund
School District Criteria and Standards Review19 75333 0000000
Form 01CS
California Dept of EducationSACS Financial Reporting Software - 2016.1.0File: cs-a (Rev 03/17/2016) Page 23 of 28 Printed: 6/10/2016 4:25 PM
Negotiations Not Settled
6. Cost of a one percent increase in salary and statutory benefits
Budget Year 1st Subsequent Year 2nd Subsequent Year
(2016-17) (2017-18) (2018-19)
7. Amount included for any tentative salary schedule increases
Budget Year 1st Subsequent Year 2nd Subsequent YearCertificated (Non-management) Health and Welfare (H&W) Benefits (2016-17) (2017-18) (2018-19)
1. Are costs of H&W benefit changes included in the budget and MYPs? Yes Yes Yes
2. Total cost of H&W benefits 3,218,625 3,398,868 3,589,205
3. Percent of H&W cost paid by employer 80.0% 80.0% 80.0%
4. Percent projected change in H&W cost over prior year -7.0% 5.6% 5.6%
Certificated (Non-management) Prior Year SettlementsAre any new costs from prior year settlements included in the budget?
If Yes, amount of new costs included in the budget and MYPsIf Yes, explain the nature of the new costs:
Budget Year 1st Subsequent Year 2nd Subsequent YearCertificated (Non-management) Step and Column Adjustments (2016-17) (2017-18) (2018-19)
1. Are step & column adjustments included in the budget and MYPs? Yes Yes Yes
2. Cost of step & column adjustments 434,192 393,783
3. Percent change in step & column over prior year 1.3% 1.3% 1.3%
Budget Year 1st Subsequent Year 2nd Subsequent YearCertificated (Non-management) Attrition (layoffs and retirements) (2016-17) (2017-18) (2018-19)
1. Are savings from attrition included in the budget and MYPs? Yes Yes Yes
2. Are additional H&W benefits for those laid-off or retired employeesincluded in the budget and MYPs?
Yes Yes Yes
Certificated (Non-management) - OtherList other significant contract changes and the cost impact of each change (i.e., class size, hours of employment, leave of absence, bonuses, etc.):

Manhattan Beach UnifiedLos Angeles County
2016-17 July 1 BudgetGeneral Fund
School District Criteria and Standards Review19 75333 0000000
Form 01CS
California Dept of EducationSACS Financial Reporting Software - 2016.1.0File: cs-a (Rev 03/17/2016) Page 24 of 28 Printed: 6/10/2016 4:25 PM
S8B. Cost Analysis of District's Labor Agreements - Classified (Non-management) Employees
DATA ENTRY: Enter all applicable data items; there are no extractions in this section.
Prior Year (2nd Interim) Budget Year 1st Subsequent Year 2nd Subsequent Year
(2015-16) (2016-17) (2017-18) (2018-19)
Number of classified (non-management)FTE positions 236.0 229.0 224.0 224.0
Classified (Non-management) Salary and Benefit Negotiations1. Are salary and benefit negotiations settled for the budget year? Yes
If Yes, and the corresponding public disclosure documentshave been filed with the COE, complete questions 2 and 3.
If Yes, and the corresponding public disclosure documentshave not been filed with the COE, complete questions 2-5.
If No, identify the unsettled negotiations including any prior year unsettled negotiations and then complete questions 6 and 7.
Negotiations Settled2a. Per Government Code Section 3547.5(a), date of public disclosure
board meeting: May 18, 2016
2b. Per Government Code Section 3547.5(b), was the agreement certified
by the district superintendent and chief business official? Yes
If Yes, date of Superintendent and CBO certification: May 12, 2016
3. Per Government Code Section 3547.5(c), was a budget revision adopted
to meet the costs of the agreement? Yes
If Yes, date of budget revision board adoption: Jun 15, 2016
4. Period covered by the agreement: Begin Date: Jul 01, 2016 End Date: Jun 30, 2017
5. Salary settlement: Budget Year 1st Subsequent Year 2nd Subsequent Year
(2016-17) (2017-18) (2018-19)
Is the cost of salary settlement included in the budget and multiyear projections (MYPs)? Yes Yes Yes
One Year AgreementTotal cost of salary settlement 191,022
% change in salary schedule from prior year 1.5%
orMultiyear Agreement
Total cost of salary settlement
% change in salary schedule from prior year(may enter text, such as "Reopener")
Identify the source of funding that will be used to support multiyear salary commitments:
Negotiations Not Settled
6. Cost of a one percent increase in salary and statutory benefits
Budget Year 1st Subsequent Year 2nd Subsequent Year
(2016-17) (2017-18) (2018-19)
7. Amount included for any tentative salary schedule increases

Manhattan Beach UnifiedLos Angeles County
2016-17 July 1 BudgetGeneral Fund
School District Criteria and Standards Review19 75333 0000000
Form 01CS
California Dept of EducationSACS Financial Reporting Software - 2016.1.0File: cs-a (Rev 03/17/2016) Page 25 of 28 Printed: 6/10/2016 4:25 PM
Budget Year 1st Subsequent Year 2nd Subsequent YearClassified (Non-management) Health and Welfare (H&W) Benefits (2016-17) (2017-18) (2018-19)
1. Are costs of H&W benefit changes included in the budget and MYPs? Yes Yes Yes
2. Total cost of H&W benefits 1,616,345 1,706,860 1,802,444
3. Percent of H&W cost paid by employer 80.0% 80.0% 80.0%
4. Percent projected change in H&W cost over prior year -7.0% 5.6% 5.6%
Classified (Non-management) Prior Year SettlementsAre any new costs from prior year settlements included in the budget?
If Yes, amount of new costs included in the budget and MYPsIf Yes, explain the nature of the new costs:
Budget Year 1st Subsequent Year 2nd Subsequent YearClassified (Non-management) Step and Column Adjustments (2016-17) (2017-18) (2018-19)
1. Are step & column adjustments included in the budget and MYPs? Yes Yes Yes
2. Cost of step & column adjustments 142,827 143,158
3. Percent change in step & column over prior year 1.3% 1.3%
Budget Year 1st Subsequent Year 2nd Subsequent YearClassified (Non-management) Attrition (layoffs and retirements) (2016-17) (2017-18) (2018-19)
1. Are savings from attrition included in the budget and MYPs? Yes Yes Yes
2. Are additional H&W benefits for those laid-off or retired employeesincluded in the budget and MYPs? Yes Yes Yes
Classified (Non-management) - OtherList other significant contract changes and the cost impact of each change (i.e., hours of employment, leave of absence, bonuses, etc.):

Manhattan Beach UnifiedLos Angeles County
2016-17 July 1 BudgetGeneral Fund
School District Criteria and Standards Review19 75333 0000000
Form 01CS
California Dept of EducationSACS Financial Reporting Software - 2016.1.0File: cs-a (Rev 03/17/2016) Page 26 of 28 Printed: 6/10/2016 4:25 PM
S8C. Cost Analysis of District's Labor Agreements - Management/Supervisor/Confidential Employees
DATA ENTRY: Enter all applicable data items; there are no extractions in this section.
Prior Year (2nd Interim) Budget Year 1st Subsequent Year 2nd Subsequent Year
(2015-16) (2016-17) (2017-18) (2018-19)Number of management, supervisor, andconfidential FTE positions 24.9 25.0 25.0 25.0
Management/Supervisor/Confidential Salary and Benefit Negotiations
1. Are salary and benefit negotiations settled for the budget year? Yes
If Yes, complete question 2.
If No, identify the unsettled negotiations including any prior year unsettled negotiations and then complete questions 3 and 4.
If n/a, skip the remainder of Section S8C.
Negotiations Settled
2. Salary settlement: Budget Year 1st Subsequent Year 2nd Subsequent Year
(2016-17) (2017-18) (2018-19)
Is the cost of salary settlement included in the budget and multiyear projections (MYPs)? Yes Yes Yes
Total cost of salary settlement 91,779
% change in salary schedule from prior year(may enter text, such as "Reopener") 2.0%
Negotiations Not Settled
3. Cost of a one percent increase in salary and statutory benefits
Budget Year 1st Subsequent Year 2nd Subsequent Year
(2016-17) (2017-18) (2018-19)
4. Amount included for any tentative salary schedule increases
Management/Supervisor/Confidential Budget Year 1st Subsequent Year 2nd Subsequent YearHealth and Welfare (H&W) Benefits (2016-17) (2017-18) (2018-19)
1. Are costs of H&W benefit changes included in the budget and MYPs? Yes Yes Yes
2. Total cost of H&W benefits 241,178 254,684 268,946
3. Percent of H&W cost paid by employer 80.0% 80.0% 80.0%
4. Percent projected change in H&W cost over prior year -7.0% 5.6% 5.6%
Management/Supervisor/Confidential Budget Year 1st Subsequent Year 2nd Subsequent YearStep and Column Adjustments (2016-17) (2017-18) (2018-19)
1. Are step & column adjustments included in the budget and MYPs? Yes Yes Yes2. Cost of step and column adjustments3. Percent change in step & column over prior year
Management/Supervisor/Confidential Budget Year 1st Subsequent Year 2nd Subsequent YearOther Benefits (mileage, bonuses, etc.) (2016-17) (2017-18) (2018-19)
1. Are costs of other benefits included in the budget and MYPs? Yes Yes Yes
2. Total cost of other benefits
3. Percent change in cost of other benefits over prior year

Manhattan Beach UnifiedLos Angeles County
2016-17 July 1 BudgetGeneral Fund
School District Criteria and Standards Review19 75333 0000000
Form 01CS
California Dept of EducationSACS Financial Reporting Software - 2016.1.0File: cs-a (Rev 03/17/2016) Page 27 of 28 Printed: 6/10/2016 4:25 PM
S9. Local Control and Accountability Plan (LCAP)
Confirm that the school district's governing board has adopted an LCAP or an update to the LCAP effective for the budget year.
DATA ENTRY: Click the appropriate Yes or No button in item 1, and enter the date in item 2.
1. Did or will the school district's governing board adopt an LCAP or approve an update to the LCAP effective for the budget year? Yes
2. Approval date for adoption of the LCAP or approval of an update to the LCAP. Jun 14, 2016
S10. LCAP Expenditures
Confirm that the school district's budget includes the expenditures necessary to implement the LCAP or annual update to the LCAP.
DATA ENTRY: Click the appropriate Yes or No button.
Does the school district's budget include the expenditures necessary to implement the LCAP or annual update to the LCAP as describedin the Local Control and Accountability Plan and Annual Update Template, Section 3: Actions, Services and Expenditures? Yes
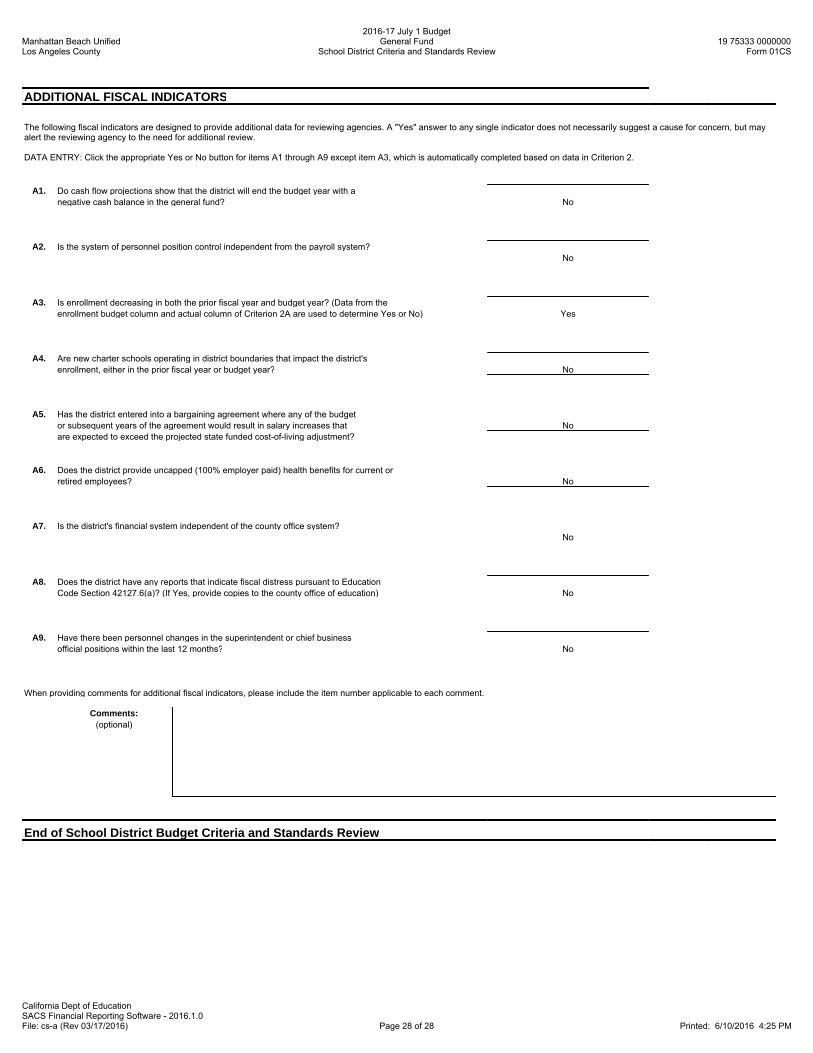
Manhattan Beach UnifiedLos Angeles County
2016-17 July 1 BudgetGeneral Fund
School District Criteria and Standards Review19 75333 0000000
Form 01CS
California Dept of EducationSACS Financial Reporting Software - 2016.1.0File: cs-a (Rev 03/17/2016) Page 28 of 28 Printed: 6/10/2016 4:25 PM
ADDITIONAL FISCAL INDICATORS
The following fiscal indicators are designed to provide additional data for reviewing agencies. A "Yes" answer to any single indicator does not necessarily suggest a cause for concern, but mayalert the reviewing agency to the need for additional review.
DATA ENTRY: Click the appropriate Yes or No button for items A1 through A9 except item A3, which is automatically completed based on data in Criterion 2.
A1. Do cash flow projections show that the district will end the budget year with anegative cash balance in the general fund? No
A2. Is the system of personnel position control independent from the payroll system?No
A3. Is enrollment decreasing in both the prior fiscal year and budget year? (Data from theenrollment budget column and actual column of Criterion 2A are used to determine Yes or No) Yes
A4. Are new charter schools operating in district boundaries that impact the district'senrollment, either in the prior fiscal year or budget year? No
A5. Has the district entered into a bargaining agreement where any of the budgetor subsequent years of the agreement would result in salary increases that Noare expected to exceed the projected state funded cost-of-living adjustment?
A6. Does the district provide uncapped (100% employer paid) health benefits for current orretired employees? No
A7. Is the district's financial system independent of the county office system?No
A8. Does the district have any reports that indicate fiscal distress pursuant to EducationCode Section 42127.6(a)? (If Yes, provide copies to the county office of education) No
A9. Have there been personnel changes in the superintendent or chief businessofficial positions within the last 12 months? No
When providing comments for additional fiscal indicators, please include the item number applicable to each comment.
Comments:(optional)
End of School District Budget Criteria and Standards Review