Long Term Recommendation: GNA Axles Ltd CMP INR 377 … … · GNA Axle Ltd (GNA) is one of the ......
22
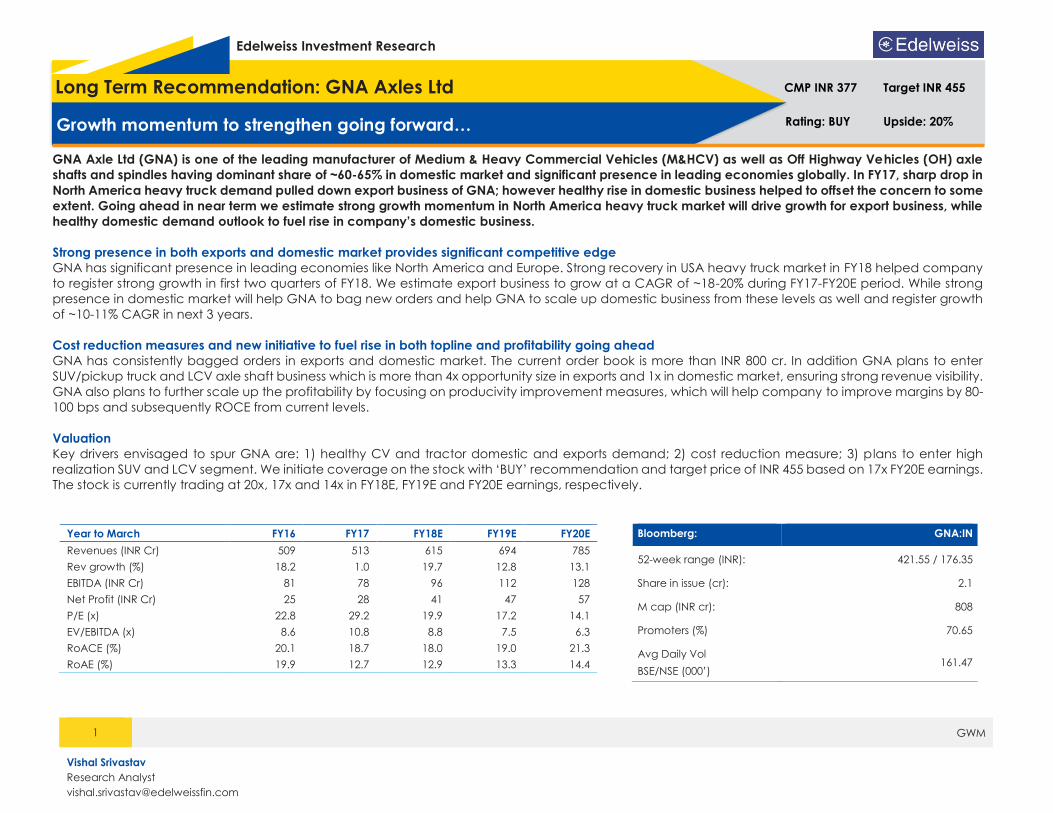
1 GWM Edelweiss Investment Research GNA Axle Ltd (GNA) is one of the leading manufacturer of Medium & Heavy Commercial Vehicles (M&HCV) as well as Off Highway Vehicles (OH) axle shafts and spindles having dominant share of ~60-65% in domestic market and significant presence in leading economies globally. In FY17, sharp drop in North America heavy truck demand pulled down export business of GNA; however healthy rise in domestic business helped to offset the concern to some extent. Going ahead in near term we estimate strong growth momentum in North America heavy truck market will drive growth for export business, while healthy domestic demand outlook to fuel rise in company’s domestic business. Strong presence in both exports and domestic market provides significant competitive edge GNA has significant presence in leading economies like North America and Europe. Strong recovery in USA heavy truck market in FY18 helped company to register strong growth in first two quarters of FY18. We estimate export business to grow at a CAGR of ~18-20% during FY17-FY20E period. While strong presence in domestic market will help GNA to bag new orders and help GNA to scale up domestic business from these levels as well and register growth of ~10-11% CAGR in next 3 years. Cost reduction measures and new initiative to fuel rise in both topline and profitability going ahead GNA has consistently bagged orders in exports and domestic market. The current order book is more than INR 800 cr. In addition GNA plans to enter SUV/pickup truck and LCV axle shaft business which is more than 4x opportunity size in exports and 1x in domestic market, ensuring strong revenue visibility. GNA also plans to further scale up the profitability by focusing on producivity improvement measures, which will help company to improve margins by 80- 100 bps and subsequently ROCE from current levels. Valuation Key drivers envisaged to spur GNA are: 1) healthy CV and tractor domestic and exports demand; 2) cost reduction measure; 3) plans to enter high realization SUV and LCV segment. We initiate coverage on the stock with ‘BUY’ recommendation and target price of INR 455 based on 17x FY20E earnings. The stock is currently trading at 20x, 17x and 14x in FY18E, FY19E and FY20E earnings, respectively. Year to March FY16 FY17 FY18E FY19E FY20E Revenues (INR Cr) 509 513 615 694 785 Rev growth (%) 18.2 1.0 19.7 12.8 13.1 EBITDA (INR Cr) 81 78 96 112 128 Net Profit (INR Cr) 25 28 41 47 57 P/E (x) 22.8 29.2 19.9 17.2 14.1 EV/EBITDA (x) 8.6 10.8 8.8 7.5 6.3 RoACE (%) 20.1 18.7 18.0 19.0 21.3 RoAE (%) 19.9 12.7 12.9 13.3 14.4 Long Term Recommendation: GNA Axles Ltd Growth momentum to strengthen going forward… CMP INR 377 Target INR 455 Rating: BUY Upside: 20% Bloomberg: GNA:IN 52-week range (INR): 421.55 / 176.35 Share in issue (cr): 2.1 M cap (INR cr): 808 Promoters (%) 70.65 Avg Daily Vol BSE/NSE (000’) 161.47 Vishal Srivastav Research Analyst [email protected]
-
Upload
vuongkhanh -
Category
Documents
-
view
217 -
download
0
Transcript of Long Term Recommendation: GNA Axles Ltd CMP INR 377 … … · GNA Axle Ltd (GNA) is one of the ......
1 GWM
Edelweiss Investment Research
GNA Axle Ltd (GNA) is one of the leading manufacturer of Medium & Heavy Commercial Vehicles (M&HCV) as well as Off Highway Vehicles (OH) axle
shafts and spindles having dominant share of ~60-65% in domestic market and significant presence in leading economies globally. In FY17, sharp drop in
North America heavy truck demand pulled down export business of GNA; however healthy rise in domestic business helped to offset the concern to some
extent. Going ahead in near term we estimate strong growth momentum in North America heavy truck market will drive growth for export business, while
healthy domestic demand outlook to fuel rise in company’s domestic business.
Strong presence in both exports and domestic market provides significant competitive edge
GNA has significant presence in leading economies like North America and Europe. Strong recovery in USA heavy truck market in FY18 helped company
to register strong growth in first two quarters of FY18. We estimate export business to grow at a CAGR of ~18-20% during FY17-FY20E period. While strong
presence in domestic market will help GNA to bag new orders and help GNA to scale up domestic business from these levels as well and register growth
of ~10-11% CAGR in next 3 years.
Cost reduction measures and new initiative to fuel rise in both topline and profitability going ahead
GNA has consistently bagged orders in exports and domestic market. The current order book is more than INR 800 cr. In addition GNA plans to enter
SUV/pickup truck and LCV axle shaft business which is more than 4x opportunity size in exports and 1x in domestic market, ensuring strong revenue visibility.
GNA also plans to further scale up the profitability by focusing on producivity improvement measures, which will help company to improve margins by 80-
100 bps and subsequently ROCE from current levels.
Valuation
Key drivers envisaged to spur GNA are: 1) healthy CV and tractor domestic and exports demand; 2) cost reduction measure; 3) plans to enter high
realization SUV and LCV segment. We initiate coverage on the stock with ‘BUY’ recommendation and target price of INR 455 based on 17x FY20E earnings.
The stock is currently trading at 20x, 17x and 14x in FY18E, FY19E and FY20E earnings, respectively.
Year to March FY16 FY17 FY18E FY19E FY20E
Revenues (INR Cr) 509 513 615 694 785
Rev growth (%) 18.2 1.0 19.7 12.8 13.1
EBITDA (INR Cr) 81 78 96 112 128
Net Profit (INR Cr) 25 28 41 47 57
P/E (x) 22.8 29.2 19.9 17.2 14.1
EV/EBITDA (x) 8.6 10.8 8.8 7.5 6.3
RoACE (%) 20.1 18.7 18.0 19.0 21.3
RoAE (%) 19.9 12.7 12.9 13.3 14.4
Long Term Recommendation: GNA Axles Ltd
Growth momentum to strengthen going forward…
CMP INR 377 Target INR 455
Rating: BUY Upside: 20%
Bloomberg: GNA:IN
52-week range (INR): 421.55 / 176.35
Share in issue (cr): 2.1
M cap (INR cr): 808
Promoters (%) 70.65
Avg Daily Vol
BSE/NSE (000’) 161.47
Vishal Srivastav
Research Analyst
GNA Axles Ltd.
2 GWM
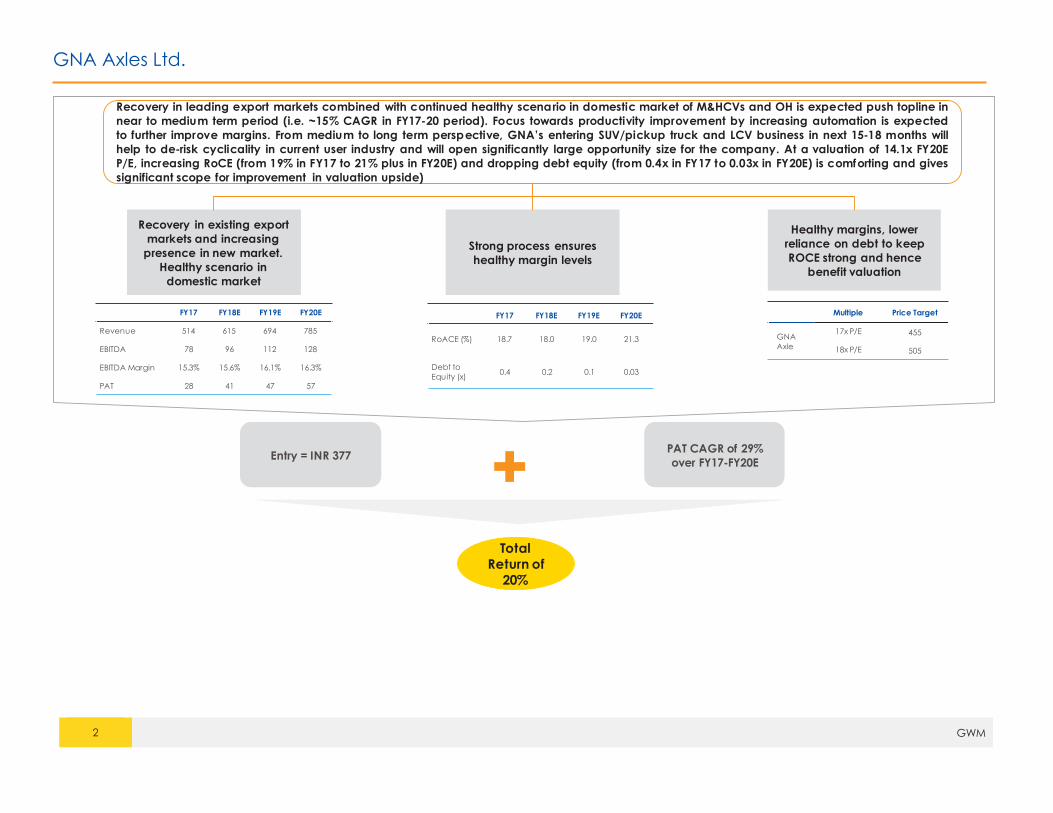
Recovery in leading export markets combined with continued healthy scenario in domestic market of M&HCVs and OH is expected push topline in
near to medium term period (i.e. ~15% CAGR in FY17-20 period). Focus towards productivity improvement by increasing automation is expected
to further improve margins. From medium to long term perspective, GNA’s entering SUV/pickup truck and LCV business in next 15-18 months will
help to de-risk cyclicality in current user industry and will open significantly large opportunity size for the company. At a valuation of 14.1x FY20E
P/E, increasing RoCE (from 19% in FY17 to 21% plus in FY20E) and dropping debt equity (from 0.4x in FY17 to 0.03x in FY20E) is comforting and gives
significant scope for improvement in valuation upside)
Recovery in existing export
markets and increasing
presence in new market.
Healthy scenario in
domestic market
Strong process ensures
healthy margin levels
Healthy margins, lower
reliance on debt to keep
ROCE strong and hence
benefit valuation
FY17 FY18E FY19E FY20E
Revenue 514 615 694 785
EBITDA 78 96 112 128
EBITDA Margin 15.3% 15.6% 16.1% 16.3%
PAT 28 41 47 57
FY17 FY18E FY19E FY20E
RoACE (%) 18.7 18.0 19.0 21.3
Debt to
Equity (x)0.4 0.2 0.1 0.03
Multiple Price Target
GNA
Axle
17x P/E 455
18x P/E 505
Entry = INR 377PAT CAGR of 29%
over FY17-FY20E
Total
Return of
20%
GNA Axles Ltd.
3 GWM
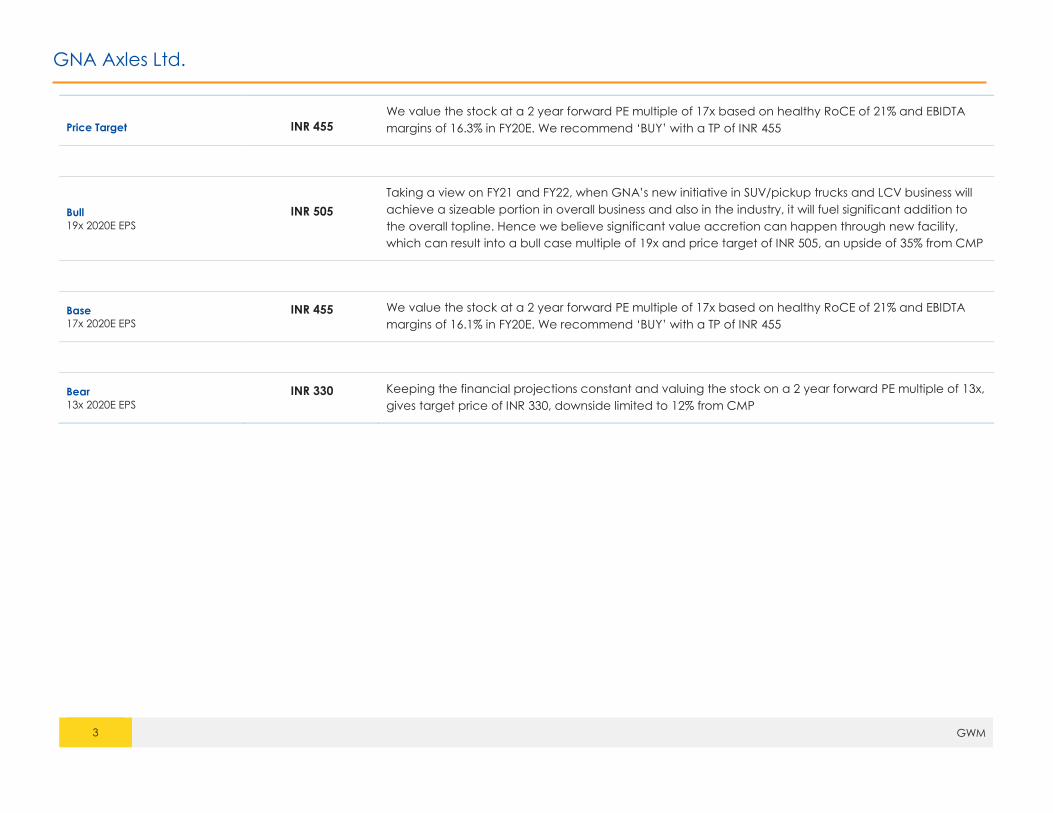
Price Target INR 455
We value the stock at a 2 year forward PE multiple of 17x based on healthy RoCE of 21% and EBIDTA
margins of 16.3% in FY20E. We recommend ‘BUY’ with a TP of INR 455
Bull
19x 2020E EPS
INR 505
Taking a view on FY21 and FY22, when GNA’s new initiative in SUV/pickup trucks and LCV business will
achieve a sizeable portion in overall business and also in the industry, it will fuel significant addition to
the overall topline. Hence we believe significant value accretion can happen through new facility,
which can result into a bull case multiple of 19x and price target of INR 505, an upside of 35% from CMP
Base
17x 2020E EPS
INR 455 We value the stock at a 2 year forward PE multiple of 17x based on healthy RoCE of 21% and EBIDTA
margins of 16.1% in FY20E. We recommend ‘BUY’ with a TP of INR 455
Bear
13x 2020E EPS
INR 330 Keeping the financial projections constant and valuing the stock on a 2 year forward PE multiple of 13x,
gives target price of INR 330, downside limited to 12% from CMP
GNA Axles Ltd.
4 GWM
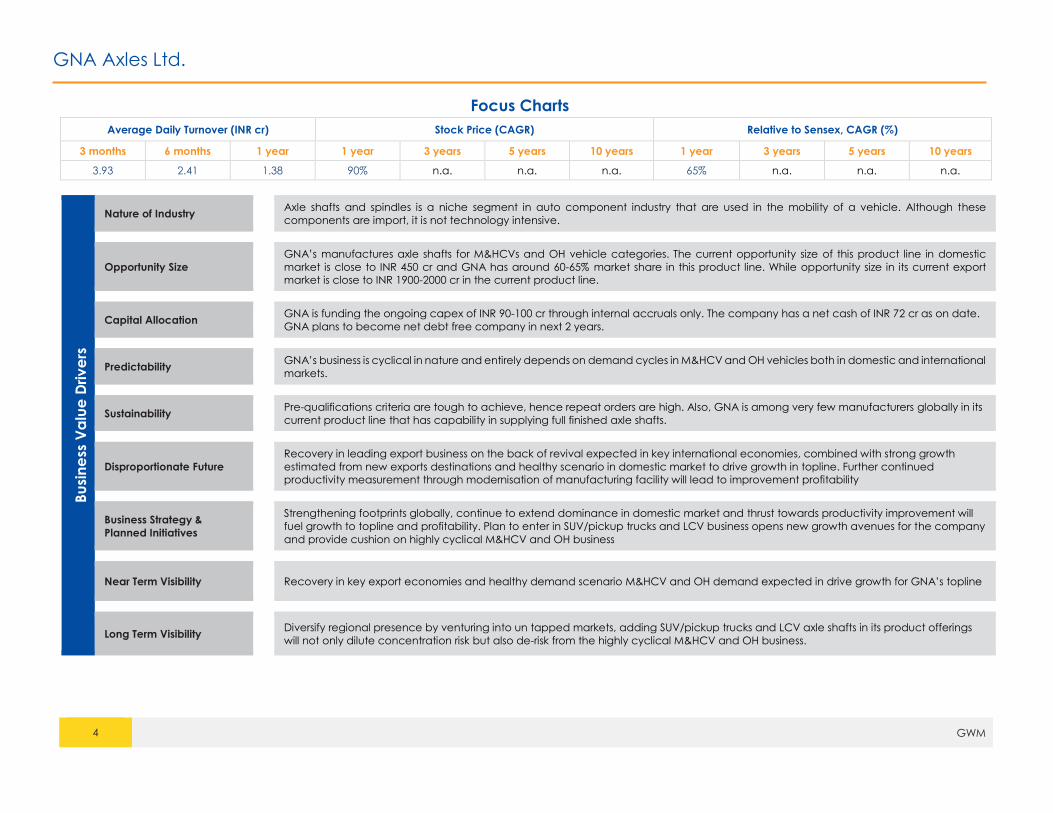
Focus Charts
Average Daily Turnover (INR cr) Stock Price (CAGR) Relative to Sensex, CAGR (%)
3 months 6 months 1 year 1 year 3 years 5 years 10 years 1 year 3 years 5 years 10 years
3.93 2.41 1.38 90% n.a. n.a. n.a. 65% n.a. n.a. n.a.
Bu
sin
ess
Va
lue
Driv
ers
Nature of Industry Axle shafts and spindles is a niche segment in auto component industry that are used in the mobility of a vehicle. Although these
components are import, it is not technology intensive.
Opportunity Size GNA’s manufactures axle shafts for M&HCVs and OH vehicle categories. The current opportunity size of this product line in domestic
market is close to INR 450 cr and GNA has around 60-65% market share in this product line. While opportunity size in its current export
market is close to INR 1900-2000 cr in the current product line.
Capital Allocation GNA is funding the ongoing capex of INR 90-100 cr through internal accruals only. The company has a net cash of INR 72 cr as on date.
GNA plans to become net debt free company in next 2 years.
Predictability GNA’s business is cyclical in nature and entirely depends on demand cycles in M&HCV and OH vehicles both in domestic and international
markets.
Sustainability Pre-qualifications criteria are tough to achieve, hence repeat orders are high. Also, GNA is among very few manufacturers globally in its
current product line that has capability in supplying full finished axle shafts.
Disproportionate Future Recovery in leading export business on the back of revival expected in key international economies, combined with strong growth
estimated from new exports destinations and healthy scenario in domestic market to drive growth in topline. Further continued
productivity measurement through modernisation of manufacturing facility will lead to improvement profitability
Business Strategy &
Planned Initiatives
Strengthening footprints globally, continue to extend dominance in domestic market and thrust towards productivity improvement will
fuel growth to topline and profitability. Plan to enter in SUV/pickup trucks and LCV business opens new growth avenues for the company
and provide cushion on highly cyclical M&HCV and OH business
Near Term Visibility Recovery in key export economies and healthy demand scenario M&HCV and OH demand expected in drive growth for GNA’s topline
Long Term Visibility Diversify regional presence by venturing into un tapped markets, adding SUV/pickup trucks and LCV axle shafts in its product offerings
will not only dilute concentration risk but also de-risk from the highly cyclical M&HCV and OH business.
GNA Axles Ltd.
5 GWM
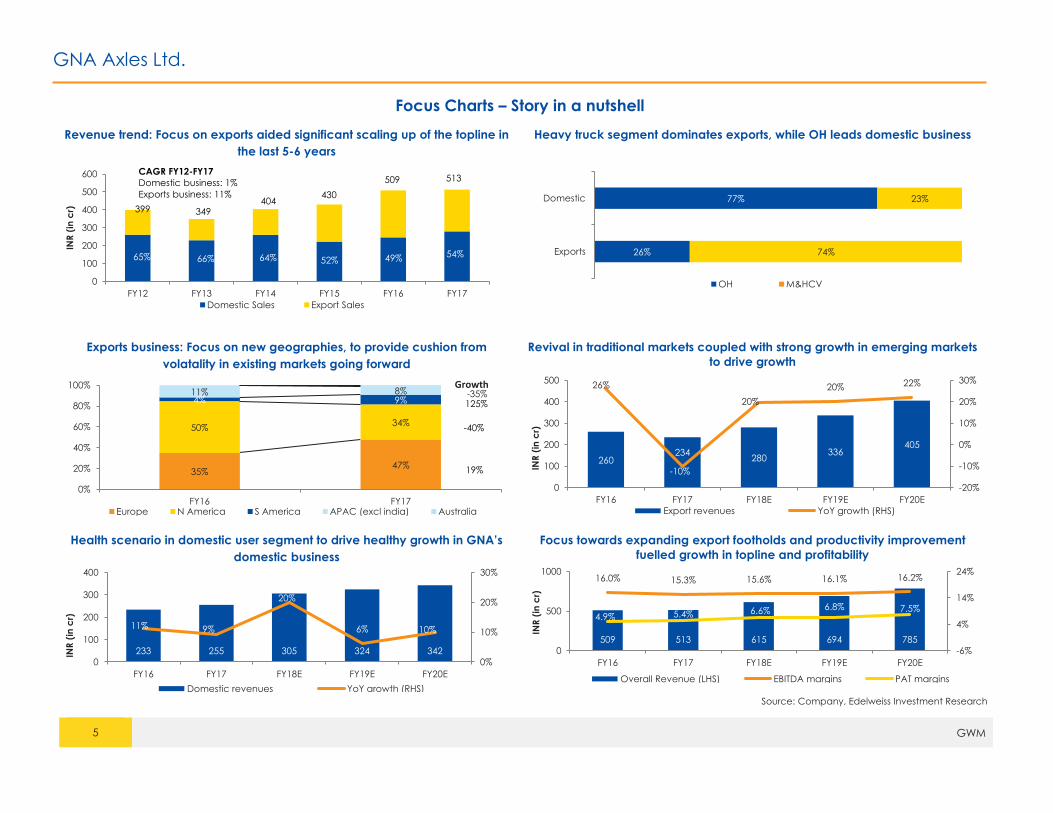
Focus Charts – Story in a nutshell
Revenue trend: Focus on exports aided significant scaling up of the topline in
the last 5-6 years
Heavy truck segment dominates exports, while OH leads domestic business
Exports business: Focus on new geographies, to provide cushion from
volatality in existing markets going forward
Revival in traditional markets coupled with strong growth in emerging markets
to drive growth
Health scenario in domestic user segment to drive healthy growth in GNA’s
domestic business
Focus towards expanding export footholds and productivity improvement
fuelled growth in topline and profitability
Source: Company, Edelweiss Investment Research
0
100
200
300
400
500
600
FY12 FY13 FY14 FY15 FY16 FY17
INR
(in
cr)
Domestic Sales Export Sales
399 349404
430
509 513
65% 66% 64% 52% 49% 54%
CAGR FY12-FY17
Domestic business: 1%
Exports business: 11%
26%
77%
74%
23%
Exports
Domestic
OH M&HCV
35%47%
50%34%
4% 9%11% 8%
0%
20%
40%
60%
80%
100%
FY16 FY17Europe N America S America APAC (excl india) Australia
19%
-40%
125%-35%
Growth
260234
280336
405
26%
-10%
20%
20% 22%
-20%
-10%
0%
10%
20%
30%
0
100
200
300
400
500
FY16 FY17 FY18E FY19E FY20E
INR
(in
cr)
Export revenues YoY growth (RHS)
233 255 305 324 342
11% 9%
20%
6% 10%
0%
10%
20%
30%
0
100
200
300
400
FY16 FY17 FY18E FY19E FY20E
INR
(in
cr)
Domestic revenues YoY growth (RHS)
509 513 615 694 785
16.0% 15.3% 15.6% 16.1% 16.2%
4.9% 5.4% 6.6% 6.8% 7.5%
-6%
4%
14%
24%
0
500
1000
FY16 FY17 FY18E FY19E FY20E
INR
(in
cr)
Overall Revenue (LHS) EBITDA margins PAT margins
GNA Axles Ltd.
6 GWM
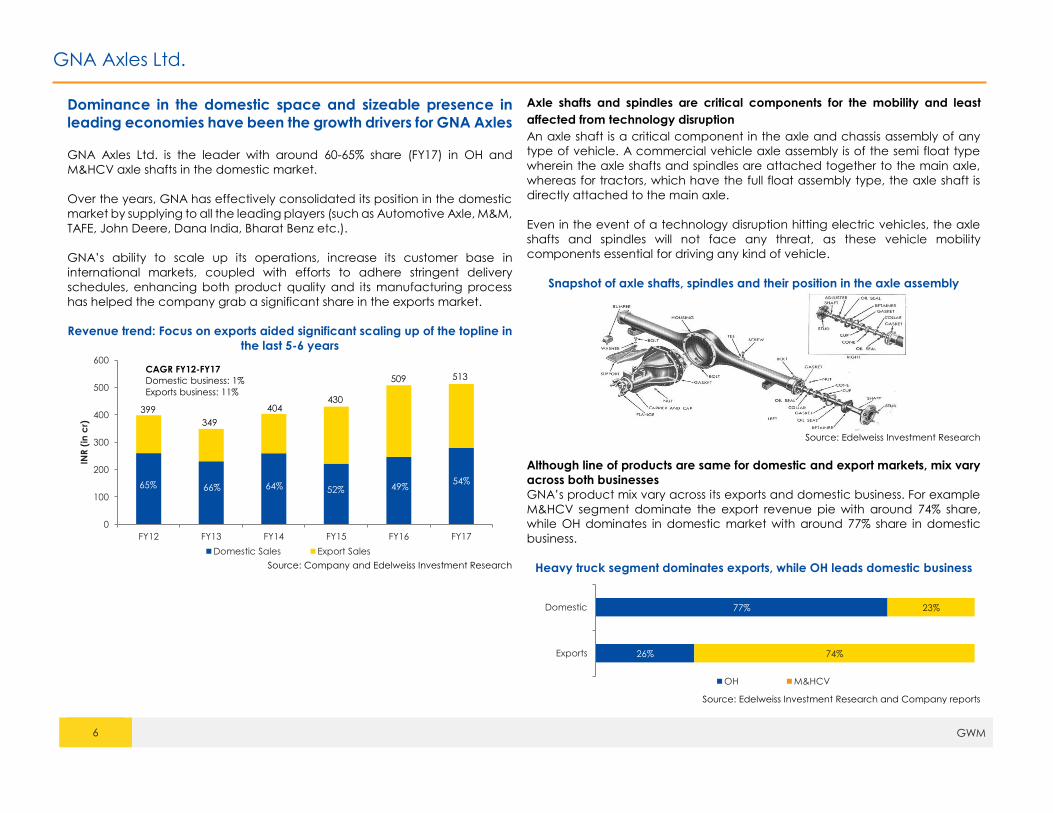
Dominance in the domestic space and sizeable presence in
leading economies have been the growth drivers for GNA Axles GNA Axles Ltd. is the leader with around 60-65% share (FY17) in OH and
M&HCV axle shafts in the domestic market.
Over the years, GNA has effectively consolidated its position in the domestic
market by supplying to all the leading players (such as Automotive Axle, M&M,
TAFE, John Deere, Dana India, Bharat Benz etc.).
GNA’s ability to scale up its operations, increase its customer base in
international markets, coupled with efforts to adhere stringent delivery
schedules, enhancing both product quality and its manufacturing process
has helped the company grab a significant share in the exports market.
Revenue trend: Focus on exports aided significant scaling up of the topline in
the last 5-6 years
Source: Company and Edelweiss Investment Research
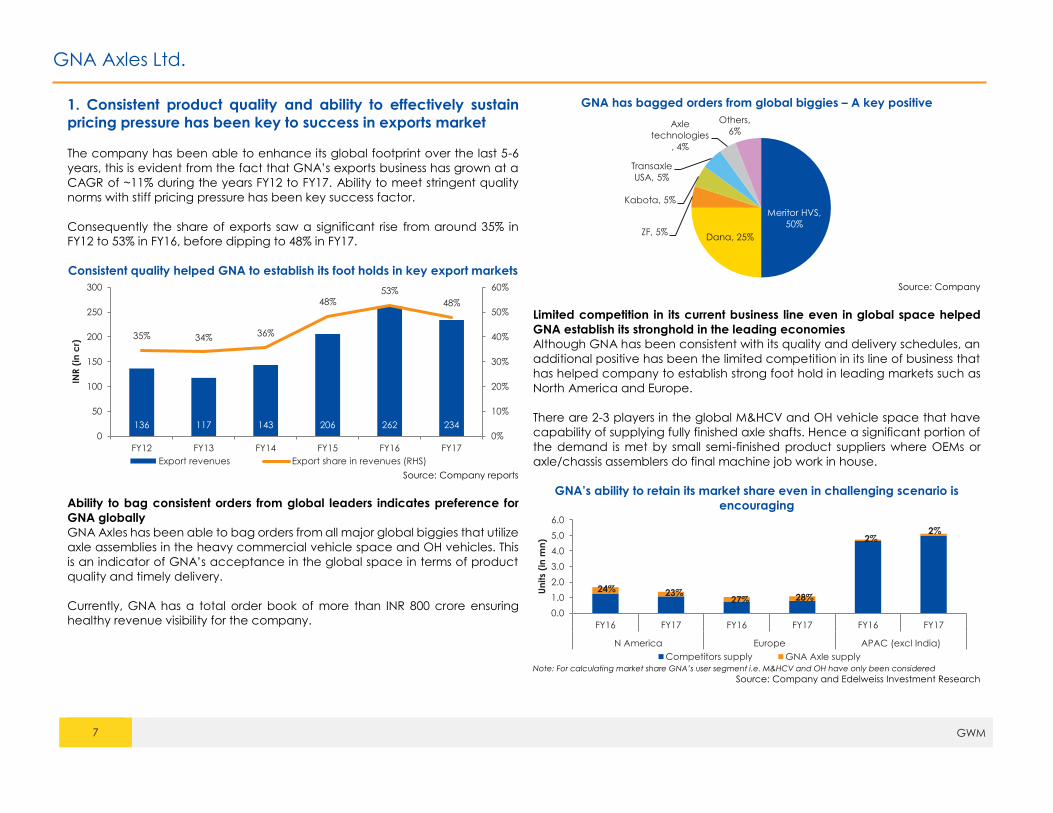
Axle shafts and spindles are critical components for the mobility and least
affected from technology disruption
An axle shaft is a critical component in the axle and chassis assembly of any
type of vehicle. A commercial vehicle axle assembly is of the semi float type
wherein the axle shafts and spindles are attached together to the main axle,
whereas for tractors, which have the full float assembly type, the axle shaft is
directly attached to the main axle.
Even in the event of a technology disruption hitting electric vehicles, the axle
shafts and spindles will not face any threat, as these vehicle mobility
components essential for driving any kind of vehicle.
Snapshot of axle shafts, spindles and their position in the axle assembly
Source: Edelweiss Investment Research
Although line of products are same for domestic and export markets, mix vary
across both businesses
GNA’s product mix vary across its exports and domestic business. For example
M&HCV segment dominate the export revenue pie with around 74% share,
while OH dominates in domestic market with around 77% share in domestic
business.
Heavy truck segment dominates exports, while OH leads domestic business
Source: Edelweiss Investment Research and Company reports
0
100
200
300
400
500
600
FY12 FY13 FY14 FY15 FY16 FY17
INR
(in
cr)
Domestic Sales Export Sales
399
349
404430
509 513
65% 66% 64% 52% 49%54%
CAGR FY12-FY17
Domestic business: 1%
Exports business: 11%
26%
77%
74%
23%
Exports
Domestic
OH M&HCV
GNA Axles Ltd.
7 GWM
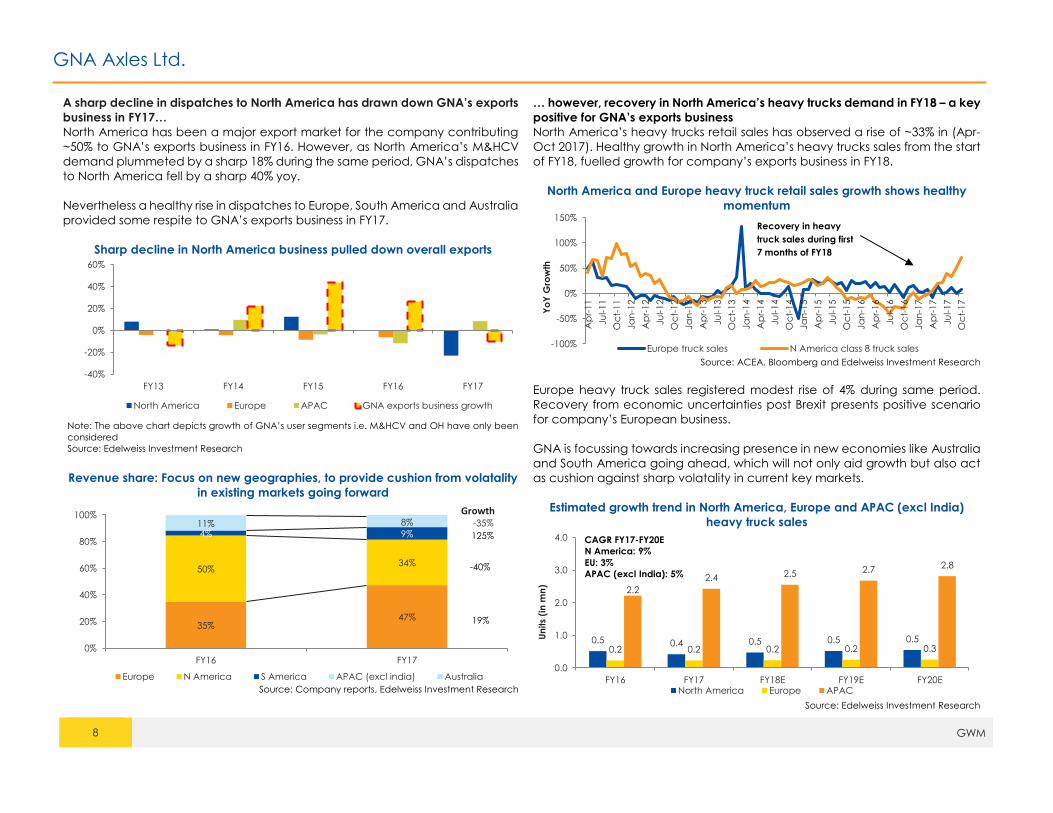
1. Consistent product quality and ability to effectively sustain
pricing pressure has been key to success in exports market
The company has been able to enhance its global footprint over the last 5-6
years, this is evident from the fact that GNA’s exports business has grown at a
CAGR of ~11% during the years FY12 to FY17. Ability to meet stringent quality
norms with stiff pricing pressure has been key success factor.
Consequently the share of exports saw a significant rise from around 35% in
FY12 to 53% in FY16, before dipping to 48% in FY17.
Consistent quality helped GNA to establish its foot holds in key export markets
Source: Company reports
Ability to bag consistent orders from global leaders indicates preference for
GNA globally
GNA Axles has been able to bag orders from all major global biggies that utilize
axle assemblies in the heavy commercial vehicle space and OH vehicles. This
is an indicator of GNA’s acceptance in the global space in terms of product
quality and timely delivery.
Currently, GNA has a total order book of more than INR 800 crore ensuring
healthy revenue visibility for the company.
GNA has bagged orders from global biggies – A key positive
Source: Company
Limited competition in its current business line even in global space helped
GNA establish its stronghold in the leading economies
Although GNA has been consistent with its quality and delivery schedules, an
additional positive has been the limited competition in its line of business that
has helped company to establish strong foot hold in leading markets such as
North America and Europe.
There are 2-3 players in the global M&HCV and OH vehicle space that have
capability of supplying fully finished axle shafts. Hence a significant portion of
the demand is met by small semi-finished product suppliers where OEMs or
axle/chassis assemblers do final machine job work in house.
GNA’s ability to retain its market share even in challenging scenario is
encouraging
Note: For calculating market share GNA’s user segment i.e. M&HCV and OH have only been considered
Source: Company and Edelweiss Investment Research
136 117 143 206 262 234
35% 34%36%
48%53%
48%
0%
10%
20%
30%
40%
50%
60%
0
50
100
150
200
250
300
FY12 FY13 FY14 FY15 FY16 FY17
INR
(in
cr)
Export revenues Export share in revenues (RHS)
Meritor HVS,
50%
Dana, 25%ZF, 5%
Kabota, 5%
Transaxle
USA, 5%
Axle
technologies
, 4%
Others,
6%
0.0
1.0
2.0
3.0
4.0
5.0
6.0
FY16 FY17 FY16 FY17 FY16 FY17
N America Europe APAC (excl India)
Un
its
(in
mn
)
Competitors supply GNA Axle supply
24% 23%27% 28%
2%2%
GNA Axles Ltd.
8 GWM
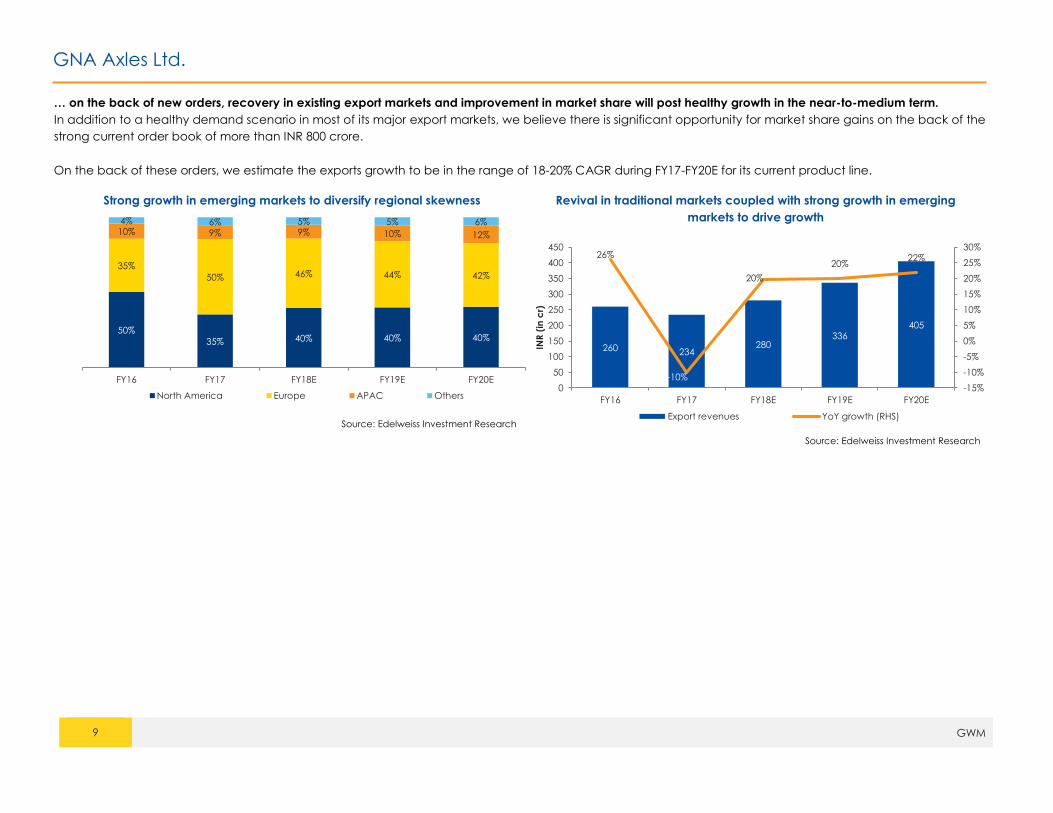
A sharp decline in dispatches to North America has drawn down GNA’s exports
business in FY17…
North America has been a major export market for the company contributing
~50% to GNA’s exports business in FY16. However, as North America’s M&HCV
demand plummeted by a sharp 18% during the same period, GNA’s dispatches
to North America fell by a sharp 40% yoy.
Nevertheless a healthy rise in dispatches to Europe, South America and Australia
provided some respite to GNA’s exports business in FY17.
Sharp decline in North America business pulled down overall exports
Note: The above chart depicts growth of GNA’s user segments i.e. M&HCV and OH have only been
considered
Source: Edelweiss Investment Research
Revenue share: Focus on new geographies, to provide cushion from volatality
in existing markets going forward
Source: Company reports, Edelweiss Investment Research
… however, recovery in North America’s heavy trucks demand in FY18 – a key
positive for GNA’s exports business
North America’s heavy trucks retail sales has observed a rise of ~33% in (Apr-
Oct 2017). Healthy growth in North America’s heavy trucks sales from the start
of FY18, fuelled growth for company’s exports business in FY18.
North America and Europe heavy truck retail sales growth shows healthy
momentum
Source: ACEA, Bloomberg and Edelweiss Investment Research
Europe heavy truck sales registered modest rise of 4% during same period.
Recovery from economic uncertainties post Brexit presents positive scenario
for company’s European business.
GNA is focussing towards increasing presence in new economies like Australia
and South America going ahead, which will not only aid growth but also act
as cushion against sharp volatality in current key markets.
Estimated growth trend in North America, Europe and APAC (excl India)
heavy truck sales
Source: Edelweiss Investment Research
-40%
-20%
0%
20%
40%
60%
FY13 FY14 FY15 FY16 FY17
North America Europe APAC GNA exports business growth
35%47%
50%34%
4% 9%11% 8%
0%
20%
40%
60%
80%
100%
FY16 FY17
Europe N America S America APAC (excl india) Australia
19%
-40%
125%
-35%
Growth
-100%
-50%
0%
50%
100%
150%
Ap
r-11
Ju
l-11
Oc
t-11
Ja
n-1
2
Ap
r-12
Ju
l-12
Oc
t-12
Ja
n-1
3
Ap
r-13
Ju
l-13
Oc
t-13
Ja
n-1
4
Ap
r-14
Ju
l-14
Oc
t-14
Ja
n-1
5
Ap
r-15
Ju
l-15
Oc
t-15
Ja
n-1
6
Ap
r-16
Ju
l-16
Oc
t-16
Ja
n-1
7
Ap
r-17
Ju
l-17
Oc
t-17
Yo
Y G
row
th
Europe truck sales N America class 8 truck sales
0.5 0.4 0.5 0.5 0.50.2 0.2 0.2 0.2 0.3
2.2
2.4 2.5 2.7 2.8
0.0
1.0
2.0
3.0
4.0
FY16 FY17 FY18E FY19E FY20E
Un
its
(in
mn
)
North America Europe APAC
CAGR FY17-FY20E
N America: 9%
EU: 3%
APAC (excl India): 5%
Recovery in heavy
truck sales during first
7 months of FY18
GNA Axles Ltd.
9 GWM
… on the back of new orders, recovery in existing export markets and improvement in market share will post healthy growth in the near-to-medium term.
In addition to a healthy demand scenario in most of its major export markets, we believe there is significant opportunity for market share gains on the back of the
strong current order book of more than INR 800 crore.
On the back of these orders, we estimate the exports growth to be in the range of 18-20% CAGR during FY17-FY20E for its current product line.
Strong growth in emerging markets to diversify regional skewness
Source: Edelweiss Investment Research
Revival in traditional markets coupled with strong growth in emerging
markets to drive growth
Source: Edelweiss Investment Research
50%
35% 40% 40% 40%
35%
50% 46% 44% 42%
10% 9% 9% 10% 12%
4% 6% 5% 5% 6%
FY16 FY17 FY18E FY19E FY20E
North America Europe APAC Others
260 234280
336405
26%
-10%
20%
20%22%
-15%
-10%
-5%
0%
5%
10%
15%
20%
25%
30%
0
50
100
150
200
250
300
350
400
450
FY16 FY17 FY18E FY19E FY20E
INR
(in
cr)
Export revenues YoY growth (RHS)
GNA Axles Ltd.
10 GWM
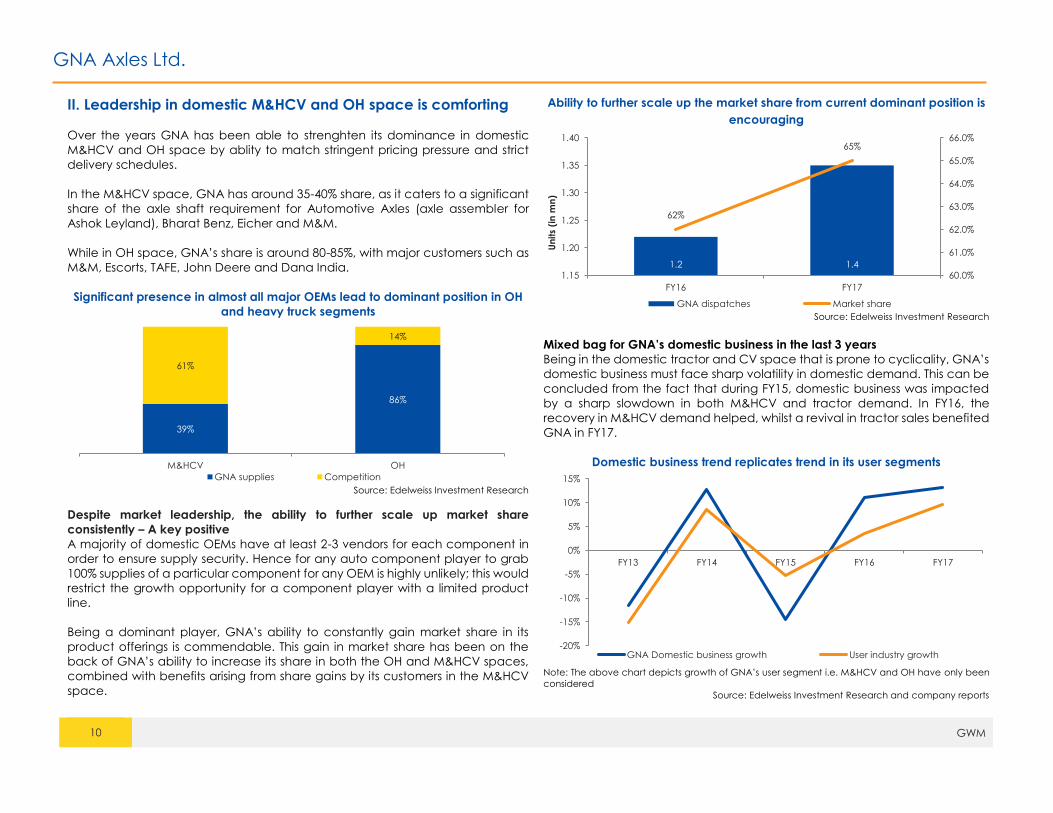
II. Leadership in domestic M&HCV and OH space is comforting
Over the years GNA has been able to strenghten its dominance in domestic
M&HCV and OH space by ablity to match stringent pricing pressure and strict
delivery schedules.
In the M&HCV space, GNA has around 35-40% share, as it caters to a significant
share of the axle shaft requirement for Automotive Axles (axle assembler for
Ashok Leyland), Bharat Benz, Eicher and M&M.
While in OH space, GNA’s share is around 80-85%, with major customers such as
M&M, Escorts, TAFE, John Deere and Dana India.
Significant presence in almost all major OEMs lead to dominant position in OH
and heavy truck segments
Source: Edelweiss Investment Research
Despite market leadership, the ability to further scale up market share
consistently – A key positive
A majority of domestic OEMs have at least 2-3 vendors for each component in
order to ensure supply security. Hence for any auto component player to grab
100% supplies of a particular component for any OEM is highly unlikely; this would
restrict the growth opportunity for a component player with a limited product
line.
Being a dominant player, GNA’s ability to constantly gain market share in its
product offerings is commendable. This gain in market share has been on the
back of GNA’s ability to increase its share in both the OH and M&HCV spaces,
combined with benefits arising from share gains by its customers in the M&HCV
space.
Ability to further scale up the market share from current dominant position is
encouraging
Source: Edelweiss Investment Research
Mixed bag for GNA’s domestic business in the last 3 years
Being in the domestic tractor and CV space that is prone to cyclicality, GNA’s
domestic business must face sharp volatility in domestic demand. This can be
concluded from the fact that during FY15, domestic business was impacted
by a sharp slowdown in both M&HCV and tractor demand. In FY16, the
recovery in M&HCV demand helped, whilst a revival in tractor sales benefited
GNA in FY17.
Domestic business trend replicates trend in its user segments
Note: The above chart depicts growth of GNA’s user segment i.e. M&HCV and OH have only been
considered
Source: Edelweiss Investment Research and company reports
39%
86%
61%
14%
M&HCV OH
GNA supplies Competition
1.2 1.4
62%
65%
60.0%
61.0%
62.0%
63.0%
64.0%
65.0%
66.0%
1.15
1.20
1.25
1.30
1.35
1.40
FY16 FY17
Un
its
(in
mn
)
GNA dispatches Market share
-20%
-15%
-10%
-5%
0%
5%
10%
15%
FY13 FY14 FY15 FY16 FY17
GNA Domestic business growth User industry growth

GNA Axles Ltd.
11 GWM
Ability to scale up its market share coupled with healthy trend in user industry
fuelled growth during last two fiscals
Source: Edelweiss Investment Research and company reports
Expectation of an improving domestic market scenario could result in better
near-term prospects
After a slump in Q1FY18, domestic CV demand recovered in Q2FY18. We
estimate H2FY18 to be better than previous year because of the advantage of
the lower base created by sharp drop in demand due to demonetization
annoucement during same period last year. Further FY19 is expected to be a
healthy growth period for the M&HCV sales.
Healthy growth momentum in domestic tractor sales have been key driver for
company’s domestic business during last two fiscals. Further company has been
able to bag new orders in this segment in the Q2FY18, that assures significant
positivities.
Going ahead we estimate, FY19E is expected to observe modest growth
scenario for tractor demand; however healthy M&HCV sales and company’s
ability to gain market share will continue to drive healthy growth for domestic
business.
Riding on buoyancy in the user industry, we estimate domestic business to
grow in the range of around 10-11% over FY17-FY19E for GNA’s current product
line.
Healthy scenario estimated in near to medium term in key user segments…
Source: Edelweiss Investment Research
…to drive healthy growth in GNA’s domestic business
Source: Edelweiss Investment Research
231 260 222 247 279
-12%
13%
-14%
11%13%
-20%
-15%
-10%
-5%
0%
5%
10%
15%
0
50
100
150
200
250
300
FY13 FY14 FY15 FY16 FY17
INR
(in
cr)
Domestic Sales YoY growth (RHS)
0.60.7
0.70.7
0.8
0.3 0.3 0.40.4
0.5
FY16 FY17 FY18E FY19E FY20E
Un
its
(in
mn
)
Tractor production M&HCV production
CAGR FY17-FY20E
M&HCV: 10-12%
Tractor: 5-7%
233 255 305 324 342
11%
9%
20%
6%
10%
0%
5%
10%
15%
20%
25%
0
50
100
150
200
250
300
350
400
FY16 FY17 FY18E FY19E FY20E
INR
(in
cr)
Domestic revenues YoY growth (RHS)
GNA Axles Ltd.
12 GWM
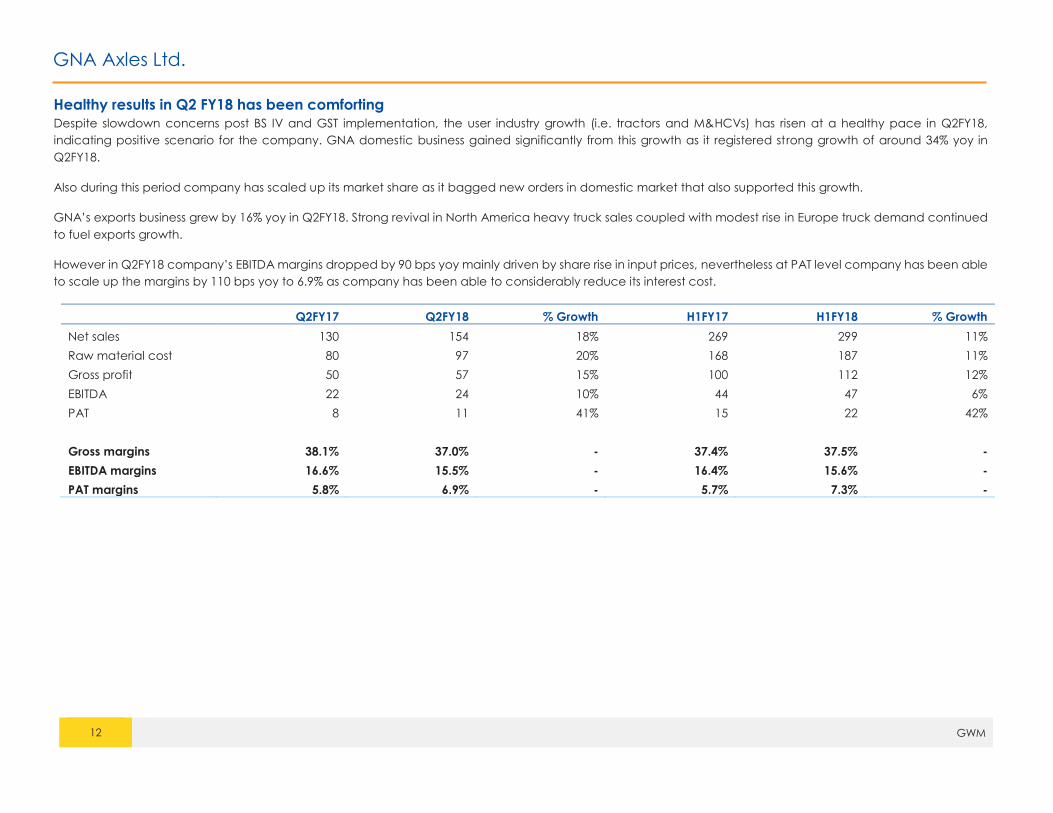
Healthy results in Q2 FY18 has been comforting
Despite slowdown concerns post BS IV and GST implementation, the user industry growth (i.e. tractors and M&HCVs) has risen at a healthy pace in Q2FY18,
indicating positive scenario for the company. GNA domestic business gained significantly from this growth as it registered strong growth of around 34% yoy in
Q2FY18.
Also during this period company has scaled up its market share as it bagged new orders in domestic market that also supported this growth.
GNA’s exports business grew by 16% yoy in Q2FY18. Strong revival in North America heavy truck sales coupled with modest rise in Europe truck demand continued
to fuel exports growth.
However in Q2FY18 company’s EBITDA margins dropped by 90 bps yoy mainly driven by share rise in input prices, nevertheless at PAT level company has been able
to scale up the margins by 110 bps yoy to 6.9% as company has been able to considerably reduce its interest cost.
Q2FY17 Q2FY18 % Growth H1FY17 H1FY18 % Growth
Net sales 130 154 18% 269 299 11%
Raw material cost 80 97 20% 168 187 11%
Gross profit 50 57 15% 100 112 12%
EBITDA 22 24 10% 44 47 6%
PAT 8 11 41% 15 22 42%
Gross margins 38.1% 37.0% - 37.4% 37.5% -
EBITDA margins 16.6% 15.5% - 16.4% 15.6% -
PAT margins 5.8% 6.9% - 5.7% 7.3% -

GNA Axles Ltd.
13 GWM
III. Initiative to enter less cyclical SUV/LCV business – A strategy in right direction
GNA has plans to enter the SUV/pick-up truck axle and LCV shaft business by FY20E. We believe this initiative will help reduce the risk of cyclicality in the CV and
OH businesses.
In the domestic market GNA will be able to cater to bigger SUVs and small commercial vehicles (SCVs), whereas in the export market, it has plans to cater to SUVs
and the pick-up truck industry. Entering into a new product line will help GNA to not only diversify its existing clientele but also to provide the company access to a
much wider market versus the existing business line.
Domestic market: Estimated size of potential market is more than the existing product line, which presents significant growth opporunity for GNA
Source: Edelweiss Investment Research and company reports
Estimated addition to domestic topline, depending on target rise in market share
Domestic SUV/LCV axle shaft market is 30% larger than the size of current
product line of GNA axle.
Even if company is able to grab 5% market share in this product line, the
additional upside from this initiative to the domestic topline will be close
to 8-10%.
Note: The market sizing estimation is done on FY17 domestic sales data of MUVs and LCVs
Source: Edelweiss Investment Research and company reports
1.71.9 1.8 1.8
2.02.2
2.0 2.02.2
2.6
FY13 FY14 FY15 FY16 FY17
Un
its
(in
mn
)
Current M&HCV/OH shaft market Potential SUV/LCV shaft market
CAGR FY13-FY17
M&HCV/Tractors: 4%
SUV/LCV: 5%
25-30 cr
85-90 cr
100-120 cr
Estimated revenue based on target market share
INR
(in
cr)
5 percent 15 percent 20 percentTarget market share ------------------>
5% mkt share
15% mkt share
20% mkt share
GNA Axles Ltd.
14 GWM
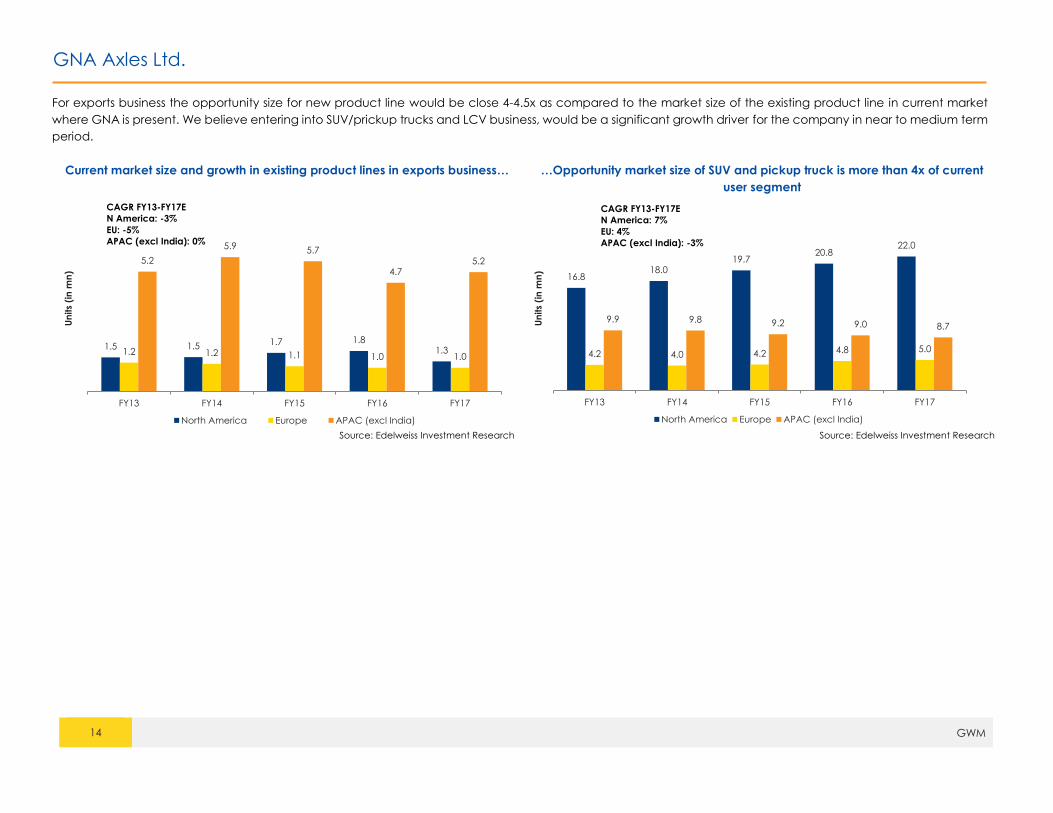
For exports business the opportunity size for new product line would be close 4-4.5x as compared to the market size of the existing product line in current market
where GNA is present. We believe entering into SUV/prickup trucks and LCV business, would be a significant growth driver for the company in near to medium term
period.
Current market size and growth in existing product lines in exports business… …Opportunity market size of SUV and pickup truck is more than 4x of current
user segment
Source: Edelweiss Investment Research Source: Edelweiss Investment Research
1.5 1.5 1.7 1.81.31.2 1.2 1.1 1.0 1.0
5.2
5.9 5.7
4.75.2
FY13 FY14 FY15 FY16 FY17
Un
its
(in
mn
)
North America Europe APAC (excl India)
CAGR FY13-FY17E
N America: -3%
EU: -5%
APAC (excl India): 0%
16.818.0
19.720.8
22.0
4.2 4.0 4.2 4.8 5.0
9.9 9.8 9.2 9.0 8.7
FY13 FY14 FY15 FY16 FY17
Un
its
(in
mn
)
North America Europe APAC (excl India)
CAGR FY13-FY17E
N America: 7%
EU: 4%
APAC (excl India): -3%

GNA Axles Ltd.
15 GWM
IV. Healthy order book, focus on productivity improvement and
limited capex will spur growth in both topline growth and margins GNA has been able to maintain a healthy order book on the back of its ability
to bag new orders from global leaders. Currently the order book size of GNA is
more than INR 800 crore — approximately 1.4x its revenue, thereby ensuring
healthy revenue visibility in the near term.
Focus on improving productivity will lead to further profitability enhancement
Overall, in the last 4-5 years GNA Axles has taken various productivity
improvement measures such as increasing automation in the production
process, using electricity instead of furnace oil or diesel, which has resulted in
substantial cost savings in the past.
Going forward as well, the company plans to increase automation across its
different facilities, which will lead to further reduction in labour cost as well as
minimize raw material wastage.
For instance GNA has been able to reduce labour cost by almost 10-15% in one
of its automated forging plants compared with its older manually operated unit.
Focus towards expanding export footholds and productivity improvement
fuelled growth in topline and profitability
Source: Edelweiss Investment Research
FY17 has been challenging for GNA; impacted mainly by a sharp drop in the
export business
Challenging market conditions for the North American heavy truck industry
has significantly impacted the company’s exports business which slid by ~11%
in FY17. The last two quarters (Q3 and Q4 FY17) have been particularly
concerning as GNA’s topline has shrunk by 4% and 5% respectively.
However despite the pressure on topline and rise in input prices GNA has been
able to maintain its EBITDA margin in FY17, while PAT margin improved by ~100
bps yoy to 5.9% on the back of reduced interest cost as the company has
drawn down its debt level.
Despite decent capex, healthy profitability to drive improvement in ROCE and
debt equity
GNA’s plans capex of INR 90-100 cr for next 2 years, mainly towards increasing
the manufacturing capacity of its existing plant from 3 mn to 4 mn units,
automation of existing facility and setting up unit for SUVs axle shafts.
The company will be able to fund this through the remaining IPO proceeds
and internal accruals.
Healthy profitability and low reliance of debt to fund capex is ROCE
accretive
Source: Edelweiss Investment Research
509 513 612 691 785
16.0% 15.3% 15.6% 16.1% 16.2%
4.9% 5.4%6.6% 6.8% 7.5%
-4%
0%
4%
8%
12%
16%
20%
24%
0
200
400
600
800
1000
FY16 FY17 FY18E FY19E FY20E
INR
(in
cr)
Overall Revenue (LHS) EBITDA margins PAT margins 15.2 7.8 70.0 35.0 35.0
FY16 FY17 FY18E FY19E FY20E
INR
(in
cr)
20%19% 18%
19%
21%0.9
0.40
0.22
0.11
0.03
0.0
0.2
0.4
0.6
0.8
1.0
0%
5%
10%
15%
20%
25%
FY16 FY17 FY18E FY19E FY20E
tim
es
RoCE (adj for CWIP and cash)
Debt Equity (RHS)
GNA Axles Ltd.
16 GWM
V. Valuation
With visible signs of improvement for its export business and with the domestic market estimated to remain buoyant in expectation of healthy infrastructure spending
by the government, the company’s topline is likely to head north in near-to-medium term.
Further, introduction of new SUV and LCV offerings in the next two years will likely be topline and margin accretive for the company in the medium–to-long term
period.
For the near-to-medium term, we forecast improvement in EBITDA margins to 15.6%, 16.1% and 16.3% for FY18E, FY19E and FY20E from 15.3% in FY17, and ROCE to
18.0%, 19.0% and 21.3% in FY18E, FY19E and FY20E respectively from 18.7% in FY17.
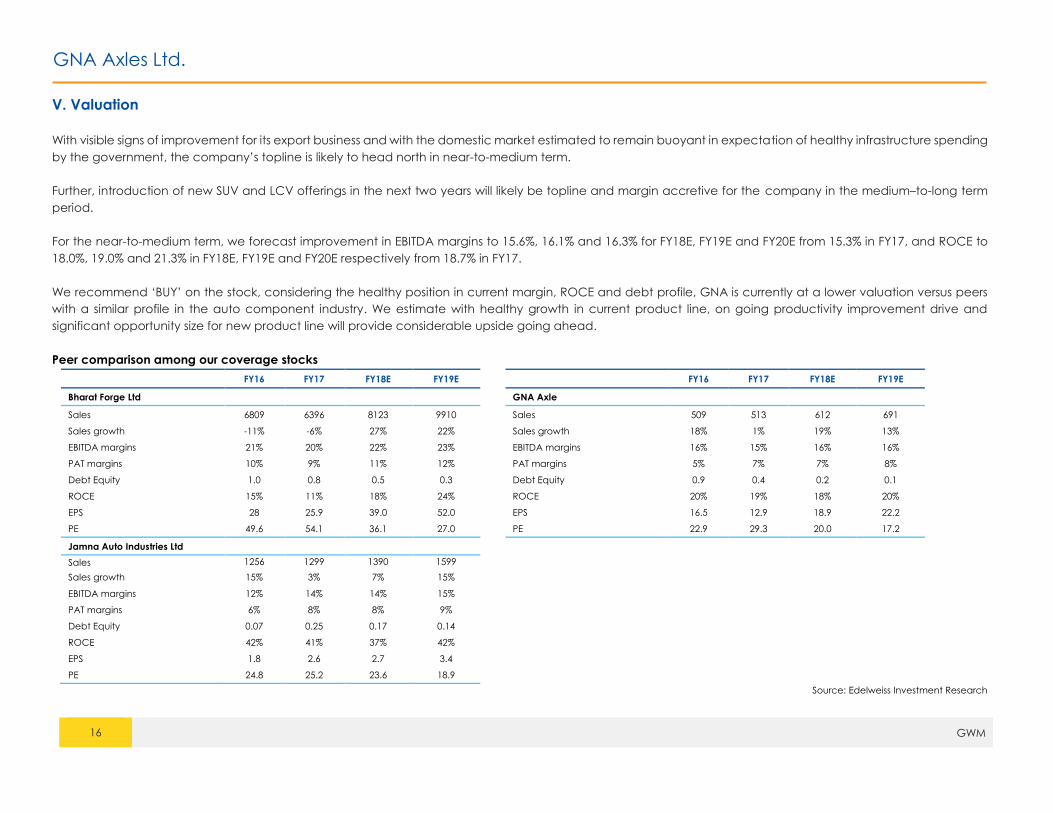
We recommend ‘BUY’ on the stock, considering the healthy position in current margin, ROCE and debt profile, GNA is currently at a lower valuation versus peers
with a similar profile in the auto component industry. We estimate with healthy growth in current product line, on going productivity improvement drive and
significant opportunity size for new product line will provide considerable upside going ahead.
Peer comparison among our coverage stocks
FY16 FY17 FY18E FY19E
FY16 FY17 FY18E FY19E
Bharat Forge Ltd
GNA Axle
Sales 6809 6396 8123 9910
Sales 509 513 612 691
Sales growth -11% -6% 27% 22%
Sales growth 18% 1% 19% 13%
EBITDA margins 21% 20% 22% 23%
EBITDA margins 16% 15% 16% 16%
PAT margins 10% 9% 11% 12%
PAT margins 5% 7% 7% 8%
Debt Equity 1.0 0.8 0.5 0.3
Debt Equity 0.9 0.4 0.2 0.1
ROCE 15% 11% 18% 24%
ROCE 20% 19% 18% 20%
EPS 28 25.9 39.0 52.0
EPS 16.5 12.9 18.9 22.2
PE 49.6 54.1 36.1 27.0
PE 22.9 29.3 20.0 17.2
Jamna Auto Industries Ltd
Sales 1256 1299 1390 1599
Sales growth 15% 3% 7% 15%
EBITDA margins 12% 14% 14% 15%
PAT margins 6% 8% 8% 9%
Debt Equity 0.07 0.25 0.17 0.14
ROCE 42% 41% 37% 42%
EPS 1.8 2.6 2.7 3.4
PE 24.8 25.2 23.6 18.9
Source: Edelweiss Investment Research
GNA Axles Ltd.
17 GWM
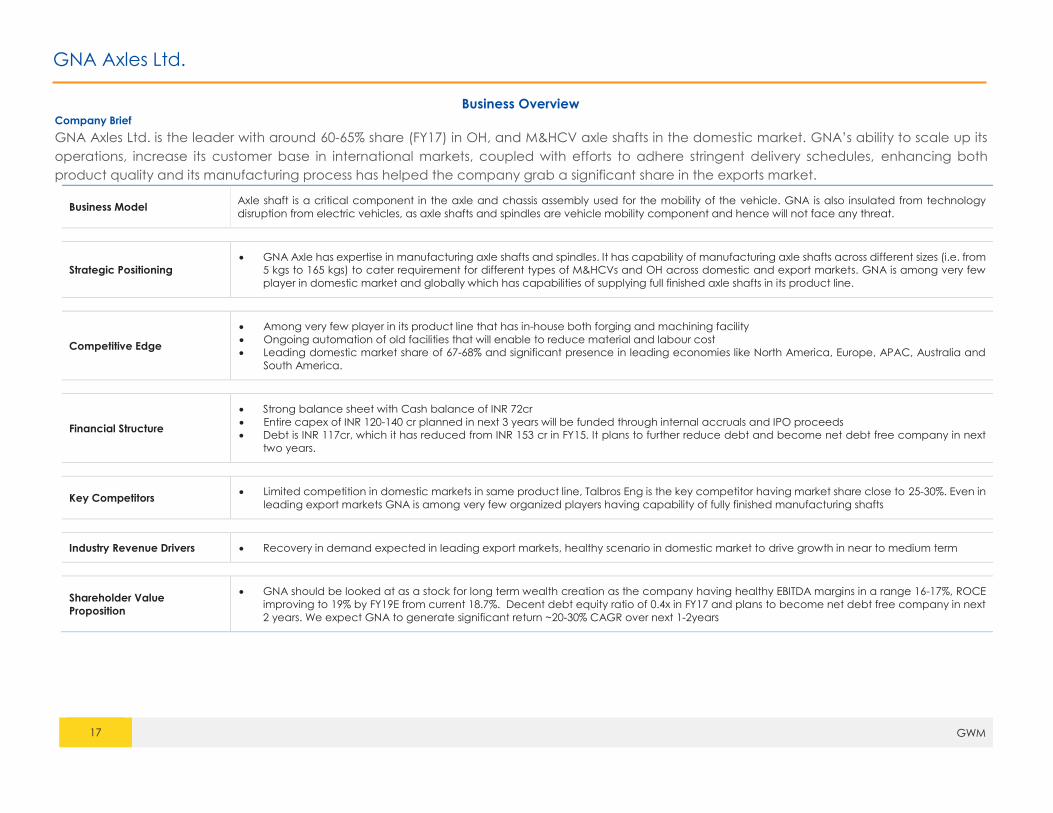
Business Overview Company Brief
GNA Axles Ltd. is the leader with around 60-65% share (FY17) in OH, and M&HCV axle shafts in the domestic market. GNA’s ability to scale up its
operations, increase its customer base in international markets, coupled with efforts to adhere stringent delivery schedules, enhancing both
product quality and its manufacturing process has helped the company grab a significant share in the exports market.
Business Model Axle shaft is a critical component in the axle and chassis assembly used for the mobility of the vehicle. GNA is also insulated from technology
disruption from electric vehicles, as axle shafts and spindles are vehicle mobility component and hence will not face any threat.
Strategic Positioning
GNA Axle has expertise in manufacturing axle shafts and spindles. It has capability of manufacturing axle shafts across different sizes (i.e. from
5 kgs to 165 kgs) to cater requirement for different types of M&HCVs and OH across domestic and export markets. GNA is among very few
player in domestic market and globally which has capabilities of supplying full finished axle shafts in its product line.
Competitive Edge
Among very few player in its product line that has in-house both forging and machining facility
Ongoing automation of old facilities that will enable to reduce material and labour cost
Leading domestic market share of 67-68% and significant presence in leading economies like North America, Europe, APAC, Australia and
South America.
Financial Structure
Strong balance sheet with Cash balance of INR 72cr
Entire capex of INR 120-140 cr planned in next 3 years will be funded through internal accruals and IPO proceeds
Debt is INR 117cr, which it has reduced from INR 153 cr in FY15. It plans to further reduce debt and become net debt free company in next
two years.
Key Competitors Limited competition in domestic markets in same product line, Talbros Eng is the key competitor having market share close to 25-30%. Even in
leading export markets GNA is among very few organized players having capability of fully finished manufacturing shafts
Industry Revenue Drivers Recovery in demand expected in leading export markets, healthy scenario in domestic market to drive growth in near to medium term
Shareholder Value
Proposition
GNA should be looked at as a stock for long term wealth creation as the company having healthy EBITDA margins in a range 16-17%, ROCE
improving to 19% by FY19E from current 18.7%. Decent debt equity ratio of 0.4x in FY17 and plans to become net debt free company in next
2 years. We expect GNA to generate significant return ~20-30% CAGR over next 1-2years
GNA Axles Ltd.
18 GWM
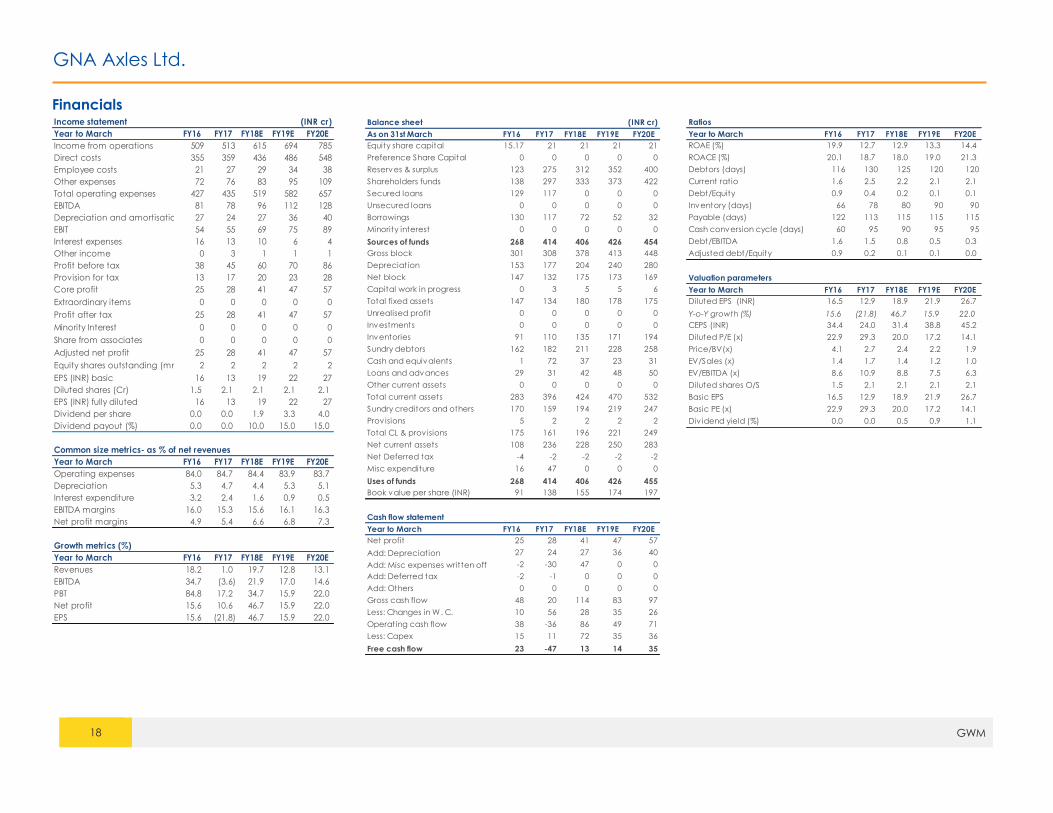
Financials
Income statement (INR cr)
Year to March FY16 FY17 FY18E FY19E FY20E
Income from operations 509 513 615 694 785
Direct costs 355 359 436 486 548
Employee costs 21 27 29 34 38
Other expenses 72 76 83 95 109
Total operating expenses 427 435 519 582 657
EBITDA 81 78 96 112 128
Depreciation and amortisation 27 24 27 36 40
EBIT 54 55 69 75 89
Interest expenses 16 13 10 6 4
Other income 0 3 1 1 1
Profit before tax 38 45 60 70 86
Provision for tax 13 17 20 23 28
Core profit 25 28 41 47 57
Extraordinary items 0 0 0 0 0
Profit after tax 25 28 41 47 57
Minority Interest 0 0 0 0 0
Share from associates 0 0 0 0 0
Adjusted net profit 25 28 41 47 57
Equity shares outstanding (mn) 2 2 2 2 2
EPS (INR) basic 16 13 19 22 27
Diluted shares (Cr) 1.5 2.1 2.1 2.1 2.1
EPS (INR) fully diluted 16 13 19 22 27
Dividend per share 0.0 0.0 1.9 3.3 4.0
Dividend payout (%) 0.0 0.0 10.0 15.0 15.0
Common size metrics- as % of net revenues
Year to March FY16 FY17 FY18E FY19E FY20E
Operating expenses 84.0 84.7 84.4 83.9 83.7
Depreciation 5.3 4.7 4.4 5.3 5.1
Interest expenditure 3.2 2.4 1.6 0.9 0.5
EBITDA margins 16.0 15.3 15.6 16.1 16.3
Net profit margins 4.9 5.4 6.6 6.8 7.3
Growth metrics (%)
Year to March FY16 FY17 FY18E FY19E FY20E
Revenues 18.2 1.0 19.7 12.8 13.1
EBITDA 34.7 (3.6) 21.9 17.0 14.6
PBT 84.8 17.2 34.7 15.9 22.0
Net profit 15.6 10.6 46.7 15.9 22.0
EPS 15.6 (21.8) 46.7 15.9 22.0
Ratios
Year to March FY16 FY17 FY18E FY19E FY20E
ROAE (%) 19.9 12.7 12.9 13.3 14.4
ROACE (%) 20.1 18.7 18.0 19.0 21.3
Debtors (days) 116 130 125 120 120
Current ratio 1.6 2.5 2.2 2.1 2.1
Debt/Equity 0.9 0.4 0.2 0.1 0.1
Inventory (days) 66 78 80 90 90
Payable (days) 122 113 115 115 115
Cash conversion cycle (days) 60 95 90 95 95
Debt/EBITDA 1.6 1.5 0.8 0.5 0.3
Adjusted debt/Equity 0.9 0.2 0.1 0.1 0.0
Valuation parameters
Year to March FY16 FY17 FY18E FY19E FY20E
Diluted EPS (INR) 16.5 12.9 18.9 21.9 26.7
Y-o-Y growth (%) 15.6 (21.8) 46.7 15.9 22.0
CEPS (INR) 34.4 24.0 31.4 38.8 45.2
Diluted P/E (x) 22.9 29.3 20.0 17.2 14.1
Price/BV(x) 4.1 2.7 2.4 2.2 1.9
EV/Sales (x) 1.4 1.7 1.4 1.2 1.0
EV/EBITDA (x) 8.6 10.9 8.8 7.5 6.3
Diluted shares O/S 1.5 2.1 2.1 2.1 2.1
Basic EPS 16.5 12.9 18.9 21.9 26.7
Basic PE (x) 22.9 29.3 20.0 17.2 14.1
Div idend yield (%) 0.0 0.0 0.5 0.9 1.1
Balance sheet (INR cr)
As on 31st March FY16 FY17 FY18E FY19E FY20E
Equity share capital 15.17 21 21 21 21
Preference Share Capital 0 0 0 0 0
Reserves & surplus 123 275 312 352 400
Shareholders funds 138 297 333 373 422
Secured loans 129 117 0 0 0
Unsecured loans 0 0 0 0 0
Borrowings 130 117 72 52 32
Minority interest 0 0 0 0 0
Sources of funds 268 414 406 426 454
Gross block 301 308 378 413 448
Depreciation 153 177 204 240 280
Net block 147 132 175 173 169
Capital work in progress 0 3 5 5 6
Total fixed assets 147 134 180 178 175
Unrealised profit 0 0 0 0 0
Investments 0 0 0 0 0
Inventories 91 110 135 171 194
Sundry debtors 162 182 211 228 258
Cash and equivalents 1 72 37 23 31
Loans and advances 29 31 42 48 50
Other current assets 0 0 0 0 0
Total current assets 283 396 424 470 532
Sundry creditors and others 170 159 194 219 247
Prov isions 5 2 2 2 2
Total CL & prov isions 175 161 196 221 249
Net current assets 108 236 228 250 283
Net Deferred tax -4 -2 -2 -2 -2
Misc expenditure 16 47 0 0 0
Uses of funds 268 414 406 426 455
Book value per share (INR) 91 138 155 174 197
Cash flow statement
Year to March FY16 FY17 FY18E FY19E FY20E
Net profit 25 28 41 47 57
Add: Depreciation 27 24 27 36 40
Add: Misc expenses written off -2 -30 47 0 0
Add: Deferred tax -2 -1 0 0 0
Add: Others 0 0 0 0 0
Gross cash flow 48 20 114 83 97
Less: Changes in W. C. 10 56 28 35 26
Operating cash flow 38 -36 86 49 71
Less: Capex 15 11 72 35 36
Free cash flow 23 -47 13 14 35
GNA Axles Ltd.
19 GWM
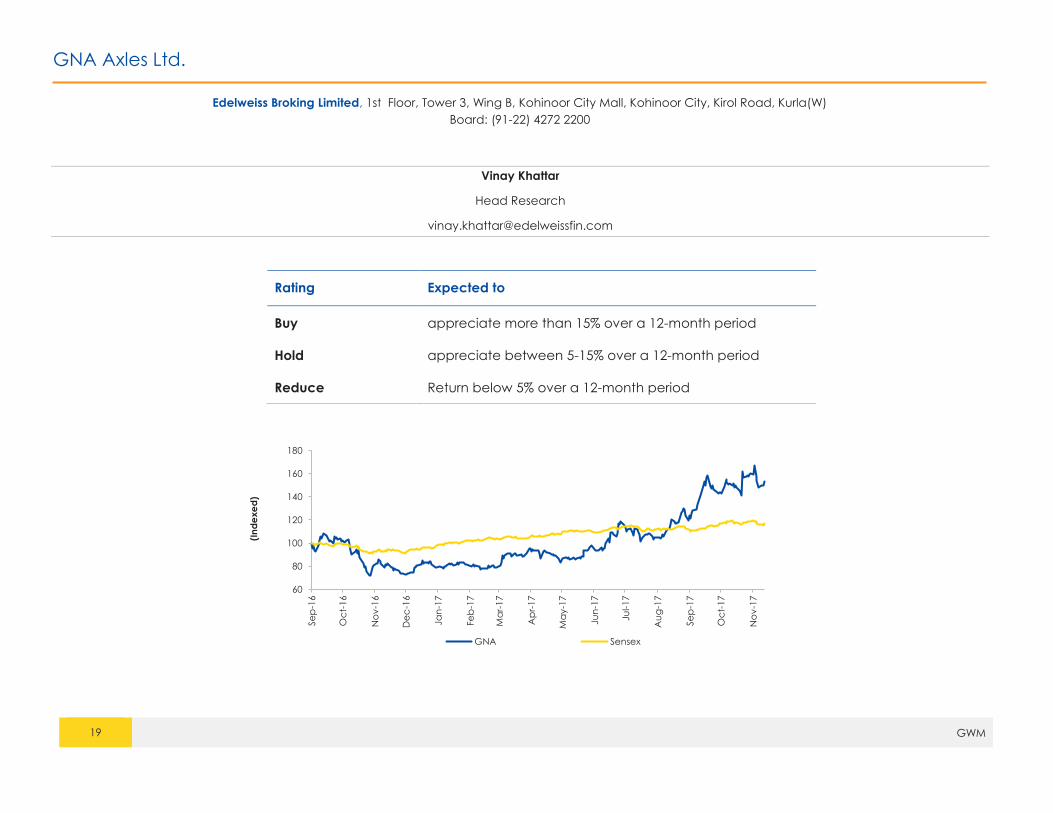
Edelweiss Broking Limited, 1st Floor, Tower 3, Wing B, Kohinoor City Mall, Kohinoor City, Kirol Road, Kurla(W)
Board: (91-22) 4272 2200
Vinay Khattar
Head Research
Rating Expected to
Buy appreciate more than 15% over a 12-month period
Hold appreciate between 5-15% over a 12-month period
Reduce Return below 5% over a 12-month period
60
80
100
120
140
160
180
Se
p-1
6
Oc
t-16
No
v-1
6
De
c-1
6
Ja
n-1
7
Fe
b-1
7
Ma
r-1
7
Ap
r-17
Ma
y-1
7
Ju
n-1
7
Ju
l-17
Au
g-1
7
Se
p-1
7
Oc
t-17
No
v-1
7
(In
de
xe
d)
GNA Sensex
Disclaimer
20 GWM
Edelweiss Broking Limited (“EBL” or “Research Entity”) is regulated by the Securities and Exchange Board of India (“SEBI”) and is licensed to carry on the business of broking, depository services and related
activities. The business of EBL and its Associates (list available on www.edelweissfin.com) are organized around five broad business groups – Credit including Housing and SME Finance, Commodities, Financial
Markets, Asset Management and Life Insurance.
Broking services offered by Edelweiss Broking Limited under SEBI Registration No.: INZ000005231; Name of the Compliance Officer: Mr. Brijmohan Bohra, Email ID: [email protected]
Corporate Office: Edelweiss House, Off CST Road, Kalina, Mumbai - 400098; Tel. 18001023335/022-42722200/022-40094279
This Report has been prepared by Edelweiss Broking Limited in the capacity of a Research Analyst having SEBI Registration No.INH000000172 and distributed as per SEBI (Research Analysts) Regulations 2014. This
report does not constitute an offer or solicitation for the purchase or sale of any financial instrument or as an official confirmation of any transaction. The information contained herein is from publicly available
data or other sources believed to be reliable. This report is provided for assistance only and is not intended to be and must not alone be taken as the basis for an investment decision. The user assumes the entire
risk of any use made of this information. Each recipient of this report should make such investigation as it deems necessary to arrive at an independent evaluation of an investment in the securities of companies
referred to in this document (including the merits and risks involved), and should consult his own advisors to determine the merits and risks of such investment. The investment discussed or views expressed may
not be suitable for all investors.
This information is strictly confidential and is being furnished to you solely for your information. This information should not be reproduced or redistributed or passed on directly or indirectly in any form to any other
person or published, copied, in whole or in part, for any purpose. This report is not directed or intended for distribution to, or use by, any person or entity who is a citizen or resident of or located in any locality,
state, country or other jurisdiction, where such distribution, publication, availability or use would be contrary to law, regulation or which would subject EBL and associates / group companies to any registration
or licensing requirements within such jurisdiction. The distribution of this report in certain jurisdictions may be restricted by law, and persons in whose possession this report comes, should observe, any such
restrictions. The information given in this report is as of the date of this report and there can be no assurance that future results or events will be consistent with this information. This information is subject to change
without any prior notice. EBL reserves the right to make modifications and alterations to this statement as may be required from time to time. EBL or any of its associates / group companies shall not be in any
way responsible for any loss or damage that may arise to any person from any inadvertent error in the information contained in this report. EBL is committed to providing independent and transparent
recommendation to its clients. Neither EBL nor any of its associates, group companies, directors, employees, agents or representatives shall be liable for any damages whether direct, indirect, special or
consequential including loss of revenue or lost profits that may arise from or in connection with the use of the information. Our proprietary trading and investment businesses may make investment decisions that
are inconsistent with the recommendations expressed herein. Past performance is not necessarily a guide to future performance .The disclosures of interest statements incorporated in this report are provided
solely to enhance the transparency and should not be treated as endorsement of the views expressed in the report. The information provided in these reports remains, unless otherwise stated, the copyright of
EBL. All layout, design, original artwork, concepts and other Intellectual Properties, remains the property and copyright of EBL and may not be used in any form or for any purpose whatsoever by any party
without the express written permission of the copyright holders.
EBL shall not be liable for any delay or any other interruption which may occur in presenting the data due to any reason including network (Internet) reasons or snags in the system, break down of the system or
any other equipment, server breakdown, maintenance shutdown, breakdown of communication services or inability of the EBL to present the data. In no event shall EBL be liable for any damages, including
without limitation direct or indirect, special, incidental, or consequential damages, losses or expenses arising in connection with the data presented by the EBL through this report.
We offer our research services to clients as well as our prospects. Though this report is disseminated to all the customers s imultaneously, not all customers may receive this report at the same time. We will not
treat recipients as customers by virtue of their receiving this report.
EBL and its associates, officer, directors, and employees, research analyst (including relatives) worldwide may: (a) from time to time, have long or short positions in, and buy or sell the securities thereof, of
company(ies), mentioned herein or (b) be engaged in any other transaction involving such securities and earn brokerage or other compensation or act as a market maker in the financial instruments of the
subject company/company(ies) discussed herein or act as advisor or lender/borrower to such company(ies) or have other potential/material conflict of interest with respect to any recommendation and
related information and opinions at the time of publication of research report or at the time of public appearance. EBL may have proprietary long/short position in the above mentioned scrip(s) and therefore
should be considered as interested. The views provided herein are general in nature and do not consider risk appetite or investment objective of any particular investor; readers are requested to take
independent professional advice before investing. This should not be construed as invitation or solicitation to do business with EBL.
EBL or its associates may have received compensation from the subject company in the past 12 months. EBL or its associates may have managed or co-managed public offering of securities for the subject
company in the past 12 months. EBL or its associates may have received compensation for investment banking or merchant banking or brokerage services from the subject company in the past 12 months. EBL
or its associates may have received any compensation for products or services other than investment banking or merchant banking or brokerage services from the subject company in the past 12 months. EBL
or its associates have not received any compensation or other benefits from the Subject Company or third party in connection with the research report. Research analyst or his/her relative or EBL’s associates
may have financial interest in the subject company. EBL, its associates, research analyst and his/her relative may have other potential/material conflict of interest with respect to any recommendation and
related information and opinions at the time of publication of research report or at the time of public appearance.
Disclaimer
21 GWM
Participants in foreign exchange transactions may incur risks arising from several factors, including the following: ( i) exchange rates can be volatile and are subject to large fluctuations; ( ii) the value of
currencies may be affected by numerous market factors, including world and national economic, political and regulatory events, events in equity and debt markets and changes in interest rates; and (iii)
currencies may be subject to devaluation or government imposed exchange controls which could affect the value of the currency. Investors in securities such as ADRs and Currency Derivatives, whose values
are affected by the currency of an underlying security, effectively assume currency risk.
Research analyst has served as an officer, director or employee of subject Company: No
EBL has financial interest in the subject companies: No
EBL’s Associates may have actual / beneficial ownership of 1% or more securities of the subject company at the end of the month immediately preceding the date of publication of research report.
Research analyst or his/her relative has actual/beneficial ownership of 1% or more securities of the subject company at the end of the month immediately preceding the date of publication of research report:
No
EBL has actual/beneficial ownership of 1% or more securities of the subject company at the end of the month immediately preceding the date of publication of research report: No
Subject company may have been client during twelve months preceding the date of distribution of the research report.
There were no instances of non-compliance by EBL on any matter related to the capital markets, resulting in significant and material disciplinary action during the last three years.
A graph of daily closing prices of the securities is also available at www.nseindia.com
Analyst Certification:
The analyst for this report certifies that all of the views expressed in this report accurately reflect his or her personal views about the subject company or companies and its or their securities, and no part of his or
her compensation was, is or will be, directly or indirectly related to specific recommendations or views expressed in this report.
Additional Disclaimer for U.S. Persons
Edelweiss is not a registered broker – dealer under the U.S. Securities Exchange Act of 1934, as amended (the“1934 act”) and under applicable state laws in the United States. In addition Edelweiss is not a
registered investment adviser under the U.S. Investment Advisers Act of 1940, as amended (the "Advisers Act" and together with the 1934 Act, the "Acts), and under applicable state laws in the United States.
Accordingly, in the absence of specific exemption under the Acts, any brokerage and investment services provided by Edelweiss, including the products and services described herein are not available to or
intended for U.S. persons.
This report does not constitute an offer or invitation to purchase or subscribe for any securities or solicitation of any investments or investment services and/or shall not be considered as an advertisement tool.
"U.S. Persons" are generally defined as a natural person, residing in the United States or any entity organized or incorporated under the laws of the United States. US Citizens living abroad may also be deemed
"US Persons" under certain rules.
Transactions in securities discussed in this research report should be effected through Edelweiss Financial Services Inc.
Additional Disclaimer for U.K. Persons
The contents of this research report have not been approved by an authorised person within the meaning of the Financial Services and Markets Act 2000 ("FSMA").
In the United Kingdom, this research report is being distributed only to and is directed only at (a) persons who have professional experience in matters relating to investments falling within Article 19(5) of the
FSMA (Financial Promotion) Order 2005 (the “Order”); (b) persons falling within Article 49(2)(a) to (d) of the Order (including high net worth companies and unincorporated associations); and (c) any other
persons to whom it may otherwise lawfully be communicated (all such persons together being referred to as “relevant persons”).
This research report must not be acted on or relied on by persons who are not relevant persons. Any investment or investment activity to which this research report relates is available only to relevant persons
and will be engaged in only with relevant persons. Any person who is not a relevant person should not act or rely on this research report or any of its contents. This research report must not be distributed,
published, reproduced or disclosed (in whole or in part) by recipients to any other person.

Disclaimer
22 GWM
Additional Disclaimer for Canadian Persons
Edelweiss is not a registered adviser or dealer under applicable Canadian securities laws nor has it obtained an exemption from the adviser and/or dealer registration requirements under such law. Accordingly,
any brokerage and investment services provided by Edelweiss, including the products and services described herein, are not available to or intended for Canadian persons.
This research report and its respective contents do not constitute an offer or invitation to purchase or subscribe for any securities or solicitation of any investments or investment services.
Disclosures under the provisions of SEBI (Research Analysts) Regulations 2014 (Regulations)
Edelweiss Broking Limited ("EBL" or "Research Entity") is regulated by the Securities and Exchange Board of India ("SEBI") and is licensed to carry on the business of broking, depository services and related activities.
The business of EBL and its associates are organized around five broad business groups – Credit including Housing and SME Finance, Commodities, Financial Markets, Asset Management and Life Insurance.
There were no instances of non-compliance by EBL on any matter related to the capital markets, resulting in significant and material disciplinary action during the last three years. This research report has been
prepared and distributed by Edelweiss Broking Limited ("Edelweiss") in the capacity of a Research Analyst as per Regulation 22(1) of SEBI (Research Analysts) Regulations 2014 having SEBI Registration
No.INH000000172.