Logic Gantt Chart RIP - pmatechnologies.com · Mid-1910s Henry Gantt creates Gantt charts as a tool...
56
© 2012-2013 PMA Consultants LLC Logic Gantt Chart RIP 1896 - ? Gui Ponce de Leon, PhD, PE, PMP, LEED AP GPM Boot Camp Newark, New Jersey March 8 th , 2013
Transcript of Logic Gantt Chart RIP - pmatechnologies.com · Mid-1910s Henry Gantt creates Gantt charts as a tool...
© 2
012-
2013
PM
A C
onsu
ltant
s LL
C
Logic Gantt Chart RIP1896 - ?
Gui Ponce de Leon, PhD, PE, PMP, LEED APGPM Boot CampNewark, New JerseyMarch 8th, 2013
2Logic Gantt Chart RIP© 2
012-
2013
PM
A C
onsu
ltant
s LL
C
Human history teaches us, however, that economic growth springs from better recipes, not just from more cooking.
“”
(Paul Romer, 2008)
Romer, Paul M. “Economic Growth.” In The Concise Encyclopedia of Economics, edited by David Henderson. Library of Economics and Liberty. Article published August 2008. http://www.econlib.org/library/Enc/EconomicGrowth.html#
3Logic Gantt Chart RIP© 2
012-
2013
PM
A C
onsu
ltant
s LL
C
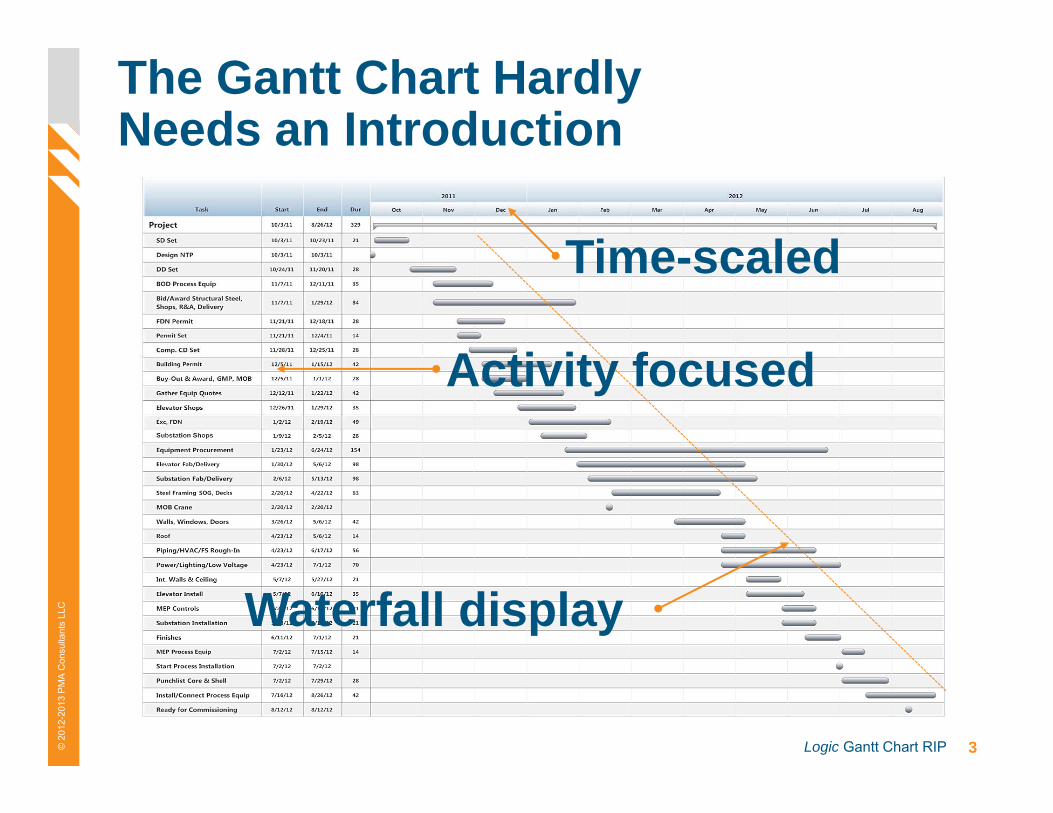
The Gantt Chart Hardly Needs an Introduction
Time-scaled
Waterfall display
Activity focused
4Logic Gantt Chart RIP© 2
012-
2013
PM
A C
onsu
ltant
s LL
C
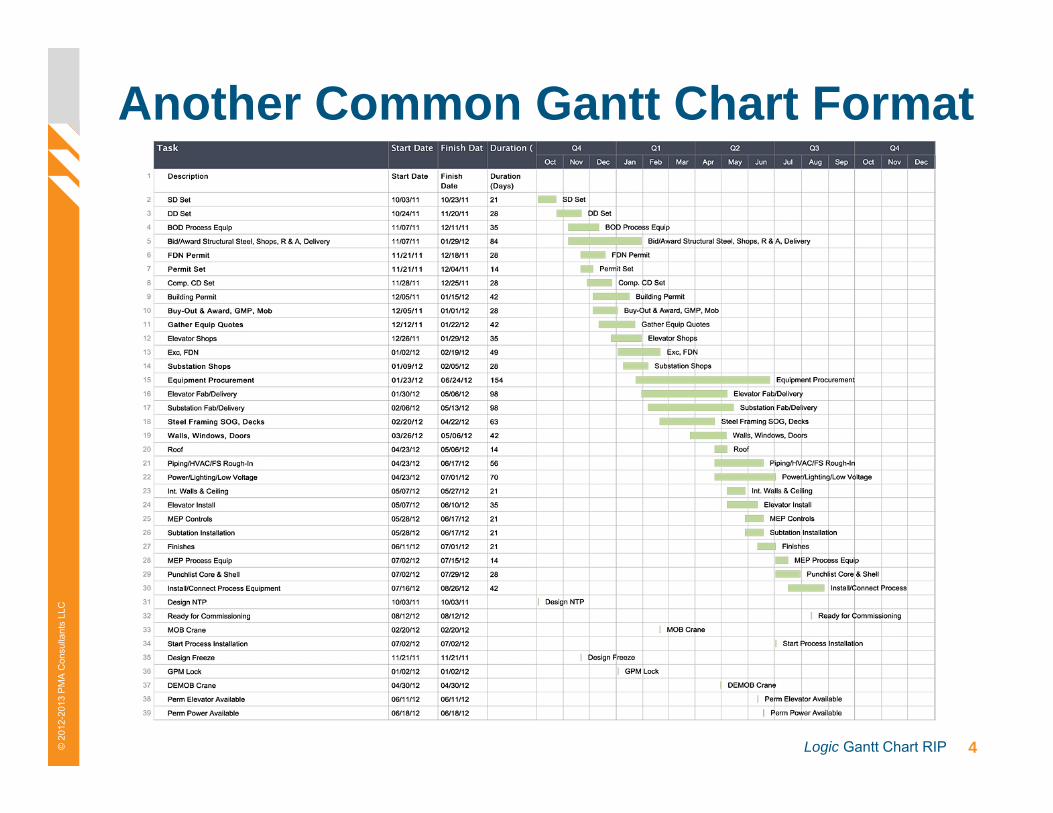
Another Common Gantt Chart Format
5Logic Gantt Chart RIP© 2
012-
2013
PM
A C
onsu
ltant
s LL
C
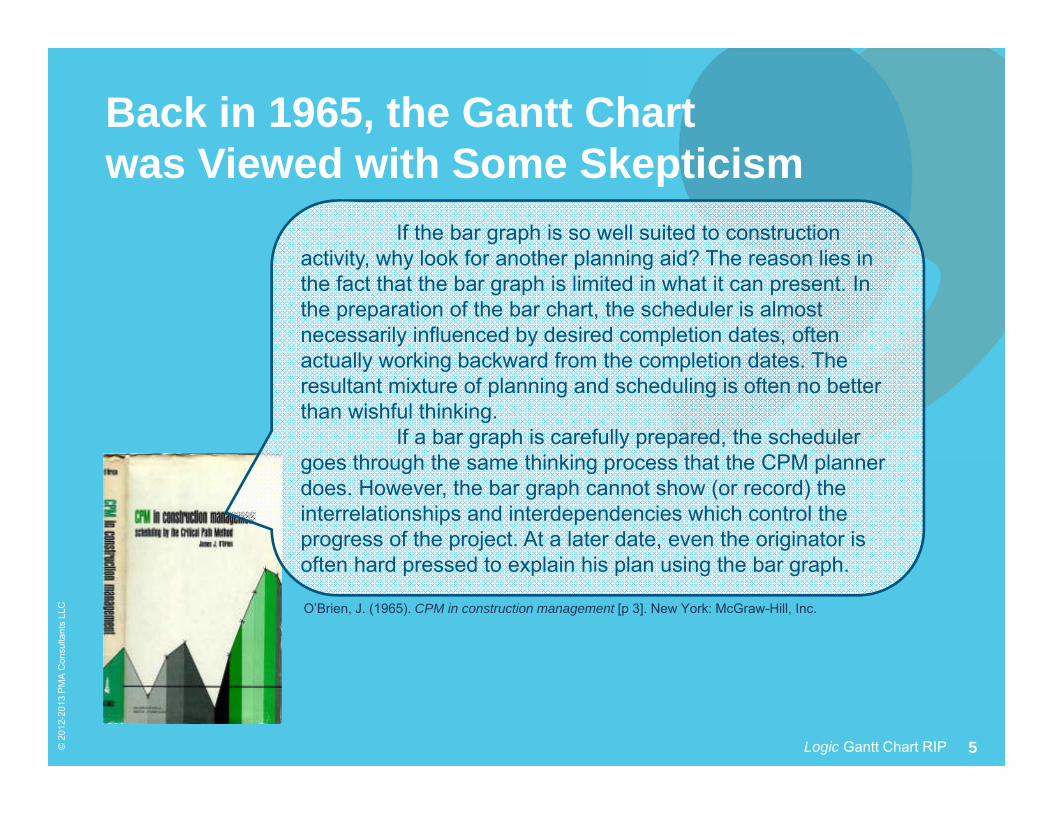
Back in 1965, the Gantt Chart was Viewed with Some Skepticism
O’Brien, J. (1965). CPM in construction management [p 3]. New York: McGraw-Hill, Inc.
If the bar graph is so well suited to construction activity, why look for another planning aid? The reason lies in the fact that the bar graph is limited in what it can present. In the preparation of the bar chart, the scheduler is almost necessarily influenced by desired completion dates, often actually working backward from the completion dates. The resultant mixture of planning and scheduling is often no better than wishful thinking.
If a bar graph is carefully prepared, the scheduler goes through the same thinking process that the CPM planner does. However, the bar graph cannot show (or record) the interrelationships and interdependencies which control the progress of the project. At a later date, even the originator is often hard pressed to explain his plan using the bar graph.
6Logic Gantt Chart RIP© 2
012-
2013
PM
A C
onsu
ltant
s LL
C
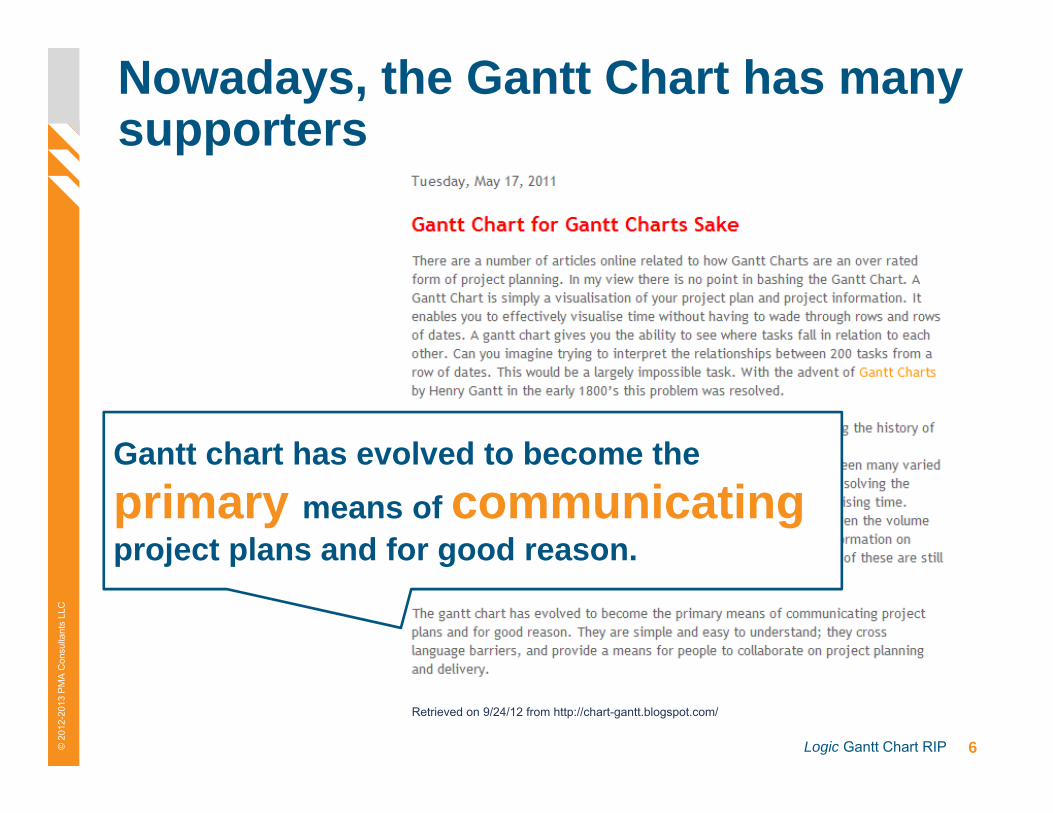
Nowadays, the Gantt Chart has many supporters
Retrieved on 9/24/12 from http://chart-gantt.blogspot.com/
Gantt chart has evolved to become the primary means of communicatingproject plans and for good reason.
7Logic Gantt Chart RIP© 2
012-
2013
PM
A C
onsu
ltant
s LL
C
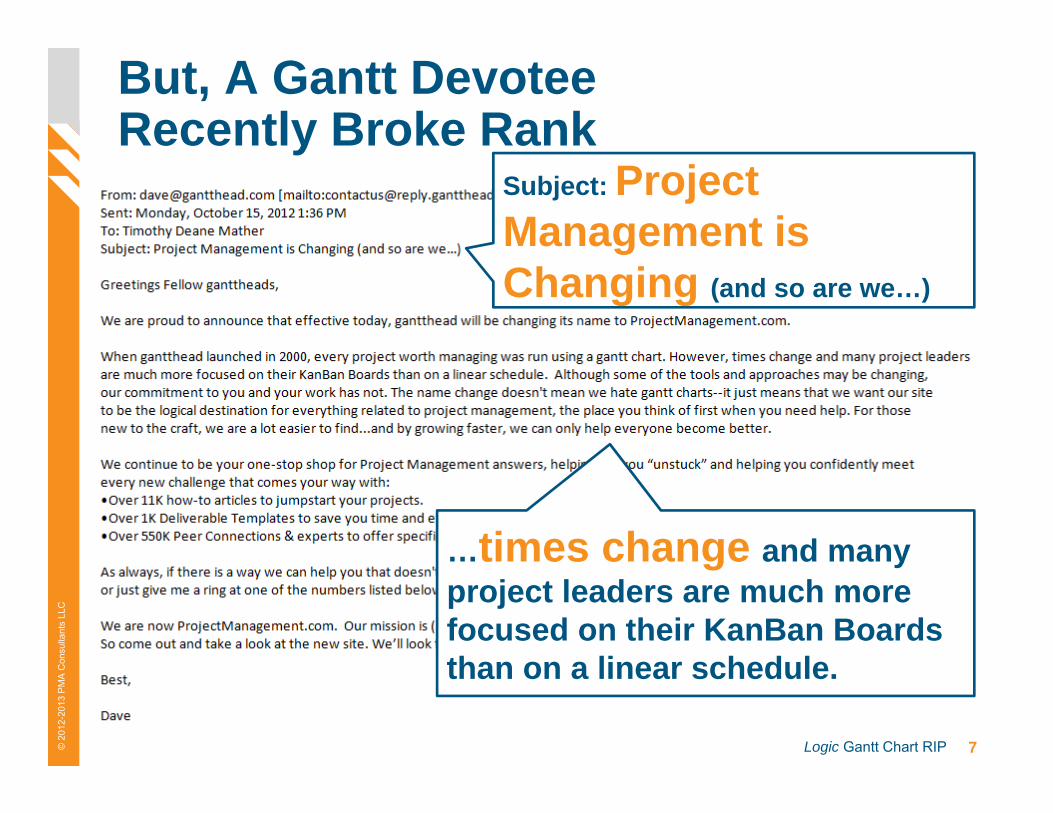
But, A Gantt Devotee Recently Broke Rank
Retrieved on 9/24/12 from http://chart-gantt.blogspot.com/
…times change and many project leaders are much more focused on their KanBan Boards than on a linear schedule.
Subject: Project Management is Changing (and so are we…)
8Logic Gantt Chart RIP© 2
012-
2013
PM
A C
onsu
ltant
s LL
C
1915 1925 1935 1945 1955 1965 1975 1985 1995 2005 2015
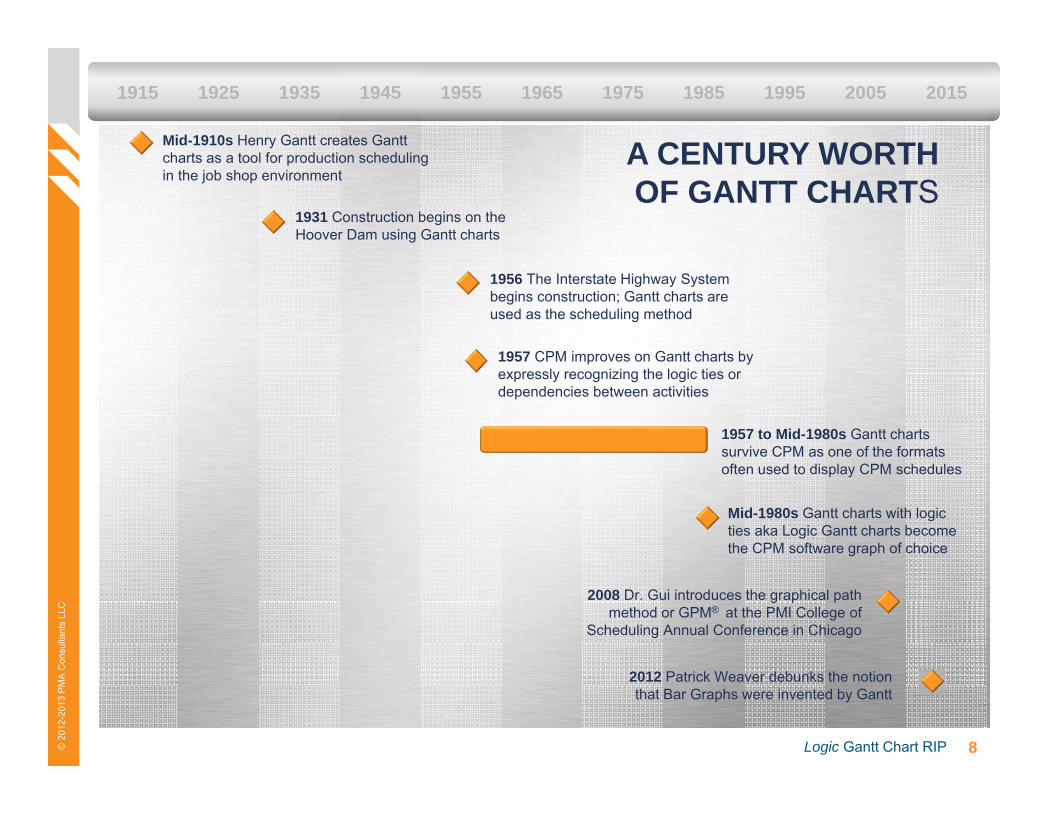
Mid-1910s Henry Gantt creates Gantt charts as a tool for production scheduling in the job shop environment
1931 Construction begins on the Hoover Dam using Gantt charts
1956 The Interstate Highway System begins construction; Gantt charts are used as the scheduling method
1957 CPM improves on Gantt charts by expressly recognizing the logic ties or dependencies between activities
1957 to Mid-1980s Gantt charts survive CPM as one of the formats often used to display CPM schedules
Mid-1980s Gantt charts with logic ties aka Logic Gantt charts become the CPM software graph of choice
2008 Dr. Gui introduces the graphical path method or GPM® at the PMI College of
Scheduling Annual Conference in Chicago
A CENTURY WORTH OF GANTT CHARTS
2012 Patrick Weaver debunks the notion that Bar Graphs were invented by Gantt
9Logic Gantt Chart RIP© 2
012-
2013
PM
A C
onsu
ltant
s LL
C
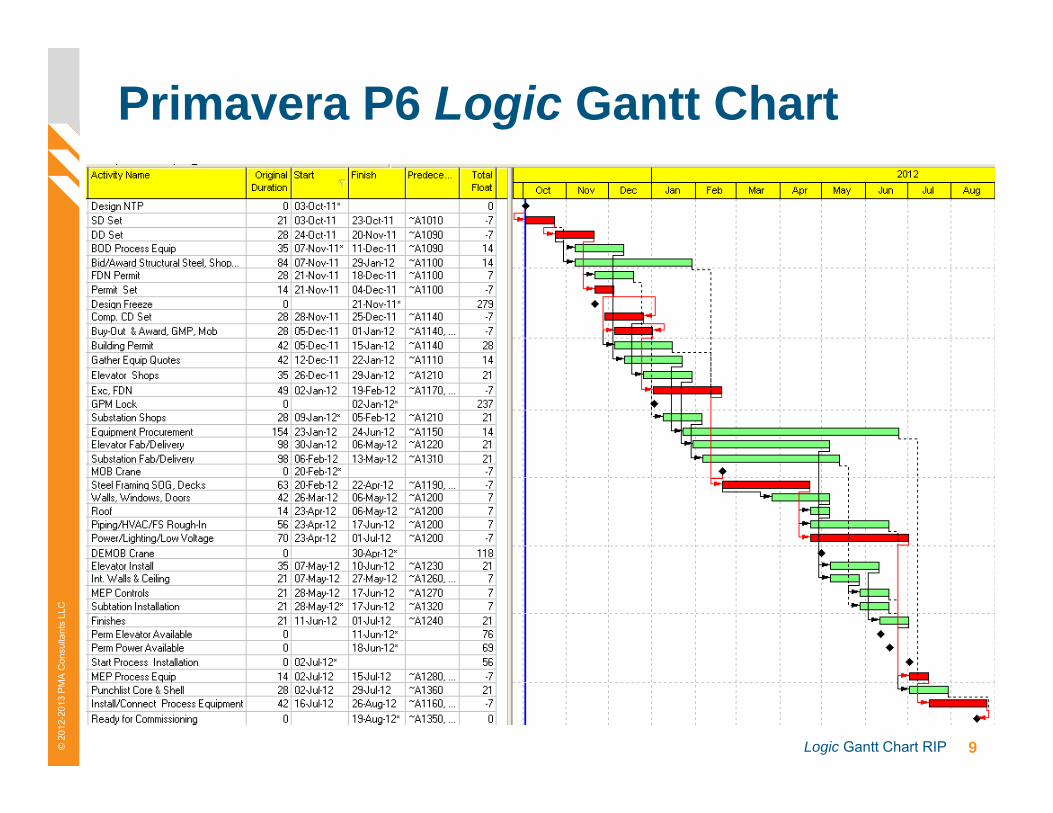
Primavera P6 Logic Gantt Chart
10Logic Gantt Chart RIP© 2
012-
2013
PM
A C
onsu
ltant
s LL
C
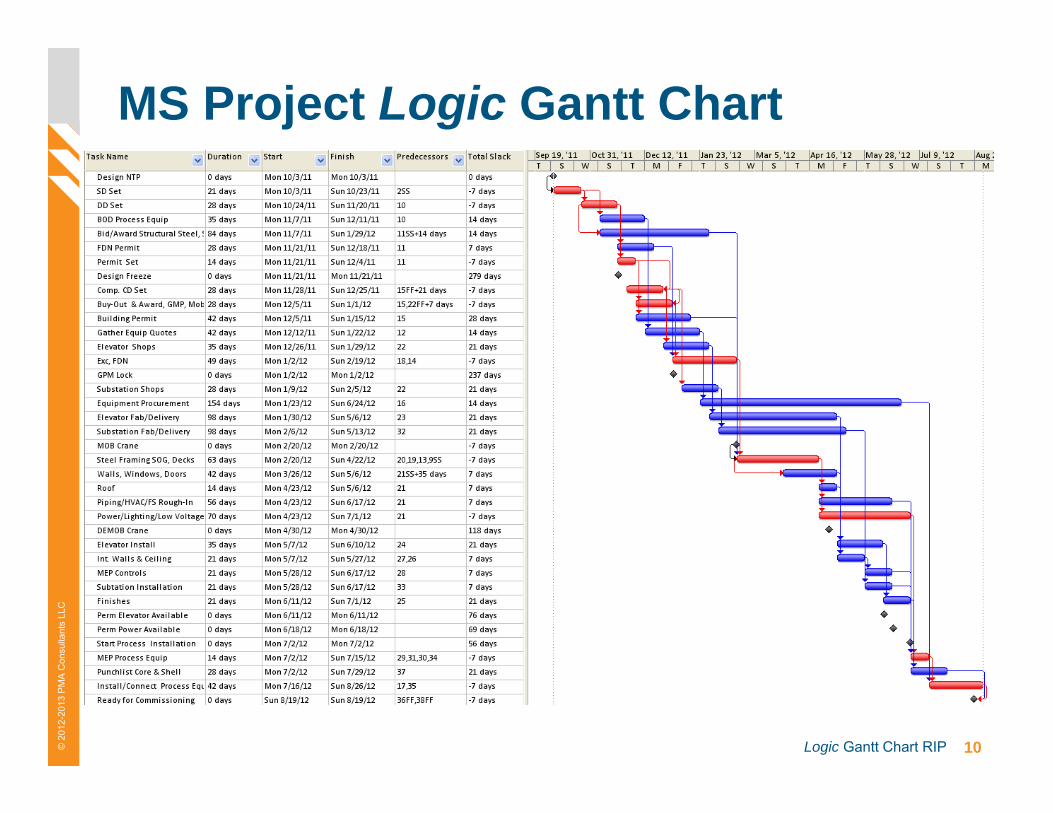
MS Project Logic Gantt Chart
11Logic Gantt Chart RIP© 2
012-
2013
PM
A C
onsu
ltant
s LL
C
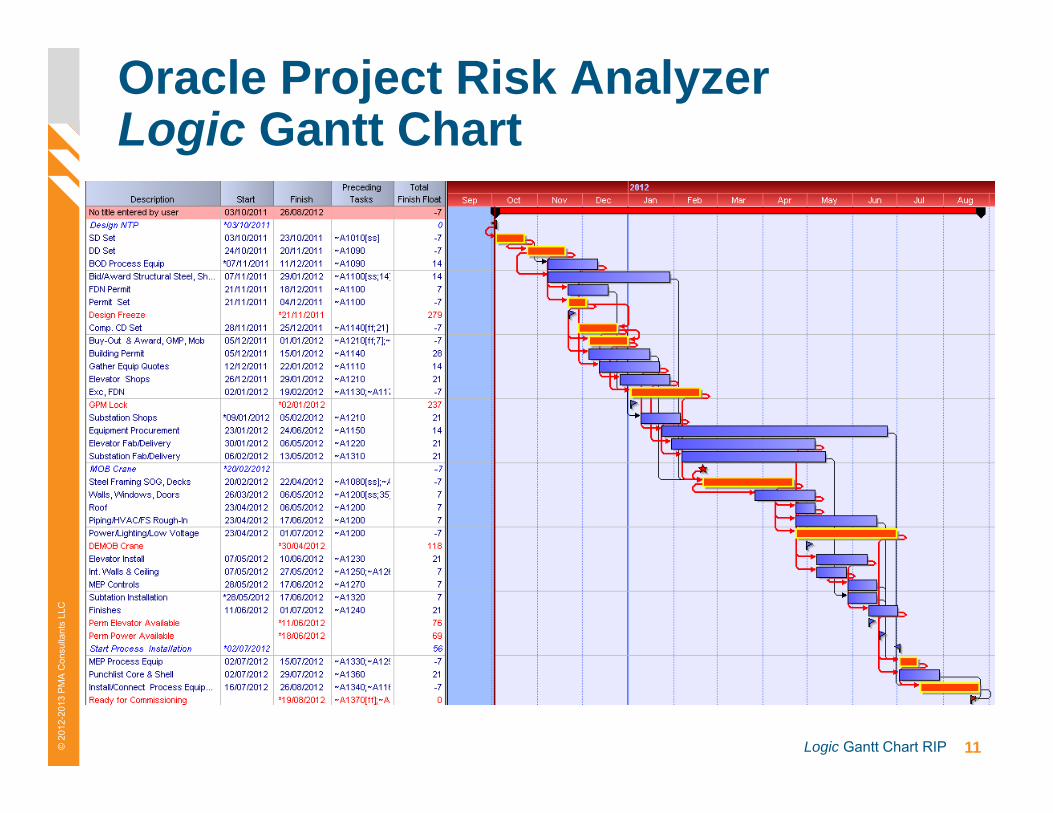
Oracle Project Risk AnalyzerLogic Gantt Chart
12Logic Gantt Chart RIP© 2
012-
2013
PM
A C
onsu
ltant
s LL
C
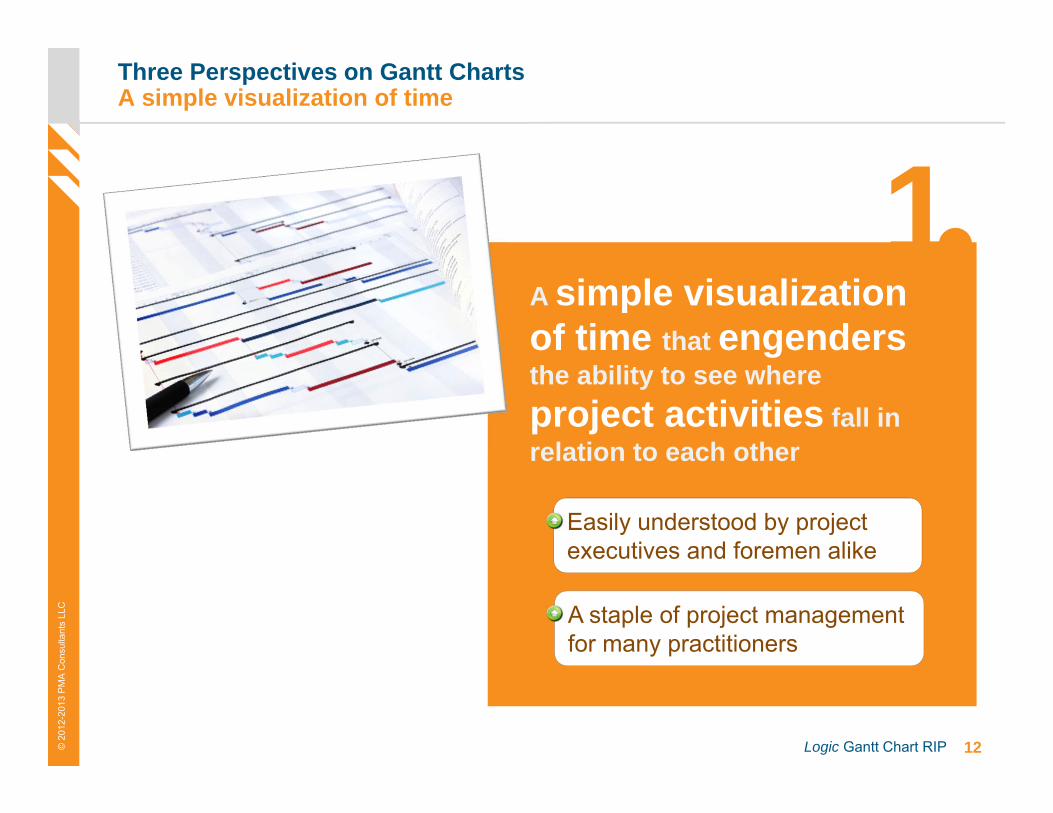
Easily understood by project executives and foremen alike
Three Perspectives on Gantt ChartsA simple visualization of time
A staple of project management for many practitioners
1A simple visualization of time that engendersthe ability to see where project activities fall in relation to each other
13Logic Gantt Chart RIP© 2
012-
2013
PM
A C
onsu
ltant
s LL
C
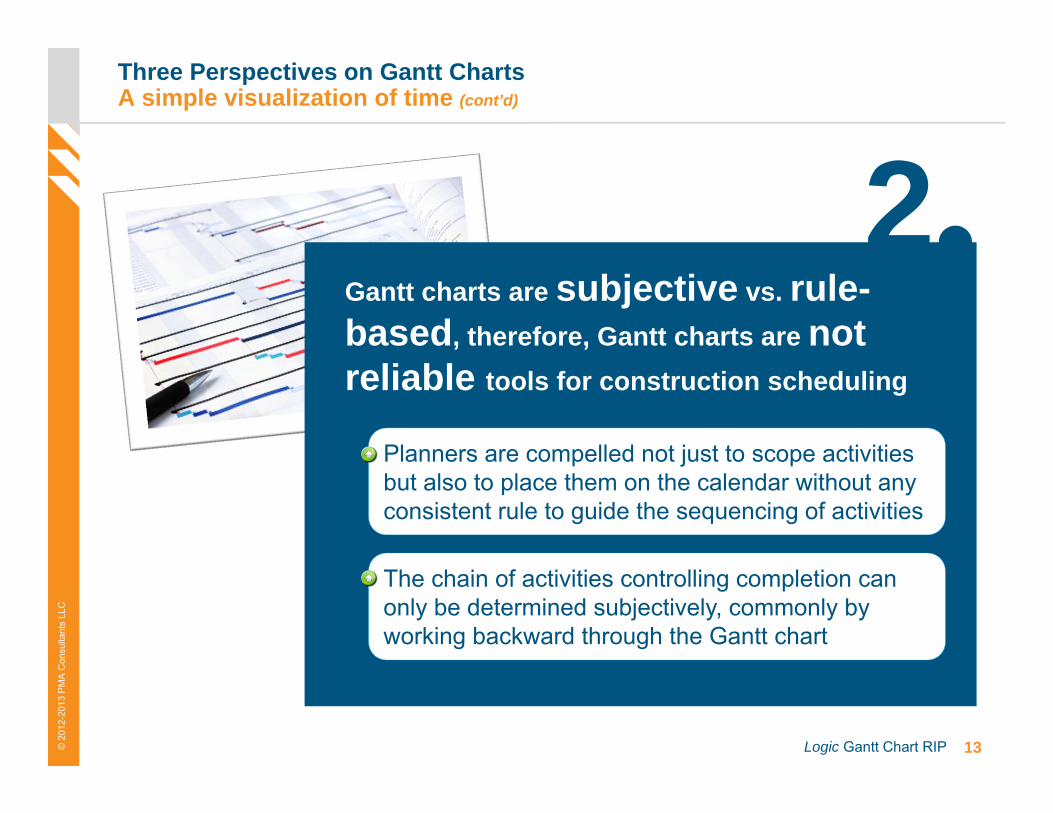
Planners are compelled not just to scope activities but also to place them on the calendar without any consistent rule to guide the sequencing of activities
Three Perspectives on Gantt ChartsA simple visualization of time (cont’d)
The chain of activities controlling completion can only be determined subjectively, commonly by working backward through the Gantt chart
2Gantt charts are subjective vs. rule-based, therefore, Gantt charts are not reliable tools for construction scheduling
14Logic Gantt Chart RIP© 2
012-
2013
PM
A C
onsu
ltant
s LL
C
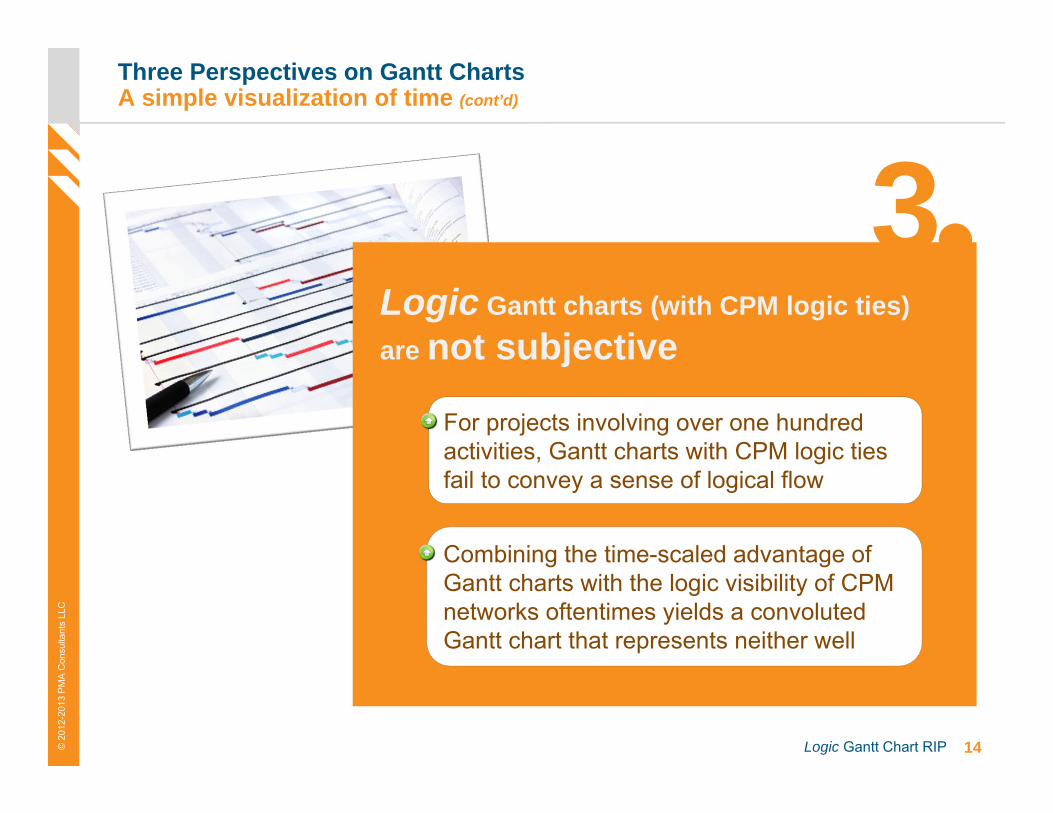
For projects involving over one hundred activities, Gantt charts with CPM logic ties fail to convey a sense of logical flow
Three Perspectives on Gantt ChartsA simple visualization of time (cont’d)
Combining the time-scaled advantage of Gantt charts with the logic visibility of CPM networks oftentimes yields a convoluted Gantt chart that represents neither well
3Logic Gantt charts (with CPM logic ties) are not subjective
15Logic Gantt Chart RIP© 2
012-
2013
PM
A C
onsu
ltant
s LL
C
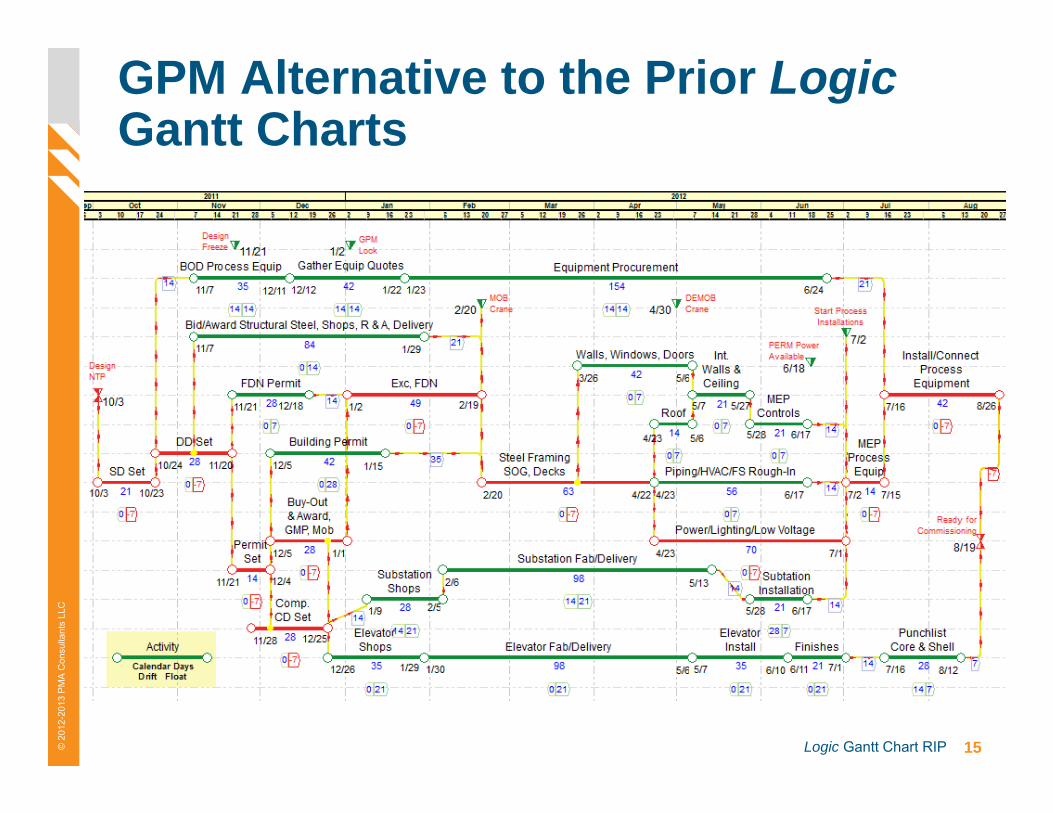
GPM Alternative to the Prior LogicGantt Charts
16Logic Gantt Chart RIP© 2
012-
2013
PM
A C
onsu
ltant
s LL
C
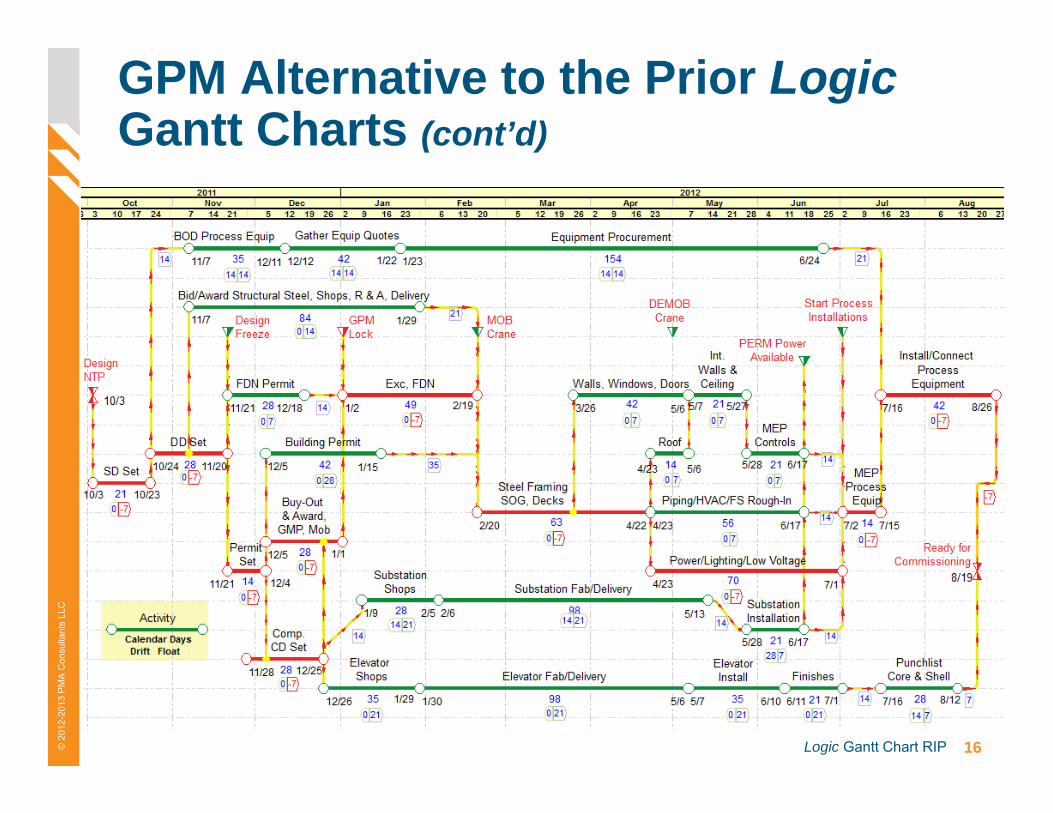
GPM Alternative to the Prior LogicGantt Charts (cont’d)
17Logic Gantt Chart RIP© 2
012-
2013
PM
A C
onsu
ltant
s LL
CThree Networking AlternativesADM, PDM, & LDM
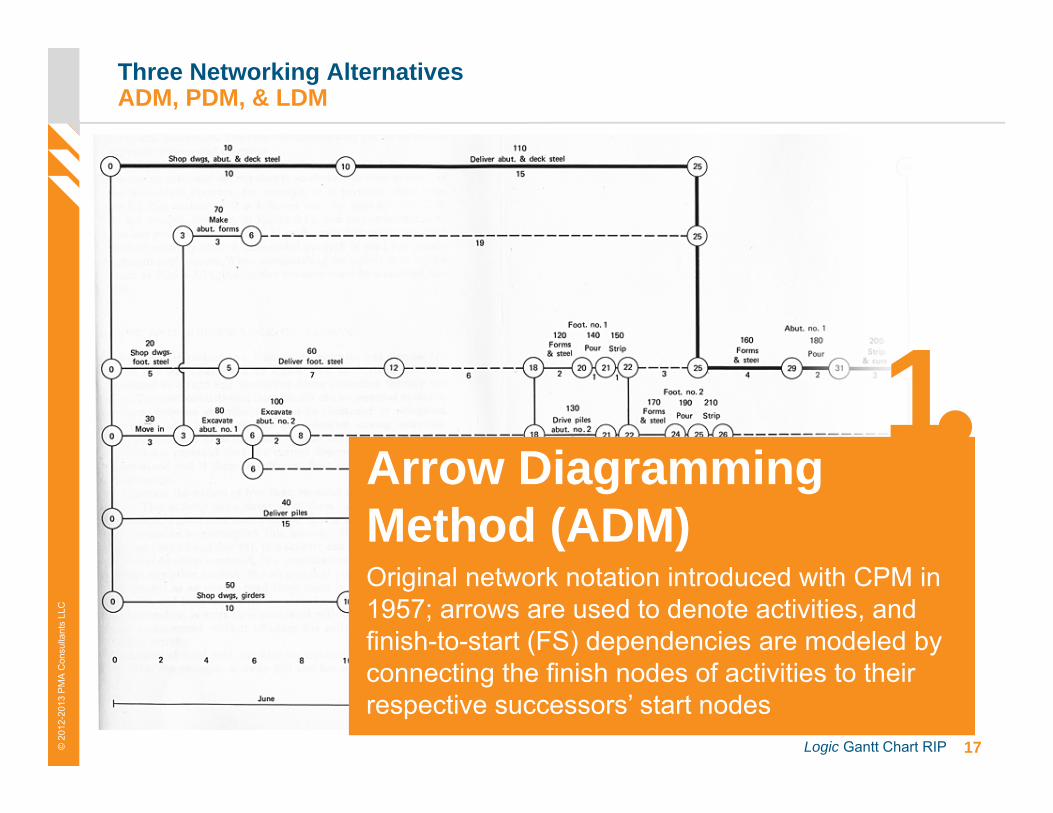
1Original network notation introduced with CPM in 1957; arrows are used to denote activities, and finish-to-start (FS) dependencies are modeled by connecting the finish nodes of activities to their respective successors’ start nodes
Arrow Diagramming Method (ADM)
18Logic Gantt Chart RIP© 2
012-
2013
PM
A C
onsu
ltant
s LL
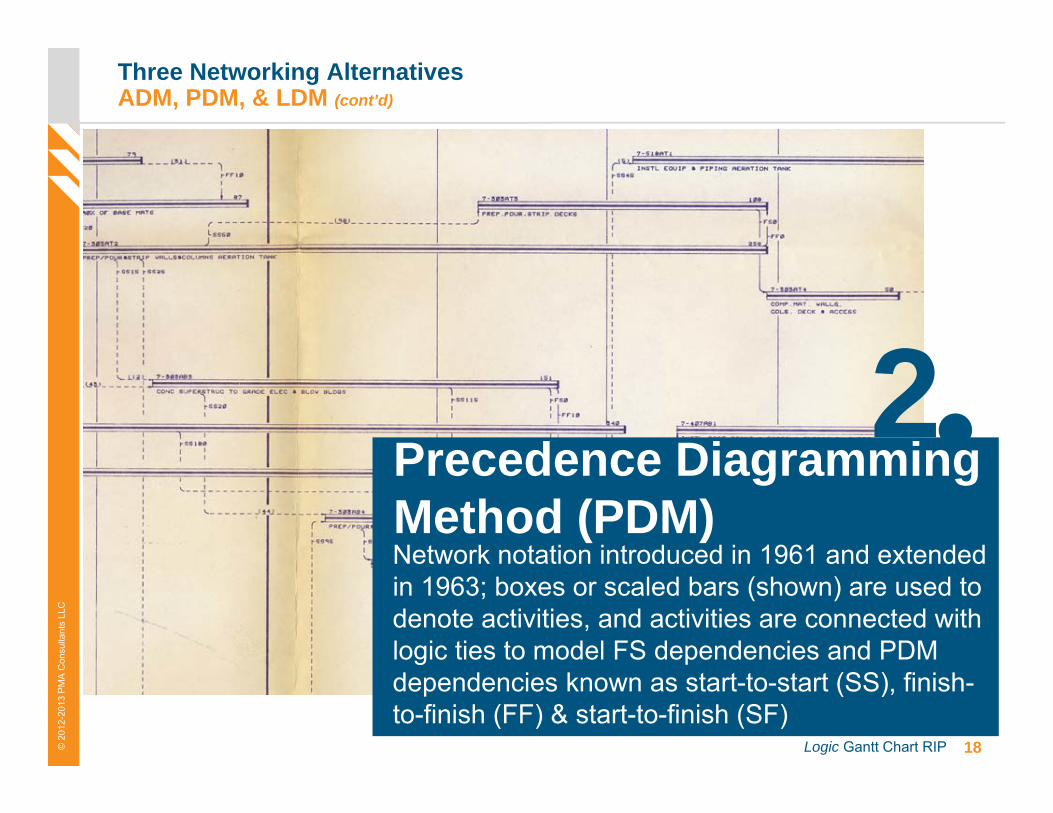
CThree Networking AlternativesADM, PDM, & LDM (cont’d)
2Network notation introduced in 1961 and extended in 1963; boxes or scaled bars (shown) are used to denote activities, and activities are connected with logic ties to model FS dependencies and PDM dependencies known as start-to-start (SS), finish-to-finish (FF) & start-to-finish (SF)
Precedence Diagramming Method (PDM)
19Logic Gantt Chart RIP© 2
012-
2013
PM
A C
onsu
ltant
s LL
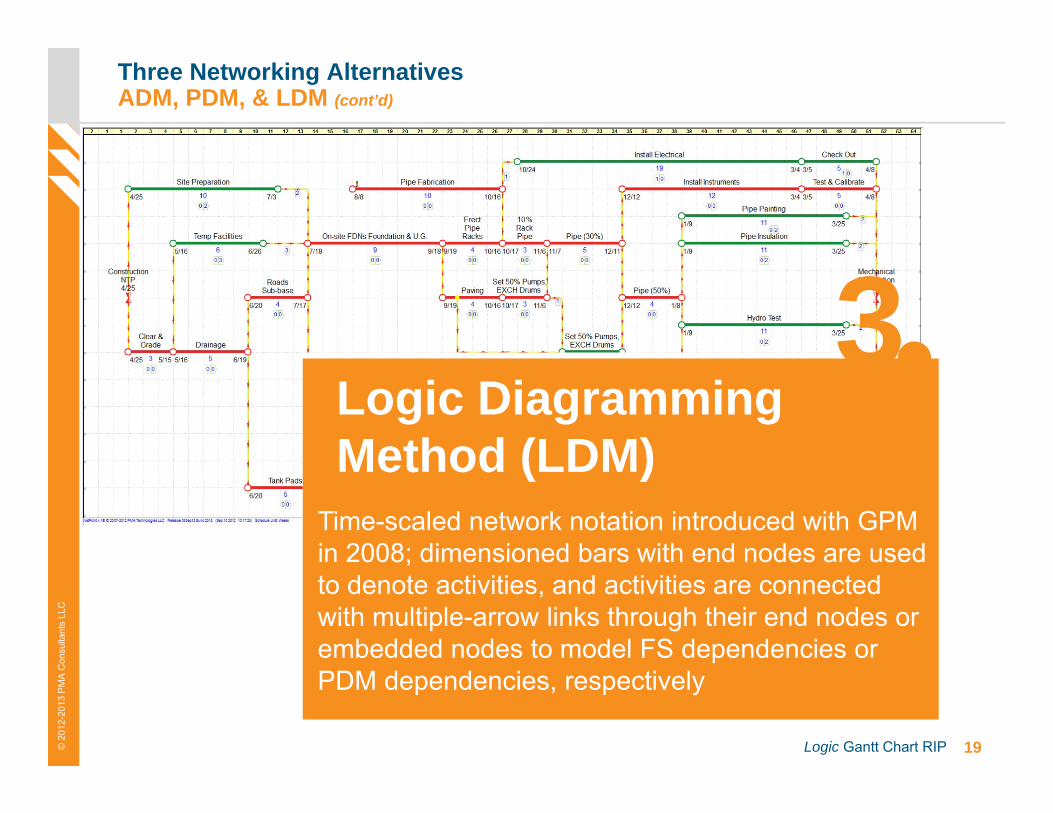
CThree Networking AlternativesADM, PDM, & LDM (cont’d)
3Time-scaled network notation introduced with GPM in 2008; dimensioned bars with end nodes are used to denote activities, and activities are connected with multiple-arrow links through their end nodes or embedded nodes to model FS dependencies or PDM dependencies, respectively
Logic Diagramming Method (LDM)
20Logic Gantt Chart RIP© 2
012-
2013
PM
A C
onsu
ltant
s LL
C
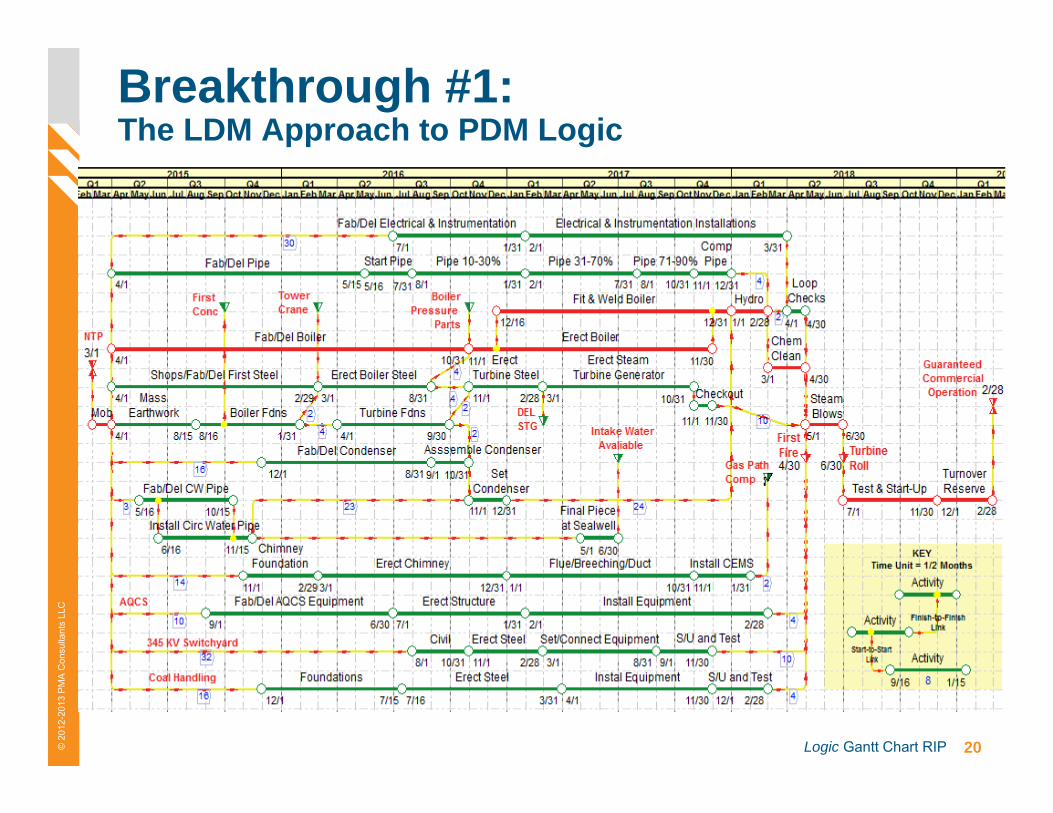
Breakthrough #1: The LDM Approach to PDM Logic
21Logic Gantt Chart RIP© 2
012-
2013
PM
A C
onsu
ltant
s LL
C
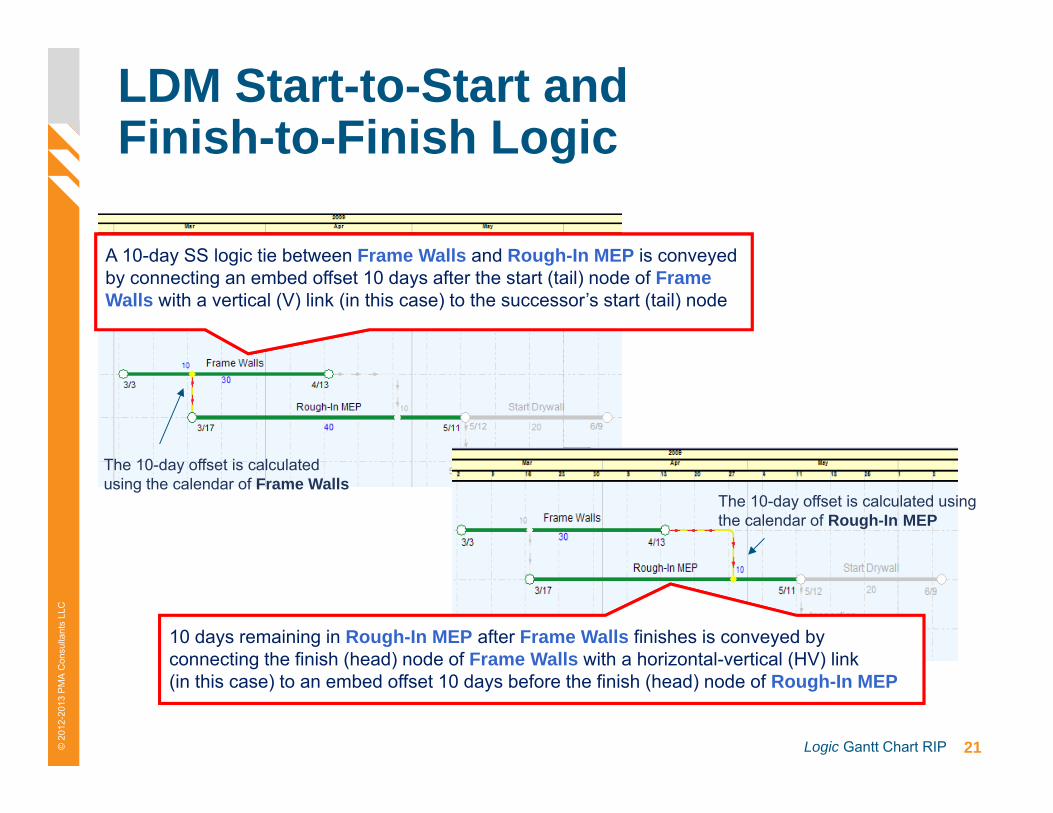
LDM Start-to-Start and Finish-to-Finish Logic
A 10-day SS logic tie between Frame Walls and Rough-In MEP is conveyed by connecting an embed offset 10 days after the start (tail) node of Frame Walls with a vertical (V) link (in this case) to the successor’s start (tail) node
The 10-day offset is calculated using the calendar of Frame Walls
10 days remaining in Rough-In MEP after Frame Walls finishes is conveyed by connecting the finish (head) node of Frame Walls with a horizontal-vertical (HV) link (in this case) to an embed offset 10 days before the finish (head) node of Rough-In MEP
The 10-day offset is calculated using the calendar of Rough-In MEP
22Logic Gantt Chart RIP© 2
012-
2013
PM
A C
onsu
ltant
s LL
C
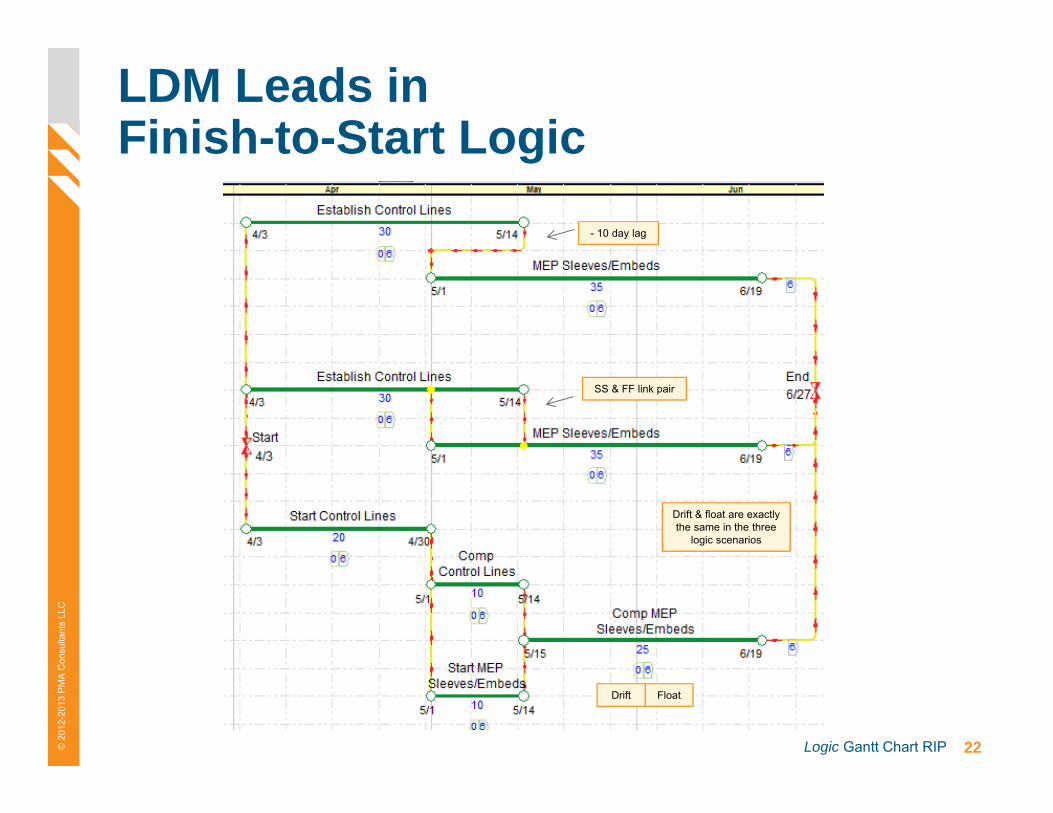
LDM Leads inFinish-to-Start Logic
Drift & float are exactly the same in the three
logic scenarios
- 10 day lag
SS & FF link pair
Float Drift
23Logic Gantt Chart RIP© 2
012-
2013
PM
A C
onsu
ltant
s LL
C
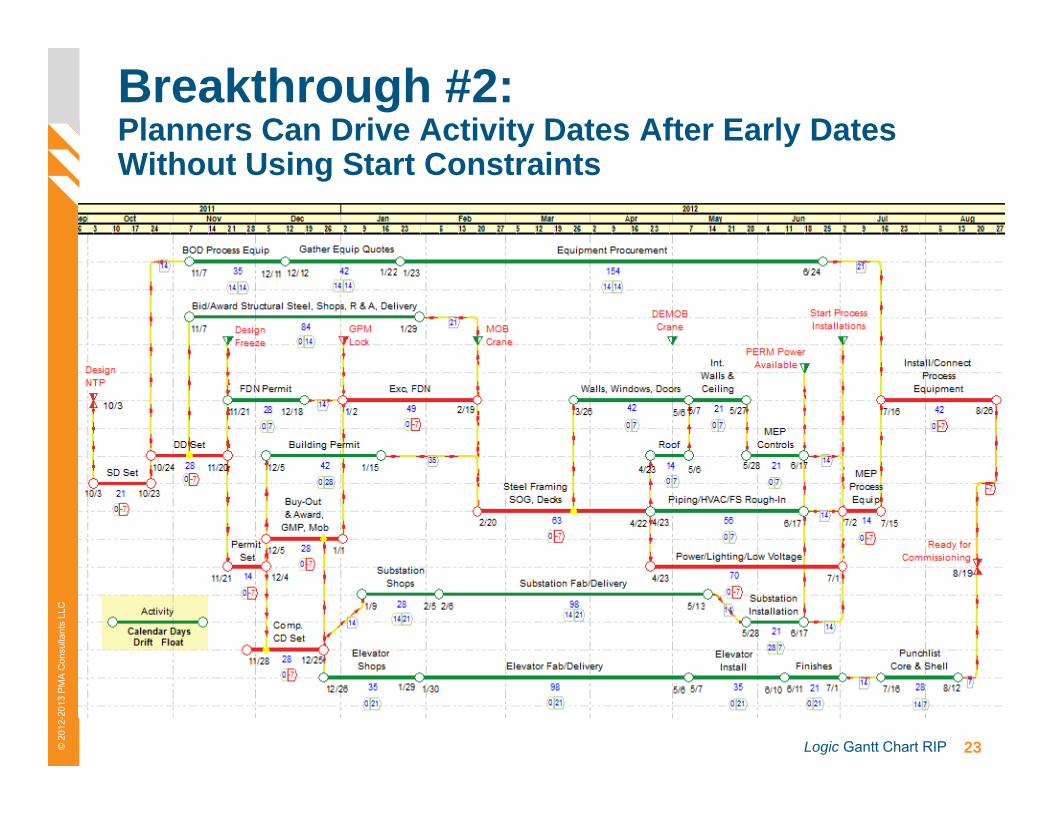
Breakthrough #2: Planners Can Drive Activity Dates After Early Dates Without Using Start Constraints
24Logic Gantt Chart RIP© 2
012-
2013
PM
A C
onsu
ltant
s LL
C
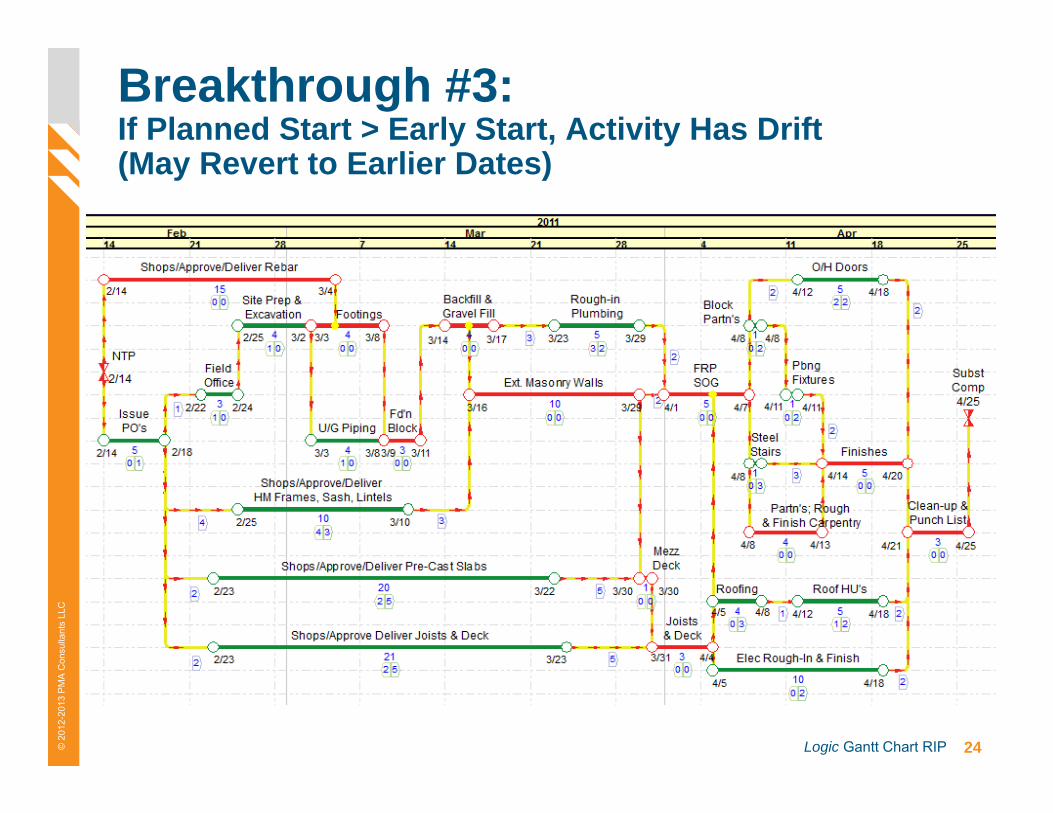
Breakthrough #3: If Planned Start > Early Start, Activity Has Drift (May Revert to Earlier Dates)
25Logic Gantt Chart RIP© 2
012-
2013
PM
A C
onsu
ltant
s LL
C
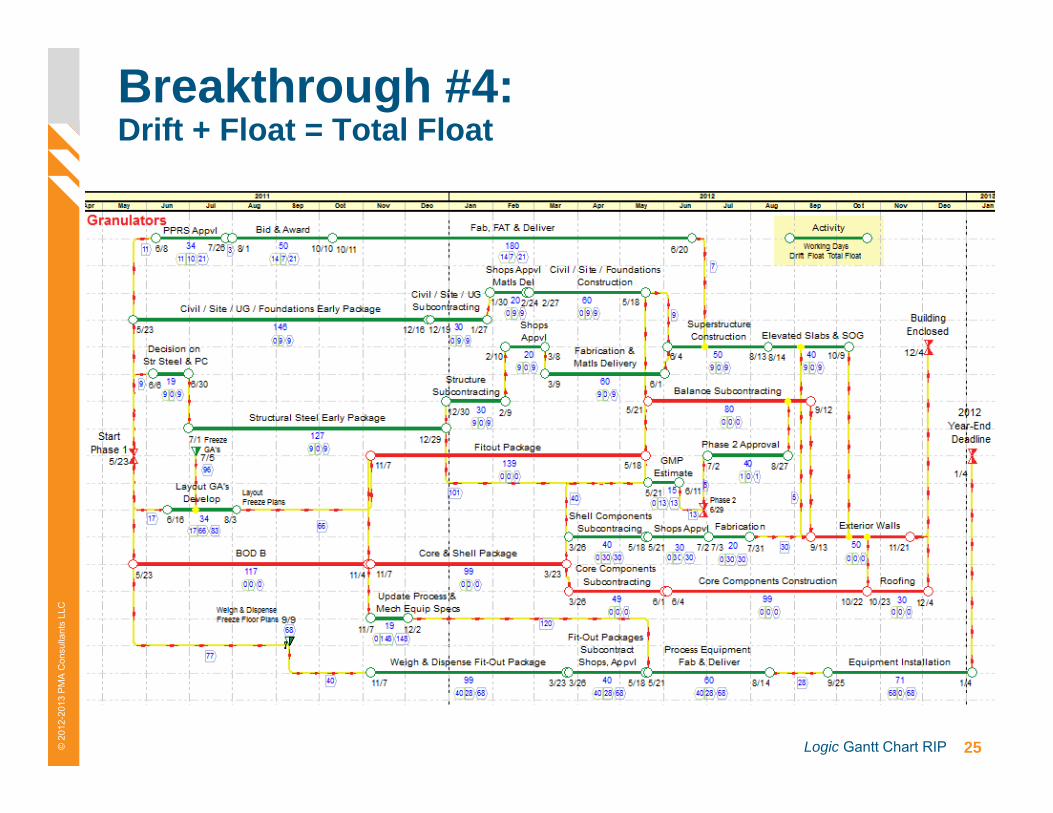
Breakthrough #4: Drift + Float = Total Float
26Logic Gantt Chart RIP© 2
012-
2013
PM
A C
onsu
ltant
s LL
C
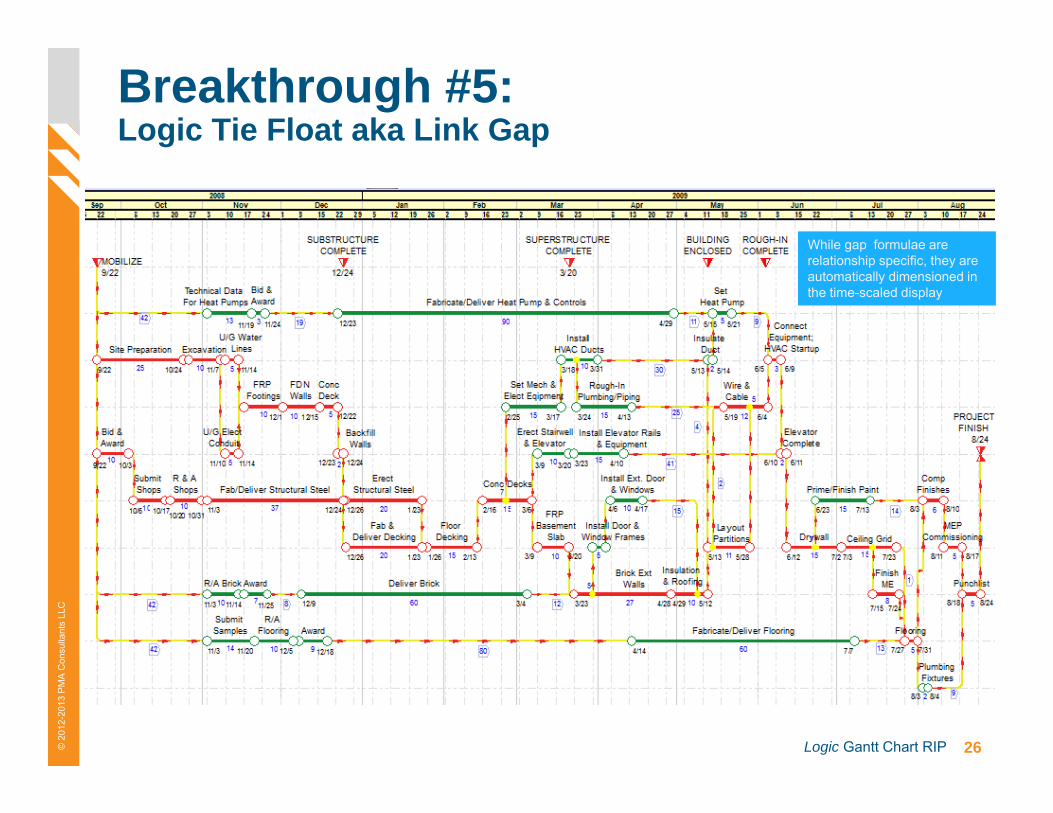
Breakthrough #5: Logic Tie Float aka Link Gap
While gap formulae are relationship specific, they are automatically dimensioned in the time-scaled display
27Logic Gantt Chart RIP© 2
012-
2013
PM
A C
onsu
ltant
s LL
C
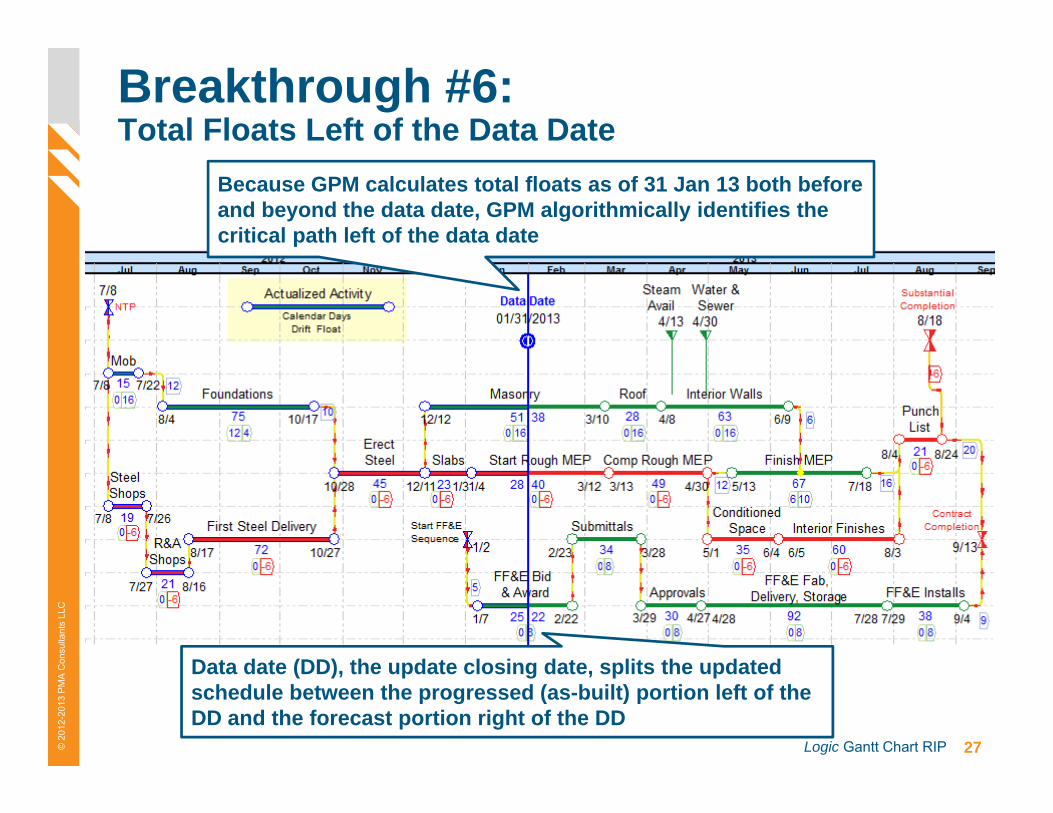
Breakthrough #6: Total Floats Left of the Data Date
Because GPM calculates total floats as of 31 Jan 13 both before and beyond the data date, GPM algorithmically identifies the critical path left of the data date
Data date (DD), the update closing date, splits the updated schedule between the progressed (as-built) portion left of the DD and the forecast portion right of the DD
28Logic Gantt Chart RIP© 2
012-
2013
PM
A C
onsu
ltant
s LL
C
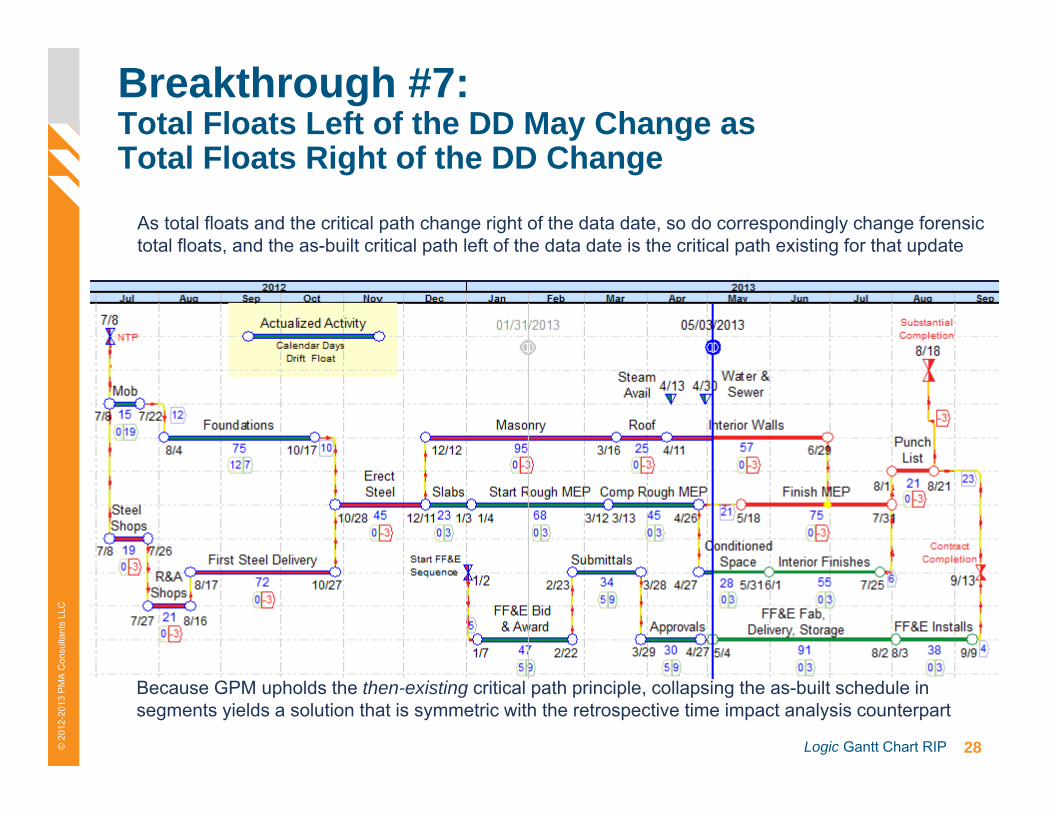
Breakthrough #7: Total Floats Left of the DD May Change as Total Floats Right of the DD Change
As total floats and the critical path change right of the data date, so do correspondingly change forensic total floats, and the as-built critical path left of the data date is the critical path existing for that update
Because GPM upholds the then-existing critical path principle, collapsing the as-built schedule in segments yields a solution that is symmetric with the retrospective time impact analysis counterpart
29Logic Gantt Chart RIP© 2
012-
2013
PM
A C
onsu
ltant
s LL
C
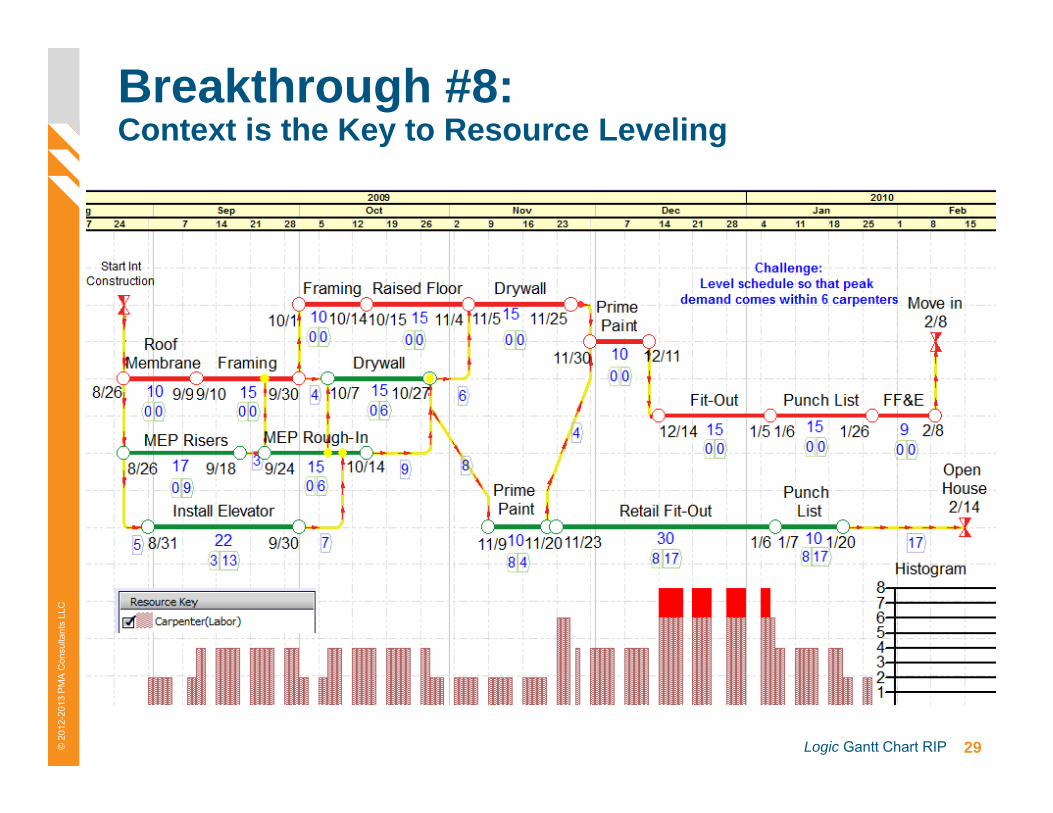
Breakthrough #8: Context is the Key to Resource Leveling
30Logic Gantt Chart RIP© 2
012-
2013
PM
A C
onsu
ltant
s LL
C
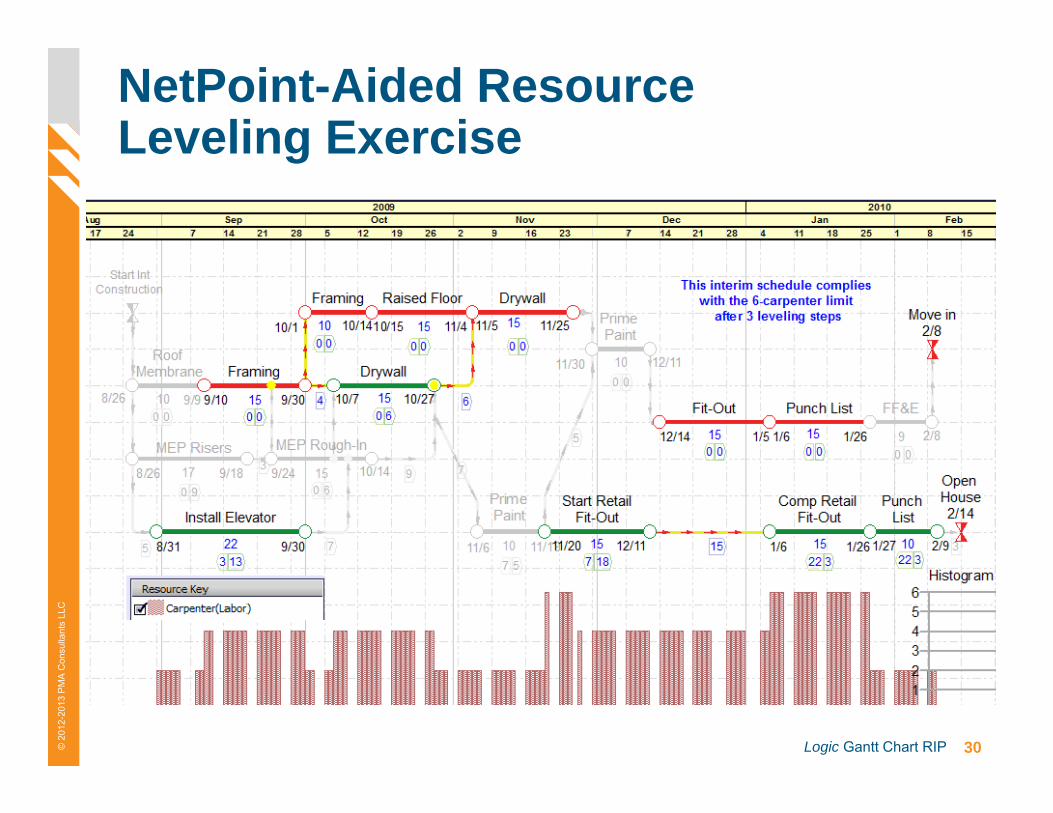
NetPoint-Aided Resource Leveling Exercise
31Logic Gantt Chart RIP© 2
012-
2013
PM
A C
onsu
ltant
s LL
C
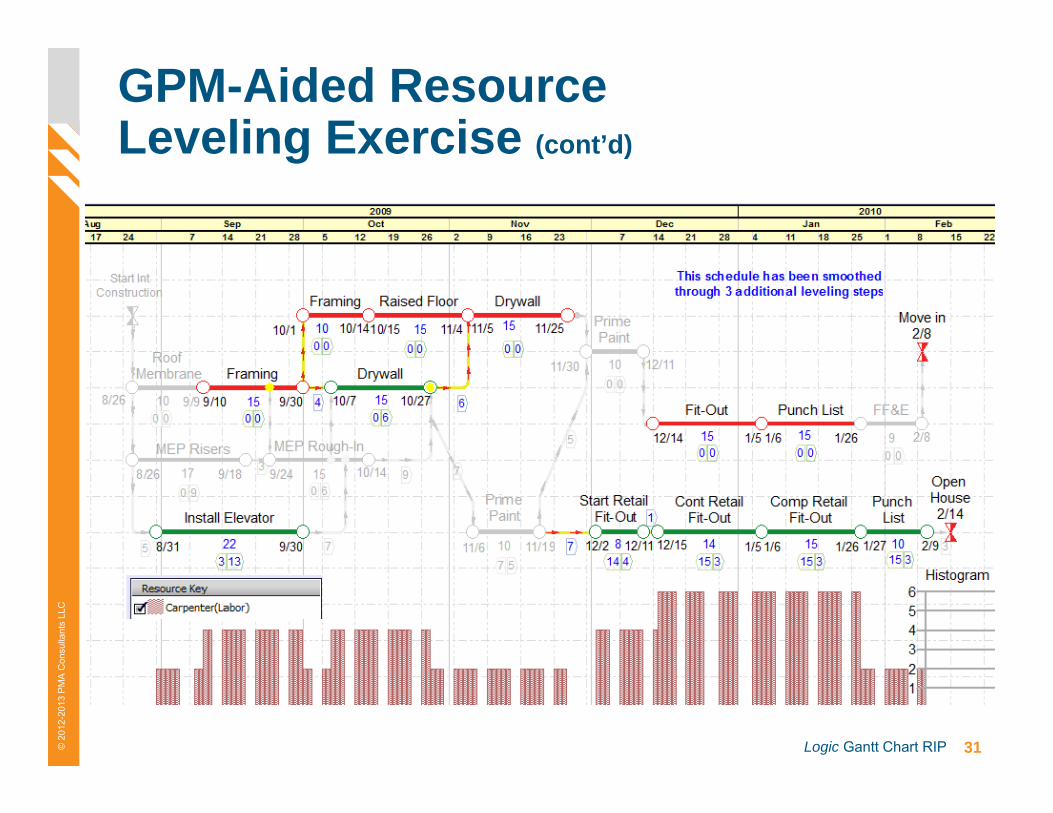
GPM-Aided Resource Leveling Exercise (cont’d)
32Logic Gantt Chart RIP© 2
012-
2013
PM
A C
onsu
ltant
s LL
C
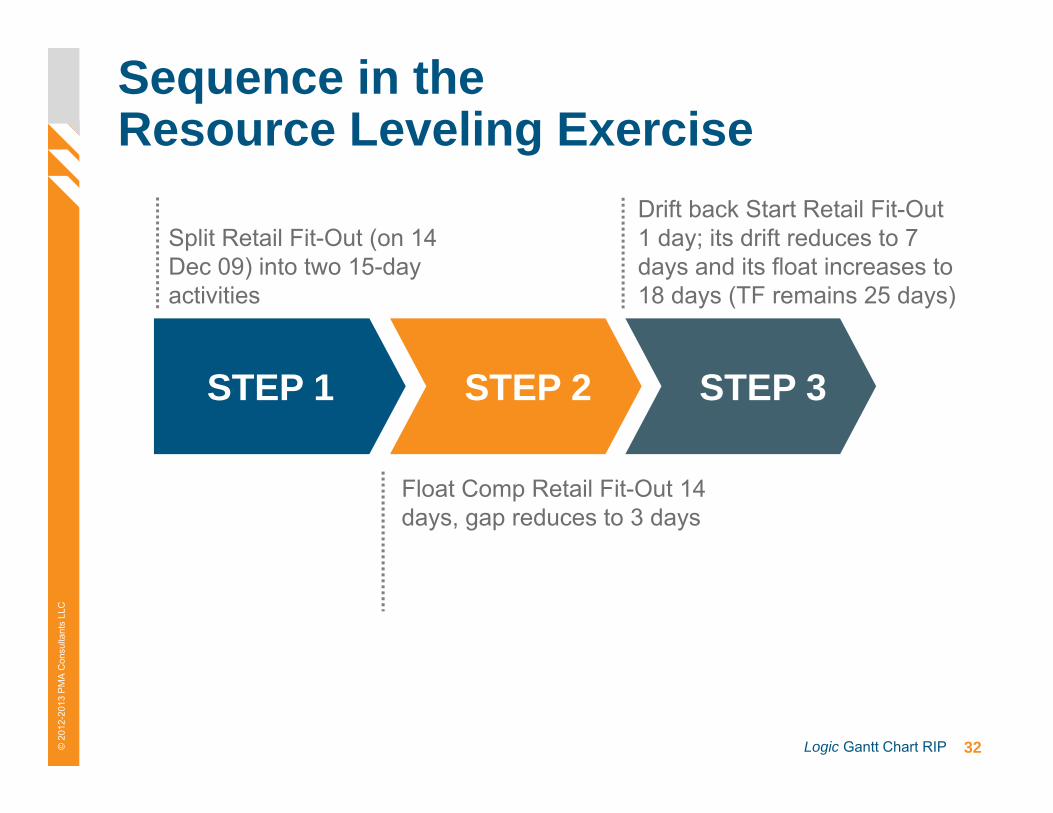
Sequence in the Resource Leveling Exercise
Split Retail Fit-Out (on 14 Dec 09) into two 15-day activities
Drift back Start Retail Fit-Out 1 day; its drift reduces to 7 days and its float increases to 18 days (TF remains 25 days)
Float Comp Retail Fit-Out 14 days, gap reduces to 3 days
STEP 1 STEP 2 STEP 3
33Logic Gantt Chart RIP© 2
012-
2013
PM
A C
onsu
ltant
s LL
C
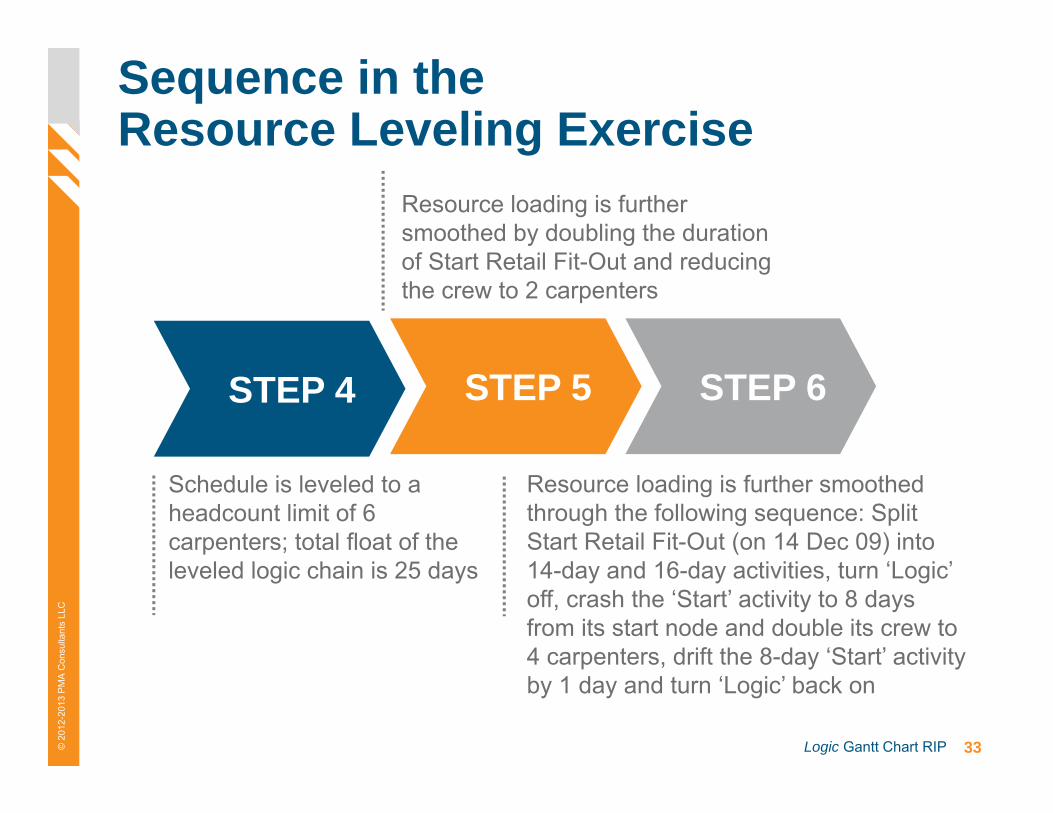
Sequence in the Resource Leveling Exercise
Schedule is leveled to a headcount limit of 6 carpenters; total float of the leveled logic chain is 25 days
Resource loading is further smoothed through the following sequence: Split Start Retail Fit-Out (on 14 Dec 09) into 14-day and 16-day activities, turn ‘Logic’ off, crash the ‘Start’ activity to 8 days from its start node and double its crew to 4 carpenters, drift the 8-day ‘Start’ activity by 1 day and turn ‘Logic’ back on
Resource loading is further smoothed by doubling the duration of Start Retail Fit-Out and reducing the crew to 2 carpenters
STEP 5 STEP 6STEP 4
34Logic Gantt Chart RIP© 2
012-
2013
PM
A C
onsu
ltant
s LL
C
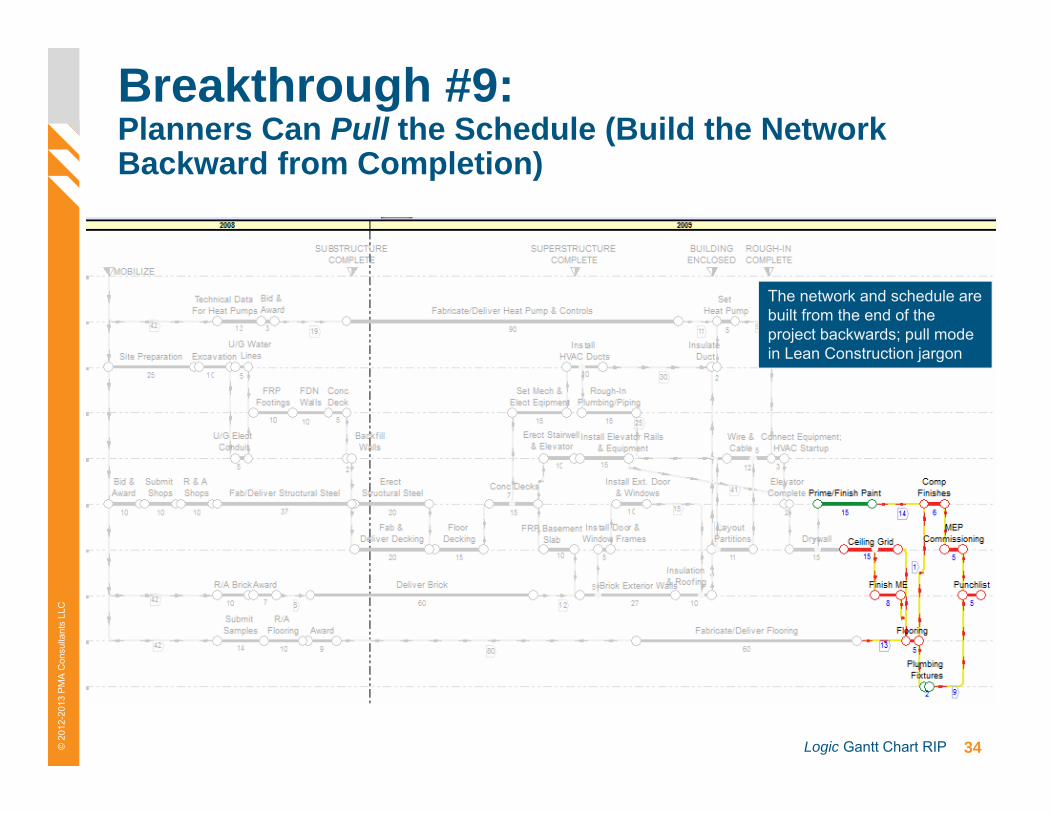
Breakthrough #9: Planners Can Pull the Schedule (Build the Network Backward from Completion)
The network and schedule are built from the end of the project backwards; pull mode in Lean Construction jargon
35Logic Gantt Chart RIP© 2
012-
2013
PM
A C
onsu
ltant
s LL
C
Page 35
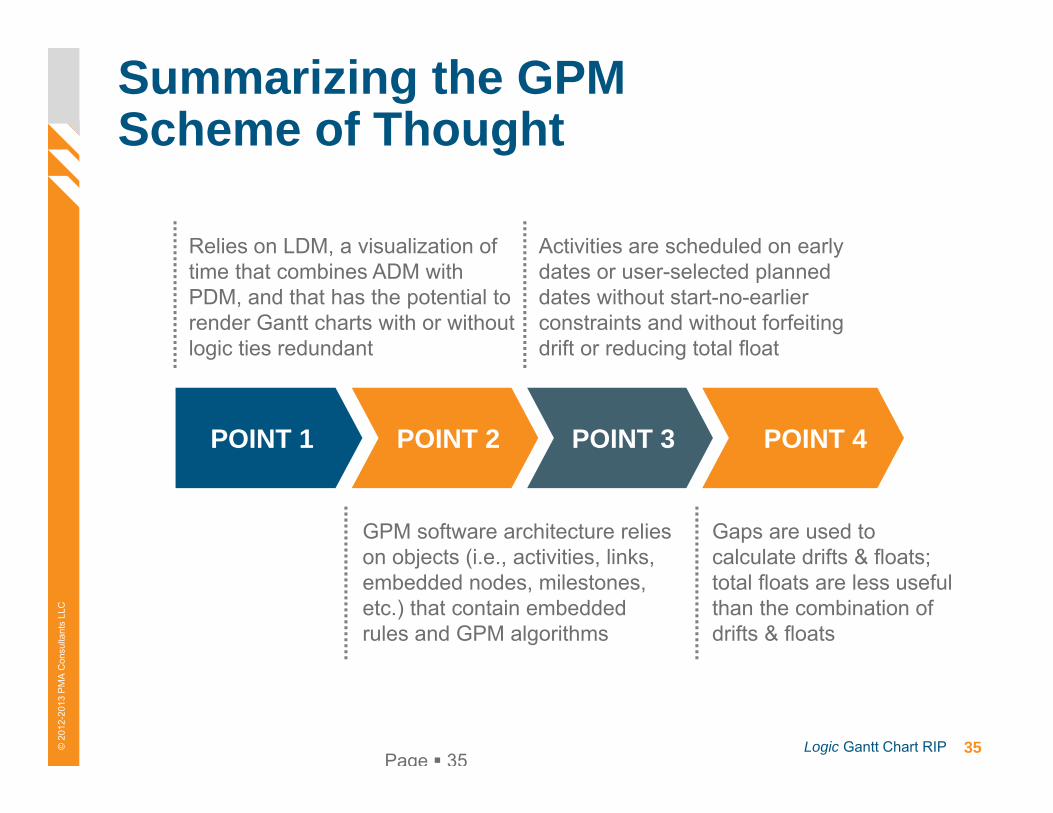
Summarizing the GPM Scheme of Thought
Relies on LDM, a visualization of time that combines ADM with PDM, and that has the potential to render Gantt charts with or without logic ties redundant
Activities are scheduled on early dates or user-selected planned dates without start-no-earlier constraints and without forfeiting drift or reducing total float
GPM software architecture relies on objects (i.e., activities, links, embedded nodes, milestones, etc.) that contain embedded rules and GPM algorithms
Gaps are used to calculate drifts & floats; total floats are less useful than the combination of drifts & floats
POINT 1 POINT 2 POINT 3 POINT 4
36Logic Gantt Chart RIP© 2
012-
2013
PM
A C
onsu
ltant
s LL
C
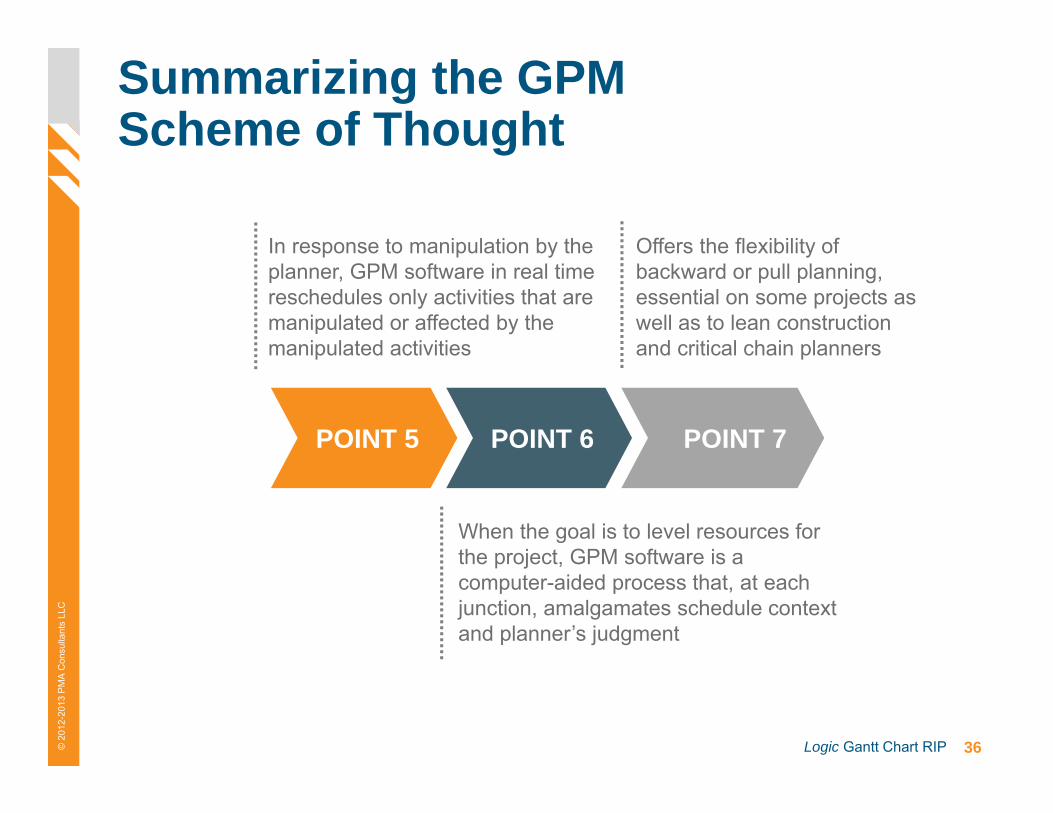
Summarizing the GPM Scheme of Thought
In response to manipulation by the planner, GPM software in real time reschedules only activities that are manipulated or affected by the manipulated activities
Offers the flexibility of backward or pull planning, essential on some projects as well as to lean construction and critical chain planners
When the goal is to level resources for the project, GPM software is a computer-aided process that, at each junction, amalgamates schedule context and planner’s judgment
POINT 5 POINT 6 POINT 7
37Logic Gantt Chart RIP© 2
012-
2013
PM
A C
onsu
ltant
s LL
C
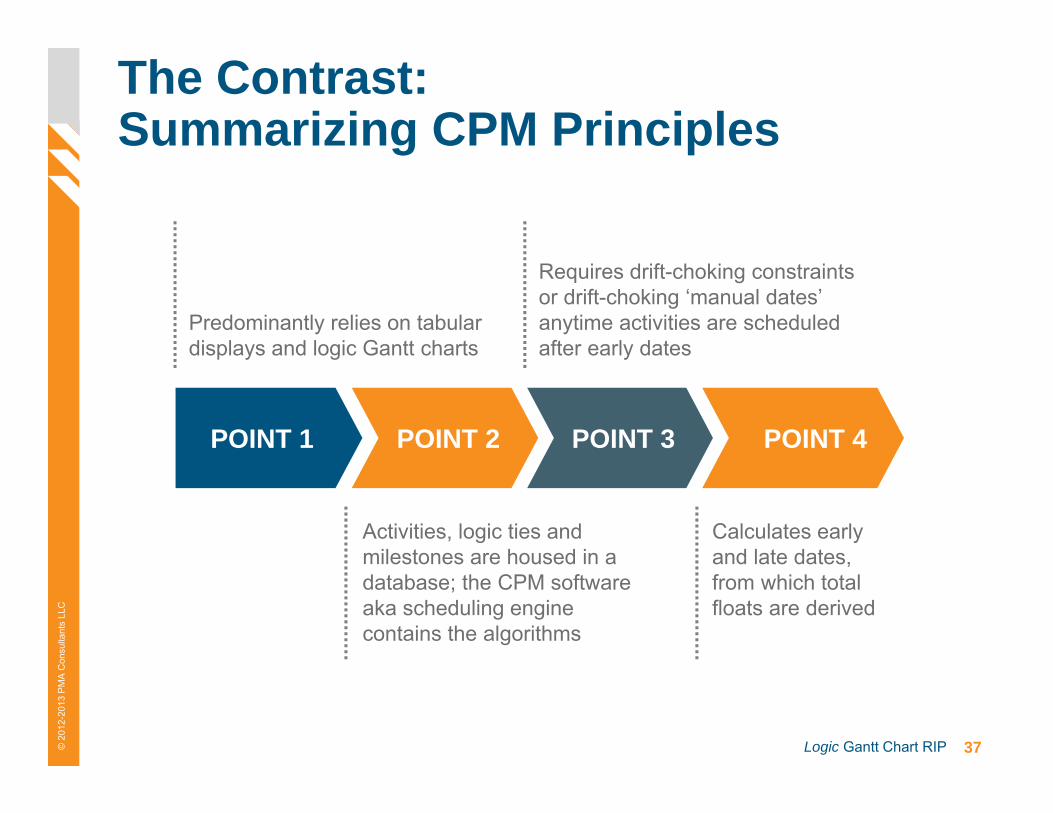
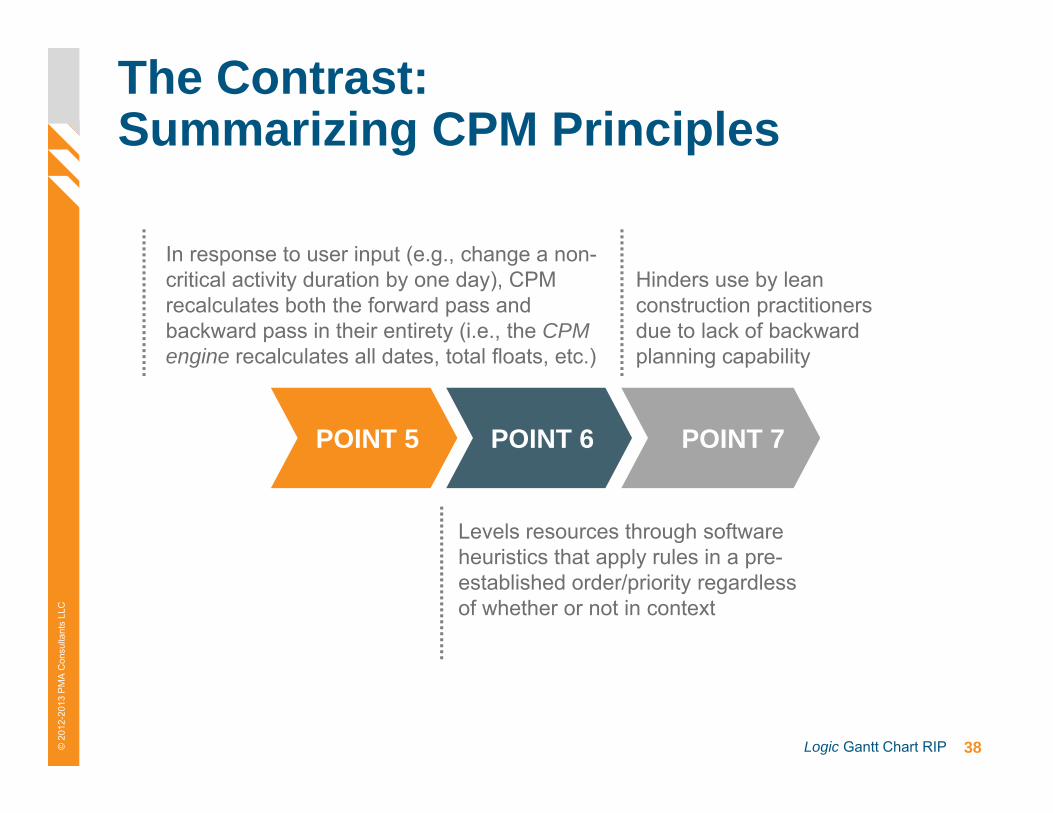
The Contrast: Summarizing CPM Principles
Predominantly relies on tabular displays and logic Gantt charts
Requires drift-choking constraints or drift-choking ‘manual dates’ anytime activities are scheduled after early dates
Activities, logic ties and milestones are housed in a database; the CPM software aka scheduling engine contains the algorithms
Calculates early and late dates, from which total floats are derived
POINT 1 POINT 2 POINT 3 POINT 4
38Logic Gantt Chart RIP© 2
012-
2013
PM
A C
onsu
ltant
s LL
C
The Contrast: Summarizing CPM Principles
In response to user input (e.g., change a non-critical activity duration by one day), CPM recalculates both the forward pass and backward pass in their entirety (i.e., the CPM engine recalculates all dates, total floats, etc.)
Hinders use by lean construction practitioners due to lack of backward planning capability
Levels resources through software heuristics that apply rules in a pre-established order/priority regardless of whether or not in context
POINT 5 POINT 6 POINT 7
39Logic Gantt Chart RIP© 2
012-
2013
PM
A C
onsu
ltant
s LL
C
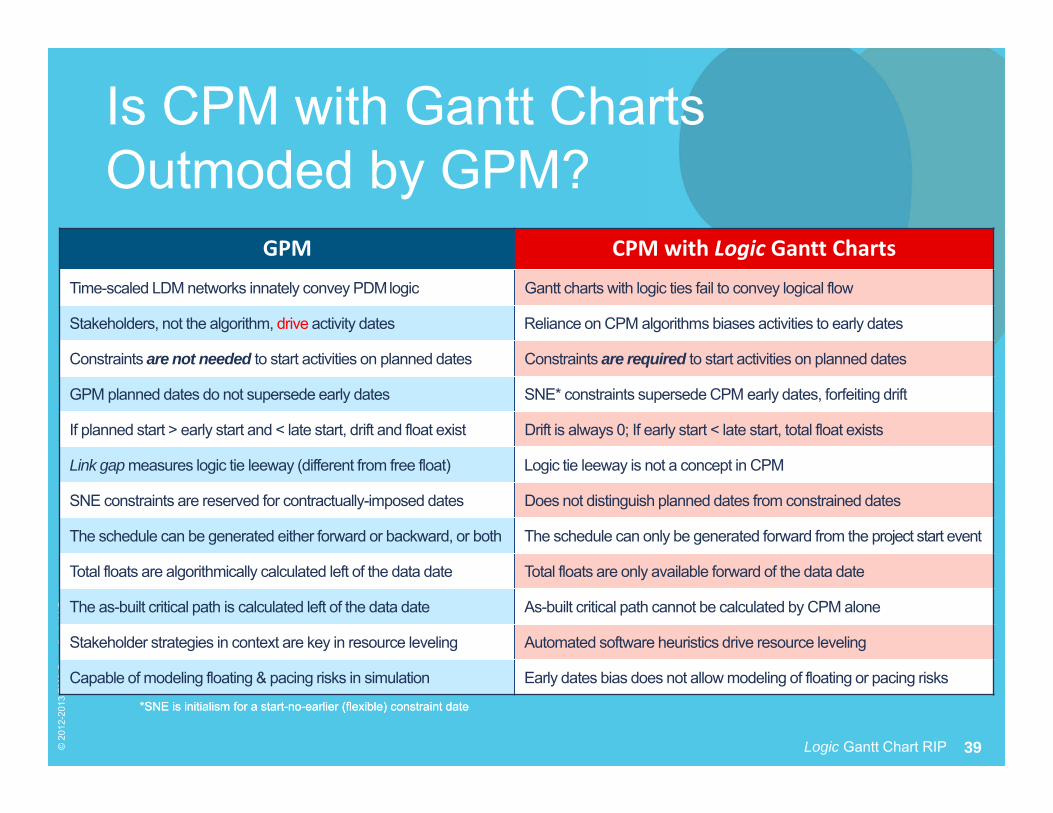
Is CPM with Gantt Charts Outmoded by GPM?
*SNE is initialism for a start-no-earlier (flexible) constraint date*SNE is initialism for a start-no-earlier (flexible) constraint date
GPM CPM with Logic Gantt Charts
Time-scaled LDM networks innately convey PDMlogic Gantt charts with logic ties fail to convey logical flow
Stakeholders, not the algorithm, drive activity dates Reliance on CPM algorithms biases activities to early dates
Constraints are not needed to start activities on planned dates Constraints are required to start activities on planned dates
GPM planned dates do not supersede early dates SNE* constraints supersede CPM early dates, forfeiting drift
If planned start > early start and < late start, drift and float exist Drift is always 0; If early start < late start, total float exists
Link gap measures logic tie leeway (different from free float) Logic tie leeway is not a concept in CPM
SNE constraints are reserved for contractually-imposed dates Does not distinguish planned dates from constrained dates
The schedule can be generated either forward or backward, or both The schedule can only be generated forward from the project start event
Total floats are algorithmically calculated left of the data date Total floats are only available forward of the data date
The as-built critical path is calculated left of the data date As-built critical path cannot be calculated by CPM alone
Stakeholder strategies in context are key in resource leveling Automated software heuristics drive resource leveling
Capable of modeling floating & pacing risks in simulation Early dates bias does not allow modeling of floating or pacing risks
40Logic Gantt Chart RIP© 2
012-
2013
PM
A C
onsu
ltant
s LL
C
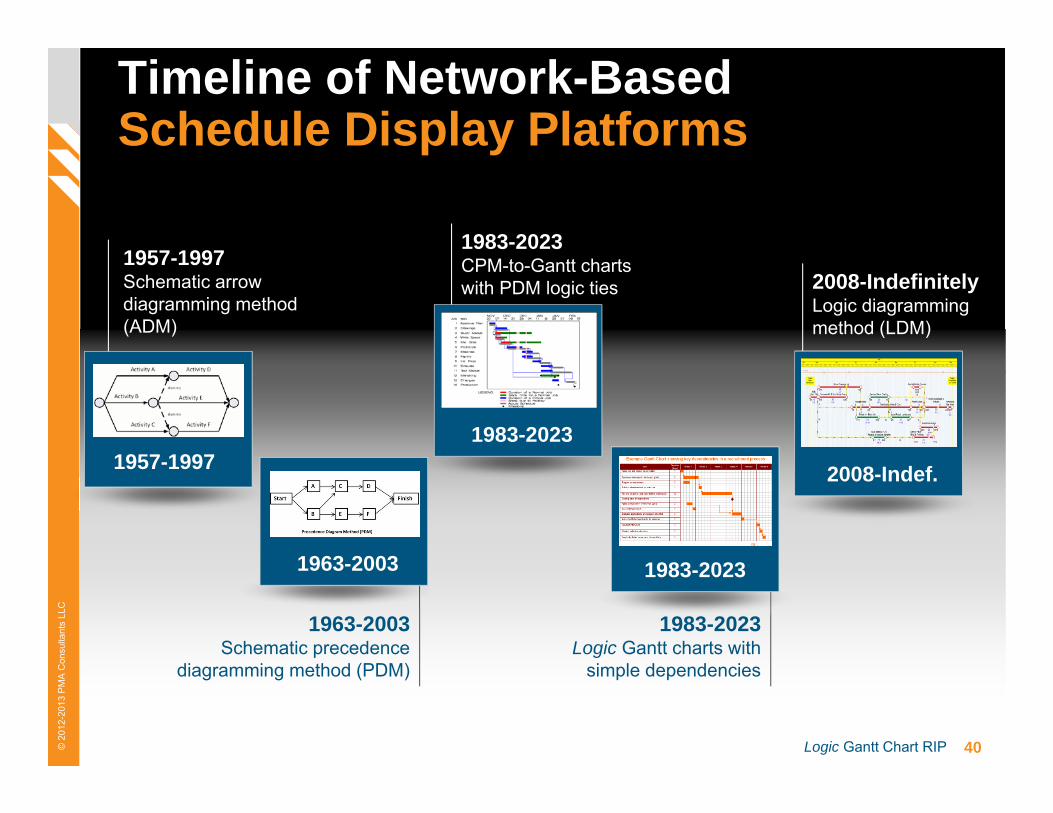
Timeline of Network-BasedSchedule Display Platforms
1983-20231957-1997
1957-1997Schematic arrow diagramming method (ADM)
2008-IndefinitelyLogic diagramming method (LDM)
1963-2003Schematic precedence
diagramming method (PDM)
1983-2023Logic Gantt charts with
simple dependencies
1963-2003 1983-2023
2008-Indef.
1983-2023CPM-to-Gantt charts with PDM logic ties
41Logic Gantt Chart RIP© 2
012-
2013
PM
A C
onsu
ltant
s LL
C
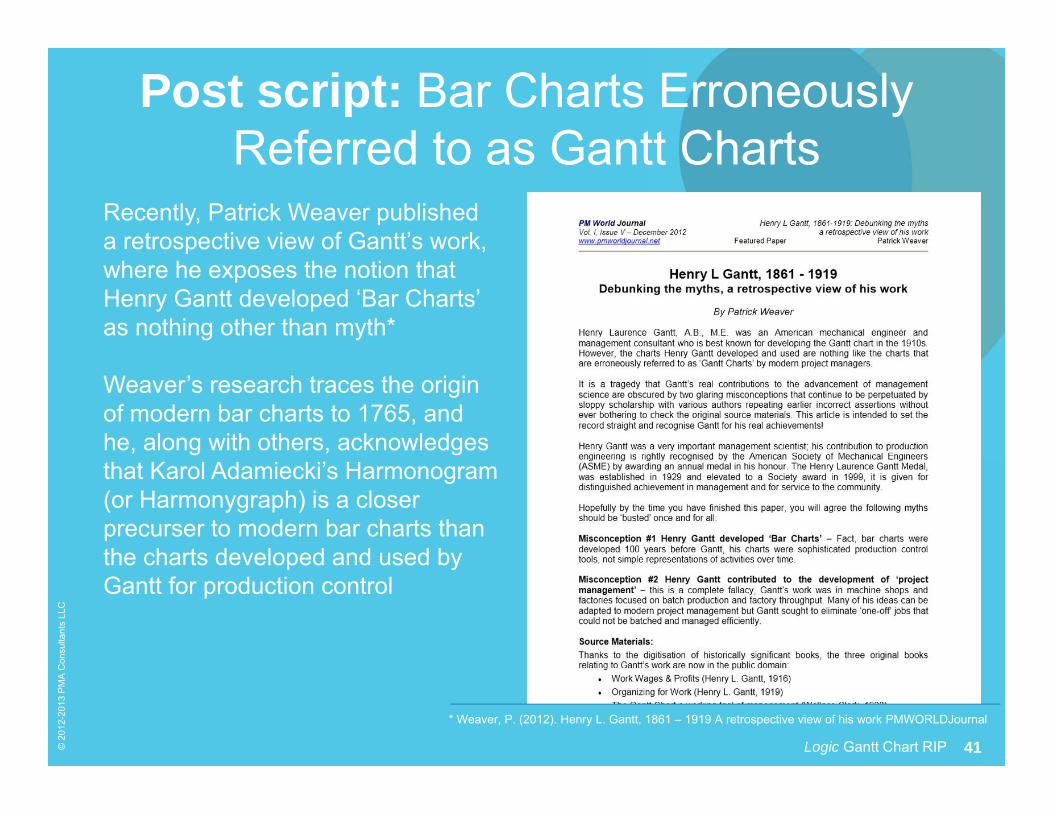
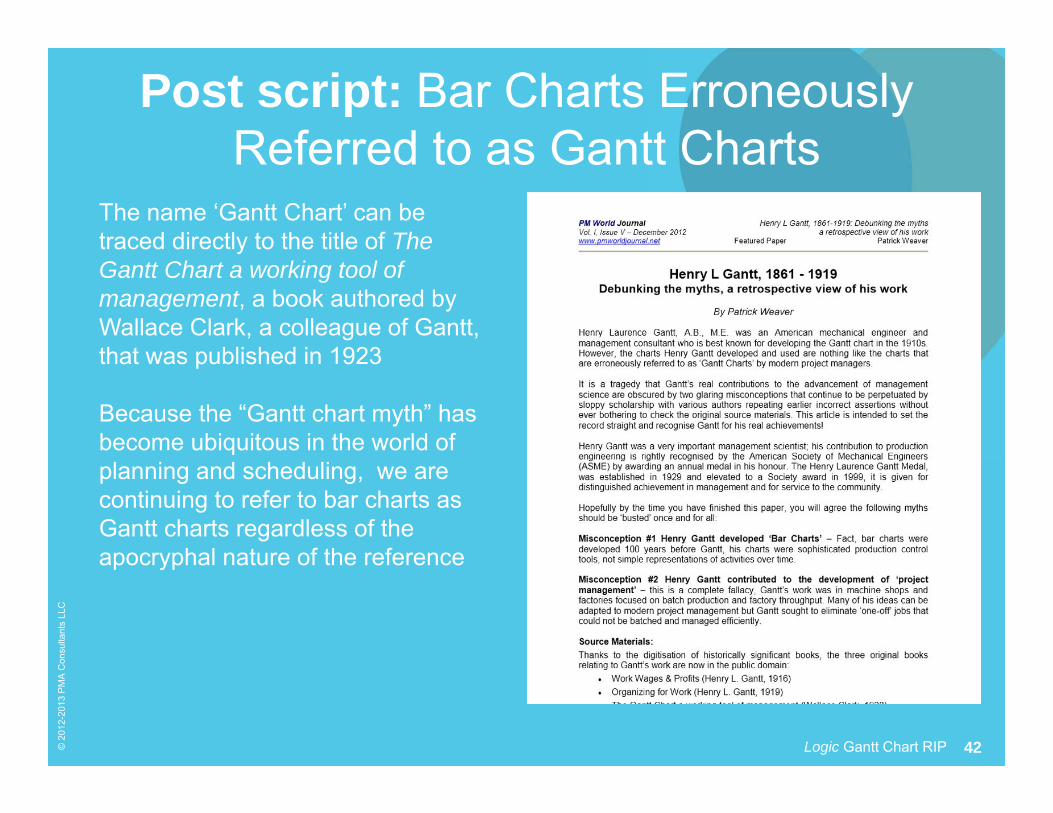
Post script: Bar Charts Erroneously Referred to as Gantt Charts
* Weaver, P. (2012). Henry L. Gantt, 1861 – 1919 A retrospective view of his work PMWORLDJournal
Recently, Patrick Weaver published a retrospective view of Gantt’s work, where he exposes the notion that Henry Gantt developed ‘Bar Charts’ as nothing other than myth*
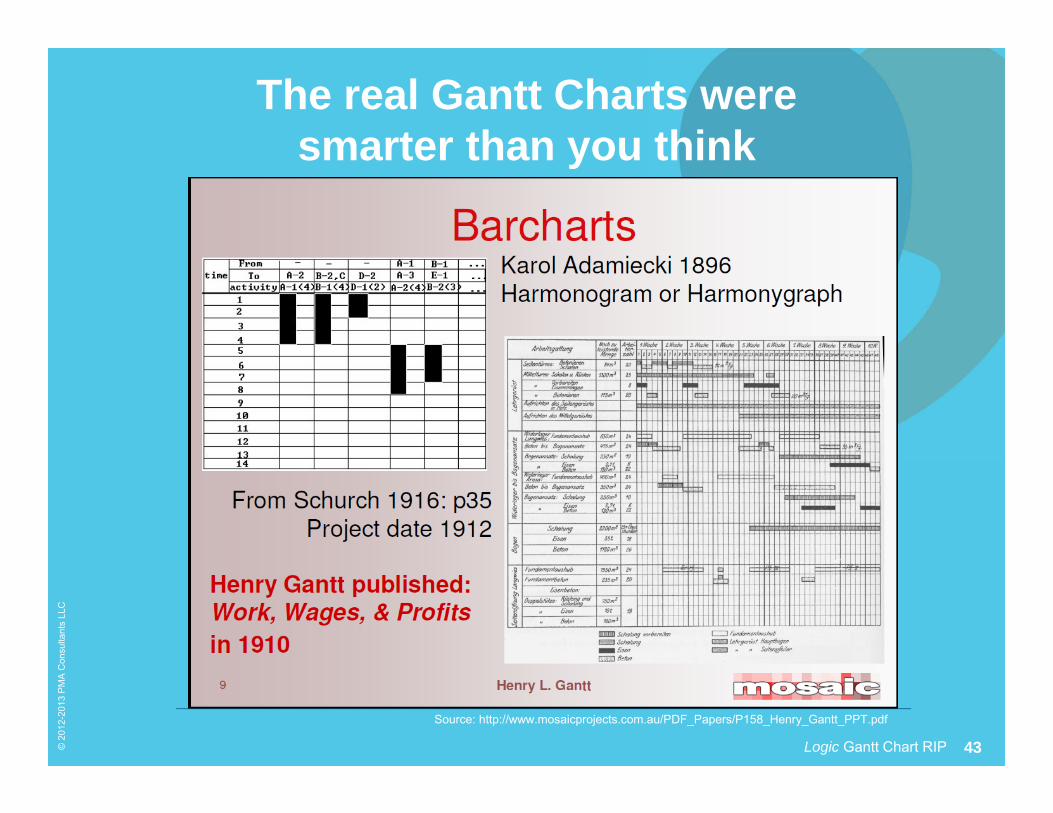
Weaver’s research traces the origin of modern bar charts to 1765, and he, along with others, acknowledges that Karol Adamiecki’s Harmonogram(or Harmonygraph) is a closer precurser to modern bar charts than the charts developed and used by Gantt for production control
42Logic Gantt Chart RIP© 2
012-
2013
PM
A C
onsu
ltant
s LL
C
The name ‘Gantt Chart’ can be traced directly to the title of TheGantt Chart a working tool of management, a book authored by Wallace Clark, a colleague of Gantt, that was published in 1923
Because the “Gantt chart myth” has become ubiquitous in the world of planning and scheduling, we are continuing to refer to bar charts as Gantt charts regardless of the apocryphal nature of the reference
Post script: Bar Charts Erroneously Referred to as Gantt Charts
43Logic Gantt Chart RIP© 2
012-
2013
PM
A C
onsu
ltant
s LL
C
The real Gantt Charts were smarter than you think
Source: http://www.mosaicprojects.com.au/PDF_Papers/P158_Henry_Gantt_PPT.pdf
44Logic Gantt Chart RIP© 2
012-
2013
PM
A C
onsu
ltant
s LL
C
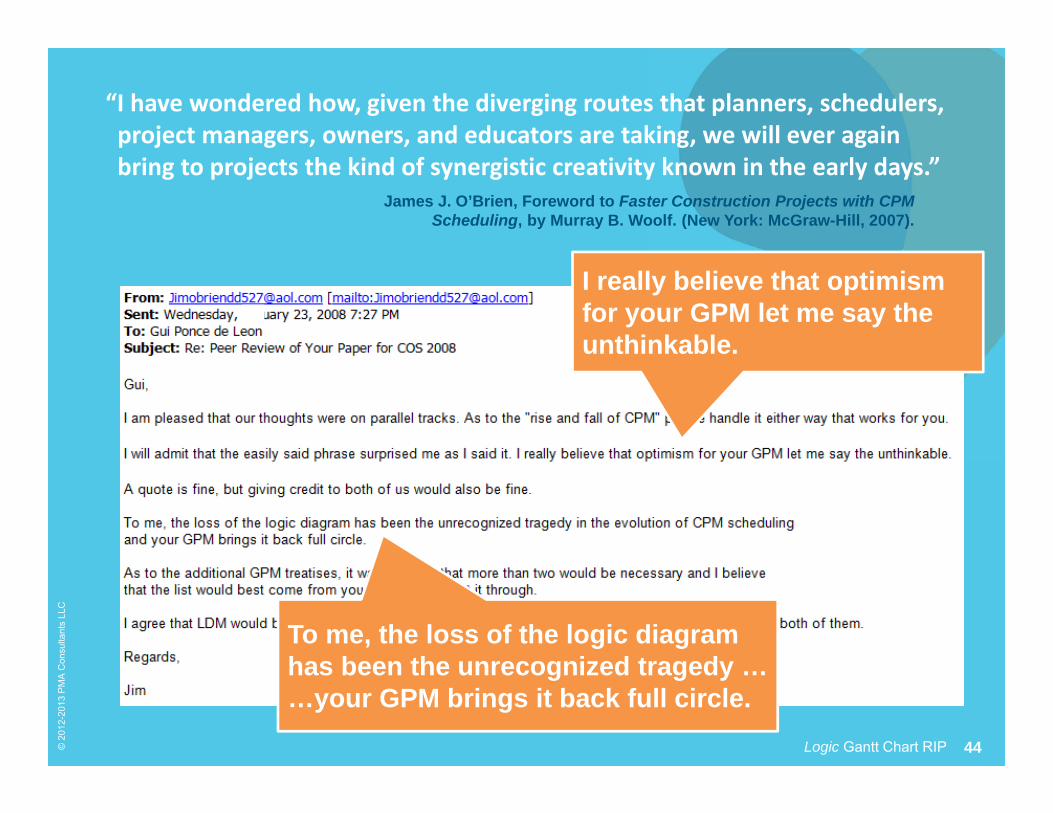
“I have wondered how, given the diverging routes that planners, schedulers, project managers, owners, and educators are taking, we will ever again bring to projects the kind of synergistic creativity known in the early days.”
James J. O’Brien, Foreword to Faster Construction Projects with CPM Scheduling, by Murray B. Woolf. (New York: McGraw-Hill, 2007).
I really believe that optimism for your GPM let me say the unthinkable.
To me, the loss of the logic diagram has been the unrecognized tragedy ……your GPM brings it back full circle.
45Logic Gantt Chart RIP© 2
012-
2013
PM
A C
onsu
ltant
s LL
C
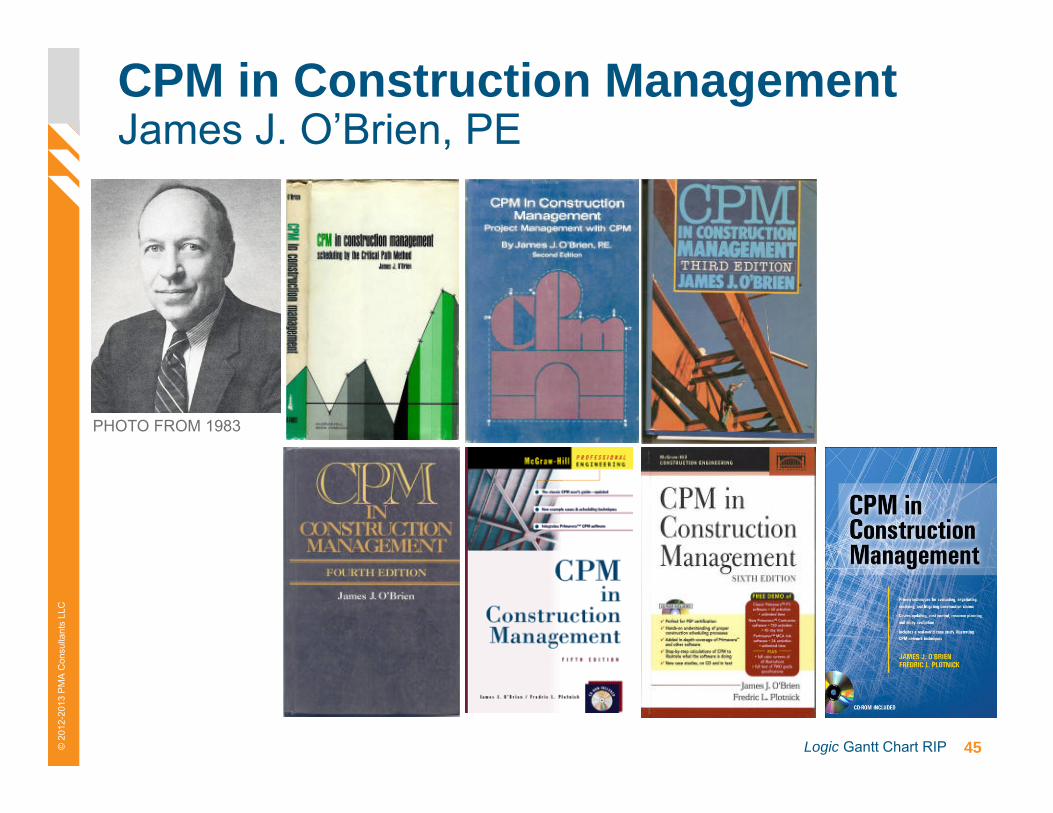
CPM in Construction ManagementJames J. O’Brien, PE
PHOTO FROM 1983

46Logic Gantt Chart RIP© 2
012-
2013
PM
A C
onsu
ltant
s LL
C
Testimonial from Virginia Tech Prof. de la Garza
Vecellio Professor of Construction Engineering & ManagementDepartment of Civil & Environmental EngineeringVirginia Tech - Civil and Environmental Engineering
Jesus M. de la Garza, PhD
I have been using NetPoint and GPM in my project controls classes for a few years now. NetPoint is intuitive for the students and they don’t have to struggle with the tool in order to build quality network schedules. In fact, NetPoint’s combined time scale and Logic Diagramming Method (LDM) create a much clearer graphical representation of the schedule than other scheduling tools. Students can concentrate on learning quality scheduling rather than learning a scheduling software tool.
“
”
47Logic Gantt Chart RIP© 2
012-
2013
PM
A C
onsu
ltant
s LL
C
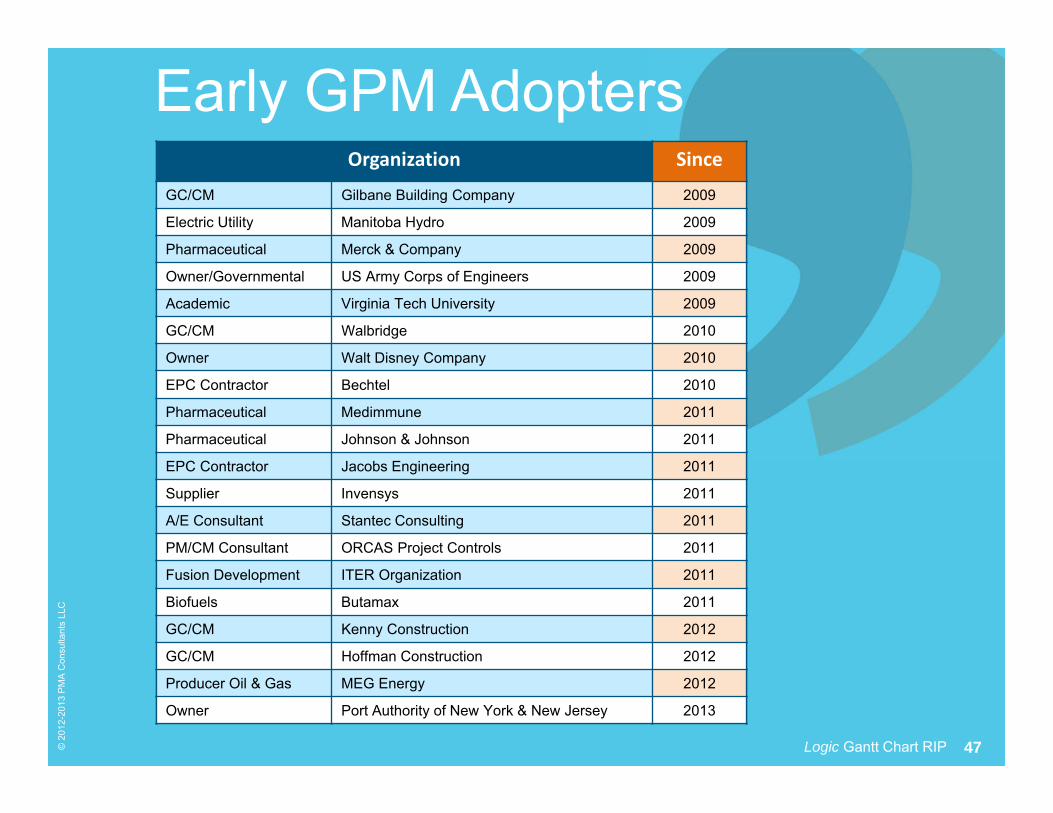
Early GPM AdoptersOrganization Since
GC/CM Gilbane Building Company 2009
Electric Utility Manitoba Hydro 2009
Pharmaceutical Merck & Company 2009
Owner/Governmental US Army Corps of Engineers 2009
Academic Virginia Tech University 2009
GC/CM Walbridge 2010
Owner Walt Disney Company 2010
EPC Contractor Bechtel 2010
Pharmaceutical Medimmune 2011
Pharmaceutical Johnson & Johnson 2011
EPC Contractor Jacobs Engineering 2011
Supplier Invensys 2011
A/E Consultant Stantec Consulting 2011
PM/CM Consultant ORCAS Project Controls 2011
Fusion Development ITER Organization 2011
Biofuels Butamax 2011
GC/CM Kenny Construction 2012
GC/CM Hoffman Construction 2012
Producer Oil & Gas MEG Energy 2012
Owner Port Authority of New York & New Jersey 2013
48Logic Gantt Chart RIP© 2
012-
2013
PM
A C
onsu
ltant
s LL
C
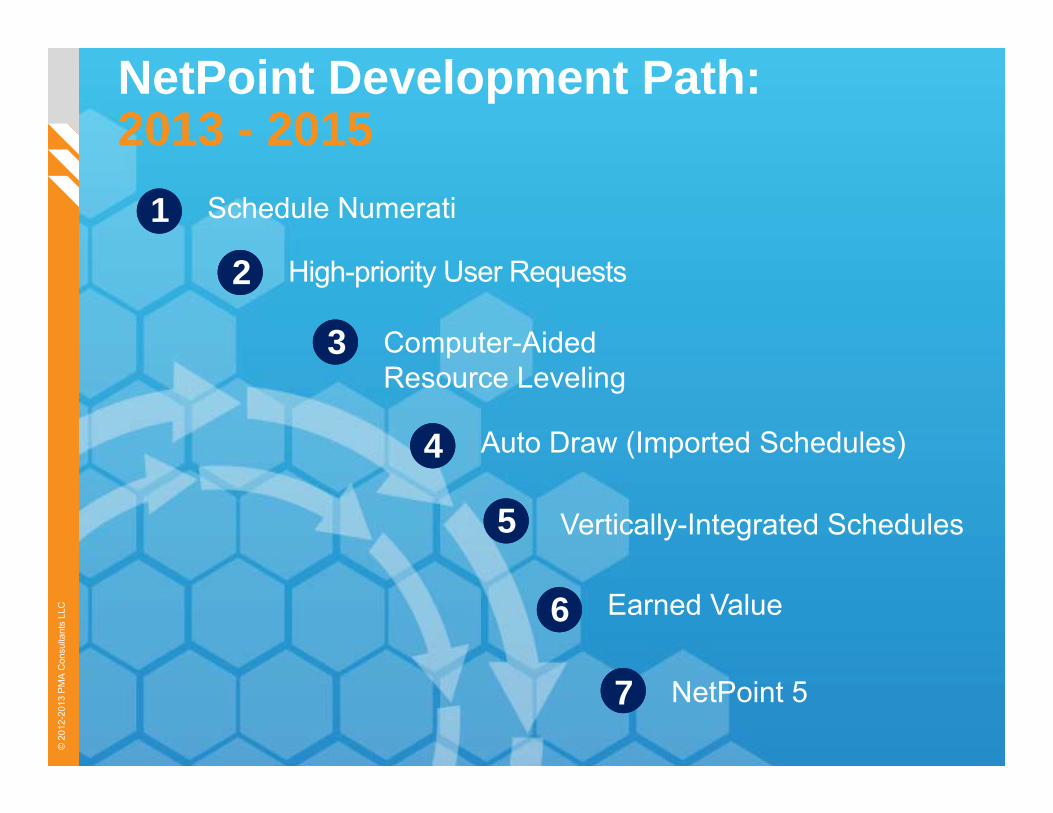
NetPoint Development Path: 2013 - 2015
1 Schedule Numerati
2 High-priority User Requests
3 Computer-Aided Resource Leveling
4 Auto Draw (Imported Schedules)
6 Earned Value
7 NetPoint 5
5 Vertically-Integrated Schedules
49Logic Gantt Chart RIP© 2
012-
2013
PM
A C
onsu
ltant
s LL
C
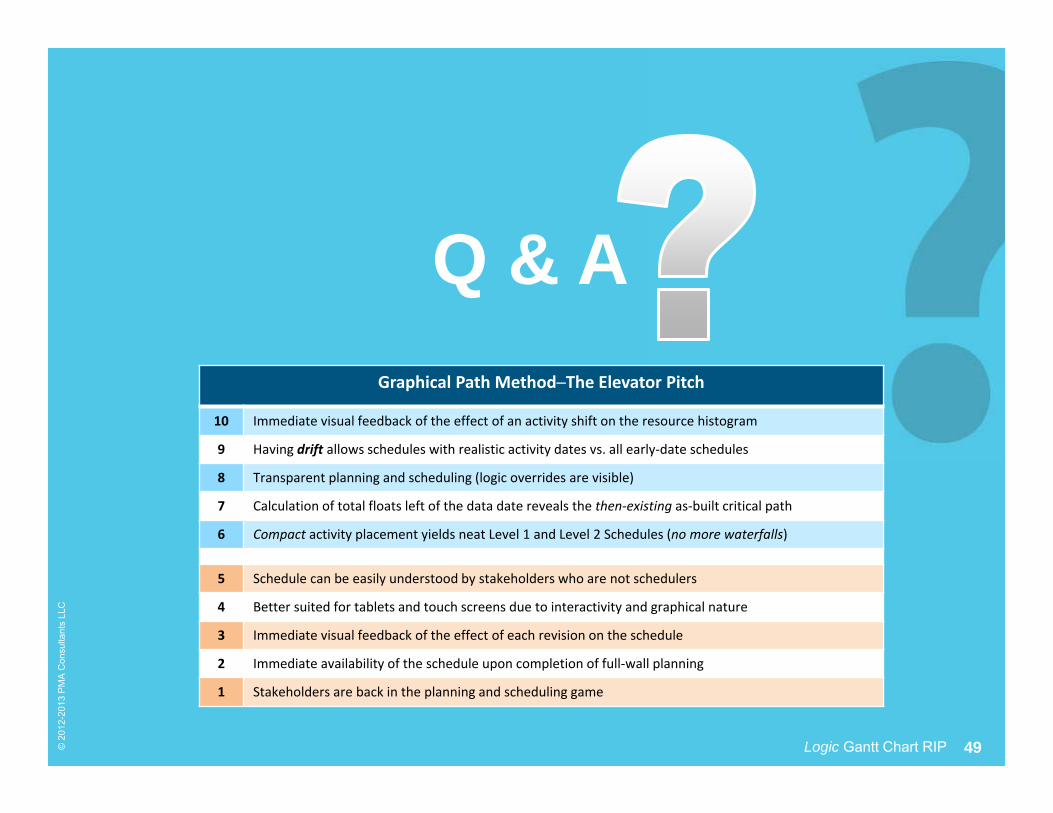
Graphical Path Method─The Elevator Pitch
10 Immediate visual feedback of the effect of an activity shift on the resource histogram
9 Having drift allows schedules with realistic activity dates vs. all early‐date schedules
8 Transparent planning and scheduling (logic overrides are visible)
7 Calculation of total floats left of the data date reveals the then‐existing as‐built critical path
6 Compact activity placement yields neat Level 1 and Level 2 Schedules (no more waterfalls)
5 Schedule can be easily understood by stakeholders who are not schedulers
4 Better suited for tablets and touch screens due to interactivity and graphical nature
3 Immediate visual feedback of the effect of each revision on the schedule
2 Immediate availability of the schedule upon completion of full‐wall planning
1 Stakeholders are back in the planning and scheduling game
Q & A
50Logic Gantt Chart RIP© 2
012-
2013
PM
A C
onsu
ltant
s LL
C
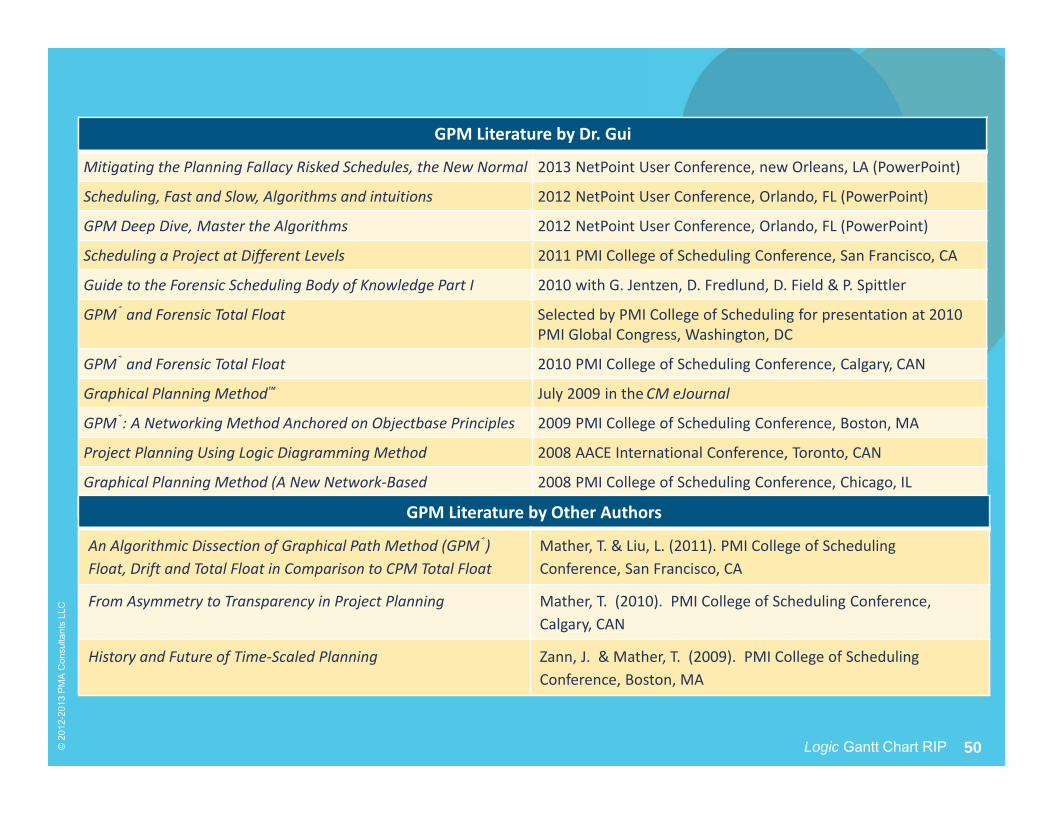
GPM Literature by Dr. Gui
Mitigating the Planning Fallacy Risked Schedules, the New Normal 2013 NetPoint User Conference, new Orleans, LA (PowerPoint)
Scheduling, Fast and Slow, Algorithms and intuitions 2012 NetPoint User Conference, Orlando, FL (PowerPoint)
GPM Deep Dive, Master the Algorithms 2012 NetPoint User Conference, Orlando, FL (PowerPoint)
Scheduling a Project at Different Levels 2011 PMI College of Scheduling Conference, San Francisco, CA
Guide to the Forensic Scheduling Body of Knowledge Part I 2010 with G. Jentzen, D. Fredlund, D. Field & P. Spittler
GPM® and Forensic Total Float Selected by PMI College of Scheduling for presentation at 2010 PMI Global Congress, Washington, DC
GPM® and Forensic Total Float 2010 PMI College of Scheduling Conference, Calgary, CAN
Graphical Planning Method™ July 2009 in theCM eJournal
GPM®: A Networking Method Anchored on Objectbase Principles 2009 PMI College of Scheduling Conference, Boston, MA
Project Planning Using Logic Diagramming Method 2008 AACE International Conference, Toronto, CAN
Graphical Planning Method (A New Network‐Based Planning/Scheduling Paradigm)
2008 PMI College of Scheduling Conference, Chicago, IL
GPM Literature by Other Authors
An Algorithmic Dissection of Graphical Path Method (GPM®) Float, Drift and Total Float in Comparison to CPM Total Float
Mather, T. & Liu, L. (2011). PMI College of Scheduling Conference, San Francisco, CA
From Asymmetry to Transparency in Project Planning Mather, T. (2010). PMI College of Scheduling Conference, Calgary, CAN
History and Future of Time‐Scaled Planning Zann, J. & Mather, T. (2009). PMI College of Scheduling Conference, Boston, MA
51Logic Gantt Chart RIP© 2
012-
2013
PM
A C
onsu
ltant
s LL
C
APPENDIX
GPM Network Development─Basic Rules
Tips for Superior NetPoint Graphics
52Logic Gantt Chart RIP© 2
012-
2013
PM
A C
onsu
ltant
s LL
C
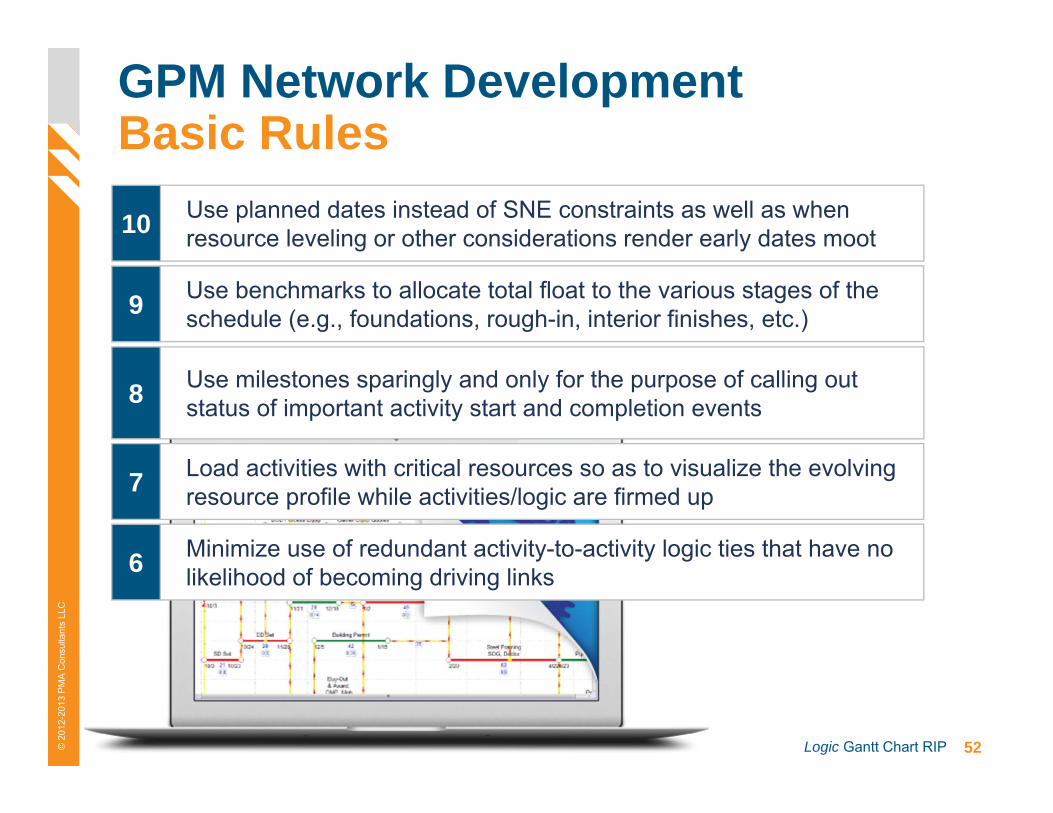
GPM Network DevelopmentBasic Rules
Use planned dates instead of SNE constraints as well as when resource leveling or other considerations render early dates moot 10
Use benchmarks to allocate total float to the various stages of the schedule (e.g., foundations, rough-in, interior finishes, etc.)9
Use milestones sparingly and only for the purpose of calling out status of important activity start and completion events 8
Load activities with critical resources so as to visualize the evolving resource profile while activities/logic are firmed up7
Minimize use of redundant activity-to-activity logic ties that have no likelihood of becoming driving links 6
53Logic Gantt Chart RIP© 2
012-
2013
PM
A C
onsu
ltant
s LL
C
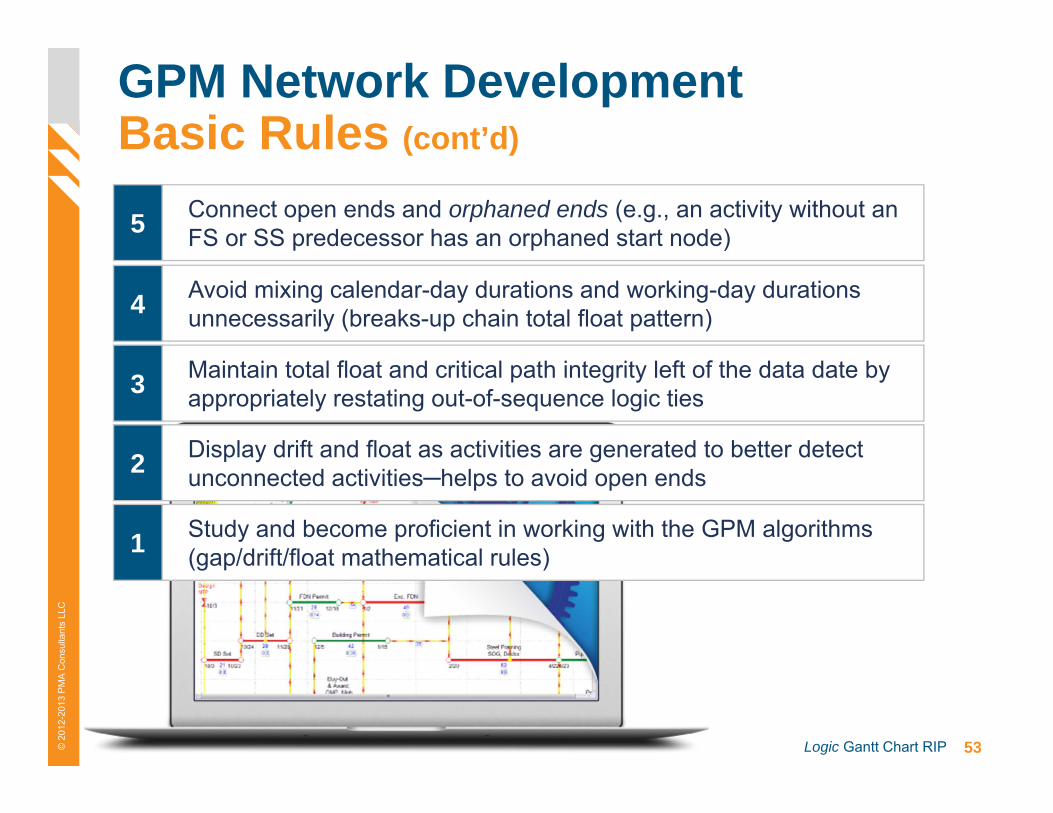
GPM Network DevelopmentBasic Rules (cont’d)
Connect open ends and orphaned ends (e.g., an activity without an FS or SS predecessor has an orphaned start node)5
Avoid mixing calendar-day durations and working-day durations unnecessarily (breaks-up chain total float pattern)4
Maintain total float and critical path integrity left of the data date by appropriately restating out-of-sequence logic ties3
Display drift and float as activities are generated to better detect unconnected activities─helps to avoid open ends2
Study and become proficient in working with the GPM algorithms (gap/drift/float mathematical rules)1
54Logic Gantt Chart RIP© 2
012-
2013
PM
A C
onsu
ltant
s LL
C
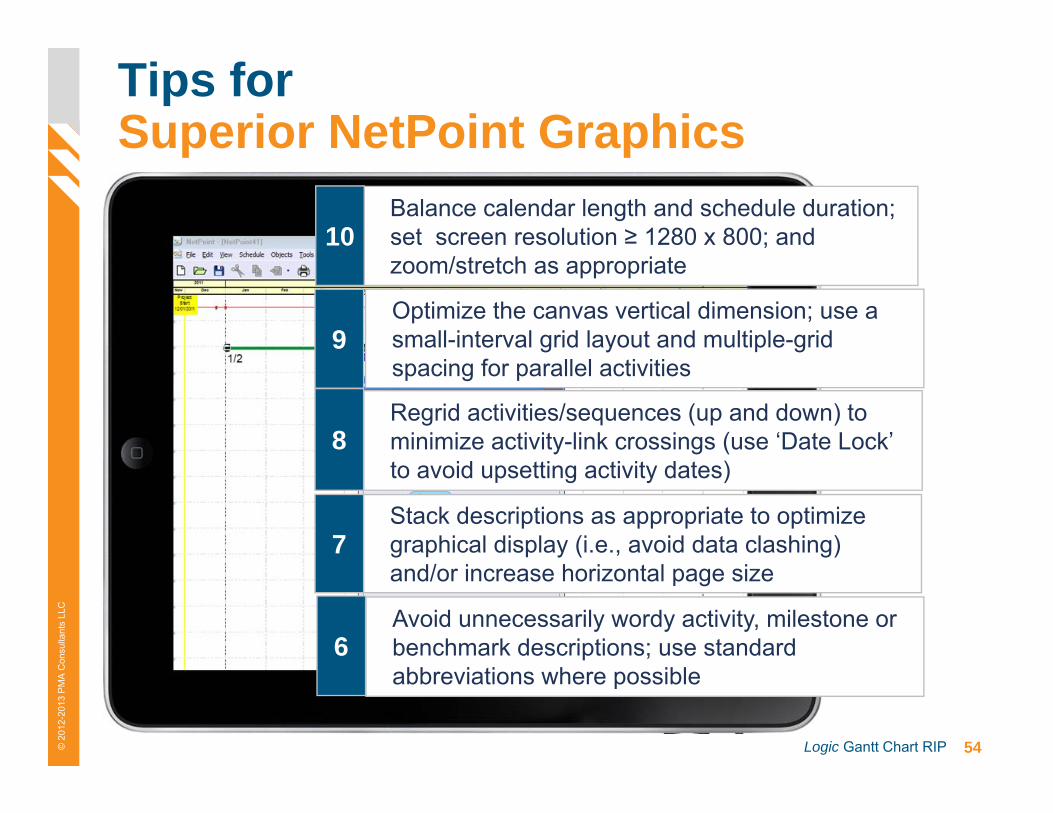
Tips for Superior NetPoint Graphics
Balance calendar length and schedule duration; set screen resolution ≥ 1280 x 800; and zoom/stretch as appropriate
10
Optimize the canvas vertical dimension; use a small-interval grid layout and multiple-grid spacing for parallel activities
9
Regrid activities/sequences (up and down) to minimize activity-link crossings (use ‘Date Lock’ to avoid upsetting activity dates)
8
Stack descriptions as appropriate to optimize graphical display (i.e., avoid data clashing) and/or increase horizontal page size
7
Avoid unnecessarily wordy activity, milestone or benchmark descriptions; use standard abbreviations where possible
6
55Logic Gantt Chart RIP© 2
012-
2013
PM
A C
onsu
ltant
s LL
C
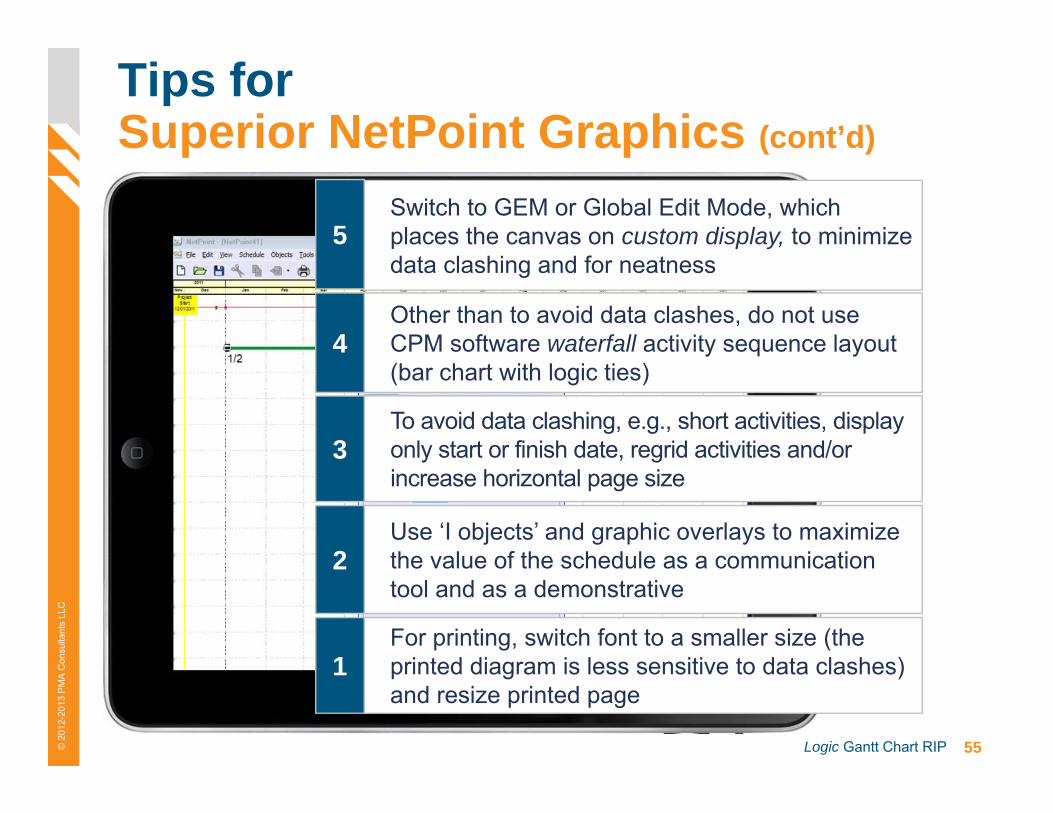
Tips for Superior NetPoint Graphics (cont’d)
Other than to avoid data clashes, do not use CPM software waterfall activity sequence layout (bar chart with logic ties)
4
To avoid data clashing, e.g., short activities, display only start or finish date, regrid activities and/or increase horizontal page size
3
Use ‘I objects’ and graphic overlays to maximize the value of the schedule as a communication tool and as a demonstrative
2
For printing, switch font to a smaller size (the printed diagram is less sensitive to data clashes) and resize printed page
1
Switch to GEM or Global Edit Mode, which places the canvas on custom display, to minimize data clashing and for neatness
5

56Logic Gantt Chart RIP© 2
012-
2013
PM
A C
onsu
ltant
s LL
C
Thank YouGui Ponce de Leon PhD, PE, PMP, LEED AP
Inventor of GPM® and Developer of NetPoint®
Truth in Scheduling™