8.2 Gantt Charts - Philadelphia University Gantt Chart.pdf · Gantt Chart Gantt chart is a...
17
Dr. Tarek A. Tutunji Engineering Skills, Philadelphia University 8.2 Gantt Charts Dr. Tarek A. Tutunji Philadelphia University, Jordan
Transcript of 8.2 Gantt Charts - Philadelphia University Gantt Chart.pdf · Gantt Chart Gantt chart is a...
Dr. Tarek A. TutunjiEngineering Skills, Philadelphia University
8.2 Gantt ChartsDr. Tarek A. Tutunji
Philadelphia University, Jordan
Dr. Tarek A. TutunjiEngineering Skills, Philadelphia University
Overview In the previous section, an introduction to Project
Management was provided.
In this sequence, Gant Charts will be introduced.

Dr. Tarek A. TutunjiEngineering Skills, Philadelphia University
Graphical Project Planning Graphical project planning techniques are very helpful
in project management.
The most commonly used are:
Gantt Charts.
Critical Path Method (CPM).
Dr. Tarek A. TutunjiEngineering Skills, Philadelphia University
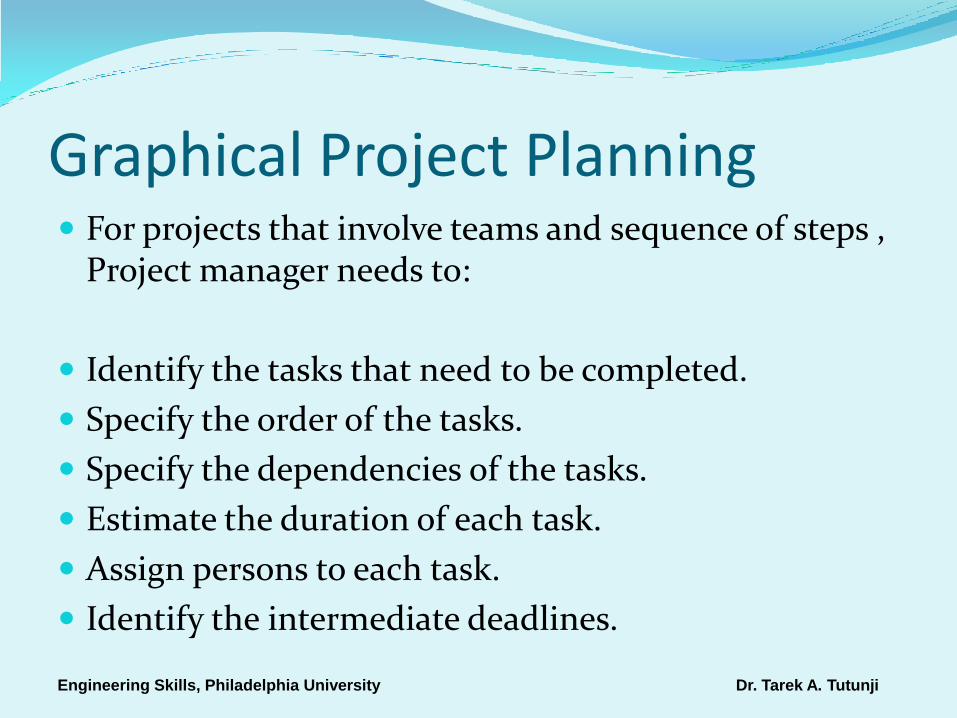
Graphical Project Planning For projects that involve teams and sequence of steps ,
Project manager needs to:
Identify the tasks that need to be completed.
Specify the order of the tasks.
Specify the dependencies of the tasks.
Estimate the duration of each task.
Assign persons to each task.
Identify the intermediate deadlines.
Dr. Tarek A. TutunjiEngineering Skills, Philadelphia University
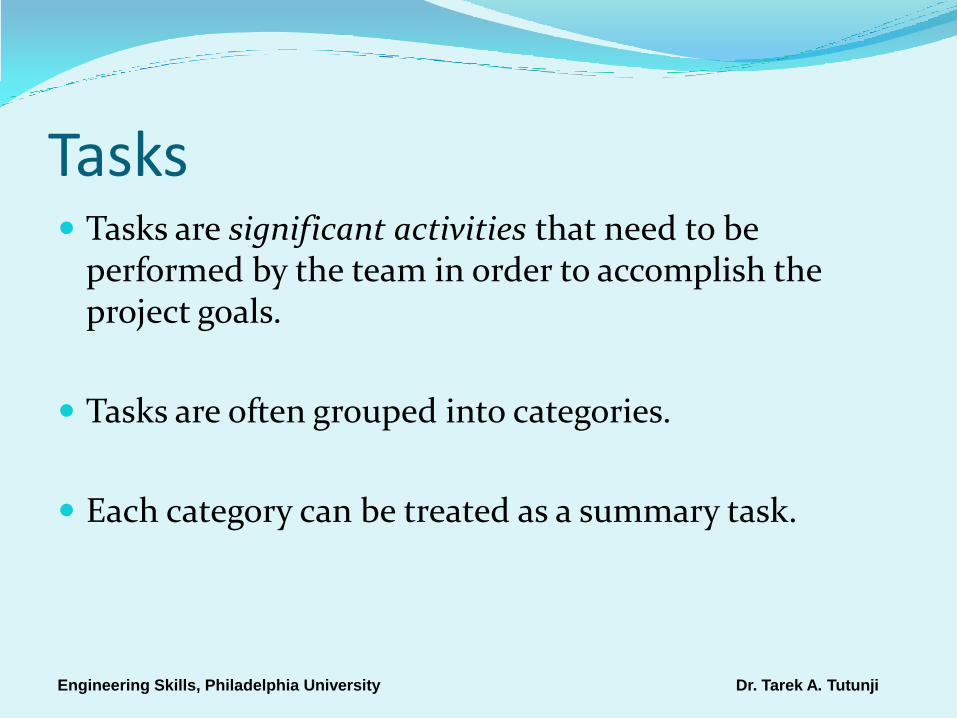
Tasks Tasks are significant activities that need to be
performed by the team in order to accomplish the project goals.
Tasks are often grouped into categories.
Each category can be treated as a summary task.
Dr. Tarek A. TutunjiEngineering Skills, Philadelphia University
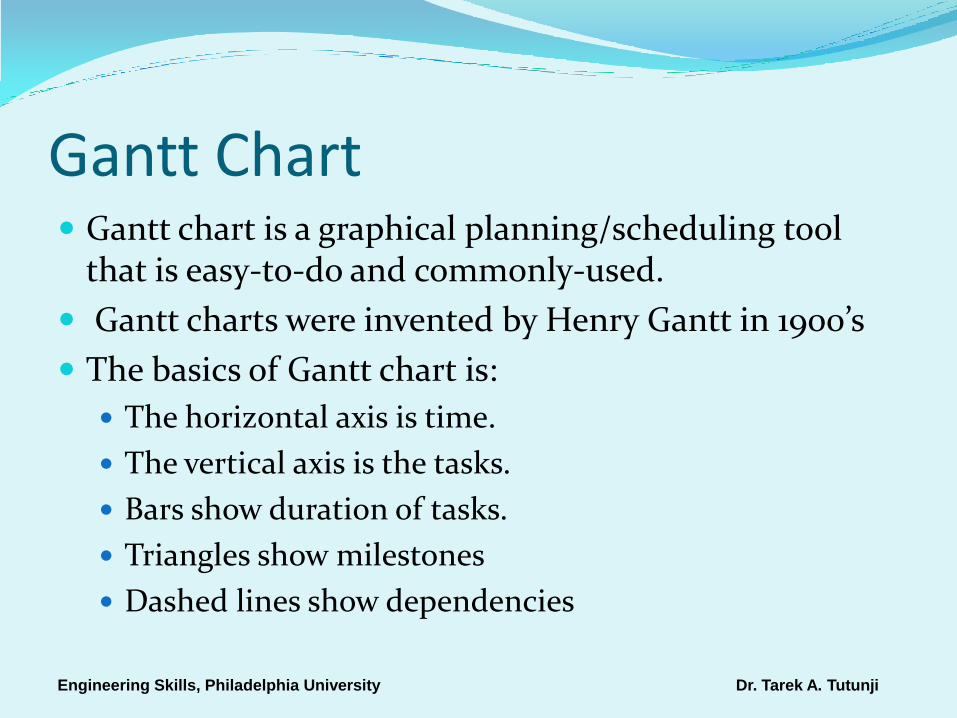
Gantt Chart Gantt chart is a graphical planning/scheduling tool
that is easy-to-do and commonly-used.
Gantt charts were invented by Henry Gantt in 1900’s
The basics of Gantt chart is:
The horizontal axis is time.
The vertical axis is the tasks.
Bars show duration of tasks.
Triangles show milestones
Dashed lines show dependencies
Dr. Tarek A. TutunjiEngineering Skills, Philadelphia University
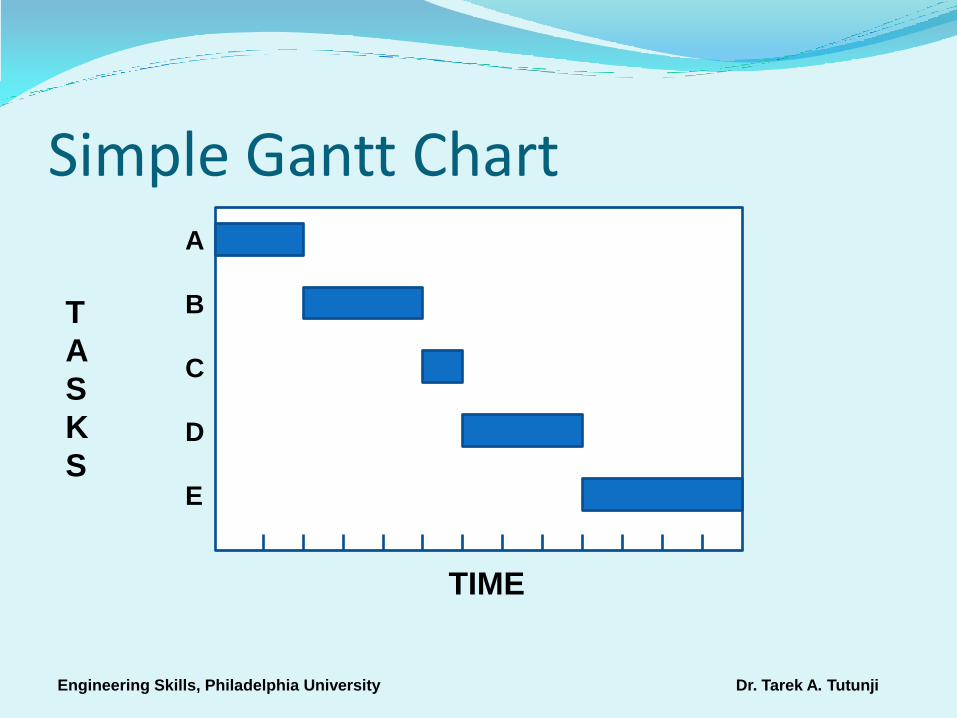
Simple Gantt Chart
T
A
S
K
S
TIME
A
B
C
D
E
Dr. Tarek A. TutunjiEngineering Skills, Philadelphia University
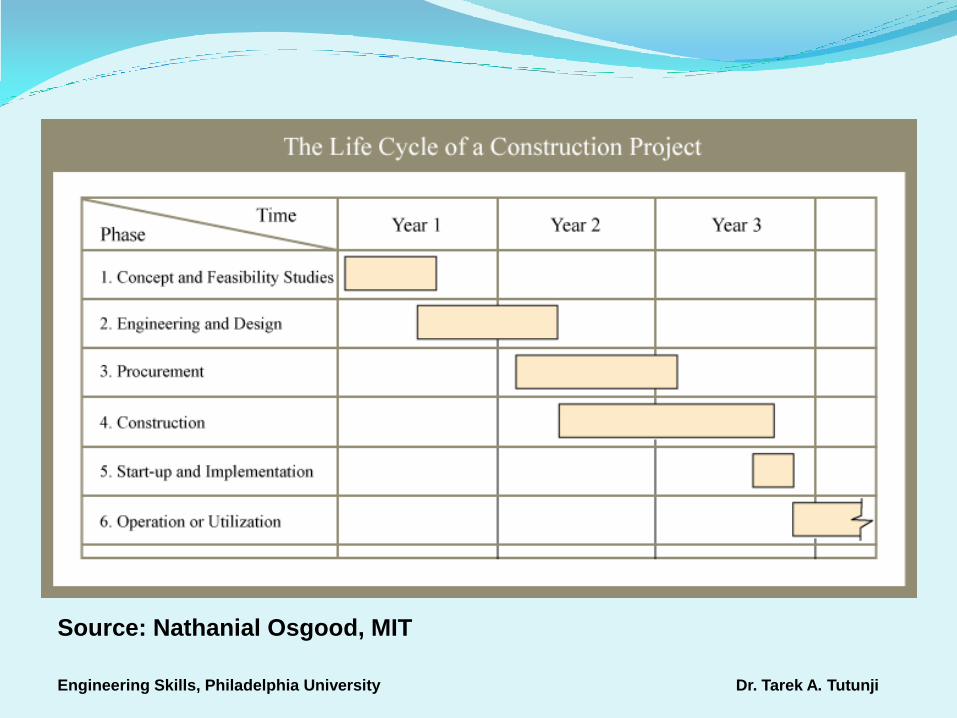
Source: Nathanial Osgood, MIT

Dr. Tarek A. TutunjiEngineering Skills, Philadelphia University
Source: D. Grover, Mechanical Engineering Dept., University of Minnesota
Dr. Tarek A. TutunjiEngineering Skills, Philadelphia University
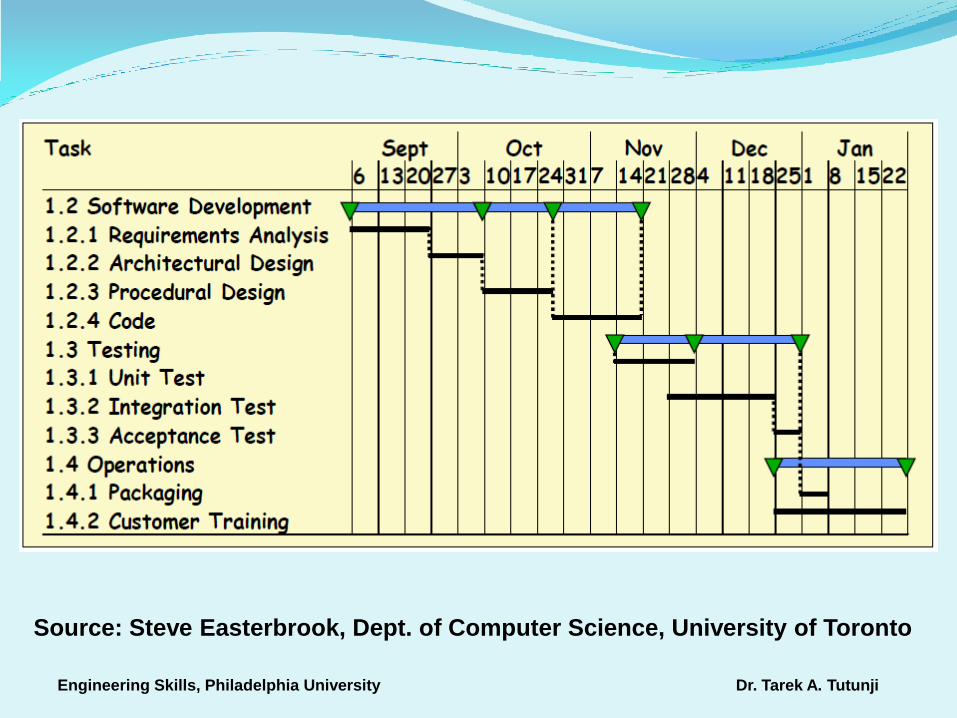
Source: Steve Easterbrook, Dept. of Computer Science, University of Toronto

Dr. Tarek A. TutunjiEngineering Skills, Philadelphia University
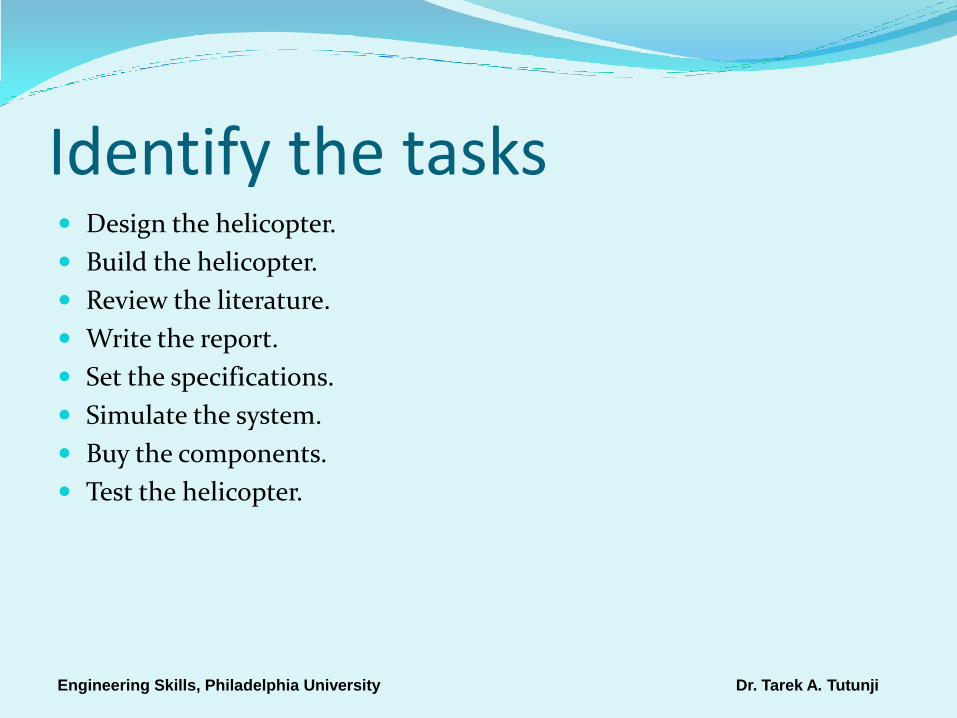
Gantt Chart Example Suppose that you have been assigned the task of
designing and building a toy-helicopter
Dr. Tarek A. TutunjiEngineering Skills, Philadelphia University
Identify the tasks Design the helicopter.
Build the helicopter.
Review the literature.
Write the report.
Set the specifications.
Simulate the system.
Buy the components.
Test the helicopter.
Dr. Tarek A. TutunjiEngineering Skills, Philadelphia University
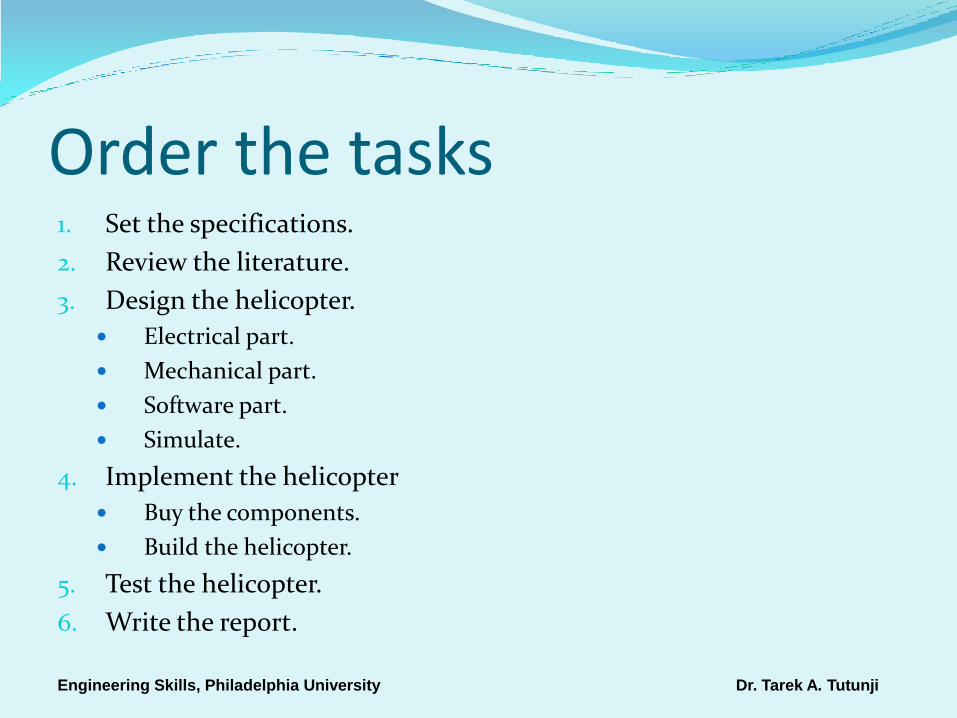
Order the tasks1. Set the specifications.
2. Review the literature.
3. Design the helicopter.
Electrical part.
Mechanical part.
Software part.
Simulate.
4. Implement the helicopter
Buy the components.
Build the helicopter.
5. Test the helicopter.
6. Write the report.

Dr. Tarek A. TutunjiEngineering Skills, Philadelphia University
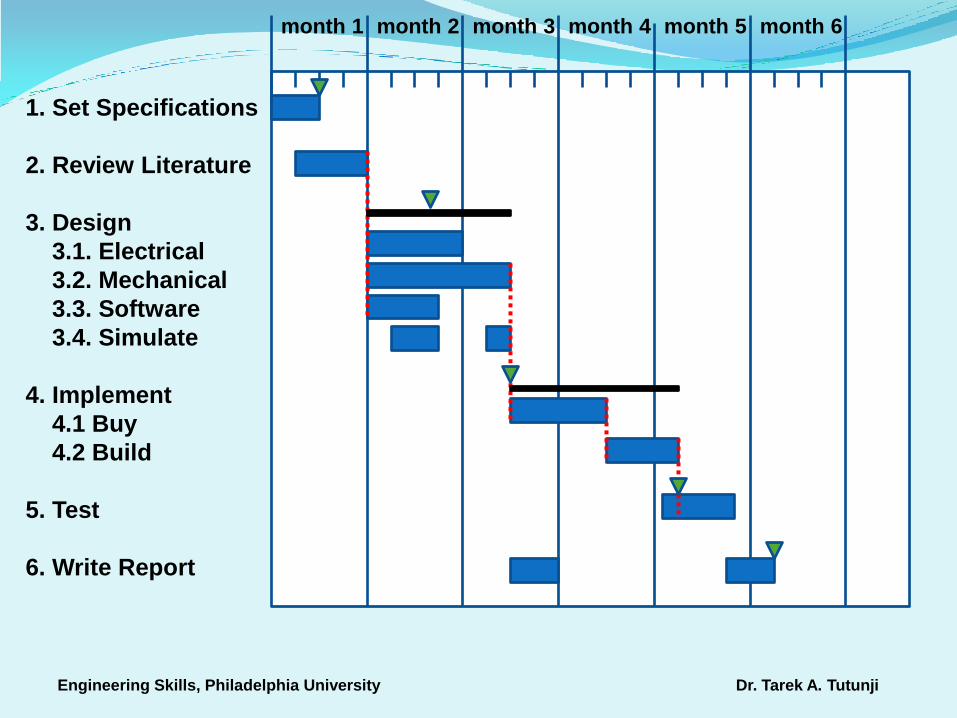
Estimate time for each tasks1. Set the specifications 2 week
2. Review the literature. 3 weeks
3. Design the helicopter.
Electrical part. 4 weeks
Mechanical part. 6 weeks
Software part. 3 weeks
Simulate 3 weeks
4. Implement the helicopter
Buy the components. 4 weeks
Build the helicopter. 3 weeks
5. Test the helicopter. 3 weeks
6. Write the report. 4 weeks
Dr. Tarek A. TutunjiEngineering Skills, Philadelphia University
month 1 month 2 month 3 month 4 month 5 month 6
1. Set Specifications
2. Review Literature
3. Design
3.1. Electrical
3.2. Mechanical
3.3. Software
3.4. Simulate
4. Implement
4.1 Buy
4.2 Build
5. Test
6. Write Report

Dr. Tarek A. TutunjiEngineering Skills, Philadelphia University
Gantt Chart Advantages Easy-way to plan-and-read project schedule
Time is explicit.
All tasks are visible.
The relationship among the tasks is shown.
Deadlines are shown.
Project status and progress can be determined.

Dr. Tarek A. TutunjiEngineering Skills, Philadelphia University
Conclusions In this sequence, graphical project planning
techniques were introduced.
A commonly-used graphical planning technique is the Gantt charts.
In this sequence, Gantt charts were presented and several examples using this technique were shown.