Laboratoire de Psychologie Sociale et Cognitive, CNRS ...
55
Perception and evaluation in human-robot interaction: The Human-Robot Interaction Evaluation Scale (HRIES) ± a multicomponent approach of anthropomorphism Spatola, Nicolas 1,2 ; Kühnlenz, Barbara 3 ; Cheng, Gordon 3 1. Laboratoire de Psychologie Sociale et Cognitive, CNRS, UMR6024, Clermont Auvergne Université, France 2. University of Potsdam, Department of Education, Potsdam, Germany 3. Institute for Cognitive Systems, Department of Electrical and Computer Engineering, Technical University of Munich, Germany. Corresponding author: Nicolas Spatola CNRS and Université Clermont Auvergne Laboratoire de Psychologie Sociale et Cognitive (LAPSCO ± UMR CNRS 6024) 34, avenue Carnot 63037 Clermont-Ferrand FRANCE E-mail: [email protected] Phone: + 33 699 729 467 Fax: + 33 473 406 114
Transcript of Laboratoire de Psychologie Sociale et Cognitive, CNRS ...

Perception and evaluation in human-robot interaction: The Human-Robot Interaction Evaluation
Scale (HRIES) – a multicomponent approach of anthropomorphism
Spatola, Nicolas1,2; Kühnlenz, Barbara3; Cheng, Gordon3
1. Laboratoire de Psychologie Sociale et Cognitive, CNRS, UMR6024, Clermont Auvergne Université, France
2. University of Potsdam, Department of Education, Potsdam, Germany
3. Institute for Cognitive Systems, Department of Electrical and Computer Engineering, Technical University of Munich,
Germany.
Corresponding author: Nicolas Spatola CNRS and Université Clermont Auvergne Laboratoire de Psychologie Sociale et Cognitive (LAPSCO – UMR CNRS 6024) 34, avenue Carnot 63037 Clermont-Ferrand FRANCE E-mail: [email protected] Phone: + 33 699 729 467 Fax: + 33 473 406 114


ABSTRACT
The evaluation of how (human) individuals perceive robots is a central issue to better understand Human-
Robot Interaction (HRI). On this topic, promising proposals have emerged. However, present tools are not able to
assess a sufficient part of the composite psychological dimensions involved in the evaluation of human-robot
interaction. Indeed, the percentage of variance explained is often under the recommended threshold for a construct
to be valid. In this article, we consolidate the lessons learned from three different studies and propose a further
developed questionnaire based on a multicomponent approach of anthropomorphism by adding traits from
psychosocial theory about the perception of others and the attribution and deprivation of human characteristics: the
de-humanization theory. Among these characteristics, the attribution of agency is of main interest in the field of
social robotics as it has been argued that robots could be considered as intentional agents. Factor analyses reveal a
four sub-dimensions scale including Sociability, Agency, Animacy, and the Disturbance. We discuss the
implication(s) of these dimensions on future perception of and attitudes towards robots.
KEYWORDS
Robot perception; Robot Evaluation; Anthropomorphism; Scale; Questionnaire; Human-Robot Interaction.

2
1 Introduction
While we are increasingly developing the capabilities of social robots to ensure a broad range of roles they
could play in our environment and lives (Mathur & Reichling, 2016; Yang et al., 2018), measuring the human
perception of those robots and to what extent potential users attribute human characteristics to them is of major
importance for the whole design process with regard to the resulting social interaction dynamics between robots
and humans (Chaminade & Cheng, 2009). One of those possible social dynamics is the so-called process of
anthropomorphism. It describes the attribution of emotional states, competences but also uniquely human traits like
morality or rationality to non-humans (Epley, Waytz, & Cacioppo, 2007; Waytz et al., 2010).
As early as 1944, Heider and Simmel investigated the tendency of humans to attribute emotions,
motivations, and purpose to simple shapes roaming around in an abstract film in their experiments (Heider &
Simmel, 1950). Hence, effects of anthropomorphism towards robotic agents that enter the daily lives of humans in
order to assist them in manifold complex and cognitive tasks seem to be natural and, thus, have to be considered
and evaluated in the design process, dependent on the intended application.
For example, in close human-robot interaction (HRI) in industrial contexts, where humans work in direct
physical contact with robots, the same type of motor interferences are observed for incongruent arm movements as
in human-human interaction, indicating that observing the actions of humanoid robots rely on similar perceptual
processes to observing the actions of human co-workers (Oztop, Chaminade, & Franklin, 2004). The latest research
results further suggest, that trying to compensate those motor interferences comes along with increased cognitive
task load in comparison to incongruent collaborative arm-movements, conducted by less human-like designed
robotic co-workers (Kühnlenz & Kühnlenz, 2020). Those results hint to the fact that the effects of
anthropomorphism, induced by human-like physical robot design may not always be desired and highly depend on
the targeted application scenario.
Beyond the design of the physical appearance of a robot, also the extent of human-like behavior, e.g. in
trajectory profiles of industrial robots turned out to have a significant positive impact on the health and wellbeing
of human users (Cheng, 2014). As an example, minimum-jerk trajectory profiles led to reduced stress levels with
regard to heart rate variability in close human-robot collaboration (Kühnlenz et al., 2018), and also the actions of

3
virtual agents have been categorized as more biological by human users when they are animated with motion data
captured from human actors in contrast to an interpolation between different poses designed by an animator
(Chaminade, Hodgins, & Kawato, 2007).
In the research field of social robotics, the effects of anthropomorphism are more obvious and can even be
used in a targeted way to shape HRI as desired in specific applications, e.g. to induce prosocial behavior towards a
robot (Kühnlenz et al., 2013). Despite the shortcomings of measures for anthropomorphism, the phenomenon itself
is well-known and thoroughly investigated with regard to socially interactive robotics (Fink, 2012), and even the
extension of legal protections to robotic companions, analogous to animal abuse laws, are discussed (Darling, 2012,
2017).
Thus, it is substantial to develop a scientifically valid measure for anthropomorphism in HRI that, in
contrast to state-of-the-art measures, considers not only the attribution but also the deprivation of human
characteristics, among which agency is of main interest, given that robots can and could be more and more seen as
intentional agents in future society (Marchesi et al., 2019; Pérez-Osorio & Wykowska, 2019).
The remainder of the paper is structured as follows: In Section 2, the theoretical background is presented
with regard to relevant insights from social-cognitive psychology, and state-of-the-art measures of
anthropomorphism are discussed. In Section 3, the development and validation of the proposed HRIES-
questionnaire are presented in a pretest and four consecutive user-studies starting on a morphologic level and
different levels of animacy in pictures and videos of state-of-the-art robots representing different levels of human-
like design, ending up with real-world HRI in study four. The general limits of the proposed measure are discussed
in Section 4, and concluding remarks are provided in Section 5.
2 Background
2.1 Relevant Insights from Social-cognitive Psychology Anthropomorphism is a form of social perception through the attribution of uniquely human traits like
morality or rationality to non-humans and goes back to the theory of mentalization. Mentalization is defined as a
form of procedural mental activity that energizes the perception and interpretation of the behavior of others in terms

4
of intentional mental states (e.g., beliefs, goals, purposes, and reasons (Dennett, 1988; Kitcher & Dennett, 1990)).
While the results of recent psychological studies on HRI argue that these different dimensions are mandatory to
explain the perception of robots and the attempt to interact with them, actually there is no existing tool for the
evaluation of anthropomorphism gathering all those dimensions (Eyssel & Kuchenbrandt, 2012; Kuchenbrandt,
Eyssel, Bobinger, & Neufeld, 2013; Spatola, Belletier, et al., 2019, 2018).
Social perception is an evolution construct. To determine whether the other is friends or foe and whether
this entity may or not produce a behavior that could help or injure the observer is of prime importance. This
theoretical framework has been associated with warmth (e.g., sincerity, trustworthiness, morality) and competence
(e.g., ambition, confidence) (Dupree & Fiske, 2017; Fiske, Cuddy, & Glick, 2007). The warmth dimension predicts
active behaviors such as helping (high warmth) or attacking (low warmth). The competence dimension predicts
passive behaviors such as association (high competence) or neglect (low competence). The valence (positive vs.
negative) and content (e.g., psychological traits and behaviors) of social evaluation then heavily depend on the
degree of perceived warmth and competence associated with the individual or group involved. Individuals or
members of social groups stereotyped as warm and competent are perceived much more positively than individuals
or members of social groups stereotyped as cold and incompetent. This social evaluation dimensions could also
apply, at least in part, to robots (Carpinella, Wyman, Perez, & Stroessner, 2017).
Interestingly, recent research in social robotics proposes that in addition to the basic inter-individual social
evaluation dimensions, people could also attribute morality to robots (Banks, 2018). This new dimension is not
trivial regarding mentalization and the de-humanization theories of Haslam. As we said, mentalization is the
extrapolation of a mental reality in others. The inference of mental states to others, including robots, is a particularly
important skill for social interactions (Chaminade et al., 2012). The de-humanization taxonomy (Haslam, 2006)
contains two bi-dimensional constructs. The first one illustrates the attribution of human traits: human uniqueness
(e.g., moral sensibility) opposed to animalistic de-humanization (e.g., irrationality), and the second the human
nature attribution (e.g., interpersonal warmth) opposed to mechanistic de-humanization (e.g., passivity). According
to Haslam’s taxonomy of de-humanization, morality and associated traits (e.g. cognitive openness, individuality,

5
depth) are specific human characteristics opposed to a mechanistic conceptualization of the other. The Human
nature vs. mechanistic de-humanization process refers to the attribution versus deprivation of human characteristics
to a fellow creature. In other words, it measures the perceived conceptual distance between the perception of a
human and the representation of what is a human. De-humanization is also one of the main psychosocial
mechanisms of social acceptance, as a perception of the proximity between others and their group of belonging (in-
group) or the self (Shi, Kashima, Loughnan, Suitner, & Haslam, 2008). The observer will use the in-group or
him/her-self as the stereotypical representation of the human concept. Studies showed that mechanistic de-
humanization results in behavior such as indifference or lack of empathy towards individuals (Haslam, 2006;
Haslam & Loughnan, 2014; Kteily, Bruneau, Waytz, & Cotterill, 2015). This de-humanization dimension has
proved to be a reliable measure of social evaluation to predict socio-cognitive processes in an HRI situation,
especially the Human nature/Mechanistic de-humanization distance measure (Spatola, Belletier, et al., 2019;
Spatola, Monceau, & Ferrand, 2019).
2.2 Current Measures of Anthropomorphism
In the HRI-community, two prominent examples of questionnaires developed to measure the attribution of
anthropomorphic traits to robots, are widely used: the Godspeed questionnaire series (Bartneck, Kulić, Croft, &
Zoghbi, 2009), and the Robot Social Attribute Scale (RoSAS) (Carpinella et al., 2017).
The Godspeed questionnaires have been a promising first step, however, their development lacks
methodology and does not provide any clear test on their structural psychometric validity (Ho & MacDorman,
2010). As a consequence, the scale is subject to a high variability to its five constructs, i.e. anthropomorphism,
animacy, likeability, perceived intelligence, and perceived safety (Bartneck et al., 2009). First, the use of a semantic
differential response format (i.e., a bi-dimension scale) relies on a clear identification of the underlying constructs
being measured (Diab, 1965). While some items use antonyms (e.g., dead-alive) others reflect more than a single
dimension of judgment (e.g. awful-nice). Thus, the semantic space between the different word pairs cannot be
assessed as comparable (Krosnick, Boninger, Chuang, Berent, & Carnot, 1993). Also, there are individual
differences in the size and character of the semantic space (Heise, 1970; Heise, 1969). Second, several of the

6
opposite items are confounded with positive and negative valence that could explain the high covariance between
the dimensions (Choi & Pak, 2005). Finally, the items do not load on factors as proposed in the scale. Factor loadings
measure the factorial structure of a scale. They make it possible to group items on separate dimensions and to signify
the concept being measured by each factor. On the Godspeed scale, some items load on more than one dimension
while others do not load onto any (Ho & MacDorman, 2010). The result is a significant and extremely high
correlation between anthropomorphism, likeability, animacy, and perceived intelligence dimensions (i.e., r = [0.69,
0.89]) suggesting that those concepts have no discriminant validity. They are all measuring the same concept.
Working on these issues, the RoSAS (Carpinella et al., 2017) proposes an interesting new dichotomy with
the three dimensions: warmth, competence, and disturbance. The authors used a factor analysis on the five
dimensions of the Godspeed questionnaires (23 bi-dimensional items, “artificial–lifelike” appearing on both the
anthropomorphism and animacy subscale) to reduce it into the three RoSAS’ dimensions (18 items). The dimension
of warmth and competence are defined as universal dimensions of social perception (Fiske et al., 2007). These
dimensions are central in interpersonal and intergroup perception and are related to cognitive, emotional and
behavioral reactions like the tendency to develop empathy or to indulge others. However, regarding the results in
real HRI-experiments, the scale produces ambiguous results with a low level of explained variance especially when
linked to socio-cognitive processes during HRI (Spatola, Belletier, et al., 2018; Spatola, Santiago, et al., 2018). The
reason could be that the validation was made using images of robots, which constitutes a different paradigm than
actual interaction. Indeed, people do not rely on the same cognitive and neural processes in front of an embodied
robot compared to a robot image projected on a screen (Kiesler, Powers, Fussell, & Torrey, 2008).
In contrast to state-of-the-art approaches, the taxonomy of Haslam as described in Sec. 2.1 was used to
evaluate the perception of robots after different types of HRI in recent studies (Spatola, Belletier, et al., 2019, 2018).
The authors showed that the attribution of uniquely human traits to robots could be modulated by the form of
interaction and could predict the impact of HRI on socio-cognitive processes while the RoSAS couldn’t (Spatola,
Belletier, et al., 2018). For example, in one experiment, participants were asked to perform a cognitive control task
in the presence of a robot after a social vs. non-social HRI. Results showed that in the presence of the social robot,

7
participants performed better on the cognitive control task, an effect called “social facilitation” (Spatola, Belletier,
et al., 2019; Spatola, Monceau, et al., 2019). In addition, this effect was similar to those observed in the presence
of a fellow creature. Results also showed that this effect was moderated by uniquely human vs. mechanistic
attributions. Indeed, the social facilitation effect was relative to the attribution of human traits on the de-
humanization scale. This psychosocial construct was able to provide a deeper perspective than proposed by the
dimension of warmth, competence, and disturbance during real HRI. Also, it may help to link the perception of
robots to the perception of humanness with fellow creatures. In addition, it could increase the level of variance
explained by the RoSAS scale (43.88% according to the main paper). Indeed, the recommended level of explained
variance in factor analysis for a construct to be valid is 60% (Cronbach, 1951; James Dean Brown, 2002;
Worthington & Whittaker, 2006).
Thus, in this paper, we propose to improve the RoSAS with new traits from the Haslam’s de-humanization
theory and to test whether this new scale may precisely measure the perception of robots in HRI psychosocial
manipulations. To this end, the following Section presents the development and validation of the proposed HRIES-
questionnaire in a pretest and four consecutive user-studies starting on a morphologic level and different levels of
animacy in pictures and videos of state-of-the-art robots representing different levels of human-like design, up to
real-world interactions with a robot in study four.
3 Development and Validation of the Scale in User Studies
3.1 Pretest
We conducted a pretest to evaluate the semantic redundancy of the different items in order to avoid any
weight bias (i.e., redundancy gain effect) of similar items in the scale development (Shepherdson & Miller, 2014).
Forty-four items were taken from the Godspeed scale (Bartneck et al., 2009), Warmth and Competence
dimensions (Fiske et al., 2007), RoSAS (disturbance dimension) (Carpinella et al., 2017), De-humanization theory
(Human nature dimension) (Haslam, 2006) (Table 1) were used in this pretest. To control for potential correlation
effect in de-humanization items we conducted a pretest to ensure the independency of positive and negative
dimensions. In the pretest, twenty participants (Mage = 20.32, SD = 2.03) had to evaluate four robots (i.e., Nao,

8
Yumi, Spot and Meccanoid, see figure 1) on the 20 items of Haslam de-humanization taxonomy. Results showed
that all pairs were significantly correlated (all ps < .05, r = [.69, .96]). Based on these results, we presented only the
5 positive items of the mechanistic de-humanization taxonomy to avoid any semantic differentiator issues (Diab,
1965; Heise, 1970; Heise, 1969; Krosnick et al., 1993). The presentation of semantically dichotomist items tends
to energize the emergence a positive/negative judgment effect increasing the likelihood to observe a
positive/negative semantic bias in participants responses rather than an in depth treatment of the meaning of the
word (Ho & MacDorman, 2010). Also, the use of positive rather than negative items seems better because of the
positivity bias on negative items and the ambiguity that may arise (e.g., higher standard deviation between
participants in judgment) (Fayers, 2004; Lindwall et al., 2012; Roszkowski & Soven, 2010; Schriesheim & Hill,
1981; Stansbury, Ried, & Velozo, 2006).
All 44 words were displayed on a computer screen in a randomized table using Qualtrics, an online
experiment platform, to 118 English speaking participants recruited on the internet (Mage = 25 years, SD = 4.13, 79
males, 29 female). They were instructed to “identify if, in the present list, you can find synonyms.” To signify the
synonymy of the word, participants had to drag and drop words on their synonyms. We set the threshold of
agreement of synonymy to 80%. Groups of items above this threshold were then reduced to one prototypical item.
Table 1. Synonymy evaluation. The similarity evaluation present, in percentage, the proportion of
association of the words among participants.
Items Synonyms Similarity evaluation
Emotional Warm
Open-mindedness Trustworthy Honest 87%
Friendly Nice 84% Likable Sincere Kind
Pleasant Agency/individuality
Deep Competent Intelligent
Skilled Efficient

9
Rational Sensible 83% Intentional
Knowlegeable Responsible Human-like
Mortal Alive Real
Natural Lifelike 93% Organic
Interactive Creepy Weird Strange 98%
_ Awkward 87% Supernatural
Uncanny Strange 88% Freaky
Shocking Eeriness
Scary Dangerous Aggressive
Awful
Seven items were considered as a synonym. To delineate which of the synonym would remain we followed
a simple procedure. In each synonymic pair, looking at which word was dragged and which word was used as the
referent, we kept the one that was used the most frequently as the referent. All other items were kept for the
following study.
3.2 Study 1: Scale development
The first study aimed to design a structure for the scale. To that end, a fair number of pictures of real robots
were evaluated with respect to a combination of de-humanization taxonomy and items of the RoSAS-scale. This
picture evaluation method was chosen to provide a holistic approach of robot evaluation in order to extract a first
reliable and generalizable matrix. The depiction of robots with different designs allows them to create a higher level
of variability and to provide a questionnaire structure that can adapt to a representative sample of robots (Phillips,
Zhao, Ullman, & Malle, 2018).
3.2.1 Method
10
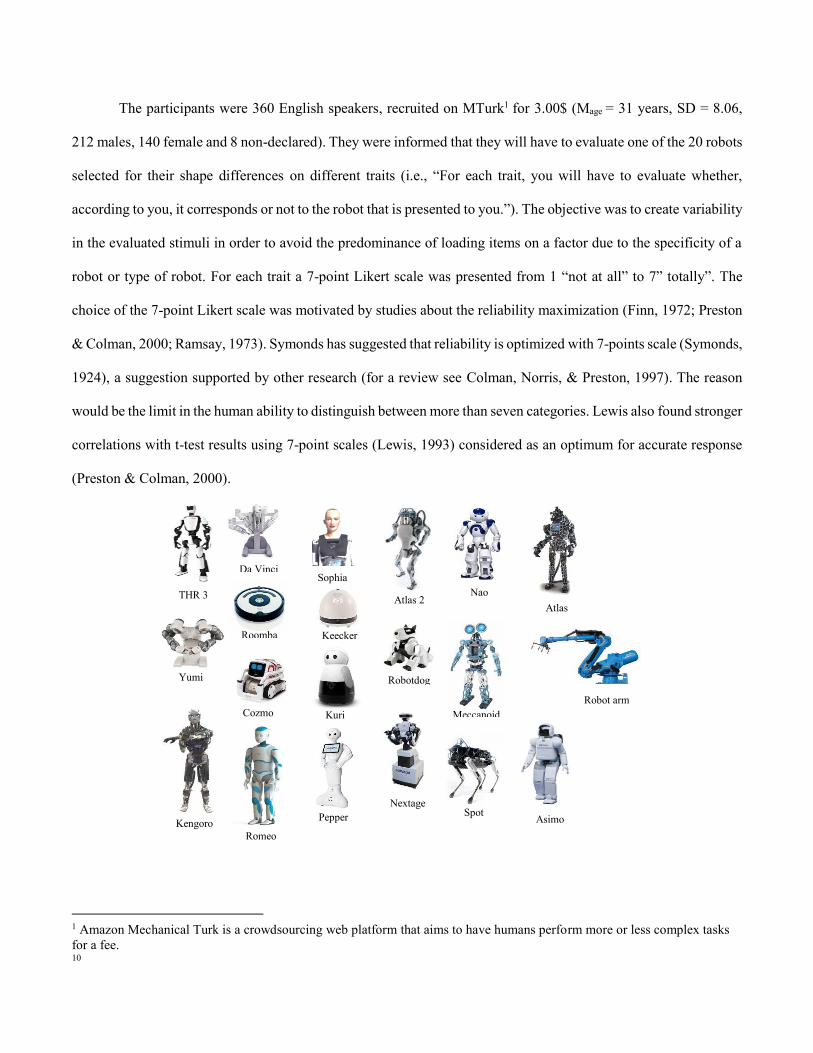
The participants were 360 English speakers, recruited on MTurk1 for 3.00$ (Mage = 31 years, SD = 8.06,
212 males, 140 female and 8 non-declared). They were informed that they will have to evaluate one of the 20 robots
selected for their shape differences on different traits (i.e., “For each trait, you will have to evaluate whether,
according to you, it corresponds or not to the robot that is presented to you.”). The objective was to create variability
in the evaluated stimuli in order to avoid the predominance of loading items on a factor due to the specificity of a
robot or type of robot. For each trait a 7-point Likert scale was presented from 1 “not at all” to 7” totally”. The
choice of the 7-point Likert scale was motivated by studies about the reliability maximization (Finn, 1972; Preston
& Colman, 2000; Ramsay, 1973). Symonds has suggested that reliability is optimized with 7-points scale (Symonds,
1924), a suggestion supported by other research (for a review see Colman, Norris, & Preston, 1997). The reason
would be the limit in the human ability to distinguish between more than seven categories. Lewis also found stronger
correlations with t-test results using 7-point scales (Lewis, 1993) considered as an optimum for accurate response
(Preston & Colman, 2000).
1 Amazon Mechanical Turk is a crowdsourcing web platform that aims to have humans perform more or less complex tasks for a fee.
THR 3
Da Vinci Sophia
Atlas 2 Nao
Keecker Roomba
Yumi
Kengoro
Robotdog
Meccanoid
Spot Nextage
Pepper
Romeo Asimo
Robot arm
Atlas
Cozmo Kuri

11
Fig. 1. The 20 robots presented in the questionnaire. Each participant saw a random robot and had to judge 37 traits.
To produce a valid factorial analysis we asked participants to evaluate a random robot out of 20 robots (see
Figure 1) on the 37 selected items (see Table 1). All items were presented in the adjective form in a random order
to avoid that participants’ responses to questionnaires may be affected by question order (Bowling & Windsor,
2008; Lee & Schwarz, 2014; Schwarz, 1999).
The 20 robots represented a broad range of different design styles and anthropomorphic levels in order to
create variability and ensure a generalized use of the scale (Worthington & Whittaker, 2006; Xie & DeVellis, 2006).
3.2.2 Results
Sample data
First, we used Bartlett's sphericity test to ensure inter-item correlation, χ2(666) = 8111.41, p<.001. Inter-
item correlations examine the extent to which scores on one item are related to scores on all other items in a scale
(Cohen & Swerdlik, 2013; Williams, Onsman, & Brown, 2018). Second, we conducted a Kaiser-Meyer-Olkin
(KMO) test that verifies that once the linear effect of the other items has been controlled, the partial correlations of
each pair of items are low, which would confirm the presence of latent factors linking the items to each other
(Williams et al., 2018). Its value varies from 0 to 1.1. This is an index for measuring the quality of the data in the
sample for the factor analysis. Here the KMO = 0.91. KMO values between 0.8 and 1 indicate the sampling is
adequate (Cerny & Kaiser, 1977; Dziuban & Shirkey, 1974; IBM, 2011).
Analysis method
In order to determine an initial factorial structure of the scale and sort out unsuitable items, we performed
an explanatory factor analysis. We chose a common factor model to attribute the variance to latent factors. This
method provides more reliable results than component models (e.g. PCA) in the majority of the cases, while the
methods would be roughly equivalent in the remaining cases (De Winter & Dodou, 2016; Gorsuch, 1990; Snook &
Gorsuch, 1989; Velicer & Jackson, 1990; Widaman, 1993). Our analysis method started with a principal axis

12
factoring method of extraction with a Promax rotation2. The Promax rotation aims to emphasize the differences
between the high and low factor saturation coefficients by raising them to the power κ (here 4, the default value3).
When the loadings are raised to a Kth power, they are all reduced resulting in a simple structure. As the absolute
value of the coefficients decreases, the gap between them increases (Gorsuch, 1990; Hendrickson & White, 1964;
Maxwell & Harman, 2006). We conducted analyses on the pattern matrix, which holds the beta weights to reproduce
variable scores from factor scores.
Selection of items
The first pattern matrix produced seven factors. We conducted a first exploratory factor analysis (EFA)
including all items and used the Kaiser-Guttman-Criterion (eigenvalue > 1) to identify the meaningful number of
possible latent factors. For each factor we proceeded as follows: all items were included in a scale reliability analysis
to evaluate the reliability of the factor if an item is dropped to maximize the Cronbach’s alpha (Cronbach, 1951;
Unwin, 2013). Negatively correlated items were reversed to control for negative covariance in the Cronbach’s alpha
equation that incorporates the average of all covariance between items. After the first iteration, we conducted a new
iterative EFA with the remaining items until no items could be dropped. From the remaining items, we made a
practical choice to maximize the quality of participants’ responses saving the reliability of the factors by keeping
the four most central items of each factor. Indeed, researchers have demonstrated that length is negatively correlated
with the completion and the quality of response of participants (Meade & Craig, 2012) especially in self-
administered questionnaires (Galesic & Bosnjak, 2009; Mavletova, 2013). This process made it possible to keep a
Cronbach alpha superior to .70 (Cronbach, 1951; Hair, Black, Babin, & Anderson, 2010) losing the minimum of
information. For instance, dropping items loading on the first factor to 4 changed the Cronbach alpha from .94 to
.93, optimizing the average variance extracted from .70 to .77. We then conducted a new factorial analysis with the
same settings to confirm that the psychometric structure remains the same after each drop of item.
2 Using orthogonal rotation (e.g. VARIMAX), we preserve the independence of the factors. With oblique rotation (e.g. OBLIMIN, PROMAX), we break it and factors are allowed to correlate. 3 This value is appropriate for most analysis (Hendrickson & White, 1964).

13
However, it is to mention that such a process reduces the width of the construct to its conceptual centroid.
We assume this practical choice to ensure a good balance between practicability and reliability. From the 37
experimental items, 16 remain in the final matrix, χ2(120) = 3237.86, p<.001; KMO = .85, explaining 71.82% of
variance (Figure 2) with 4 factors (Table 2).
Fig. 2. Eigen values for study 1 factor analysis
Table 2 Study 1 pattern matrix presenting loading factors for each item, percent of explained variance and Cronbach’s alphas for each factor of the final factors. Items in bold are the items included in the final matrix.
Items Factors
1 2 3 4 Warm 0,910 0,017 -0,068 -0,004
Likeable 0,866 -0,002 -0,025 0,023 Trustworthy 0,865 0,042 -0,065 0,062
Friendly 0,863 -0,014 -0,019 0,069 Emotional 0,791 -0,099 -0,051 0,038 Pleasant 0,789 0,006 0,176 -0,127
Kind 0,763 -0,132 -0,058 0,046 Open-minded 0,676 0,146 0,078 0,167 Supernatural -0,664 0,063 0,157 0,080
Sincere 0,577 0,005 0,298 -0,120 Eeriness -0,515 0,266 0,251 -0,091
Knowlegeable 0,357 0,227 0,310 0,158 Responsible 0,327 -0,071 0,275 0,243
Scary -0,140 0,842 0,067 0,050 Creepy -0,113 0,796 0,089 0,065 Weird -0,168 0,774 0,076 0,153
Uncanny 0,161 0,758 -0,093 -0,060 Awful -0,109 0,738 -0,298 0,053
Shocking 0,161 0,715 -0,113 -0,083
0,000
1,000
2,000
3,000
4,000
5,000
6,000
0 5 10 15
Eige
n va
lues

14
Dangerous 0,157 0,628 -0,043 -0,093 Freaky -0,054 0,621 0,061 -0,082
Aggressive -0,072 0,614 -0,045 -0,024 Mortal 0,347 0,415 -0,164 -0,087
Rational -0,124 -0,127 0,903 0,033 Self-reliant -0,099 -0,031 0,845 0,112 Intelligent 0,027 -0,072 0,764 -0,222 Intentional 0,218 0,187 0,608 0,067
Deep 0,003 -0,455 0,466 0,054 Human-like 0,027 0,113 0,154 0,647
Real -0,061 -0,136 0,185 0,567 Alive 0,296 -0,199 -0,020 0,504
Natural 0,279 0,182 0,092 0,486 Efficient -0,047 -0,104 -0,356 0,474
Competent -0,035 -0,191 -0,307 -0,045 Skilled -0,339 0,325 0,079 0,134
Interactive -0,118 0,013 -0,022 0,015 Organic 0,415 0,048 0,212 -0,054
% of explained variance 29.940 21.096 14.086 6.695
Cronbach's alpha 0,928 0,879 0,811 0,738
3.2.3 Discussion study 1
The aim of the first study was to delineate a new structure from robot anthropomorphic evaluation based
on existing scales proposals and psychosocial theories taxonomy. Our results demonstrate a new taxonomy that
may be linked to recent findings in psychology and neuropsychology of HRI. Factorial analysis of the first study
showed a structure with four factors.
We found the first factor around “Sociability” attribution including the items “Warm”, “Trustworthy”,
“Friendly”, and “Likeable”. This construct represents the social constructs that are positively related to the intent
of interaction with others (Fiske et al., 2007; Fiske & Neuberg, 1990; Yamagishi, 2001). Sociability is the ability
of an individual or a group of individuals to evolve in society. Gathering traits perceived as central for human social
interactions (Kelley, 1987; Lopes, Salovey, Côté, & Beers, 2005), the Sociability factor, could be determinant for
evaluation and acceptance of HRI (De Graaf & Ben Allouch, 2013). Since humans, indeed, tend to evaluate others
on their ability to interact positively with them, Fiske and colleagues proposed these attributions as the primary
dimension of interpersonal evaluation that they labeled “warmth” (Fiske et al., 2007). For robots, the

15
conceptualization is relatively different, as should the terminology be. Indeed, this factor is more willing to evaluate
the perceived pro-social characteristics rather than intrinsic personality qualities (e.g., moral).
The second factor echoes “Disturbance” attribution including the items “Scary”, “Creepy”, “Weird”, and
“Uncanny”. This factor represents the negative perception of robots in terms of uncomfortable feelings and
perceptions. Unlike the Disturbance dimension in the RoSAS proposal, the Disturbance factor is centered on
negative anticipation about something that one cannot consider as “usual”. Intrinsically, this dimension represents
a form of something negatively unknown resulting in a specific feeling rather than a threat feeling (e.g.,
“Dangerous” in RoSAS) (MacDorman, 2006; MacDorman & Chattopadhyay, 2016). For instance, considering
robots falling into the uncanny valley is not related to a threat feeling but a feeling of disturbance. Because RoSAS’
Disturbance dimension engages two different processes one considering the threat looking or interacting with a
robot and one associated with not feeling at ease, the evaluation of an uncanny robot would be less efficient because
it does not necessary trigger any threat effect. According to our data dangerosity does not seem to be the main
predictor. The reason could be that actual robots are not likely to harm people and the feeling of the threat is more
distant and abstract (e.g., the fear to be replaced by robots) (Anderson, 2005; Sundar, Waddell, & Jung, 2016).
Therefore, we assume to not introduce dimension (i.e., threat and disturbance feelings) in a unique factor as, while
threat triggers disturbance, disturbance does not necessarily trigger threat.
The third factor is close to the dimension of “Agency” including the items “Rational”, “Self-reliant”,
“Intelligent”, and “Intentional”. This factor regroups items relevant to the evaluation of the attribution of traits
defined as “uniquely human” (Haslam, 2006) with a form of agency (Sullins, 2006). The differentiation between
the “Competence” dimension (Carpinella et al., 2017) and the actual factor echoes previous research on the
independence of the two dimensions of capacities to produce a behavior and the mental process behind this behavior.
Many studies investigated the perception of robots as intentional agents which is a form of mentalization process
(Chaminade et al., 2012, 2010; Rauchbauer et al., 2019) that could be conceptualized as a form of co-adaptation
(Ehrlich & Cheng, 2018). Regarding the social evaluation framework, one component is the evaluation of the others’
capacity to act positively or negatively toward the observer. The original items from Fiske and colleagues on the

16
so-called competence dimension were specifically oriented toward high-level cognition traits such as “intelligence”
or “determined” rather than “technical” capacities (Fiske et al., 2007). To treat robots with higher cognitive
capacities would be related to consider them as rational agents as proposed by Dennett (Dennett, 2009; Dennett,
1988; Kitcher & Dennett, 1990). This “intentional stance” or “folk psychology stance” is the assumption that an
entity, in the present case a robot, will have its own beliefs, thoughts and intents. Therefore, it is a reliable measure
of the evaluation of the capacity of a robot to act positively or negatively toward the observer and a reliable measure
of the anthropomorphism. As a socio-cognitive process, the more agency, the more social perception and the more
anthropomorphic the robot would be seen. Finally, this Agency dimension could be a transitory measure of the
“personal stance” which not only relies on the intentional stance but also consider the entity as a person (D. C.
Dennett, 1988; Heil & Heil, 2019; Shoemaker & Dennett, 1990).
The fourth factor regroups items associated with “Animacy” shape evaluation: “Human-like”, “Real”,
“Alive”, and “Natural”, suggesting human characteristics for non-human agents. This factor is close to the general
concept of the “Living” oriented to a human form of life. This factor is close to the theoretical concept of
“Humanization” as an extension of the simple attribution of human characteristics to a modulation of the conceptual
distance between what defines a human for an observer and the attribution to another entity (Spatola, 2019).
Taking together Sociability, Agency and Animacy dimensions are positively related to anthropomorphism
that is defined in the Oxford dictionary as “the attribution of human traits, emotions, or intentions to non-human
entities” (Oxford English Dictionary, 2017). The Disturbance dimension is more ambiguous. Indeed, the
disturbance may arise from various factors as demonstrated by the items included in this specific dimension. It goes
from a perception of danger, linked to a protective reflex, to a perception of strangeness, linked to theories such as
the uncanny valley (Burleigh, Schoenherr, & Lacroix, 2013; Mori, MacDorman, & Kageki, 2012). According to
the uncanny valley, too anthropomorphic design of a robot or an appearance that does not match with the movements
of the robot, but not enough again to blur the difference with a human, it results in a fall-off in acceptance. Thus,
Disturbance is more a negative anticipation measure than an anthropomorphic one.
3.3 Study 2: Confirmatory study

17
In a second step, we tested the stability of the matrix in the evaluation of a robot in motion. Thus, the second
experiment aimed to confirm the study 1 structure of the questionnaire. However, instead of using pictures,
participants judge a robot presented on a video. This difference will make it possible to ensure that the scale
properties are suitable for both stop and ongoing motion perception. Indeed, the motion may have a great impact
on robot perception (Chaminade, Franklin, Oztop, & Cheng, 2005; Kätsyri, Förger, Mäkäräinen, & Takala, 2015).
For humans and other animals, movement is synonymous with life - so are robots triggering potential positive or
negative affects (Chaminade et al., 2005; Saygin, Chaminade, Ishiguro, Driver, & Frith, 2012).
3.3.1 Method
The participants were 235 English speakers recruited on MTurk4 for 1.00$ (Mage = 20.5 years, SD = 6.93,
158 males, 73 female and 4 non-declared). They were informed that they will have to evaluate a robot presented on
a short-film on different traits (i.e., “For each trait, you will have to evaluate whether, according to you, it
corresponds or not to the robot that is presented to you.”). For each trait, a 7-point Likert scale was presented from
1 “not at all” to 7” totally”.
The video presented the NAO robots interacting with a human, an object, and another NAO for 1.36
minutes. The video came from an Aldebaran Nao presentation video5. In order to control from external priming
effect, the video was cut to not display any logo and sound. The NAO was chosen for its median human-likeness
characteristics norm proposed by the ABOT database (average score = 45.92 on a 100 point scale) (Phillips et al.,
2018). We will develop about this database at continuation.
3.3.2 Results
In order to conduct a confirmatory factor analysis, we checked the Bartlett's sphericity test to ensure inter-item
correlation [χ2 = 1493.61, df = 120, p < .001] and the Kaiser-Meyer-Olkin Indice [KMO= .79] for the sample
adequacy (Cerny & Kaiser, 1977; Dziuban & Shirkey, 1974; IBM, 2011). To test the reliability of the proposed
4 Amazon Mechanical Turk is a crowdsourcing web platform that aims to have humans perform more or less complex tasks for a fee. 5 The original footage can be accessed from https://www.youtube.com/watch?v=rSKRgasUEko

18
structure we conducted a confirmatory factor analysis (CFA) with a structural model using AMOS plugin in SPSS
(figure 3) using a variance-covariance matrix with maximum likelihood (ML) estimation (Mishra, 2016). ML
estimation is more reliable in many cases than others and is widely used (Bollen, 1989). The model-fit indices
showed that chi square (χ2) value was 189.09 (df = 98, p < 0.001). Table 3 shows the recommended model-fit
indices (Jackson, Gillaspy, & Purc-Stephenson, 2009; Schermelleh-Engel, Moosbrugger, & Müller, 2003) as well
as the recommended thresholds (Wood, 2008).
Fig. 3. Measurement Theory Model (CFA) for the four factors Sociability, Agency, Animacy and Disturbance
Table 3. Confirmatory model fit indices. χ2/df the ratio of chi square to degree of freedom; GFI the goodness-of-fit-index; AGFI the adjusted goodness-of-fit; NFI the normalized fit index, CFI the comparative fit index; RMSR the root mean square
residual.
Recommended value Values obtained χ2/df ≤ 3.00 1.45 GFI ≥ 0.90 0.94
AGFI ≥ 0.80 0.90 NFI ≥ 0.90 0.92 CFI ≥ 0.90 0.97 TLI ≥ 0.90 0.96
RMSEA ≤ 0.08 0.04 SRMR ≤ 0.08 0.07

19
As shown in Table 3, all model-fit indices exceeded their respective common acceptance level except for the NFI
that was slightly lower than the recommended value. Table 4 presents the non-standardized estimates for each item.
All items were significantly associated with their respective factor (all ps < .001).
Table 4. CFA non-standardized estimates
Items Factor Estimate S.E. t value p value Warm ← Sociability 1,156 0,098 11,758 < .001
Trustworthy ← Sociability 1,157 0,095 12,133 < .001 Likeable ← Sociability 1,039 0,098 10,553 < .001 Friendly ← Sociability 1,287 0,088 14,577 < .001
Scary ← Disturbance 1,172 0,094 12,491 < .001 Creepy ← Disturbance 1,215 0,105 11,569 < .001
Uncanny ← Disturbance 1,349 0,097 13,915 < .001 Weird ← Disturbance 1,063 0,1 10,621 < .001
Intelligent ← Agency 1,499 0,09 16,627 < .001 Rational ← Agency 1,265 0,108 11,725 < .001
Intentional ← Agency 0,913 0,088 10,355 < .001 Conscious ← Agency 1,323 0,109 12,107 < .001 Humanlike ← Animacy 1,008 0,094 10,695 < .001
Alive ← Animacy 1,144 0,112 10,199 < .001 Natural ← Animacy 0,908 0,102 8,882 < .001
Real ← Animacy 1,156 0,098 11,758 < .001
3.3.3 Discussion study 2
This second experiment aimed to confirm the structural validity of the new scale. The structural model for
the CFA showed a good fit.
3.4 Study 3: Stress test and internal reliability
Recently, Philips and colleagues propose the ABOT (Anthropomorphic roBOT) Database, a collection of
real-world anthropomorphic robots (Phillips et al., 2018). Interestingly, this database proposes a quantification of
the human-likeness score for more than 250 robots. We thus used robots (different from the previous ones) from
this database based on their human-likeness score. The purpose was 1) to evaluate the psychometric validity and
reliability of the new questionnaire using a machine learning approach and 2) to stress the usefulness and reliability
of each dimension in the evaluation of the anthropomorphism tendency of participants in regard to social evaluation
theories. According to social psychology literature, attitudes are predominantly defined by positive attribution rather
than negative attributions (Dupree & Fiske, 2017; Fiske et al., 2007). Negative attributions usually occur when there

20
is a lack of positive attributions as neutral/negative attitudes modulators (Yarkin, Harvey, & Bloxom, 1981).
Therefore, if the present items correctly measure social/anthropomorphic evaluation, the anthropomorphism
tendency of participants should be defined first by positive attributions (Agency, Sociability, Animacy), and
negative attribution (Disturbance) should act as a modulator when no positive attributions are made. 3) We wanted
to evaluate whether the four factors were sensitive to the robot comparison and especially whether the Animacy
dimension could follow the human-likeness norms from the ABOT database. 4) Finally, to test external validity,
we wanted to put the scale in the perspective of a validated scale: The Negative Attitudes Towards Robots Scale
(NARS) (Nomura, Suzuki, Kanda, & Kato, 2006b; Syrdal, Dautenhahn, Koay, & Walters, 2009). Indeed, positive
attitudes towards robots should be positively correlated to positive attribution (Agency, Sociability, Animacy) while
negative attitudes should be positively correlated to negative attribution (Disturbance) (Epley et al., 2007).
3.3.1 Method
The participants were 1086 English speakers recruited by a mailing list (Mage = 20.5 years, SD = 5.71, 246
males, 840 female). They were informed that they will have to evaluate five robots presented on their screen in a
random order (i.e., “For each trait, you will have to evaluate whether, according to you, it corresponds or not to the
robot that is presented to you.”). For each trait on each robot, a 100-points slider scale was presented from 1 “not at
all” to 100 “totally”. We chose this 100-points scale to test the reliability of the present factors in the face of more
variability in a continuous structure. Some authors have argued that a continuous scale would be better regarding
sensitivity, respondent preference (Joyce, Zutshi, Hrubes, & Mason, 1975), and accuracy (de Leon, Lara-Muñoz,
Feinstein, & Wells, 2004). Lozano et al. (2008) have shown that both the reliability and validity of a Likert Scale
decrease when the number of response options is reduced (Lozano, García-Cueto, & Muñiz, 2008). Slider scale can
be used for a greater number of statistical tests and goodness of fit tests may be more powerful compared to a
standard Likert scale (Funke & Reips, 2012).
The five robots were selected by quintile selection on the human-likeness score of the ABOT database
resulting in the use of Hospi, Personal Robot, ARMAR, Nimbro, and Nadine (figure 4).

21
Fig. 4. By order of Human-likeness ABOT score, from left to right, Hospi, Personal Robot, ARMAR, Nimbro, Nadine.
At the end of the experiment, participants completed Nomura, Kanda, Suzuki, and Kato’s scale (Nomura,
Suzuki, Kanda, & Kato, 2006a) measuring negative attitudes toward robots, hereafter referred to as NARS scale.
The NARS scale constitutes of 14 items in three constructs: actual interactions (e.g., “I feel that if I depend on
robots too much, something bad might happen”) (α = .77); social/future implications (e.g., “I would feel uneasy if
robots really had emotions”) (α = .63); and emotional attitudes (e.g., “If robots had emotions I would be able to
make friends with them”) (α = .92). For the purpose of clarity in analysis, we kept the emotional attitudes in its
original positive form and did not reverse the scores. For each dimension, participants rated whether they agreed or
disagreed (from 1 to 100).
3.3.2 Results
Structural validity
As previously, we checked the Bartlett's sphericity test to ensure inter-item correlation [χ2 = 57048.83 , df
= 120, p < .001] and the Kaiser-Meyer-Olkin Indice (KMO= .75) for the sample adequacy (Cerny & Kaiser, 1977;
Dziuban & Shirkey, 1974; IBM, 2011). Again, to test the reliability of the scale we tested a structural model (figure
3) using a variance-covariance matrix with maximum likelihood (ML) estimation. The model-fit indices showed
that chi square (χ2) value was 786.03 (df = 98, p < 0.001). It is to mention that the χ2 statistic is very sensitive to
sample size (Schermelleh-Engel et al., 2003; Vandenberg, 2006). Table 5 shows the recommended model-fit indices
(Schermelleh-Engel et al., 2003) as well as the recommended thresholds (Brown, 2015).

22
Table 5. Confirmatory model fit indices. χ2/df the ratio of chi square to degree of freedom; GFI the goodness-of-fit-index; AGFI the adjusted goodness-of-fit; NFI the normalized fit index, CFI the comparative fit index; RMSR the root mean square
residual.
Recommended value Values obtained χ2/df ≤ 3.00 4.46 GFI ≥ 0.90 0.96
AGFI ≥ 0.80 0.93 NFI ≥ 0.90 0.97 CFI ≥ 0.90 0.98 TLI ≥ 0.90 0.97
RMSEA ≤ 0.08 0.06 SRMR ≤ 0.08 0.04
Table 6 presents the non-standardized estimates for each item. All items were significantly associated with their
respective factor (all ps < .001).
Table 6. CFA non-standardized estimates
Items Factor Estimate S.E. t value p value Warm ← Sociability 16,63 0,442 37,641 < .001
Trustworthy ← Sociability 14,935 0,497 30,067 < .001 Likeable ← Sociability 18,89 0,442 42,771 < .001 Friendly ← Sociability 19,457 0,466 41,736 < .001
Scary ← Disturbance 15,284 1,325 11,534 < .001 Creepy ← Disturbance 16,171 1,168 13,847 < .001
Uncanny ← Disturbance 13,832 1,086 12,735 < .001 Weird ← Disturbance 13,643 1,28 10,654 < .001
Intelligent ← Agency 14,722 0,601 24,489 < .001 Rational ← Agency 10,987 0,587 18,712 < .001
Intentional ← Agency 14,916 0,501 29,752 < .001 Conscious ← Agency 14,066 0,608 23,137 < .001 Humanlike ← Animacy 8,869 0,402 22,066 < .001
Alive ← Animacy 12,088 0,457 26,437 < .001 Natural ← Animacy 8,234 0,42 19,586 < .001
Real ← Animacy 8,773 0,957 9,164 < .001
Machine learning
To evaluate the structural stability of the present questionnaire we wanted to compare the consistency of
the prediction of the scale with a training and test sample. The purpose was to evaluate whether the scale was
reliable to reproduce its prediction (here in terms of cluster solution as a respondent profiles proxy) on different
samples. We first processed a two-step clustering using Disturbance, Agency, Sociability, and Animacy to delineate
anthropomorphic patterns into participants (Bacher, Wenzig, & Vogler, 2004). The clustering proposed a solution

23
with a 2 clusters’ matrice with a 1.36 ratio sizes (figure 5) and a cluster quality = 0.5 that measure the cohesion and
separation of clusters (good fit).
Fig. 5. First solution cluster distribution
According to cluster silhouette and cluster comparison, analyses argue for a low vs. high anthropomorphism
tendency. Indeed, participants in the low cluster attributed less Agency, F(1, 1085) = 962.45, p < .001, η²p = .47,
Sociability, F(1, 1085) = 1322.67, p < .001, η²p = .55, and Animacy, F(1, 1085) = 881.77, p < .001, η²p = .45, traits
to the robots compared to participants in the high anthropomorphism tendency cluster. However, we didn’t found
difference on Disturbance attribution, F(1, 1085) = 1.11, p = .293, η²p < .01 (table 7).
Table 7. First cluster solution. Centroids in function of cluster and factors. Factors are presented by order of importance for the clustering solution from left to right.
Agency Social HumLike Disturbance Mean Std. Deviation Mean Std. Deviation Mean Std. Deviation Mean Std. Deviation
Cluster 1 23,08 12,16 17,21 11,37 15,48 8,38 30,81 17,94 2 44,88 10,39 44,03 12,83 32,44 10,43 29,73 14,86
Combined 32,31 15,72 28,57 17,89 22,66 12,52 30,35 16,71
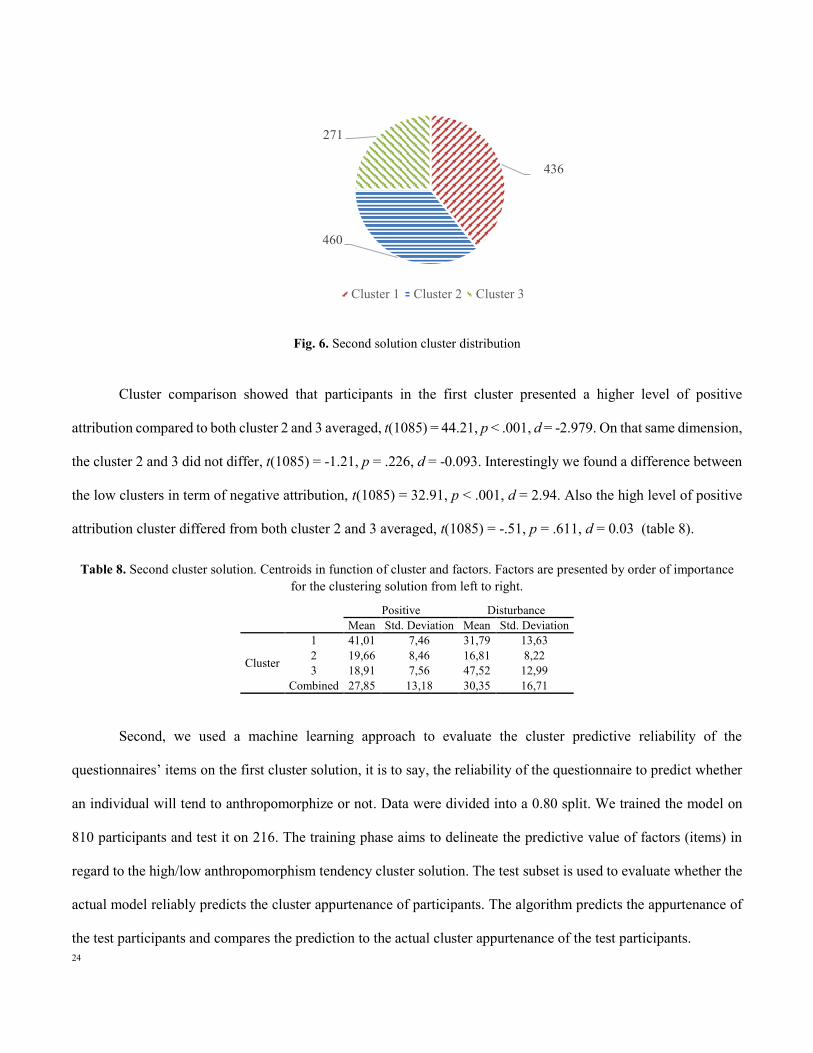
To evaluate the modulation role of Disturbance, we processed a second cluster analysis including the
positive dimensions in a single factor and the Disturbance attribution. We found a 3 cluster solution with a 1.57 ratio
sizes (figure 6) and a cluster quality = 0.5 (good fit).
626
460
Cluster 1 Cluster 2
24
Fig. 6. Second solution cluster distribution
Cluster comparison showed that participants in the first cluster presented a higher level of positive
attribution compared to both cluster 2 and 3 averaged, t(1085) = 44.21, p < .001, d = -2.979. On that same dimension,
the cluster 2 and 3 did not differ, t(1085) = -1.21, p = .226, d = -0.093. Interestingly we found a difference between
the low clusters in term of negative attribution, t(1085) = 32.91, p < .001, d = 2.94. Also the high level of positive
attribution cluster differed from both cluster 2 and 3 averaged, t(1085) = -.51, p = .611, d = 0.03 (table 8).
Table 8. Second cluster solution. Centroids in function of cluster and factors. Factors are presented by order of importance for the clustering solution from left to right.
Positive Disturbance Mean Std. Deviation Mean Std. Deviation
Cluster
1 41,01 7,46 31,79 13,63 2 19,66 8,46 16,81 8,22 3 18,91 7,56 47,52 12,99
Combined 27,85 13,18 30,35 16,71
Second, we used a machine learning approach to evaluate the cluster predictive reliability of the
questionnaires’ items on the first cluster solution, it is to say, the reliability of the questionnaire to predict whether
an individual will tend to anthropomorphize or not. Data were divided into a 0.80 split. We trained the model on
810 participants and test it on 216. The training phase aims to delineate the predictive value of factors (items) in
regard to the high/low anthropomorphism tendency cluster solution. The test subset is used to evaluate whether the
actual model reliably predicts the cluster appurtenance of participants. The algorithm predicts the appurtenance of
the test participants and compares the prediction to the actual cluster appurtenance of the test participants.
436
460
271
Cluster 1 Cluster 2 Cluster 3
25
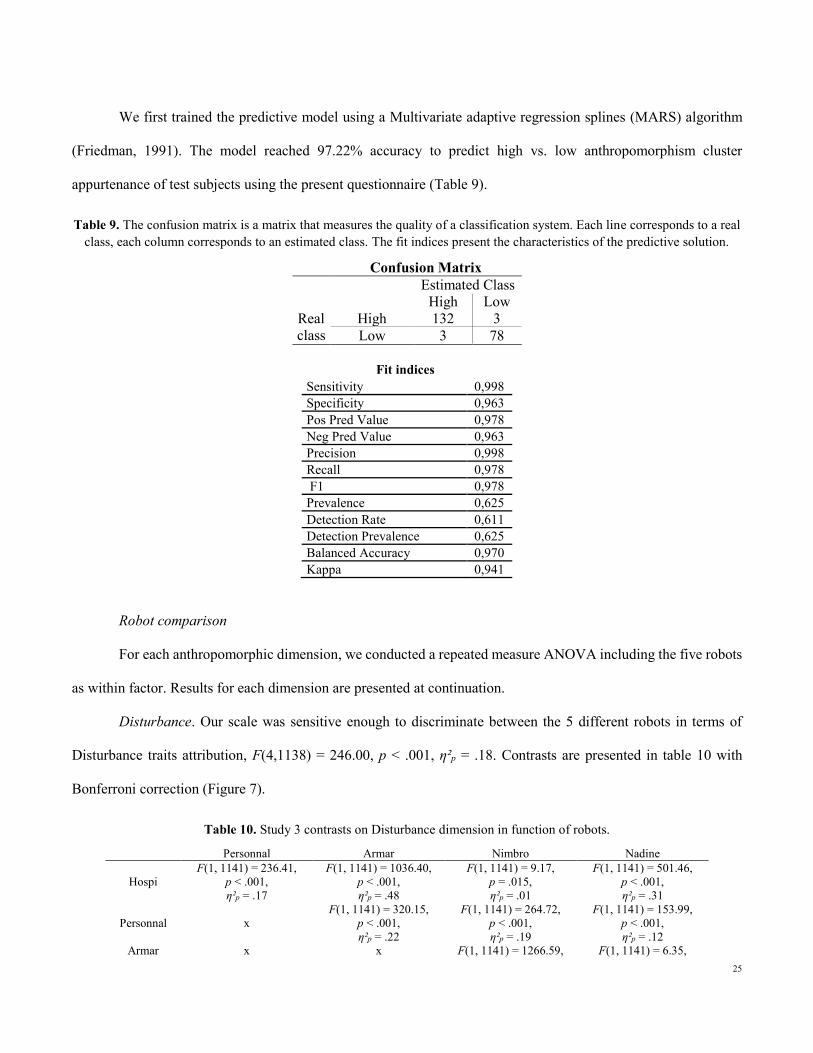
We first trained the predictive model using a Multivariate adaptive regression splines (MARS) algorithm
(Friedman, 1991). The model reached 97.22% accuracy to predict high vs. low anthropomorphism cluster
appurtenance of test subjects using the present questionnaire (Table 9).
Table 9. The confusion matrix is a matrix that measures the quality of a classification system. Each line corresponds to a real class, each column corresponds to an estimated class. The fit indices present the characteristics of the predictive solution.
Confusion Matrix Estimated Class
High Low Real class
High 132 3 Low 3 78
Fit indices
Sensitivity 0,998 Specificity 0,963 Pos Pred Value 0,978 Neg Pred Value 0,963 Precision 0,998 Recall 0,978 F1 0,978 Prevalence 0,625 Detection Rate 0,611 Detection Prevalence 0,625 Balanced Accuracy 0,970 Kappa 0,941
Robot comparison
For each anthropomorphic dimension, we conducted a repeated measure ANOVA including the five robots
as within factor. Results for each dimension are presented at continuation.
Disturbance. Our scale was sensitive enough to discriminate between the 5 different robots in terms of
Disturbance traits attribution, F(4,1138) = 246.00, p < .001, η²p = .18. Contrasts are presented in table 10 with
Bonferroni correction (Figure 7).
Table 10. Study 3 contrasts on Disturbance dimension in function of robots. Personnal Armar Nimbro Nadine
Hospi F(1, 1141) = 236.41,
p < .001, η²p = .17
F(1, 1141) = 1036.40, p < .001, η²p = .48
F(1, 1141) = 9.17, p = .015, η²p = .01
F(1, 1141) = 501.46, p < .001, η²p = .31
Personnal x F(1, 1141) = 320.15,
p < .001, η²p = .22
F(1, 1141) = 264.72, p < .001, η²p = .19
F(1, 1141) = 153.99, p < .001, η²p = .12
Armar x x F(1, 1141) = 1266.59, F(1, 1141) = 6.35,

26
p < .001, η²p = .53
p = .119, η²p = .01
Nimbro x x x F(1, 1141) = 600.58,
p < .001, η²p = .35
Fig. 7. Disturbance traits average score and distribution in function of the type of robot.
Agency. The robot were also accurately discriminated on Agency traits attribution, F(4,1138) = 261.84, p
< .001, η²p = .48. Contrasts are presented in table 11 with Bonferroni correction (Figure 8).
Table 11. Study 3 contrasts on Agency dimension in function of robots. Personnal Armar Nimbro Nadine
Hospi F(1, 1141) = 24.08,
p < .001, η²p = .02
F(1, 1141) = 91.19, p < .001, η²p = .07
F(1, 1141) = 371.85, p < .001, η²p = .25
F(1, 1141) = 676.05, p < .001, η²p = .37
Personnal x F(1, 1141) = 163.68,
p < .001, η²p = .13
F(1, 1141) = 465.38, p < .001, η²p = .29
F(1, 1141) = 802.48, p < .001, η²p = .41
Armar x x F(1, 1141) = 94.44,
p < .001, η²p = .08
F(1, 1141) = 392.82, p < .001, η²p = .26
Nimbro x x x F(1, 1141) = 154.45,
p < .001, η²p = .12

27
Fig. 8. Agency traits average score and distribution in function of the type of robot.
Sociability. According to the scale, the robots were also different in term of Sociability traits attribution,
F(4,1138) = 251.47, p < .001, η²p = .47. Contrasts are presented in table 12 with Bonferroni correction (figure 9).
Table 12. Study 3 contrasts on Sociability dimension in function of robots. Personnal Armar Nimbro Nadine
Hospi F(1, 1141) = 288.70,
p < .001, η²p = .20
F(1, 1141) = 806.07, p < .001, η²p = .41
F(1, 1141) = 20.38, p < .001, η²p = .02
F(1, 1141) = 182.22, p < .001, η²p = .14
Personnal x F(1, 1141) = 152.29,
p < .001, η²p = .12
F(1, 1141) = 162.95, p < .001, η²p = .13
F(1, 1141) = 1.179, p = .278, η²p < .01
Armar x x F(1, 1141) = 676.73,
p < .001, η²p = .37
F(1, 1141) = 165.36, p < .001, η²p = .13
Nimbro x x x F(1, 1141) = 106.5,
p < .001, η²p = .09

28
Fig. 9. Social traits average score and distribution in function of the type of robot.
Animacy. Finally, the robots were different in term of Animacy traits attribution, F(4,1138) = 736.34, p <
.001, η²p = .72, following the ABOT database pattern according to the present scale. Contrasts are presented in table
13 with Bonferroni correction (figure 10).
Table 13. Study 3 contrasts on Animacy dimension in function of robots. Personnal Armar Nimbro Nadine
Hospi F(1, 1141) = 16.66,
p < .001, η²p = .01
F(1, 1141) = 104.27, p < .001, η²p = .08
F(1, 1141) = 471.93, p < .001, η²p = .29
F(1, 1141) = 2719.28, p < .001, η²p = .71
Personnal x F(1, 1141) = 18.73,
p < .001, η²p = .02
F(1, 1141) = 188.63, p < .001, η²p = .14
F(1, 1141) = 2497.55, p < .001, η²p = .69
Armar x x F(1, 1141) = 168.59,
p < .001, η²p = .13
F(1, 1141) = 2333.47, p < .001, η²p = .67
Nimbro x x x F(1, 1141) = 1750.19,
p < .001, η²p = .61
Fig. 10. Human-like traits average score and distribution in function of the type of robot.
Construct validity
To test the external validity of the present scale we compared the level of anthropomorphic
attribution to the attitudes towards robots of participants. We expected a strong correlation between the NARS and
the present questionnaire as attitudes toward robots should predict, in part, anthropomorphic attribution. We

29
processed Pearson correlation analyses including NARS dimensions, Disturbance, Agency, Sociability, and
Animacy factors. The results are presented in Table 14.
Table 14. Correlation between Negative Attitude Towards Robots Scale and Disturbance, Agency, Sociability and Animacy dimension.
r t p
Disturbance social/future implications 0.321 11.148 0.000
emotional attitudes 0.306 10.569 0.000 actual interactions -0.126 -4.174 0.000
Agency social/future implications -0.044 -1.461 0.144
emotional attitudes -0.037 -1.230 0.219 actual interactions 0.170 5.676 0.000
Sociability social/future implications -0.136 -4.527 0.000
emotional attitudes -0.127 -4.211 0.000 actual interactions 0.260 8.852 0.000
Animacy social/future implications -0.095 -3.129 0.002
emotional attitudes -0.111 -3.667 0.000 actual interactions 0.199 6.695 0.000
3.4.3 Discussion
The present study aimed to validate the psychometric reliability of the new questionnaire and evaluate the
sensitivity of the 4 dimensions on 5 new robots from a validated database. Factorial analysis again validated the 4
dimensions structure of the questionnaire. The cluster split argues for a basic dichotomic perception were positive
traits (Agency, Sociability, Animacy) rely on a common dimension and negative traits (Disturbance) act as a
modulator in a second step. The machine learning approach makes it possible to test the reliability and stability of
the questionnaire reaching a 97.22% prediction to classify high vs. low anthropomorphism tendency group
appurtenance of participants. This result confirms the underlying common anthropomorphic dimension for positive
attribution. Finally, we used a continuous scale to evaluate the reliability of the questionnaire without categorical
responses.
The use of the continuous scale does not seem to change the structure or the stability of the constructs.
According to Cicchetti and colleagues eight, nine, ten, or even 100-point scales should show no more reliability
than a seven-point scale (Cicchetti, Shoinralter, & Tyrer, 1985).
Regarding the comparison of the robots, we found a good sensitivity to dichotomize the stimuli with
different patterns on each dimension arguing for complementarity between dimensions. As hypothesized, the

30
Animacy dimension followed the ABOT database norm. Interestingly, the attribution of high cognitive capacities
in the Agency dimension seems correlated to the human-like shape level of robots. Finally, Social and Disturbance
traits presented opposed pattern. Therefore, it seems that all dimensions do not rely on the same vector of attribution
but converge in a general dimension that is the anthropomorphic attribution.
Finally, the NARS make it possible to validate the external reliability of the questionnaire dimensions as
positive attribution was perfectly predicted by positive attitudes (actual interactions dimension) while negative
attribution was perfectly predicted by negative attitudes towards robots (social/future implications, emotional
attitudes dimensions).
3.5 Study 4: Scale validation in real-world HRI
The first experiment makes it possible to define a suitable matrix scale to evaluate attribution to various
range of robots on the four factors that are Sociability, Agency, Disturbance, and Animacy. The second experiment
was designed to evaluate how the new questionnaire could account for the change of perception of a robot after a
social interaction observation and assesses for the psychometric validity of the scale. The third experiment used an
external database to create a controlled test sampling and assesses for the sensitivity of the scale. The fourth (and
final) study tested the reliability of the questionnaire in order to finally evaluate the perception of robots online in
real-world HRI. Recent studies showed that interaction with a robot could influence the attribution of
anthropomorphic traits (Spatola, Belletier, et al., 2019, 2018). Indeed, a social robot (i.e., a robot with social verbal
interaction capacities) was seen with more uniquely human traits (e.g. warmth) and less mechanical traits (e.g.
inertness) than a passive robot (i.e., a robot displaying the same physical movements than the social robot but
without any social and verbal interaction). Regarding the present scale, the social robot interaction should elicit
more sociability and agency because of the social nature of the interaction and the related inference associated with
the robot that energizes a mentalization process in the observer (Chaminade et al., 2012; Epley et al., 2007). Also,
more Animacy attribution should be made because, compared to a non-interactive robot, the social robot should be
seen as more autonomous and with more technical and technological capacities (Foster et al., 2012). Finally, the
robot in the social interaction condition should elicit less Disturbance compared to the simple observation, as it

31
should enhance a bonding feeling (Kühnlenz et al., 2013). Finally, we expected to find the same four factors
psychometric construct than in study 1 in a real HRI context.
3.5.1 Method
Participants
Participants were 81 students from Clermont-Auvergne university (Mage= 19.33, SD= 2.42, 65% males,
35% females) recruited in exchange of credit class.
Material and procedure
In a « non-social robot » condition (n = 40), participants were asked to give their opinion on the appearance
of a physically present but passive robot. In the « social robot » condition (n = 41), participants were asked to
interact verbally with the same robot that was controlled at distance by a human operator (without their knowledge)
in a “Wizard of Oz paradigm” paradigm (Hanington & Martin, 2012). In both conditions, the robot had exactly the
same preprogrammed movements. The robot was a 1-meter MeccanoidG15KS humanoid that has already been used
in similar experiments (Spatola, Belletier, et al., 2019, 2018; Spatola, Monceau, et al., 2019). The operator was
using two smartphones for the control of the robot’s gestures and speech (by selecting pre-established
conversational scripts) in a coherent way. This verbal interaction was set to encourage anthropomorphic inferences
and familiarity towards the robot (Salem, Eyssel, Rohlfing, Kopp, & Joublin, 2013). The interaction always
followed the same pre-established script (see supplementary material), the operator only had to choose when to
launch a given sequence. After the interaction, a French version of the scale was presented to the participants6. They
had to judge to what extent the traits in the scale corresponded to the robot being present on a 7-point Likert scale
1 “not at all” to 7” totally” in a paper-pen format. Participants made their judgments on a computer. Items were
randomized to ensure the reliability of factors as not dependent on a semantic congruency effect order. Finally, in
6 To translate the questionnaire from English to French we processed as follow. First, in a forward translation, two bilingual translators have translated the questionnaire into French. As recommended one translator was aware of the purpose of the questionnaire while the second one was naïve (Sousa & Rojjanasrirat, 2011; Sperber, 2004). The initial translation was independently back-translated in a backward process and we conducted a pre-test on the questionnaire to ensure psychometric reliability.

32
both conditions the cover story was to use their judgment to provide data for projects with roboticists, none of the
participants declared any doubt about the purpose of the experiment during the debriefing. We also asked whether
participants could have been disturbed by the interaction, all responses were negative.
3.4.2 Results
Structural validity
In order to conduct a confirmatory factor analysis we checked the Bartlett's sphericity test to ensure inter-
item correlation (χ2 = 812,52, ddl = 120, p < .001) and the Kaiser-Meyer-Olkin Indice (KMO = .84) for the sample
adequacy (Cerny & Kaiser, 1977; Dziuban & Shirkey, 1974; IBM, 2011). We used the same structural model (figure
3) using a variance-covariance matrix with maximum likelihood (ML) estimation. Table 15 shows the
recommended model-fit (Schermelleh-Engel et al., 2003) indices as well as the recommended thresholds (Brown,
2015).
Table 15. Confirmatory model fit indices. χ2/df the ratio of chi square to degree of freedom; GFI the goodness-of-fit-index; AGFI the adjusted goodness-of-fit; NFI the normalized fit index, CFI the comparative fit index; RMSR the root mean square
residual.
Recommended value Values obtained χ2/df ≤ 3.00 1.01 GFI ≥ 0.90 0.87
AGFI ≥ 0.80 0.80 NFI ≥ 0.90 0.89 CFI ≥ 0.90 0.99 TLI ≥ 0.90 0.99
RMSEA ≤ 0.08 0.01 SRMR ≤ 0.08 0.08
Table 16 presents the non-standardized estimates for each item. All items were significantly associated with their
respective factor (all ps < .001).
Table 16. CFA non-standardized estimates
Items Factor Estimate S.E. t value p value Warm ← Sociability 0,706 0,081 8,666 < .001
Trustworthy ← Sociability 0,615 0,083 7,435 < .001 Likeable ← Sociability 0,765 0,091 8,4 < .001 Friendly ← Sociability 0,754 0,088 8,555 < .001
Scary ← Disturbance 0,982 0,116 8,458 < .001

33
Creepy ← Disturbance 1,064 0,111 9,565 < .001 Uncanny ← Disturbance 0,963 0,111 8,649 < .001
Weird ← Disturbance 1,048 0,124 8,468 < .001 Intelligent ← Agency 0,804 0,098 8,239 < .001 Rational ← Agency 0,502 0,102 4,905 < .001
Intentional ← Agency 0,947 0,107 8,815 < .001 Conscious ← Agency 0,618 0,106 5,833 < .001 Humanlike ← Animacy 0,789 0,099 7,98 < .001
Alive ← Animacy 0,917 0,105 8,689 < .001 Natural ← Animacy 0,85 0,104 8,138 < .001
Real ← Animacy 0,934 0,11 8,472 < .001
Experimental manipulation
We conducted a multivariate ANOVA including all factors as DVs and the type of interaction with the robot
as independent variable (non-social robot vs. social robot). Results showed that participants attributed significantly
higher Sociability [F(1,80) = 10.83, p = .001, η²p =.12], Animacy [F(1,80)=5.70, p = .019, η²p =.07] and Agency
[F(1,80)= 6.21, p =.015, η²p =.07] traits to the robot in the social interaction condition compared to the non-social
one. In addition, less Disturbance traits were associated to the robot in the social interaction condition [F(1,80) =
13.58, p<.001, η²p =.15].
3.4.3 Discussion study 3
First, this study aimed to replicate the psychometric construct of studies 1, 2, and 3 in a real-world HRI situation.
Results confirmed that the four-dimension pattern matrix is reliable according to Cronbach’s alpha (Cronbach,
1951; James Dean Brown, 2002).
Second, in agreement with our hypotheses, we found higher Sociability, Agency, and Animacy attribution in parallel
to less Disturbance when evaluating the social robot compared to the non-social one. These results are in line with
previous studies using the same methodology in which participants attributed more anthropomorphic characteristics
to the robots after a social- compared to a non-social interaction (Spatola et al 2018, Spatola et al, 2019). However,
comparing to these previous results, the present scale seems more sensitive than those used in the above-mentioned
study. Interestingly, considering the positive but relative correlation of the four dimensions and the significance of
each regarding the experimental manipulation, Sociability, Agency, Animacy, and Disturbance seem to reliably
measure different components of anthropomorphism.

34
4 Presentation of the Human-Robot Interaction Evaluation Scale
To use this scale simply present the items on a 7-points Likert scale with the following instruction:
Using the scale provided, how closely are the words below associated with the [robot stimuli to evaluate]?
From 1 “not at all” to 7 “totally”.
Items Factor
Warm Sociability
Likeable Sociability
Trustworthy Sociability
Friendly Sociability
Alive Animacy
Natural Animacy
Real Animacy
Human-like Animacy
Self-reliant Agency
Rational Agency
Intentional Agency
Intelligent Agency
Creepy Disturbance
Scary Disturbance
Uncanny Disturbance
Weird Disturbance
We highly recommend randomization, at least of the factors, so not all participants evaluate each item in
the same order which could, potentially, result in semantic bias. The structure of the scale holds with higher ranging
scales however one should take into account the number of response possibilities when planning the experiment
and the number of participants to not artificially increase interindividual variability. Therefore, we recommend the
7-points Likert scale. To analyze the score of participants we recommend considering the four dimensions
separately while checking for collinearity. In the current state of knowledge, it is indeed difficult to consider each
dimension as illustrating evaluation processes at the same levels. It is likely that one dimension may precede and
therefore condition a subsequent evaluation process on another dimension.
5 General limits
How humans consider and perceive robots is a complex topic as we still do not know and understand all
factors implied. The present scale is, thus, dependent on actual conceptualization of HRI that is a simplified

35
interaction compared to human-human interaction. Indeed, while there is basic inter-individual perception and
evaluation, a broad range of socio-cognitive factors interact to define how we will consider and perceive others
(e.g., conformism, intra-group bias) but also individual factors such as the feeling of loneliness, need for control,
etc. All these determinants could affect how we perceive robots. Thus, to understand HRI, researchers must foster
structuring perspectives more than a unitary approach.
Considering a central individual factor, in pretest and study 3, the sample was principally female and several
studies demonstrated a gender effect on attitudes toward robots (Echterhoff, Bohner, & Siebler, 2006; Eyssel,
Kuchenbrandt, Hegel, & De Ruiter, 2012; Nomura, Kanda, & Suzuki, 2006). For instance, individuals experienced
more psychological closeness to a same-sex robot than toward a robot of the opposite sex and most people report a
preference for human avatars that matched their gender (Nowak & Rauh, 2005). This gender effect could affect the
anthropomorphic attribution and thus the result of the scale. However, this bias does not seem to impair the structure
in perspective of the other studies presented in the manuscript. Still comparing the response tendency according to
dispositional factors, as mentioned above, seem of great interest for social robotics.
Finally, scales aim to measure attitudes toward a stimulus or phenomenon. However, there are two forms
of attitudes: explicit and implicit (Evans, 2008). Explicit attitudes operate on a conscious level and are generally
measured through self-report measures (e.g. questionnaires) while implicit attitudes often rely on the unconscious
and automatic processes measured, e.g. through reaction time paradigms (e.g. implicit association test) (De Houwer,
Teige-Mocigemba, Spruyt, & Moors, 2009). In other words, implicit attitudes do not require a person’s awareness
or reflexive processing. These two forms of attitudes are sometimes related (Hofmann, Gawronski, Gschwendner,
Le, & Schmitt, 2005), however, implicit attitudes are showed as better predictors of future intention and behavior,
especially in the inter-group relationship (McConnell & Leibold, 2001; Tetlock, Oswald, Mitchell, Blanton, &
Jaccard, 2013). A considerable amount of research suggests that attitudes toward others in an intergroup relationship
are often based on implicit perceptions of these groups (Banaji, Hardin, & Rothman, 1993; Greenwald & Banaji,
1995). In the context of human-robot interaction (HRI), robots may be seen as a group (i.e., as “non-human
machines”). As in other social cognitive constructs, attitudes toward robots naturally arise from both conscious and
36
unconscious processes (K. F. MacDorman, Vasudevan, & Ho, 2009; Sumioka et al., 2018), so a combination of the
proposed scale with implicit measures, e.g. heart-rate variability, reaction time, eye movements, skin conductance/
-resistance, or EEG-based measures is desirable.
5 Conclusion
In order to improve our understanding of human-robot interactions, it is of prime importance to produce
reliable tools to evaluate how we perceive these new artificial agents that we aim to integrate into our society,
especially if we aim to use these agents as experimental tools to study human cognition (Chaminade & Cheng,
2009; Cheng, 2014; Wykowska, Chaminade, & Cheng, 2016). In this article, we propose a new composite
questionnaire to evaluate how people perceive robots and attribute human characteristics to them. The scale ranges
from basic to uniquely human traits and measures the perception of others based on various state-of-the-art scales
and psychological theories such as de-humanization. Considering the composite structures of robot evaluation is
not trivial as, in interpersonal human behaviors, consequences of the attribution of human traits (or the opposite) is
predictive of attitudes (Epley et al., 2007; Urquiza-Haas & Kotrschal, 2015) but also symptomatic of the form of
the social evaluation process (Haslam & Loughnan, 2012; Kteily, Hodson, & Bruneau, 2016). With regard to robots,
to attribute them to intentional traits, for example, is relied on the recognition of a form of individuality that relies
on the same neural pathway as human-human interaction (Chaminade et al., 2012; Rauchbauer et al., 2019).
Therefore the question is not to investigate if we anthropomorphize robot per se as it seems a default state but to
what extent and what are the conditions for such a process to increase or decrease (Urquiza-Haas & Kotrschal,
2015).
Regarding the evolution of social robotics, it is relevant to continuously improve and develop theories and
tools to better envisage and evaluate the more and more complex nature of future human-robot relationships,
especially with regard to social and psychological attributions. Based on intergroup psychological constructs and
processes, the Human-Robot Interaction Evaluation Scale (HRIES) contributes to this interdisciplinary work by
extending the evaluation dimension of robots essentially in real social HRI situations. The reliability and validity
of the proposed scale are evaluated and confirmed in four different types of user studies, including different

37
complexity-levels in their experimental design as used in the HRI community, ranging from online surveys over
video-based studies, up to real-world HRI experiments.
Compliance with Ethical Standards: This study was approved by the Clermont-Ferrand IRM
UCA Ethics Committee (Ref.: IRB00011540-2018-23) and was carried out in accordance with the
provisions of the World Medical Association Declaration of Helsinki.
Conflict of Interest: The authors declare that they have no conflict of interest.
REFERENCES
Anderson, M. L. (2005). Why is AI so scary? Artificial Intelligence, 169(2), 201–208.
https://doi.org/10.1016/j.artint.2005.10.008
Bacher, J., Wenzig, K., & Vogler, M. (2004). SPSS TwoStep Cluster - A First Evaluation. University
Erlangen-Nürnberg, 1(1), 1–20.
Banaji, M. R., Hardin, C., & Rothman, A. J. (1993). Implicit Stereotyping in Person Judgment. Journal
of Personality and Social Psychology, 65(2), 272–281. https://doi.org/10.1037/0022-3514.65.2.272
Bartneck, C., Kulić, D., Croft, E., & Zoghbi, S. (2009). Measurement instruments for the
anthropomorphism, animacy, likeability, perceived intelligence, and perceived safety of robots.
International Journal of Social Robotics, Vol. 1, pp. 71–81. https://doi.org/10.1007/s12369-008-
0001-3
Bollen, K. A. (1989). Structural Equations with Latent Variables. In Structural Equations with Latent
Variables. https://doi.org/10.1002/9781118619179
Bowling, A., & Windsor, J. (2008). The effects of question order and response-choice on self-rated
health status in the English Longitudinal Study of Ageing (ELSA). Journal of Epidemiology and
Community Health, 62(1), 81–85. https://doi.org/10.1136/jech.2006.058214
Burleigh, T. J., Schoenherr, J. R., & Lacroix, G. L. (2013). Does the uncanny valley exist? An empirical

38
test of the relationship between eeriness and the human likeness of digitally created faces.
Computers in Human Behavior, 29(3), 759–771. https://doi.org/10.1016/j.chb.2012.11.021
Carpinella, C. M., Wyman, A. B., Perez, M. A., & Stroessner, S. J. (2017). The Robotic Social
Attributes Scale (RoSAS): Development and Validation. ACM/IEEE International Conference on
Human-Robot Interaction, Part F1271, 254–262. https://doi.org/10.1145/2909824.3020208
Cerny, B. A., & Kaiser, H. F. (1977). A study of a measure of sampling adequacy for factor-analytic
correlation matrices. Multivariate Behavioral Research, 12(1), 43–47.
https://doi.org/10.1207/s15327906mbr1201_3
Chaminade, T., & Cheng, G. (2009). Social cognitive neuroscience and humanoid robotics. Journal of
Physiology Paris, 103(3–5), 286–295. https://doi.org/10.1016/j.jphysparis.2009.08.011
Chaminade, T., Franklin, D. W., Oztop, E., & Cheng, G. (2005). Motor interference between humans
and humanoid robots: Effect of biological and artificial motion. Proceedings of 2005 4th IEEE
International Conference on Development and Learning, 2005, 96–101.
https://doi.org/10.1109/DEVLRN.2005.1490951
Chaminade, T., Hodgins, J., & Kawato, M. (2007). Anthropomorphism influences perception of
computer-animated characters’ actions. Social Cognitive and Affective Neuroscience, 2(3), 206–
216. https://doi.org/10.1093/scan/nsm017
Chaminade, T., Rosset, D., Da Fonseca, D., Nazarian, B., Lutcher, E., Cheng, G., & Deruelle, C. (2012).
How do we think machines think? An fMRI study of alleged competition with an artificial
intelligence. Frontiers in Human Neuroscience, 6(MAY 2012).
https://doi.org/10.3389/fnhum.2012.00103
Chaminade, T., Zecca, M., Blakemore, S. J., Takanishi, A., Frith, C. D., Micera, S., … Umiltà, M. A.
(2010). Brain response to a humanoid robot in areas implicated in the perception of human

39
emotional gestures. PLoS ONE, 5(7). https://doi.org/10.1371/journal.pone.0011577
Cheng, G. (2014). Humanoid robotics and neuroscience: Science, engineering, and society. In
Humanoid Robotics and Neuroscience: Science, Engineering and Society.
https://doi.org/10.1201/b17949
Choi, B. C. K., & Pak, A. W. P. (2005). Peer reviewed: A Catalog of Biases in Questionnaires.
Preventing Chronic Disease.
Cicchetti, D. V., Shoinralter, D., & Tyrer, P. J. (1985). The Effect of Number of Rating Scale Categories
on Levels of Interrater Reliability: A Monte Carlo Investigation. Applied Psychological
Measurement. https://doi.org/10.1177/014662168500900103
Cohen, R. J., & Swerdlik, M. E. (2013). Psychological Testing and Assessment An introduction to tests
and measurement (9th ed.). In McGrawHill. https://doi.org/13: 9780767421577
Colman, A. M., Norris, C. E., & Preston, C. C. (1997). Comparing rating scales of different lengths:
Equivalence of scores from 5-point and 7-point scales. Psychological Reports.
https://doi.org/10.2466/pr0.1997.80.2.355
Cronbach, L. J. (1951). Coefficient alpha and the internal structure of tests. Psychometrika, 16(3), 297–
334. https://doi.org/10.1007/BF02310555
Darling, K. (2012). Extending Legal Rights to Social Robots. SSRN Electronic Journal.
https://doi.org/10.2139/ssrn.2044797
Darling, K. (2017). “Who’s johnny?" Anthropomorphic framing in human-robot: Interaction,
integration, and policy. In Robot Ethics 2.0: From Autonomous Cars to Artificial Intelligence.
https://doi.org/10.1093/oso/9780190652951.003.0012
De Graaf, M. M. A., & Ben Allouch, S. (2013). Exploring influencing variables for the acceptance of
social robots. Robotics and Autonomous Systems, 61(12), 1476–1486.

40
https://doi.org/10.1016/j.robot.2013.07.007
De Houwer, J., Teige-Mocigemba, S., Spruyt, A., & Moors, A. (2009). Implicit Measures: A Normative
Analysis and Review. Psychological Bulletin, 135(3), 347–368. https://doi.org/10.1037/a0014211
de Leon, S. P., Lara-Muñoz, C., Feinstein, A. R., & Wells, C. K. (2004). A comparison of three rating
scales for measuring subjective phenomena in clinical research. Archives of Medical Research.
https://doi.org/10.1016/j.arcmed.2003.07.009
De Winter, J. C. F., & Dodou, D. (2016). Common Factor Analysis versus Principal Component
Analysis: A Comparison of Loadings by Means of Simulations. Communications in Statistics:
Simulation and Computation, 45(1), 299–321. https://doi.org/10.1080/03610918.2013.862274
Dennett, D. (2009). Intentional Systems Theory. The Oxford Handbook of Philosophy of Mind, 68(4),
87–106. https://doi.org/10.1093/oxfordhb/9780199262618.003.0020
Dennett, D. C. (1988). Précis of The Intentional Stance. Behavioral and Brain Sciences, 11(3), 495–505.
https://doi.org/10.1017/S0140525X00058611
Diab, L. N. (1965). Some Limitations of Existing Scales in the Measurement of Social Attitudes.
Psychological Reports, 17(2), 427–430. https://doi.org/10.2466/pr0.1965.17.2.427
Dupree, C. H., & Fiske, S. T. (2017). Universal dimensions of social signals: Warmth and competence.
In Social Signal Processing (pp. 23–33). https://doi.org/10.1017/9781316676202.003
Dziuban, C. D., & Shirkey, E. C. (1974). When is a correlation matrix appropriate for factor analysis?
Some decision rules. Psychological Bulletin, 81(6), 358–361. https://doi.org/10.1037/h0036316
Echterhoff, G., Bohner, G., & Siebler, F. (2006). “Social Robotics” und Mensch-Maschine-Interaktion.
Aktuelle Forschung und Relevanz fuer die Sozialpsychologie., Social robotics and human-machine
interaction: Current research and relevance for social psychology. Zeitschrift Fuer
Sozialpsychologie. https://doi.org/http://dx.doi.org/10.1024/0044-3514.37.4.219

41
Ehrlich, S. K., & Cheng, G. (2018). Human-agent co-adaptation using error-related potentials. Journal
of Neural Engineering, 15(6). https://doi.org/10.1088/1741-2552/aae069
Epley, N., Waytz, A., & Cacioppo, J. T. (2007). On Seeing Human: A Three-Factor Theory of
Anthropomorphism. Psychological Review, 114(4), 864–886. https://doi.org/10.1037/0033-
295X.114.4.864
Evans, J. S. B. T. (2008). Dual-Processing Accounts of Reasoning, Judgment, and Social Cognition.
Annual Review of Psychology, 59(1), 255–278.
https://doi.org/10.1146/annurev.psych.59.103006.093629
Eyssel, F., & Kuchenbrandt, D. (2012). Social categorization of social robots: Anthropomorphism as a
function of robot group membership. British Journal of Social Psychology, 51(4), 724–731.
https://doi.org/10.1111/j.2044-8309.2011.02082.x
Eyssel, F., Kuchenbrandt, D., Hegel, F., & De Ruiter, L. (2012). Activating elicited agent knowledge:
How robot and user features shape the perception of social robots. Proceedings - IEEE
International Workshop on Robot and Human Interactive Communication.
https://doi.org/10.1109/ROMAN.2012.6343858
Fayers, P. (2004). Item Response Theory for Psychologists. Quality of Life Research.
https://doi.org/10.1023/b:qure.0000021503.45367.f2
Fink, J. (2012). Anthropomorphism and human likeness in the design of robots and human-robot
interaction. Lecture Notes in Computer Science (Including Subseries Lecture Notes in Artificial
Intelligence and Lecture Notes in Bioinformatics). https://doi.org/10.1007/978-3-642-34103-8_20
Finn, R. H. (1972). Effects of Some Variations in Rating Scale Characteristics on the Means and
Reliabilities of Ratings. Educational and Psychological Measurement.
https://doi.org/10.1177/001316447203200203

42
Fiske, S. T., Cuddy, A. J. C., & Glick, P. (2007). Universal dimensions of social cognition: warmth and
competence. Trends in Cognitive Sciences, 11(2), 77–83. https://doi.org/10.1016/j.tics.2006.11.005
Fiske, S. T., & Neuberg, S. L. (1990). A Continuum of Impression Formation, from Category-Based to
Individuating Processes: Influences of Information and Motivation on Attention and Interpretation.
Advances in Experimental Social Psychology, 23(C), 1–74. https://doi.org/10.1016/S0065-
2601(08)60317-2
Foster, M. E., Gaschler, A., Giuliani, M., Isard, A., Pateraki, M., & Petrick, R. P. A. (2012). Two People
Walk Into a Bar : Dynamic Multi-Party Social Interaction with a Robot Agent. Icmi.
https://doi.org/10.1145/2388676.2388680
Friedman, J. H. (1991). Multivariate Adaptive Regression Splines. The Annals of Statistics.
https://doi.org/10.1214/aos/1176347963
Funke, F., & Reips, U. D. (2012). Why Semantic Differentials in Web-Based Research Should Be Made
from Visual Analogue Scales and Not from 5-Point Scales. Field Methods.
https://doi.org/10.1177/1525822X12444061
Galesic, M., & Bosnjak, M. (2009). Effects of questionnaire length on participation and indicators of
response quality in a web survey. Public Opinion Quarterly. https://doi.org/10.1093/poq/nfp031
Gorsuch, R. L. (1990). Common Factor Analysis versus Component Analysis: Some Well and Little
Known Facts. Multivariate Behavioral Research, 25(1), 33–39.
https://doi.org/10.1207/s15327906mbr2501_3
Greenwald, A. G., & Banaji, M. R. (1995). Implicit Social Cognition: Attitudes, Self-Esteem, and
Stereotypes. Psychological Review, 102(1), 4–27. https://doi.org/10.1037/0033-295X.102.1.4
Hair, J.F., Black, W.C., Babin, B.J., & Anderson, R. E. (2010). Multivariate Data Analysis. Seventh
Edition. Prentice Hall. In Exploratory Data Analysis in Business and Economics.

43
https://doi.org/10.1007/978-3-319-01517-0_3
Hanington, B., & Martin, B. (2012). Universal methods of design: 100 ways to research complex
problems, develop innovative ideas, and design effective solutions. In Choice Reviews Online (Vol.
49). https://doi.org/10.5860/CHOICE.49-5403
Haslam, N. (2006). Dehumanization: An integrative review. Personality and Social Psychology Review,
10(3), 252–264. https://doi.org/10.1207/s15327957pspr1003_4
Haslam, N., & Loughnan, S. (2012). Prejudice and dehumanization. In Beyond Prejudice.
https://doi.org/10.1017/cbo9781139022736.006
Haslam, N., & Loughnan, S. (2014). Dehumanization and Infrahumanization. Annual Review of
Psychology, 65(1), 399–423. https://doi.org/10.1146/annurev-psych-010213-115045
Heider, F., & Simmel, M. (1950). An Experimental Study of Apparent Behavior. The Japanese Journal
of Psychology, 20(2), 67–74. https://doi.org/10.4992/jjpsy.20.2_67
Heil, J., & Heil, J. (2019). The Intentional Stance. In Philosophy of Mind.
https://doi.org/10.4324/9780429506994-9
Heise, D. R. (1969). Some methodological issues in semantic differential research. Psychological
Bulletin. https://doi.org/10.1037/h0028448
Heise, D. R. (1970). Semantic Differential and Attitude Research. In Attitude Measurement.
Hendrickson, A. E., & White, P. O. (1964). PROMAX: A QUICK METHOD FOR ROTATION TO
OBLIQUE SIMPLE STRUCTURE. British Journal of Statistical Psychology.
https://doi.org/10.1111/j.2044-8317.1964.tb00244.x
Ho, C. C., & MacDorman, K. F. (2010). Revisiting the uncanny valley theory: Developing and
validating an alternative to the Godspeed indices. Computers in Human Behavior, 26(6), 1508–
1518. https://doi.org/10.1016/j.chb.2010.05.015

44
Hofmann, W., Gawronski, B., Gschwendner, T., Le, H., & Schmitt, M. (2005). A meta-analysis on the
correlation between the Implicit Association Test and explicit self-report measures. Personality and
Social Psychology Bulletin, Vol. 31, pp. 1369–1385. https://doi.org/10.1177/0146167205275613
IBM. (2011). IBM Kaiser-Meyer-Olkin measure for identity correlation matrix. Journal of the Royal
Statistical Society. Retrieved from http://www-
01.ibm.com/support/docview.wss?uid=swg21479963
Jackson, D. L., Gillaspy, J. A., & Purc-Stephenson, R. (2009). Reporting Practices in Confirmatory
Factor Analysis: An Overview and Some Recommendations. Psychological Methods.
https://doi.org/10.1037/a0014694
James Dean Brown. (2002). The Cronbach alpha reliability estimate. Shiken: JALT Testing &
Evaluation SIG Newsletter, 6(1), 17–18.
Joyce, C. R. B., Zutshi, D. W., Hrubes, V., & Mason, R. M. (1975). Comparison of fixed interval and
visual analogue scales for rating chronic pain. European Journal of Clinical Pharmacology.
https://doi.org/10.1007/BF00562315
Kätsyri, J., Förger, K., Mäkäräinen, M., & Takala, T. (2015). A review of empirical evidence on
different uncanny valley hypotheses: Support for perceptual mismatch as one road to the valley of
eeriness. Frontiers in Psychology. https://doi.org/10.3389/fpsyg.2015.00390
Kelley, H. H. (1987). Attribution in social interaction. In Attribution: Perceiving the causes of behavior.
(pp. 1–26). Hillsdale, NJ, US: Lawrence Erlbaum Associates, Inc.
Kiesler, S., Powers, A., Fussell, S. R., & Torrey, C. (2008). Anthropomorphic Interactions with a Robot
and Robot–like Agent. Social Cognition, 26(2), 169–181.
https://doi.org/10.1521/soco.2008.26.2.169
Krosnick, J. A., Boninger, D. S., Chuang, Y. C., Berent, M. K., & Carnot, C. G. (1993). Attitude

45
Strength: One Construct or Many Related Constructs? Journal of Personality and Social
Psychology. https://doi.org/10.1037/0022-3514.65.6.1132
Kteily, N., Bruneau, E., Waytz, A., & Cotterill, S. (2015). The ascent of man: Theoretical and empirical
evidence for blatant dehumanization. Journal of Personality and Social Psychology, 109(5), 901–
931. https://doi.org/10.1037/pspp0000048
Kteily, N., Hodson, G., & Bruneau, E. (2016). They see us as less than human: Metadehumanization
predicts intergroup conflict via reciprocal dehumanization. Journal of Personality and Social
Psychology. https://doi.org/10.1037/pspa0000044
Kuchenbrandt, D., Eyssel, F., Bobinger, S., & Neufeld, M. (2013). When a Robot’s Group Membership
Matters: Anthropomorphization of Robots as a Function of Social Categorization. International
Journal of Social Robotics, 5(3), 409–417. https://doi.org/10.1007/s12369-013-0197-8
Kühnlenz, B., Maximilian, E., Marcel, K., Zhi-Qiao, W., Julian, W., & Kolja, K. (2018). Impact of
trajectory profiles on user stress in close human-robot interaction. At - Automatisierungstechnik,
Vol. 66, p. 483. https://doi.org/10.1515/auto-2018-0004
Kühnlenz, B., Sosnowski, S., Buß, M., Wollherr, D., Kühnlenz, K., & Buss, M. (2013). Increasing
Helpfulness towards a Robot by Emotional Adaption to the User. International Journal of Social
Robotics. https://doi.org/10.1007/s12369-013-0182-2
Kühnlenz, K., & Kühnlenz, B. (n.d.). Insights from a Study on Human-likeness, Motor Interference and
Task Load in Close HRI. Advanced Robotics.
Lee, S., & Schwarz, N. (2014). Question context and priming meaning of health: Effect on differences in
self-rated health between Hispanics and non-Hispanic Whites. American Journal of Public Health.
https://doi.org/10.2105/AJPH.2012.301055
Lewis, J. R. (1993). Multipoint Scales: Mean and Median Differences and Observed Significance

46
Levels. International Journal of Human-Computer Interaction.
https://doi.org/10.1080/10447319309526075
Lindwall, M., Barkoukis, V., Grano, C., Lucidi, F., Raudsepp, L., Liukkonen, J., & Thgersen-Ntoumani,
C. (2012). Method effects: The problem with negatively versus positively keyed items. Journal of
Personality Assessment. https://doi.org/10.1080/00223891.2011.645936
Lopes, P. N., Salovey, P., Côté, S., & Beers, M. (2005). Emotion Regulation Abilities and the Quality of
Social Interaction. (R. E. Petty, Ed.). Emotion, Vol. 5, pp. 113–118. https://doi.org/10.1037/1528-
3542.5.1.113
Lozano, L. M., García-Cueto, E., & Muñiz, J. (2008). Effect of the number of response categories on the
reliability and validity of rating scales. Methodology. https://doi.org/10.1027/1614-2241.4.2.73
MacDorman, K. (2006). Subjective ratings of robot video clips for human likeness, familiarity, and
eeriness: An exploration of the uncanny valley. ICCS/CogSci-2006 Long Symposium: Toward ….
https://doi.org/10.1093/scan/nsr025
MacDorman, K. F., & Chattopadhyay, D. (2016). Reducing consistency in human realism increases the
uncanny valley effect; increasing category uncertainty does not. Cognition.
https://doi.org/10.1016/j.cognition.2015.09.019
MacDorman, K. F., Vasudevan, S. K., & Ho, C. C. (2009). Does Japan really have robot mania?
Comparing attitudes by implicit and explicit measures. AI and Society, 23(4), 485–510.
https://doi.org/10.1007/s00146-008-0181-2
Marchesi, S., Ghiglino, D., Ciardo, F., Perez-Osorio, J., Baykara, E., & Wykowska, A. (2019). Do we
adopt the intentional stance toward humanoid robots? Frontiers in Psychology.
https://doi.org/10.3389/fpsyg.2019.00450
Mathur, M. B., & Reichling, D. B. (2016). Navigating a social world with robot partners: A quantitative

47
cartography of the Uncanny Valley. Cognition, 146, 22–32.
https://doi.org/10.1016/j.cognition.2015.09.008
Mavletova, A. (2013). Data Quality in PC and Mobile Web Surveys. Social Science Computer Review.
https://doi.org/10.1177/0894439313485201
Maxwell, A. E., & Harman, H. H. (2006). Modern Factor Analysis. Journal of the Royal Statistical
Society. Series A (General). https://doi.org/10.2307/2343736
McConnell, A. R., & Leibold, J. M. (2001). Relations among the Implicit Association Test,
discriminatory behavior, and explicit measures of racial attitudes. Journal of Experimental Social
Psychology, 37(5), 435–442. https://doi.org/10.1006/jesp.2000.1470
Meade, A. W., & Craig, S. B. (2012). Identifying careless responses in survey data. Psychological
Methods. https://doi.org/10.1037/a0028085
Mishra, M. (2016). Confirmatory Factor Analysis (CFA) as an Analytical Technique to Assess
Measurement Error in Survey Research. Paradigm. https://doi.org/10.1177/0971890716672933
Mori, M., MacDorman, K. F., & Kageki, N. (2012). The uncanny valley. IEEE Robotics and Automation
Magazine, 19(2), 98–100. https://doi.org/10.1109/MRA.2012.2192811
Nomura, T., Kanda, T., & Suzuki, T. (2006). Experimental investigation into influence of negative
attitudes toward robots on human-robot interaction. AI and Society. https://doi.org/10.1007/s00146-
005-0012-7
Nomura, T., Suzuki, T., Kanda, T., & Kato, K. (2006a). Measurement of anxiety toward robots.
Proceedings - IEEE International Workshop on Robot and Human Interactive Communication,
372–377. https://doi.org/10.1109/ROMAN.2006.314462
Nomura, T., Suzuki, T., Kanda, T., & Kato, K. (2006b). Measurement of negative attitudes toward
robots. Interaction StudiesInteraction Studies. Social Behaviour and Communication in Biological

48
and Artificial Systems. https://doi.org/10.1075/is.7.3.14nom
Nowak, K. L., & Rauh, C. (2005). The influence of the avatar on online perceptions of
anthropomorphism, androgyny, credibility, homophily, and attraction. Journal of Computer-
Mediated Communication. https://doi.org/10.1111/j.1083-6101.2006.tb00308.x
Oxford English Dictionary. (2017). Oxford English Dictionary Online.
Oztop, E., Chaminade, T., & Franklin, D. W. (2004). Human-humanoid interaction: is a humanoid robot
perceived as a human? IEEE/RAS International Conference on Humanoid Robots, 2(4), 830–841.
https://doi.org/10.1109/ICHR.2004.1442688
Pérez-Osorio, J., & Wykowska, A. (2019). Adopting the intentional stance toward natural and artificial
agents. Philosophical Psychology. https://doi.org/10.31234/osf.io/t7dwg
Phillips, E., Zhao, X., Ullman, D., & Malle, B. F. (2018). What is Human-like?: Decomposing Robots’
Human-like Appearance Using the Anthropomorphic roBOT (ABOT) Database. ACM/IEEE
International Conference on Human-Robot Interaction. https://doi.org/10.1145/3171221.3171268
Preston, C. C., & Colman, A. M. (2000). Optimal number of response categories in rating scales:
Reliability, validity, discriminating power, and respondent preferences. Acta Psychologica.
https://doi.org/10.1016/S0001-6918(99)00050-5
Ramsay, J. O. (1973). The effect of number of categories in rating scales on precision of estimation of
scale values. Psychometrika. https://doi.org/10.1007/BF02291492
Rauchbauer, B., Nazarian, B., Bourhis, M., Ochs, M., Prévot, L., & Chaminade, T. (2019). Brain
activity during reciprocal social interaction investigated using conversational robots as control
condition. Philosophical Transactions of the Royal Society B: Biological Sciences, 374(1771).
https://doi.org/10.1098/rstb.2018.0033
Roszkowski, M. J., & Soven, M. (2010). Shifting gears: Consequences of including two negatively

49
worded items in the middle of a positively worded questionnaire. Assessment and Evaluation in
Higher Education. https://doi.org/10.1080/02602930802618344
Salem, M., Eyssel, F., Rohlfing, K., Kopp, S., & Joublin, F. (2013). To Err is Human(-like): Effects of
Robot Gesture on Perceived Anthropomorphism and Likability. International Journal of Social
Robotics, 5(3), 313–323. https://doi.org/10.1007/s12369-013-0196-9
Saygin, A. P., Chaminade, T., Ishiguro, H., Driver, J., & Frith, C. (2012). The thing that should not be:
Predictive coding and the uncanny valley in perceiving human and humanoid robot actions. Social
Cognitive and Affective Neuroscience, 7(4), 413–422. https://doi.org/10.1093/scan/nsr025
Schermelleh-Engel, K., Moosbrugger, H., & Müller, H. (2003). Evaluating the Fit of Structural Equation
Models: Tests of Significance and Descriptive Goodness-Of-Fit Measures. Methods of
Psychological Research Online, 8, 23-74. Methods of Psychological Research Online.
Schriesheim, C. A., & Hill, K. D. (1981). Controlling Acquiescence Response Bias by Item Reversals:
The Effect on Questionnaire Validity. Educational and Psychological Measurement.
https://doi.org/10.1177/001316448104100420
Schwarz, N. (1999). How the Quesions Shape the Answers. American Psychologist.
Shepherdson, P., & Miller, J. (2014). Redundancy gain in semantic categorisation. Acta Psychologica.
https://doi.org/10.1016/j.actpsy.2014.01.011
Shi, J., Kashima, Y., Loughnan, S., Suitner, C., & Haslam, N. (2008). Subhuman, Inhuman, and
Superhuman: Contrasting Humans with Nonhumans in Three Cultures. Social Cognition, 26(2),
248–258. https://doi.org/10.1521/soco.2008.26.2.248
Shoemaker, S., & Dennett, D. (1990). The Intentional Stance. The Journal of Philosophy, 87(4), 212.
https://doi.org/10.2307/2026682
Snook, S. C., & Gorsuch, R. L. (1989). Component Analysis Versus Common Factor Analysis: A Monte

50
Carlo Study. Psychological Bulletin, 106(1), 148–154. https://doi.org/10.1037/0033-
2909.106.1.148
Sousa, V. D., & Rojjanasrirat, W. (2011). Translation, adaptation and validation of instruments or scales
for use in cross-cultural health care research: A clear and user-friendly guideline. Journal of
Evaluation in Clinical Practice. https://doi.org/10.1111/j.1365-2753.2010.01434.x
Spatola, N. (2019). L’homme et le robot, de l’anthropomorphisme à l’humanisation. Topics in Cognitive
Psychology, (119), 515–563.
Spatola, N., Belletier, C., Chausse, P., Augustinova, M., Normand, A., Barra, V., … Huguet, P. (2019).
Improved Cognitive Control in Presence of Anthropomorphized Robots. International Journal of
Social Robotics, 11(3), 463–476. https://doi.org/10.1007/s12369-018-00511-w
Spatola, N., Belletier, C., Normand, A., Chausse, P., Monceau, S., Augustinova, M., … Ferrand, L.
(2018). Not as bad as it seems: When the presence of a threatening humanoid robot improves
human performance. Science Robotics, 3(21), eaat5843. https://doi.org/10.1126/scirobotics.aat5843
Spatola, N., Monceau, S., & Ferrand, L. (2019). Cognitive impact of Social Robots:How
anthropomorphism boosts performance. IEEE Robotics and Automation Magazine.
https://doi.org/10.1109/MRA.2019.2928823
Spatola, N., Santiago, J., Beffara, B., Mermillod, M., Ferrand, L., & Ouellet, M. (2018). When the sad
past is left: The mental metaphors between time, valence, and space. Frontiers in Psychology,
9(JUN). https://doi.org/10.3389/fpsyg.2018.01019
Sperber, A. D. (2004). Translation and Validation of Study Instruments for Cross-Cultural Research.
Gastroenterology. https://doi.org/10.1053/j.gastro.2003.10.016
Stansbury, J. P., Ried, L. D., & Velozo, C. A. (2006). Unidimensionality and bandwidth in the Center
for Epidemiologic Studies Depression (CES-D) Scale. Journal of Personality Assessment.

51
https://doi.org/10.1207/s15327752jpa8601_03
Sumioka, H., Złotowski, J., Nishio, S., Eyssel, F., Ishiguro, H., & Bartneck, C. (2018). Model of Dual
Anthropomorphism: The Relationship Between the Media Equation Effect and Implicit
Anthropomorphism. International Journal of Social Robotics, 10(5), 701–714.
https://doi.org/10.1007/s12369-018-0476-5
Sundar, S. S., Waddell, T. F., & Jung, E. H. (2016). The Hollywood robot syndrome: Media effects on
older adults’ attitudes toward robots and adoption intentions. ACM/IEEE International Conference
on Human-Robot Interaction. https://doi.org/10.1109/HRI.2016.7451771
Symonds, P. M. (1924). On the Loss of Reliability in Ratings Due to Coarseness of the Scale. Journal of
Experimental Psychology. https://doi.org/10.1037/h0074469
Syrdal, D. S., Dautenhahn, K., Koay, K. L., & Walters, M. L. (2009). The Negative Attitudes Towards
Robots Scale and reactions to robot behaviour in a live Human-Robot Interaction study. Adaptive
and Emergent Behaviour and Complex Systems - Proceedings of the 23rd Convention of the Society
for the Study of Artificial Intelligence and Simulation of Behaviour, AISB 2009.
Tetlock, P. E., Oswald, F. L., Mitchell, G., Blanton, H., & Jaccard, J. (2013). Predicting ethnic and racial
discrimination: A meta-analysis of IAT criterion studies. Journal of Personality and Social
Psychology, 105(2), 171–192. https://doi.org/10.1037/a0032734
Unwin, A. (2013). Discovering Statistics Using R by Andy Field, Jeremy Miles, Zoë Field. In
International Statistical Review (Vol. 81). https://doi.org/10.1111/insr.12011_21
Urquiza-Haas, E. G., & Kotrschal, K. (2015). The mind behind anthropomorphic thinking: Attribution
of mental states to other species. Animal Behaviour, Vol. 109, pp. 167–176.
https://doi.org/10.1016/j.anbehav.2015.08.011
Vandenberg, R. J. (2006). Introduction: Statistical and Methodological Myths and Urban Legends.
52
Organizational Research Methods. https://doi.org/10.1177/1094428105285506
Velicer, W. F., & Jackson, D. N. (1990). Component Analysis versus Common Factor Analysis: Some
Issues in Selecting an Appropriate Procedure. Multivariate Behavioral Research, 25(1), 1–28.
https://doi.org/10.1207/s15327906mbr2501_1
Waytz, A., Morewedge, C. K., Epley, N., Monteleone, G., Gao, J. H., & Cacioppo, J. T. (2010). Making
sense by making sentient: effectance motivation increases anthropomorphism. Journal of
Personality and Social Psychology, 99(3), 410–435. https://doi.org/10.1037/a0020240
Widaman, K. F. (1993). Common Factor Analysis Versus Principal Component Analysis: Differential
Bias in Representing Model Parameters? Multivariate Behavioral Research, 28(3), 263–311.
https://doi.org/10.1207/s15327906mbr2803_1
Williams, B., Onsman, A., & Brown, T. (2018). Exploratory factor analysis: A five-step guide for
novices. Australasian Journal of Paramedicine. https://doi.org/10.33151/ajp.8.3.93
Wood, P. (2008). Confirmatory Factor Analysis for Applied Research. In The American Statistician
(Vol. 62). https://doi.org/10.1198/tas.2008.s98
Worthington, R. L., & Whittaker, T. A. (2006). Scale Development Research: A Content Analysis and
Recommendations for Best Practices. The Counseling Psychologist.
https://doi.org/10.1177/0011000006288127
Wykowska, A., Chaminade, T., & Cheng, G. (2016). Embodied artificial agents for understanding
human social cognition. Philosophical Transactions of the Royal Society B: Biological Sciences,
Vol. 371. https://doi.org/10.1098/rstb.2015.0375
Xie, Y., & DeVellis, R. F. (2006). Scale Development: Theory and Applications. Contemporary
Sociology. https://doi.org/10.2307/2075704
Yamagishi, T. (2001). Trust as a form of social intelligence. In Trust in society. Russell Sage foundation

53
series on trust, vol. 2.
Yang, G. Z., Bellingham, J., Dupont, P. E., Fischer, P., Floridi, L., Full, R., … Wood, R. (2018). The
grand challenges of science robotics. Science Robotics, 3(14), eaar7650.
https://doi.org/10.1126/scirobotics.aar7650
Yarkin, K. L., Harvey, J. H., & Bloxom, B. M. (1981). Cognitive sets, attribution, and social interaction.
Journal of Personality and Social Psychology. https://doi.org/10.1037/0022-3514.41.2.243
View publication statsView publication stats