L2, R. L. K, - NASA · tional Laboratory, ... 11 Mullard Space Science Laboratory, University...
12
, ..... > 00 - ..q- . DRAIT '.'ERSJON JANUARY 23, 2012 typeset using style emulateapj v. 04/21/05 BROADBAND STUDY OF GRB 091127: A SUB-ENERGETIC BURST AT HIGHER REDSHIFT? E. TROJA t • 2 , T. SAKAMOT0 2 , C. GUtDORZI 3 , "" J. P. NORRlS s , A. PANAITESCU 6 :! S. KOBAYASH]<i , N. OMODEl 7 , J. C. BROWN 2 , D. N. BURROWS s , P. A. E VANS 9 , N. GEHRELS 2 , F. E. MARSHALL , N. UAWSON\ A. MELANDRl tO . 4 C. G. MUNDELL 4 , S. R. OATES II , V. PAL'SHIN L2 , R. D . PREECE 13 , J. L. RACUSIN 2 . 1. A. STEELE", N. R. TANVlR 9 , V. V AS ILEJOU l4 , C. WILSON-HODGE 5, K, YAMAOKA I6 Draft version January 29, f!0 12 ABSTRACT GRB 091127 is a bright gamma-ray burst (GRB) detected by Swift at a redshift z=0.49 and as- sociated with SN 2009nz. We present the broadband analysis of the GRB prompt and afterglow emission and study its high-energy properties in the context of the GRB/SN association. While the high luminosity of the prompt emission and standard afterglow behavior are typical of cosmological long GRBs, its low energy release (E,<3x10 49 erg), soft spectrum and unusual spectral lag connect this GRB to the class of suh-energetic bursts. We discuss the suppression of high-energy emission in this burst, and investigate vrhether this behavior could be connected vrith the sub-energetic nature of the explosion. Subject headings: gamma-ray bursts: individual (GRB 091127) 1. INTRODUCTION It is well established that (most) long duration GRBs are linked to the gravitational collapse of massive stars (Woosley & Bloom 2006). Such a connection is sup- ported by several lines of evidence (Hjorth & Bloom 2011, 2..nd references therein). In a few remarkable cases the spectroscopic identification of a broad line Type Ie SN, co-spatial and coeval with the GRB, provided a di- rect proof of the physical association between the two phenomena, With the exception of GRB 030329, whose properties are roughly similar to typical long GRBs (Berger et al. 1 NASA Postdoctoral Program Fellow 2 NASA, Goddard Space Flight Center, Greenbelt, MD 20771, USA 3 Department, University of Ferrara, via Saragat I, 1- 44122, Ferrara, Italy 4 Astrophysics Research Institute, Liverpool John MoorM Uni- versity, TwelYe Quays House, Egerton Wharf, C H41 lLD, Birken- head, UK IS PhY3ics Department, Boise State University, 1910 University Drive, Boise, ID 83725, USA 6 Space Science and Applications, MS 0466, Los Alamos Na- tional Laboratory, Los Alamos, NM 87545, USA 7 W. W. Hansen Experimental Physics Laborator::-, KaYli In- stitute =or Particle Astrophysics and Cosmology, Department of Physics and SLAC National _\ccelerator Laboratory, Stanford Uni- versity, Stanford, CA 94305, USA B Department of Astronomy and _\strophysics, Pennsylvania State University, 525 Davey University Ps.rk, fA 16802, USA 9 X-rc:.y and Observational Astronomy Gro.uP, Department of and Astronomy, University of Leicester, LEI 7RH, UK o INAF-OAB, via Bianchi 46, 1-23807 Mente (LC), Italy 11 Mullard Space Science Laboratory, University College Lon- don, Holrnbury St. Mary, Dorking Surrey, RH5 6NT, UK 12 Ioffe Physico-Technical Institute, Laboratory for Experimen- tal _\sttophysics, 26 Polytekhnicheskaya, St Petersburg 194021, Russian Federation 13 University of Alaba.ma in Huntsville, NSSTC, 320 Sparkman Drive, Huntsville, AL 35805, USA 14 Laboratoire Univers et Part.icules de Uni-.-ersite Montpellier 2, and CNRSj IN2P3, h1ontpellier, France 15 Institute of Astro and Particle Ph)'Hics , University Innsbruck, Technikerstrasse 25, 6176 Innsbruck, Austria 16 Department of Physics and 11athematics, Aoyama Gakuin University, 5-10-1 Fuchinobe, Chuo-ku, Sagamihara, Kanagawa. 252-5258 2003), GRBs with spectroscopically confirmed SNe show a peculiar behavior, both in their prompt and after- glow emission phases (Kaneko et a!. 2007; Starling et a!. 2011). These bursts are characterized by a relatively softer spectrum (Epk keV) , and a lower energy out- put than standard GRBs. They do not strictly follow the lag-luminosity relation (Norris 2002), whereas they generally agree with the Amati re- lation (Amati et aI. 2007) , but with GRB 980425 be- ing a notable outlier. Suh-energetic nearby bursts tend to show a faint afterglow emission, both in X-rays and in the optical band. Late time radio monitoring of their afterglows showed evidence of a quasi-spherical and only mildly relativistic (r", 2) outflow (Soderberg et a!. 2006), very different from the highly relativistic and col- limated jets observed in long GRBs (Bloom et a!. 2003; l\folinari et a!. 2007; Cenko et a!. 2010). For these rea- sons it has been speculated that suh-energetic e,-ents belong to an intrinsically distinct population of bursts which dominate the !ocal (z 0.5) rate of observed events (Liang et a1. 2007; Chapman et aI. 2007). Whereas the case for spectroscopically confirmed SNe remains confined to nearby GRBs, at higher redshifts (0.3 < z < 1) the emergence of the associated SN is pin- pointed by a late-time optical rebrightening or c;bump" in the afterglow light curves (Bloom et aI. 1999; Zeh et a1. 2004; Tanvir et a1. 2010). Though alternative explana- tions for such a feature are plausible (Esin & Blandford 2000; Waxman & Draine 2000), a spectroscopic analy- sis of some of these SN bumps supports their similar- ity with bright Type Ic SNe (e.g. Della Valle et a1. 2006; Sparre et a1. 2011). This is the case of GRB 091127, detected by the Swift satellite (Gehrels et a1. 2004) at a redshift of z =0.49, and associated with SN2009nz. Cobb et aI. (2010) identified in the GRB afterglow a late-time optical rebrightening, peaking at a magnitude of 1= 22.3±0.2 mag at d after the burst, and at- tributed it to the SN light. The photometric prop- erties of SN2009nz resemble SNl998bw (Galama et a1. 1998), though displaying a faster temporal evolution and a slightly dimmer peak magnitude. More recently, the https://ntrs.nasa.gov/search.jsp?R=20120010113 2018-07-27T20:40:07+00:00Z
Transcript of L2, R. L. K, - NASA · tional Laboratory, ... 11 Mullard Space Science Laboratory, University...

,..... >
00 -..q-.
DRAIT '.'ERSJON JANUARY 23, 2012 Prep~int typeset using ~TgX style emulateapj v. 04/21/05
BROADBAND STUDY OF GRB 091127: A SUB-ENERGETIC BURST AT HIGHER REDSHIFT?
E. TROJA t•2, T. SAKAMOT02, C. GUtDORZI3,"" J. P. NORRlSs , A. PANAITESCU6:! S. KOBAYASH]<i , N. OMODEl7, J. C. BROWN2, D . N. BURROWSs , P. A. E VANS9, N . GEHRELS2, F. E. MARSHALL , N. UAWSON\ A. MELANDRl tO.4
C. G. MUNDELL4, S. R. OATES II , V. PAL'SHINL2, R. D . PREECE13, J. L. RACUSIN2. 1. A. STEELE", N. R. TANVlR9 ,
V. VASILEJOU l4 , C. WILSON-HODGE 5, K, YAMAOKA I6
Draft version January 29, f!012
ABSTRACT GRB 091127 is a bright gamma-ray burst (GRB) detected by Swift at a redshift z=0.49 and as
sociated with SN 2009nz. We present the broadband analysis of the GRB prompt and afterglow emission and study its high-energy properties in the context of the GRB/SN association. While the high luminosity of the prompt emission and standard afterglow behavior are typical of cosmological long GRBs, its low energy release (E,<3x1049 erg), soft spectrum and unusual spectral lag connect this GRB to the class of suh-energetic bursts. We discuss the suppression of high-energy emission in this burst, and investigate vrhether this behavior could be connected vrith the sub-energetic nature of the explosion. Subject headings: gamma-ray bursts: individual (GRB 091127)
1. INTRODUCTION
It is well established that (most) long duration GRBs are linked to the gravitational collapse of massive stars (Woosley & Bloom 2006). Such a connection is supported by several lines of evidence (Hjorth & Bloom 2011, 2..nd references therein). In a few remarkable cases the spectroscopic identification of a broad line Type Ie SN, co-spatial and coeval with the GRB, provided a direct proof of the physical association between the two phenomena,
With the exception of GRB 030329, whose properties are roughly similar to typical long GRBs (Berger et al.
1 NASA Postdoctoral Program Fellow 2 NASA, Goddard Space Flight Center, Greenbelt, MD 20771,
USA 3 Ph~'sics Department, University of Ferrara, via Saragat I, 1-
44122, Ferrara, Italy 4 Astrophysics Research Institute, Liverpool John MoorM Uni
versity, TwelYe Quays House, Egerton Wharf, C H41 lLD, Birkenhead , UK
IS PhY3ics Department, Boise State University, 1910 University Drive, Boise, ID 83725, USA
6 Space Science and Applications, MS 0466, Los Alamos National Laboratory, Los Alamos, NM 87545, USA
7 W. W. Hansen Experimental Physics Laborator::-, KaYli Institute =or Particle Astrophysics and Cosmology, Department of Physics and SLAC National _\ccelerator Laboratory, Stanford University, Stanford, CA 94305, USA
B Department of Astronomy and _\strophysics, Pennsylvania State University, 525 Davey L~b , University Ps.rk, fA 16802 , USA
9 X-rc:.y and Observational Astronomy Gro.uP, Department of P~sics and Astronomy, University of Leicester, LEI 7RH, UK
o INAF-OAB, via Bianchi 46, 1-23807 Mente (LC), Italy 11 Mullard Space Science Laboratory, University College Lon
don, Holrnbury St. Mary, Dorking Surrey, RH5 6NT, UK 12 Ioffe Physico-Technical Institute, Laboratory for Experimen
tal _\sttophysics, 26 Polytekhnicheskaya, St Petersburg 194021, Russian Federation
13 University of Alaba.ma in Huntsville, NSSTC, 320 Sparkman Drive, Huntsville, AL 35805, USA
14 Laboratoire Univers et Part.icules de ~rontpellier , Uni-.-ersite Montpellier 2, and CNRSj IN2P3, h1ontpellier, France
15 Institute of Astro and Particle Ph)'Hics, University Innsbruck, Technikerstrasse 25, 6176 Innsbruck, Austria
16 Department of Physics and 11athematics, Aoyama Gakuin University, 5-10-1 Fuchinobe, Chuo-ku, Sagamihara, Kanagawa. 252-5258
2003), GRBs with spectroscopically confirmed SNe show a peculiar behavior, both in their prompt and afterglow emission phases (Kaneko et a!. 2007; Starling et a!. 2011). These bursts are characterized by a relatively softer spectrum (Epk ~120 keV) , and a lower energy output (E"i,o~1048-1050erg) than standard GRBs. They do not strictly follow the lag-luminosity relation (Norris 2002), whereas they generally agree with the Amati relation (Amati et aI. 2007) , but with GRB 980425 being a notable outlier. Suh-energetic nearby bursts tend to show a faint afterglow emission, both in X-rays and in the optical band. Late time radio monitoring of their afterglows showed evidence of a quasi-spherical and only mildly relativistic (r", 2) outflow (Soderberg et a!. 2006), very different from the highly relativistic and collimated jets observed in long GRBs (Bloom et a!. 2003; l\folinari et a!. 2007; Cenko et a!. 2010). For these reasons it has been speculated that suh-energetic e,-ents belong to an intrinsically distinct population of bursts which dominate t he !ocal (z ~ 0.5) rate of observed events (Liang et a1. 2007; Chapman et aI. 2007).
Whereas the case for spectroscopically confirmed SNe remains confined to nearby GRBs, at higher redshifts (0.3 < z < 1) the emergence of the associated SN is pinpointed by a late-time optical rebrightening or c;bump" in the afterglow light curves (Bloom et aI. 1999; Zeh et a1. 2004; Tanvir et a1. 2010). Though alternative explanations for such a feature are plausible (Esin & Blandford 2000; Waxman & Draine 2000), a spectroscopic analysis of some of these SN bumps supports their similarity with bright Type Ic SNe (e.g. Della Valle et a1. 2006; Sparre et a1. 2011). This is the case of GRB 091127, detected by the Swift satellite (Gehrels et a1. 2004) at a redshift of z =0.49, and associated with SN2009nz. Cobb et aI. (2010) identified in the GRB afterglow a late-time optical rebrightening, peaking at a magnitude of 1= 22.3±0.2 mag at ~22 d after the burst, and attributed it to the SN light. The photometric properties of SN2009nz resemble SNl998bw (Galama et a1. 1998), though displaying a faster temporal evolution and a slightly dimmer peak magnitude. More recently, the
https://ntrs.nasa.gov/search.jsp?R=20120010113 2018-07-27T20:40:07+00:00Z

2 E. Troja et al. .
spectroscopic analysis presented bv Berger et al. (2011) uncovered the typical undulations of broad line Type Ie SNe associated with nearby GRBs, thus confirming the SN origin of the photometric bump. Berger et al. (2011) concluded that the explosion properties of SN2009nz (EK",2xl051 erg, M,;-1.4M0 , and MNI",,0.35M0 ) are remarkably similar to SN2006aj (Pian et al. 2006), associated with GRB 060218. GRB 091127 therefore represents one of the best cases linking long GRBs and SNe at red,hifts z>0.3.
While previous works mainly focused on the properties of SN2009nz and its environment (Cobb et al. 2010; Vergani et al. 2011), in this paper we present a broadband analysis of the GRB prompt and afterglow emission and study the high-energy properties of the explosion in the co~text of GRBjSN associations. Being a bright and relatively nearby burst, GRB 091127 has a rich multiwavelength coverage up to very late times, which allows us to study in detail its spectral and temporal evolution (see also Filgas et 1'1. 2011) and compare it to other wellknown cases of GRBsjSNe.
The paper is organized as follows: our observations are detailed in § 2: In § 3 we present a multi-wavelength timing and spectral analysis of both the prompt and the afterglow emission; our results are presented in § 4 and discussed in § 5. Finally, in § 6 we summarize our findings and conclusions. Throughout the paper, times are gh'en relative to the Swift trigger time To, t=T-To, and the convention fv,t ex: lI-(3t-a has been followed l
where the energy index f3 is related to the photon index r = f3 -l- 1. The phenomenology of the burst is presented in the observer's time frame. Unless otherwise stated, all the quoted errors are given at 90% confidence level for one interesting parameter (Lampton et al. 1976).
2. OBSERVATIONS AND DATA REDUCTION
GRB 091127 triggered the Swift Burst Alert Telescope (BAT; Barthelmy et al. 2005) at 23:25:45 UT on 2009 November 27 (Troja et al. 2009). It was also observed by Konus- Wind, Suzaku Wide-band All-sky Monitor (WAM), and the Fermi Gamma-Ray Burst Monitor (GBM). The burst was within the field of view of the Fermi Large Area Telescope (LAT; Atwood et al. 2009), at an angle of 25' from the boresight.
The 2-m Liverpool Telescope (LT) responded robotically to the Swift alert and began observing at 23:28:06 UT, 141 s after the BAT trigger. The detection mode of the automatic LT GRB pipeline (Guidorzi et 1'1. 2006) identified a bright optical afterglow (r' = 15.4 mag) at " = 02h26w l9'!89, 0 = - IS'57'OS'!6 (J2000) (uncertainty of 0:'5; Smith et a1. 2009). Observations were obtained with r'i' z' filters until 2.3 hours post burst. The afterglow was monitored with both the Faulkes Telescope South (FTS) and LT up to 6 days post-burst within the BV Rr'i' filters. Magnitudes of field stars in BV R were calibrated using Landolt standard stars (Landolt 1992) obtained during following photonetric nights. SDSS r'i' z' magnitudes of t he same field stars were obtained using the transformations by Jordi et aI. (2006). Early time observations were also obtained using SkycamZ, mounted on the LT tube. Observations are filter-less (white light) to maximize the throughput of the optics. The data were dark and bias
subtracted in the usual fashion and flat fielded using a stack of twilight exposures. Standard aperture photometry was carried out using two local reference stars, and calibrated by comparison with R band frames of the same field .
Due to an Earth limb constraint, Swift did not immediately slew to the burst location and follow-up observations with its two narrow field instruments, the XRay Telescope (XRT; Burrows et a1. 2005) and the Ultra,Violet Optical Telescope (UVOT; Rorning et al. 2005), began 53 min after the trigger. As the X-ray afterglow was still bright (~1O ctss- '), XRT started collecting data in Windowed Timing (WT) mode, and automatically switched to Photon Counting (PC) mode when the source decreased to ':::;2 etas- I. Follow-up observations monitored the X-ray afterglow for 36 d for a total net exposure of 760 sin WT mode and 470 ks in PC mode. The optical afterglow was detected by UVOT in the White, V, u, uvwl , and uvm2 filters at a position consistent with the LT localizat ion. The detection in the UV filters is consistent with the low redshift z=0.49 of this burst. Swift j XFIT and UVOT data were reduced using the HEASOFTlT (v6.11) and Swift software (v3.S) tools and latest calibration products. We refer the reader to Evans et al. (2007) for further details on the XRT data reduction and analysis. The UVOT photometry was done following the methods described in Breeveld et al. (2010) with adjustments to compensate for the contamination of a nearby star.
In order to monitor the late time X-ray afterglow, two Target of Opportunity observations were performed by the Chandra X-Ray Observatory at t=98 d for a total exposure of 38 ks and t=IS8 d for a total exposure of SO ks. Chandra data were reduced using version 4.2 of the CIAO software. Source events were extracted from a 2 pixel radius region around the GRB position, while the background was estimated from a source-free area using a 20 pixel radius region.
3. DATA ANALYSIS
3.1. Gamma-ray data
3.1.1. Temporal analysis
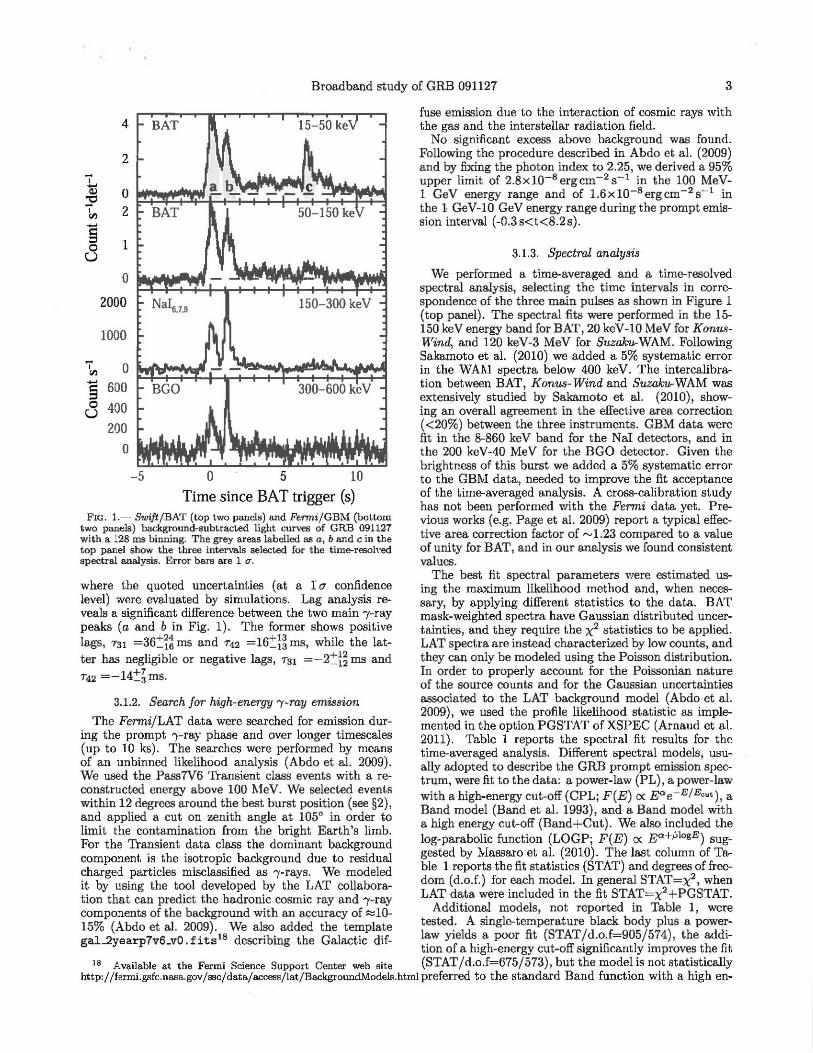
Figure 1 presents the prompt emission light curves with a 128 rns time resolution and in four different energy bands. The burst duration, defined as the interval containing 90% of the total observed fiuence, is Too (15-350 keV)=7.1±0.2 s. The burst temporal profile is characterized by two main peaks, at t.....,Q sand t.....,1.1 s, respectively. They are clearly detected up to -600 keY and display a soft-to-hard spectral evolution. A period of faint , spectrally soft emission lasting -S s, follows. On top of it a third peak at t~7 s is visible at energies below 50 keY.
Spectral lags were calculated by cross-correlating the light curves in the standard BAT channels: 1 (15-25 keY), 2 (25-50 keY), 3 (50-100 keV), 4 (100-350 keY). In order to increase the signal-to-noise ib the higher energy channels, the analysis was performed on non maskweighted lightcurves, each '\\'ith a 8 IDS time resolu-t · W d . d 2 2+22.8 d 9 2+8.2 Ion. e enve T31 = . - 11.3 rns an 7"42 = - . - 6.5 rns,
17 http://heasarc.gsfc.nasa..gov/docs/softwa:ce/lheasoft/
Broadband study of GRB 091127 3
4
2 ,. ~ Q) 0 "0 ,.
2 '" ~ §
1 0 U
o 2000
1000
o § 600
o 400 U 200
o
BAT 15-50 ke
BAT 50-150 ke
150-300 keY
BGO 300-600 keY
-5 o 5 10
Time since BAT trigger (s) FIG. 1.- Swift/BAT (top two panels) and Fenni/GBM (bottom
two panels) background-subtracted light curv~ of GRE 091127 with a l 28 ms binning. The grey areas labelled 88 4 , band c in the top panel show the three intervals selected for the time-resoh-ed spectral analysis. Error bars are 1 u.
where the quoted uncertainties (at a r (j confidence level) were evaluated by simulations. Lag analysis reveals a significant difference between the two main 'Y-ray peaks (a and b in Fig. 1). The former shows positive lags, 'T31 =36!~: rns and 742 =16~~~ rns, while the latter has negligible or negative lags, T31 =-2~i~ IllS and 742 =-14~ims .
3.1.2. Search for high-energy "(-ray emission
The Fermi/LAT data were searched for emission during the prompt ,)-ra.y phase and over longer timescales (up to 10 ks). The searches were performed by means of an unbinned likelihood analysis (Abdo et al. 2009). We used the Pass7V6 Transient class events with a reconstructed energy above 100 l\leV. We selected events within 12 degrees around the best burst position (see §2), and applied a cut on zenith angle at 105° in order to limit the contamination from the bright Earth's limb. For the Transient data class the dominant background component is the isotropic background due to residual charged particles misclassified as "(-rays. We modeled it by using the tool developed by the LAT collaboration that can predict the hadronic cosmic ray and ,,(-ray compo:J.ents of the background with an accuracy of ~W-15% (Abdo et a1 . 2009). We also addecl the template gaL2yearp7v6_vO. fits lS describing the Galactic dif-
fuse emission due to the interaction of cosmic rays with the gas and the interstellar radiation field.
No significant excess above background was found. Following the procedure described in Abdo et al. (2009) and by fixing the photon index to 2.25, we derived a 95% upper limit of 2.8xlO-8 ergcm-2 s-1 in the 100 MeV-1 GeV energy range and of 1.6xlO-8 ergcm-2 s- 1 in the [. GeV-1O GeV energy range during the prompt emission interval (-0.3s<t<8.2s).
3.1.3. Spectral analysis
We performed a time-averaged and a time-resolved spectral analysis, selecting the time intervals in correspondence of the three main pulses as shown in Figure 1 (top panel). The spectral fits were performed in the 15-150 keY energy band for BAT, 20 keV-lO MeV for KonusWind, and 120 keV-3 MeV for Suzairur WAM. Following Sa.kamoto et al. (2010) we added a 5% systematic error in the WA11 spectra below 400 ke V. The intercalibration between BAT, Konus-Wind and SuzakvrWAM was extensively studied by Sakamoto et a1. (2010), showing an overall agreement in the effective area correction «20%) between the three instruments. GBM data were fit in the 8-860 ke V band for the N aI detectors, and in the 200 keV-40 MeV for the BGO detector. Given the brightness of this burst we added a 5% systematic error to the GBM data, needed to improve the fit acceptance of the time-averaged analysis. A cross-calibra.tion study has not been performed Vlith the Fermi data yet. Previous works (e.g. Page et 001. 2009) report a typical effective area correction factor of ~ 1.23 compared to a value of unity for BAT, and in our analysis we found consistent values.
The best fi t spectral parameters were estimated using the maximum likelihood method and, when necessary, by applying different statistics to the data. BAT mask-weighted spectra have Gaussian distributed uncertainties, and they require the X2 statistics to be applied. LAT spectra are instead characterized by low counts, and they can only be modeled using the Poisson distribution. In order to properly account for the Poissonian nature of the source counts and for the Gaussian uncertainties associated to the LAT background model (Abdo et al. 2009), we used the profile likelihood statistic as implemented in the option PGSTAT of XSPEC (Arnaud et al. 2011). Table 1 reports the spectral fit results for the time-averaged analysis. Different spectral models, usually adopted to describe the GRB prompt emission spectrum, were fit to the data: a power-law (PL), a power-law with a high-energy cut-off (CPL; F(E) ()( E"'e- E/E, •• ), a Band model (Band et al. 1993), and a Band model with a high energy cut-off (Band+Cut). We also included the log-parabolic function (LOGP; F(E) ()( EQ+':'logE) suggested by Massaro et 001. (2010). The last column of Table 1 reports the fit statistics (STAT) and degrees of freedom (d.o.f.) for each model. In general STAT=X2 , when LAT data were included in the fit STAT= X2 +PGSTAT.
Additional models, not reported in Table I , were tested. A single-temperature black body plus a powerlaw yields a poor fit (STAT / d.o.f=905/574), the addition of a high-energy cut-off significantly improves the fit
18 Available at the Fecmi Science Suppoct Center web ,ite (STAT /d.o.f=675/573) , but the model is not statistically http://fermLgsfc.nasa.gov/ssc/data/access/lat/Bs.ckgroWldModels.html preferred to the standard Band function with a high en-

4 E. Troja et al.
TABLE 1 SPECrRAL FIT REsCLTS OF THE TIME-AVERAGED ANALYSIS
Det-ector Model Q /3 E.k (keY) E.ou. (keV) STATld.o.f BAT PL 2. 17±O.07 52/57 (0.91) KW PL 2. 19±0.04 74/59 (1.26) KW CPL 2.oo±O.10 510:!:1~ 57/58 (0.98)
WAM PL 2.35:!:g:~: 23/25 (0.90) WAM CPL 1.9±O.5 >400 20/24 (0.85) GBM LOGP 0.73±0.14 0.37±0.04 465/396 (1.18) GBM Band 1.20±O.16 2.23±0.04 39±5 457/395 (1.16) GBM Band+Cut O.3:::~:~ 1.94± O.OB 25:!:~6 500:!:~gg 448/394 (1.14)
GBM+LAT LOGP 0.73± 0.14 0.37±0.04 468/398 (1.18) GBM+ LAT Band 1.34±0.16 2.32± 0.06 45±5 485/397 (1.21) GBM+LAT Band+Cut O.6+o.~ 1.96:g:~~ 26:!:~5 530:!:1~ 450/396 (1.14)
JOINT LOGP 081 ;:O:J3 0.35±0.04 632/544 (1.16) . - 0 .10 JOINT Band 1.37±0.12 2.31±O.05 45±4 640/543 (1.18) JOINT Band+Cut 1·06+~ · ~5 207+0.12 36+~2 800+ 800 602/ 542 (1.11) . g Q8 ag!:!
TABLE 2 SPFCI'RAL FIT REsULTS OF THE TIME-RESOLVED ANALYSIS
Detector Model -Q - /3 Epk (keV) E.ou. (keV) STAT/ d.o.f Time interval a.: from To-O.3s to To+o.7s
BAT PL 1.91±O.10 59/57 (1.03) WAh! PL 2.42!g: ~~ 39/34 (1.15) WAM CPL 1.89±0.5 600+ 2000 33/33 (1.00) -300 GB~I LOGP <0.017 0.54±0.02 313/270 (1.16) GBM Band 0.54±0.16 2.27±0.07 56±5 257/269 (0.95) GBh! Band+Cut O.4:!:g:~8 1.97±0.17 54±6 600:!:~gg 247/268 (0.92)
GBM+LAT LOGP <0.019 0.55± 0.02 314/272 (1.15) GBM+LAT Band 0.60±0.15 2.32± 0.06 59±5 266/271 (0.98) CBM+LAT Band+Cut O.4:!:g:iS 1.97±0.17 54±S 600+900 248/270 (0.92) -200
JOINT LOGP <0.021 0.54±0.02 413/365 (1.13) JOINT Band 0.63±O·13 2.34±0.06 59±5 369/364 (1.01) JOINT Ba.nd+Cut 0.41+:2:28 2.02±0.11 53±5 700+600 344/363 (0.95) -300
Time interval b: from To+O.8s to To+l .7s BAT PL 1.78±0.12 WAM PL 2.38±0.11 WAH CPL 1.8:!:g:! GBM LOGP 0 .35±0.16 0.38±O.05 GBM Band 1.22+0 .08 2.23+0.2
3 GBM Band+Cut I 22;:8:1~ 2 13;:8:1 . -0.13 . - 0.13
GBM+LAT LOGP 0.33±O.15 O.37±0.05 GBM+LAT Band 1.31±0.06 2.6!g :~ GBM+LAT Band+Cut 1.30±O.07 2.52±0.17
JOINT LOGP O.292tt~ 0.38±0.04 JOINT Band 1.32±0.06 2.51:g:i; JOINT Band+Cut 1.29+g·~~ 2.34±0.12
ergy cut-off (STAT/d.o.f=652/573). A multicolor black body (Ryde et al. 2010) gives similar results.
Table 2 reports the results of the time-resolved spectral analysis for both intervals a and b. As found for the timeintegr~ted spectrum, alternative models do not provide an improvement in the fit statistics and are not reported in the table.
The apectrum of the third peak (intervai c in Fig. I) is well described by a power law of photon index r BAT= 2.78±0.18. The average observed flux during this interval is 8~U)( 1O- 7 ergscm-2 S-I in the IS-SOkeV band.
52/ 57 (0.92)
lOOO:!::ggo 34/ 34 (1.00) 28/ 33 (0 .87)
263/ 270 (Om) 14O±30 257/ 269 (0.95) 14O±30 >900 257/268 (0.96)
263/272 (0.97) 170±30 2.56/271 (0.94) 170±30 > 700 252/270 (0.93)
366/364 (1.00) 170!~g 361/363 (0.99) 160+~ > 1000 356/362 (0.98)
3.2. X-my data
The XRT light curve is well described (X2/d.o.f.=376/ 364) by a power law decay with slope 0b=1.03±0.04 steepening to 02=1.S5±0.03 at tbk=32~6 ks. The two Char.dm detections lie slightly above the extrapolation of this model, but are consistent with it within 3 u. This constrains the time of anr late-time jet-break in the X-ray light curve to t:2;115 d. This time was determined by forcing in the fit an additional break with :'0=1 , and by varying the break time until a Ll.X2=2.706 was reached.
During our observations a slight soft-to-hard spectral evolution is visible over the first few hours. We performed time-resolved spectral fits on seven consecutive time intervals, selected according to the light

Broadband study of GRB 091127 5
§~~i~ 10
o. ~h~.5 >: I
10 • 8+2.5
~ 0 V+1.S t:J. R+O.19 . ,. ~
i '" 15
20
-. '-
1000 104 105
Time since trigger [sJ HI'
'" ... j'-1.S _ 7;'-2.5 10-1 ~
Q. ~
= ~ q
~
10'
FIG. 2.- X-ray and optical afterglow light curVE'S of GRB 091127 with the best fit models overplotted (solid and dashed lines respectively). At late times (t>lO d) the optical emission is dominated by the underlying host galaxy. Error bars are 1 (J', Optical magnitudes are not corrected for Galactic extinction.
curve phases and to have'" 1000 net counts each. The X-ray spectra were modeled with an absorbed power law. We derived an intrinsic NH=9~~xl020 cm-2 at z=0.49, in excess of the Galactic value of 2.8x 1020 cm-2 (Kalberla et al. 2005). The resulting photon indices fx, ranging from 2.02±0.1O to 1.82±0.09, are consistent within the uncertainties, however a systematic trend of a slowly decreasing r x is evident. The time-averaged photon index is fx=1.88±0.08.
Because of the low number of events in the Chandra spectrum (67 net counts) we used the Cash statistics (Cash 1979) and fit it with an absorbed power law by fixing the absorption components to the values quoted above. The resulting photon index is f x=1.6±0.3, from which we calculate an energy conversion factor of rvl.lxlO-llergs cm-2 count-1 .
3.3. Optical data
Figt:re 2 shows the X-ray afterglow light curve, reporting the XRT (filled circles) and Chandra (open circles) data, and the optical afterglow light curves, including data from UVOT, LT, FTS, and SkycamZ. The best fit models are also shown (X-ray: solid line; optical: dashed lines).
The UVOT /White light curve is well described by a broken power law plus a constant that accounts for the host galaxy emission. The afterglow initially decays with a slope of 0.56±0.04, steepening to 1.57±0.05 after ~29 ks. We estimate a host galaxy contribution of 23.4±O.15 mag.
A significant afterglow color evolution (~I_B~0.25 mag) over the course of the first night was reported by Haislip et al. (2009). In the fit of the multicolor light curves we initially allowed for frequency-dependent slopes and/or temporal breaks, but the sparse sampling in the B, V, and Zl filters does not allow us to detect any color variation. As we found consistent results between the different filters, we performed a joint fit of the BVRr'i'z' light curves by leaving the normalizations free to vary and tying the other model parameters. The best fit model requires three temporal breaks (X2/d.o.f.=53/70). The model parameters
"-"-
"-
0.1 "-
"-'>; "-
"" "-
..: "-
0.01
10-3
om 0.1 Energy [keV[
FIG. 3.- Afterglow spectral energy distributions at 6 ks and 55 ks. The best fit model (solid line) and the same model corrected for extinction and absorption effects (dashed line) are shown.
are: ",=0.58±0.12, tbk,1=330:':}go s, "2=0.27±0.01, tbk,2=4.1:':g·7 ks, "3=0.55±0.1O, tbk,3=28:':g ks, "4=1.34±0.04. Contamination from the SN-bump and the host galax)' light , not detected in the early-time LT exposures, may explain the shallower temporal index at late times. By including in the fit a constant component with magnitude I=22.54±0.1O to account for the host emission and a SN-like bump, based on the observation of Cobb et al. (2010), the afterglow slope steepens to "4=1.64±0.06.
3.4. Spectral energy distribution
An optical-to-X-ray spectral energy distribution (SED) was produced at two different times, 6 ks and 55 ks, selected because of the good color information and in order to study the spectral evolution across the achromatic temporal break at ~30 ks. Two X-ray spectra were produced, the former in the pre-break interval 9-20 ks, the latter in the post-break interval 50-1000 ks, and scaled to match the observed count-rate at each time of interest. The two SEDs were jointly fit in count space (Starling et al. 2007) either with a power law or a broken power law continuum. In the latter case the two spectral slopes were tied so to obey the standard afterglow closure relations. Two dust and gas components, modeling the Galactic and intrinsic host extinction and absorption, were also included in the fit. We assumed a Solar metallicity for the absorption components and constrained them to the values derived from the XRT spectral fits. We tested three canonical laws - Uilky Way (MW), Small Magellanic Cloud (SMC), and Large l\lagellanic Cloud (LMC) - for the host galaxy extinction by using the parameterization of Pei (1992).
The resulting fit is shown in Figure 3. Both SEDs are well described (X2=146 for 168 d.o.f.) by a broken power law v.-ith indices .81 =O.300~g:g~o, fh=(31 +0.5=0.800:,:g:g~0 and a decreasing break energy of Ebk=0.15±0.03 keY at 6 ks and Ebk=6:':~ eVat 55 ks. A LMC-type extinction with E(B - V)=0.036±0.015 mag is only slightly preferred (~X2<2) to a MW-type or a SMC-type law.

6 E. Troja et al.
4. RESULTS
4.1. Prompt emisSion properties
4.1.1. Spectml lags
A common property of long GREs is that soft energy photons are delayed with respect to the higher energy ones. The measurement of such lags is a ,,-aluable tool in the study of G REs and their classification (e.g. Gehrels et al. 2006). Systematic studies of BATSE and Swift bursts show that long GRBs predominantlr have large, positive lags, ranging from 25 IDS to ",200 s (Norris 2002; Norris et al. 2005; Ukwatta et al. 2010), while negligible lags are characteristic of short-duration bursts (Norris & Bonnell 2006; Gehrels et al. 2006) and high-luminosity long GREs (Norris 2002).
The prompt emission of GRE 091127 seems not to fit in this classification scheme. We measured a small spectral lag of 731",2.2 ms, consistent with zero, in the BAT channels 3-1, and a negative lag of T42~-9.2 ms in the BAT channels 4-2. The burst position in the lagluminosity plane is shown in Figure 4, where we also report data for short and long GRBs from the literature (Gehrels et al. 2006; McBreen et al. 2008). Having a negligible lag and only a moderate isotropic peak luminosity (Lpk,i",~5xlO51 ergss-1), GRE 091127 does not follow the trend of cosmological long GRBs, analogously to under-luminous bursts such as GRB 980425. Nearby sub-energetic bursts (with or without an associated SN) are outliers of the lag-luminosity relation (thick dashed line). The inclusion of GRE 091127 suggests that instead of simply being outliers, there might be a population of bursts following a distinct trend (thin dashed line). While a larger sample of nearby bursts is needed to test this hypothesis, an immediate result coming from Figure 4 is that GRB 091127, wh:ch is securely associated with a massive star progenitor, intercepts the bright end of the short GRB population, showing that the scatter of long GREs in the lag-luminosity plane is larger than previously thought.
In t he case of GRE 091127, thanks to the GRB low redshift and low intrinsic extinction, the associated SN ,{as easily revealed by ground-based follow-up observations (Cobb et al. 2010; Berger et al. 2011), nailing down the nature of the GRB progenitor. However, had the same GRB occured at a higher redshift, its classification would mostly rely on its high-energy properties. At z > 3 the faint soft emission would be under the BAT detection threshold, and the GRB would appear as a zero lag, intrinsically short (Tgo/(1 + z) ;:;2 s) burst, similar to GRB 080913 and GRE 090423 for which a merger-type progenitor was also considered (e.g. Zhang et al. 2009). It is also possible that some of the higher redshift shortduration bursts arise from massive star collapses (e.g. Virgili et al. 2011).
0.2. Softening of the high-en<rgy spectrum
Fitting results are listed in Table 1 for the timeaveraged spectrum and in Tab. 2 for the time-resolved analysis. By describing the time-integrated spectrum with tile canonical Band function we obtained typical parameters: a~-1.3, 6~-2.3 and a soft peak energy of ~45 keY. However by extrapolating the best fit Band model to the LAT energy range, the predicted flux in the 100MeV-IGeV energy band is "'10-7 ergscm-2 s-',
1:' ~ .. J 50
48
~ -& 050509B
-2 0 log '[3/(1 +z) [sl
• LongGRB ShortGRB GRBSN GRB noS"
010211
-,-v-2
FIG. 4.- Lag-luminosity diagram for long GRBs (squares), short GRBs (triangles), nearby GRBs with SNe (filled circ1("s) and without SN (open circ1e3). Error bars are 1 0'.
well above the 95% upper limit derived in § 3.1.2. This is shown in Figure 5, where we report the observed data with their best fit Band model extrapolated to the LAT energy range.
The joint fits reported in Table 1 confirm that Fermi/LAT observations are not consistent with the extension of a Band function from low to high energies, but require a steepening of the spectrum at energies below 100 !\IeV. The inclusion of a high-energy spectral break, that we modelled as an exponential cut-off, improves the fit (Ll.-STAT~38 for one additional degree of freedom). Such a break is particularly evident in the K onus- Wind and in the GBM spectra, and we note that the two fits yield consistent values of the cut-off energy and an improvement in the fit statistic of Ll.X2~14 and Ll.X2~9 respectively. The quality of the data does not allow us to constrain the spectral index above the break energy and distinguish between a steepening of the power-law decay or an exponential cut-off. By modeling the highenergy data with a simple power-law we derive a photon index of ~-3.6, and set an upper limit <-2.6 (90% confidence level). The significance of the high-energy break VlaS tested by simulating 10,000 spectra with a simple Band shape. We jointly fit each set of spectra with a Band function (our null model) and a Band function with an exponential cut-off (the alternative model). The fractional number of simulations in which Ll.-STAT238 gives the chance probability that a high-energy spectral break improves the fit. None of the simulations showed a variation of the statistics as high as the one observed, confirming that the presence of a spectral break is statistically preferred at a >99.99% level.
The log-parabolic model of IIJassaro et al. (2010) also provides a better fit than the standard Band function (STAT/d.o.f~679/575 vs. 690/574), and naturally accounts for the observed suppression of the high-energy emission.
A time-resolved spectral analysis temporally localizes the spectral break during the first 'l'-ray peak (interval a). In this case the presence of a cut-off at energies "'500-1000 keY decreases the flt statistics of ..i.-STAT~25. The lower significance with respect to the time-averaged analysis is likely due to the lack of Konus- Wind data in this fit, however the observed break is evident both in

Broadband study of GRB 091127 7
10 100 1000 10' 10' 10' 10' Energy [keV]
F~G .. 5.- ~es~-fit Band model of the time-averaged spectrum (solid lm~) wIth Its 1 (I confidence interval (dashed lines). Data from Swift/BAT, Suzaku-\\'AM, GEM and Kanus- Wind are reported with their 1 C1 error bars. Upper limits from Fermi/LAT are also shown.
the WAM and in the GBM spectra at a folding energy Ecut consIstent between the different instruments. According to, this model, the obsen-ed fluence during the first peak IS (4.3±0.6) X 10-6 erg cm-2 in the 8-1000keV energy band. At a redshift z~0.49 this corresponds to ~n isotropic equivalent energy E"i,0~(3.5±0.5) x1051 erg In the 1-10,000 keY rest-frame energy band. In this time interval the derived value of the low-energy index is a=-0.41:!:g:~8, which is harder but marginally consistent with the limit of 2/3 imposed by the optically thin synchrotron emission. The presence of a thermal com parrent is sometimes invoked to explain the hardest low-energy spectral indices (e.g. Ghirlanda et al. 2003). As already noted In § 3.1, we tested this hypothesis and found that in no case does the inclusion of a black-bodv (single or multi-temperature) yield a significant improv~ ment in the fit statistics, although such a component is not inconsistent with the data.
The spectrum of the second peak (interval b) can be well descnbed by a Band function. The inclusion of the LAT data yields a steeper high-energy spectral slope than the one derived from the GBM only fit, and the addition of a h:gh-energy break is not required by the data. According to this model, the observed fiuence during this interval is (4.5±0.2)xlO-6 erg cm-2 in the 8-1000keV energy band, corresponding to an isotropic equivalent energy E"iw~(4.3±0.3) x 1051 erg in the 1-10,000 keY restframe energy band.
4.2. Afterglow properties
In Figure 6 we compare the afterglov.' of GRB 091127 to the sample of Swift GRBs with bona fide SN associations (Hjorth & Bloom 2011). The observed XRT and UVOT light curves were corrected for red shift and absorption effects, and shifted to a common rest-frame energy band of 0.3-10 keY (XRT) and a rest-frame wavelength of 1600 A (UVOT; Oates et al. 2009). From an afterglow perspectlve, GRB 091127 resembles the behavior of typical long GRBs, dominated by the bright emission from the external forward shock, rather than the unusual evolution of nearby GRBs. The isotropic X-ray luminosity at t~11 hr
is LX,i,o~2xlO45ergs-l, very similar to GRB 030329, and a factor of > 103 brighter than GRB 031203 and other GRBs/SNe. The UV /optical afterglows appear instead to decay more rapidly and to cluster at late times but this could be the result of an observational bias, a~ the chance of discovering a supernova is higher if the optical afterglow· is faint.
If the afterglov! emission of GRB 091127 is mainly synchrotron radiation from the external forward shock its broadband behavior has to obey the fireball model 'closure relations (e.g. Zhang & Meszaros 2004). We found that the GRB afterglow is roughly consistent with a model of a narrow jet expanding into a homogeneous surrounding medium. Our results agree well with previous studies (Vergani et al. 2011; Filgas et al. 2011). The fireball model describes the emission from a population of accelerated electrons with energy distribution n( E) ex E-P .
From the afterglow spectral properties we derive an electron index p=1.60:!:g:~~, which is at the lower end of the p distribution but not uncommon (Panaitescu & Kumar 2002). An achromatic break is detected at ~8hr, after WhICh the X-ray and optical light curves deca'" with a similar slope of ""' 1.6. This behavior is suggestive of an early jet-break. The presence of ajel-break at early times IS also supported b~r our Chandra observations, which do not show evidence of a steepening in the X-ray light curve several months after the burst. We found that any possible late time jet-break is constrained to t> 115 d which for typical parameters, would imply an unusually larg~ opening angle OJ >300
• Instead the two Chandra points hint at a shallower decline, as expected for example in the transition to the non-relativistic phase (Piro et a1. 2001).
The SED analvsis (§ 3.4) shows that optical and X-ray data belong to different branches of the synchrotron spectrum, since the cooling frequency Vc lies between the two energy bands. The observed break at 30 ks is therefore not connected to spectral variations or changes in the ambient density. Figure 3 shows that at 6 ks the lowest optical flux produced by the X-ray source (with I/c just below X-rays) would be only a factor ;S2 lower than measured, thus the reverse shock contribution to the. total optical flux (Kobayashi 2000) is negligible and optIcal and X-ray emission mainly arise from the same source (external forward shock). In this framework the evolution of the cooling frequency is tied to th~ observed X-ray and optical decays by the following relation (Panaitescu et al. 2006):
d In Vc - dint ~ 2(Qx-Qopt) = 0.94±0.11. (1)
This is co~sistent with our spectral fits, which measure a coolmg frequency that is rapidly moving downwards in energy as Vc ex t-1.5±O.5, as independently found in Filgas et al. (2011). For constant microphysical parameters, a decreasing Vc sugges:.s an ISM environment rather than a wind-like density profile, where the cooling frequency is expected to increase with time. In a uniform density medium, the cooling break evolves as 1/ E -l/2 -3/2t-l/2 C h . I c ex E B lor a sp enca expansion, and as Vc ex E-2j3E"B3j2tO in the jet spreading phase (Panaitescu & Kumar 2002, 2004). For constant micro-

8 E. Troja et al.
D 030329 • 0803198 10" 10" D 031203 • 050525A
• l00316D • 1012198 • lJuOfilK
• 0803198 • 0505025A • 1012198 • 090618
• \ , 060218
" 980425 • 081007 • 091127 10"
10" -~
• 08 to07 • 09 11 27 \
::c :E .... ~ 1031
.j;' 10" e.n !1 ~
.i§ ~1030
.3 0
" ,., Ie" ·6 e " I .....l 10'" >< 0« C) C)
10" <D
.... 10" ...-10"
100 1000 10' 10' 10' 100 1000 10' 10' 10' Time since burst [s] Time since burst [sl
FIG. 6.- Left panel: Rest-frame XRT afterglow lightcurvcs for Swift GRBs with an associa.ted SN (filled circlE'S). We also report the da.ta for the three pre-Swift bursts with a spectroscopicaJl~' confirmed SN (open symbols, Kaneko et aI. 2007). Right Panel: Reost-frame UVOT afterglow light curves. Only GRBs with an UVOT detection arc shown. Early time LT /FTS data for GRB 091127 are also reported.
physical parameters and no energy injection into the blastwave, the expected decay is shallower than the observed one. This shows that the simplest version of the fireball model can not account for the overall afterglow behavior I and, as we vIill discuss in Sect. 5.2, some mod· ifications (e.g. energy injection or evolving microphysca.l parameters) are required.
5. DISCUSSION
5.1. Origin of the high-energy speetml break
The most recent Fermi observations of aRBs suggested that the prompt '1'-ray emission can be satisfactorily described by a smoothly broken power law, the Band function, extending to the GeV energies, often accompanied b.v an additional non-thermal component modeled as a power law (Zhang et al. 2(11). In this burst we found that a standard Band function, though providing an adequate description of the spectrum in the keY energy range, is in contrast with the simultaneous Fermi/LAT observations as it overpredicts the observed emission above 100MeV (see Fig. 5). The spectral fits presented in Table 1 and Table 2 detect the presence of a spectnl softening at ",0.5-1 MeV in the time-integrated spectrum and during the first peak of emission. This disfavors spectral evolution as the origin of the observed feature.
A steepening of the high-energy spectral slope could be caused by several factors such as absorption from the extragalactic background light (EBL), attenuation via pair production (')''1' --+ e±) or an intrinsic break in the energy distribution of the emitting electrons. Based on the low redshift of this burst (z=0.49) and the low energy of the observed break, EBL absorption can be excluded (see e.g. Finke et al. 2010). Belov! we consider in turn the other possibilities.
Opt:eal depth effects - The lack of high-energy photons in bright bursts such as GRB 091127 could be an indication of a pair opacity break (Beniamini et al. 2011), and therefore used to constrain the outflow Lorentz factor ( Lith~'ick & Sari 2(01). In order to be self-consistent these calculations rely on the fundamental assumption that the observed sub-MeV spectrum extrapolates to aeV energies. Following this line of argument, we can set a first upper limit on the bulk Lorentz factor in aRB 091127 just by considering its non-detection by LAT. We use here the Band function parameters and impose Em ",<100MeV:
r" < 130 [C~~7:,V) !loo t;-l].m (2)
where ,6=2.28 is the high-energy spectral slope and flOo ~O.l ph cm-2 S-1 keV-1 the observed flux density at 100 keY, both derived from the spectral fit in Tab. 1. The variability timescale was set to tv"'0.3 s, the minimum value observed in the "I-ray lightcurve. In deriving Eq. 2 we approximated the spectral shape with a simple power-law, fv <X v-p. Given that for E=100MeV the typical energv of the target photons is E, ~ 1 MeV> > Ep'" the effects of low-energy spectral
curvature (Baring & Harding 1998) can be considered negligible and a simple power-law decay is a valid approximation.
The upper limit derived in Eq. 2 is based on the simple formulation given in Lithwick & Sari (2001), where spatial and temporal dependencies are averaged out. More realistic calculations taking into account the progressive buildup of the radiation field further decrease the above value by a factor of 2-3 (Hascoet et a1. 2011), that is r n '" 50. This is significantly lower than the values

Broadband study of GRB 091127 9
estimated for cosmological GRBs (Molinari et al. 2007; Liang et al. 2010), though similar to the Lorentz factor inferred for X-ray flares (Abdo et al. 2011). If we now take into account the observed steepening at ;S1 MeV as it c:-iginates from an increase in the optical depth, by setting Emax. ~Ecut we get r ~ 2. Such a low Lorentz factor, tr"ough atypical for classical GRBs, is not unprecedented (Soderberg et al. 2006). A weakly relativistic outflow could therefore account for the lack of highenerg~j photons, and the observed soft spectrum, but not for the bright afterglow detected a few minutes after the burst.
An independent estimate of the bulk Lorentz factor can be derived from afterglow observations. The duration of the GRB being rather short, we consider the thin shell case (Kobayashi et al. 1999). Since the afterglow is already fading in our first observation we can assume that be onset happened at tpk <140 (l+z)-1 ~100s, and set a lower limit to the outflow Lorentz factor ro (Piran 1999):
ro > 240 ( E,,~; ) 1/8
1]0.2 n pk,2 (3)
where E;,=1052 E-y,52 erg is the isotropic-equivalent energy, TJ = O.21}!J.2 is the radiative efficiency and n ~1 cm-3 is the medium density (Bloom et al. 2003). By using the empirical relation suggested by Liang et al. (2010), we infer a similar high value of ro ~200.
The limits derived from the prompt and afterglow emission properties are inconsistent: the former suggest a mildly relativistic outflow (r < 50, or even r "'2), the latter a highly relativistic jet (r » 100). A possibilitv that would reconcile the two sets of limits is that the fiBt spectrally softer pulse, during which we detect the significant presence of a spectral break, is instead the GRB precursor originating at RR::2r2ctuR:: lOll em, e.g. from the jet cocoon emerging from the progenitor star (Lazzati & Begelman 2005). A different physical origin could also explain the different lags between the two main '"V-ray events and the unusual lag evolution: while spectral lags in GRB pulses generally tend to increase with time (Hakkila et al. 2008), it has been found that precursors have larger lags than the following 'Y-ray emission (Page et al. 2007). Precursors, however, carry only a small fraction of the total energy release (Morsony et al. 2007), while the first peak encloses 50% of the observed ')'-ray fiuence.
We therefore are led to consider that our assumption of a palr opacity break is not valid, that is: 1) the incomistency between Eq. 2 and Eq. 3 implies that the Band-t.ype spectrum does not extend to Ge V energies, but a spectral break (not related to optical depth effects) below 100 MeV. is required by the data; 2) we identify this b,eak with the steepening at ",0.7 MeV, which is therefore an intrinsic feature of the GRB spectrum.
Breaks in GRB spectra - We discuss here the standard scenario, in which internal shocks within the expanding outflow accelerate the ambient electrons to relativistic energies with a power-law distribution n(E) ex: E-P. The GRB prompt emission originates as synchrotron radiation from the shock-accelerated electrons. The small ratio between the GeV and keV fluences of this burst,
'J"GeV /'J"keY ;S 0.01, disfavors Synchrotron Self Compton as the main radiation mechanism (Piran et a1. 2009; Beniamini et al. 2011).
The observed spectrum of the first ,-ray peak, is roughly in agreement with a fast cooling synchrotron spectrum: the low-energy slope a~-O.4 is marginally consistent with the maximum slope of 2/3 allowed for v<v" while the high-energy slope fJ ~-2 suggests that for E >50 keV we are already above the injection frequency V m . It follows that VcR::Vm, that is the effects of adiabatic and radiative cooling are comparable (marginal fast cooling; Daigne et al. 2011). In the extreme case r c/r m I"V 10, synthetic spectra resemble the observed spectral shape: a hard low-energy tail followed by a smooth, flat transition (vm<v<lO vm) to the final Fv'X v-p/2 decay. The observed steepening at "'0.7 MeV from fJ~-2 to <-2.6 corresponds to this transition, and implies p ~ 3.2. However when the slow cooling contribution is significant, the radiative efficiency decreases markedly (Daigne et al. 2011), and it is hard to account for the high luminosity and variability of the prompt emission. If we consider the more efficient case of rcir m ~1 , then the spectral break has to be ascribed to a different mechanism.
. A spectral cut-off is expected at vbM), where '"(M'
is the maximum Lorentz factor of the shocked electrons. Such a break occurs at energies ;:;200 l\IeV (Bosnjak et al. 2009), and it is unlikely at the origin of the MeV break. An alternath,-e explanation is an intrinsic curvature in the energy distribution of the radiating electrons (Hassaro et al. 2010), arising if the higher energy electrons are accelerated less efficiently than those with lower energy.
5.2. Jet collimation and energetics
From our broadband spectral fits of the prompt emission we derived an isotropic equivalent energy E"i'o =(1.1±0.2) x 10'2 erg, which is in the typical range of long GRBs (Bloom et al. 2003). The afterglow properties show evidence of a tightly collimated outflow, indicating that the true energy release is significantly lower. The achromatic nature of the break at tbk ~30 ks and the subsequent afterglow fast decay are typical signatures of a jet-break, and we first consider this hypothesis. ill this scenario the jet opening angle OJ is:
e. =4.2 (Ei'0"2)-1/8 (tbk )3/8 deg, (4) J 'Ia.2 n 8 hr
and the collimation-corrected energy is E"j=(3.0±0.8) x 1049 erg, at least an order of magnitude lower than typical long GRBs (Cenko et al. 2010). However, as noted in § 4.2, this simple fireball scenario fails to reproduce two main features: 1) the rapid temporal evolution of the cooling frequency; 2) the observed pre-break flux decay rates (ax = 1.03±0.04, aopt = 0.56±0.04), which are not compatible with the model expectations (av>v" 1"V0.7, av,,>v>vm 1"V0.45 for a spreading jetj av>vc = av,,>v>vm I"VO.8 for a non-spreading jet; Panaitescu & Kumar 2004). In order to reconcile the observed afterglow behavior with the theoretical expectations one needs to invoke either a continual energy injection and/or evolving microphysical parameters. The former scenario would require an

10 E. Troja et al.
0 ;::
;:: ~ 10
~60218 ~
~ - • w -c
-'" c
~o 031203 ~ Long GRBs
L .030329
091127 ~n. ~XRF 020903
0.1
98~ / 091127 (I)
10 EK [10'" erg]
lOa
FIG. 7.-:- Prompt emission" energy release, E'l' versus afterglow kinetic "lnergy, EK. For GRB 091127 both the scenarios discussed in the text are shown: (I) narrow jet + prolonged energy injection; (II) evolving ~B. We report data for standard long GRBs (filled circles), XRFs (open circles), and bursts with a spectroscopic SN (squares). Values are corrected for collimation effects. Ref: Panaitucu & Kumar (2002); Bloom et al. (2003); Soderberg et aI. (2004); Cenko et aI. (20lO).
extreme injection episode, the jet energy increasing by a factor of 100 in the first 8 hours. Furthermore, there is no apparent reason for the injection to end at the time of the jet-break, leading to an even larger shock energY carried by the slower ejecta. The alternative possibility of a growing magnetic energy fraction € B is discussed by Filgas et al. (2011). ~-e found instead that a narrow confined jet, 'Vihose
boundary is visible from the first afterglow measurement (i.e. r < 8;1), and a prolonged energy injection, lasting until rv30 ks, provide a consistent description of the afterglow temporal and spectral properties and ease the energetic burden without requiring any variation of the shock microphysical parameters. For an ISM-like circumburst medium (§ 4.2), the flux decay indices are given by (Panaitescu & Kumar 2004):
3 p+4 "'0 = 4P - -4-e, (5)
3p+ I p+3 "'x = -4- - -4-e, (6)
where e is the power-law evolution of the forward-shock energy E ex te. The above set of equations overconstrain the e parameter, thus providing a consistency check of the solution. By substituting in Eq. 5 and 6 the observed pre-break temporal slopes and the value of p~1.6 from the broadband spectral fit, we derive e=0.48±0.06 and e=0.39±0.06, respectively. Departures of the energo" injection from a pure power law can explain the optical plateau at t<5 ks, while the cessation 6f energy injection at R<3C ks yields the observed achromatic break. According to this model, by imposing tbk < 140s in our Eq. 4 we derive OJ ;S0.6 (nil cm-3 )l/S deg, and E, ;S6x1047
(nil cm-3)l/4 erg. By using e ~0.45, the blastwave kinetic energy can be constrained to &<. ;S3x 1050 erg, most of which comes from the slower ejecta that are gradually replenishing the forward shock energy.
From our analysis the following features clearly. emerge: GRB 091127 is characterized by a highly col-
limated outflow (OJ;S4'), a low prompt 'Y-ray energy (E, <3x 1049 erg), and a total relativistic energy yield of Em1 ;S3 X 1050 erg, at the lower end of the long GRBs distribution. In Figure 7 VIe compare the burst energetics with the sample of long GRBs. Independently from the afterglow model adopted (I, narrow jet + energy injection: star; II, evolving €B: diamond), the' burst location in the lower left corner shows that GRB 091127 more closely resembles the class of X-ray Flashes (XRFs) and GRBs/SNe rather than typical GRBs. This is also consistent with its rather soft spectrum and unusual lags.
6. SUMMARY AND CONCLUSION
We presented a broadband analysis of the prompt and afterglow emission of GRB 091127, securely associated with SN2009nz. Two main features emerged from our study of the prompt emission: I) the burst is characterized by small, negligible spectral lags; 2) the high energy (>IOOMeV) emission is significantly suppressed. The GRB has a long duration (T90~7s), and a relatively soft spectrum (EpkR<45 ke V). However having negligible spectral lags and only a moderate luminosity, the burst does not fit the lag-luminosity relation followed by cosmological long GREs, but lies in the region of short duration bursts. While the association with SN2009nz leaves no douMs about the origin of the GRB progenitor, the atypical lag behavior adds additional uncertainty in the classification of GRBs based solely on their high-energy properties. It also links GRB 091127 to nearby sub-energetic bursts, such as GRB 980425, which are also outliers of the lag-luminosity relation.
By modeling the GRB prompt emission with the standard Band function, we found that such a model significantly overpredicts the observed flux at higher (>100 MeV) energies. Consistently, our spectral fits show eyidence of a spectral curvature at energies ;S11\[eV. If due to opacity effects, the suppression of high energy emission would suggest a low outflow Lorentz factor (r < 50, or even r ~ 2), as measured in nearby subenergetic GREs. However, this interpretation is not consistent with our early-time detection of a bright fading afterglow, which suggests r»100. We therefore conclude that the high-energy break is an intrinsic property of the GRB spectrum.
The multi-wavelength afterglow emission is characterized by an achromatic break at ",8 hr after the burst, and by a rapidly decaying cooling frequency, lie ex: t-1.5±0.5. We considered two scenarios to interpret these features within the standard fireball model. The former interprets the achromatic break as ajet-break, from which we derive a jet opening angle 8 j ~4 deg, and a collimation-corrected energy E,R<3xl049 erg. This. model needs to let the microphysical parameters vary with time in order to reproduce the observed temporal decays and the rapidlv decreasing lie. The latter scenario instead interprets the achromatic break as the end of a prolonged energy injection episode, the jet-break happening before the start of our observations (t<140 s). According to this model, we derive a jet opening angle OJ ;S 0.6 deg, and a collimationcorrected energy E,;S6xI047 erg. This GRB therefore presents hybrid properties: a high luminosity ')'-ray emission powered by narrowly collimated and highly relativistic outflow as typical of long GREsj its low-energy

'.
Broadband study of GRB 091127 11
output, rather soft spectrum and location in the lagluminosity plan more closely resembles the class of XRFs and GRBsjSNe.
We thank T. Ukwatta, R. Starling, and and R. Filgas for useful discussions and information.
ET was supported by an appointment to the NASA Postdoctoral Program at the Goddard Space Flight Center, administered by Oak Ridge Associated Universities through a contract with NASA.
This work made use of data supplied by the UK Swift Science Data Centre at the University of Leicester.
The Konus-Wind experiment is supported by a Russian Space Agency contract and RFBR grant 11-02-12082·ofLm.
The Fermi LAT Collaboration acknowledges generous ongoing support from a number of agencie!) and institutes that have supported both the development and the
operation of the LAT as well as scientific data analysis. These include the National Aeronautics and Space Administration and the Department of Energy in the United States, the Commissariat a. [,Energie Atomique and the
. Centre National de la Recherche Scientifique j Institut National de Physique Nucleaire et de Physique des Particules in France, the Agenzia Spaziale Italiana and the Istituto Nazionale di Fisica NUcleare in Italy, the Ministry of Education, Culture, Sports, Scit~nce and Technology (MEXT), High Energy Accelerator Research Organization (KEK) and Japan Aerospace Exploration Agency (JAXA) in Japan, and the K. A. Wallenberg Foundation, the Swedish Research Council and the Swedish National Space Board in Sweden.
Additional support for science analysis during the operations phase is gratefully acknowledged from the Istituto Nazionale di Astrofisica in Italy and the Centre National d'Etudes Spatiales in France.
REFERENCES '
Abelo, A. A., Ackermann, M., Ajello, M. , et aI. 2011, ApJ , 734, L27+
Abdo, A. A" Ackermann, M., Asano, K., et at. 2009, ApJ, 707, 580 Amati, L., Della. Valle, M., Frontera, F., et al. 2007, A&A, 463, 913 Arnaud, K, Smith, R., & Siemiginowska, A. 2011, Cambridge
Observing Handbooks for Research Astronomers, 7, 18B1',9780521883733
Atwooci, W. B., .\bdo, A. A., Ackermann, !\l., et a1. 2009, ApJ, 697, 1071
Band, D., Matteson, J., Ford, L., et al. 1993, ApJ, 413, 281 Baring. !l.L G. & Harding, A. 'K. 1998, Advances in Space Research,
22, IllS Barthelmy, S. D., Barbier, L. M., Cummings, J. R., et aI. 2005,
Space Science Re\'iews, 120, 143 Beni&JT'Jni, P., Guetta, D., Na.w, E., & Piran, T. 2011, MNRAS,
416, 3089 Berger: E., Charnock, R, Holmes,.T. R, et al. 2011, ApJ, 743, 204 Berger: E ., Kulkarni, S. R., Pooley, G., et a!. 2003, Nature, 426,
164 Bloom, J . S., Frail, D. A., &£ Kulkarni , S. R. 2003, ApJ, 594, 674 Bloom, J . S. , Kulkarni, S. R. , Djorguvski , S. G., et aI. 1999, Nature,
401,453 Bahljak, Z., Daigne, F ., &. Dubus, G. 2009, A&A, 498 , 677 Breeve1d, A. A., Curran, P. A., Hoversten, E. A. , et a1. 2010,
1'.1NRAS, 406, 1687 Burrows, D. N., Hill, J. E., Nousek, J. A., at al. 2005, Space Science
Redsws, 120, .165 Cash, W. 1979, ApJ, 228, 939 Cenko, S . B., Frail, D. A., Harrison, F. A., et aJ. 2010, ApJ, 711,
641 Cha.pman, R., Tanvir, N. R., Priddey, R. S., & Levan, A. J. 2007,
MNRAS, 382, L21 Cobb, B. E., Bloom, J. S., Perley, D. A., et al. 2010, ApJ, 718,
LISO Daigne, F., BoBnjak, Z., & Dubus, G. 2011, A&A, 526, .\110+ Della. VeJle, M., Malesani, D., Bloom, J.·S., et aI. 2006, ApJ, 642,
LI0S Esin, A. A. & Blandford, R. 2000, ApJ, 534, L151 Evans,? A., Beardmore, A. P., Page, K. L., et a1. 2007, A&A, 469,
379 Filgas , R., Greiner, J. , Schady, P. , et aI. 2011, A&A, 535, A57 Finke, J. D., Razzaque, S., &£ Dermer, C. D. 2010, ApJ , 712, 238 Gdam&, T . J., ' .TreE"Jwijk, P. M., van Paradijs, J ., et a1. 1998,
Nature, 395, 670 Gehrels, N., Chincarini, G., Giommi, P., et aI. 2004, ApJ, 611,1005 Gehrels, N., :"lorris, J. P., Barthelmy, S. D. , et aI. 2006, Nature,
444, 1044 Ghirlanda., G., Ce1otti, A., & Ghisellini, G. 2003, AkA, 406, 879 Guldorzi, C., Monfardini, A., Gomboc, A., et al. 2006, PASP, 118,
288 . HakkUa, J., Giblin, T. W., Norris, J. P., Fragile, P. C., &. Bonne!l,
J. T, 2008, ApJ, 677, L81
Hascoet, R. , Daigne, F., Mochkovitch, R, &£ Vennin, V. 2011, arXiv:1110.6313
Hjorth, J. Ix. Bloom, J. S. 2011, arXi\' :1104 .2274 Jordi, K., Grebel, E. K., Ix. Ammon, K. 2006, A&A, 460, 339 Kalberla, P. M. W., Burton, W. B., HW'tmann, D., at a1. 2005,
A&A, 440, 775 Kaneko, Y., Ramirez-Ruiz, E., Granot, J., et aI. 2007, ApJ, 654,
385 Kobayashi, S. 2000, ApJ, 545, 807 Kobayashi, S., Pirau, T., &. Sari, R. 1999, ApJ, 513,669 Lampton, M., :Margon, B., & Bowyer, S. 1976, ApJ, 208, 177 Landolt, A. U. 1992, AJ, 104, 340
. Lazzati, D. & Begelman, M. C. 2005, ApJ, 629, 903 Liang, E., Yi, S., Zhang, J., et a1. 2010, ApJ , 725, 2209 Liang, E., Zhang, B., Virgili, F., &. Dai, Z. G. 2007, ApJ, 662, 1111 Lithwick, Y. &; Sari, R. 2001, ApJ, 555, 540 Massaro, F., Griridlay, J . £ ., &. Paggi, A. 2010, ApJ, 714, L299 l\[cBreen, S. , Foley, S., Watson, 0., at al. 2008, ApJ, 6IT, L85 Molinari, E., Vergani, S. D., Ualesani, D ., ot ai. 2007, A&A, 469,
L13 Morsony, B. J. , Lazzati, D., &. Begelman, hI. C. 2007, ApJ, 665,
569 Norris, J. P. 2002, ApJ, 579, 386 Norris, J. P. & Bonnell, J. T . 2006, ApJ , 643,266 Norris, J. P., Bonnell, J. T., Kazanas, n'r et al. 2005, ApJ, 627,
324 Oates, S. R., Page, M. J., Schad:;, P., et 8,1. 2009, MNRAS, 395,
490 Page, K. L., Willingale, R., Bissaldi, E., et aI. 2009, MNRAS, 400,
134 Page, K. L., WilIingaIe, R., Osborne, J. P., ct al. 2007, ApJ, 663,
1125 Panaitescu, A. & Kumar, P. 2002, ApJ, 571, 779 Panaitescu, A. & Kumar, P. 2004, MNRAS, 350, 213 Panaitescu, A., Meszaros, P., Burrows, D., at aI. 2006, MNRAS,
369, 2059 Pei, Y. C. 1992,ApJ, 395, 130 Pian, E., Mazzali, P. A., Masetti, N., et aI. 2006, Nature, 442, 1011 Piran, T; 1999, Phys. Rep. , 314, 575 Piran, T., Sari, R., & Zoll, Y.-C. 2009, MNRAS, 393, 1107 Piro, L., Garmire, G., Garcia, M. R., et al. 2001 , .\pJ, 558, 442 Homing, P. W. A., Kennedy, T. E., Mason , K. 0., et aL 2005,
Space Science Reviews, 120, 95 Ryde, F. , Axelsson, M., Zhang, B. B., et ai. 2010, ApJ , 709, L172 Smith, R J., Kobayashi , S. , Guidorzi, C., & MWldell, C. G. 2009,
GRB Coordinates Network, 10192, 192, J Soderberg, A. M., Kulkarni, S. R, Berger, E. , et al. 2004, Nature,
430, 648 Soderberg, A. :M., Kulkarni, S. R., Nakar, E., et al. 2000, Nature,
442, 1014 Sparre, M., Sollerman, J., F~'nbo, J. P. V., et aI. 2011, ApJ, 735,
L24+

.. 12 E. Troja et al.
Starling, R. L. C., Evans, P. A" Read, A. M., et al. 2011, MNRAS, 412, 1853
Starling, R. L. C., Wijers, R. A. M. J., Vt'iersema, K., et aI. 2007, ApJ, 661, 787
Tanvir, N. R., Rol, E., Levan, A. J., et al. 2010, ApJ, 725, 625 Traja, E., Barthelmy, S. D., Baumgartner, W. H" et a1. 2009, GRB
Coordinates Network, 10191, 191, 1 Ukwatta, T. N., Stamatikos, M., Dhuga, K. S., et al. 2010, ApJ,
711, 1073 Vergani, S. D., Flores, H., Covino, S., et al. 2011, A&A, 535, A127 Virgili, F. J., Zhang, B., O'Brien, P., & Traja, E. 2011, ApJ, 727,
109
Waxman, E. & Draine, B. T. 2000, ApJ, 537, 796 Woosley, S. E. & Bloom, J. S. 2006, ARA&A, 44, 507 Zeh, A., Klose, S., & Hartmann, D. H. 2004, ApJ, 609, 952 Zhang, B. & Meszaros, P. 2004, International Journal of Modern
Physics A, 19, 2385 Zhang, B., Zhang, B., Liang, E., et al. 2011, ApJ, 730, 141 Zhang, B., Zhang, B.-B., Virgili, F. J., et aI. 2009, ApJ, 703, 1696