KACGOON - elibrary.pacounties.org
131
Transcript of KACGOON - elibrary.pacounties.org
KACGOON VALLEY PLAN
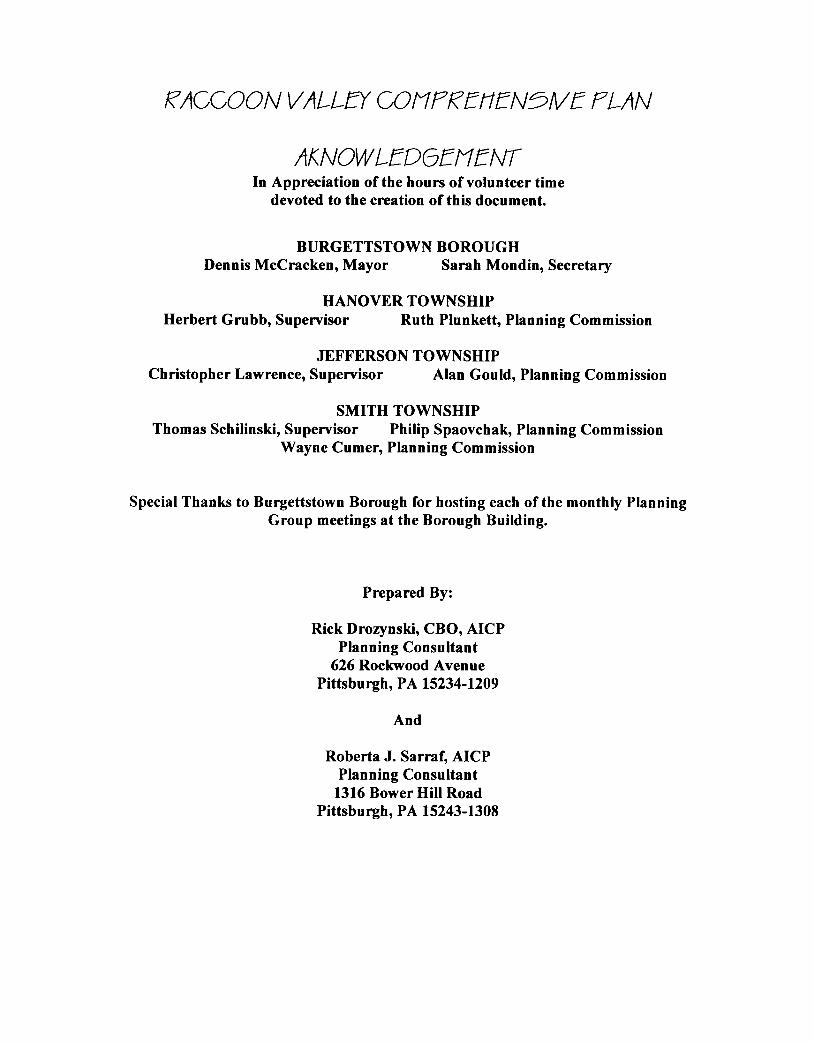
AKNOWLEDGEHENT In Appreciation of the hours of volunteer time
devoted to the creation of this document.
BURGETTSTOWN BOROUGH Dennis McCracken, Mayor Sarah Mondin, Secretary
HANOVER TOWNSHIP Herbert Grubb, Supervisor Ruth Plunkett, Planning Commission
JEFFERSON TOWNSHIP Christopher Lawrence, Supervisor Alan Gould, Planning Commission
SMITH TOWNSHIP
Wayne Cumer, Planning Commission Thomas Schilinski, Supervisor Philip Spaovchak, Planning Commission
Special Thanks to Burgettstown Borough for hosting each of the monthly Planning Group meetings at the Borough Building.
Prepared By:
Rick Drozynski, CBO, AICP Planning Consultant
626 Rockwood Avenue Pittsburgh, PA 15234-1209
And
Roberta J. Sarraf, AICP Planning Consultant 1316 Bower Hill Road
Pittsburgh, PA 15243-1308
I I I I 'I I I I I I I I I I I I I I I
I
RACCOON VALLEY COMPREtTN5IVE PLAN
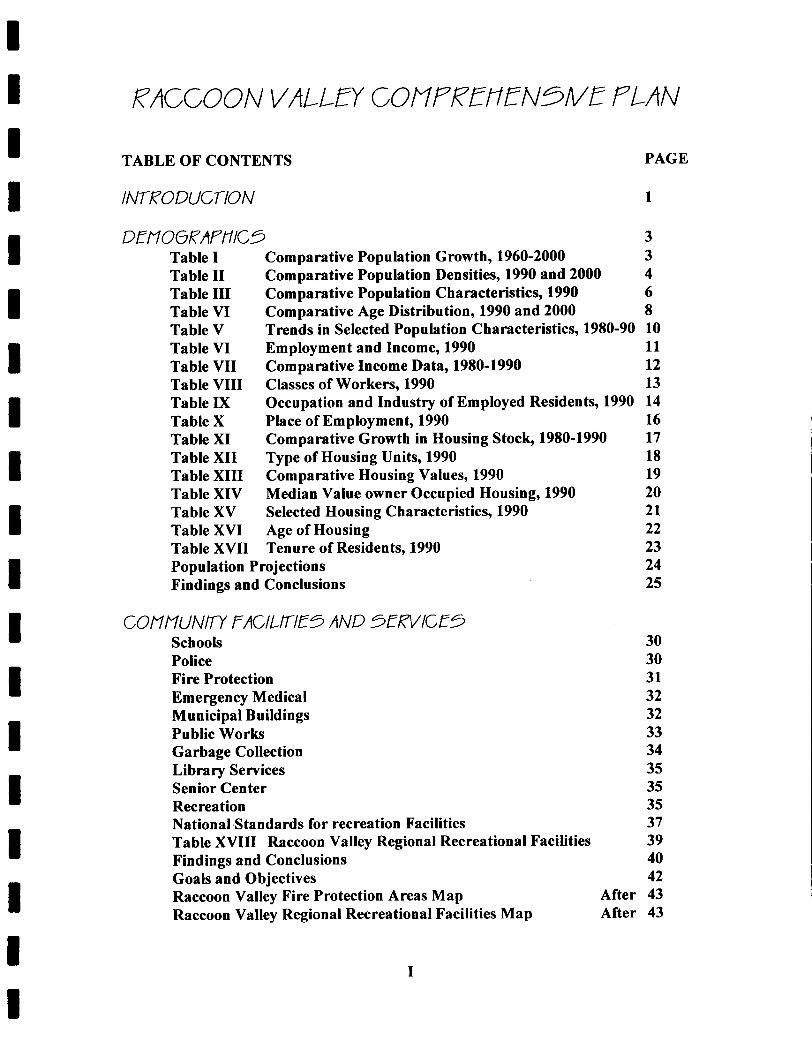
TABLE OF CONTENTS PAGE
INT#?ODUCl-IO N 1
DEMOGKAPHIC5 3 Table I Table I1 Table I11 Table VI Table V Table VI Table VI1 Table VI11 Table IX Table X Table XI Table XI1 Table XI11 Table XIV Table XV Table XVI Table XVII
Com pa rative Population Growth, 1960-2000 Comparative Population Densities, 1990 and 2000
3 4
Comparative Population Characteristics, 1990 6 Comparative Age Distribution, 1990 and 2000 8 Trends in Selected Population Characteristics, 1980-90 10 Employment and Income, 1990 11 Comparative Income Data, 1980-1990 12 Classes of Workers, 1990 13 Occupation and Industry of Employed Residents, 1990 14 Place-of Employment, 1990 Comparative Growth in Housing Stock, 1980-1990 Type of Housing Units, 1990 Comparative Housing Values, 1990 Median Value owner Occupied Housing, 1990 Selected Housing Characteristics, 1990 Age of Housing Tenure of Residents, 1990
Population Projections Findings and Conclusions
COMMUNtN FACILlTl&5 AND 5 E W I C E 5 Sc h oo Is Police Fire Protection Emergency Medical Municipal Buildings Public Works Garbage Collection Library Services Senior Center Recreation National Standards for recreation Facilities Table XVIII Raccoon Valley Regional Recreational Facilities Findings and Conclusions Goals and Obiectives
16 17 18 19 20 21 22 23 24 25
30 30 31 32 32 33 34 35 35 35 37 39 40 42
Raccoon Valley Fire Protection Areas Map Raccoon Valley Regional Recreational Facilities Map
After 43 After 43
I
I I I I I I 1 I I I I 1 I I 1 I I I I
KACCOON VALLEY COHPK'EIiEN3VE PLAN
TABLE OF CONTENTS PAGE
FI5CAL ANALY5I5 Table XIX
Burgettstown Borough, Assessed Value Burgettstown Borough, Revenue Burgettstown Borough, Expenditures Table XX Burgettstown Borough,
Table XXI Burgettstown Borough,
Hanover Township, Assessed Value Hanover Township, Revenue Hanover Township, Expenditures Table XXII Hanover Township,
Table XXIII Hanover Township,
Jefferson Township, Assessed Value Jefferson Township, Revenue Jefferson Township, Expenditures Table XXIV Jefferson Township,
Table XXV Jefferson Township,
Smith Township, Assessed Value Smith Township, Revenue Smith Township, Expenditures Table XXVI Smith Township,
Table XXVII Smith Township,
Findings and Conclusions Goals and Objectives
1999 Tax Rates, Selected Washington County Communities
Annual Budget Revenues, 1990-1999
Annual Budget Revenues, 1990-1999
Annual Budget Expenditures, 1990-1999
Annual Budget Revenue, 1990-1999
Annual Budget, Revenue 1990-1999
Annual Budget Expenditures, 1990-1999
Annual Budget Revenue, 1990-1999
Annual Budget, Expenditures 1990-1999
44 46 46 47
48
49 50 50 51
52
53 55 55 56
57
58 59 59 60
61
62 63 64
-TF7AN5POflATlON Table XXVIII 2001-2004 Transportation Improvement Program 68
DUILDING PEK'HK ANALY5I5 Table XXIX Raccoon Valley Residential Building Permits 69 Table XXX Comparative Growth in Housing Stock 70
KACCOON VALLEY COHP/?Et7EN5/VE PLAN
I I
I I
I I
I I I I I
TABLE OF CONTENTS PAGE
iZXl5irlNG LAND U5E Existing Land Use Study Key 72 Burgettstown Borough 73 Table XXXI Existing Land Use Area, Burgettstown Borough 74 Hanover Township 74 Table XXXII Existing Land Use Area, Hanover Township Jefferson Township 75 Table XXXIII Existing Land Use Area, Jefferson Township Smith Township 75
74
75
Table XXXIV Existing Land Use Area, Smith Township 76 Findings And Conclusions 76 Existing Land Use Map After 76
EXI5irIN G 20 NIN G ORDINANCE Table XXXV Zoning District Comparison, Conservation Table XXXVIZon ing District Com pa rison, Agricu Itu ra I-
Table XXXVII Zoning District Comparison, Suburban Residential Table XXXVIII Zoning District Comparison, Urban Residential Table XXXIX Zoning District Comparison, Business/CommerciaI Table XXXX Zoning District Comparison, Industrial Findings And Conclusions Existing Zoning District Map After
Rural Residential
Cll-IZEN PAKTlCIPAirlO N Burgettstown Borough Survey Summary Burgettstown Borough Survey Results Hanover Township Survey Summary Hanover Township Survey Results Jefferson Township Survey and Community Meeting Summary Jefferson Township Survey Results Smith Township Survey Summary Smith Township survey Results
79
80 81 82 83 84 85 85
86 88 91 92 96 98 99 100
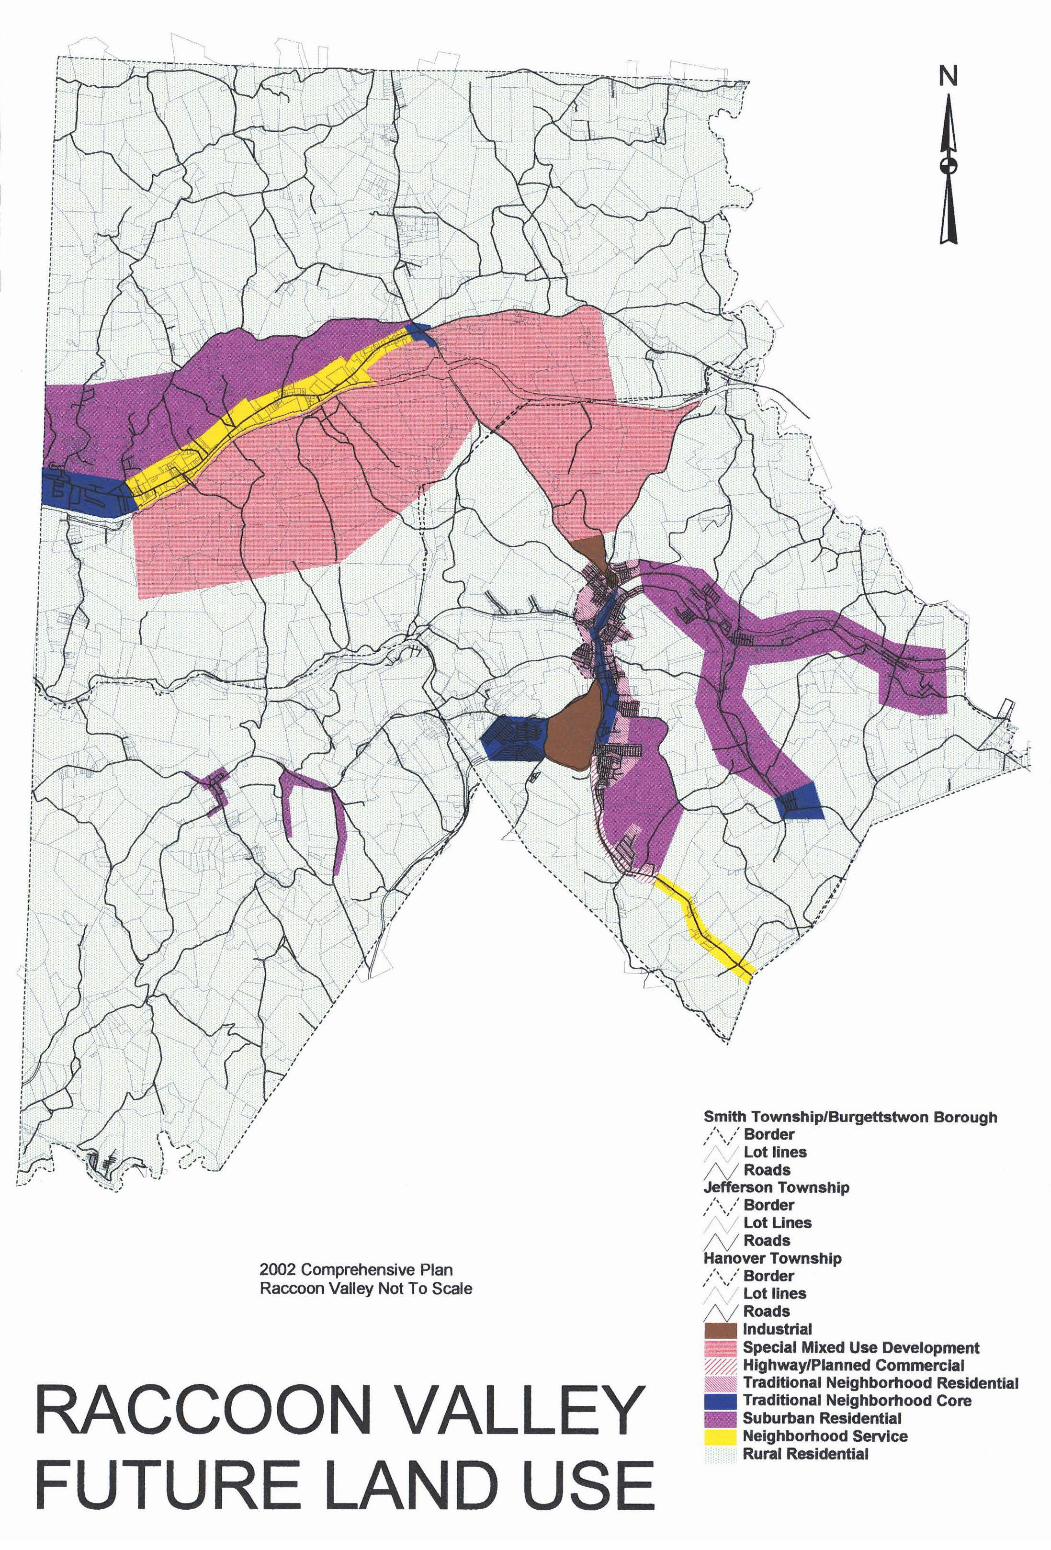
FiJTUKE LAND U 5 E Hanover Township 103 Burgettstown Borough 105 Smith Township 107 Jefferson Township 107 Future Zoning 108 Future Land Use Categories 109
111 A Multi-Municipal Approach To Planning And Zoning
I I
KACCOON VALLEY COt'IPK&tl&N5/V& PLAN
TABLE OF CONTENTS FWUKi5 LAND U5E (Continued)
PA MPC Terminology Findings and Conclusions, Future land Use Goals And Objectives Future Land Use Map
IV
PAGE
112 116 117
After 118
I I I I I I I I I I I I I I I I I I I
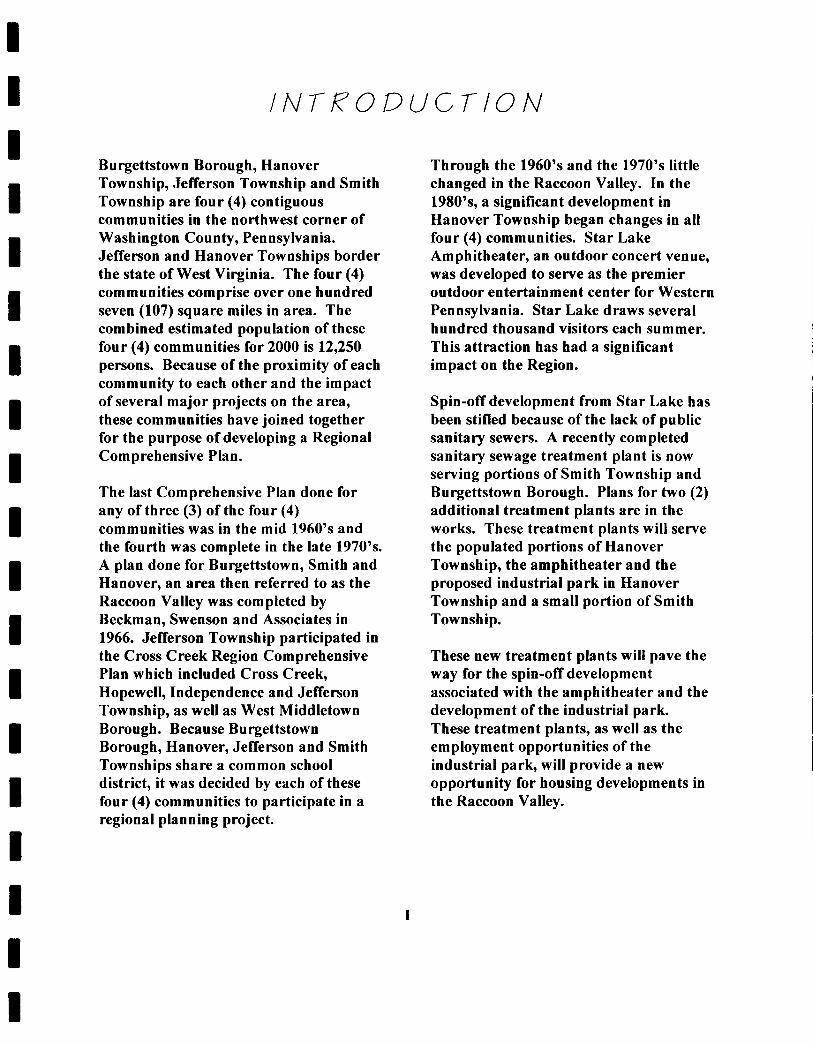
Burgettstown Borough, Hanover Township, Jefferson Township and Smith Township are four (4) contiguous communities in the northwest corner of Washington County, Pennsylvania. Jefferson and Hanover Townships border the state of West Virginia. The four (4) communities comprise over one hundred seven (107) square miles in area. The combined estimated population of these four (4) communities for 2000 is 12,250 persons. Because of the proximity of each community to each other and the impact of several major projects on the area, these communities have joined together for the purpose of developing a Regional Comprehensive Plan.
The last Comprehensive Plan done for any of three (3) of the four (4) communities was in the mid 1960’s and the fourth was complete in the late 1970’s. A plan done for Burgettstown, Smith and Hanover, an area then referred to as the Raccoon Valley was completed by Beckman, Swenson and Associates in 1966. Jefferson Township participated in the Cross Creek Region Comprehensive Plan which included Cross Creek, Hopewell, Independence and Jefferson Township, as well as West Middletown Borough. Because Burgettstown Borough, Hanover, Jefferson and Smith Townships share a common school district, it was decided by each of these four (4) communities to participate in a regional planning project.
1
Through the 1960’s and the 1970’s little changed in the Raccoon Valley. In the 1980’s, a significant development in Hanover Township began changes in all four (4) communities. Star Lake Amphitheater, an outdoor concert venue, was developed to serve as the premier outdoor entertainment center for Western Pennsylvania. Star Lake draws several hundred thousand visitors each summer. This attraction has had a significant impact on the Region.
Spin-off development from Star Lake has been stifled because of the lack of public sanitary sewers. A recently completed sanitary sewage treatment plant is now serving portions of Smith Township and Burgettstown Borough. Plans for two (2) additional treatment plants are in the works. These treatment plants will serve the populated portions of Hanover Township, the amphitheater and the proposed industrial park in Hanover Township and a small portion of Smith Township.
These new treatment plants will pave the way for the spin-off development associated with the amphitheater and the development of the industrial park. These treatment plants, as well as the employment opportunities of the industrial park, will provide a new opportunity for housing developments in the Raccoon Valley.
I I I I I B I B I ~I I ~I I I ‘I I I
The Washington County Redevelopment Authority has acquired property for, and is proposing, a one hundred and forty (140) acre industrial park in Hanover Township. The one hundred and forty (140) acre proposal is the first phase of an industrial park proposed to cover approximately 1,200 acres of Hanover Township. This industrial park will have access to Route 22, a divided four-lane highway extending East to West through the Valley.
The Pennsylvania Turnpike Commission’s Southern Beltway project will also impact the development of the Raccoon Valley Region. The Findlay Connector portion of the project will pass North to South only a few miles from the Raccoon Valley. The Connector will join Route 60 at the Pittsburgh International Airport with Route 22, just east of the Region. This Connector will provide direct access from Pittsburgh International Airport to the proposed industrial park and the numerous acres of undeveloped land in the Region. The continuation of the Beltway from Route 22 South will open this area to the southwest quadrant of the Pittsburgh metropolitan region.
The Borough of Burgettstown and the villages of Langloth, Atlasburg and Slovan in Smith Township are currently the population centers of the Region. Burgettstown is almost fully developed and little opportunity exists to develop in the Borough without taking a redevelopment approach. Burgettstown, like many other communities that once served as the commercial hub for employees of the mining and agricultural industries, has lost all but a few local businesses.
2
Smith Township remains fairly rural but has several points of access to major roads and with the construction of public sewers can expect development in selected parts of the community.
Jefferson Township remains rural and does not have the ease of access or potential public sewers that Smith Township will have. Jefferson Township can expect to remain rural in character.
The Pan Handle Trail is a rails-to-trails project that will extend from Walkers Mill in Collier Township, Allegheny County, PA through the Raccoon Valley to Weirton, West Virginia. The Allegheny County portion of the trail is complete. Through the Raccoon Valley property acquisition is complete and funding is in place for trail development.
The communities of the Raccoon Valley are similar in many other ways but each community is unique in its current development and future opportunities. The communities of the Raccoon Valley have recognized the need to think, plan, act and react regionally, but are strong in their conviction to remain communities with individual characteristics and identities.
“Action without vision is merely passing time. Vision without action
is merely a dream Action with vision creates the future. ’’
Author Unknown
I I
I I I
DEMOGRAPHICS
I I I I I I I I I I ~I
I I I I
~I I
TABLE I RACCOON VALLEY REGION
COMPARATIVE POPULATION GROWTH, 1960-2000
BURGETTSTO WN BOROUGH
HANOVER
JEFFERSON TOWNSHIP
SMITH
MT. PLEASANT
CECIL TOWNSHIP
PETERS +3,546 +2,432 +1,363 +3,099 TOWNSHIP
217,271 210,876 217,074 204,584 202,897
(+SO.O%) (+22.8?'0) (+1O.4?'0) (+17,7y0)
WASHINGTON -6,395 +6,198 -12,490 -1,687 COUNTY (-2.9 YO) (+2.9%) (-5.8%) (-< 1 O h )
SOURCE: U.S. Department of Commerce, Bureau of Census, 1960-1990 Censuses of Population and U.S. Census Bureau, Census 2000 web site
3
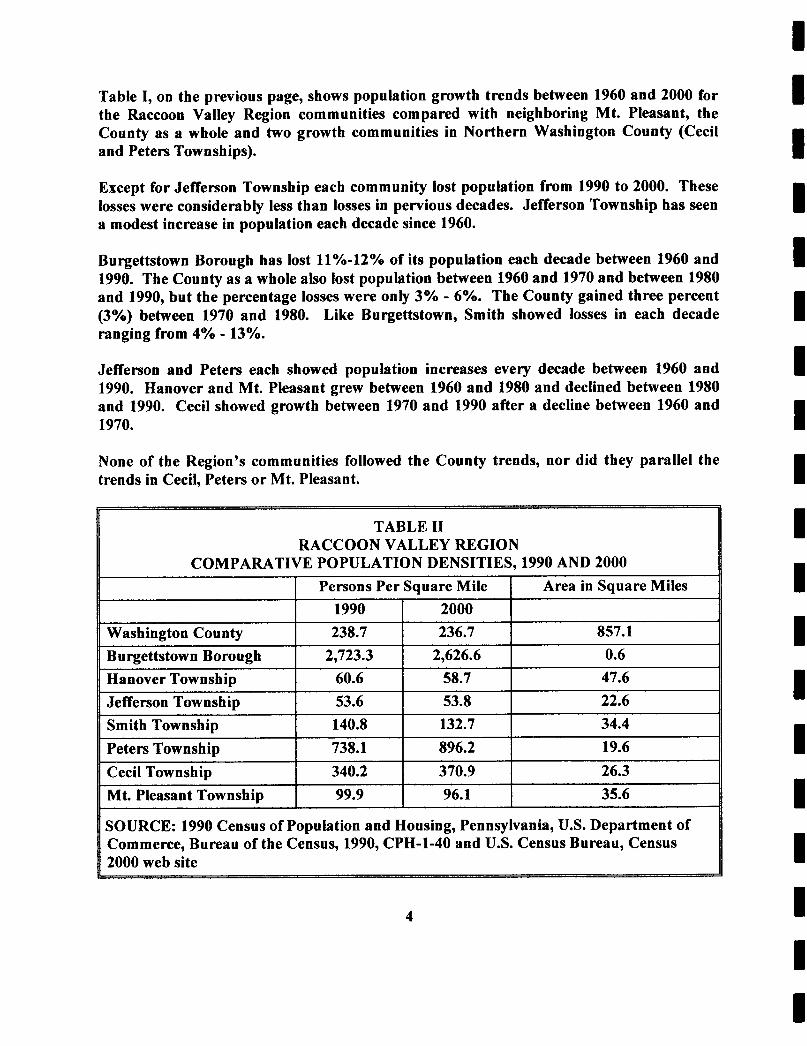
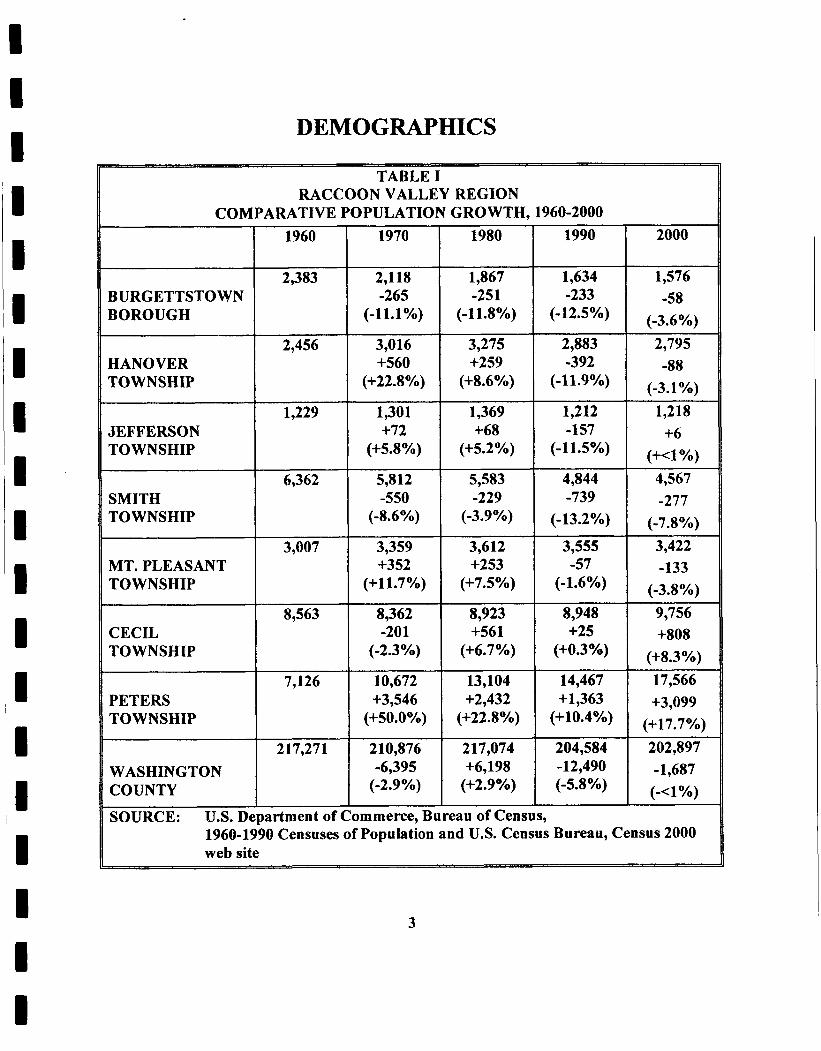
Table I, on the previous page, shows population growth trends between 1960 and 2000 for the Raccoon Valley Region communities compared with neighboring Mt. Pleasant, the County as a whole and two growth communities in Northern Washington County (Cecil and Peters Townships).
Except for Jefferson Township each community lost population from 1990 to 2000. These losses were considerably less than losses in pervious decades. Jefferson Township has seen a modest increase in population each decade since 1960.
Burgettstown Borough has lost 11%-12% of its population each decade between 1960 and 1990. The County as a whole also lost population between 1960 and 1970 and between 1980 and 1990, but the percentage losses were only 3% - 6%. The County gained three percent (3%) between 1970 and 1980. Like Burgettstown, Smith showed losses in each decade ranging from 4% - 13%.
Jefferson and Peters each showed population increases every decade between 1960 and 1990. Hanover and Mt. Pleasant grew between 1960 and 1980 and declined between 1980 and 1990. Cecil showed growth between 1970 and 1990 after a decline between 1960 and 1970.
None of the Region’s communities followed the County trends, nor did they parallel the trends in Cecil, Peters or Mt. Pleasant.
RACCOON VALLEY REGION
I I I I I I I I I I I I I I 1 I I I I
4
I I I
1 I I I
I II I I I I I
Table 11, on the previous page, shows comparative population densities in 1990 and 2000 for the Raccoon Valley Region communities, neighboring Mt. Pleasant Township, the growth communities of Cecil and Peters and Washington County as a whole.
In 1990 suburban Peters Township has tbree (3) times the density of the County as a whole. Growing Cecil Township has 1.4 times the density of the County as a whole.
The Raccoon Valley Townships and Mt. Pleasant are less dense than the County as a whole in 1990. Hanover and Jefferson are the least dense (20% - 25% of the County density). Mt. Pleasant is about 40% of the County density and Smith Township is about 60% of the County density. Burgettstown Borough has a very small land area and is fully developed. Burgettstown’s density is 115 times more dense than the County as a whole.
In 2000 Peters, Cecil and Jefferson Townships became more dense while the other communities in Table I1 became less dense. While Peters’ and Cecil’s density increased by 17.7% and 8.3%, respectively, Jefferson’s density only increased by 0.4%. Jefferson Township continues to be the least densely populated of any community in the Region.
5
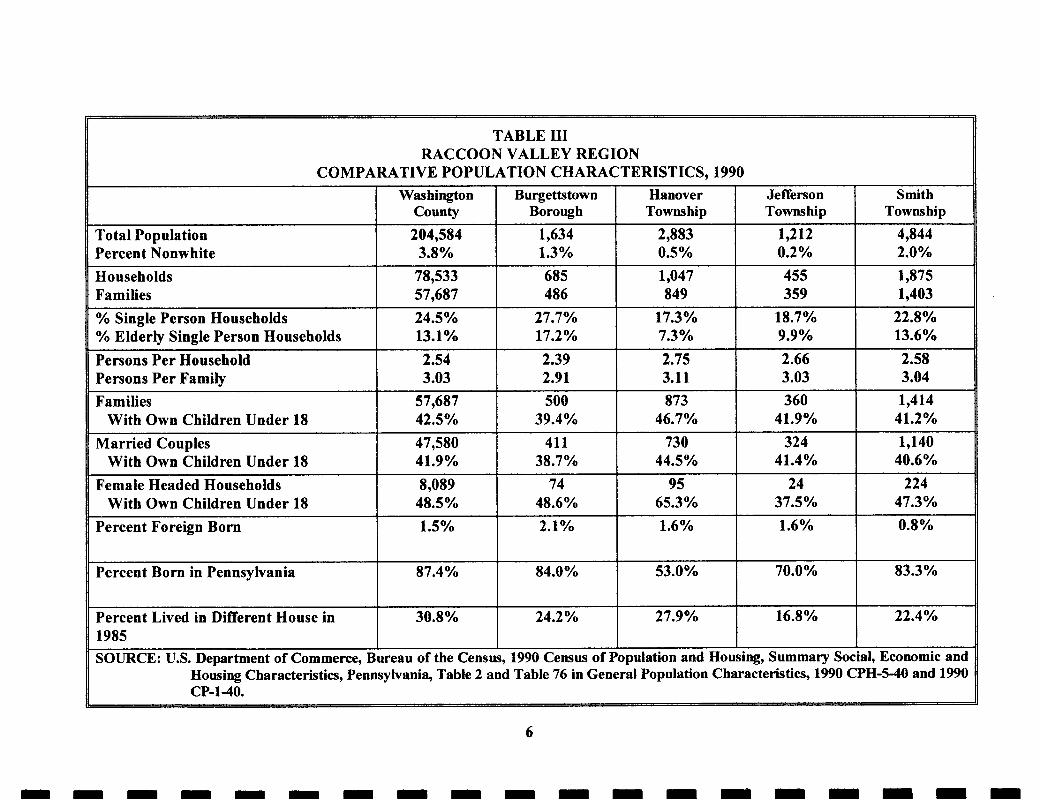
TABLE I11 RACCOON VALLEY REGION
COMPARATIVE POPULATION CHARACTERISTICS, 1990 Burgettstown
Borough Hanover Jefferson Smith Township Towns hip Township
Total Population Percent Nonwhite Households Families % Single Person Households % Elderly Single Person Households
Married Couples 47,580 With Own Children Under 18 1 41.9%
204,584 3.8%
78,533 57,687 24.5% 13.1%
Female Headed Households 8,089 48.5%
Percent Foreign Born 1.5% With Own Children Under 18
685 486
27.7% 17.2%
2.39 2.91
Percent Born in Pennsylvania 87.4%
1,047 455 1,875 849 359 1,403
17.3% 18.7% 22.8% 7.3% 9.9% 13.6% 2.75 2.66 2.58 3.11 3.03 3.04
Percent Lived in Different House in 1985
30.8%
Persons Per Household Persons Per Family Families
With Own Children Under 18
2.54 3.03
57,687 42.5%
4,844 1.3%
500 39.4%
411 38.7%
873 360 1,414 46.7% 41.9% 41.2%
730 324 1,140 44.5% 41.4% 40.6%
2.1% 1.6% 1.6% 0.8%
84.0% 53.0% 70.0% 83.3%
24.2% 27.9% 16.8% 22.4%
I I I I
SOURCE: U.S. Department of Commerce, Bureau of the Census, 1990 Census of Population and Housing, Summary Social, Economic and Housing Characteristics, Pennsylvania, Table 2 and Table 76 in General Population Characteristics, 1990 CPH-5-40 and 1990 CP-1-40.
6
I I I I I 1 I 1 I I I I I I 1
1 I 1
11
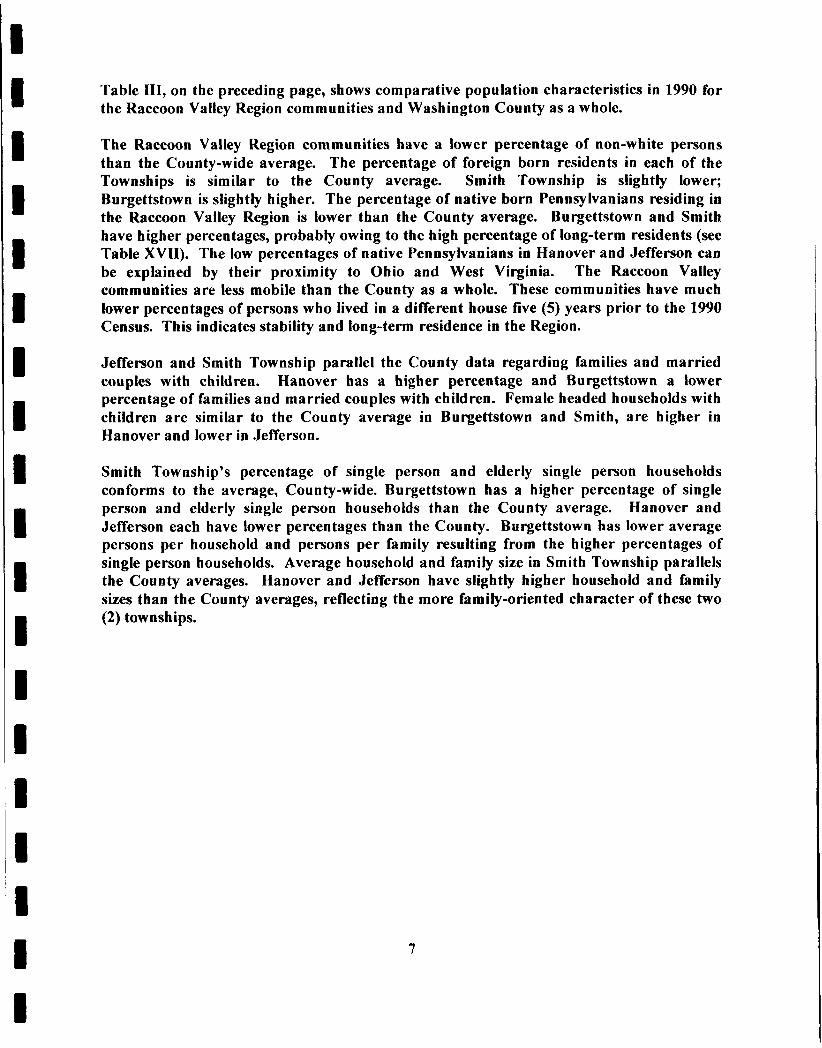
Table 111, on the preceding page, shows comparative population characteristics in 1990 for the Raccoon Valley Region communities and Washington County as a whole.
The Raccoon Valley Region communities have a lower percentage of non-white persons than the County-wide average. The percentage of foreign born residents in each of the Townships is similar to the County average. Smith Township is slightly lower; Burgettstown is slightty higher. The percentage of native born Pennsylvanians residing in the Raccoon Valley Region is lower than the County average. Burgettstown and Smith have higher percentages, probably owing to the high percentage of long-term residents (see Table XVII). The low percentages of native Pennsylvanians in Hanover and Jefferson can be explained by their proximity to Ohio and West Virginia. The Raccoon Valley communities are less mobile than the County as a whole. These communities have much lower percentages of persons who lived in a different house five (5 ) years prior to the 1990 Census. This indicates stability and long-term residence in the Region.
Jefferson and Smith Township parallel the County data regarding families and married couples with children. Hanover has a higher percentage and Burgettstown a lower percentage of families and married couples with children. Female headed households with children are similar to the County average in Burgettstown and Smith, are higher in Hanover and lower in Jefferson.
Smith Township’s percentage of single person and elderly single person households conforms to the average, County-wide. Burgettstown has a higher percentage of single person and elderly single person households than the County average. Hanover and Jefferson each have lower percentages than the County. Burgettstown has lower average persons per household and persons per family resulting from the higher percentages of single person households. Average household and family size in Smith Township parallels the County averages. Hanover and Jefferson have slightly higher household and family sizes than the County averages, reflecting the more family-oriented character of these two (2) townships.
7
’1
I TABLE IV
RACCOON VALLEY REGION COMPARATIVE AGE DISTRIBUTION, 1990 AND 2000
~~
Total
Under 5
web site. !I
B u rgettstown Ha n ove r Jefferson Smith Washington Borough Township Township Township County
1990 2000 1990 2000 1990 2000 1990 2000 1990 2000
1,634 1,576 2,883 2,795 1,212 1,218 4,844 4,567 204,584 202,897
4.8% 5.8% 6.2% 5.4% 5.0% 5.5% 5.9% 5.8% 5.8% 5.5%
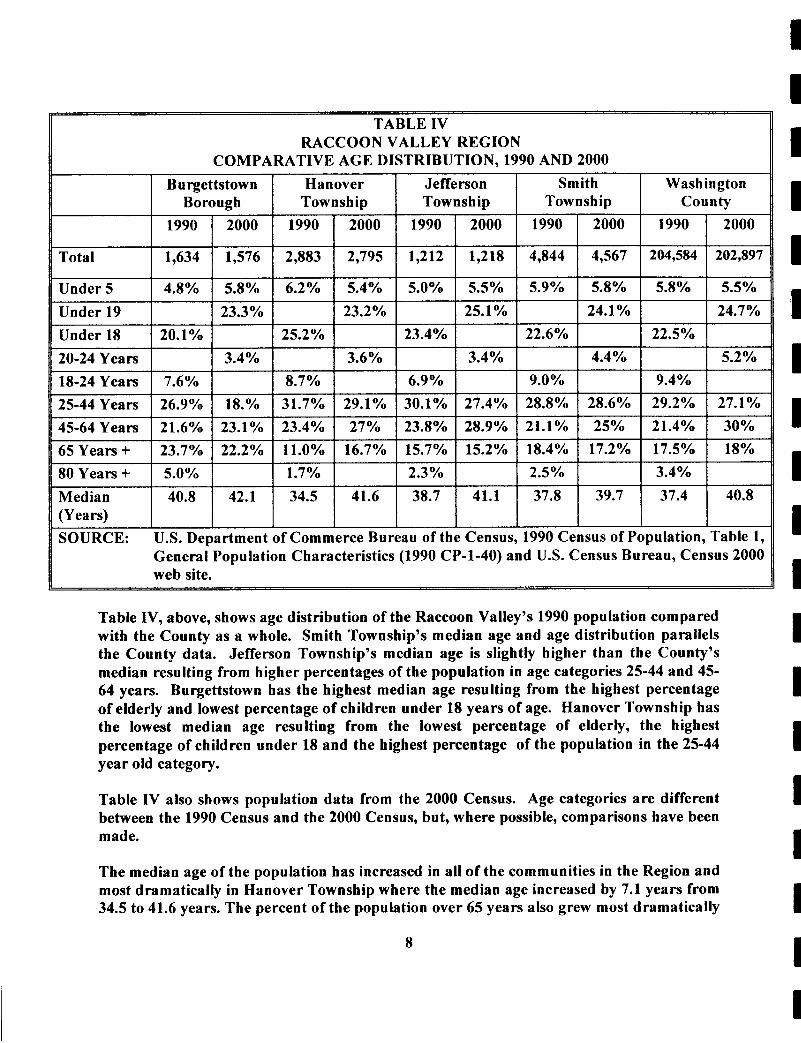
Table IV, above, shows age distribution of the Raccoon Valley’s 1990 population compared with the County as a whole. Smith Township’s median age and age distribution parallels the County data. Jefferson Township’s median age is slightly higher than the County’s median resulting from higher percentages of the population in age categories 25-44 and 45- 64 years. Burgettstown has the highest median age resulting from the highest percentage of elderly and lowest percentage of children under 18 years of age. Hanover Township has the lowest median age resulting from the lowest percentage of elderly, the highest percentage of children under 18 and the highest percentage of the population in the 25-44 year old category.
Table IV also shows population data from the 2000 Census. Age categories are different between the 1990 Census and the 2000 Census, but, where possible, comparisons have been made.
The median age of the population has increased in all of the communities in the Region and most dramatically in Hanover Township where the median age increased by 7.1 years from 34.5 to 41.6 years. The percent of the population over 65 years also grew most dramatically
8
I I 1 I I I I I I 1 I I I I I I
1 I I I 1 1 I I 1 I I I I
~' ~1 I I I I
in Hanover Township. This category increased from 11% in 1990 to 16.7% in 2000. Each of the other communities in the Region saw a decline in the percent of population over 65 years.
The 25-44 year age category has traditionally been the home buying and family starting age category. The percent of the population in this age category has decreased between 1990 and 2000 in all of the communities in the region and in the County. The most dramatic decrease in this category was in Burgettstown where it dropped from 26.9% in 1990 to 189% in 2000.
Table V, on the following page, shows trends in selected population characteristics in the Raccoon Valley communities between 1980 and 1990. The percentage of high school graduates increased substantially in the Townships, but only minimally in the Borough. The percentage of college graduates declined slightly in the Borough and increased in the Townships. Unemployment remained about the same in the Borough, but decreased in Hanover and Jefferson Townships between 1980 and 1990. Unemployment increased in Smith Township by approximately the same ratio as did the percent of families below the poverty level between 1980 and 1990. In Hanover and Burgettstown, percentages of families below poverty increased while the percentages decreased in Jefferson Township between 1980 and 1990.
9
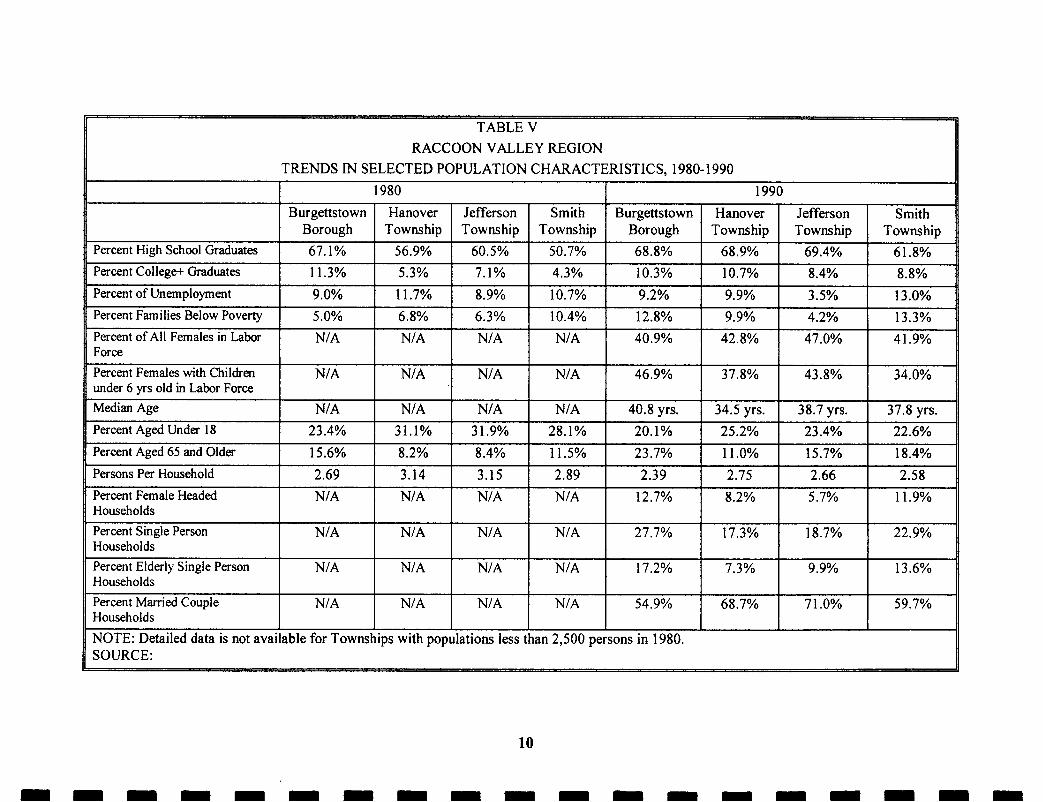
RACCOON VALLEY REGION TRENDS IN SELECTED POPULATION CHARACTERISTICS, 1980-1 990
Percent High School Graduates Percent College Graduates Percent of Unemployment Percent Families Below Poverty Percent of All Females in Labor Force Percent Females with Children under 6 y s old in Labor Force Median Age Percent Aged Under 18
Percent Aged 65 and Older Persons Per Household Percent Female Headed Households Percent Single Person Households Percent Elderly Single Person Households Percent Married Couple Households NOTE: Detailed data is not avaj SOURCE:
Burgettstown Hanover Jefferson Smith Burgettstown Borough Township Township Township Borough 67.1% 56.9% 60.5% 50.7% 68.8% 11.3% 5.3% 7.1% 4.3% 10.3% 9.0% 1 1.7% 8.9% 10.7% 9.2% 5.0% 6.8% 6.3% 10.4% 12.8% N/A N/A N/A N/A 40.9%
N/A N/A NIA N/A 46.9%
N/A N/A N/A N/A 40.8 yrs. 23.4% 31.1% 3 1.9% 28.1% 20.1% 15.6% 8.2% 8.4% 11.5% 23.7% 2.69 3.14 3.15 2.89 2.39 N/A I N/A I N/A I N/A I 12.7%
N/A N/A N/A N/A 27.7%
N/A NIA N/A NIA 17.2%
N/A N/A N/A N/A 54.9% I I I I
able for Townships with populations less than 2,500 persons in 1980.
Hanover Jefferson Smith Township Township Township
68.9% 69.4% 61.8% 10.7% 8.4% 8.8% 9.9% 3.5% 13.0% 9.9% 4.2% 13.3%
42.8% 47.0% 41.9%
37.8% 43.8% 34.0%
34.5 yrs. 38.7 yrs. 37.8 yrs. 25.2% 23.4% 22.6% 11.0% 15.7% 18.4% 2.75 2.66 2.58 8.2% I 5.7% I 11.9%
17.3% I 18.7% I 22.9%
7.3% I 9.9% I 13.6%
68.7% I 71.0% I 59.7%
1 1 1 I I I 1 I 1 I I I I I I I i 1 m
TABLE VI RACCOON VALLEY REGION
EMPLOYMENT AND INCOME, 1990
Persons 16+ Years Old Percent in Labor Force Percent Females in Labor Force Percent with Children under 6
Percent Unemployment in Labor Force
Journey to Work: Carpool Public Transp.
Per Capita Income Median Household Income Median Family Income
Persons Below Poverty Level
Families Below Poverty Level Percent of All Persons
Percent of All Families
Bu rgettstown Borough
1,349
40.9%
46.9% 9.2%
51.1%
11.6% 1.8%
$12,097 $22,333 $29,559
230 14.1%
64 12.8%
Ha n over Jefferson Smith Township Township Township
2,296 968 3,877 56.1 O h 56.8% 53.8 O/O
42.8% 47.0% 41.9%
37.8% 43.8% 34.0% 9.9% 3.5% 13.0%
7.7% 12.2% 15.2% - - 0.6%
$12,2 12 $13,555 $10,37 1 $30,268 $2 8,6 8 7 $2 1,862 $33,618 $34,125 $25,588
320 84 749 11.0% 7.0% 15.5%
86 15 188 9.9% 4.2% 13.3%
SOURCE: U.S. Department of Commerce, Bureau of the Census, 1990 Census of Population and Housing Summary Social, Economic and Housing Characteristics, Tables 5 and 9 (1990 CPH-5-40).
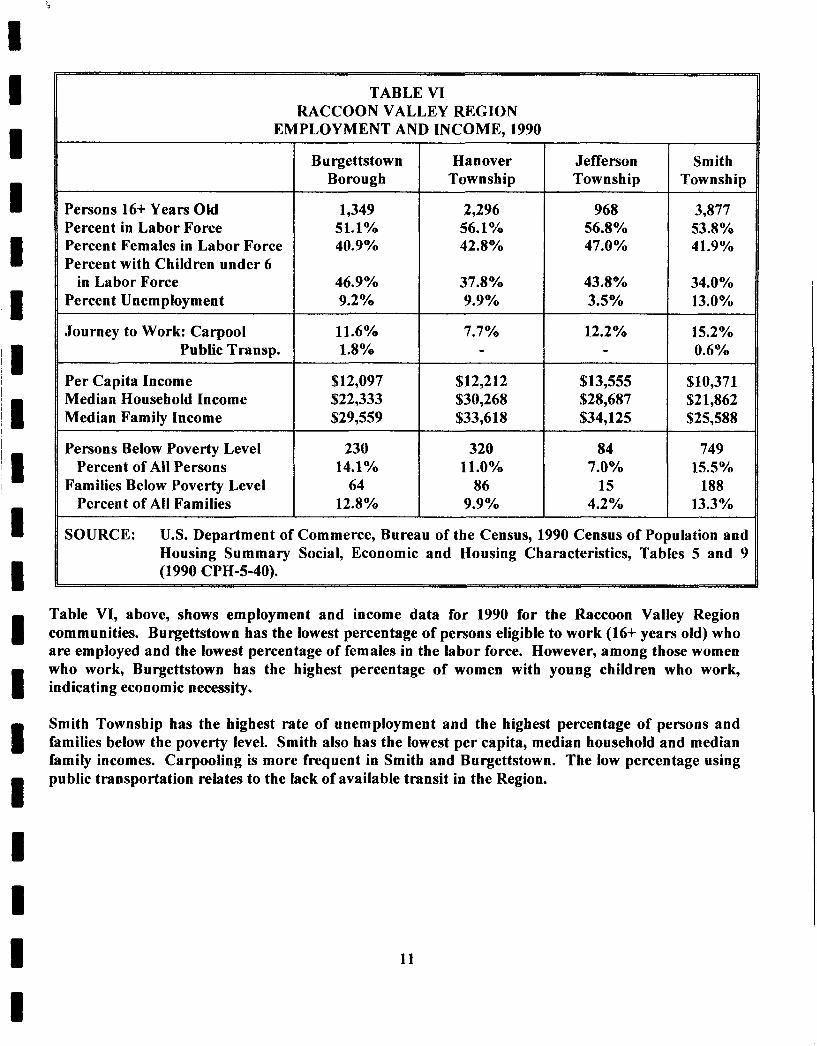
Table VI, above, shows employment and income data for 1990 for the Raccoon Valley Region communities. Burgettstown has the lowest percentage of persons eligible to work (16+ years old) who are employed and the lowest percentage of females in the labor force. However, among those women who work, Burgettstown has the highest percentage of women with young children who work, indicating economic necessity.
Smith Township has the highest rate of unemployment and the highest percentage of persons and families below the poverty level. Smith also has the lowest per capita, median household and median family incomes. Carpooling is more frequent in Smith and Burgettstown. The low percentage using public transportation relates to the lack of available transit in the Region.
11
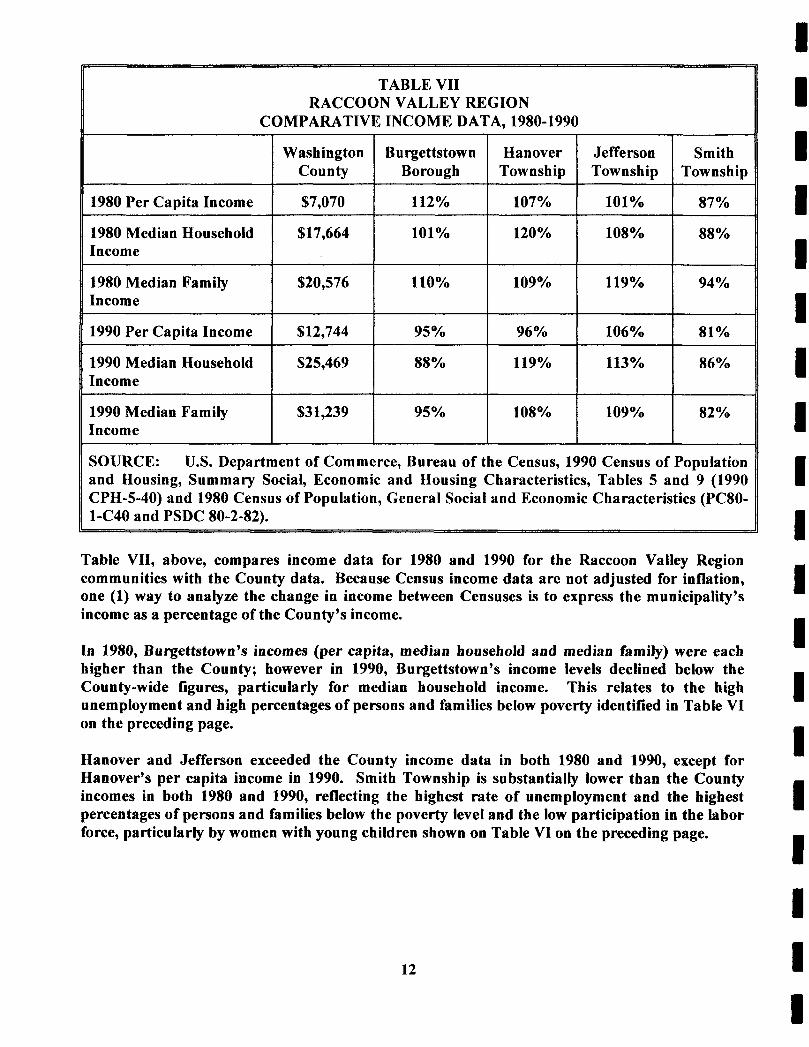
TABLE VI1 RACCOON VALLEY REGION I COMPARATIVE INCOME DATA, 1980-1990
1980 Per Capita Income
1980 Median Household Income
1980 Median Family Income
1990 Per Capita Income
1990 Median Household Income
1990 Median Family Income
Washington County
$7,070
$17,664
$20,576
$12,744
$25,469
$3 1,239
B u rgettstow n Hanover Jefferson Borough Township Township
112% 107% 101%
101% 120% 108%
110% 109% 119%
95% I 96% I 106%
88% 119% 113%
9 5 ‘/o 108% 109%
Smith Township
87%
88%
94%
81%
86%
82 o/o
SOURCE: U.S. Department of Commerce, Bureau of the Census, 1990 Census of Population and Housing, Summary Social, Economic and Housing Characteristics, Tables 5 and 9 (1990 CPH-5-40) and 1980 Census of Population, General Social and Economic Characteristics (PC80- 1-C40 and PSDC 80-2-82).
Table VII, above, compares income data for 1980 and 1990 for the Raccoon Valley Region communities with the County data. Because Census income data are not adjusted for inflation, one (1) way to analyze the change in income between Censuses is to express the municipality’s income as a percentage of the County’s income.
In 1980, Burgettstown’s incomes (per capita, median household and median family) were each higher than the County; however in 1990, Burgettstown’s income levels declined below the County-wide figures, particularly for median household income. This relates to the high unemployment and high percentages of persons and families below poverty identified in Table VI on the preceding page.
Hanover and Jefferson exceeded the County income data in both 1980 and 1990, except for Hanover’s per capita income in 1990. Smith Township is substantially lower than the County incomes in both 1980 and 1990, reflecting the highest rate of unemployment and the highest percentages of persons and families below the poverty level and the low participation in the labor force, particularly by women with young children shown on Table VI on the preceding page.
12
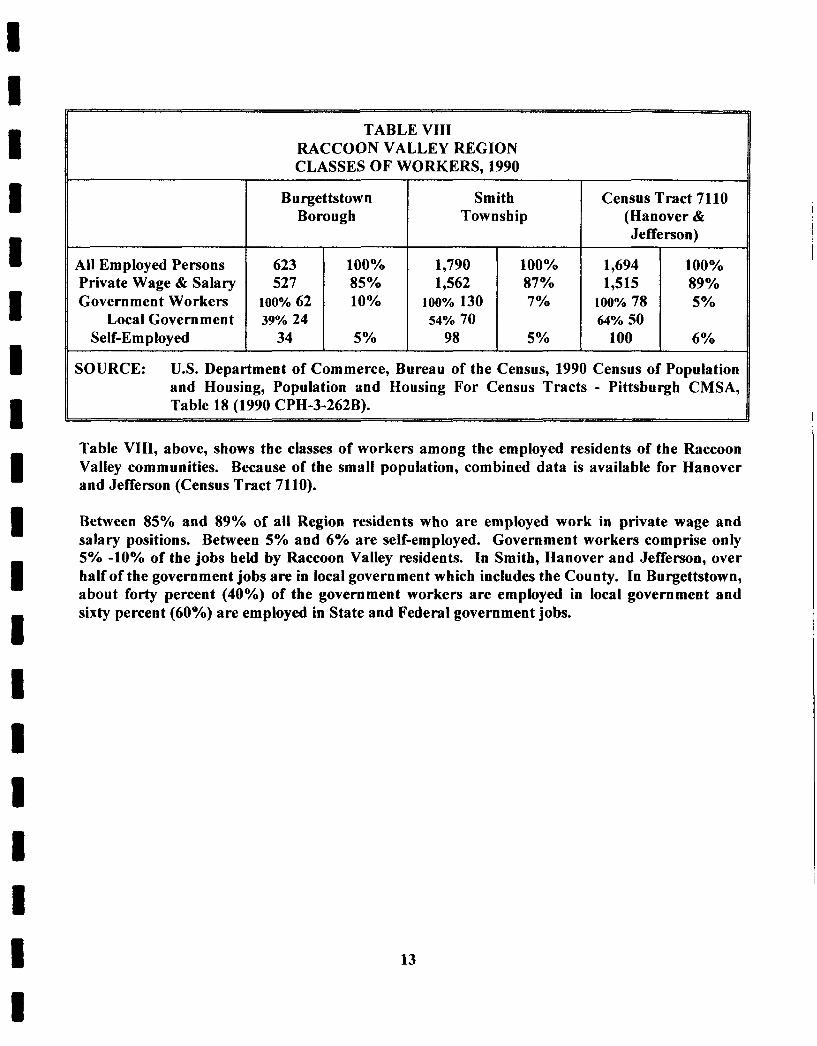
TABLE VI11 RACCOON VALLEY REGION CLASSES OF WORKERS, 1990
I I I Burgettstown
Borough
All Employed Persons 623 100% Private Wage & Salary 527 85 Yo Government Workers 100% 62 10%
Local Government 39% 24 Self- Em p loyed 34 5 y o
Smith Township
1,790 looo/o 1,562 87%
100% 130 7% 54% 70
98 5 y o
Census Tract 7110 (Hanover & Jefferson)
1,694 1,515
100% 78 64% 50
100
100% 89% 5 y o
6%
SOURCE: U.S. Department of Commerce, Bureau of the Census, 1990 Census of Population and Housing, Population and Housing For Census Tracts - Pittsburgh CMSA, Table 18 (1990 CPH-3-262B).
Table VIII, above, shows the classes of workers among the employed residents of the Raccoon Valley communities. Because of the small population, combined data is available for Hanover and Jefferson (Census Tract 7110).
Between 85% and 89% of all Region residents who are employed work in private wage and salary positions. Between 5% and 6% are self-employed. Government workers comprise only 5% -10% of the jobs held by Raccoon Valley residents. In Smith, Hanover and Jefferson, over half of the government jobs are in local government which includes the County. In Burgettstown, about forty percent (40%) of the government workers are employed in local government and sixty percent (60%) are employed in State and Federal government jobs.
13
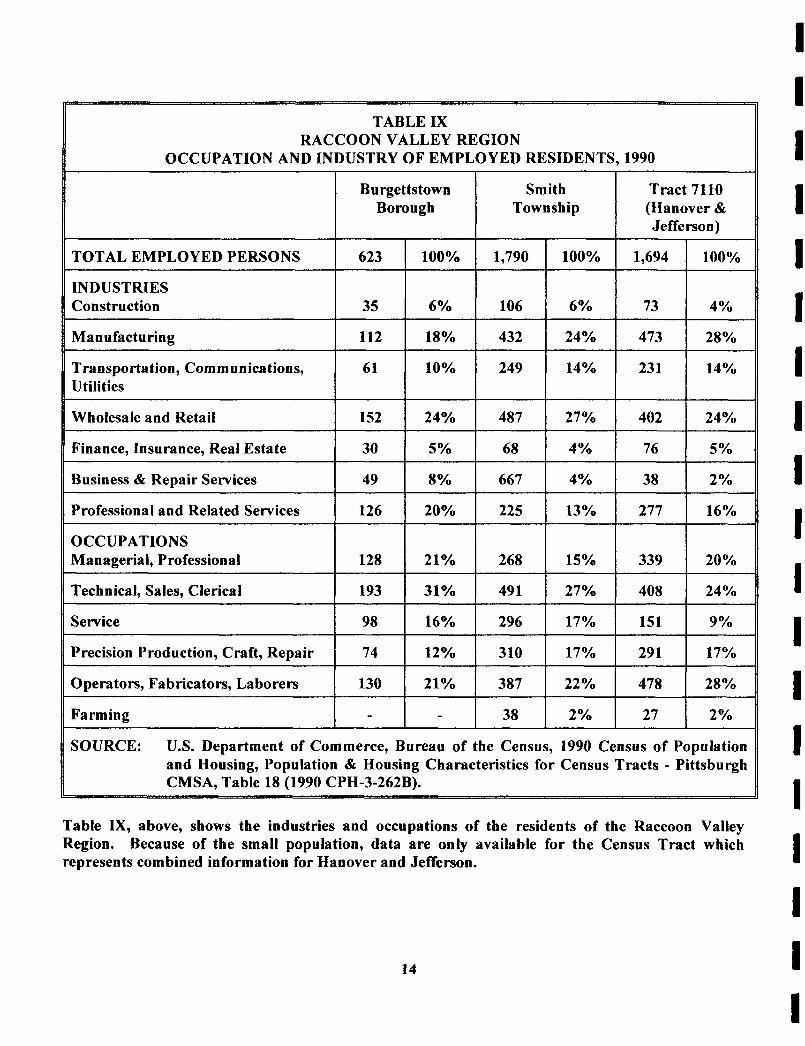
TABLE IX RACCOON VALLEY REGION
OCCUPATION AND INDUSTRY OF EMPLOYED RESIDENTS, 1990 I I I
SOURCE: U.S. Department of Commerce, Bureau of the Census, 1990 Census of Population and Housing, Population & Housing Characteristics for Census Tracts - Pittsburgh CMSA, Table 18 (1990 CPH-3-262B).
Table IX, above, shows the industries and occupations of the residents of the Raccoon Valley Region. Because of the small population, data are only available for the Census Tract which represents combined information for Hanover and Jefferson.
14
I I I 1 1 I I I 1 I I I I I I I I I I
The highest percentage of residents in Hanover and Jefferson Townships are employed in manufacturing. The highest percentage of Burgettstown and Smith Township’s residents are employed in wholesale and retail trade. The second (20d) highest percentage of Borough residents are employed in professional and related services. The third (3rd) highest percentage of Borough residents are employed in manufacturing. In Smith Township, the second (2”d) highest percentage of residents are employed in manufacturing, followed by professional and related services.
Transportation, communications and utilities employs fourteen percent (14%) of the residents of the three Townships. Each remaining category employs less than ten percent (10%) of each community’s residents.
Within the various industries, the types of occupations are also shown on Table IX on the preceding page. In Hanover and Jefferson, where most residents are employed in manufacturing, the occupation category “operators, fabricators and laborers” accounts for the highest percentage of employment. Most Smith Township residents are employed in wholesale and retail trade and in manufacturing. The predominant occupations among Smith Township residents are “technical, sales and clerical” and “operators, fabricators and laborers”.
In Burgettstown, where wholesale and retail trade employs the most residents, “technical, sales and clerical” is the predominant occupation. Burgettstown’s second (20d) highest employment category is professional and related services which correlates with the high percentage of “managerial and professional” occupations. The third (3rd) highest employer of Borough residents is manufacturing which relates to the similar percentage employed as “operators, fab ricato rs and la bo re rs” . Only two percent (2%) of the residents of the three (3) Townships are employed in farming.
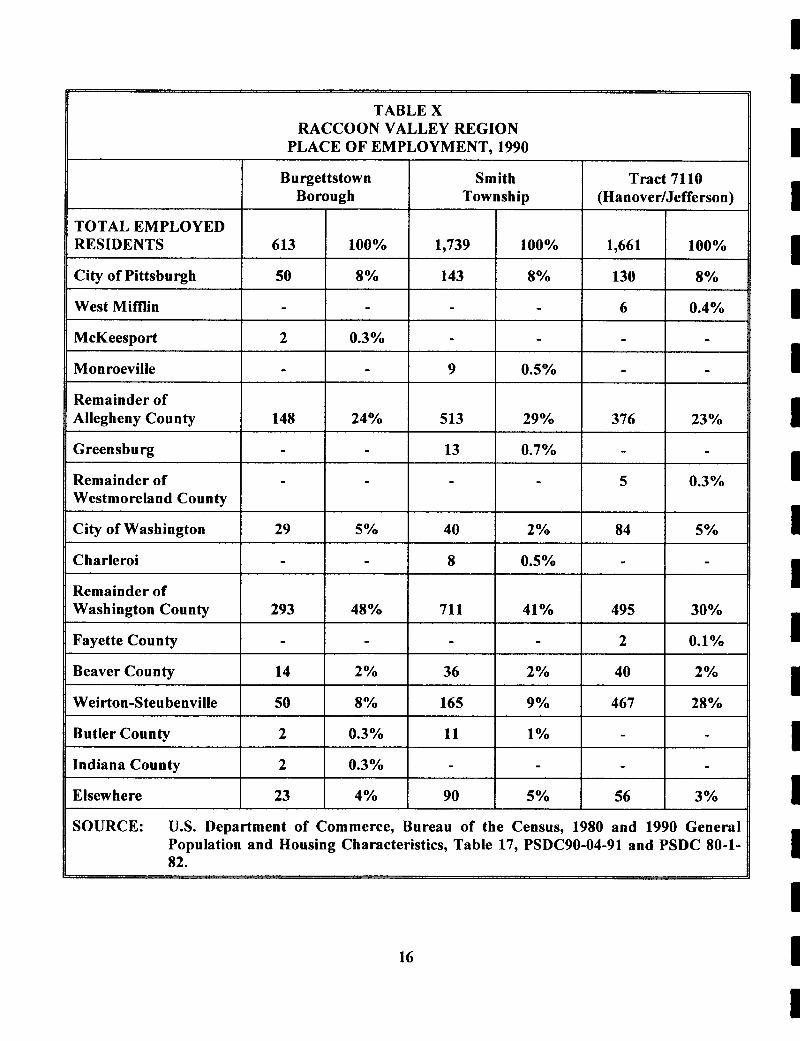
Table X on the next page shows the place where Raccoon Valley Region residents work according to the 1990 Census. Only eight percent (8%) are employed in the City of Pittsburgh and an additional 23%-29% are employed in Allegheny County outside the City of Pittsburgh. Five percent (5%) or less are employed in the City of Washington, but between thirty percent (30%) in HanovedJefferson and forty-eight percent (48%) in Burgettstown are employed in Washington County outside of the City.
Only 8%-9% of Burgettstown and Smith residents work in Weirton-Steubenville; but, because of close proximity, twenty-eight percent (28%) of Hanover/Jefferson residents are employed in Weirton-Steubenville. Two percent (2%) or less work in Fayette, Butler, Beaver or Indiana counties. Three to five percent (3%-5%) were employed in locations categorized as “Elsewhere.”
15
SOURCE: U.S. Department of Commerce, Bureau of the Census, 1980 and 1990 General Population and Housing Characteristics, Table 17, PSDC90-04-91 and PSDC 80-1- 82.
16
1 1 1 1 1 1 I I I I I 1 I I I I I I I
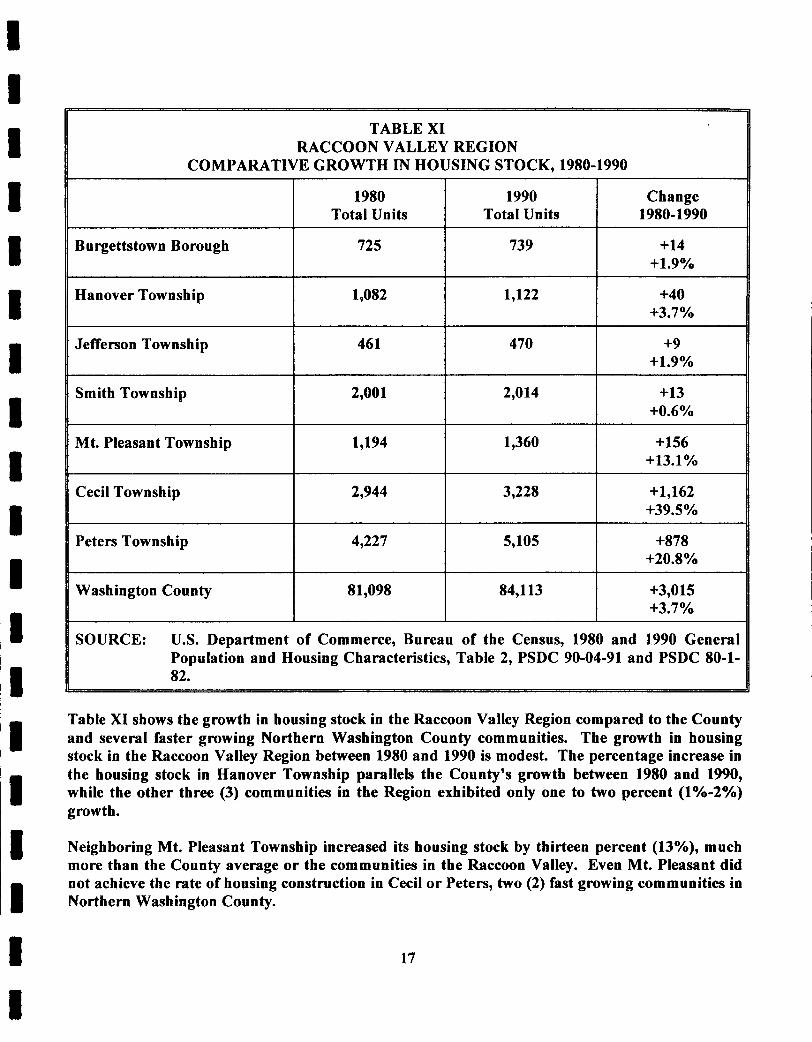
TABLE XI RACCOON VALLEY REGION
COMPARATIVE GROWTH IN HOUSING STOCK, 1980-1990
Smith Township
Change Total 1990 Units I 1980-1990
1 1980 1 Total Units
+1.9%
2,001 2,014 +13 +O.6%
Burgettstown Borough 725 1 739 1 +I4 +1.9%
Mt. Pleasant Township
Cecil Township
1,194 1,360 +156 +13.1%
2,944 3,228 +1,162 +39.5%
Peters Township 4,227 5,105 +878 +2O.8%
Washington County
SOURCE: U.S. Department of Commerce, Bureau of the Census, 1980 and 1990 General Population and Housing Characteristics, Table 2, PSDC 90-04-91 and PSDC 80-1- 82.
81,098 84,113 +3,015 +3.7%
Table XI shows the growth in housing stock in the Raccoon Valley Region compared to the County and several faster growing Northern Washington County communities. The growth in housing stock in the Raccoon Valley Region between 1980 and 1990 is modest. The percentage increase in the housing stock in Hanover Township parallels the County’s growth between 1980 and 1990, while the other three (3) communities in the Region exhibited onty one to two percent (1%-2%) growth.
Neighboring Mt. Pleasant Township increased its housing stock by thirteen percent (13%), much more than the County average or the communities in the Raccoon Valley. Even Mt. Pleasant did not achieve the rate of housing construction in Cecil or Peters, two (2) fast growing communities in Northern Washington County.
17
10 or more units
Mobile Homes
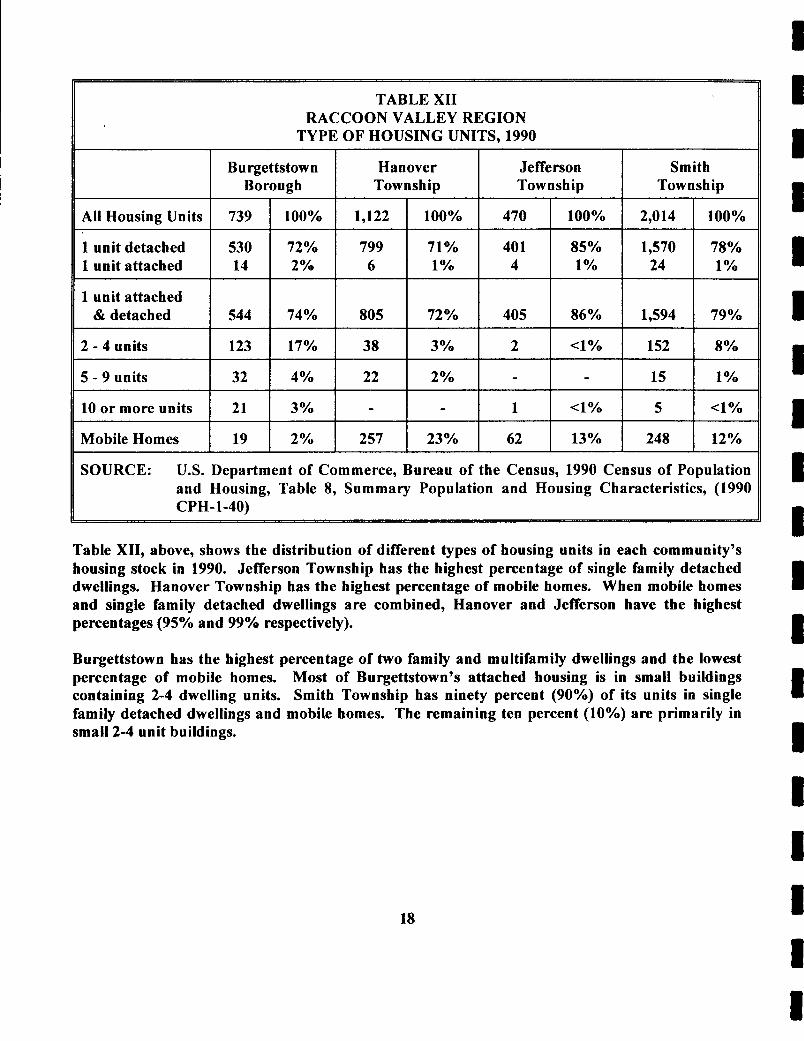
Table XII, above, shows the distribution of different types of housing units in each community's housing stock in 1990. Jefferson Township has the highest percentage of single family detached dwellings. Hanover Township has the highest percentage of mobile homes. When mobile homes and single family detached dwellings are combined, Hanover and Jefferson have the highest percentages (95% and 99% respectively).
21 3 y o - - 1 <1 Yo 5 4%
19 2 Yo 257 2 3 '/o 62 13 '10 248 12%
Burgettstown has the highest percentage of two family and multifamily dwellings and the lowest percentage of mobile homes. Most of Burgettstown's attached housing is in small buildings containing 2-4 dwelling units. Smith Township has ninety percent (goo/,) of its units in single family detached dwellings and mobile homes. The remaining ten percent (10%) are primarily in small 2-4 unit buildings.
18
I 1 I I I I i I 8 I I I I I 1 I I I I
1
TABLE XI11 RACCOON VALLEY REGION
COMPARATIVE HOUSING VALUES, 1990 Burgettstown Hanover Jefferson Smith Cecil Peters Washington
Borough Township Township Township Township Township County Owner Occupied 459 84 1 396 1,527 2,196 4,159 46,374 Units Less than $5 0,O 0 0 57% 3 5 '/o 40% 61% 34% 3% 46% $50,000 - $99,999 40 y o 57% 49% 35% 51% 31% 42% $100,000 - $149,999 2 Yo 6% 9 y o 3 y o 11% 30 % 8% $150,000 or more 4% 2 O/O 4% < 1 O/O 4 yo 35% 5% Median Value $47,000 $57,900 $56,700 $41,200 $64,500 $124,500 $53,600 SOURCE: U.S. Department of Commerce, Bureau of the Census, 1990 Census of Population and Housing Table 10, Summary Population and Housing Characteristics (1990 CH-1-40) and PSDC 90-04-91.
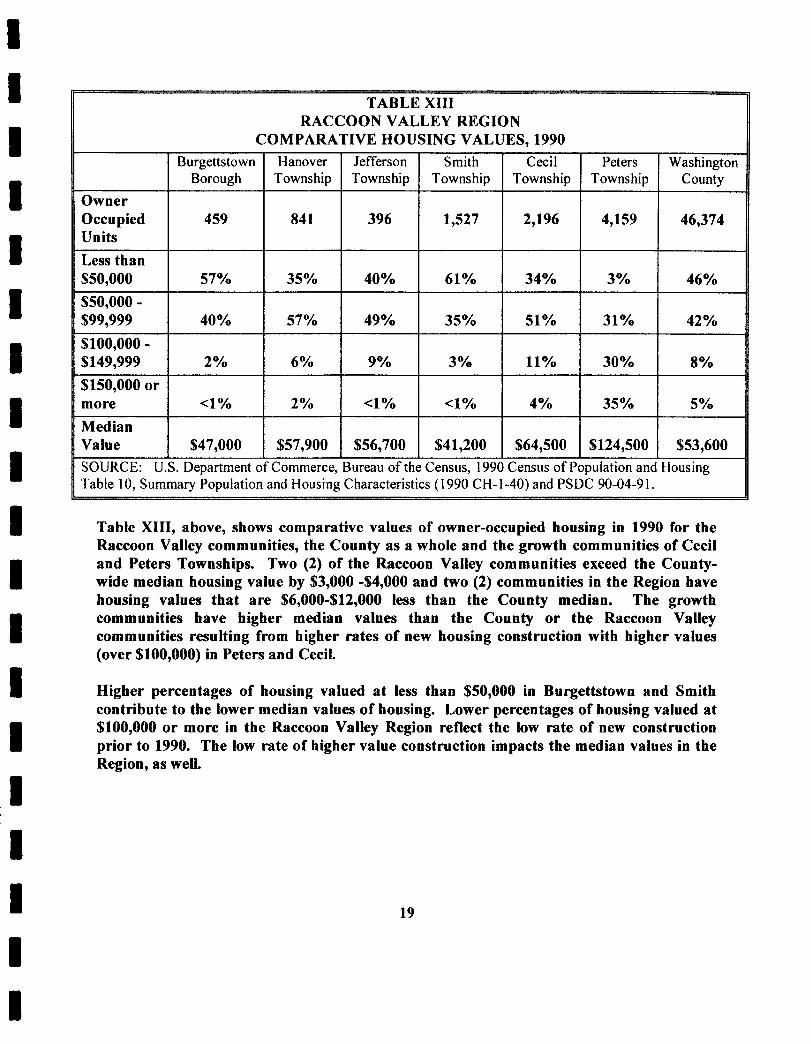
Table XIII, above, shows comparative values of owner-occupied housing in 1990 for the Raccoon Valley communities, the County as a whole and the growth communities of Cecil and Peters Townships. Two (2) of the Raccoon Valley communities exceed the County- wide median housing value by $3,000 -$4,000 and two (2) communities in the Region have housing values that are $6,000-$12,000 less than the County median. The growth communities have higher median values than the County or the Raccoon Valley communities resulting from higher rates of new housing construction with higher values (over $100,000) in Peters and Cecil.
Higher percentages of housing valued at less than $50,000 in Burgettstown and Smith contribute to the lower median values of housing. Lower percentages of housing valued at $100,000 or more in the Raccoon Valley Region reflect the low rate of new construction prior to 1990. The low rate of higher value construction impacts the median values in the Region, as well.
~I 1 U I
19
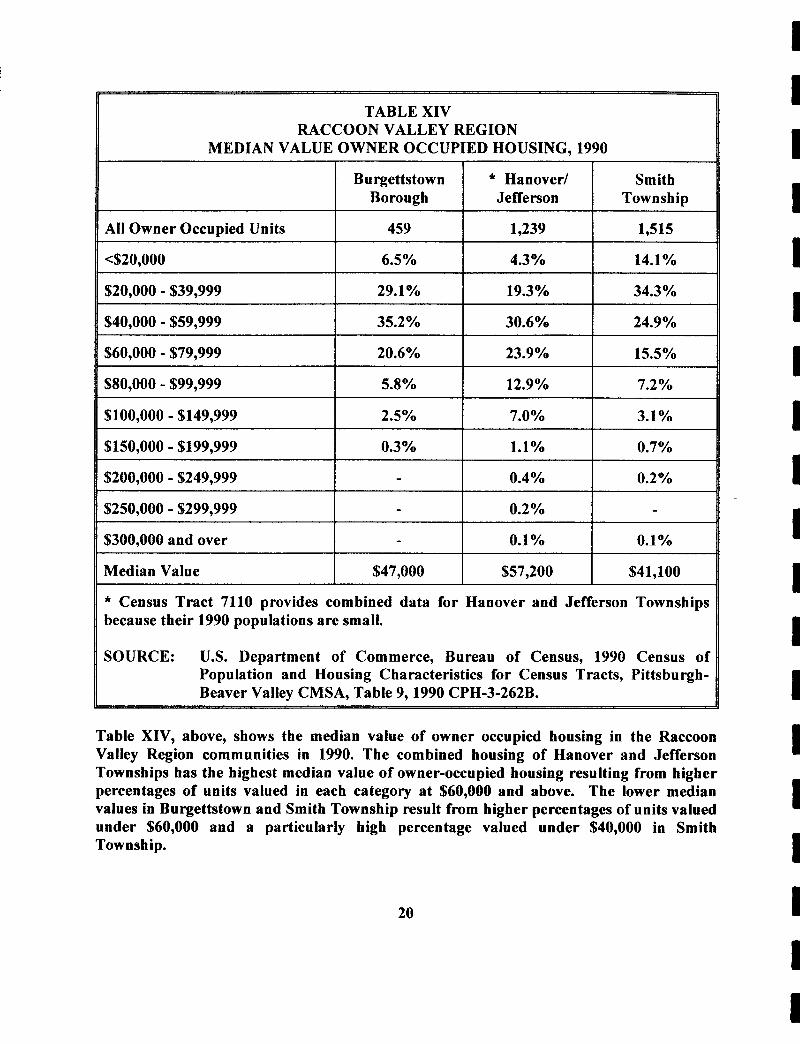
TABLE XIV RACCOON VALLEY REGION
MEDIAN VALUE OWNER OCCUPIED HOUSING, 1990
Burgettstown * Hanoverl Smith Borough Jefferson Township
11 All Owner Occupied Units I 459 I 1,239 I 1,515
I 6.5% I 4.3% I 14.1%
- $250,000 - $299,999 I I 0.2% I -
SOURCE: U.S. Department of Commerce, Bureau of Census, 1990 Census of Population and Housing Characteristics for Census Tracts, Pittsburgh-
I I 1 I I 1 I I I 1 1 I I 1 1 I
Table XIV, above, shows the median value of owner occupied housing in the Raccoon Valley Region communities in 1990. The combined housing of Hanover and Jefferson Townships has the highest median value of owner-occupied housing resulting from higher percentages of units valued in each category at $60,000 and above. The lower median values in Burgettstown and Smith Township result from higher percentages of units valued under $60,000 and a particularly high percentage valued under $40,000 in Smith Township.
20
1 1 I 1 D I I 1 I I 1 1 1 1 1 I I I
YO Lacking Complete Plumbing
O h With Public or Private Water System
O h With Public Sewers
TABLE XV RACCOON VALLEY REGION
SELECTED HOUSING CHARACTERISTICS, 1990
1.2 Yo 2.1% 1.7% 2.6%
98.6% 58.6% 0.6% 77.6%
71.0% 6.1% 0.9% 21.1%
I 1 I I
Burgettstown Hanover Jefferson Borough 1 Township Township 1 T,",".':Eip
I I I I All Housing Units I 739 470 I 2,014
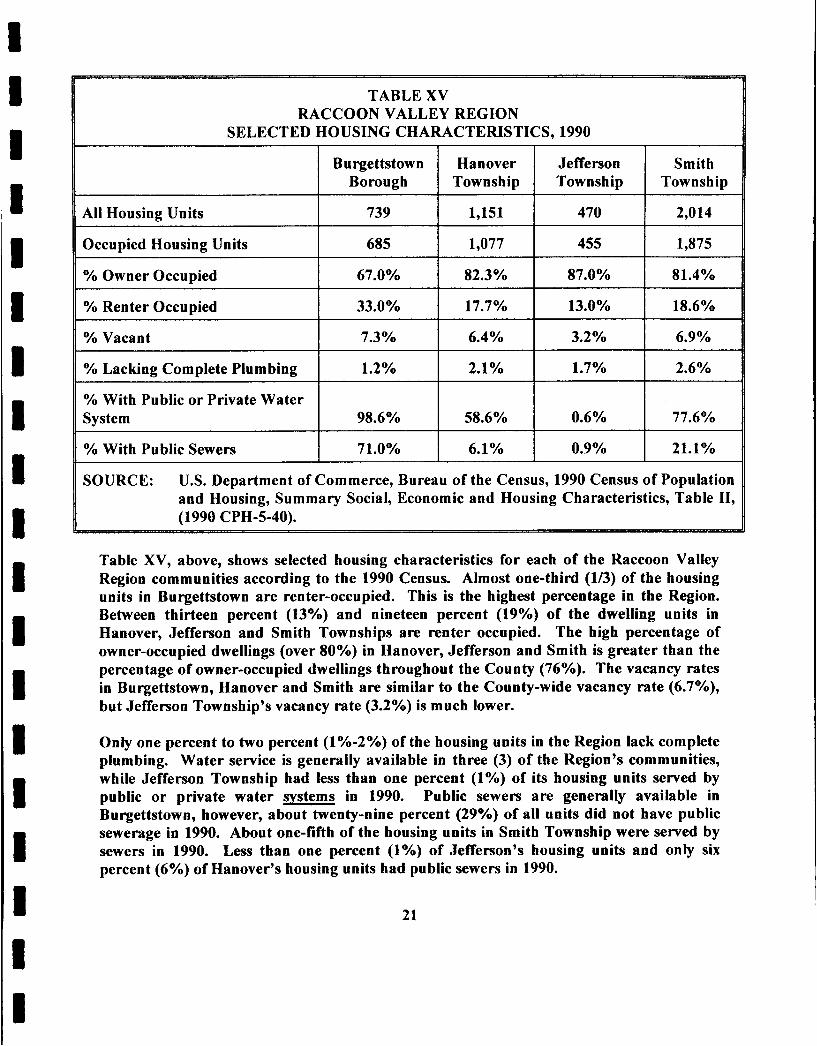
Table XV, above, shows selected housing characteristics for each of the Raccoon Valley Region communities according to the 1990 Census. Almost one-third (1/3) of the housing units in Burgettstown are renter-occupied. This is the highest percentage in the Region. Between thirteen percent (13%) and nineteen percent (19%) of the dwelling units in Hanover, Jefferson and Smith Townships are renter occupied. The high percentage of owner-occupied dwellings (over 80%) in Hanover, Jefferson and Smith is greater than the percentage of owner-occupied dwellings throughout the County (76%). The vacancy rates in Burgettstown, Hanover and Smith are similar to the County-wide vacancy rate (6.7%), but Jefferson Township's vacancy rate (3.2%) is much lower.
Only one percent to two percent (1%-2%) of the housing units in the Region lack complete plumbing. Water service is generally available in three (3) of the Region's communities, while Jefferson Township had less than one percent (1%) of its housing units served by public or private water systems in 1990. Public sewers are generally available in Burgettstown, however, about twenty-nine percent (29%) of all units did not have public sewerage in 1990. About one-fifth of the housing units in Smith Township were served by sewers in 1990. Less than one percent (1%) of Jefferson's housing units and only six percent (6%) of Hanover's housing units had public sewers in 1990.
21
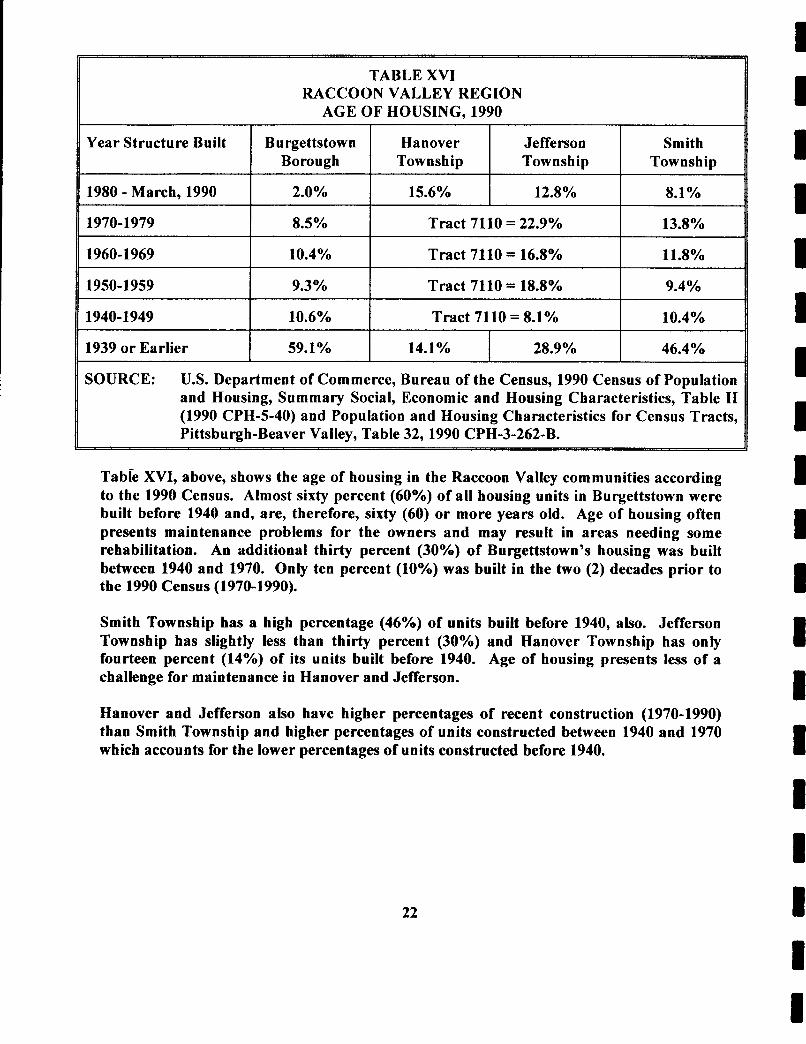
TABLE XVI RACCOON VALLEY REGION
AGE OF HOUSING, 1990
Year Structure Built Burgettstown Hanover Jefferson Smith Borough Township Township Township
1980 - March, 1990 2.0% 15.6% 12.8% 8.1%
1970-1979 8.5% Tract 7110 = 22.9% 13.8%
and Housing, Summary Social, Economic and Housing Characteristics, Table I1 (1990 CPH-5-40) and Population and Housing Characteristics for Census Tracts, Pittsburgh-Beaver Valley, Table 32, 1990 CPH-3-262-B.
I I I
Table XVI, above, shows the age of housing in the Raccoon Valley communities according to the 1990 Census. Almost sixty percent (60%) of all housing units in Burgettstown were built before 1940 and, are, therefore, sixty (60) or more years old. Age of housing often presents maintenance problems for the owners and may result in areas needing some rehabilitation. An additional thirty percent (30%) of Burgettstown’s housing was built between 1940 and 1970. Only ten percent (10%) was built in the two (2) decades prior to the 1990 Census (1970-1990).
Smith Township has a high percentage (46%) of units built before 1940, also. Jefferson Township has slightty less than thirty percent (30%) and Hanover Township has only fourteen percent (14%) of its units built before 1940. Age of housing presents less of a challenge for maintenance in Hanover and Jefferson.
Hanover and Jefferson also have higher percentages of recent construction (1970-1990) than Smith Township and higher percentages of units constructed between 1940 and 1970 which accounts for the lower percentages of units constructed before 1940.
I I 1 1 1 I I I I I I I I I 1 I i I
22
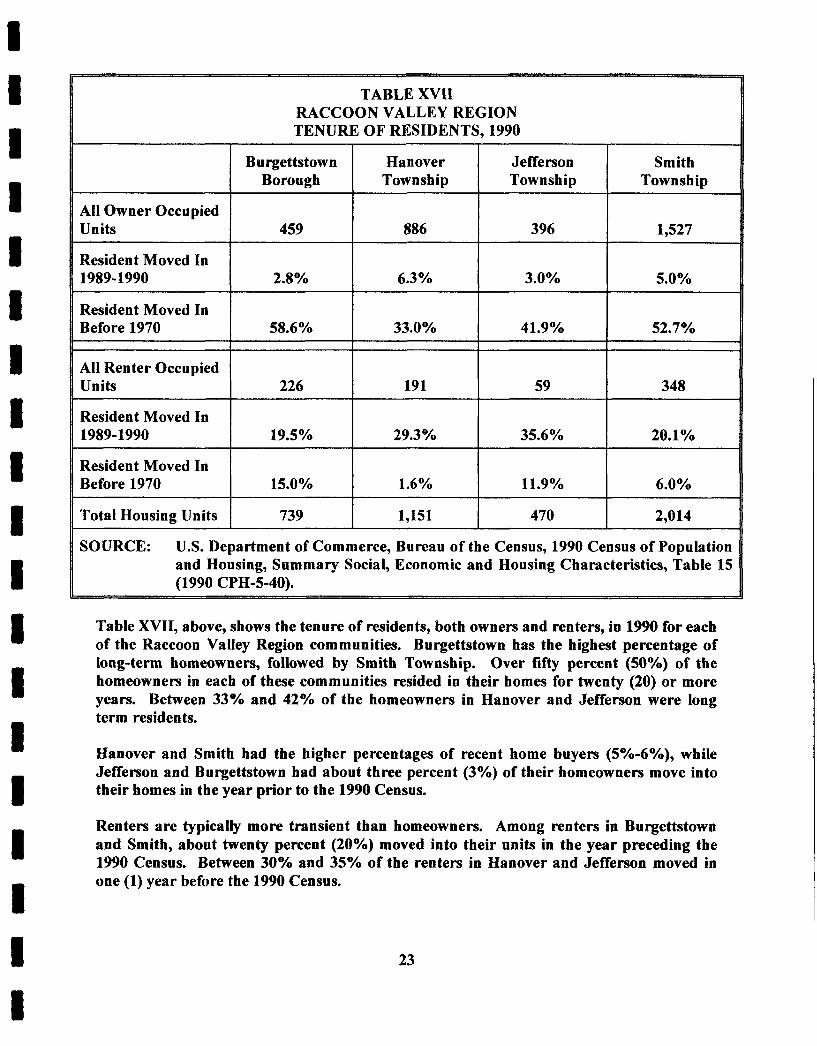
TABLE XVII RACCOON VALLEY REGION TENURE OF RESIDENTS, 1990
SOURCE: U.S. Department of Commerce, Bureau of the Census, 1990 Census of Population and Housing, Summary Social, Economic and Housing Characteristics, Table 15 (1990 CPH-5-40).
Table XVII, above, shows the tenure of residents, both owners and renters, in 1990 for each of the Raccoon Valley Region communities. Burgettstown has the highest percentage of long-term homeowners, followed by Smith Township. Over fifty percent (50%) of the homeowners in each of these communities resided in their homes for twenty (20) or more years. Between 33% and 42% of the homeowners in Hanover and Jefferson were long term residents.
Hanover and Smith had the higher percentages of recent home buyers (5%-6%), while Jefferson and Burgettstown had about three percent (3%) of their homeowners move into their homes in the year prior to the 1990 Census.
Renters are typically more transient than homeowners. Among renters in Burgettstown and Smith, about twenty percent (20%) moved into their units in the year preceding the 1990 Census. Between 30% and 35% of the renters in Hanover and Jefferson moved in one (1) year before the 1990 Census.
23
Burgettstown (15%) and Jefferson (12%) have the highest percentage of long-term renters, while Smith has only six percent (6%) and Hanover has less than two percent (2%) of renters who lived in their units for twenty (20) or more years.
Community 2000 Influencing Population Factor
Bumettstown 1.576 -9.75%
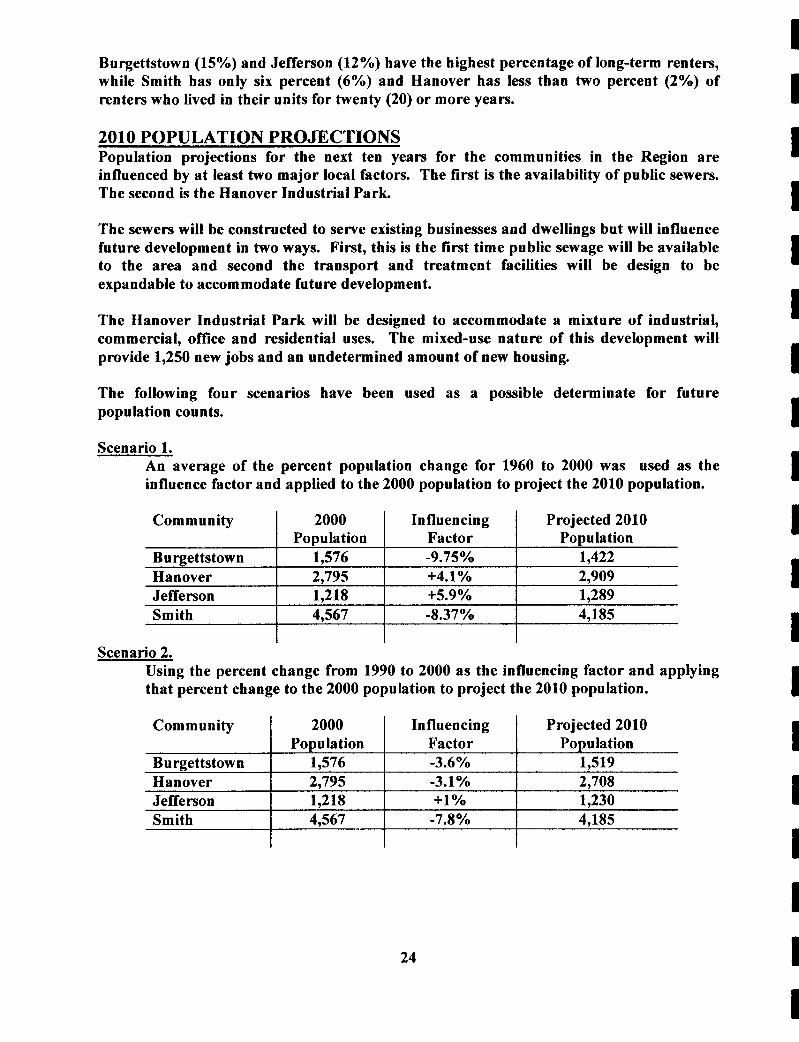
2010 POPULATION PROJECTIONS Population projections for the next ten years for the communities in the Region are influenced by at least two major local factors. The first is the availability of public sewers. The second is the Hanover Industrial Park.
Projected 2010 Population
1,422
The sewers will be constructed to serve existing businesses and dwellings but will influence future development in two ways. First, this is the first time public sewage will be available to the area and second the transport and treatment facilities will be design to be expandable to accommodate future development.
Hanover Jefferson
The Hanover Industrial Park will be designed to accommodate a mixture of industrial, commercial, office and residential uses. The mixed-use nature of this development will provide 1,250 new jobs and an undetermined amount of new housing.
2,795 4-41 y o 2,909 1,218 +5.9% 1,289
The following four scenarios have been used as a possible determinate for future population counts.
Smith
Scenario 1. An average of the percent population change for 1960 to 2000 was used as the influence factor and applied to the 2000 population to project the 2010 population.
4,567 -8.37% 4,185
Community 2000 Influencing Population Factor
Burgettstown 1,576 -3.6% Hanover 2,795 -3.1% Jefferson 1,218 +1% Smith 4,567 -7.8%
Projected 2010 Population
1,519 2,708 1,230 4,185
Scenario 2. Using the percent change from 1990 to 2000 as the influencing factor and applying that percent change to the 2000 population to project the 2010 population.
24
I I 1 I 1 1 I I I I I 1 I I I I I I I
1 i I I
Community 2000 Influencing Population Factor
Units X Persons Per Household
Burgettstown 1,576 2 X 2.34 Hanover 2,795 155 X 2.50 Jefferson 1,218 60 X 2.60 Smith 4,567 135 X 2.52
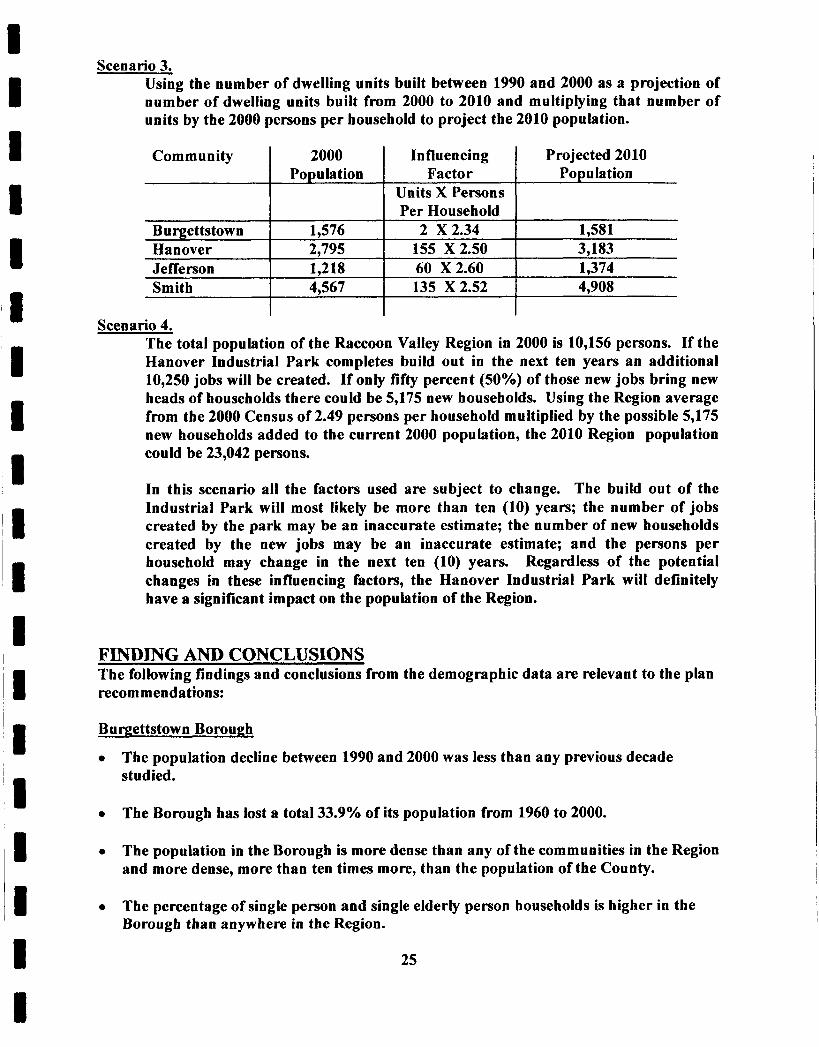
Scenario 3. Using the number of dwelling units built between 1990 and 2000 as a projection of
Projected 2010 Population
1,58 1 3,183 1,374 4,908
- - numvber of dwelling units built from 2000 to 2010 and multiplying that number of units by the 2000 persons per household to project the 2010 population.
Scenario 4. The total population of the Raccoon Valley Region in 2000 is 10,156 persons. If the Hanover Industrial Park completes build out in the next ten yea& an additional 10,250 jobs will be created. If only fifty percent (50%) of those new jobs bring new heads of households there could be 5,175 new households. Using the Region average from the 2000 Census of 2.49 persons per household multiplied by the possible 5,175 new households added to the current 2000 population, the 2010 Region population could be 23,042 persons.
In this scenario all the factors used are subject to change. The build out of the Industrial Park will most likely be more than ten (10) years; the number of jobs created by the park may be an inaccurate estimate; the number of new households created by the new jobs may be an inaccurate estimate; and the persons per household may change in the next ten (10) years. Regardless of the potential changes in these influencing factors, the Hanover Industrial Park will definitely have a significant impact on the population of the Region.
FINDING AND CONCLUSIONS The following findings and conclusions from the demographic data are relevant to the plan recom mendations:
Buwettstown Borough
The population decline between 1990 and 2000 was less than any previous decade stud ied.
The Borough has lost a total 33.9% of its population from 1960 to 2000.
Tbe population in the Borough is more dense than any of the communities in the Region and more dense, more than ten times more, than the population of the County.
The percentage of single person and single elderly person households is higher in the Borough than anywhere in the Region.
25
Burgettstown Borouph Continued
The median age in the Borough was 40.8 years in 1990. This median age was higher than any other in the Region and above that of the County. In the 2000 Census the median age rose to 42.1 years.
The percent of college graduates in the Borough dropped by 1% between 1980 and 1990.
Families below poverty in the Borough more than doubled between 1980 and 1990 from 5% to 12.8%.
The highest percentage of employed persons in the Borough are in technical, sales and clerical positions in the wholesale and retail industries.
Over half of the employed residents of the Borough are employed in the City of Washington or other locations within Washington County.
Seven percent (70%) of the housing units in the Borough are in buildings with 5 units or more. This compares to 2% in Hanover Township, 1°h-20/~ in Smith Township and less than 1y0 in Jefferson Township.
In 1990 the Borough was one of two communities in the Region with median housing values less than the County’s.
In 1990, at 91.4% the Borough has the highest percent of owner occupied dwelling units valued at less than $80,000 in the Region.
The Borough has both the highest percent of rental units and the highest percent of vacant units in the Region.
Almost 60% of the units in the Borough were build before 1940.
Over 58% of the owner occupied units in the Borough have been occupied by the current residents since before 1970.
Hanover Township
Hanover Township is the only community in the Region that has an increase in population from 1960 to 2000.
Population in the Township peaked in 1980 at 3,275 and has decreased by 480 persons since then.
Hanover is the largest Township in terms of area in the Region but has the second lowest number of persons per square mile.
26
I I 1 1 I I I I i I 1 I I I I 1 I I 1
Hanover Township Continued
Probably as a result of Hanover’s border with West Virginia it has the lowest percent of residents born in Pennsylvania at 53%.
In 1990, with 31.4%, Hanover had the highest percent of persons under 18 years old in the Region.
Hanover also had the lowest median age at 34.5 years and the lowest percent of the population 65 years and older with 12.7% in that age category.
In 1990 Hanover Township had the highest percent of college graduates in the Region.
With 2.75 persons per household Hanover exceeds the persons per household of all other communities in the Region.
The 1990 median household income in Hanover was higher than all the other communities in the Region and the County.
Forty (40) new housing units were built in Hanover Township between 1980 and 1990. This is more new dwelling units than the other three communities in the Region corn bined.
Between 1990 and 2000 Hanover Township also experienced the most new dwelling units.
Hanover has no residential buildings with ten (10) or more dwelling units.
In 1990, 2% of the dwelling units in Hanover Township were valued more than $150,000. This is the highest percent in the Region.
With 35% of the housing stock valued at less than $50,000 Hanover Township has the lowest percent in the Region.
The median value of housing in Hanover Township is higher than all the other communities in the region and higher than the County.
Dwellings occupied by owners makes up 82.3% of the housing units in Hanover Township.
Only 14.1% of the housing stock in Hanover Township was built before 1940. This is the lowest percent of all the communities in the Region.
Hanover has the lowest percent of residents that moved in before 1970.
27
Jefferson Township
Population in Jefferson Township is the smallest in the Region.
The population in Jefferson Township has only decreased by 11 persons between 1960 and 2000.
At 53.8 persons per square mile Jefferson Township has the lowest population density of all the communities in the Region.
In 1990 Jefferson Township leads the Region with persons ages 45-64 with 23.8% of the population in that age category.
In 1990 Jefferson Township had the lowest unemployment with 3.5% and the lowest percent of families below poverty with 4.2%.
Per capita income, median household income and median family income was higher in Jefferson Township than anywhere in the Region and the County.
Between 1980 and 2000, sixty-nine (69) new dwelling units were built in Jefferson Township.
Jefferson Township has the highest percent of single family detached dwelling units in the Region.
Jefferson Township has the highest percent of owner occupied dwellings in the Region.
Smith Township
Smith Township has the largest population of all the communities in the Region.
Population in Smith Township peaked in 1960 and the Township has lost 1,795 persons or 28.3% of the total population between 1960 and 2000.
Smith Township has the lowest percent of foreign born residents at less than 1%.
The 1990 median age of residents of Smith Township is almost identical to that of the County.
Smith Township has the lowest percent of high school graduates in the Region.
In 1990 Smith Township had the highest unemployment rate at 13% and the highest percent of families living below poverty (13.3%) in the Region.
Per capita income, median household income and median family income was lower in Smith Township than anywhere in the Region.
In 1990, 15.5% of the Smith Township population was living in poverty. 28
I I I B I I I I D I I I I I D I I I I
I I I I I I I I
I
Smith Township Continued
The highest percentage of employed persons in the Smith Township are in technical, sales and clerical positions in the wholesale and retail industries.
Smith Township, the Township located in the closest proximity to Allegheny County, leads the Region with persons employed in Allegheny County.
There were 148 new dwelling units built in Smith Township between 1980 and 2000.
Smith Township has 61% of its dwelling units valued at less than $50,000. This is the highest percentage in the Region.
The median value of housing in the Township is the lowest in the Region and below that of the County median.
In 1990 2.6% of the dwelling units in Smith Township were lacking complete plumbing. This is the highest percent in the Region.
46.4% of the dwelling units in Smith Township were built before 1940.
I I I I I 29
I I I I I I I I I I I I 31 ~I
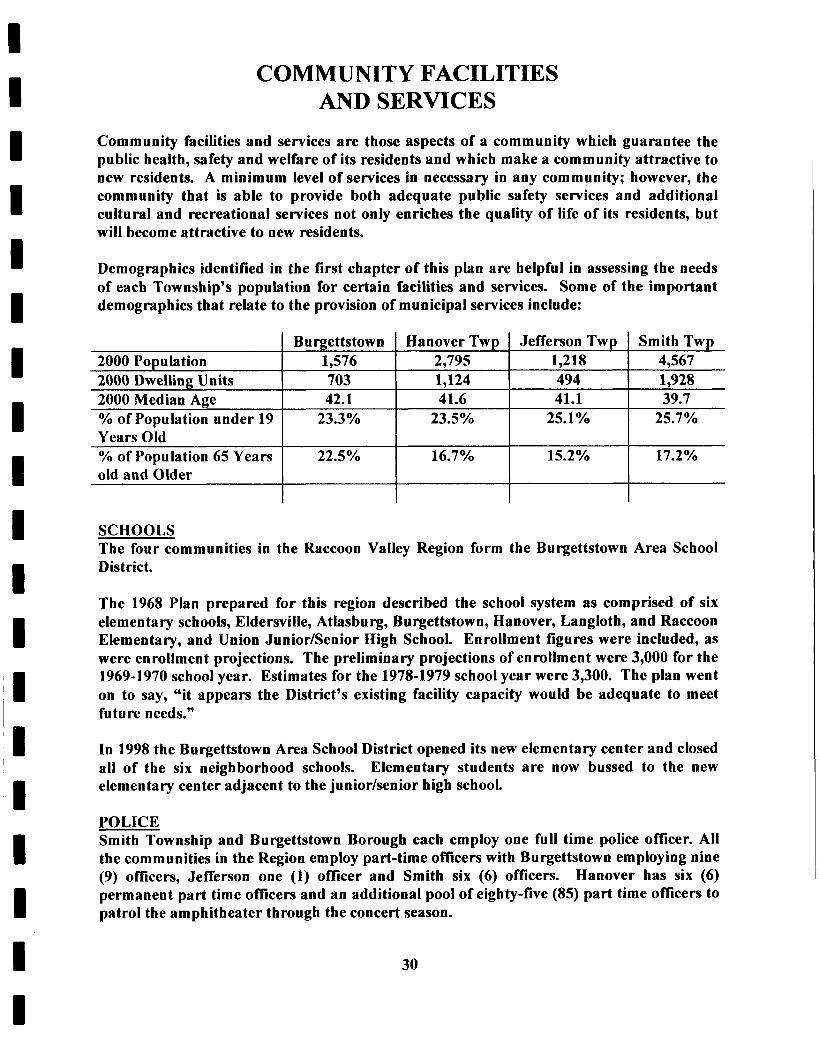
Burgettstown Hanover Twp Jefferson Twp 2000 Population 1,576 2,795 1,218 2000 Dwelling Units 703 1,124 494
YO of Population under 19 23.3% 23.5% 25.1 yo
2000 Median Age 42.1 41.6 41.1
I I I I I
Smith Twp 4,567 1,928 39.7
25.7%
COMMUNITY FACILITIES AND SERVICES
Years Old YO of Population 65 Years
Community facilities and services are those aspects of a community which guarantee the public health, safety and welfare of its residents and which make a community attractive to new residents. A minimum level of services in necessary in any community; however, the community that is able to provide both adequate public safety services and additional cultural and recreational services not only enriches the quality of life of its residents, but will become attractive to new residents.
22.5% 16.7% 15.2 Yo 17.2%
Demographics identified in the first chapter of this plan are helpful in assessing the needs of each Township’s population for certain facilities and services. Some of the important demographics that relate to the provision of municipal services include:
old and Older
SCHOOLS The four communities in the Raccoon Valley Region form the Burgettstown Area School District.
The 1968 Plan prepared for this region described the school system as comprised of six elementary schools, Eldersville, Atlasburg, Burgettstown, Hanover, Langloth, and Raccoon Elementary, and Union Junior/Senior High School. Enrollment figures were included, as were enrollment projections. The preliminary projections of enrollment were 3,000 for the 1969-1970 school year. Estimates for the 1978-1979 school year were 3,300. The plan went on to say, “it appears the District’s existing facility capacity would be adequate to meet future needs.”
In 1998 the Burgettstown Area School District opened its new elementary center and closed all of the six neighborhood schools. Elementary students are now bussed to the new elementary center adjacent to the junior/senior high school.
POLICE Smith Township and Burgettstown Borough each employ one full time police officer. All the communities in the Region employ part-time officers with Burgettstown employing nine (9) ofilcers, Jefferson one (1) officer and Smith six (6) officers. Hanover has six (6) permanent part time officers and an additional pool of eighty-five (85) part time officers to patrol the amphitheater through the concert season.
30
Smith Township provides 24-hour police protection 5 of the 7 days in a week. Each of the other communities provide police protection on shifts and/or on an “on-call” basis. All of the communities in the Region use the Pennsylvania State Police as backup in the event that no local police officer can respond.
Burgettstown Borough provides offices for police officers and temporary prisoner holding facilities in the Borough Building. Smith Township has installed a trailer adjacent to the Township Building to provide office space for the police department. Hanover Township has provided office space in the Township Building for police officers and the amphitheater provides trailers on the amphitheater property for police offices and processing facilities. The one part time police officer in Jefferson Township maintains an office in part of his residence.
In the 1998 Citizen Survey conducted by the Jefferson Township Planning Commission, respondents were asked: “In what areas would improved regulations or services contribute to an improved quality of living in Jefferson Township for you?” Of the possible thirteen (13) answers “Public Safety” tied Fire Protection in fifth place behind “Clean Air and Water,” “Public Water,” “Single Family Neighborhoods,” and “Preservation of Farms.”
FIRE PROTECTION There is a volunteer fire company in each of the communities in the Region. Each community has established mutual aid agreements with the adjoining communities.
As with all volunteer fire companies, response is a concern. The timeliness, amount of manpower and the qualifications of those individuals are the basis of concern. Most recently, municipalities in general have developed concerns with the lack of fire fighters able to respond to calls during daylight hours when much of the volunteer manpower is working at jobs outside the community. Several communities in the area have hired part- time daylight fire fighters to provide that daylight protection.
Hanover Township has budgeted funds to pay a part-time fire fighter to address the daylight protection concern. Smith Township has several individuals that work in the community, including employees of the Township, that are available to respond to calls. Burgettstown is faced with only one fire fighter capable of operating the fire truck, however he is available to respond to calls during the day.
In almost every budget studied in each of the four communities less than 3% of the general fund each year was dedicated to fire protection.
Evaluation of the abilities of a fire company are complicated and include the response time, condition and availability of equipment, quantity and quality of fire fighters and pre-plan and fire prevention efforts. For this reason only a cursory review of the location of fire stations and their relationship to different types of structures has been conducted.
31
I I I I I I I I I I I I I I I I I I I
I I I I I I I I I I I I I I I 1 I I I
The National Fire Underwriters has recommended certain standards for fire service areas:
Residential: 4 mile radius of a fire station
Commercial and Industrial: 3 mile radius of a fire station
High Value Commercial (Shopping centers)
1 mile radius of a fire station
The map at the end of this chapter shows the service areas for each of the fire stations. The map shows a four (4) mile radius for each of the volunteer fire stations. Because the commercial and industrial structures and the high value commercial are minimal and scattered and almost nonexistent, the one (1) and three (3) mile radiuses are not shown.
There is a large area in the northeast portion of Hanover that does not have coverage from any fire station. This portion of the Township is mostly State Gameland and State Park property and the need for fire protection is minimal.
EMERGENCY MEDICAL Washington Ambulance and Chair is one of the providers of emergency medical services in the area. Periodically an emergency medical unit is stationed in Burgettstown and is assigned to respond to calls in the western part of the county. Washington Ambulance and Chair is the primary responder for 911 calls. Each fire department also has a first responder to medical calls from the fire stations. Cherry Valley Ambulance is a private ambulance service that is also available to residents of the area.
The Amphitheater contracts with Washington Ambulance and Chair to provide medical services during events at the amphitheater.
MUNICIPAL BUILDINGS Burgettstown Borough’s municipal building houses the police department, administrative offices and a meeting room. Adjacent to the municipal building is the public works facility with garage space and outdoor storage. The facility is fairly new and in good condition. The facility adequately accommodates the current needs of the Borough and will continue to accommodate those needs in the next decade.
The Hanover Township Municipal Building i s located on Old Steubenville Pike in an area where the majority of the Township can be easily accessed. A meeting room, administrative offices and police offices consume the majority of the floor area of the building. The building is outdated and lacks the modern styling and accommodations for a progressive community. The insulation and windows are poor and are the cause of high heating bills.
Since early 2000 a Hanover Township facilities committee has met regularly to discuss a new Township Building. In addition to the many functions now accommodated in the current Township Building, the newly formed sewer authority will also require office space. It is anticipated that the new Township Building will accommodate the sewer authority. A preliminary design has been agreed upon and a two-acre site next to the park
32
has been selected. Final designs are to be completed by mid 2001 and construction should start shortly afterwards.
Public works facilities for Hanover Township include garage space and outdoor storage. These facilities are located across the road from the Township Building and seem to accommodate the needs of the Township.
The Jefferson Township Building functions primarily as a public works facility, but some office and meeting space is available. The site is small and outdoor storage is located between the building and the road. Office space is limited and both the police officer and zoning officer use space in their homes as their offices. Having offices, records and services scattered throughout the Township is not ideal, but, based on the small population and the slow rate of growth, it seems to work well for the Township. Because there is no increase in demand for services anticipated in the future this system should continue to work for the Township.
Smith Township has outgrown their current Township Building. The police department operates out of a trailer located next to the Township Building. The office space is minimal and over-crowded. There are no meeting rooms and public meetings are being held at the Cherry Valley Sportsman’s Club. The existing building has also outlived its useful life in terms of construction and is becoming a maintenance burden.
The Township is actively seeking a site for a new Township Building. A joint use building with the Fire Company is also being investigated. A new Township Building is needed to meet the current demands of the Township and as development continues and population grows the need for a new spacious building will increase.
Location of the Smith Township Building is also critical. Because of the size of the Township, the Township Building should be as centrally located as possible. Full advantage of the width and improved condition of Route 18 should also be taken. A building in the Route 18 corridor would provide high visibility, quicker access to all parts of the Township and easy delivery of supplies to the Building.
PUBLIC WORKS Burgettstown employs two (2) full time public works employees. The majority of their time is dedicated to maintaining the seven (7) miles of Borough roads. The public works department is well equipped and cooperates with other communities on the completion of major projects.
Between 1995 and 1998 expenditures from the general fund for public works averaged $72,143. This represents approximately 21% of the annual expenditures. The cost to the Borough of maintaining its seven (7) miles of roads has been approximately $10,306 a year per mile. The fact that all the roads in the Borough are paved and not tar and chip increase the cost of road maintenance in the Borough.
Jefferson Township also employees two (2) full time Public Works employees. Maintenance of the Township’s 26.9 miles of roads is the primary duty of these employees and the Township has equipped them well with three (3) dump trucks, a grader and a backhoe to perform their tasks.
33
I I I I I I I I I I I I I I I I I I I
I I II I I I I I I I I I
Between 1995 and 2000 an average of 22.85% of the total expenditures from the general fund were spent on the public works function. Because the Township has no other facilities, the public works expenditures are exclusively dedicated to road maintenance. The Township spends an average of $1,335 per mile per year each year.
Jefferson Township employees and equipment are also part of a cooperative effort managed by the Cross Creek Regional Planning Commission where manpower and equipment are used jointly to complete large road projects. This regional effort is a cooperative assistance program where Jefferson Township, Cross Creek Township, Independence Township, Hopewell Township and Mount Pleasant Township share ownership of major road equipment and where manpower from one community is sent to another to complete major road work.
Hanover Township employees five (5) full time public works employees. They are equipped with three (3) dump trucks, one grader, one backhoe and two (2) loaders. The primary function of these employees is road construction and maintenance.
Hanover Township has spent an average of $76,921 on roads over the past five (5) years. This equates to an average annual expenditure of $1,136 for each of the 67.68 miles of roads the Township maintains.
Smith Township employs three (3) full time and one part time public works employees. These employees are responsible for the maintenance of 47.03 miles of roads as well as the entire Township-owned storm sewers system. The Public Works Department also maintains parks in Cherry Valley, Slovan and Francis Mine.
Smith Township has spent an average of $202,496 a year each of the past five years on public works functions.
GARBAGE COLLECTION In each community in the Region, residents contract with selected garbage contractors who are licensed by the respective community for garbage collection. None of the communities have made it mandatory for residents to contract with a garbage collector. None of the communities provide, nor are they required by the State to provide, a recycling program.
Two major issues arise when discussing regulations that mandate residents to contract with a garbage collector. Mandatory collection could reduce illegal dumping of garbage along the side of rural roads and reduce the cost to the Township to clean up this dumping. Because of the rural character of roads in the area, these roads could not accommodate a large garbage truck and special arrangements would need to be made to collect garbage on these roads. There is also sparse development along these roads greatly reducing the number of customers available to a garbage collector hence increasing the cost to the customers that are available.
Burgettstown Borough, Hanover Township and Smith Township sponsor a “Clean Up” day each year where residents can dump garbage into roll-off boxes at designated locations in the communities.
34
LIBRARY SERVICE Library needs are served by the Burgettstown Area Library on Curr Street in Burgettstown. The library is independently owned and operated by the library board. Based on the small size and low density of the Region’s population, this library os adequate to serve the Region.
SENIOR CENTER A community senior center is located in Burgettstown Borough at the Borough Complex. This center serves seniors from all communities in the Region. Programs and the building are run by the senior group and some minimal funding is provided by the Borough.
Dispersed population and lack of transportation create challenges for serving the Region’s elderly population, but the Borough is a central location for this facility. Consideration should be given to making this a Regional facility and operating it with Regional support.
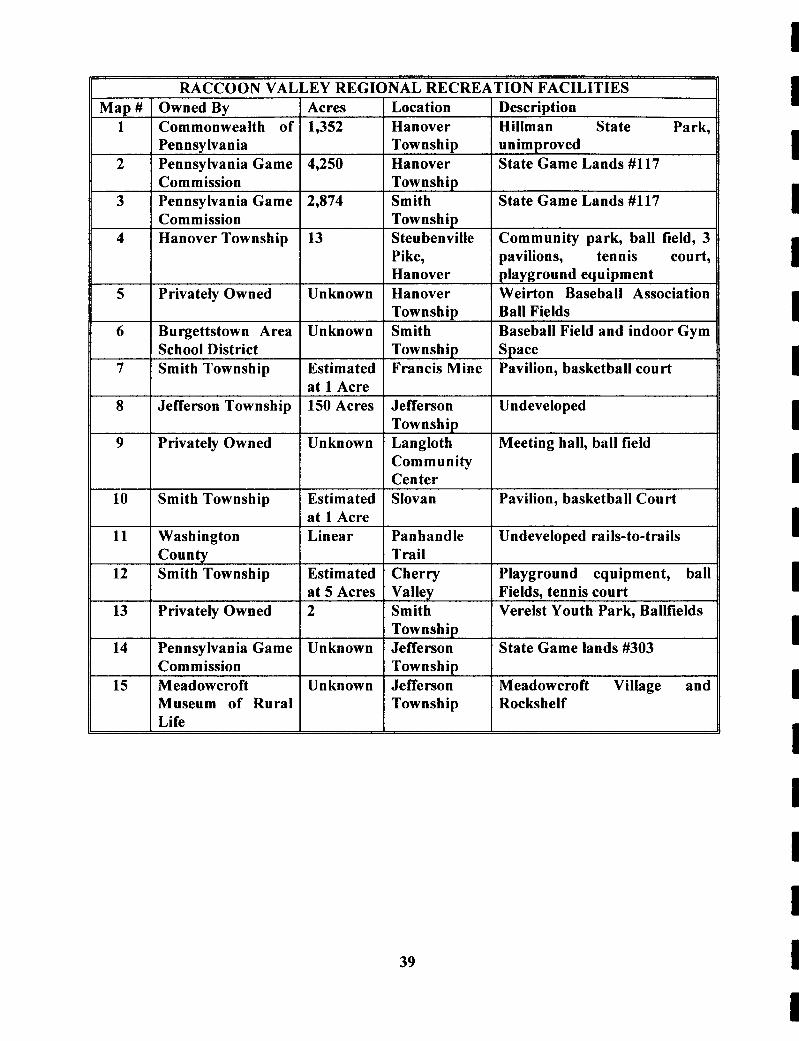
RECREATION The Region is served by several recreational areas owned by the State as well as some park land owned by Hanover and Smith Township. Jefferson Township and Burgettstown Borough do not own or operate any recreational facilities. The following table lists the recreation facilities within the region:
The Borough of Burgettstown owned and operated a large successful park on Route 18 in Smith Township. This park contained ball fields, pavilions, playground equipment and a community swimming pool. The Burgettstown Area School District acquired the property as part of the educational center campus. It was intended that facilities would remain and be available to the public. Only some ball field space remains.
Several parent groups and athletic associations offer programs for children interested in football, soccer, baseball and softball. Other than offering facilities none of the municipalities sponsor these programs. Hanover Township does offer a day camp for children in the summer months and has a community celebration in conjunction with the Washington County Covered Bridge Festival.
The Burgettstown Senior Center, located adjacent to the Burgettstown Borough Building provides programs and services for senior citizens in the area. The nonprofit organization operates independent of any of the municipalities.
The Burgettstown Area School District offers its facilities including the gyms and fields to residents of the Region at a nominal fee.
The Amphitheater located on Route 18 just south of Route 22 in Hanover Township. This facility is a major regional attraction holding outdoor musical concerts and is the destination to over 100,000 visitors a year.
Devil’s Den Rock Formation is a rock formation on the Paris Sportsman’s Club property in Hanover Township that has been referred to as the Devil’s Grotto. Once a popular regional attraction, it is now used by youths as a party site.
35
I I 1 I I I I I I I I I I 1 I I I 1 I
I I I I I D I I I I I I I I I 'I I I I
I
~
Meadowcroft Village and Rock Shelf, in Jefferson Township is billed as a world-renowned archaeological site with the oldest and longest continually used human site in North America. Radiocarbon dating of artifacts indicates that the earliest human occupancy in this site dates back to between 12,000 and 17,000 BC.
The Rock Shelf is not currently open for visitation by the public. Plans are being developed to construct a permanent structure to protect the archaeological deposits and allow visitors an opportunity to view the site. The site will soon be designated as a National Historic Landmark.
Christmas in the Village is held in Eldersville in Jefferson Township at the Historic White Church. This church formed by the abolitionists in 1844 was restored by the Jefferson Township Historical Society and was opened for the Annual Christmas In The Village Festival in December 1995.
Kidd Mill is a former gristmill site in Jefferson Township where only the grindstone and foundation remain. While this area was also a regional attraction, there are very few visitors to the site. A local group still holds spring and fall walks around the mill property.
The Pan Handle Trail has the potential to become one of the region's largest recreational assets. This trail, a rails-to-trails project that begins in Allegheny County, traverses through Smith Township from Midway Borough to Burgettstown Borough, through Burgettstown, and follows the border between Hanover and Jefferson Townships to West Virginia. The trail is shown on the Recreational Facilities Map at the end of this section. The trail continues to Weirton, West Virginia and connects Weirton, West Virginia to Walkers Mill in Collier Township in Allegheny County, Pennsylvania.
The Pan Handle Trail also has the potential to provide an alternative means of transportation in the Region. Extensions to the trail could connect the proposed industrial park in Hanover Township with the population centers in the Region. Residents of Slovan, Atlasburg and Burgettstown could access a trail system that would connect these places with the proposed industrial park. Adding a trail from Joffre to Cherry Valley could link the recreation facilities in Cherry Valley to many parts of the Region. Residents of Slovan, Atlasburg and Burgettstown could access the Cherry Valley Facilities using bike and pedestrian paths.
The Hillman State Park and the State gamelands in Hanover Township, Smith Township and Jefferson Township consume more than 8,500 acres. All of this property is reserved for hunting and hiking. Some mining and forestry are activities are authorized by the State and are also associated with this property.
36
National Standards for Recreation Facilities The National Recreation and Park Association (NRPA) establishes standards for various types of recreational facilities.
Regional Park: The recommended acreage is 20 acres per 1,000 population served and the recommended minimum size for the park is 250 acres. The service area for a regional park is one (1) hour driving distance.
Communi@ Park: The Recommended acreage is 5 acres per 1,000 population and the recommended size for the park is 25-100 acres. The service area for a community park is 0.5 miles to 3 miles and the population served is 10,000 to 50,000 persons.
Neighborhood Park: The Recommended acreage is 5 acres per 1,000 population. The recommended size for a Neighborhood Park is 5-20 acres. The service area is 0.25 miles to 0.5 miles.
Rwional Parks: Within, and outside of the Region, there are several large tracts of public land that serve as regional parks. There is almost 8,500 acres of State Gamelands in Hanover and Smith Townships that serve some of the need for outdoor recreation. The gamelands do not provide sports courts or fields or playground facilities.
Regionally some of these sports and playground facilities needs are served by Raccoon State Park located just north of the region in neighboring Beaver County. Raccoon State Park also provides some water recreation and walking and hiking trails.
The Pan Handle Trail, when complete, would be a Regional asset and would qualify as a Regional Park.
Meadowcroft Village is also a regional recreational facility.
Communi@ Parks: None of the communities in the Region have a population great enough to warrant a community park Collectively the four (4) have a total 2000 population of just over 10,000 persons, a population that would warrant a community park of about 50 acres.
In terms of a developed community park Hanover Township has a park that is 13 acres in area and developed with playground equipment and ball fields. This park meets the NRPA standards in both size and location for the Hanover Township residents.
Smith Township has provided some “community” park facilities at the Township building in Cherry Valley. This park is not of an adequate size or location to serve all the residents of Smith Township.
The need for a “community” type park is being met to some degree by privately owned and operated facilities like the Langloth Community Center and Weirton Baseball Association Ball Fields.
37
I I I I I I I I I I I I I I I I I I I
I I I I I I I I I I I I I I 1 I I I I
The undeveloped acreage in Jefferson Township, identified as #8 on the Raccoon Valley Regional Recreational Facilities map could be developed to meet some of the community park needs.
Neighborhood Parks: In Smith Township there are parks in Cherry Valley, Slovan and Francis Mine that serve these pockets of populations. These parks are small in area but are developed with playground equipment and sport courts.
Overall the Region is in need of a Community Park that would serve the population of the entire Region. There is a large amount of land reserved for public use but very little of it is developed for recreational use. Much of the ball field space is privately owned and is not always maintained to an expectable level.
38
I RACCOON VALLEY REGIONAL RECREATION FACILITIES
Pennsylvania Game Com m ission Hanover Township t
Map # I Owned Bv 1
2
Commonwealth of Pen nsy Ivan ia Pennsytvania Game Commission
8
9
10
5 I Privately Owned
Jefferson Township 150 Acres Jefferson Undeveloped
Privately Owned Unknown Langloth Meeting hall, ball field Township
Community Center
Smith Township Estimated Slovan Pavilion, basketball Court a t 1 Acre
Burgettstown Area
Smith Township
Acres 1,352
4,250
2,874
13
Unknown
Unknown
Estimated at 1 Acre
Location Ha nove r Towns h iD
Ha nove r Township Smith Towns h ip Steu benville Pike, Ha n ove r Ha n ove r Township Smith Township Francis Mine
~~
Description Hillman State Park, unimproved State Game Lands #117
State Game Lands #117
Community park, ball field, 3 pavilions, tennis court, playground equipment Weirton Baseball Association Ball Fields Baseball Field and indoor Gym Space Pavilion, basketball court
11 I Washington
Smith Township
13 I Privately Owned :: 1 L;;;;I;.i;Game Commission
Museum of Rural Life
Linear
Estimated at 5 Acres 2
Unknown
Unknown
Pan hand le Trail Cherry Valley Smith TownshiD Jefferson Township Jefferson Township
39
Undeveloped rails-to-trails
PIayg rou nd equipment, ball Fields. tennis court Verelst Youth Park, Ballfields
State Game lands #303
Meadowcroft Village and Rockshelf
I 1 I I I I I I I I I I I I I I I I I
I I I I I I 1 1 I I 1 I I I I 1 I 1 I
FINDINGS AND CONCLUSIONS - COMMUNITY FACILITIES AND SERVICES The following findings and conclusions from communities and facilities data are relevant the plan recommendations:
Burgettstown Borough Police protection in the Borough costs $62.38 per person in 1999, the most of any community in the Region except for Hanover Township. This cost is twice the cost in Smith Township, thirty (30) times the cost in Jefferson Township and cannot be compared to Hanover Township because of the cost incurred by Hanover Township for police protection at the amphitheater.
The Borough building and supporting structures are in relatively good condition and accommodate Borough functions.
Fire fighting response is compromised by a shortage of available qualified personnel.
The Borough spends approximately $10,000 per mile to maintain roads in the Borough.
Road maintenance costs three (3) to five (5) times the amount spent in other communities in the Region.
The only library and only senior center in the Region are located in the Borough.
There are no public recreation facilities in the Borough.
Public sewer and water is available to almost every resident of the Borough.
Han over Township Police protection is the highest cost incurred by Hanover Township because of the amphitheater.
Hanover Township has budgeted for a part time fire fighter to address concerns about inadequate daytime fire alarm response.
Hanover Township has formed a committee to study the location, timing and cost of a new Township Building.
Hanover Township does not participate in any cooperative efforts to share public works equipment or manpower.
The Township provides one of the two most complete parks, in terms of facilities but still small in area, in the Region.
About one third of Hanover Township is consumed by the Hillman State Park and state gamelands.
40
Jefferson Township
Public sewers will soon be available to the residents of Paris and Florence.
Jefferson Township spent $1.45 per person in 1999 on Police Protection.
Police protection on selected issues was a concern expressed by residents at the July, 2000 public meeting.
In the 1998 survey of Jefferson Township residents, public water was ranked second in services or regulations that would most improve quality of life in the Township. In this same survey, public safety and fire protection tied for fifth, public sewage ranked sixth and recreation facilities ranked ninth out of thirteen (13) choices.
The Township Building and the public works department are adequate to serve the current and future populations of Jefferson Township.
Jefferson Township has a strong history including Meadowcroft Village and Rockshelf and a strong and active historic society.
Jefferson Township owns 150 acres in close proximity to the Pan Handle Trail.
Smith Township Police protection services in Smith Township is adequate, but office and holding facilities are in poor condition and inadequate.
Smith Township has located one fire truck at the Township building to serve as a second fire station. A public works employee is a fire fighter and can respond from this location.
The current Smith Township Building are inadequate and needs replaced.
The Smith Township public works department participates in a cooperative agreement with other communities to share equipment and manpower.
Smith Township provides several small parks in the villages throughout the Township and a large park at the Township Building.
There are almost 3,000 acres of state gamelands in Smith Township.
Public water and public sewer now serves a small part of Smith Township in the vicinity of Burgettstown Borough.
41
I I 1 I I I I I I 1 1 I I I I I I I 1
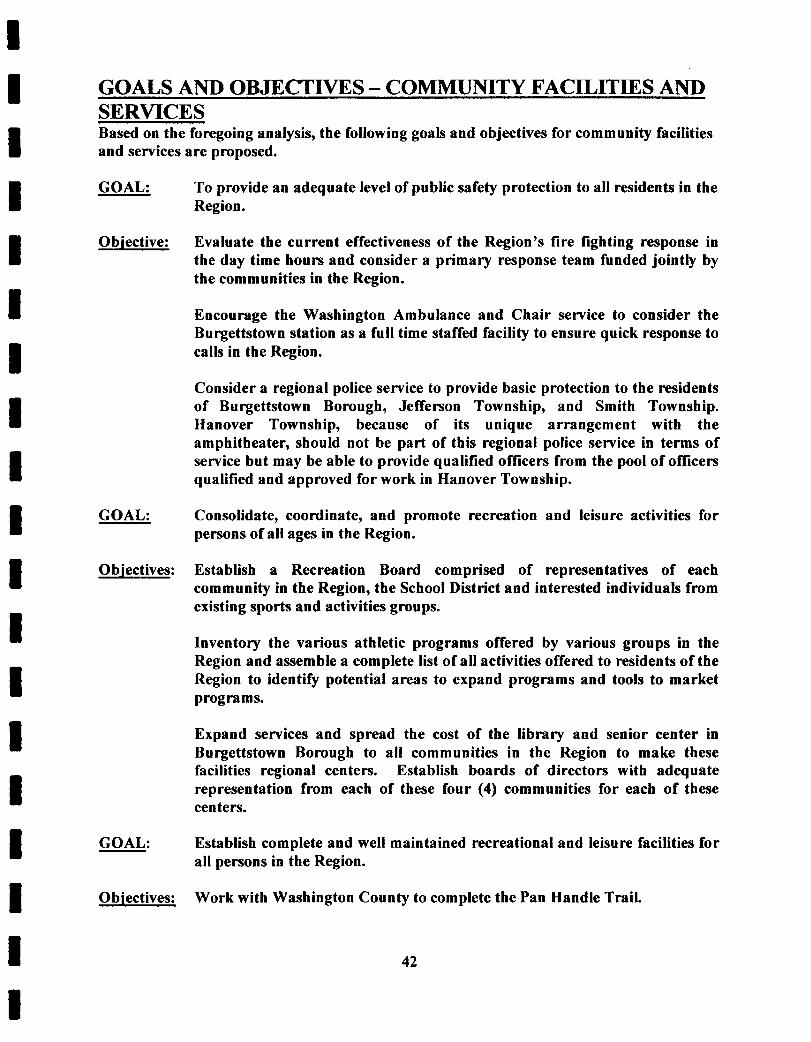
I I I I I I I 1 I II I I 11 I ‘I I I I I
GOALS AND OBJECTIVES - COMMUNITY FACILITIES AND SERVICES Based on the foregoing analysis, the following goals and objectives for community facilities and services are proposed.
GOAL: To provide an adequate level of public safety protection to all residents in the Region.
Objective: Evaluate the current effectiveness of the Region’s fire fighting response in the day time hours and consider a primary response team funded jointly by the communities in the Region.
Encourage the Washington Ambulance and Chair service to consider the Burgettstown station as a full time staffed facility to ensure quick response to calls in the Region.
Consider a regional police service to provide basic protection to the residents of Burgettstown Borough, Jefferson Township, and Smith Township. Hanover Township, because of its unique arrangement with the amphitheater, should not be part of this regional police service in terms of service but may be able to provide qualified officers from the pool of officers qualified and approved for work in Hanover Township.
GOAL: Consolidate, coordinate, and promote recreation and leisure activities for persons of all ages in the Region.
Objectives: Establish a Recreation Board comprised of representatives of each community in the Region, the School District and interested individuals from existing sports and activities groups.
Inventory the various athletic programs offered by various groups in the Region and assemble a complete list of all activities offered to residents of the Region to identify potential areas to expand programs and tools to market programs.
Expand services and spread the cost of the library and senior center in Burgettstown Borough to all communities in the Region to make these facilities regional centers. Establish boards of directors with adequate representation from each of these four (4) communities for each of these centers.
GOAL: Establish complete and well maintained recreational and leisure facilities for all persons in the Region.
Objectives: Work with Washington County to complete the Pan Handle Trail.
42
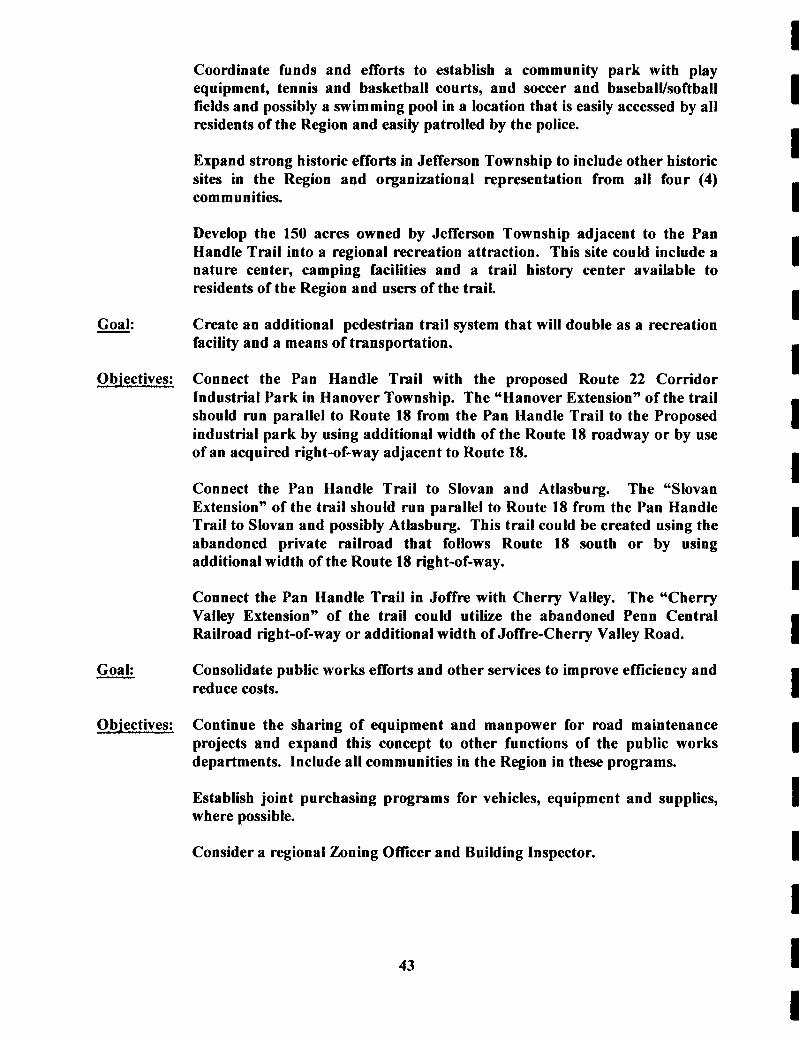
Coordinate funds and efforts to establish a community park with play equipment, tennis and basketball courts, and soccer and basebalVsoftball fields and possibly a swimming pool in a location that is easily accessed by all residents of the Region and easily patrolled by the police.
Expand strong historic efforts in Jefferson Township to include other historic sites in the Region and organizational representation from all four (4) corn m u nit its.
Develop the 150 acres owned by Jefferson Township adjacent to the Pan Handle Trail into a regional recreation attraction. This site could include a nature center, camping facilities and a trail history center available to residents of the Region and users of the trail.
- Goal: Create an additional pedestrian trail system that will double as a recreation facility and a means of transportation.
Objectives: Connect the Pan Handle Trail with the proposed Route 22 Corridor Industrial Park in Hanover Township. The “Hanover Extension” of the trail should run parallel to Route 18 from the Pan Handle Trail to the Proposed industrial park by using additional width of the Route 18 roadway or by use of an acquired right-of-way adjacent to Route 18.
Connect the Pan Handle Trail to Slovan and Atlasburg. The “Slovan Extension” of the trail should run parallel to Route 18 from the Pan Handle Trail to Slovan and possibly Atlasburg. This trail could be created using the abandoned private railroad that follows Route 18 south or by using additional width of the Route 18 right-of-way.
Connect the Pan Handle Trail in Joffre with Cherry Valley. The “Cherry Valley Extension” of the trail could utilize the abandoned Penn Central Railroad right-of-way or additional width of Joffre-Cherry Valley Road.
- Goal: Consolidate public works efforts and other services to improve efficiency and reduce costs.
Objectives: Continue the sharing of equipment and manpower for road maintenance projects and expand this concept to other functions of the public works departments. Include all communities in the Region in these programs.
Establish joint purchasing programs for vehicles, equipment and supplies, where possible.
Consider a regional Zoning Officer and Building Inspector.
43
I I 1 I I I 1 I I I I I 1 I I 1 1 I I
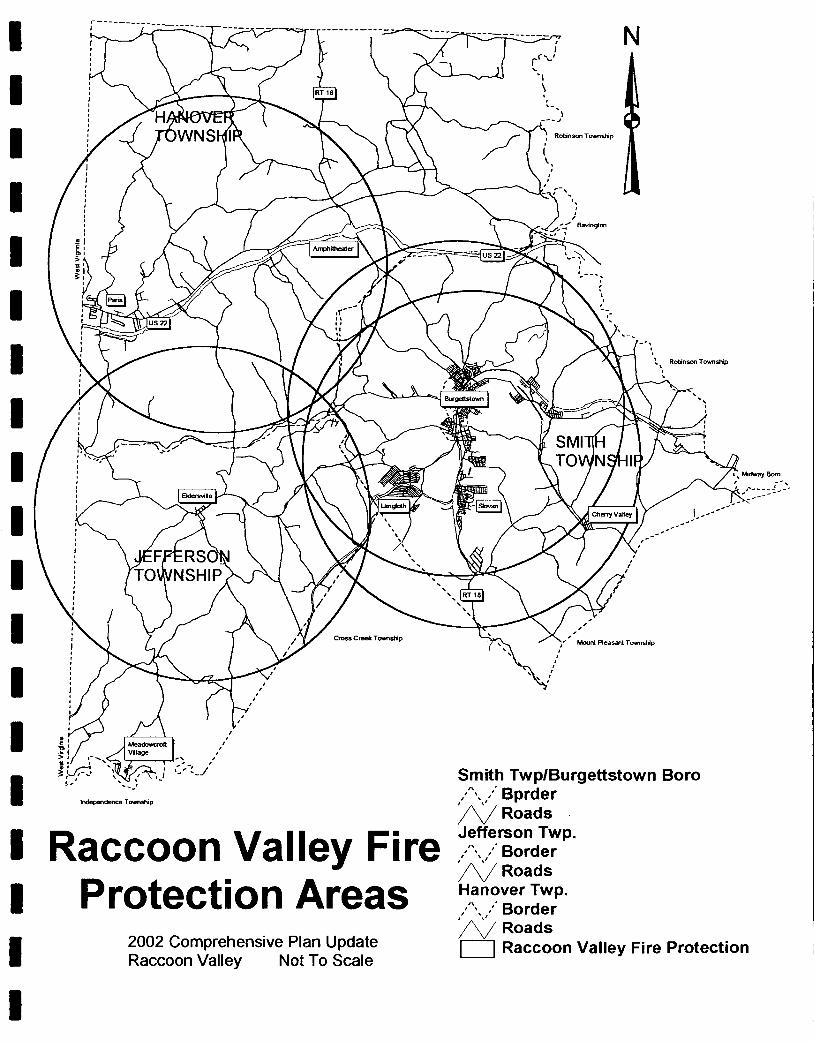
I Raccoon Valley Fire %EF2yp. ‘fi Roads I 1 Protection Areas ,%’Border Hanover Twp.
2002 Comprehensive Plan Update I Raccoon Valley Not To Scale
Roads T I Raccoon Valley Fire Protection
I
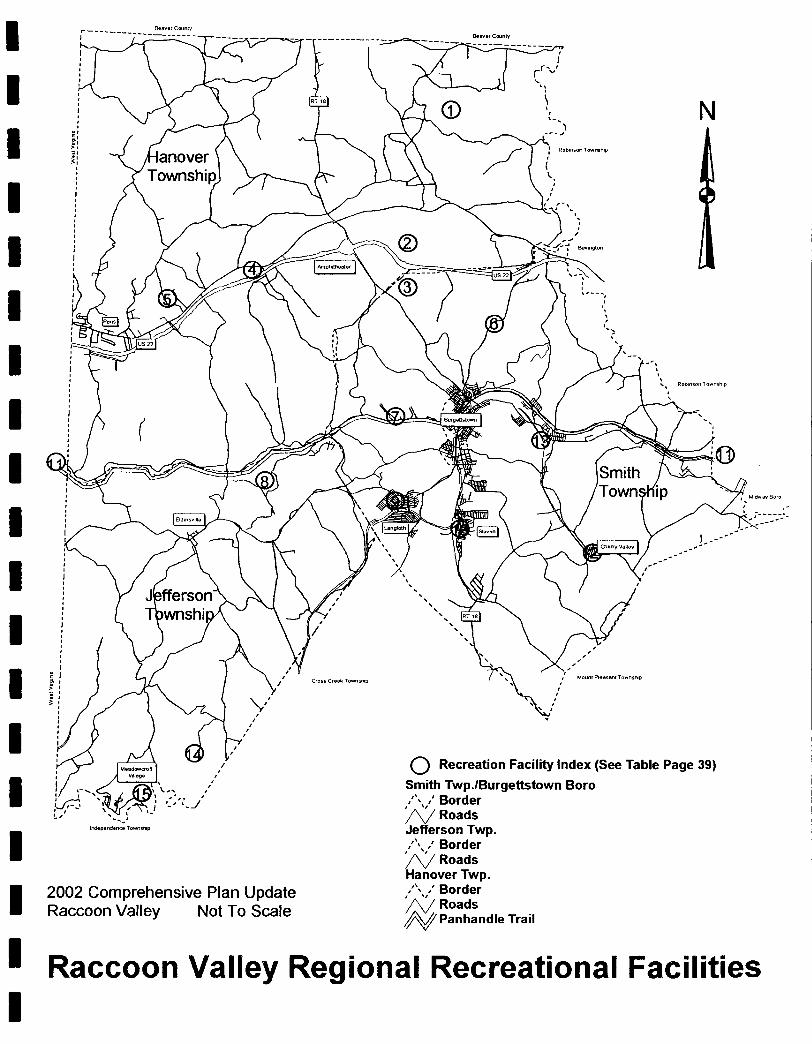
I I I I I I i I ,I i I I 1 I I I I I
d ,I7
2002 Comprehensive Plan Update Raccoon Valley Not To Scale
0 Recreation Facility Index (See Table Page 39)
Smith Twp./Burgettstown Boro ,''x ,' Border 'm Roads Jefferson Twp.
,' Border '& Roads Hanover Twp. ,"\ ,' Border
$$ E:;findle frail
Raccoon Valley Regional Recreational Facilities
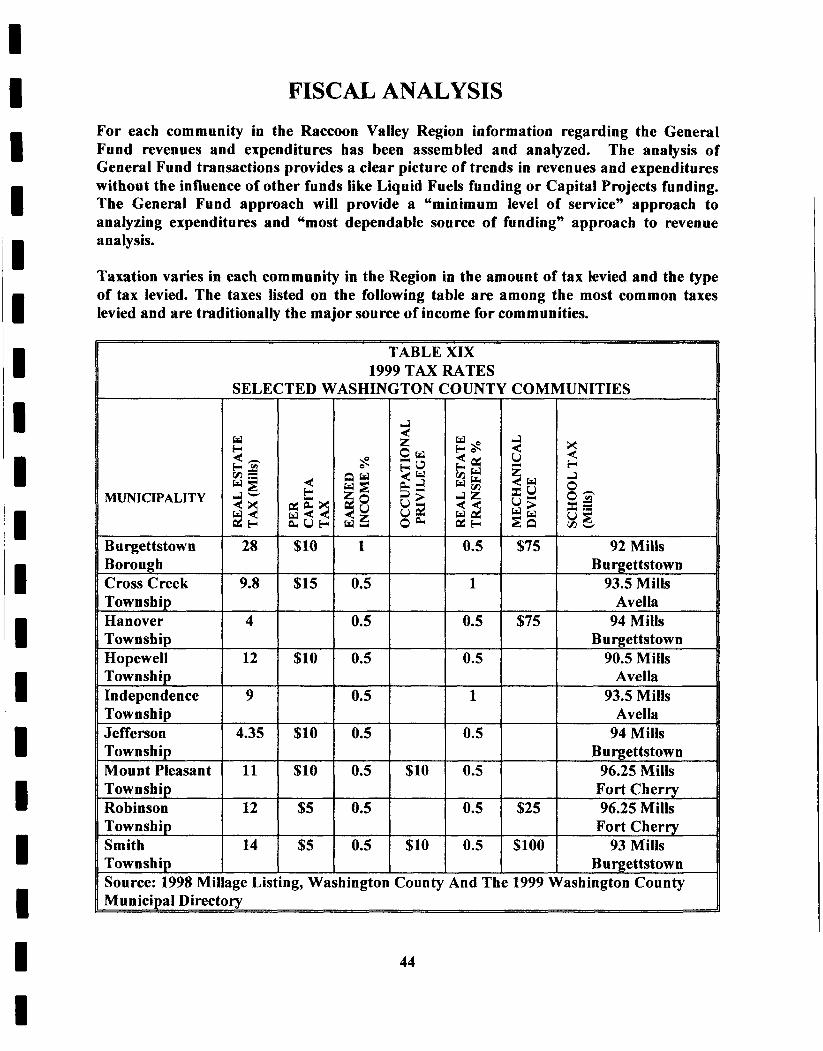
Hanover Township Hopewell Township Independence Townshit)
4
12
9
0.5
0.5
1
$75 94 Mills Burgettstown
90.5 Mills Avella
93.5 Mills Avella
0.5
0.5
0.5
94 Mills B u rgetts t ow n
96.25 Mills Fort Cherry
$25 96.25 Mills Fort Cherrv
FISCAL ANALYSIS For each community in the Raccoon Valley Region information regarding the General Fund revenues and expenditures has been assembled and analyzed. The analysis of General Fund transactions provides a clear picture of trends in revenues and expenditures without the influence of other funds like Liquid Fuels funding or Capital Projects funding. The General Fund approach will provide a “minimum level of service” approach to analyzing expenditures and “most dependable source of funding” approach to revenue analysis.
Taxation varies in each community in the Region in the amount of tax levied and the type of tax levied. The taxes listed on the following table are among the most common taxes levied and are traditionally the major source of income for communities.
TABLE XIX 1999 TAX RATES
SELECTED WASHINGTON COUNTY COMMUNITIES I I 1
MUNICIPALITY
Burgettstown I 28 $10
$15
1
0.5 Tow nsh iD I Avella
0.5
$10 0.5
0.5
I 4.35 Jefferson Township
0.5 $10
$10
$5
Mount Pleasant Townshi Robinson TownshiD
0.5
0.5
$10
$10 0.5 I $100 I 93 Mills 0.5 I I Burgettstown
Source: 1998 Millage Lis MuniciDal Directorv
4
44
Two tables have been developed for each community. The first, the Annual Audit, Revenue, displays revenue from various tax sources, licenses and permits, intergovernmental revenue and charges for services. Tax revenue is described in the table as to its source and type. The following is a description of each revenue source as described by the Annual Audit and Financial Report required by the Commonwealth of Pennsylvania.
- Taxes. Includes all taxes levied by the local government including penalties and interest on delinquent taxes. Licenses and Permits. Includes payment by individuals or agencies for any privilege or grant of authority from the local government, including but not limited to, building and zoning permits, parking permits and cable television fees. Intergovernmental revenue. Revenues from other governments in the form of operating grants, capital grants, entitlements, shared revenue, or payment in lieu of taxes. Charges for services. Payment for specific services performed by a municipal official or employee.
The second table for each community, Annual Audit Expenditures, includes expenditures from the general fund for basic services to the community. The following is a description of each revenue source as described by the Annual Audit and Financial Report required by the Commonwealth of Pennsylvania.
General Government. Expenditures for the legislative branch, the chief executive officer, and the top level staff in the administrative branch of the local government. Public Safety. This category is divided into three rows on the table, police protection, fire protection and zoning and planning. These three are the most common of all public safety components and account for the largest cost in this category. Sanitation. The cost of removal and disposal of waste matter. Public works, The cost of all public works functions except capital projects. Culture-Recreation. Recreation activities maintained for the benefit of resident citizens and visitors. Debt service. The interest and principal payment on general long-term debt and tax an ticipa tion notes. Miscellaneous. Expenditures that cannot be easily classified under some other category.
Each table includes the dollar figure reported in the annual audit for the category given and directly under that dollar value is that category’s percent of the total revenue or expenditures for that year.
45
I I I I I I I I I I I I I I I I I I I
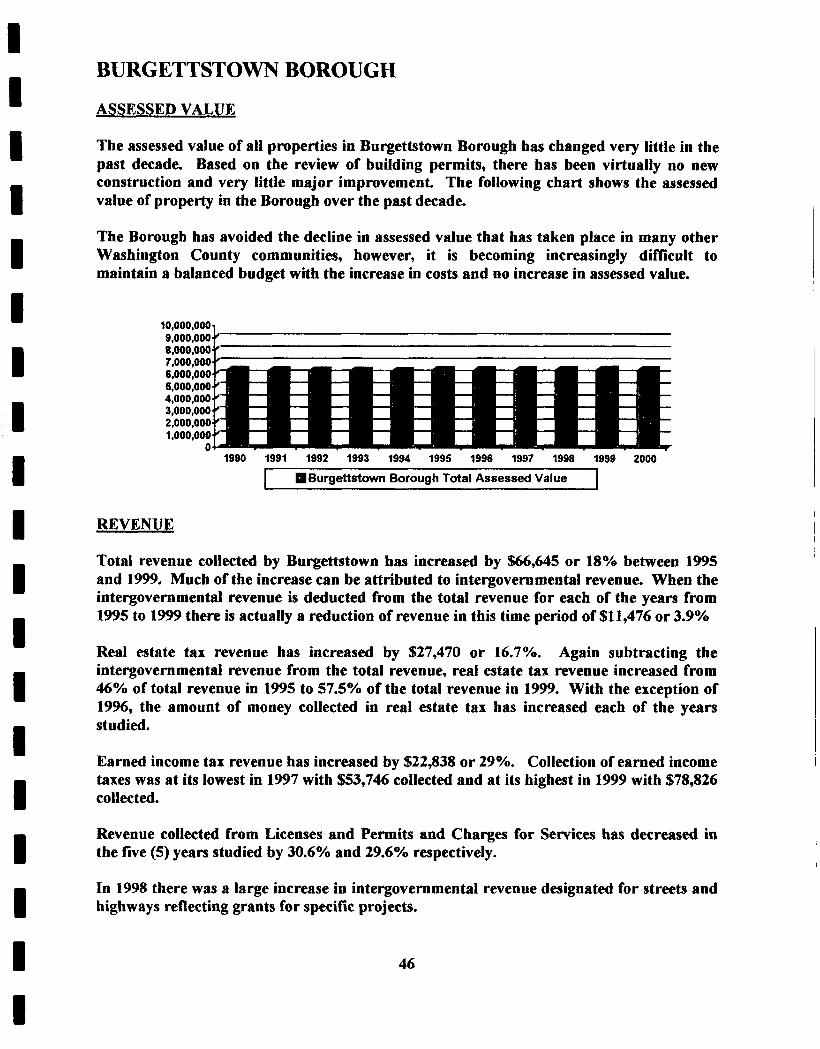
I I I I I I I I I I I I I I I I I I I
BURGETTSTOWN BOROUGH
ASSESSED VALUE
The assessed value of all properties in Burgettstown Borough has changed very little in the past decade. Based on the review of building permits, there has been virtually no new construction and very little major improvement. The following chart shows the assessed value of property in the Borough over the past decade.
The Borough has avoided the decline in assessed value that has taken place in many other Washington County communities, however, it is becoming increasingly difficult to maintain a balanced budget with the increase in costs and no increase in assessed value.
t 10,000,000 9.000,000 8.000.000 7,000;OOO 6,000,000 6,000,000 4,000,000 3,000,000 2,000.000 1,000.060
0 1990 1991 1992 1993 1994 1995 1996 1997 1998 1999 2000
c Burgettstown Borough Total Assessed Value I
REVENUE
Total revenue collected by Burgettstown has increased by $66,645 or 18% between 1995 and 1999. Much of the increase can be attributed to intergovernmental revenue. When the intergovernmental revenue is deducted from the total revenue for each of the years from 1995 to 1999 there is actually a reduction of revenue in this time period of $11,476 or 3.9%
Real estate tax revenue has increased by $27,470 or 16.7%. Again subtracting the intergovernmental revenue from the total revenue, real estate tax revenue increased from 46% of total revenue in 1995 to 57.5% of the total revenue in 1999. With the exception of 1996, the amount of money collected in real estate tax has increased each of the years studied.
Earned income tax revenue has increased by $22,838 or 29%. Collection of earned income taxes was at its lowest in 1997 with $53,746 collected and at its highest in 1999 with $78,826 collected.
Revenue collected from Licenses and Permits and Charges for Services has decreased in the five (5) years studied by 30.6% and 29.6% respectively.
In 1998 there was a large increase in intergovernmental revenue designated for streets and highways reflecting grants for specific projects.
46
EXPENDITURES
Expenditures for general government in Burgettstown have increased $13,364 or 16.8% between 1995 and 1999.
Police protection has ranged from $66,136 in 1996 to $98,321 in 1999. The average cost of police protection is $81,810 for each year in the five (5 ) years studied. Fire protection costs have also had a broad range with the least amount spent in 1995, ($5,000) and the most in 1997 with ($22,583).
The average expenditures for public works between 1995 and 1998 were $72,143. The 1999 expenditure was three and one half times the average with $255,319 spent that year. This large expenditure resulted from funding of the reconstruction of the bridge on Main Street.
The primary function of the public works department is maintenance of the Borough’s seven (7) miles of roads. The cost per mile of road maintenance between 1995 and 1998 averaged $10,306. This amount is considerable higher than the expenditures on roads for other communities in the Region because Burgettstown maintains paved roads while many of the roads in other communities are tar and chip or dirt roads.
47
I I I I I 1 I I 1 I I I I I I I I I I
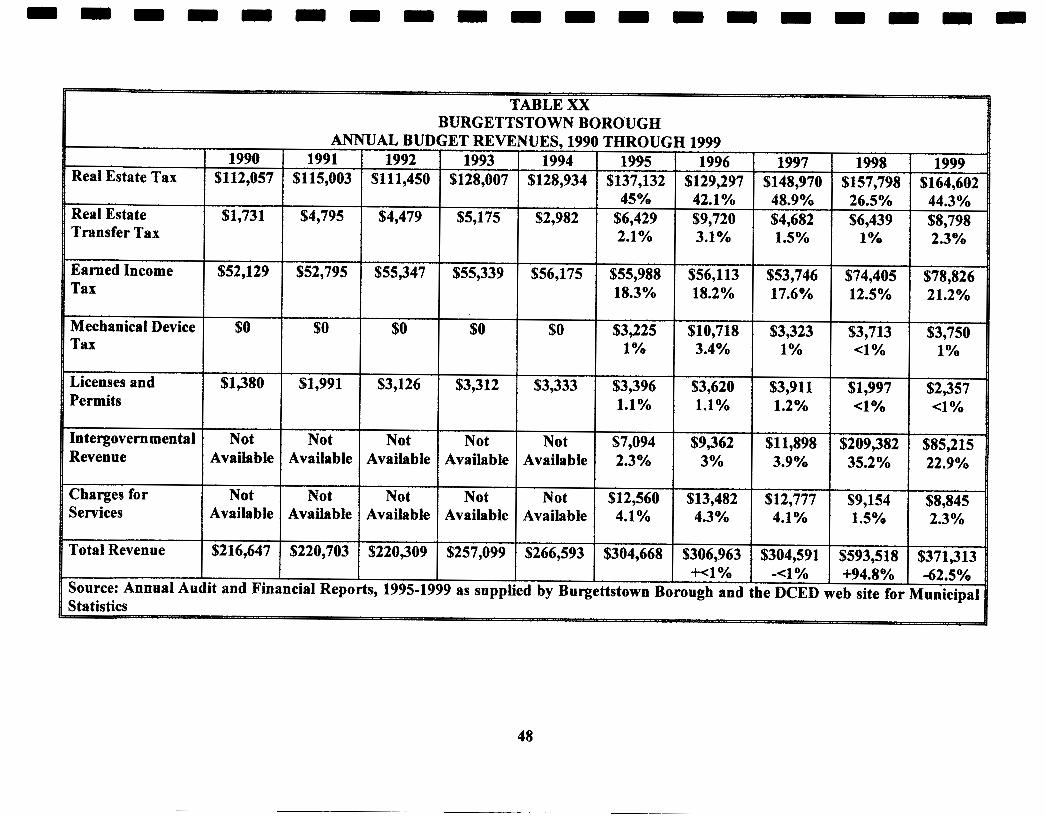
Real Estate Tax
Real Estate Transfer Tax
Earned Income Tax
Mechanical Device Tax
Licenses and Permits
Intergovernmental Revenue
Charges for Services
Total Revenue
Source: Annual Au Statistics
TABLE XX BURGETTSTOWN BOROUGH
ANNUAL BUDGET REVENUES. 1990 THROUGH 1999 1990 1991 1992 1993 1994 19% 1996
$112,057 $115,003 $111,450 $128,007 $128,934 $137,132 $129,297 45% 42.1%
$1,731 $4,795 $4,479 $5,175 $2,982 $6,429 $9,720 I 2.1% I 3.1%
$52,129 $52,795 $55,347 $55,339 $56,175 $55,988 $56,113 18.3% 18.2 Yo
$0 $0 $0 $0 $0 $3,225 $10,718
$1,380 I $1,991 I $3,126 I $3,312 I $3,333 I $3,396 I $3,620 I 1.1% I 1.1%
Not Not Not Not Not $7,094 $9,362 Available Available Available Available Available 2.3% 3 yo
Not Not Not Not Not $12,560 $13,482 Available Available Available Available Available 4.1% 4.3%
$216,647 $220,703 $220,309 $257,099 $266,593 $304,668 $306,963
lit and Financial Reports, 1995-1999 as supplied by Burgettstown Borough and +<1%
$304,591 $593,5 18 $371,3 13
the DCED web site for Municipal -4% +94.8% -62.5%
48
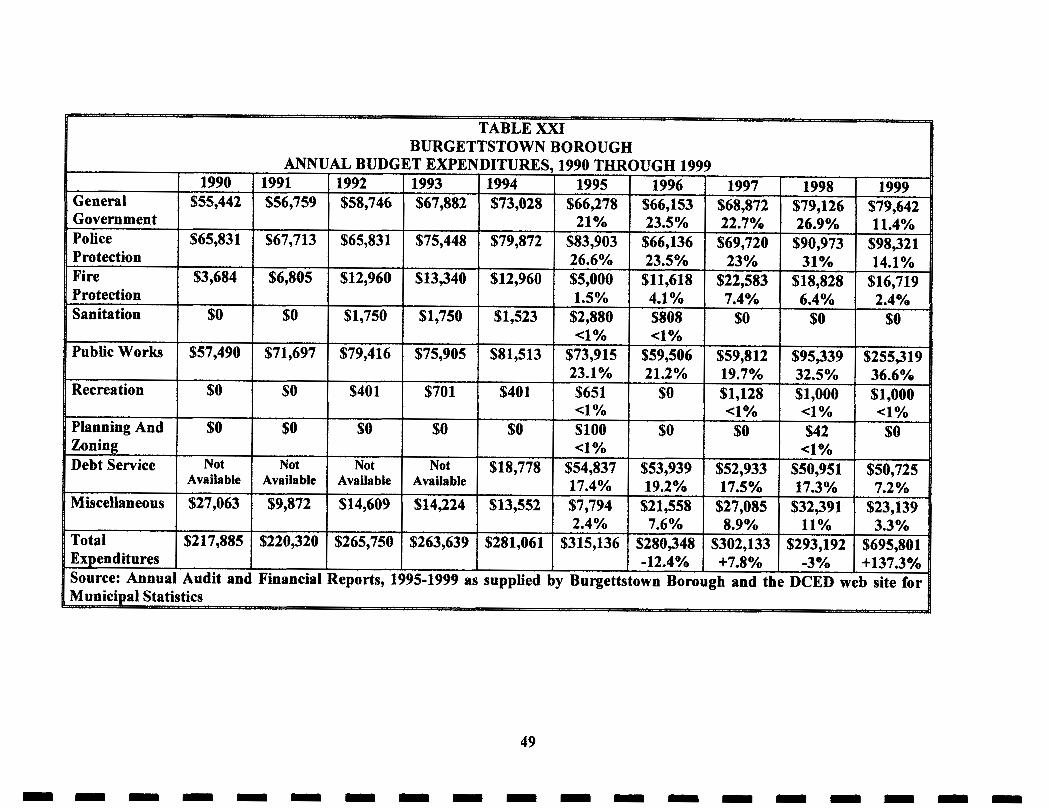
General Government Police Protection Fire Protection Sanitation
Public Works
Recreation
Planning And Zoning Debt Service
Miscellaneous
Total Expenditures Source: Annua MuniciDal Stat
ANNUAL BUDG 1990 1991 1992
$55,442 $56,759 $58,746
$65,831 $67,713 $65,831
$3,684 $6,805 $12,960
$1,750
--+%+- $40 1
$0 $0 $0
Audit and Financial Reports, 1 itics
BURGETTSTOWN BOROUGI ET EXPENDITURES, 1990 THR 1993 1994 1995 $67,882 $73,028 $66,278
21% $75,448 $79,872 $83,903
26.6% $13,340 $12,960 $5,000
23.1 Yo $701 $401 $651
Not $18,778 $54,837 Available 17.4% $14,224 $13,552 $7,794
$263,639 $281,061 $315,136
195-1999 as supplied by Burgett
2.4%
3UGH 1999 1996 I 1997 I 1998 I 1999
$66,153 I $68,872 1 $79,126 I $79,642 23.5% 22.7% 26.9% 11.4% $66,136 $69,720 $90,973 $98,321
14.1% 23.5% 23% 31% $11,618 $22,583 $18,828 $16,719 4.1% I 7.4% I 6.4% I 2.4% $808 $0 $0 $0 4 Yo
$59,506 I $59,812 $95,339 $255,319 21.2% 19.7% 32.5% 36.6%
$0 $1,128 $1,000 $1,000 4% 4 % 4 %
$0 $0 $42 $0 I 4% 1
$53,939 $52,933 $50,951 $50,725
$21,558 $27,085 $32,391 $23,139 7.6% 8.9% 11% 3.3%
$280,348 $302,133 $293,192 $695,801 -12.4% +7.8% -3% +137.3%
town Borough and the DCED web site for
19.2% 17.5% 17.3% 7.2%
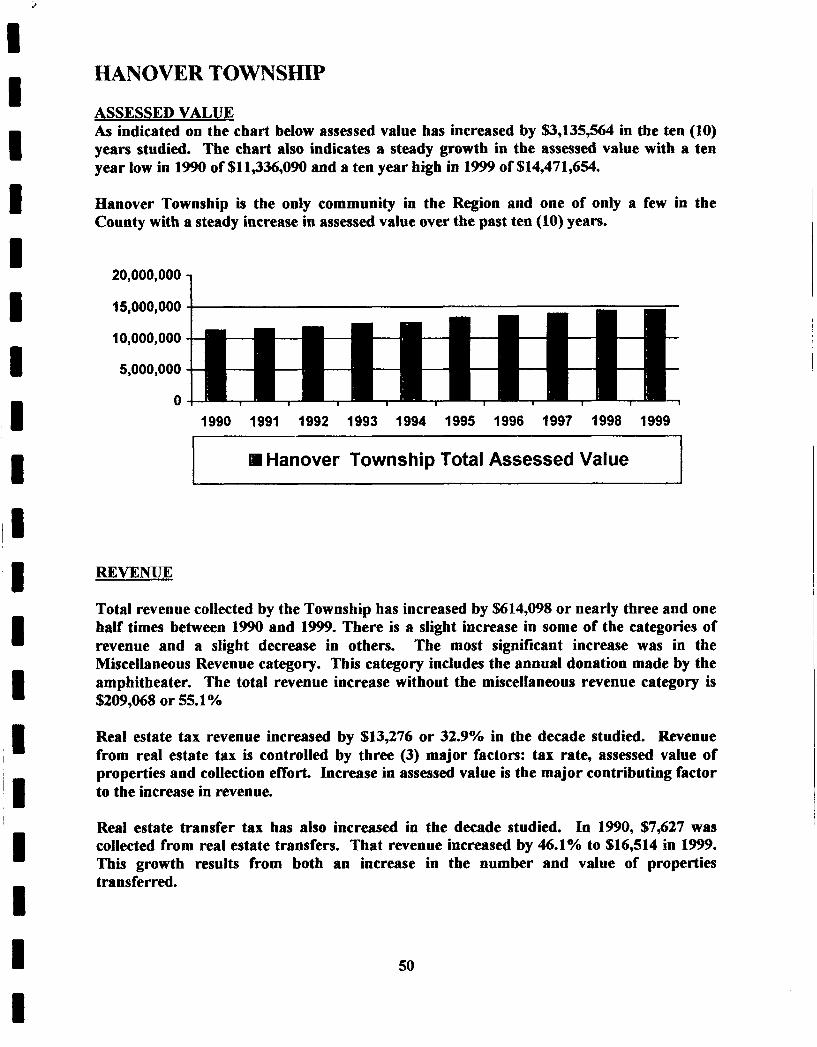
HANOVER TOWNSHIP
ASSESSED VALUE As indicated on the chart below assessed value has increased by %3,135,564 in the ten (10) years studied. The chart also indicates a steady growth in the assessed value with a ten year low in 1990 of $11,336,09O and a ten year high in 1999 of $14,471,654.
Hanover Township is the only community in the Region and one of only a few in the County with a steady increase in assessed value over the past ten (10) years.
1 20,000,000
15,000,000
10,000,000
5,000,000
0 1990 1991 1992 1993 1994 1995 1996 1997 1998 1999
Hanover Township Total Assessed Value
REVENUE
Total revenue collected by the Township has increased by $614,098 or nearly three and one half times between 1990 and 1999. There is a slight increase in some of the categories of revenue and a slight decrease in others. The most significant increase was in the Miscellaneous Revenue category. This category includes the annual donation made by the amphitheater. The total revenue increase without the miscellaneous revenue category is $209,068 or 55.1 YO
Real estate tax revenue increased by $13,276 or 32.9% in the decade studied. Revenue from real estate tax is controlled by three (3) major factors: tax rate, assessed value of properties and collection efforL Increase in assessed value is the major contributing factor to the increase in revenue.
Real estate transfer tax has also increased in the decade studied. In 1990, $7,627 was collected from real estate transfers. That revenue increased by 46.1% to $16,514 in 1999. This growth results from both an increase in the number and value of properties transferred.
50
Earned income tax has increased 18.6% from $149,813 in 1990 to $177,785 in 1999. In 1990 and 1991 earned income tax represented 58.3% and 40.8% of the total revenue respectively. In 1999 the earned income tax represented 20.4% of the total revenue.
The most significant increase in any one category of revenue is the miscellaneous revenue. The majority of revenue in this category is the donation for services made by the amphitheater. In 1992 miscellaneous revenue increased form $13,327 or 3.9% of total revenue to $148,212 or 35.8% of total revenue. In 1998 there was a significant increase in this donation. The 1997 donation was $276,081 and in 1998 it was $395,380. In 1999, at $405,300, miscellaneous revenue represented 46.5% of total revenue.
EXPENDITURES
Hanover Township total expenditures have increased almost three (3) times and grew 26.6% between 1990 and 1999. The total expenditures have increased gradually from $266,610 in 1990 to $765,135 in 1999. Total expenditures have increased proportionately with total revenues.
General government has more than doubled between 1990 and 1999 increasing from $50,688 in 1990 to $117,696 in 1999. This category averages 13.8% of the total expenditures.
Police protection has increased $200,366 from $71,932 in 1990 to $272,298 in 1999; this is a 378% increase. The expenditures for fire protection have also increased and are at a ten (10) year high of $38,098 in 1999.
Planning and zoning expenditures continue to be less than 1% of the total expenditures.
Sanitation costs were $0 until 1996 when they jumped to an average of $16,951 from 1996 to 1998 and jumped again in 1999 to $49,950.
Public works has increased by 262% from $37,231 in 1990 to $97,692 in 1999. Over the past five (5) years the Township has spent an average of $76,921 on the public works function that focuses primarily on road maintenance. With 67.68 miles of roads in the Township, the expenditure average $1,136 per mile of road maintained.
Recreation expenditures have averaged $10,078 or 1.9% of the total expenditures.
There is no debt service recorded as an expenditure for the decade studied.
51
I 1 I I 1 I I I I I I I I I 1 I I I I
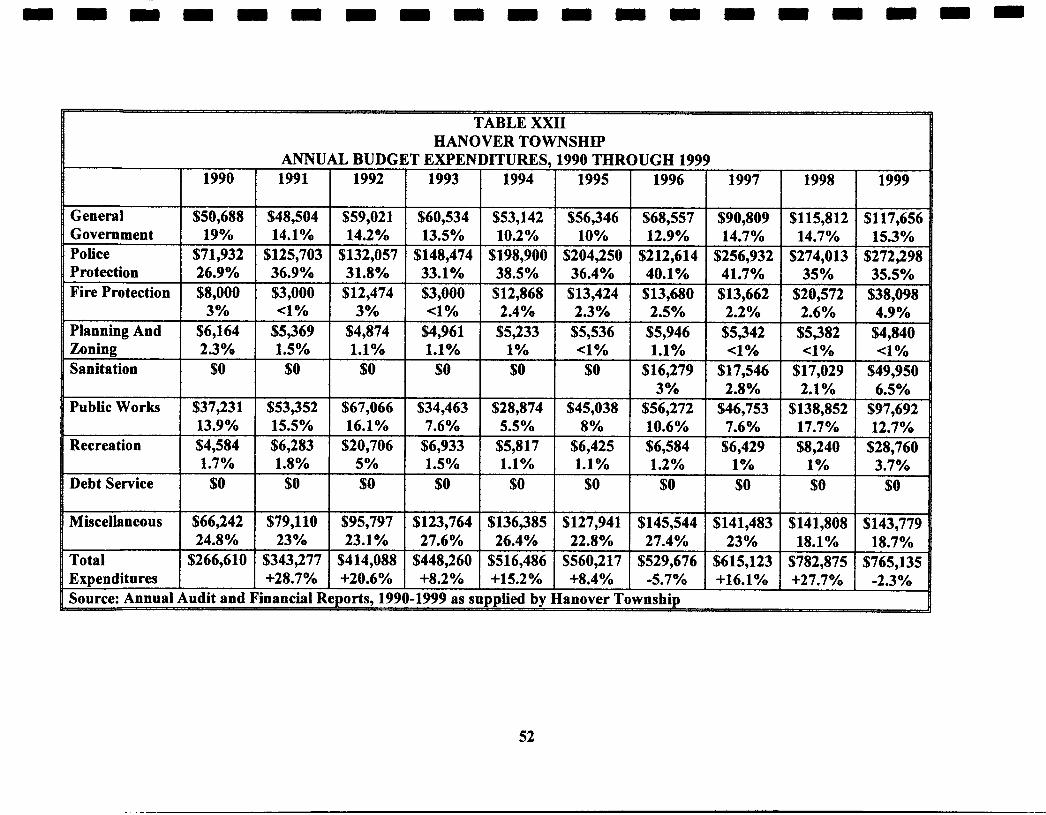
General Government
1993 1994 1995 1996
Police Protection Fire Protection
1997 1998 1999
Planning And Zoning Sanitation
12.9% $212,614 40.1% $13,680 2.5% $5,946 1.1% $16,279 3%
$56,272 10.6% $6,584 1.2 Yo
$0
Public Works
14.7% $256,932 41.7% $13,662 2.2% $5,342 4 Yo
$17,546 2.8% $46,753 7.6 Yo $6,429 1 Yo $0
Recreation
14.7% $274,013 35% $20,572 2.6% $5,382 4 Yo $17,029 2.1%
$138,852
Debt Service
153% $272,298 35.5% $38,098 4.9% $4,840 4 Yo $49,950 6.5% $97,692
Miscellaneous $123,764 $136,385 $127,941 $145,544
$448,260 $516,486 $560,217 $529,676 +8.2% +15.2% +8.4% -5.7%
27.6% 26.4% 22.8% 27.4% Total Expenditures Source: Annual
$141,483 $141,808 $143,779
$615,123 $782,875 $765,135 +16.1% +27.7% -2.3%
23% 18.1% 18.7%
ANNUAL BUDG
$50,688 $48,504 $59,021 + 19% 14.1% 14.2% $71,932 $125,703 $132,057 26.9% I 36.9% I 31.8% $8,000 $3,000 $12,474 3 yo I 4% I 3%
$6,164 $5,369 $4,874 2.3 yo I 1.5% I 1.1%
1.7% 1.8% 5% $0 $0 $0
h d i t and Financial ReDorts. 199
TABLE XXII HANOVER TOWNSHIP
1 I I I I 1
$60,534 1 $53,142 1 $56,346 I $68,557 I $90,809 I$115,812 I$117,656 13.5% 10.2% 10%
33.1% 38.5% 36.4% $3,000 $12,868 $13,424 4% 2.4% 2.3% $4,961 $5,233 $5,536 1.1% 1 Yo
$i4a,474 $198,900 $204,250
$34,463 $28,874 $45,038 7.6% I 5.5% I 8% $6,933 $5,817 $6,425 1.5% I 1.1% I 1.1%
17.7% 1 12.7% $8,240 $28,760 + 3.7%
52
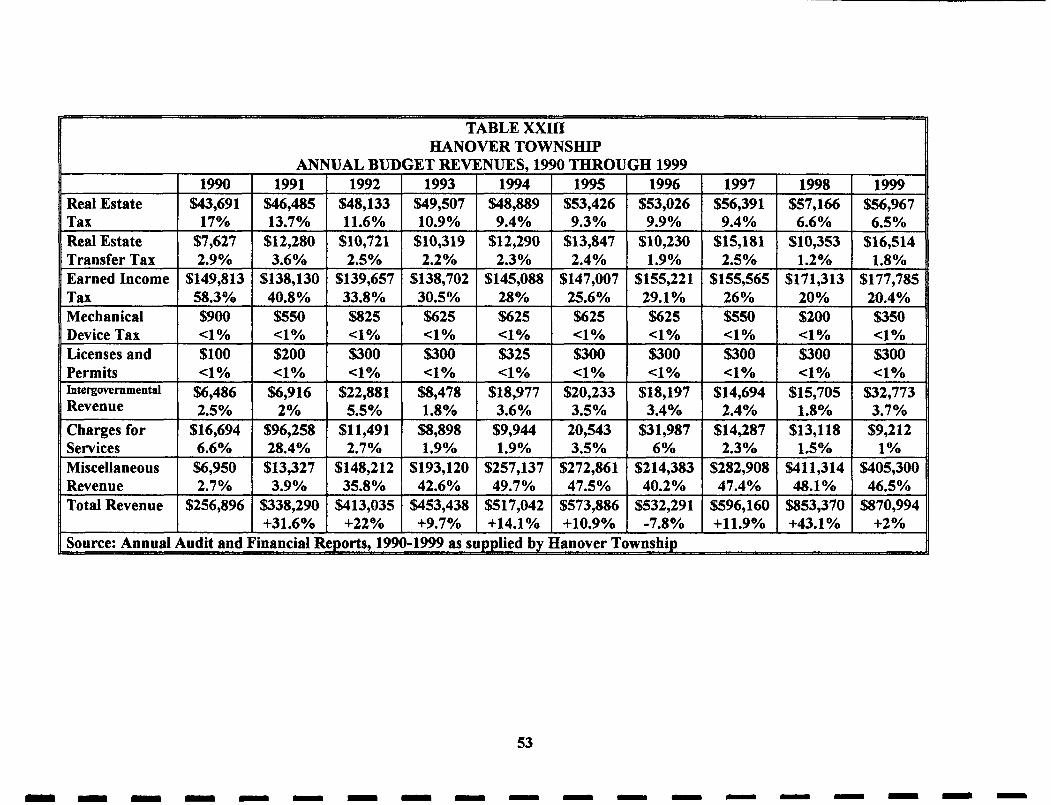
TABLE XXm HANOVER TOWNSHIP
ANNUAL BUDGET REVENUES. 1990 THROUGH 1999 1990 1991
Real Estate $43,691 $46,485 Tax I 17% I 13.7% Real Estate $7,627 $12,280 Transfer Tax 1 2.9% I 3.6% Earned Income I $149,813 I $138,130 Tax 58.3yo 40.8% Mechanical $900 $550 Device Tax Licenses and Permits
Revenue 2.5% Charges for $16,694 $96,258 Services I 6.6% 1 28.4%
Source: Annual Audit and Financial R
1992 1 1993 1 1994 1 1995 1 1996 $48,133 $49,507 $48,889 $53,426 $53,026 11.6% 10.9% 9.4% 9.3% 9.9%
$10,721 $10,319 $12,290 $13,847 $10,230 2.5% 2.2% 2.3% 2.4% 1.9%
$139,657 $138,702 $145,088 $147,007 $155,221 33.8% 30.5% 28 YO 25.6% 29.1 Yo $825 $625 $625 $625 $625 4 T o e1 Yo 4 Yo <1 Yo 4 Yo $300 $300 $325 $300 $300 <1 Yo <1 Yo 4 Yo 4 Yo <1 Yo
$22,881 %8,478 $18,977 $20,233 $18,197 5.5% 1.8YO 3.6% 3.5% 3.4%
$11,491 I $8,898 I $9,944 I 20,543 I $31,987 2.7% 1.9% 1.9% 3.5% 6 Yo
$148,212 $193,120 $257,137 $272,861 $214,383 35.8% 42.6% 49.7% 47.5% 40.2%
$413,035 $453,438 $517,042 $573,886 $532,291 +22% I +9.7% I +14.1% 1 -t10.9% I -7.8%
E D O ~ ~ S . 1990-1999 as sundied bv Hanover Townshin
53
1997 1998 1999 $56,391 %57,166 $56,967
2.5% 1.8% $1 55,565 $17 1,313 $1 77,785
26% 20% 20.4% $550 $200 $350 4 Yo <1 Yo 4 Yo !DO0 $300 $300 4 % 4 Yo 4 To
$14,694 $15,705 $32,773 2.4% 1.8% 3.7%
$14,287 $13,118 $9,212 2.3% I 1.5% I 1%
+11.9% I +43.1% I +2%
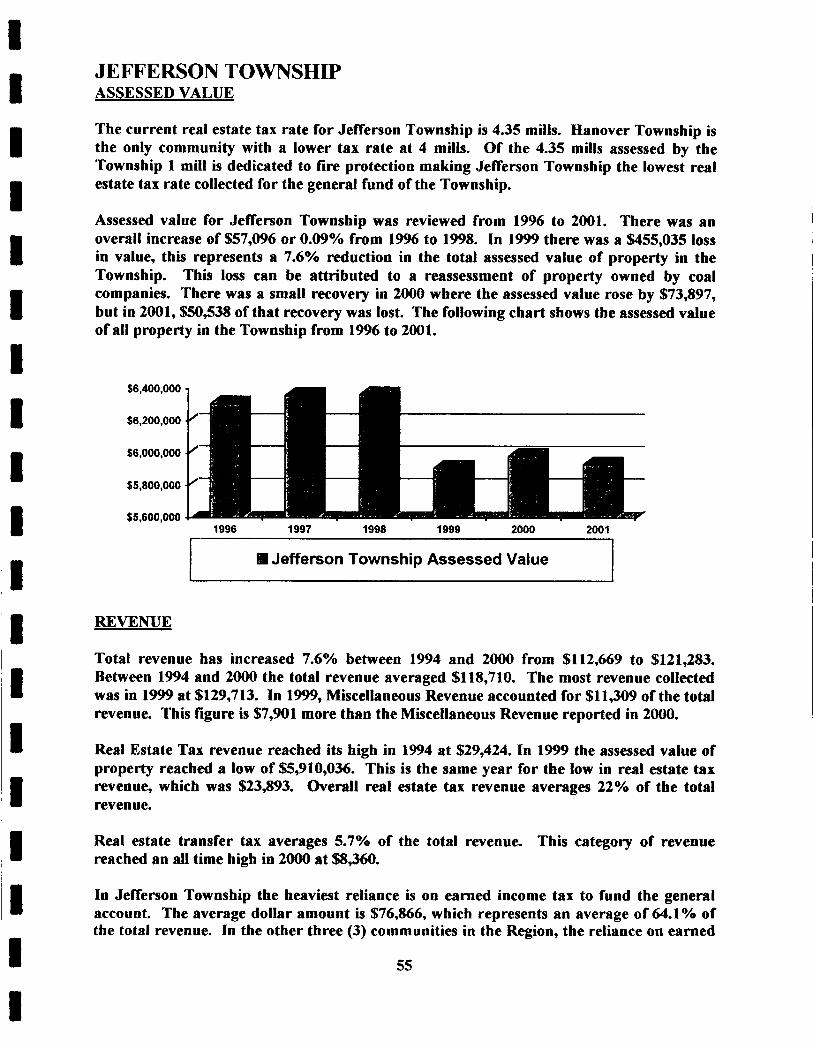
‘I I I I I I I I I I I
JEFFERSON TOWNSHIP ASSESSED VALUE
The current real estate tax rate for Jefferson Township is 4.35 mills. Hanover Township is the only community with a lower tax rate at 4 mills. Of the 4.35 mills assessed by the Township 1 mill is dedicated to fire protection making Jefferson Township the lowest real estate tax rate collected for the general fund of the Township.
Assessed value for Jefferson Township was reviewed from 1996 to 2001. There was an overall increase of %57,096 or 0.09% from 1996 to 1998. In 1999 there was a $455,035 loss in value, this represents a 7.6% reduction in the total assessed value of property in the Township. This loss can be attributed to a reassessment of property owned by coal companies. There was a small recovery in 2000 where the assessed value rose by $73,897, but in 2001, $50,538 of that recovery was lost. The following chart shows the assessed value of all property in the Township from 1996 to 2001.
$6,400,000
$6,200,000
$6,000,000
$5,800,000
$5,600,000 1996 1997 1998 1999 2000 2001
H Jefferson Township Assessed Value
REVENUE
Total revenue has increased 7.6% between 1994 and 2000 from $112,669 to $121,283. Between 1994 and 2000 the total revenue averaged $118,710. The most revenue collected was in 1999 at $129,713. In 1999, Miscellaneous Revenue accounted for $11,309 of the total revenue. This figure is $7,901 more than the Miscellaneous Revenue reported in 2000.
Real Estate Tax revenue reached its high in 1994 at $29,424. In 1999 the assessed value of property reached a low of $5,910,036. This is the same year for the low in real estate tax revenue, which was $23,893. Overall real estate tax revenue averages 22% of the total revenue.
Real estate transfer tax averages 5.7% of the total revenue. This category of revenue reached an all time high in 2000 at $8,360.
In Jefferson Township the heaviest reliance is on earned income tax to fund the general account. The average dollar amount is $76,866, which represents an average of 64.1% of the total revenue. In the other three (3) communities in the Region, the reliance on earned
55
income tax is less significant. For Burgettstown an average of 17% of the total revenue is from earned income tax, in Smith it is 33% and in Hanover it is 31%.
Each category, occupation tax, licenses and permits, intergovernmental revenue and interest, rents and royalties make up less than 1% of the total revenue for the Township.
Miscellaneous revenue has fluctuated tbe most of any of the categories of revenue. In 1996 it reached a high of $12,142 and in 2000 was reported at a low of $3,408.
EXPENDITURES
Total expenditures for Jefferson Township have increased from $102,039 in 1994 to $124,501 in 2000. Total expenditures reached an all time high in 1999 at $161,119. There seems to be no particular reason for this unusually high year. It appears that each category was slightly higher and the cumulative effect was a higher total expenditure.
General government consumes the greatest part of the Township’s expenditures. This category represents an average of 64.25% of the total expenditures of the Township. The other communities in the Region spend much less in terms of the percentage of total expenditures on general government. Burgettstown spends 21.1%, Smith spends 14.34% and Hanover spends 13.86% of their total expenditures on general government.
There are no expenditures from the general fund for fire protection. Fire protection in the Township is funded by one mill of the 4.35 mills of real estate tax levied and distributed directly to the fire department.
Between 1997 and 2000 an average of $2,055 has been spent on police protection. represents an average of 1.4% of the total expenditures for those years.
This
Public works averaged 22.85% of the total expenditures of the Township between 1995 and 2000.
Debt service expenditures have been virtually non-existent since 1994. In 1997, $2,850 was expended in this category and in 1999, $1,140 was expended. In the remaining years studied there were no expenditures.
56
1 I 1 1 I I I I 1 I I I I I 1 I I 1 1
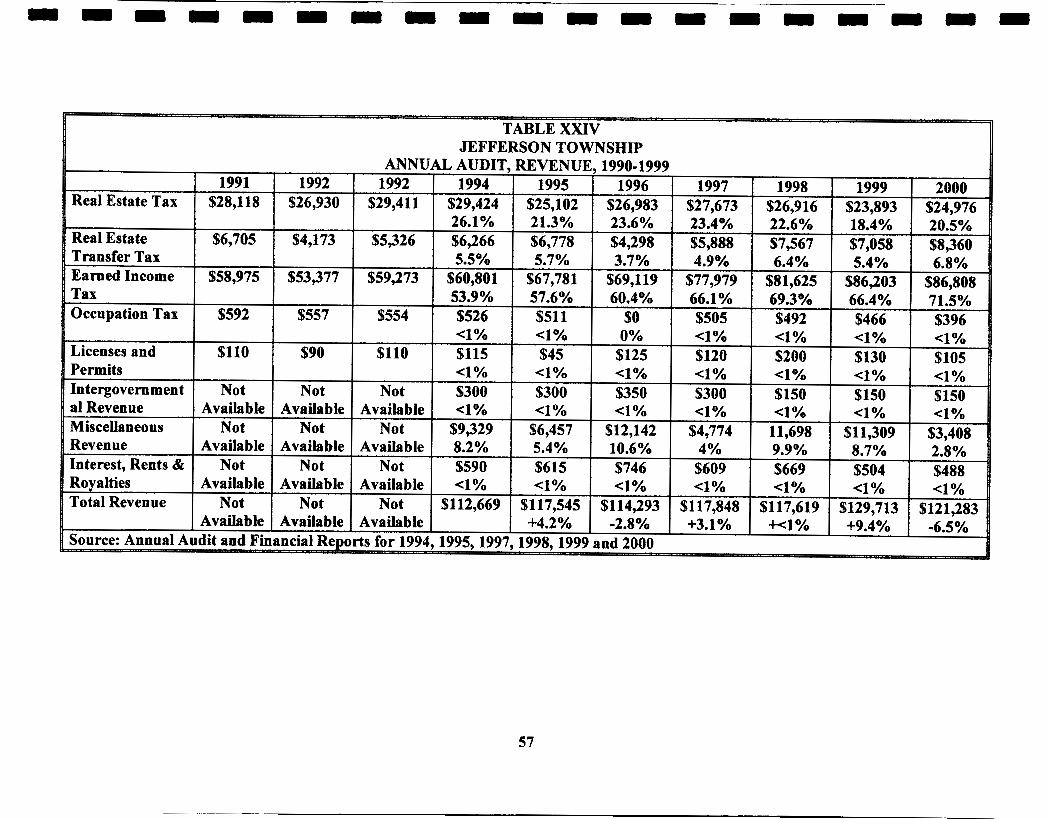
JEFFERSON TOWNSHIP
1991 1992 1992 1994 1995 1996 1997 1998 1999 ANNUAL AUDIT, REVENUE, 1990-1999
Real Estate Tax $28,118 $26,930 $29,411 $29,424 $25,102 $26,983 $27,673 $26,916 $23,893 26.1 Yo 21.3% 23.6% 23.4% 22.6% 18.4%
Real Estate $6,705 $4,173 $5,326 $6,266 $6,778 $4,298 $5,888 $7,567 $7,058 Transfer Tax 5.5% 5.7% 3.7% 4.9% 6.4% 5.4% Earned Income $58,975 $53,377 $59,273 $60,801 $67,781 $69,119 $77,979 $81,625 $86,203
66.4% Tax 53.9% 57.6% 60.4% 66.1% 69.3% Occupation Tax $592 $557 $554 $526 $51 1 $0 $505 $492 $466
-4% 4% 0 Yo <1 Yo 4% 4 % Licenses and $110 $90 $110 $115 $45 $125 $120 $200 $130 Permits <1 Yo 4% 4 % 4 Yo 4 % 4 % Intergovern men t Not Not Not $300 $300 $350 $300 $150 $150 a1 Revenue Available Available Available 4% 4% 4% 4 % <1% 4 Ye Miscellaneous Not Not Not $9,329 $6,457 $12,142 $4,774 11,698 $1 1,309 Revenue Available AvaiIable Available 8.2% 5.4% 10.6% 4% 9.9% 8.7% Interest, Rents & Not Not Not $590 $615 $746 $609 $669 $504
Total Revenue Not Not Not $112,669 $117,545 $114,293 $117,848 $117,619 $129,713 Royalties Available Available Available 4% 4% 4% 4 % -4% <1 Yo
Available Available Available +4.2% -2.8% +3.1% -1% +9.4%
2000 $24,976 20.5% $8,360 6.8%
$86,808
$396 <1 O h
$105 4% $150 4%
$3,408 2.8% $488 4%
$12 1,283 -6.5%
57
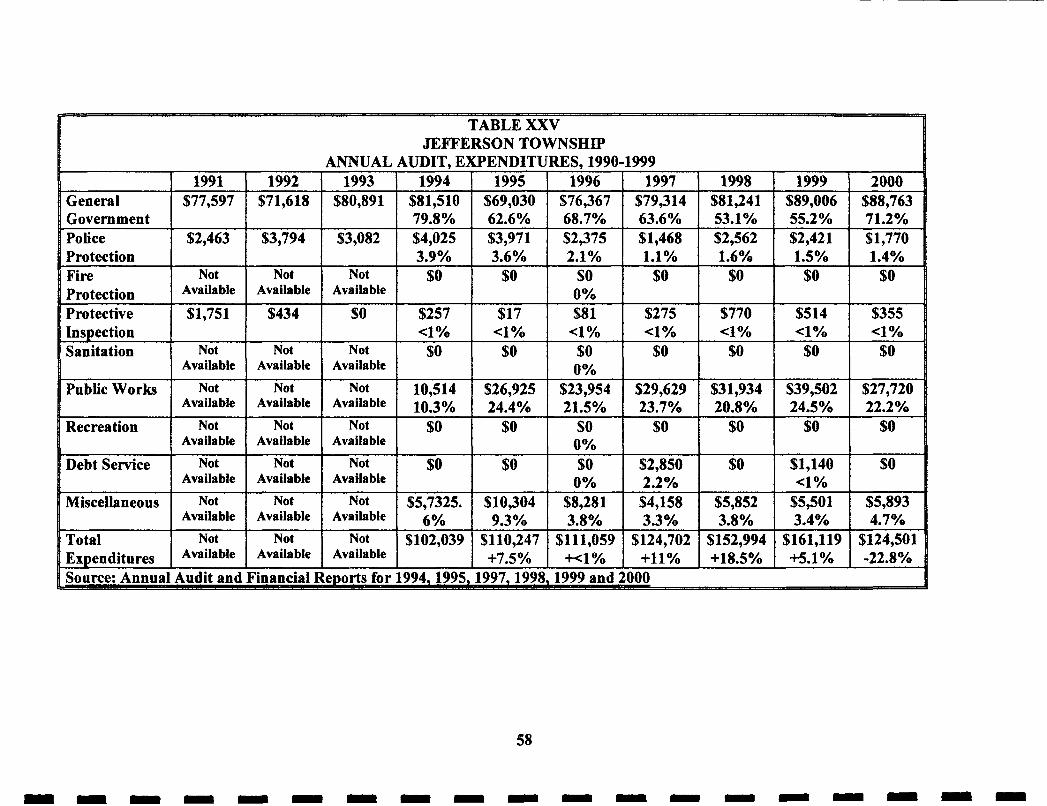
TABLE XXV JEFFERSON TOWNSHIP
ANNUAL AUDIT. EXPENDITURES. 1990-1999 1 1 1991 I 1992 I 1993 ~ 1994 General $77,597 $71,618 $80,891 $81,510 Government 79.8% Police $2,463 $3,794 $3,082 $4,025 Protection 3.9% 3.6% 2.1% 1.1% Fire Not Not Not $0 $0 $0 $0 Protection Protective $1,751 $434 $0 $257 $17 $81 $275 Inspection <1 Yo 4 Yo 4 Yo <1 Yo Sanitation Not Not Not $0 $0 $0 $0
Public Works Not Not Not 10,514 $26,925 $23,954 $29,629
Available Available 0% Available
0% Available Available Available
Available Available Available I Not 1 Not I Not Recreation
Debt Service Not Not Not Available Availabk Available
Miscellaneous Not Not Not Available Available Available
Total Not Not Not EHDenditures Available Available Available
$0
$0
$5,7325. 6 Yo
$1 02,039
$0
$0
$10,304
1 $110,247 9.3 yo
I $2,850
-1% I +11% Source: Annual Audit and Financial Reports for 1994,1995,1997,1998,1999 and 2000
c
1.6% 1.5%
<1% 4 % $ $0 SO
$0 $1,140 <1 Yo
$5,852 $5,501 3.8% 3.4%
$152,994 $161,119 +18.5% +5.1%
2000 $88,763 71.2% $1,770 1.4%
$0
$355 4 % $0
$27,720 22.2%
$0
$0
$5,893 4.7%
$12430 1 -22.8%
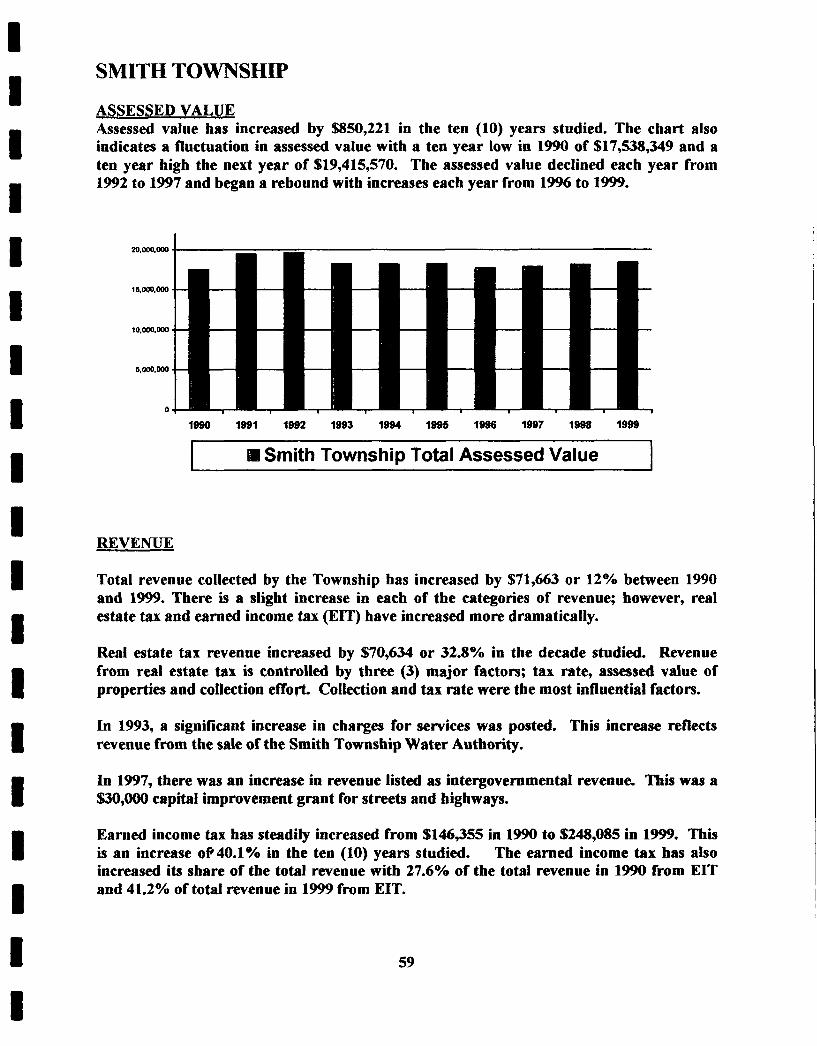
SMITH TOWNSHIP
ASSESSED VALUE Assessed value has increased by %850,221 in the ten (10) years studied. The chart also indicates a fluctuation in assessed value with a ten year low in 1990 of $17,538,349 and a ten year high the next year of $19,415,570. The assessed value declined each year from 1992 to 1997 and began a rebound with increases each year from 1996 to 1999.
1990 1991 1992 1993 1994 1996 1996 1097 1998 1999
I II Smith Township Total Assessed Value I
REVENUE
Total revenue collected by the Township has increased by $71,663 or 12% between 1990 and 1999. There is a slight increase in each of the categories of revenue; however, real estate tax and earned income tax PIT) have increased more dramatically.
Real estate tax revenue increased by $70,634 or 32.8% in the decade studied. Revenue from real estate tax is controlled by three (3) major factors; tax rate, assessed value of properties and collection effort. Collection and tax rate were the most influential factors.
In 1993, a significant increase in charges for services was posted. This increase reflects revenue from the sale of the Smith Township Water Authority.
In 1997, there was an increase in revenue listed as intergovernmental revenue. This was a %3o,OOO capital improvement grant for streets and highways.
Earned income tax bas steadily increased from $146,355 in 1990 to $248,085 in 1999. This is an increase oP40.1% in the ten (10) years studied. The earned income tax has also increased its share of the total revenue with 27.6% of the total revenue in 1990 from EIT and 41.2% of total revenue in 1999 from EIT.
59
Each of the other categories of revenue, (per capita tax, real estate transfer tax, occupation tax, mechanical tax, licenses and permits and charges for services) remain less than 2% of the total revenues.
EXPENDITURES
Total expenditures in Smith Township have increased 26.6% between 1990 and 1999. The total expenditures are erratic and do not follow any certain pattern. Expenditures increased from 1990 to 1993, dropped over 24% in 1994 and increase each year from 1995 to 1999.
General government has almost doubled between 1990 and 1999 increasing from $66,559 in 1990 to $115,142 in 1999. This category averages 14.5% of the total expenditures.
Police protection has increased $55,812 from $96,507 in 1990 to $152,319 in 1999; this is a 57.8% increase. The expenditures for fire protection have also increased, but more interesting is the fluctuation in expenditures in this category. Expenditures range from $12,240 in 1990 to $36,158 in 1998.
Public works has increased by 38.5% from $149,493 in 1990 to $243,020 in 1999. Over the past five (5) years, the Township bas spent $202,496 on the public works function that focuses primarily on road maintenance. With 47.03 miles of roads in the Township, the expenditure averages $4,305 per mile of road maintained.
There were three (3) significant changes in the expenditures for recreation. In 1993 and 1996, over $38,000 was spent on administrative services for recreation. In 1997 over $43,000 was spent to improve facilities including a pavilion in Slovan Park
Debt service has gone from as much as 13.8% of the total expenditures in 1993 to just over 4% of the total expenditures in 1999. The expenditures for debt service have been as much as $85,503 in 1993 and as little as $11,424 in 1998.
60
I 1 I 1 I 1 1 I I I I I I 1 1 1 I I I
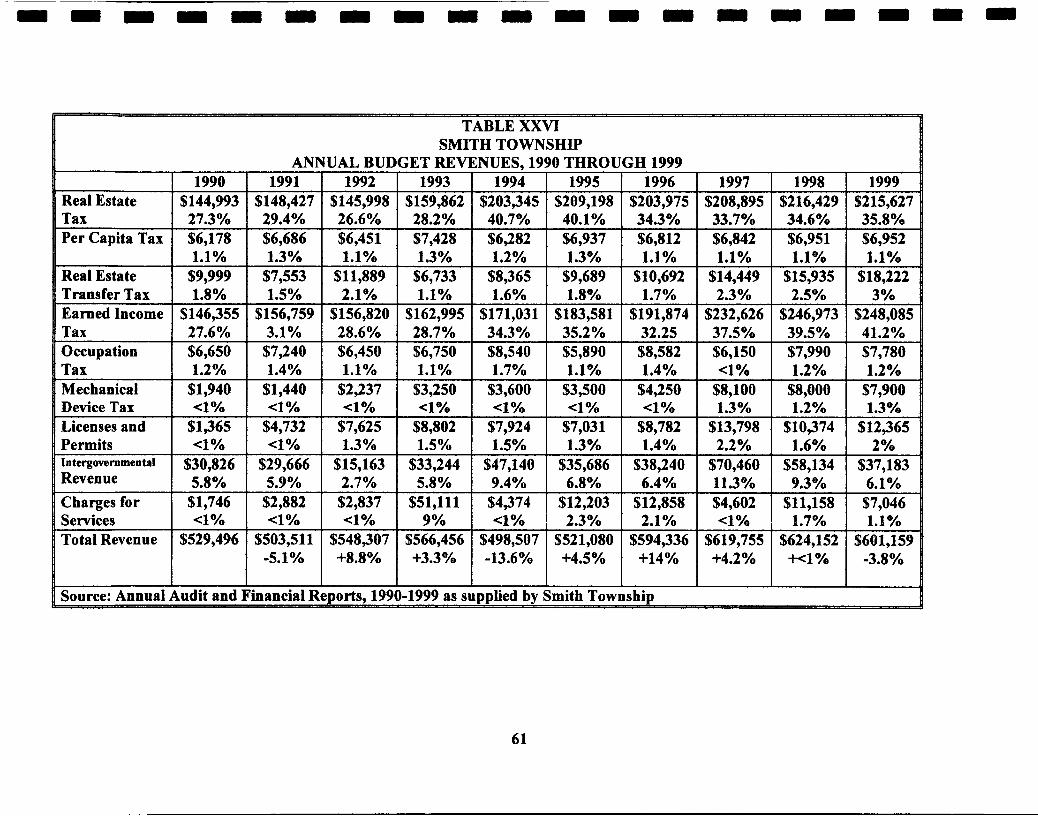
TABLE XXVI SMITH TOWNSHIP
lUAL BUDGET REV ANI
Real Estate $144,993 $148,427 1990 1991
SNUES, 19 1994
$203,345 40.7%
PO THROUGH 1999 1997
$208,895 33.7% Tax 27.3% 29.4%
Per Capita Tax $6,178 $6,686 $6,937 I $6,812 $6,951 I $6,952 $6,282 1.2%
$8,365 1.6%
$171,031 34.3%
$6,842 1.1%
$14,449 23%
$232,626 37.5% $6,150
1.1% Ill;3 $11,889
(J.J.;6;9 1.1% $10,692
1.1% 1.3% Real Estate $9,999 $7,553
2.1% 1.1% $156,820 $162,995 + 28.6% 28.7%
Transfer Tax 1.8% 1.5% Earned Income $146,355 $156,759 Tax 27.6% 3.1% 39.5% 1 41.2%
$7,990 $7,780 Occupation $6,650 $7,240 Tax I 1.2% I 1.4%
$8,540 1.7% 1.2% I 1.2% 1.1% 1.4%
$2,237 $3,250 4 % <1 Yo
$7,625 $8,802 1.3% 1.5%
$15,163 $33,244 * 2.7% 5.8%
%8,000 I $7,900 Mechanical $1,940 $1,440 Device Tax 4 % < l Yo Licenses and $1,365 $4,732 Permits <1 Yo <1 Yo *nte%overnmental $30,82 6 $29,666 Revenue 5.8% 5.9%
$3,600 4 %
$7,924 1.5%
$47,140 9.4%
$8,100 1.3%
$13,798 2.2 %
$70,460 11.3% $4,602
9.3% 6. l YO $11,158 $7,046 + 1.7% 1.1YO
$2,837 $51,111 4 %
$548,307 $566,456 + +8.8% +3.3%
Charges for
-5.1%
$49374 4 %
$498,507 -13.6%
$619,755 +4.2%
$624,152 $601,159 -1 Ye -3.8%
1 I
Source: Annual Audit and Financial R yorts, 1990-1999 as 8 ipplied by hnith Township
61
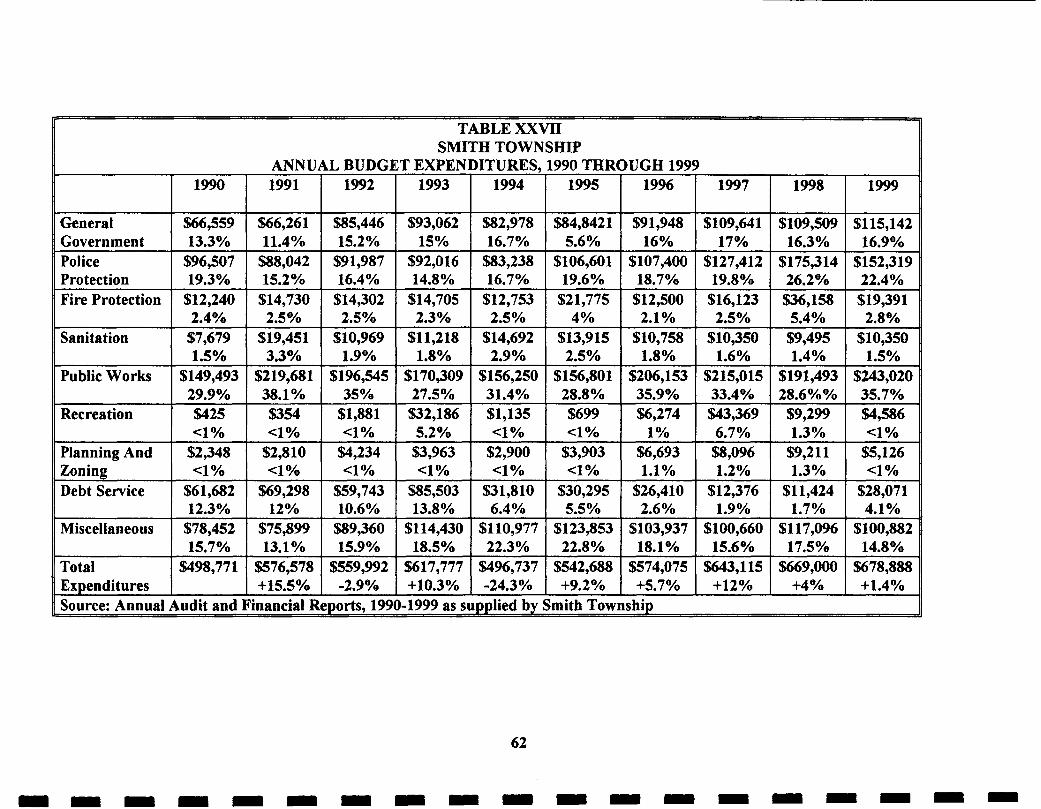
T SMI
ANNUAL BUDGET EXPEN 1991 1992 1993
$66,261 $85,446 $93,062 11.4% 15.2% 15%
$88,042 $91,987 $92,016 15.2% 16.4% 14.8%
$14,730 $14,302 $14,705 2.5% 2.5% 2.3%
$19,451 $10,969 $11,218 3.3% 1.9% 1.8%
iBLE XXMI rH TOWNSHIP )ITURES, 1990 THROUGH 199
1994 1995 1996
$82,978 $84,842 1 $9 1,948 16.7% 5.6% 16%
$83,238 $106,601 $107,400 16.7% 19.6% 18.7%
$12,753 $21,775 $12,500 2.5% 2.1%
P
1997
$109,641 17%
$127,412 19.8%
$16,123 2.5%
$10,350 1.6%
Government 13.3% Police $96,507
Fire Protection $12,240 2.4%
Sanitation $7,679 1.5%
Protection 19.3%
$14,692 $13,915 $10,758 2.9% I 2.5% I 1.8%
I
Public Works $149,493 I 29.9% $219,681 $196,545 $170,309 38.1 940 I 35% 1 27.5%
$156,250 $156,801 $206,153 31.4% I 28.8% I 35.9%
$2 1 5,0 15 33.4yo
$191,493 $243,020 28.6%% 1 35.7% 1
Recreation $425 I 4% %354 $1,881 $32,186 <1 Yo 1 4% I 5.2%
$1,135 $699 $6,274 c1 Yo I 4% I 1%
$43,369 6.7%
$9,299 $4,586 I 4% I 1.3% $2,900 $3,903 $6,693 <1 Yo I 4% I 1.1%
$8,096 1.2%
Planning And Zoning <1 Yo 1.3%
I "p:.;";02 Debt Service $69,298 $59,743 $85,503 12% I 10.6% 1 13.8%
$31,810 $30,295 $26,410 6.4% I 5.5% 1 2.6%
$12,376 1.9%
$11,424 $28,071 1.7% I 4.1% 1
Miscellaneous $78,452 1 15.7% $75,899 $89,360 $1 14,430 13.1% I 15.9% 1 18.5%
$110,977 $123,853 $103,937 22.3% I 22.8% I 18.1%
$100,660 15.6%
$117,0% $100,882 17.5% I 14.8% 1
$576,578 $559,992 $617,777 +15.5% 1 -2.9% 1 +10.3%
$496,737 $542,688 %574,075 -24.3% 1 +9.2% 1 +5.7%
%643,115 +12%
$669,OOO $678,888 +4vo I +1.4% 1 Total
ExDend i t ures 1 Source: Annual Audit and Financial Reports, 1990-1999 as supplied by Smith Township R
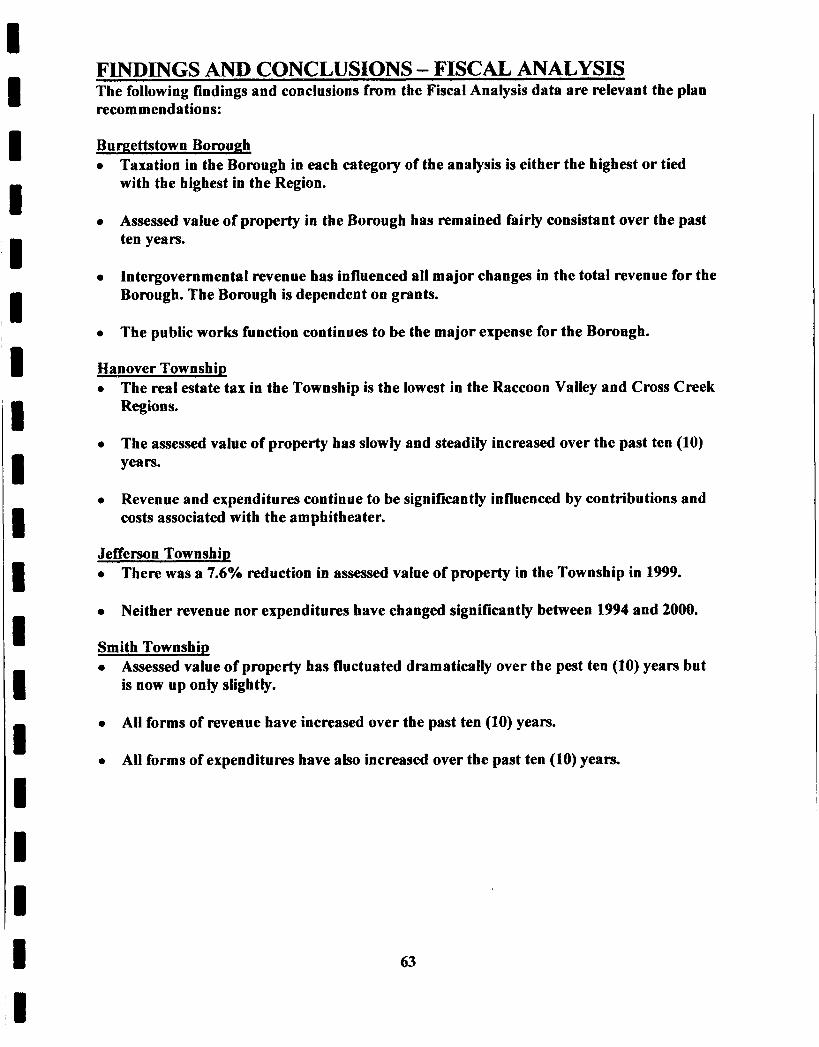
I D
FINDINGS AND CONCLUSIONS - FISCAL ANALYSIS The following findings and conclusions from the Fiscal Analysis data are relevant the plan recommendations:
I I I I 1 I
Burgettstown Borough 0 Taxation in the Borough in each category of the analysis is either the highest or tied
with the highest in the Region.
0 Assessed value of property in the Borough has remained fairly consistant over the past ten years.
0 Intergovernmental revenue has influenced all major changes in the total revenue for the Borough. The Borough is dependent on grants.
0 The public works function continues to be the major expense for the Borough.
Haaover Township 0 The real estate tax in the Township is the lowest in the Raccoon Valley and Cross Creek
Regions.
0 The assessed value of property has slowly and steadily increased over the past ten (10) years.
0 Revenue and expenditures continue to be significantly influenced by contributions and costs associated with the amphitheater.
Jefferson Township 0 There was a 7.6% reduction in assessed value of property in the Township in 1999.
0 Neither revenue nor expenditures have changed significantly between 1994 and 2000.
Smith Township 0 Assessed value of property has fluctuated dramatically over the pest ten (10) years but
is now up only slightly.
0 All forms of revenue have increased over the past ten (10) years.
0 All forms of expenditures have also increased over the past ten (10) years.
63
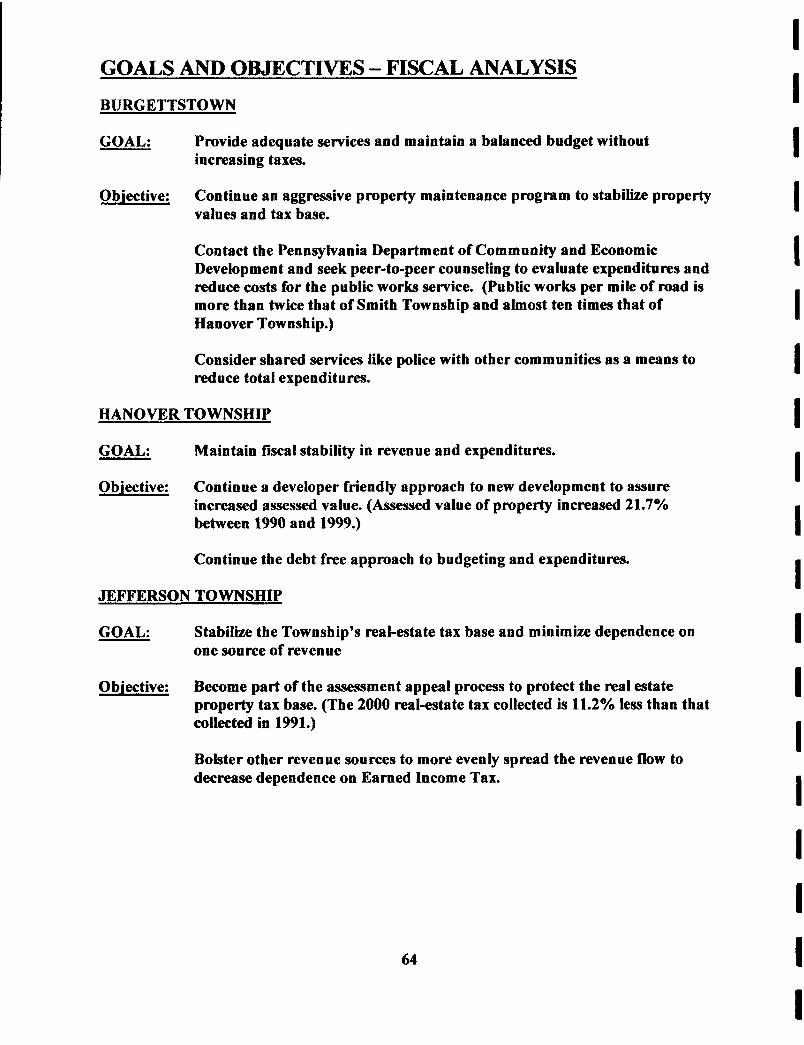
GOALS A N D OBJECTIVES - FISCAL ANALYSIS BURGETTSTO WN
GOAL: Provide adequate services and maintain a balanced budget without increasing taxes.
Objective: Continue an aggressive property maintenance program to stabilize property values and tax base.
Contact the Pennsylvania Department of Community and Economic Development and seek peer-to-peer counseling to evaluate expenditures and reduce costs for the public works service. (Public works per mile of road is more than twice that of Smith Township and almost ten times that of Hanover Townsh ip.)
Consider shared services like police with other communities as a means to reduce total expenditures.
HANOWR TOWNSHIP
GOAL: Maintain fiscal stability in revenue and expenditures.
Objective: Continue a developer friendly approach to new development to assure increased assessed value. (Assessed value of property increased 21.7% between 1990 and 1999.)
Continue the debt free approach to budgeting and expenditures.
JEFFERSON TOWNSHIP
GOAL: Stabilize the Township’s real-estate tax base and minimize dependence on one source of revenue
Objective: Become part of the assessment appeal process to protect the real estate property tax base. (The 2000 real-estate tax collected is 11.2% less than that collected in 1991.)
Bolster other revenue sources to more evenly spread the revenue flow to decrease dependence on Earned Income Tax.
64
1 I I I I I I 1 I I I I I I 1 I I I I
I I I ~I
I I I I I I I 1 I I B B II I
SMITH TOWNSHIP
GOAL: Hold the current real estate millage rate to remain competitive with neighboring communities.
Discourage increases in millage that could result in loss of development and a detraction for prospective residents.
Consider increasing the Per Capita Tax to $10 like most of the neighboring communities or increasing the real estate transfer tax like two of the neighboring communities if additional revenue is needed.
Objective:
Objective:
I
65
I I I I I I I I I I I I I I I I I I I
TRANSPORTATION The 1966 Raccoon Valley Region Plan includes a Traffic Volume Map that suggests that traffic on Route 22 (now old Route 22) is 6,000 to 9,000 vehicles per day and from 3,000 to 6,000 vehicles per day of Route 18. Route 22, relocated just south of the original Route 22 is now a four lane divided highway serving as a major thoroughfare east to west from Pittsburgh Pennsylvania to Weirton West Virginia and was completed in 1972. Old Route 22 has remained the same two-lane road in the same location but now serves a local function instead of a regional one.
At about the same time a four lane by-pass around Burgettstown was complete. Though this by-pass may have contributed to the demise of the Burgettstown business district it was a much needed improvement to the north south flow of traffic in the Region.
Also at the time of the 1966 plan there was a proposal to construct a limited access highway from Burgettstown south. This highway would have replaced Route 18 as the main north to south highway. This new highway, known as “The Raccoon Valley Expressway” would have been built from Burgettstown south along the ridge between Route 18 and Raccoon- Cherry Valley Road. This highway was never constructed and the Region is still faced with a less than desirable means of north south travel.
At the time of the 1966 Plan there were three bus lines providing public transportation within as well as to and from the region. One line serviced Burgettstown, Midway and McDonald areas. The second was a line from Pittsburgh to Weirton through Hanover and the third was an independent line serving Burgettstown, Langloth, Slovan, Atlasburg and Aliquippa. These lines no longer operate and at this time there is no public transportation in the Region.
The consensus in both the 1966 Raccoon Valley Regional Plan and the Cross Creek Valley Plan is that the location of existing roadways provide adequate access throughout the regions but that general upgrades, widening and realignments are needed. At the time these plans were written this may have been true but it is no longer the case.
Some improvements are programmed for the Region and these improvements are listed on Table XXVIII. More important are the recent developments and planned developments that have had and will have major impact on traffic in the region. These developments and the resulting traffic conditions must be addressed.
The amphitheater has already had a significant impact on traffic in the Region. There are approximately 40 concerts a years at the amphitheater that generate significant amounts of traffic. Some of these events cause traffic backups for miles in both directions from the amphitheater along Route 18. Traffic exiting US 22 also experiences back-ups for more than a mile.
This congestion though limited in the number of times a year it happens can paralyze the Region. Route 18 is viewed as the only realistic means of access to the Region and when blocked with amphitheater traffic it strands local motorists.
66
Less than one mile north of the entrance to the amphitheater is the proposed location of the Hanover Industrial Park. The 2025 Transportation And Development Plan For South western Pen nsy ban ia, prepared by the Southwest Pennsy Ivan ia Corn m ission anticipates that this industrial park wiU employ 10,250 individuals. The combination of amphitheater and industrial park traffic will be an unrealistic burden to impose on existing infrastructure.
Local residential traffic is also expected to increase. The availability of public sewage will promote residential development in the area contributing to an existing overflow of traffic on Route 18.
The ability of the local governments to address the traffic problems on Route 18 is limited. Route 18 as well as US 22 are under the jurisdiction of PennDOT. The communities in the Region cannot make the improvements to these roads, but, they can influence the decision to make those improvements.
The Southwestern Pennsylvania Commission is the agency responsible for program improvements to regional transportation facilities. This agency holds public meetings to receive testimony on proposed improvements or to receive community input on improvements that should be considered.
The communities of the Region can petition the Southwestern Pennsytvania Commission to address at least two traffic conditions by providing testimony at these public meetings and by submitting the appropriate forms requesting in writing that these conditions be addressed. The form attached as Appendix “A” at the back of the plan called the “State Transportation Commission Transportation Program Project Abstract is the appropriate form to submit the request to address the conditions.
The following “Description of Project” can be used the complete the State Transportation Commission Transportation Program Project Abstract.
Project 1. Study the impact of the amphitheater and the Hanover Industrial Park at Route 18 and US 22. Currently when there is a concert at the amphitheater traffic congestion in this area is severe. The addition of 10,250 jobs in the Hanover Industrial Park and the entrance to this park less than a mile north of the amphitheater on Route 18 could more than double the delays and congestion in this area.
Project 2: Study Route 18 from Burgettstown to the City of Washington and consider a by-pass route. Route 18 now experiences heavy truck traffic, heavy amphitheater tramc and is a main artery for the region. Events at the amphitheater often bring Route 18 to a standstill. Daily truck traffic must to negotiate narrow road widths, congested signalized intersections and urban environments with slow local traffic and pedestrians. The addition of the Industrial Park could increase the traffic on the only north-south roadway in the Region.
67
I I I I I I I I I I I I I I I I I I I
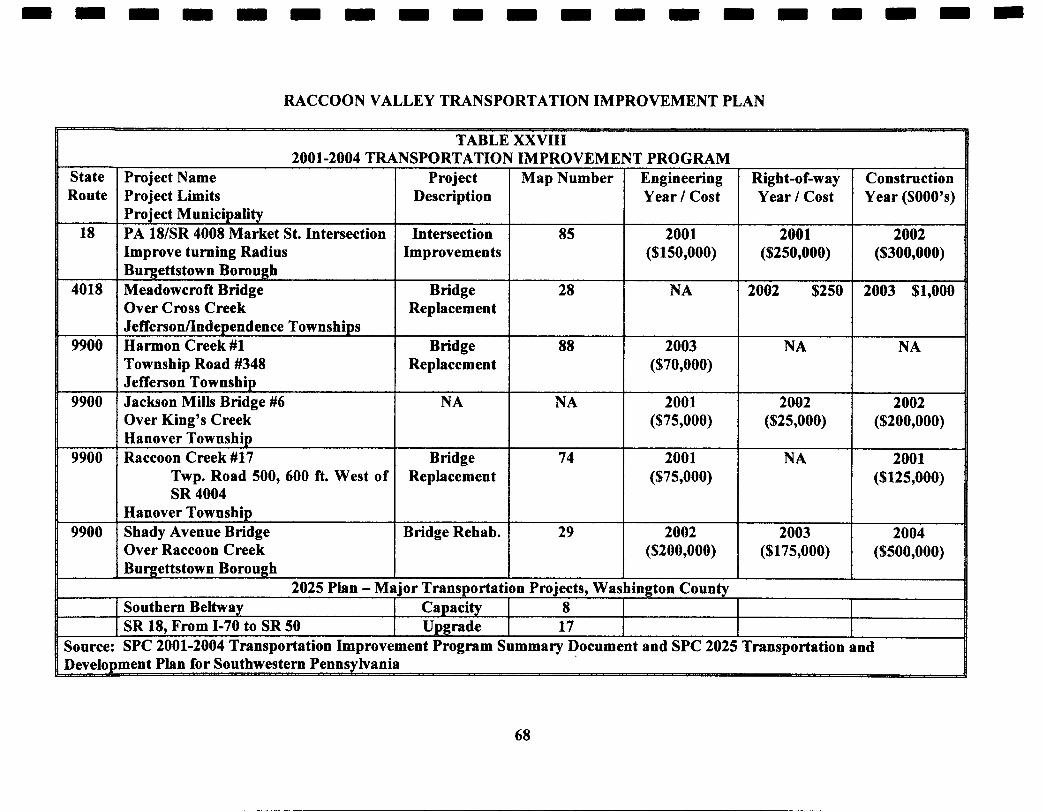
RACCOON VALLEY TRANSPORTATION IMPROVEMENT PLAN
2001-2004 T% Project Name Project Limits Project Municipality PA 181SR 4008 Market St. Intersection Improve turning Radius Burgettstown Borough Meadowcroft Bridge Over Cross Creek Jeffersonnndependence Townships Harmon Creek #1 Township Road #348 Jefferson Township Jackson Mills Bridge #6 Over King’s Creek Hanover Township Raccoon Creek #17
Twp. Road 500, 600 ft. West of SR 4004
Hanover Township Shady Avenue Bridge Over Raccoon Creek Burnettstown Borough
2025 Plan - Mi
TABLE XXVIII %§PORTATION IMPROVEMENT PROGRAM
Project Map Number Engineering Right-of-way Construction Description Year I Cost Year I Cost Year ($000’~)
Intersection 85 2001 2001 2002 Improvements ($150,000) ($250,000) ($300,000)
Bridge 28 NA 2002 $250 2003 $1,000 Replacement
Bridge 88 2003 NA NA Replacement ($70,000)
NA NA 2001 2002 2002 ($75,000) ($25,000) ($200,000)
Bridge 74 2001 NA 2001 Replacement ($75,000) ($125,000)
Bridge Rehab. 29 2002 2003 2004 ($200,000) ($175,000) ($500,000)
I I I I
or Transportation Projects, Washington County
68
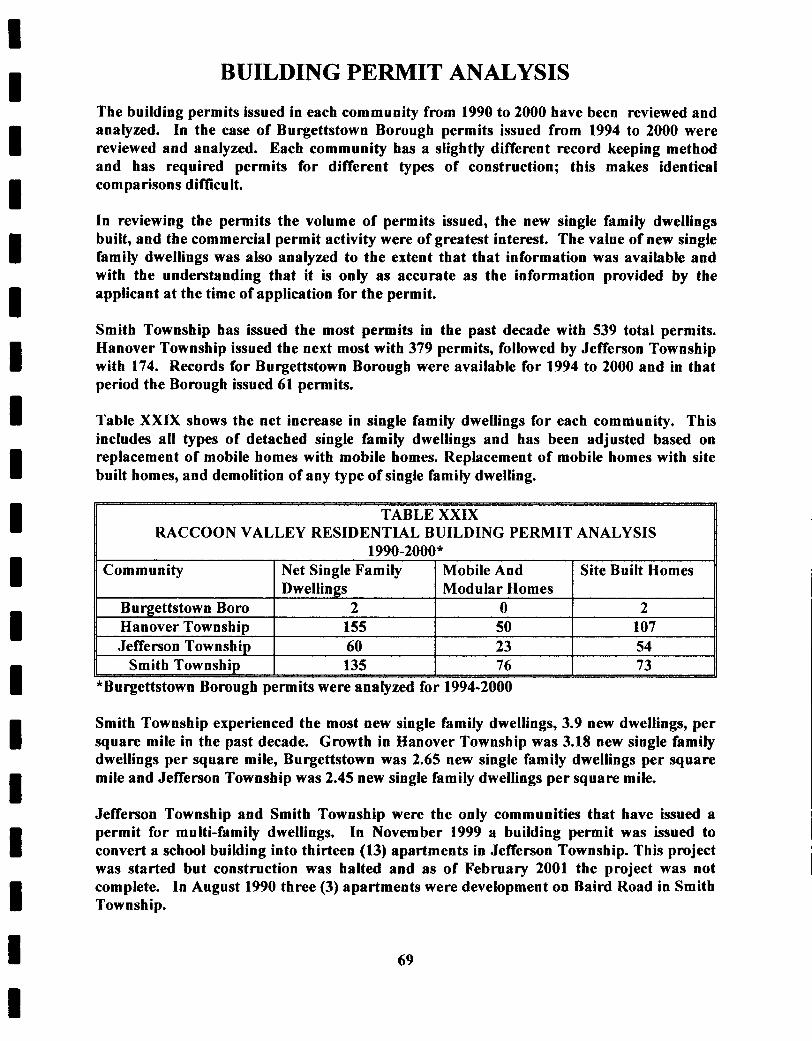
I
BUILDING PERMIT ANALYSIS The building permits issued in each community from 1990 to 2000 have been reviewed and analyzed. In the case of Burgettstown Borough permits issued from 1994 to 2000 were reviewed and analyzed. Each community has a slightly different record keeping method and has required permits for different types of construction; this makes identical com pa risons diff'icu It.
In reviewing the permits the volume of permits issued, the new single family dwellings built, and the commercial permit activity were of greatest interest. The value of new single family dwellings was also analyzed to the extent that that information was available and with the understanding that it is only as accurate as the information provided by the applicant at the time of application for the permit.
Smith Township has issued the most permits in the past decade with 539 total permits. Hanover Township issued the next most with 379 permits, followed by Jefferson Township with 174. Records for Burgettstown Borough were available for 1994 to 2000 and in that period the Borough issued 61 permits.
Table XXIX shows the net increase in single family dwellings for each community. This includes all types of detached single family dwellings and has been adjusted based on replacement of mobile homes with mobile homes. Replacement of mobile homes with site built homes, and demolition of any type of single family dwelling.
RACCOON VALLEY RESIDEN NG PERMIT ANALYSIS
*Burgettstown Borough permits were analyzed for 1994-2000
Smith Township experienced the most new single family dwellings, 3.9 new dwellings, per square mile in the past decade. Growth in Hanover Township was 3.18 new single family dwellings per square mile, Burgettstown was 2.65 new single family dwellings per square mile and Jefferson Township was 2.45 new single family dwellings per square mile.
Jefferson Township and Smith Township were the only communities that have issued a permit for multi-family dwellings. In November 1999 a building permit was issued to convert a school building into thirteen (13) apartments in Jefferson Township. This project was started but construction was halted and as of February 2001 the project was not complete. In August 1990 three (3) apartments were development on Baird Road in Smith Township.
69
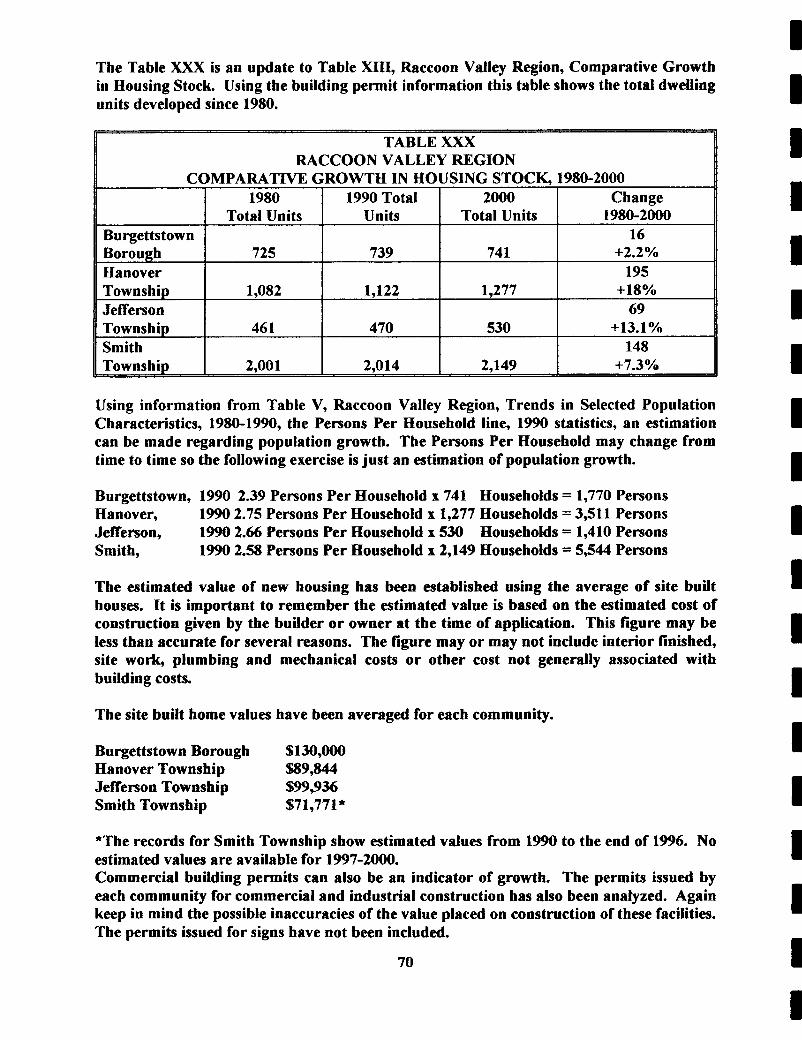
The Table XXX is an update to Table XIII, Raccoon Valley Region, Comparative Growth in Housing Stock. Using the building permit information this table shows the total dwelling units developed since 1980.
TABLE XXX RACCOON VALLEY REGION
COMPARATM GROWTH IN HOUSING STOCK, 1980-2000
Using information from Table V, Raccoon Valley Region, Trends in Selected Population Characteristics, 1980-1990, the Persons Per Household line, 1990 statistics, an estimation can be made regarding population growth. The Persons Per Household may change from time to time so the following exercise is just an estimation of population growth.
Burgettstown, 1990 2.39 Persons Per Household x 741 Households = 1,770 Persons Hanover, 1990 2.75 Persons Per Household x 1,277 Households = 3,511 Persons Jefferson, 1990 2.66 Persons Per Household x 530 Households = 1,410 Persons Smith, 1990 2.58 Persons Per Household x 2,149 Households = 5,544 Persons
The estimated value of new housing has been established using the average of site built houses. It is important to remember the estimated value is based on the estimated cost of construction given by the builder or owner at the time of application. This figure may be less than accurate for several reasons. The figure may or may not include interior finished, site work, plumbing and mechanical costs or other cost not generally associated with building costs.
The site built home values have been averaged for each community.
Burgettstown Borough %13O,OOO Hanover Township $89,844 Jefferson Township fm9= Smith Township $71,771 *
*The records for Smith Township show estimated values from 1990 to the end of 1996. No estimated values are available for 1997-2000. Commercial building permits can also be an indicator of growth. The permits issued by each community for commercial and industrial construction has also been anatyzed. Again keep in mind the possible inaccuracies of the value placed on construction of these facilities. The permits issued for signs have not been included.
70
I I I I I I I I I I I I I I I I I I I
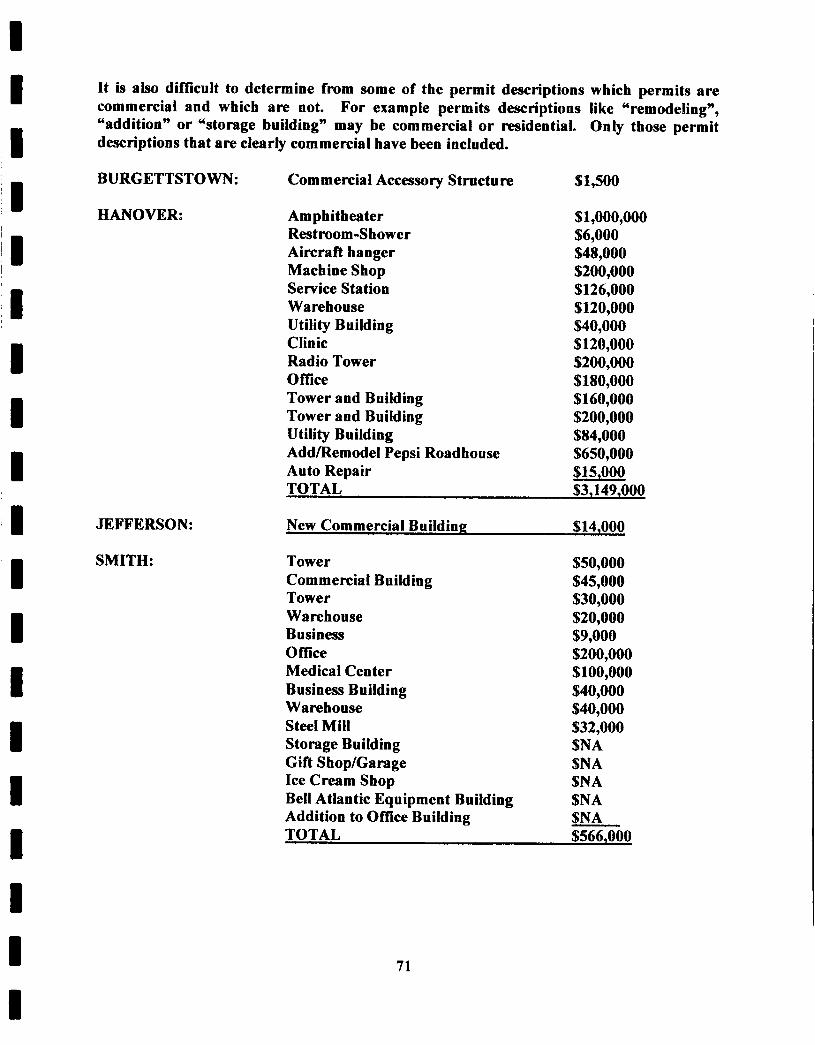
I I I I
It is also difficult to determine from some of the permit descriptions which permits are commercial and which are not. For example permits descriptions like “remodeling”, “addition” or “storage building” may be commercial or residential. Only those permit descriptions that are clearly commercial have been included.
I
BURGETTSTOWN: Commercial Accessory Structure $1,500
HANOVER: Amphitheater $1,000,000 Rest room4 hower $6,000 Aircraft hanger $48,000
Service Station $126,000 Machine Shop $200,000
Warehouse $120,000 Utility Building $40,000 Clinic $120,000 Radio Tower $200,000
Tower and Building $200,000
Office $180,000 Tower and Building $160,000
Utility Building $84,000 Addmemodel Pepsi Roadhouse $650,000 Auto Repair $15,000 TOTAL $3,149,000
JEFFERSON: New Commercial Buildinp $14,000
SMITH: Tower Commercial Building Tower Warehouse Business Office Medical Center B usineas Building Warehouse Steel Mill Storage Building Gift Shop/Garage Ice Cream Shop Bell Atlantic Equipment Building
$50,000 $45,000 $30,000 $20,000 $9,000 $200,000 $100,000 $40,000 $40,000 $32,000 $NA $NA %NA $NA -
Addition to Offrce-Building $NA TOTAL $566,000
71
EXISTING LAND USE I I I I I I I I
II
EXISTING LAND USE STUDY KEY Using a computer generated map and a combination of aerial photography and field surveys an existing land use map has been generated. Ten (10) categories have been developed to categorize all properties in each of the Townships in the Raccoon Valley Planning Region. These ten (10) categories have been applied using a best-fit approach for the use of each property, or part of a property, in the Region.
This mapping, as well as all mapping for this project is developed using a combination of aerial photography and Washington County Tax Parcel Maps. The accuracy of this mapping is only as precise as the source.
In the case of a single family dwelling as part of a large farm or large wooded parcel approximately one (1) acre of that property has been categorized as single family and the remaining property categorized as its respective category.
Vacant: This category includes all properties, or parts of properties, that have no evidence of use or development. Steep slopes, woods, waterways and properties, or parts, which may have been used as agricultural uses but are no longer active, are included in this category.
Agricultural: Farms, hayfields, pasture land, orchards, and all activities associated with farming and/or the care and feeding of livestock are included in this category.
Single Famib: Included in this category are all properties that contain single family structures. On large parcels of properties, such as farms, one (1) acre of property will be dedicated to the residential category for the farmhouse.
Multi Family: Included in this category are all properties that contain structures constructed for two or more dwelling units. All townhouse units and multi story, multi family buildings are included in this category.
Semi-Public Facilities: Included in this category are uses that are open to a segment of the public. Semi-public uses include uses where members of an organization are permitted but that free and open access to the general public is limited. Private schools, churches, fraternal organizations, private swim clubs, clubhouses, membership golf courses and country clubs and sportsman’s clubs are included in this category.
Public Facilities: This category includes all properties that house public uses owned and operated by a governmental body. Included in this category are public schools, public parks, cemeteries, utility structures, volunteer fire departments, emergency medical services, post offices, municipal buildings, and senior or community centers.
Commercial: Retail outlets and shops, restaurants, indoor or outdoor, for profit recreational facilities, retail services such as automotive repair, automotive accessory sales
72
and installation and gasoline and other automotive service stations, and other establishments offering the sale of goods and services to the general public are included in this category.
Industrial: Warehouses, wholesale outlets, manufacturing, salvage yards and industrial storage areas are included in this category. This category also includes business establishments that focus on doing business with other businesses and are not generally accessible to the general public.
Mineral Extraction: Areas of strip-mining or quarrying will be included in this category.
Mixed Use: This category includes structures where there is a mix of uses. An example would include structures with commercial uses on the street level floor and residential uses on upper floors.
BURGETTSTOWN BOROUGH The Borough is the most densely populated area in the Region. It is an older community - - - and according the 1990 Census 24% of dwelling units are is structures that house two (2) or more units. There is a considerable number of vacant buildings in the business district and though there are business on some of the first floor spaces of these buildings most of the upper floors are vacant.
A four lane bypass was build around the main shopping district of the Borough reducing the drive by traffic for these businesses to almost nothing. There are still several small business in the old business district but the new commercial development and the most vibrant business are located along Route 18 in the southern part of the Borough.
One farm exists on the West Side of the Borough. Located on this farm is a communication tower that has been categorized as commercial.
Vacant property in the Borough is a mix of rural property on the fringe of the Borough, vacant recorded lots between single family developed lots and abandoned right of ways for unopened streets and railways.
Multi Family development has happened primarily as a result of building reuse. School buildings, large single family dwellings and commercial buildings have been reconstructed to accommodate multi famity uses.
On the east side of Route 18 street are laid out in an almost grid like pattern. Most of the lots in this area are developed as single family dwellings. The majority of the structures in this area are in good condition.
The table on the following page shows the approximate acreage and percent of total area that is dedicated to certain uses.
73
I I I I I I I I I I I I I I 1 I I I I
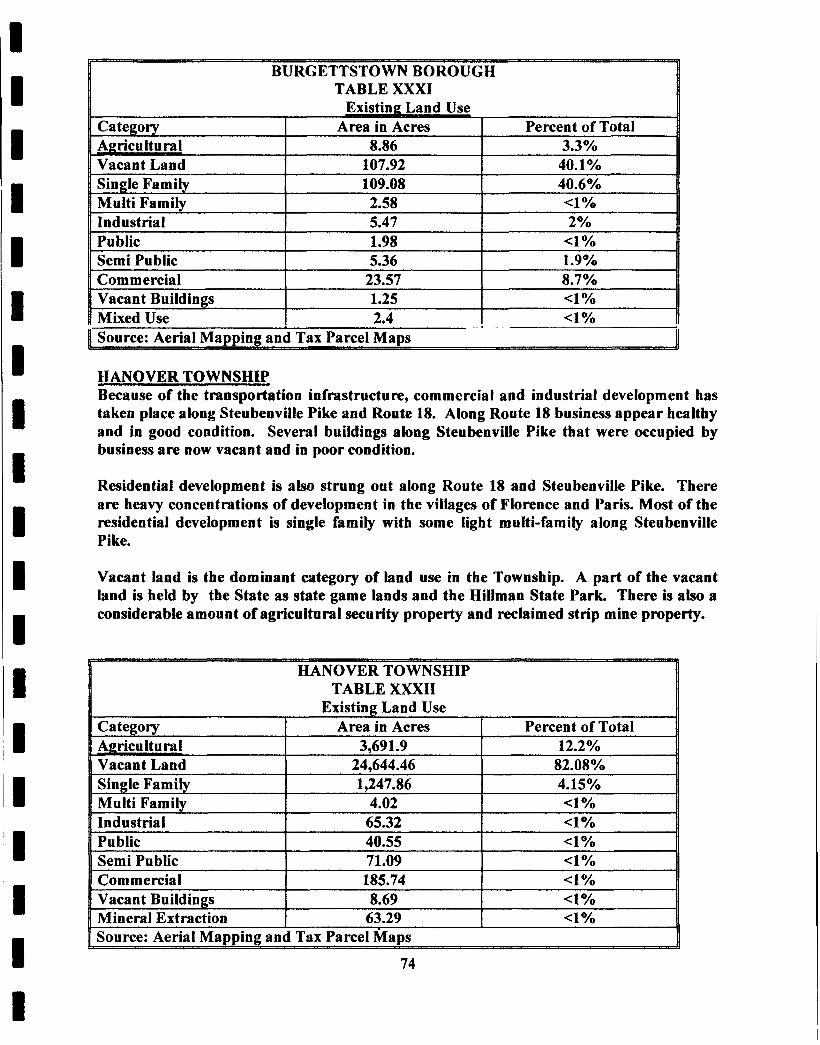
I
1
I
I
I
TABLE XXXI
I Source: Aerial Mapping and Tax Parcel Maps u HANOVER TOWNSHIP Because of the transportation infrastructure, commercial and industrial development has taken place along Steubenville Pike and Route 18. Along Route 18 business appear healthy and in good condition. Several buildings along Steubenville Pike that were occupied by business are now vacant and in poor condition.
Residential development is also strung out along Route 18 and Steubenville Pike. There are heavy concentrations of development in the villages of Florence and Paris. Most of the residential development is single family with some light multi-family along Steubenville Pike.
Vacant land is the dominant category of land use in the Township. A part of the vacant land is held by the State as state game lands and the Hillman State Park. There is also a considerable amount of agricultural security property and reclaimed strip mine property.
Commercial
74
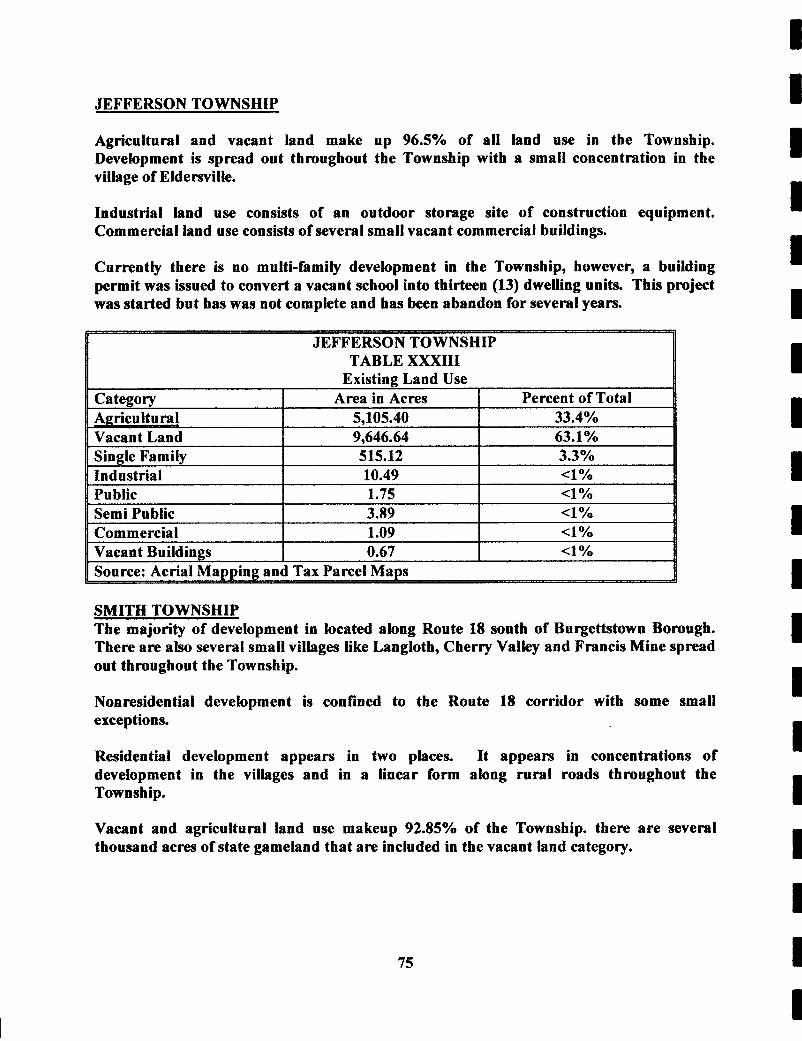
JEFFERSON TOWNSHIP
Agricultural and vacant land make up 96.5% of all land use in the Township. Development is spread out throughout the Township with a small concentration in the village of Eldersville.
Industrial land use consists of an outdoor storage site of construction equipment. Commercial land use consists of several small vacant commercial buildings.
Currently there is no multi-family development in the Township, however, a building permit was issued to convert a vacant school into thirteen (13) dwelling units. This project was started but has was not complete and has been abandon for several years.
TABLE XXXIII Existing Land Use
SMITH TOWNSHIP The majority of development in located along Route 18 south of Burgettstown Borough. There are also several small villages like Langloth, Cherry Valley and Francis Mine spread out throughout the Township.
Nonresidential development is confined to the Route 18 corridor with some small exceptions.
Residential development appears in two places. It appears in concentrations of development in the villages and in a linear form along rural roads throughout the Towaship.
Vacant and agricultural land use makeup 92.85% of the Township. there are several thousand acres of state gameland that are included in the vacant land category.
75
I I I I I I I I I I 1 I I I I I I I I
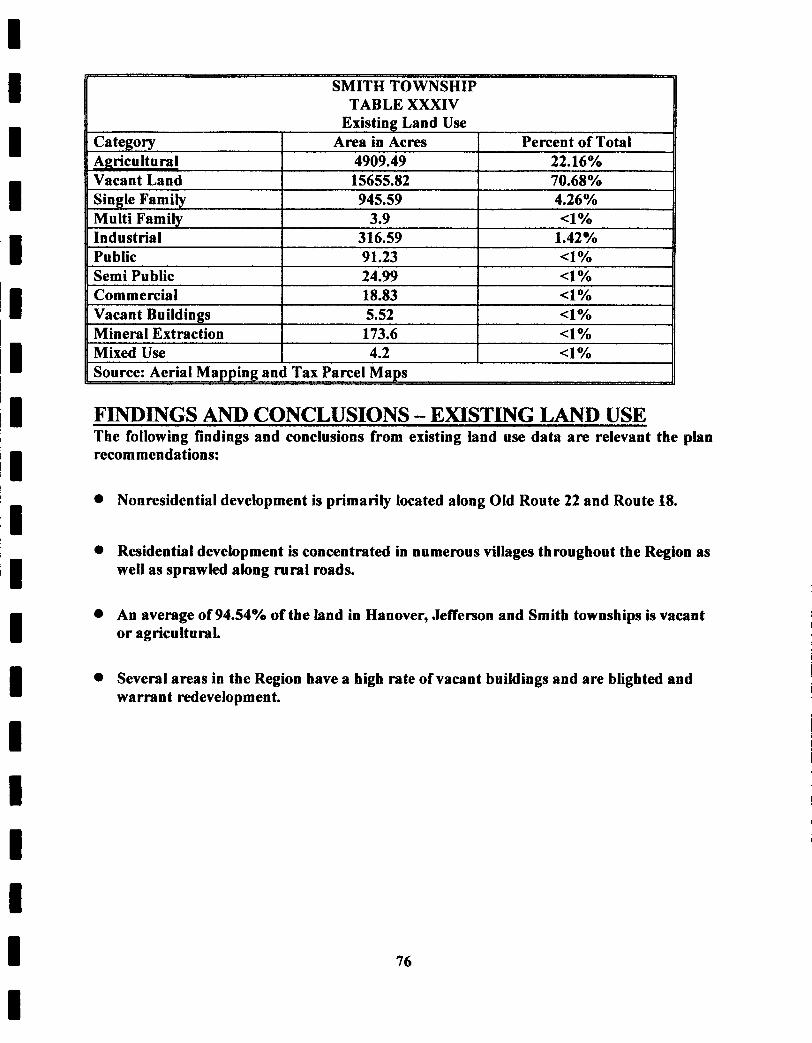
I
I
I
SMITH TOWNSHIP TABLE XXXIV
Commercial 18.83 4% Vacant Buildings 5.52 Mineral Extraction 173.6 4 Yo Mixed Use 4.2 4% Source: Aerial Mapping and Tax Parcel Maps
FINDINGS AND CONCLUSIONS - EXISTING LAND USE The following findings and conclusions from existing land use data are relevant the plan recommendations:
Nonresidential development is primarily located along Old Route 22 and Route 18.
Residential development is concentrated in numerous villages throughout the Region as well as sprawled along rural mads.
An average of 94.54% of the land in Hanover, Jefferson and Smith townships is vacant or agricultural.
Several areas in the Region have a high rate of vacant buildings and are blighted and warrant redevelopment.
76
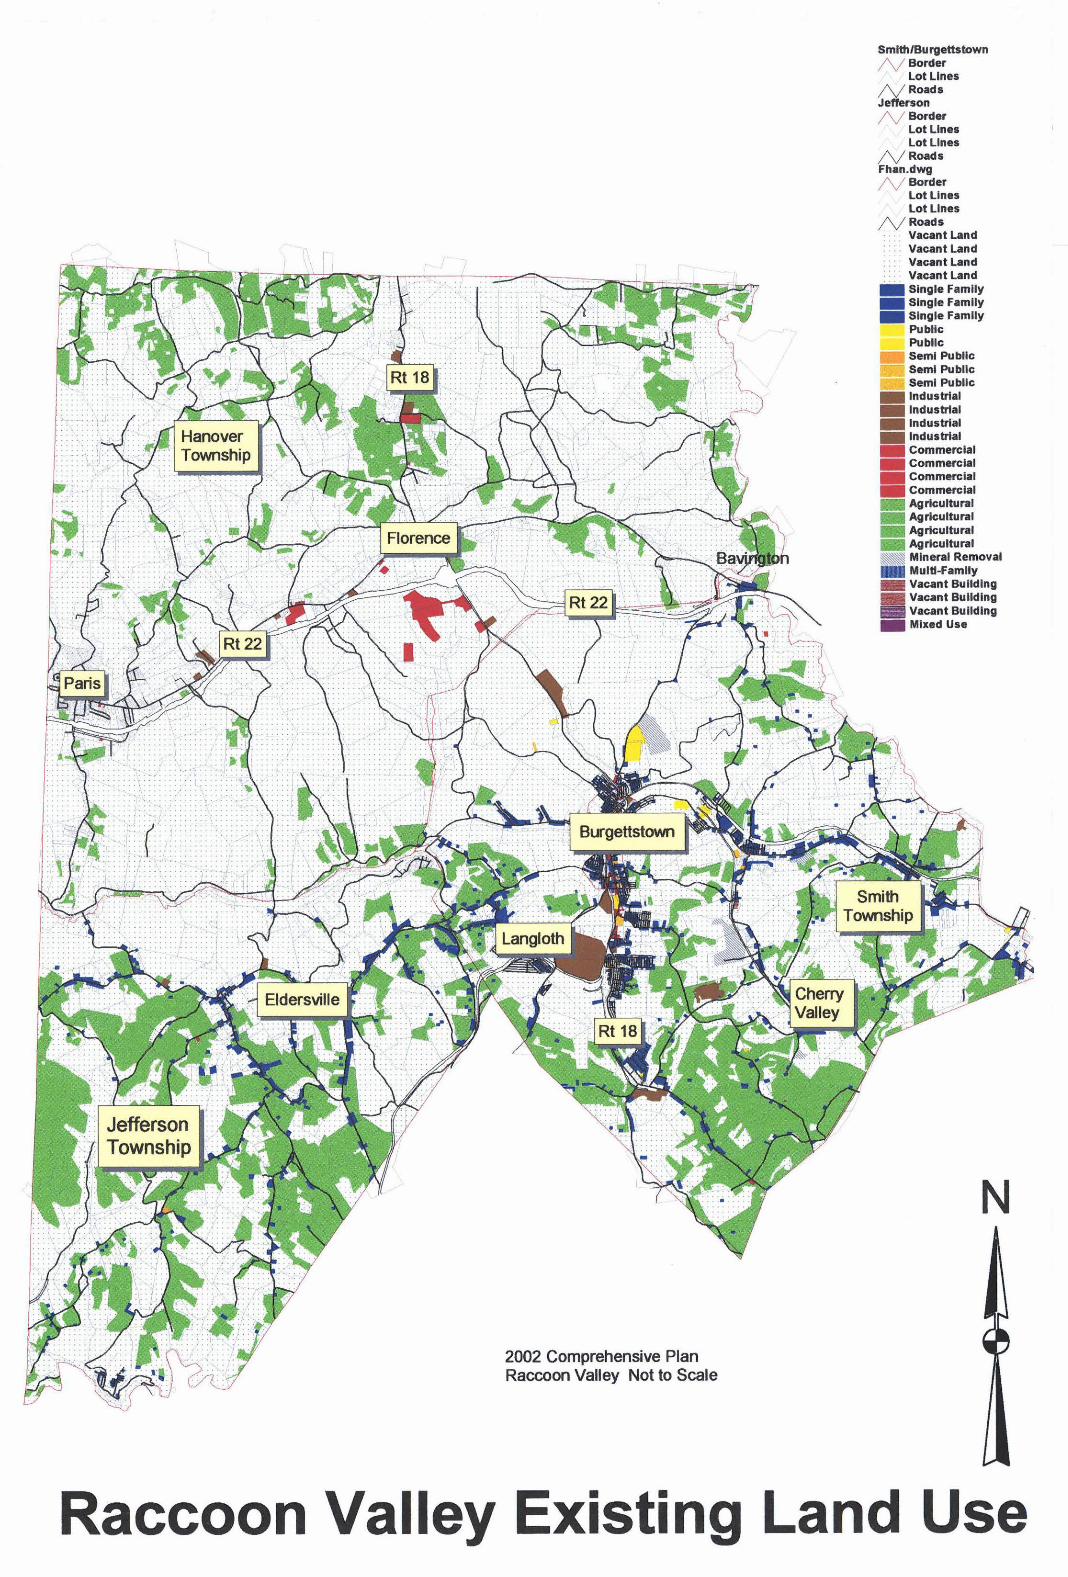
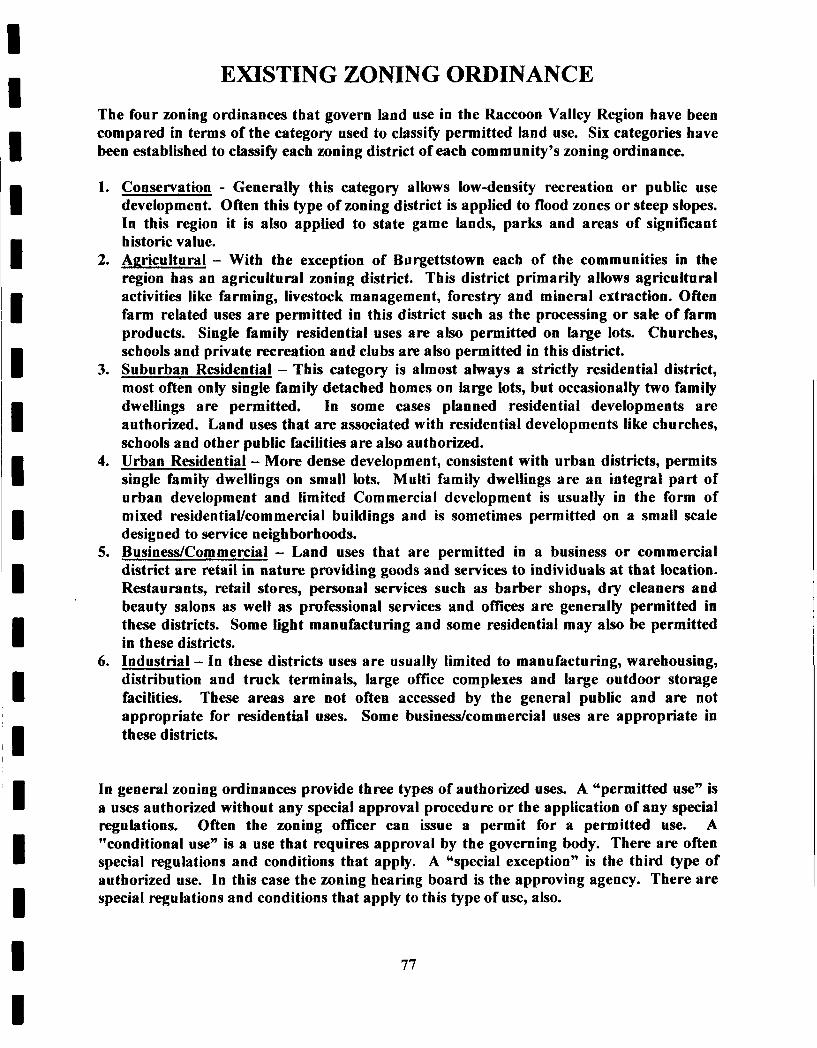
EXISTING ZONING ORDINANCE I I I I I I I I I I I I 11 I
I I I I I
The four zoning ordinances that govern land use in the Raccoon Valley Region have been compared in terms of the category used to classify permitted land use. Six categories have been established to classify each zoning district of each community's zoning ordinance.
1.
2.
3.
4.
5.
6.
Conservation - Generally this category allows low-density recreation or public use development. Often this type of zoning district is applied to flood zones or steep slopes. In this region it is also applied to state game lands, parks and areas of significant historic value. Agricultural - With the exception of Burgettstown each of the communities in the region has an agricultural zoning district. This district primarily allows agricultural activities like farming, livestock management, forestry and mineral extraction. Often farm related uses are permitted in this district such as the processing or sale of farm products. Single family residential uses are a h permitted on large lots. Churches, schools and private recreation and clubs are also permitted in this district. Suburban Residential - This category is almost always a strictly residential district, most often only single family detached homes on large lots, but occasionally two famity dwellings are permitted. In some cases planned residential developments are authorized. Land uses that are associated with residential developments like churches, schools and other public facilities are also authorized. Urban Residential - More dense development, consistent with urban districts, permits single family dwellings on small lots. Multi family dwellings are an integral part of urban development and limited Commercial development is usually in the form of mixed residentiallcommercial buildings and is sometimes permitted on a small scale designed to service neighborhoods. BusinesdCommercial - Land uses that are permitted in a business or commercial district are retail in nature providing goods and services to individuals at that location. Restaurants, retail stores, personal services such as barber shops, dry cleaners and beauty salons as well as professional services and offices are generally permitted in these districts. Some light manufacturing and some residential may also be permitted in these districts. Industrial - In these districts uses are usually limited to manufacturing, warehousing, distribution and truck terminals, large ofice complexes and large outdoor storage facilities. These areas are not often accessed by the general public and are not appropriate for residential uses. Some busindcommercial uses are appropriate in these districts.
In general zoning ordinances provide three types of authorized uses. A "permitted use" is a uses authorized without any special approval procedure or the application of any special regulations. Often the zoning officer can issue a permit for a permitted use. A "conditional use" is a use that requires approval by the governing body. There are often special regulations and conditions that apply. A "special exception" is the third type of authorized use. In this case the zoning hearing board is the approving agency. There are special regulations and conditions that apply to this type of use, also.
77
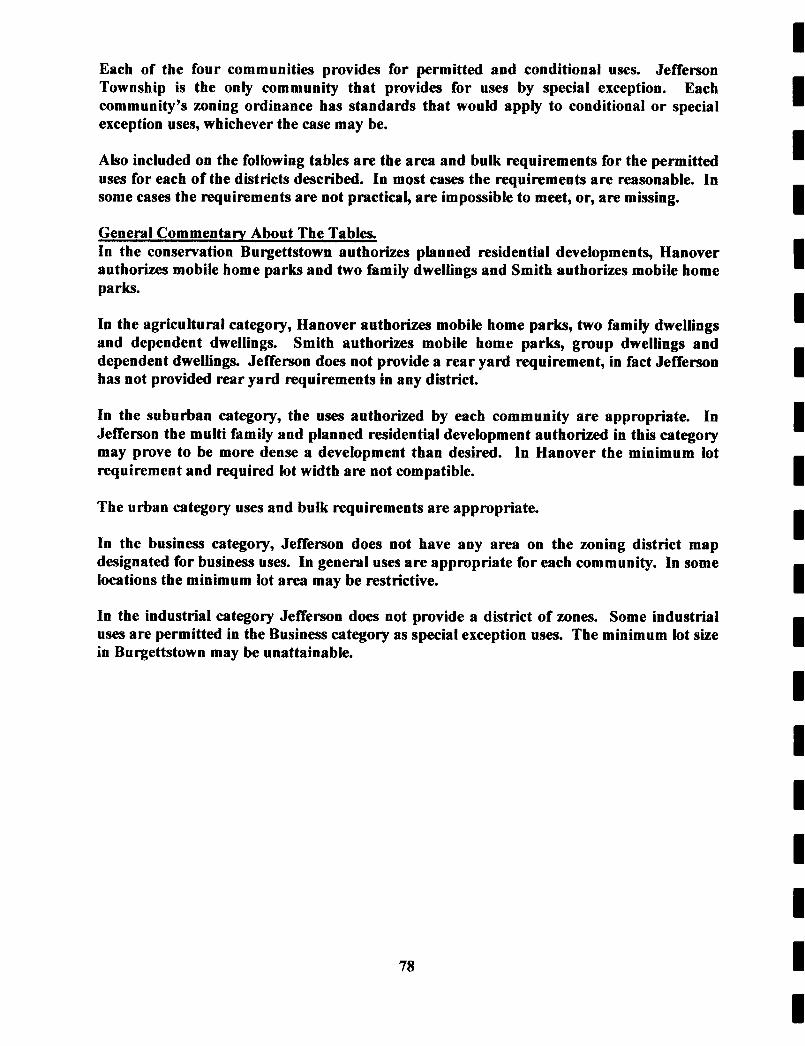
Each of the four communities provides for permitted and conditional uses. Jefferson Township is the only community that provides for uses by special exception. Each community’s zoning ordinance has standards that would apply to conditional or special exception uses, whichever the case may be.
Also included on the following tables are the area and bulk requirements for the permitted uses for each of the districts described. In most cases the requirements are reasonable. In some cases the requirements are not practical, are impossible to meet, or, are missing.
General Commentary About The Tables. In the conservation Burgettstown authorizes planned residential developments, Hanover authorizes mobile home parks and two family dwellings and Smith authorizes mobile home parks.
In the agricultural category, Hanover authorizes mobile home parks, two family dwellings and dependent dwellings. Smith authorizes mobile home parks, group dwellings and dependent dwellings. Jefferson does not provide a rear yard requirement, in fact Jefferson has not provided rear yard requirements in any district.
In the suburban category, the uses authorized by each community are appropriate. In Jefferson the multi family and planned residential development authorized in this category may prove to be more dense a development than desired. In Hanover the minimum lot requirement and required lot width are not compatible.
The urban category uses and bulk requirements are appropriate.
In the business category, Jefferson does not have any area on the zoning district map designated for business uses. In general uses are appropriate for each community. In some locations the minimum lot area may be restrictive.
In the industrial category Jefferson does not provide a district of zones. Some industrial uses are permitted in the Business category as special exception uses. The minimum lot sue in Burgettstown may be unattainable.
78
I I I I I I I I I I I I I I I I I I I
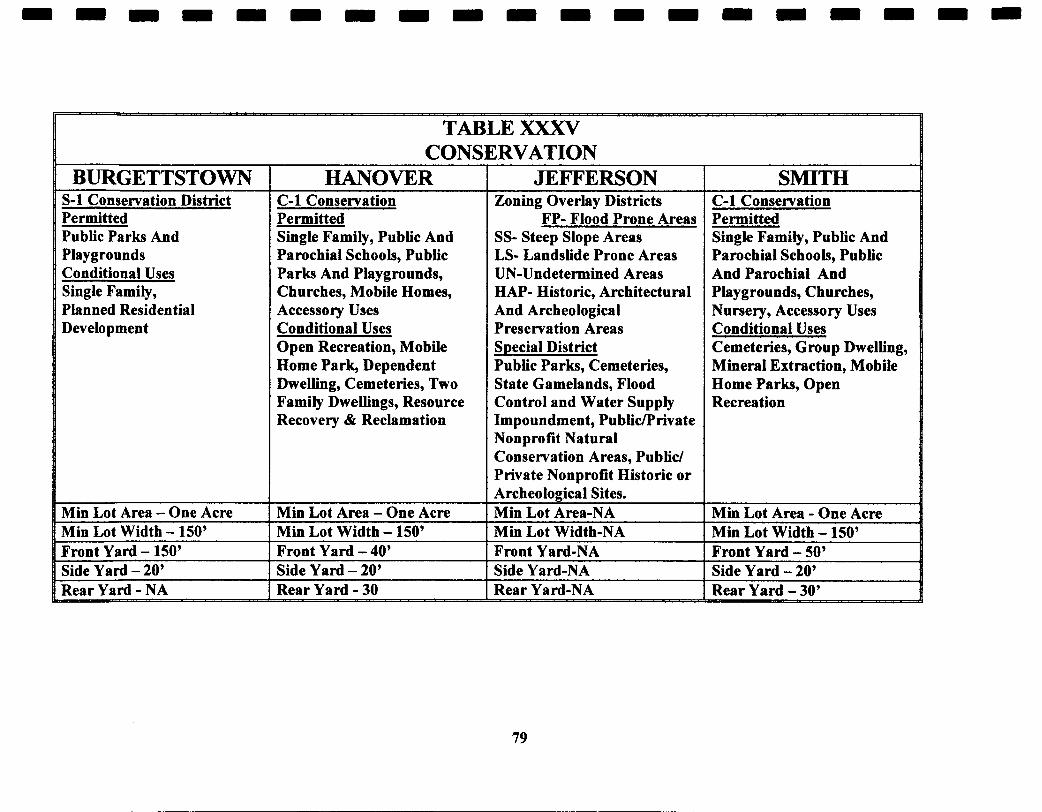
BURGETTSTOWN S-1 Conservation District Permitted Public Parks And Playgrounds Conditional Uses Single Family, Planned Residential Development
Min Lot Area - One Acre Min Lot Width - 150’ Front Yard - 150’ Side Yard - 20’ Rear Yard - NA
TABLE XXXV CONSERVATION
HANOVER C-1 Conservation Permitted Single Family, Public And Parochial Schools, Public Parks And Playgrounds, Churches, Mobile Homes, Accessory Uses Conditional Uses Open Recreation, Mobile Home Park, Dependent Dwelling, Cemeteries, Two Family Dwellings, Resource Recovery & Reclamation
Min Lot Area - One Acre Min Lot Width - 150’ Front Yard - 40’ Side Yard - 20’ Rear Yard - 30 -
JEFFERSON Zoning Overlay Districts
SS- Steep Slope Areas LS- Landslide Prone Areas UN-Undetermined Areas HAP- Historic, Architectural And Archeological Preservation Areas Special District Public Parks, Cemeteries, State Gamelands, Flood Control and Water Supply Impoundment, Publiflrivate Nonprofit Natural Conservation Areas, Public/ Private Nonprofit Historic or Archeological Sites. Min Lot Area-NA Min Lot Width-NA
FP- Flood Prone Areas
Front Yard-NA Side Yard-NA Rear Y ard-NA
SMITH C-1 Conservation Permitted Single Family, Public And Parochial Schools, Public And Parochial And Playgrounds, Churches, Nursery, Accessory Uses Conditional Uses Cemeteries, Group Dwelling, Mineral Extraction, Mobile Home Parks, Open Recreation
Min Lot Area - One Acre Min Lot Width - 150’ Front Yard - 50’ Side Yard - 20’ Rear Yard - 30’
79
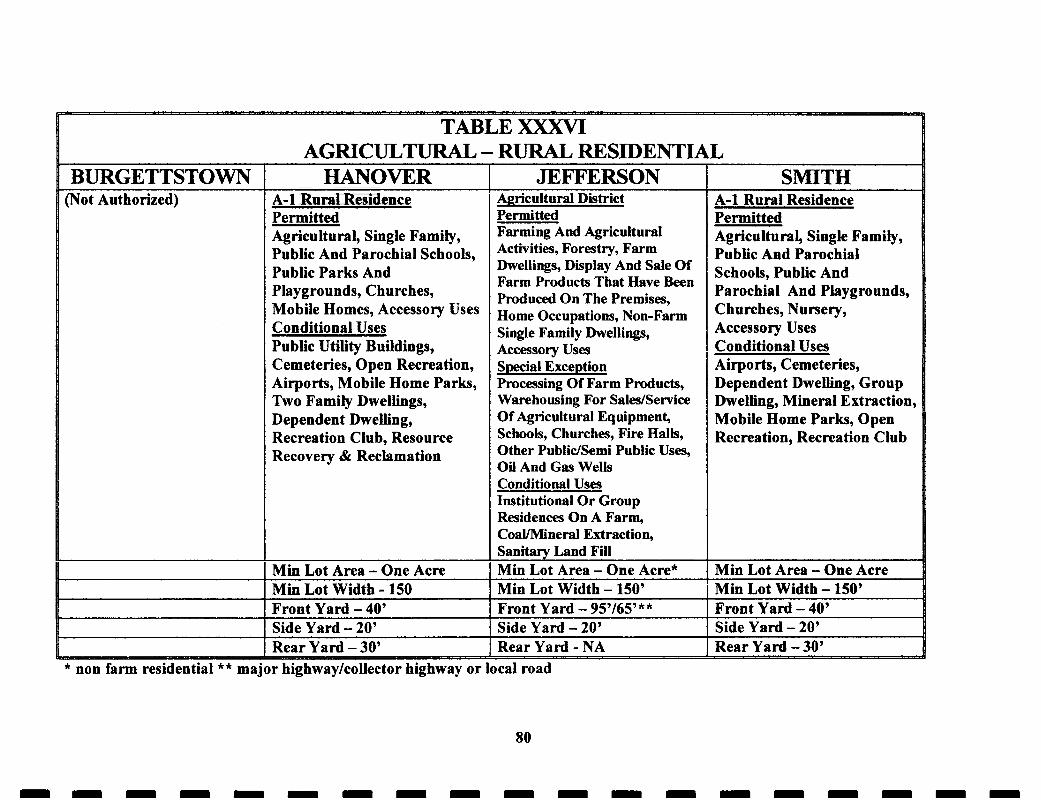
TABLE XXXVI AGRICULTURAL - RURAL RESIDENTIAL
HANOVER A-1 Rural Residence Permitted Agricultural, Single Family, Public And Parochial Schools, Public Parks And Playgrounds, Churches, Mobile Homes, Accessory Uses Conditional Uses Public Utility Buildings, Cemeteries, Open Recreation, Airports, Mobile Home Parks, Two Family Dwellings, Dependent Dwelling, Recreation Club, Resource Recovery & Reclamation
Min Lot Area - One Acre Min Lot Width - 150 Front Yard - 40’ Side Yard - 20’ Rear Yard - 30’
JEFFERSON I SMITH Agricultural District Permitted Farming And Agricultural Activities, Forestry, Farm Dwellings, Display And Sale Of Farm Products That Have Been Produced On The Premises, Home Occupatious, Non-Farm Single Family Dwellings, Accessory Uses Special Exception Processing Of Farm Products, Warehousing For Sales/Service Of Agricultural Equipment, Schools, Churches, Fire Halts, Other Publidsemi Public Uses, Oil And Gas Wells Conditional Uses Institutional Or Group Residences On A Farm, Coal/Mineral Extraction, Sanitary Land Fill Min Lot Area - One Acre*
A-1 Rural Residence Permitted Agricultural, Single Family, Public And Parochial Schools, Public And Parochial And Playgrounds, Churches, Nursery, Accessory Uses Conditional Uses Airports, Cemeteries, Dependent Dwelling, Group Dwelling, Mineral Extraction, Mobile Home Parks, Open Recreation, Recreation Club
Min Lot Area - One Acre Min Lot Width - 150’ Front Yard - 95’/65’**
Min Lot Width - 150’ Front Yard - 40’
9 * non farm residential ** major highwaykollector highway or local road
Side Yard - 20’ Rear Yard - NA
Side Yard - 20’ Rear Yard - 30’
80
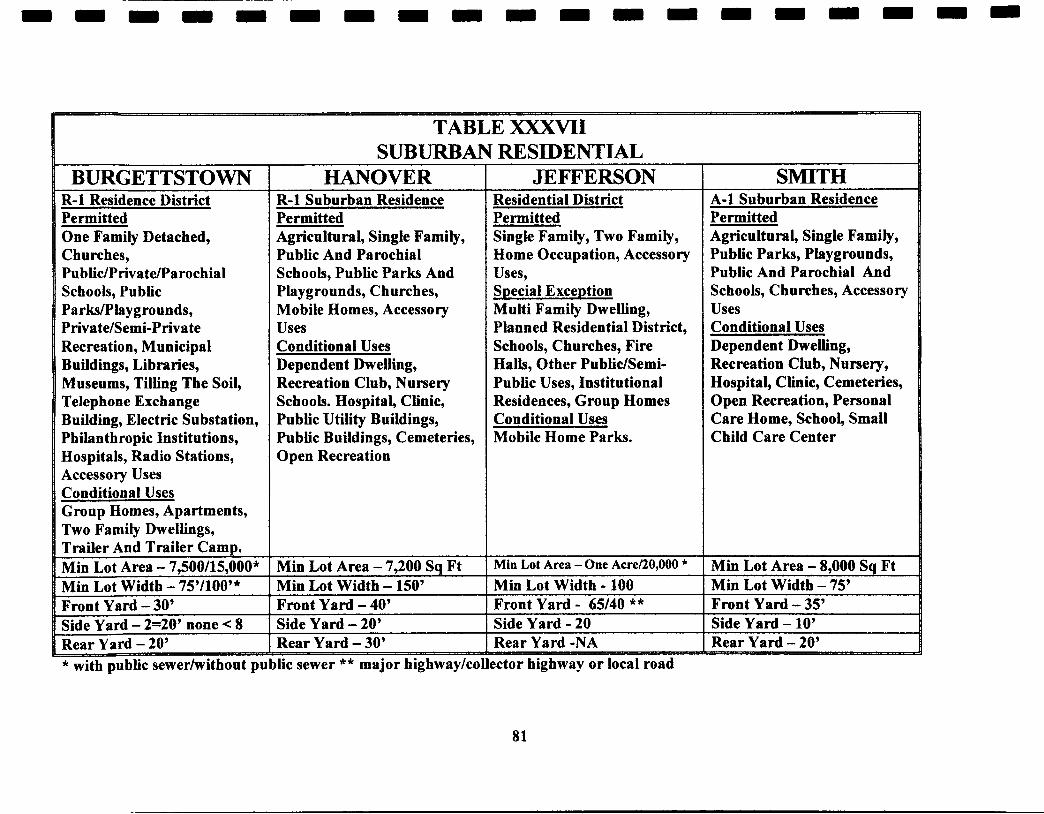
BURGETTSTOWN R-1 Residence District Permitted One Family Detached, Churches, PublidPrivsteParochial Schools, Public ParWlaygrounds, PrivateISemi-Priva te Recreation, Municipal Buildings, Libraries, Museums, Tilling The Soil, Telephone Exchange Building, Electric Substation, Philanthropic Institutions, Hospitals, Radio Stations, Accessory Uses Conditional Uses Group Homes, Apartments, Two Family Dwellings, Trailer And Trailer Camp. Min Lot Area - 7.500/15,000* Min Lot Width - 75’/100’* Front Yard - 30’ ~~
Side Yard - 2=20’ none < 8 Rear Yard - 20’ * with public sewerhvithont pu
TABLE XXXVII SUBURBAN RESIDENTIAL
HANOVER R-1 Suburban Residence Permitted Agricultural, Single Family, Public And Parochial Schools, Public Parks And Playgrounds, Churches, Mobile Homes, Accessory uses Conditional Uses Dependent Dwelling, Recreation Club, Nursery Schools. Hospital, Clinic, Public Utility Buildings, Public Buildings, Cemeteries, Open Recreation
Min Lot Area - 7,200 Sq Ft Min Lot Width - 150’ Front Yard - 40’ Side Yard - 20’ Rear Yard - 30’ llic sewer ** major highway/co
JEFFERSON Residential District Permitted Single Family, Two Family, Home Occupation, Accessory Uses, Special Exception Multi Family Dwelling, Planned Residential District, Schools, Churches, Fire Halls, Other Public/Semi- Public Uses, Institutional Residences, Group Homes Conditional Uses Mobile Home Parks.
Min Lot Area -One Acren0,OOO * Min Lot Width - 100 Front Yard - 65/40 ** Side Yard - 20 Rear Yard -NA xtor highway or local road
SMITH A-1 Suburban Residence Permitted Agricultural, Single Family, Public Parks, Playgrounds, Public And Parochial And Schools, Churches, Accessory Uses Conditional Uses Dependent Dwelling, Recreation Club, Nursery, Hospital, Clinic, Cemeteries, Open Recreation, Personal Care Home, School, Small Child Care Center
Min Lot Area - 8,000 Sq Ft Min Lot Width - 75’ Front Yard - 35’ Side Yard - 10’ Rear Yard - 20’ ¶-
81
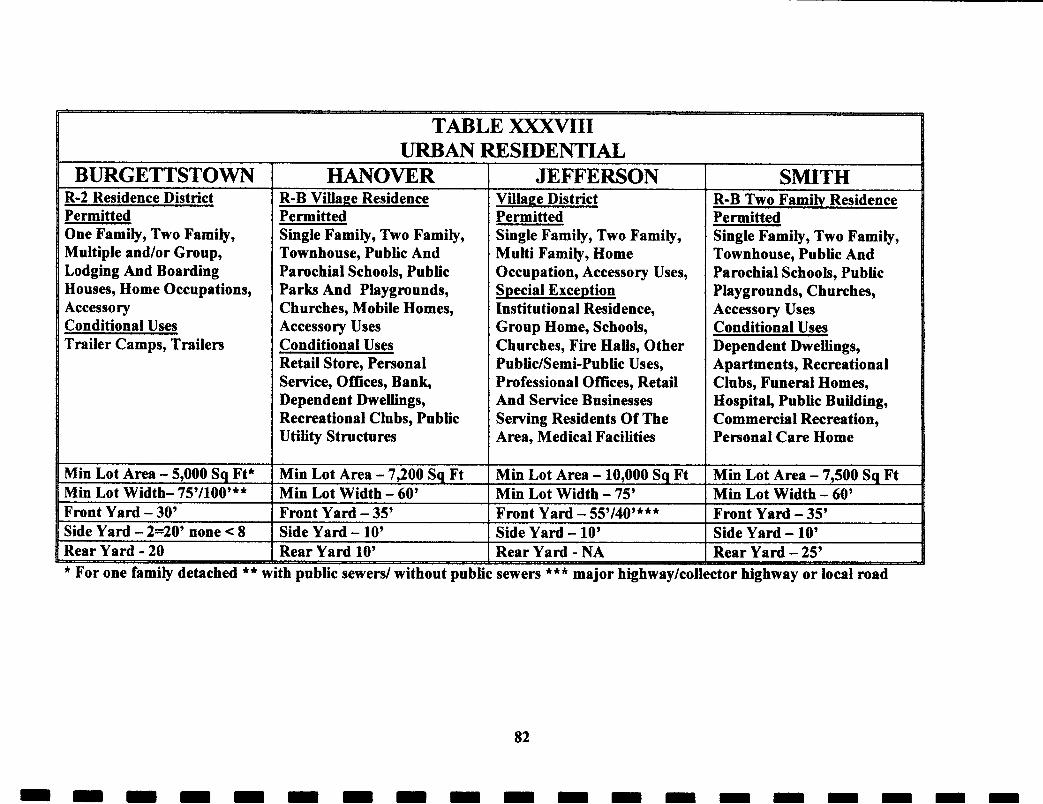
TABLE XxXvnI URBAN RESIDENTIAL
BURGETTSTOWN R-2 Residence District Permitted One Family, Two Family, Multiple and/or Group, Lodging And Boarding Houses, Home Occupations, Accessory Conditional Uses Trailer Camps, Trailers
Min Lot Area - 5.000 Sa Ft* Min Lot Width- 75’/100’** Front Yard - 30’ Side Yard - 2=20’ none < 8 Rear Yard - 20 * For one family detached ** P - _1_1
HANOVER R-B Village Residence Permitted Single Family, Two Family, Townhouse, Public And Parochial Schools, Public Parks And Playgrounds, Churches, Mobile Homes, Accessory Uses Conditional Uses Retail Store, Personal Service, Offices, Bank, Dependent Dwellings, Recreational Clubs, Public utility Structures
Min Lot Area - 7,200 Sq Ft Min Lot Width - 60’ Front Yard - 35’ Side Yard - 10’ Rear Yard 10’
JEFFERSON Villape District Permitted Single Family, Two Family, Multi Family, Home Occupation, Accessory Uses, Special Exception Institutional Residence, Group Home, Schools, Churches, Fire Halls, Other Public/Semi-Public Uses, Professional Offices, Retail And Service Businesses Serving Residents Of The Area, Medical Facilities
Min Lot Area - 10,000 Sq Ft Min Lot Width - 75’ Front Yard - 55’/40’*** Side Yard - 10’ Rear Yard - NA
th public s ewed without public sewers *** major highway/col:
82
SMITH R-B Two Family Residence Permitted Single Family, Two Family, Townhouse, Public And Parochial Schools, Public Playgrounds, Churches, Accessory Uses Conditional Uses Dependent Dwellings, Apartments, Recreational Clubs, Funeral Homes, Hospital, Public Building, Commercial Recreation, Personal Care Home
Min Lot Area - 7,500 Sq Ft Min Lot Width - 60’ Front Yard - 35’ Side Yard - 10’ Rear Yard - 25’ ctor highway or local road
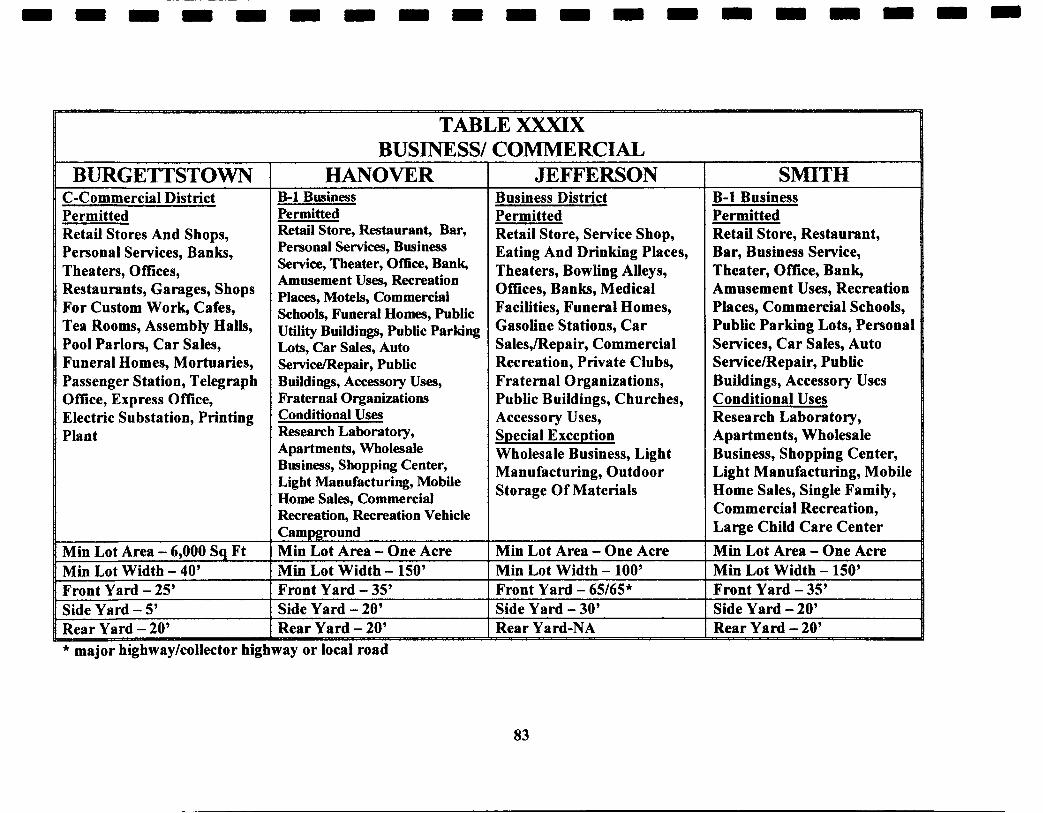
- TABLE XXXIX
BUSINESS/ COMMERCIAL BURGETTSTOWN I HANOVER
C-Commercial District Permitted Retail Stores And Shops, Personal Services, Banks, Theaters, Offices, Restaurants, Garages, Shops For Custom Work, Cafes, Tea Rooms, Assembly Halls, Pool Parlors, Car Sales, Funeral Homes, Mortuaries, Passenger Station, Telegraph Office, Express Office, Electric Substation, Printing Plant
B-1 Brrsiness Permitted Retail Store, Restaurant, Bar, Personal Services, Business Service, Theater, Office, Bank, Amusement Uses, Recreation Places, Motels, Commercial Schools, Funeral Homes, Public Utility Buildings, Public Parking Lots, Car Sales, Auto ServiceIRepair, Public Buildings, Accessory Uses, Fraternal Organizations Conditional Uses Research Laboratory, Apartments, Wholesale Business, Shopping Center, Light Manufacturing, Mobile Home Sales, Commercial Recreation, Recreation Vehicle Camwround
Min Lot Area - 6,000 SQ Ft I Min Lot Area - One Acre Min Lot Width - 40’ Front Yard - 25’
Min Lot Width - 150’ Front Yard - 35’
Side Yard - 5’ Rear Yard - 20’
Side Yard - 20’ Rear Yard - 20’
JEFFERSON SMITH Business District Permitted Retail Store, Service Shop, Eating And Drinking Places, Theaters, Bowling Alleys, Offices, Banks, Medical Facilities, Funeral Homes, Gasoline Stations, Car Sales,/Repair, Commercial Recreation, Private Clubs, Fraternal 0 rganiza tions, Public Buildings, Churches, Accessory Uses, Special Exception Wholesale Business, Light Manufacturing, Outdoor Storage Of Materials
I B-1 Business Permitted Retail Store, Restaurant, Bar, Business Service, Theater, Office, Bank, Amusement Uses, Recreation Places, Commercial Schools, Public Parking Lots, Personal Services, Car Sales, Auto Service/Repair, Public Buildings, Accessory Uses Conditional Uses Research Laboratory, Apartments, Wholesale Business, Shopping Center, Light Manufacturing, Mobile Home Sales, Single Famity, Commercial Recreation, Large Child Care Center
Min Lot Area - One Acre Min Lot Width - 100’
Min Lot Area - One Acre Min Lot Width - 150’
Front Yard - 65/65* Side Yard - 30’ Rear Y ard-NA
Front Yard - 35’ Side Yard - 20’ Rear Yard - 20’
* major highway/collector highway or local road
83
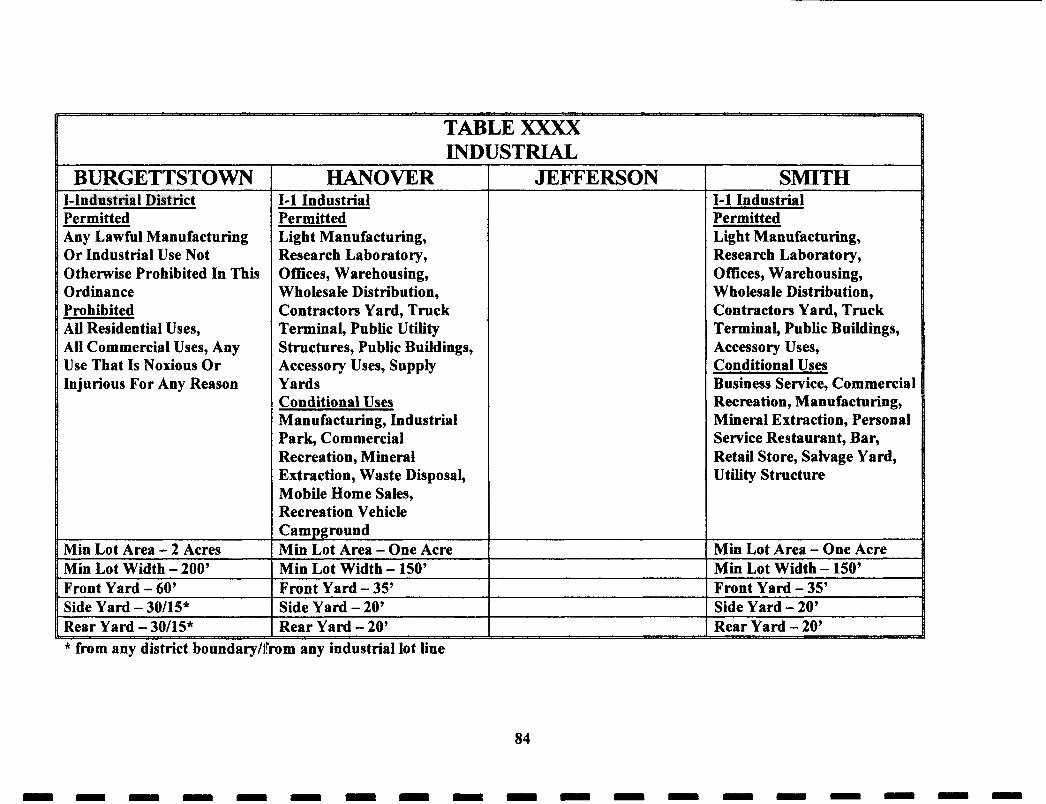
TABLE XXXX INDUSTRIAL
I BURGETTSTOWN I-Industrial District Permitted Any Lawful Manufacturing Or Industrial Use Not Otherwise Prohibited In This Ordinance Prohibited All Residential Uses, All Commercial Uses, Any Use That Is Noxious O r Injurious For Any Reason
Min Lot Area - 2 Acres Min Lot Width - 200’ Front Yard - 60’ Side Yard - 30/15* Rear Yard - 30/15* * from any district boundaryM
HANOVER 1-1 Industrial
JEFFERSON
Permitted Light Manufacturing, Research Laboratory, Offices, Warehousing, Wholesale Distribution, Contractors Yard, Truck Terminal, Public Utility Structures, Public Buildings, Accessory Uses, Supply Yards Conditional Uses Manufacturing, Industrial Park, Commercial Recreation, Mineral Extraction, Waste Disposal, Mobile Home Sales, Recreation Vehicle Campground
jrn any industrial lot line
SMITH 1-1 Industrial Permitted Light Manufacturing, Research La bora tory , Offices, Warehousing, Wholesale Distribution, Contractors Yard, Truck Terminal, Public Buildings, Accessory Uses, Conditional Uses Business Service, Commercial Recreation, Manufacturing, Mineral Extraction, Personal Service Restaurant, Bar, Retail Store, Salvage Yard, utility structure
Min Lot Area - One Acre Min Lot Width - 150’ Front Yard - 35’ Side Yard - 20’ Rear Yard - 20’
I I I I I I I I I I I I I I I I I I
FINDINGS A N D CONCLUSIONS - EXISTING ZONING ORDINANCES The following findings and conclusions from existing zoning ordinance data are relevant the plan recommendations:
e
0
e
e
e
e
e
0
e
0
0
e
e
Uses in each of the ordinance can be generalized and divided into six categories.
The generalized conservation uses includes parks, recreation areas, open space uses and low density single family development.
The generalized agricultural uses include agricultural activities, open space activities, public uses and low density residential uses.
The generalized suburban uses include public uses and single family dwellings on lots of 7,200 square feet to one acre.
The generalized urban uses include single famity, multi-family, public uses and light commercial uses. Dwellings are permitted on lots from 5,000 square feet to 10,000 square feet.
In Smith and Hanover Townships apartments are permitted as conditional uses in the generalized commercial and business category. All other uses are limited to retail outlets for food, clothing, and general merchandise. Some light industrial is permitted in Hanover and Smith in this category.
No residential uses are permitted in the generalized industrial uses. Jefferson Township does not include any industrial uses in their ordinance.
In order the comply with Pennsylvania law and protect against exclusionary challenges, each community provides for a wide variety of residential and non-residential uses io each Zoning Ordinance.
Agricultural and Conservation are the two predominate zoning districts.
Commercial zoning is scattered throughout each community at major intersections and along Route 18 and 22.
In most cases suburban residential zoning follows existing land use rather than major road or available sewers.
Urban zoning Is applied to existing villages and concentrations of small lot developments.
Industrial zoning is scattered with only some of the zoned areas cbse to major arterial roads.
85
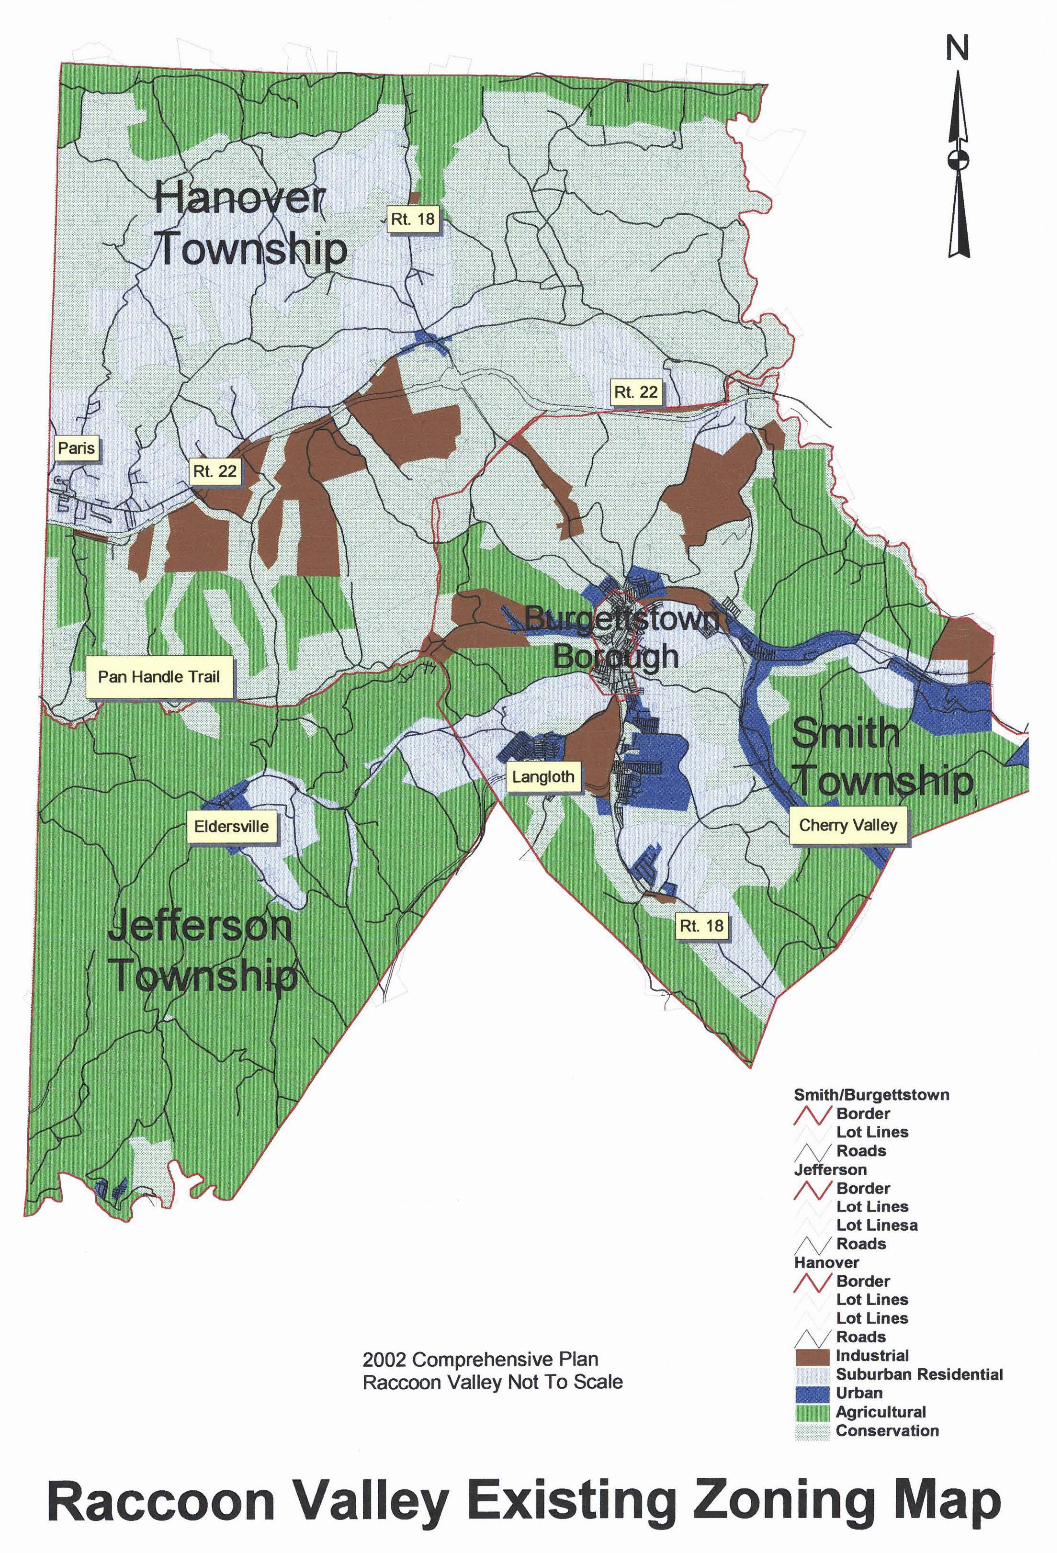
CITIZEN PARTICIPATION
II I I I I I I I I I I I I I I I
Citizen participation is a very important part of any planning process. The information collected in the citizen participation program is used throughout the plan in the appropriate sections. This section is a collection of all the information received in the various citizen participation programs.
A steering committee has been developed to work with the planning consultants on this project. The committee is formed of two (2) representatives from each community. These representatives include planning commission members, elected officials and staff members. The steering committee met once a month on a regular day at the same location. These meetings were open to the public to observe but not participate.
Each of the communities in the Region has done written citizen surveys. Burgettstown Borough, Hanover Township and Smith Township did these surveys as part of this planning project. Jefferson Township completed their survey in 1998 and held an open forum public meeting in July 2000 conjunction with this plan.
In addition to the regular steering committee meetings and the citizen surveys each community has been making public announcements at public meetings and in community news letters letting the community know that the planning project was underway and that comments were welcome. On two occasions the Penn FOCUS, a local newspaper, has done feature articles publicizing the comprehensive planning process and has published the consultants names and how to reach the consultants to provide input into the process.
Burnettstown Borough
The method of distribution chosen by the Borough was a contributing factor in the number of completed and returned surveys. Surveys were available at the Borough Building and two local business for pick-up and drop-off. Ten (10) surveys were completed and returned representing a 1.3% rate of return. A summary of the results are followed by a tally of the returns.
60% of the respondents have lived in the Borough more than 20 years. The majority of respondents were female. The age distribution of respondents covered all age groups except the 55-59 age group. Seven of the respondents were from households of three (3) or more persons. According to the 1990 Census in the Borough there were 2.39 persons per household. In 40% of the respondents no one worked outside the home. Of the 22.2% of respondents that thought they may move from the Borough in the next five (5) years the top two reasons were ‘Change in family status” and “Dissatisfaction with Township services.” 80% of the respondents now occupy the first home they occupied in the Borough and the majority chose the Borough to live to be convenient to friends and family. Four of the ten respondents knew nothing about the Southern Bettway. One of the nine (9) respondents believed the Findlay Connector part of the Beltway would be a detriment. One half of the respondents did not believe that making Route 18 a four lane road from Burgettstown to Route 22 would benefit the Borough.
86
0 There were more “poor” evaluations of Borough services than there were “good” and “excellent” evaluations combined.
0 Fire protection received the highest number of “excellent” evaluations. 0 Road maintenance and recreation programs received the highest number of “poor”
evaluations. 0 70% of the respondents have heard or are knowledgeable about the Pan Handle Trail and
60% believe it will be an asset to the Borough. 50% of respondents believe persons in their household will use the trail “sometimes” or ‘regularly” while the remaining 50% will “never” or “rarely” use it.
0 The Penn Focus and “Word of Mouth” were the two methods where respondents most often revived information about the Borough.
0 All of the respondents own the homes that they now live in and 40% believe the condition of the properties in their neighborhoods is declining.
0 None of the respondents think there are adequate shopping opportunities in the Borough.
87
I I I I 1 I I I I I I I I I I I I I I
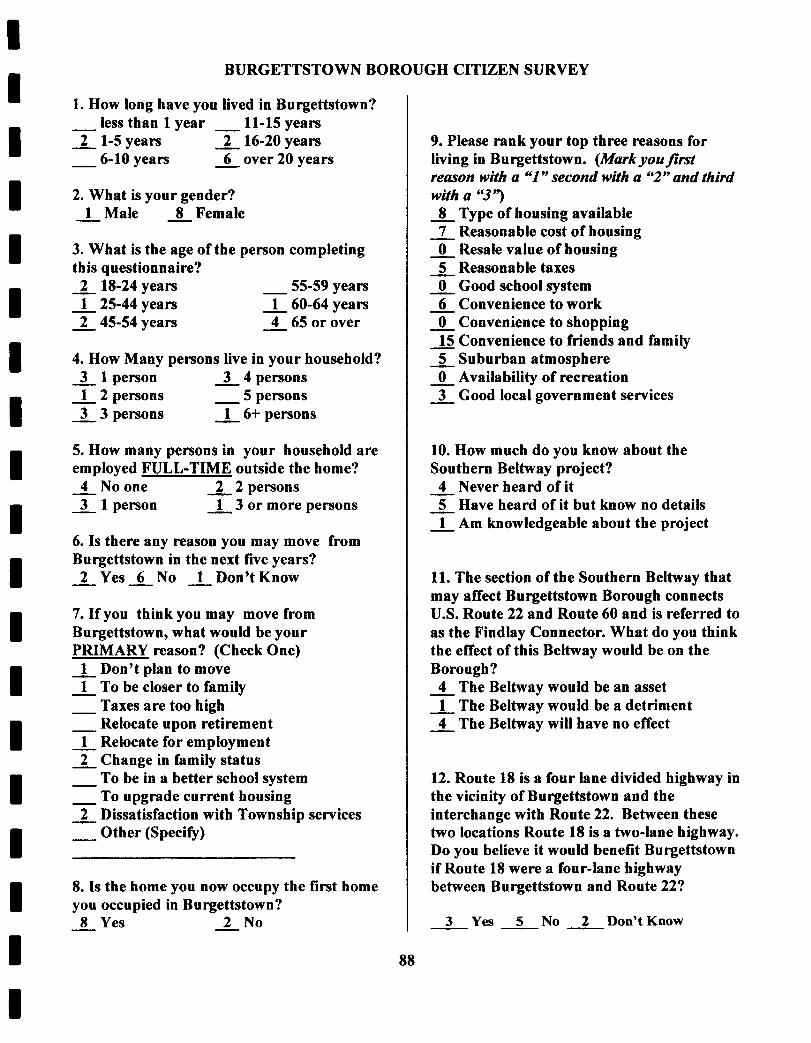
I I I I I I I I I I I I I I I I I I I
BURGETTSTOWN BOROUGH CITIZEN SURVEY
1. How long have you lived in Burgettstown? - less than 1 year - 11-15 years - 2 1-5years - 2 16-20years - 6-10 years - 6 over 20 years
2. What is your gender? - 1 Male - 8 Female
3. What is the age of the person completing this questionnaire? - 2 18-24years - 55-59 years - 1 25-44years - 1 60-64years - 2 45-54years - 4 65orover
4. How Many persons live in your household? - 3 1 person - 3 4persons - 1 2persons - 5 persons - 3 3 persons - 1 6+persons
5. How many persons in your household are employed FULL-TIME outside the home? - 4 Noone - 2 2 persons - 3 1 person - 1 3 or more persons
6. Is there any reason you may move from Burgettstown in the next five years? - 2 Y e s L N o LDon’ tKnow
7. If you think you may move from Burgettstown, what would be your PRIMARY reason? (Check One) - 1 Don’t plan to move - 1 To be closer to family - Taxes are too high - Relocate upon retirement - 1 Relocate for employment - 2 Change in family status - To be in a better school system - To upgrade current housing - 2 Dissatisfaction with Township services - Other (Specify)
8. Is the home you now occupy the first home you occupied in Burgettstown?
2 No - 8 Yes -
9. Please rank your top three reasons for living in Burgettstown. (Mark youfirst reason with a “1 ’’ second with a “2” and third with a “3’9 - 8 Type of housing available - 7 Reasonable cost of housing - 0 Resale value of housing - 5 Reasonable taxes - 0 Good school system - 6 Convenience to work - 0 Convenience to shopping - 15 Convenience to friends and family - 5 Suburban atmosphere - 0 Availability of recreation - 3 Good local government services
10. How much do you know about the Southern Beltway project? - 4 Never heard of it - 5 Have heard of it but know no details - 1 Am knowledgeable about the project
11. The section of the Southern Beltway that may affect Burgettstown Borough connects U.S. Route 22 and Route 60 and is referred to as the Findlay Connector. What do you think the effect of this Beltway would be on the Borough? - 4 The Beltway would be an asset - 1 The Beltway would be a detriment - 4 The Beltway will have no effect
12. Route 18 is a four lane divided highway in the vicinity of Burgettstown and the interchange with Route 22. Between these two locations Route 18 is a two-lane highway. Do you believe it would benefit Burgettstown if Route 18 were a four-lane highway between Burgettstown and Route 22?
3 Yes 5 No 2 Don’tKnow
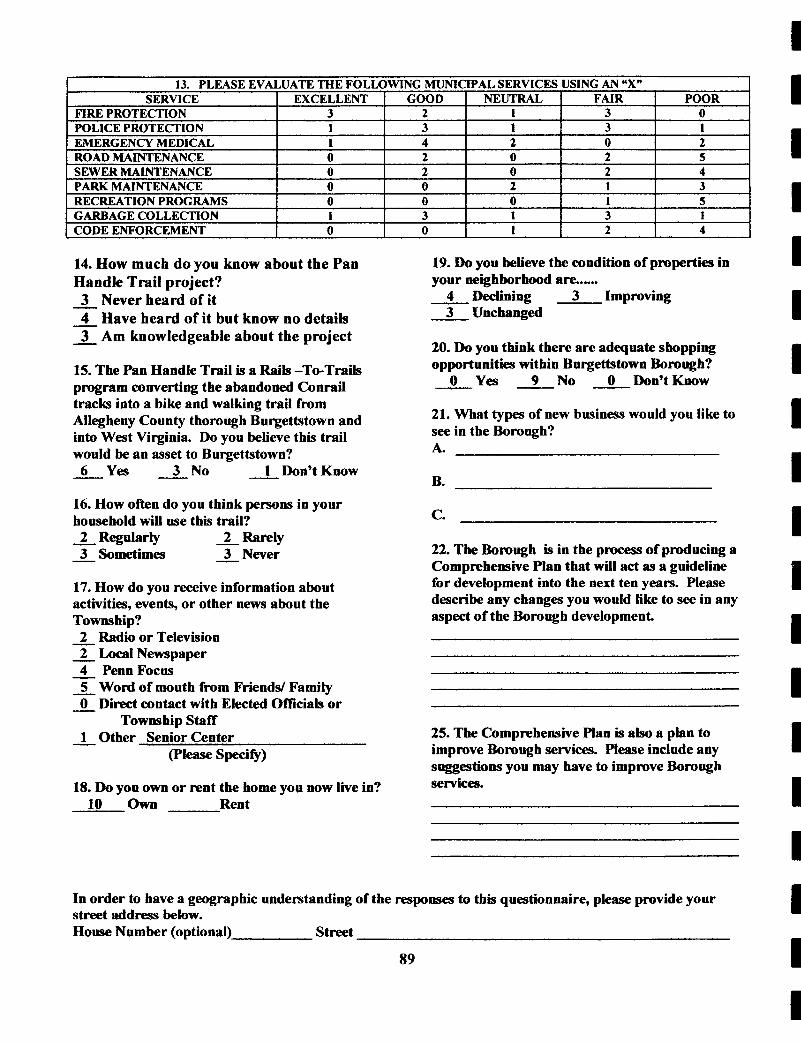
[ CODE ENFORCEMENT I 0 I 0 I 1 I 2 1 4 1 14. How much do you know about the Pan Handle Trail project? - 3 Never heard of it - 4 Have heard of it but know no details - 3 Am knowledgeable about the project
15. The Pan Handle Trail is a Raib -To-Trails program converting the abandoned Conrail tracks into a bike and walking trail from Allegheny County thorough Burgettstown and into West Virginia. Do you believe this trail would be an asset to Burgettstown? &Yes - 3 No - 1 Don’t Know
16. How often do you think persons in your household will use this trail?
- 3 Sometimes - 3 Never 7 2 Regularly - 2 Rarely
17. How do you receive information about activities, events, or other news about the Township? - 2 Radio o r Television - 2 LocalNewspaper - 4 PennFocus - 5 Word of mouth from Friends/ Family - 0 Direct contact with Elected Officials or
- 1 Other Seniorcenter Township Staff
cpl- Specify)
18. Do you own or rent the home you now live in? 10 own Rent
19. Do you believe the condition of properties in your neighborhood are..... - 4 Declining 3 Improving
3 Unchanged - 20. Do you think there are adequate shopping opportunities within Burgettstown Borough?
0 Yes 9 No 0 Don’tKhow - 21. What types of new business would you like to see in the Borough? A.
B.
C.
22. The Borough is in the process of producing a Comprehensive Plan that will act as a guideline for development into the next ten years. Please describe any changes you would like to see in any aspect of the Borough development.
25. The Comprehensive Plan is also a plan to improve Borough services. Please include any suggestions you may have to improve Borough Servtces.
In order to have a geographic understanding of the responses to this questionnaire, please provide your street address below. House Number (optional) street
89
I I I I I I I I I 1 1 I I I I I I I I
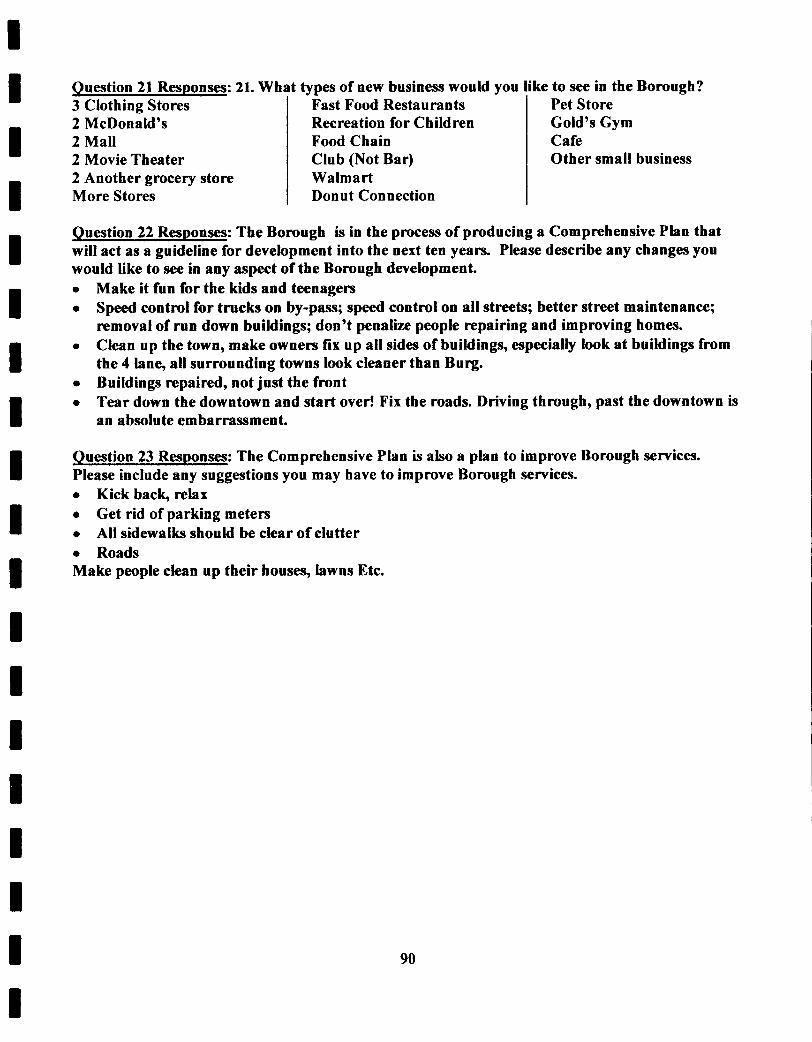
I I I I I I I I I I I I I I 1 I I 1 I
Fast Food Restaurants Recreation for Children Food Chain Club (Not Bar) Walmart Donut Connection
Ouestion 21 Responses: 21. Wh 3 Clothing Stores 2 McDonald’s 2 Mall 2 Movie Theater 2 Another grocery store More Stores
Pet Store Gold’s Gym Cafe Other small business
Question 22 Responses: The Borough is in the process of producing a Comprehensive Plan that will act as a guideline for development into the next ten years. Please describe any changes you would like to see in any aspect of the Borough development. 0
0
0
0
0
Make it fun for the kids and teenagers Speed control for trucks on by-pass; speed control on all streets; better street maintenance; removal of run down buildings; don’t penalize people repairing and improving homes. Clean up the town, make owners fix up all sides of buildings, especially look at buildings from the 4 lane, all surrounding towns look cleaner than Burg. Buildings repaired, not just the front Tear down the downtown and start over! Fix the roads. Driving through, past the downtown is an absolute embarrassment.
Question 23 Responses: The Comprehensive Plan is also a plan to improve Borough services. Please include any suggestions you may have to improve Borough services. 0 Kick back, relax 0 Get rid of parking meters 0 All sidewalks should be clear of clutter 0 Roads Make people clean up their houses, lawns Etc.
90
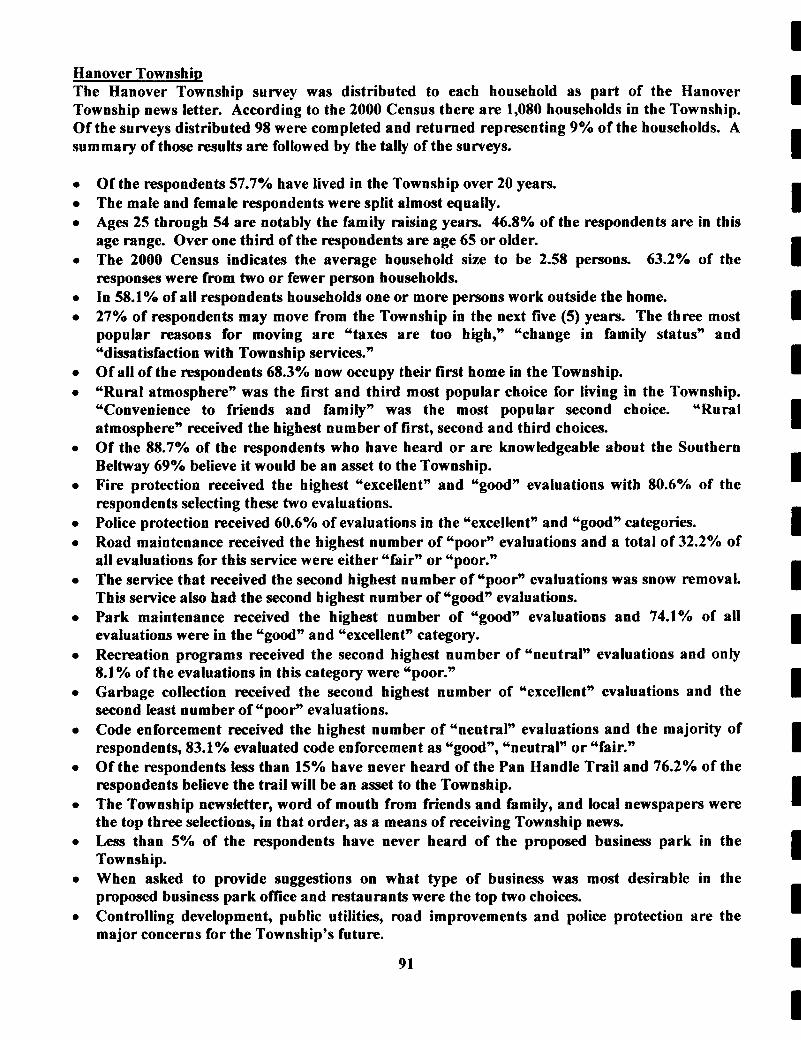
I Hanover Township The Hanover Township survey was distributed to each household as part of the Hanover Township news letter. According to the 2000 Census there are 1,080 households in the Township. Of the surveys distributed 98 were completed and returned representing 9% of the households. A summary of those results are followed by the tally of the surveys.
Of the respondents 57.7% have lived in the Township over 20 years. The male and female respondents were split almost equally. Ages 25 through 54 are notably the family raising years. 46.8% of the respondents are in this age range. Over one third of the respondents are age 65 or older. The 2000 Census indicates the average household size to be 2.58 persons. 63.2% of the responses were from two or fewer person households. I n 58.1% of all respondents households one or more persons work outside the home. 27% of respondents may move from the Township in the next five (5) years. The three most popular reasons for moving are “taxes are too high,” “change in family status” and “dissatisfaction with Township services.” Of all of the respondents 68.3% now occupy their first home in the Township. “Rural atmosphere” was the first and third most popular choice for living in the Township. “Convenience to friends and family” was the most popular second choice. “Rural atmosphere” received the highest number of first, second and third choices. Of the 88.7% of tbe respondents who have heard or are knowledgeable about the Southern Beltway 69% believe it would be an asset to the Township. Fire protection received the highest “excellent” and “good” evaluations with 80.6% of the respondents selecting these two evaluations. Police protection received 60.6% of evaluations in the “excellent” and “good” categories. Road maintenance received tbe highest number of “poor” evaluations and a total of 32.2% of all evaluations for this service were either “fair” or “poor.” The service that received the second higbest number of “poor” evaluations was snow removal This service also bad the second highest number of “good” evaluations. Park maintenance received the highest number of “good” evaluations and 74.1% of all evaluations were in the “good” and “excellent” category. Recreation programs received the second highest number of “neutral” evaluations and only 8.1% of the evaluations in this category were “poor.” Garbage collection received the second highest number of “excellent” evaluations and the second least number of “poor” evaluations. Code enforcement received the highest number of “neutral” evaluations and the majority of respondents, 83.1% evaluated code enforcement as “good”, “neutral” or “fair.” Of the respondents less than 15% have never heard of the Pan Handle Trail and 76.2% of the respondents believe the trail will be an asset to the Township. The Township newsletter, word of mouth from friends and family, and local newspapers were the top three selections, in that order, as a means of receiving Township news. Less than 5% of the respondents have never heard of the proposed business park in the Township. When asked to provide suggestions on what type of business was most desirable in the proposed business park office and restaurants were the top two choices. Controlling development, public utilities, road improvements and police protection are the major concerns for the Township’s future.
91
I I I I I I I I I I I I I I I I I I I
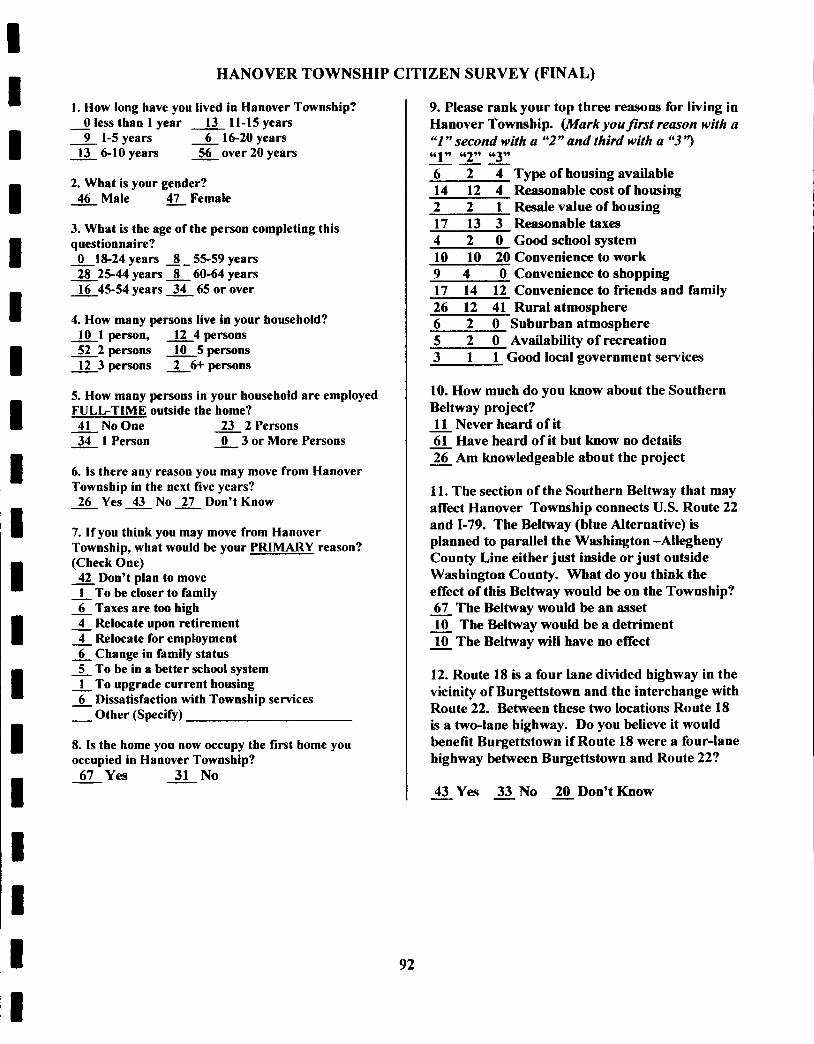
I I I I I I 1 I I I I
HANOVER TOWNSHIP CITIZEN SURVEY (FINAL)
1. How long have you lived in Hanover Township? - 0 less than I year 2 11-15 years - 9 1-5 years - 6 16-20 years - 13 6-10years - 56 over 20 years
2. What is your gender? - 46 Male - 47 Female
3. What is the age of the person completing this questionnaire? - 0 18-24 years 8 - 55-59 years - 28 25-44 years 8 60-64 years - 16 45-54 years 34 65 or over
4. How many persons live in your household? - 10 1 person, 1 2 4 persons - 52 2 persons &Spersons - 12 3 persons 2 6 - t persons
5. How many persons in your household are employed FULL-TIME outside the home? - 41 NoOne - 23 2 Persons
0 3 or More Persons - 34 1 Person - 6. Is there any reason you may move from Hanover Township in the next five years? - 26 Yes 43 No 27 Don’t Know
7. If you think you may move from Hanover Township, what would be your PRIMARY reason? (Check One) - 42 Don’t plan to move - 1 To be closer to family - 6 Taxes are too high - 4 Relocate upon retirement - 4 Relocate for employment _. 6 Change in family status - 5 To be in a better school system - 1 To upgrade current housing _. 6 Dissatisfaction with Township services _. Other (Specify)
8. Is the home you now occupy the first home you occupied in Hanover Township?
31 No 67 Yes -
9. Please rank your top three reasons for living in Hanover Township. (Mark youfirst remon with a “I ” second with a “2” and third with a “3”) 1 2 3
6 2 4 Type of housing available 14 12 4 Reasonable cost of housing 2 2 1 Resalevalueofhousing 17 13 3 Reasonabletaxes 4 2 0 Goodschoolsystem 10 10 20 Convenience to work
(6 99 b 99 U 99 ---
9 4 0 Conveniencetoshopping 17 14 12 Convenience to friends and family 26 12 41 Ruralatmosphere 6 2 0 Suburbanatmosphere 5 2 0 Availabilityofrecreation 3 1 1 Good local government services
10. How much do you know about the Southern Beltway project? - 11 Never heard of it - 61 Have heard of it but know no details - 26 Am knowledgeable about the project
11. The section of the Southern Beltway that may affect Hanover Township connects U.S. Route 22 and 1-79. The Beltway (blue Alternative) is planned to parallel the Washington -Allegheny County Line either just inside or just outside Washington County. What do you think the effect of this Beltway would be on the Township? - 67 The Beltway would be an asset - 10 The Beltway would be a detriment - 10 The Beltway will have no effect
12. Route 18 is a four lane divided highway in the vicinity of Burgettstown and the interchange with Route 22. Between these two locations Route 18 is a two-lane highway. Do you believe it would benefit Burgettstown if Route 18 were a four-lane highway between Burgettstown and Route 22?
- 43 Yes =No Z D o n ’ t K n o w
92
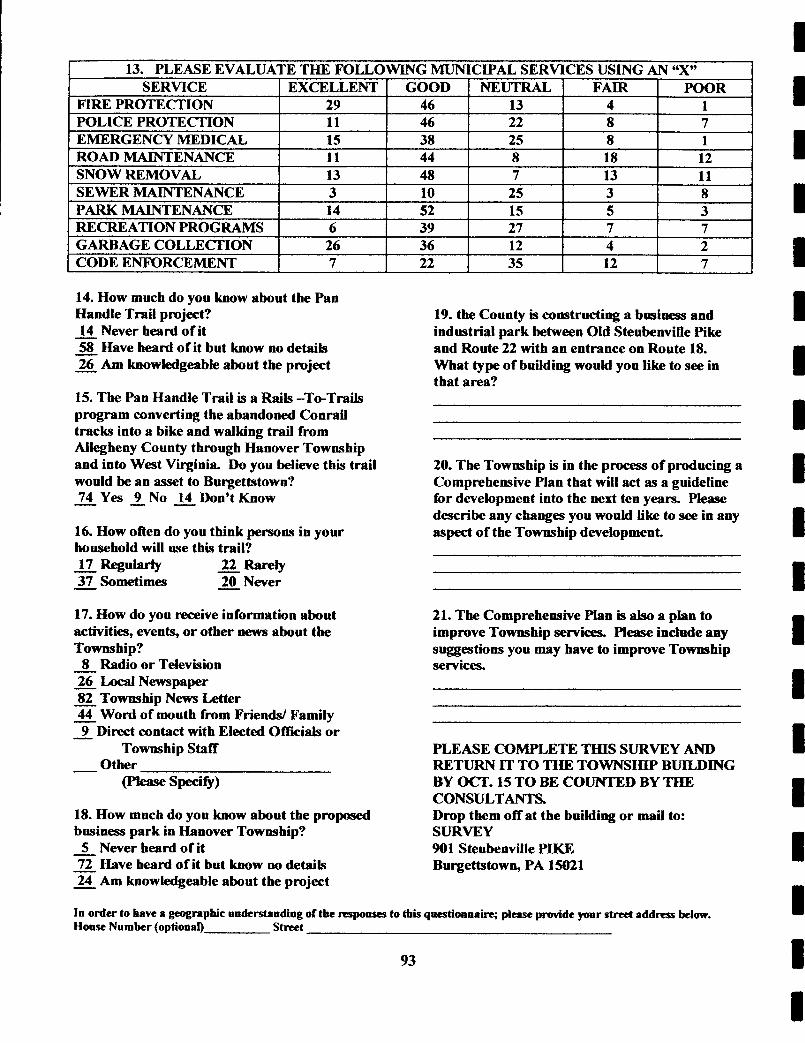
PARK MAINTENANCE RECREATION PROGRAMS GARBAGE COLLECTION CODE ENFORCEMENT
14. How much do you know about the Pan Handle Trail project? - 14 Never heard of it - 58 Have beard of it but know no detaifs - 26 Am knowledgeabfe about the project
14 52 15 5 3 6 39 27 7 7 26 36 12 4 2 7 22 35 12 7
15. The Pan Handle Trail is a Rails -To-Trails program converting the abandoned Conrail tracks into a bike and walking trail from Allegheny County through Hanover Township and into West Virginia. Do you believe this trail would be an asset to Burgettstown? - 74 Yes A N o 14Don ' tKnow
16. How often do you think persons in your household will use this trail?
- 37 Sometimes - 17 Regularty - 22 Rarely - 20 Never
17. How do you receive information about activities, events, o r other news about the Township? - 8 Radio or Television - 26 M N e w s p a p e r - 82 Township News Letter - 44 Word of mouth from Friends/ Family - 9 Direct contact with Elected Officials or
- Other Township Staff
(PleaseSPecifL)
18. How much do you know about the proposed business park in Hanover Township? - 5 Never heard of it - 72 Have beard of it but know no details - 24 Am knowledgeable about the project
19. the County is constructing a basiness and industrial park between Old Steubenville Pike and Route 22 with an entrance on Route 18. What type of building would you like to see in that area?
20. The Township is in the process of producing a Comprehensive Plan that will act as a guideline for development into the next ten years. Please describe any changes you would like to see in any aspect of the Township development.
21. The Comprehensive Plan is also a plan to improve Township services. Please include any suggestions you may have to improve Township services.
PLEASE COMPLETE THIS SURVEY AND RETURN IT TO THE TOWNSHIP BUILDING BY OCT. 19 TO BE COU"TJ3D BY THE CONSULTANTS. Drop them off at the building or mail to: SURVEY 901 Steubenville PIKE Burgettstown, PA 15021
In order to have a geographic onderstanding of tbe rrsponses to this qudonaairr; please provide your street a d d m Mow. H o w Number (optional) Strtet
I I I I 1 I I 1 I I I I I I I I I i 1
93
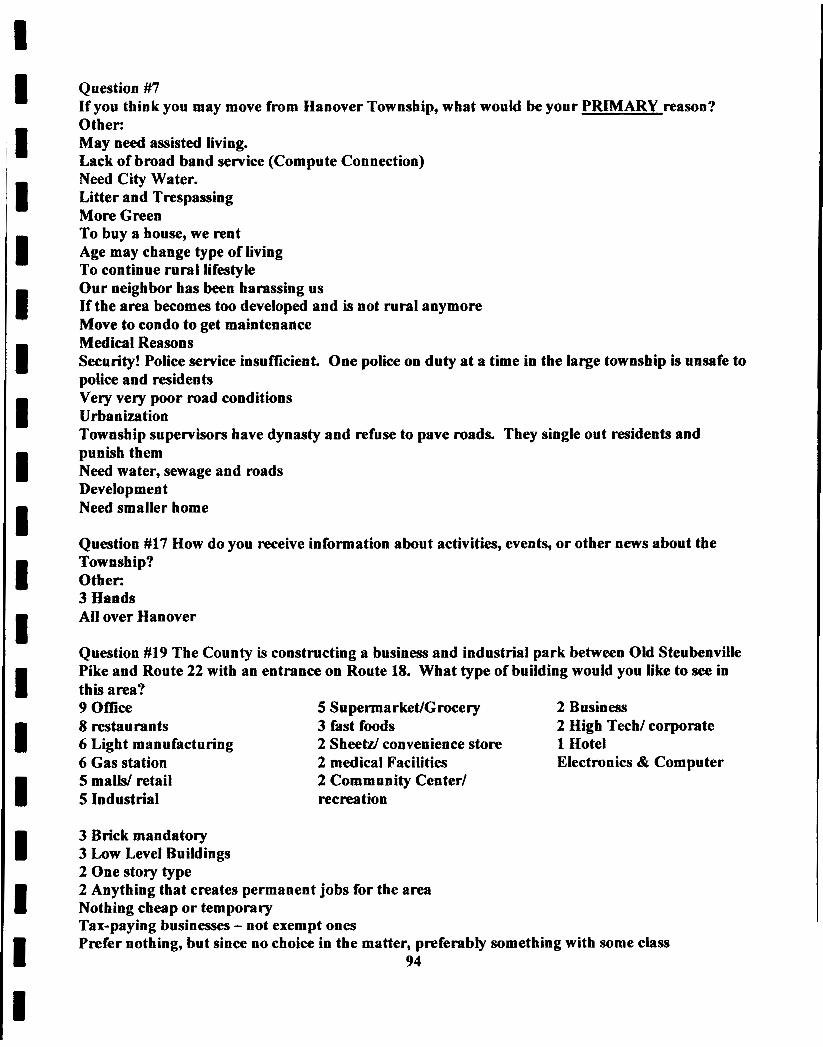
I I I I I I I I I 1 I I I I I I I I I
Question #7 If you think you may move from Hanover Township, what would be your PRIMARY reason? Other: May need assisted living. Lack of broad band service (Compute Connection) Need City Water. Litter and Trespassing More Green To buy a house, we rent Age may change type of living To continue rural lifestyle Our neighbor has been harassing us If the area becomes too developed and is not rural anymore Move to condo to get maintenance Medical Reasons Security! Police service insufficient. One police on duty at a time in the large township is unsafe to police and residents Very very poor road conditions Urbanization Township supervisors have dynasty and refuse to pave roads. They single out residents and punish them Need water, sewage and roads Development Need smaller home
Question #17 How do you receive information about activities, events, or other news about the Township? Other: 3 Hands All over Hanover
Question #19 The County is constructing a business and industrial park between OM Steubenville Pike and Route 22 with an entrance on Route 18. What type of building would you like to see in this area? 9 Office 5 Supermarket/Grocery 2 Business 8 restaurants 3 fast foods 2 High Tech/ corporate 6 Light manufacturing 6 Gas station 2 medical Facilities Electronics & Computer 5 malls/ retail 5 Industrial recreation
1 Hotel 2 Sheetz/ convenience store
2 Community Center/
3 Brick mandatory 3 JAW Level Buildings 2 One story type 2 Anything that creates permanent jobs for the area Nothing cheap or temporary Tax-paying businesses - not exempt ones Prefer nothing, but since no choice in the matter, preferably something with some class
94
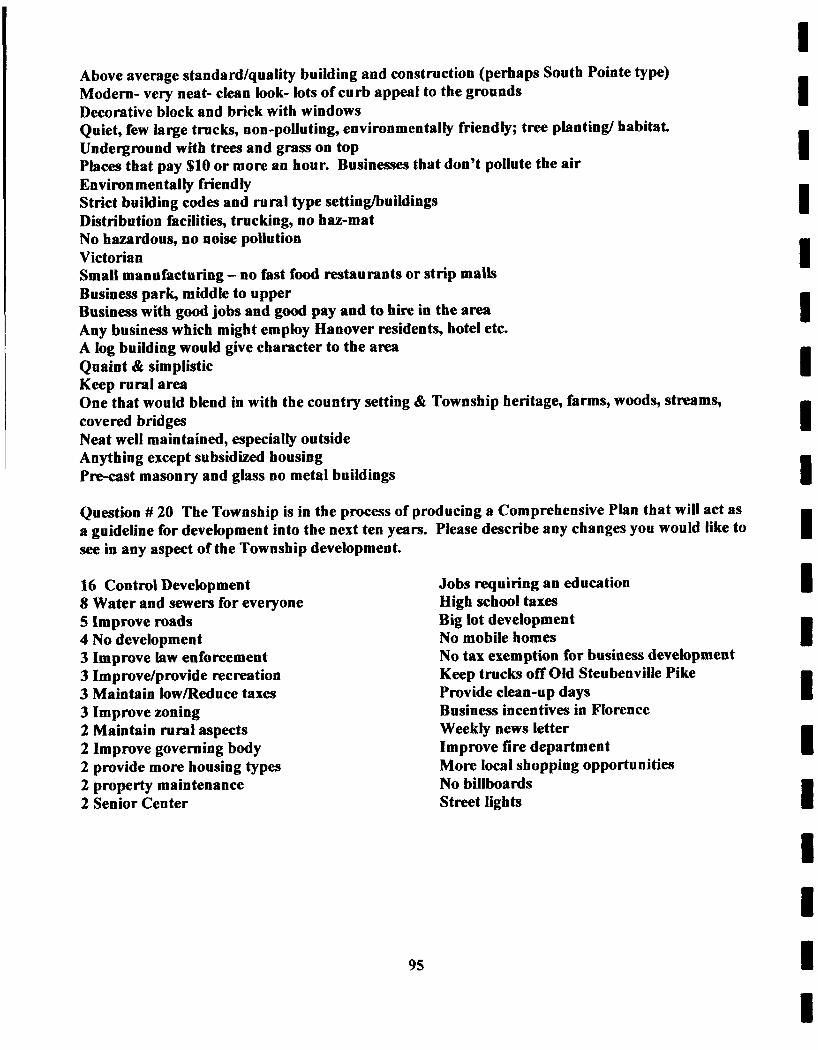
Above average standard/quality building and construction (perhaps South Pointe type) Modern- very neat- clean look- lots of curb appeal to the grounds Decorative block and brick with windows Quiet, few large trucks, non-polluting, environmentally friendly; tree planting/ habitat. Underground with trees and grass on top Places that pay $10 or more an hour. Businesses that don’t pollute the air Environmentally friendly Strict building codes and rural type settinghuildings Distribution facilities, trucking, no haz-mat No hazardous, no noise pollution Victorian Small manufacturing - no fast food restaurants or strip malls Business park, middle to upper Business with good jobs and good pay and to hire in the area Any business which might employ Hanover residents, hotel etc. A log building would give character to the area Quaint & simplistic Keep rural area One that would blend in with the country setting & Township heritage, farms, woods, streams, covered bridges Neat well maintained, especially outside Anything except subsidized housing Pre-cast masonry and glass no metal buildings
Question # 20 The Township is in the process of producing a Comprehensive Plan that will act as a guideline for development into the next ten years. Please describe any changes you would like to see in any aspect of the Township development.
16 Control Development 8 Water and sewers for everyone 5 Improve roads 4 No development 3 Improve law enforcement 3 Improve/provide recreation 3 Maintain low/Reduce taxes 3 Improve zoning 2 Maintain rural aspects 2 Improve governing body 2 provide more housing types 2 property maintenance 2 Senior Center
95
Jobs requiring an education High school taxes Big lot development No mobile homes No tax exemption for business development Keep trucks off Old Steubenville Pike Provide clean-up days Business incentives in Florence Weekly news letter Improve fire department More local shopping opportunities No billboards Street lights
1 I I I 1 1 I I 1 I I 1 I I I I I I I
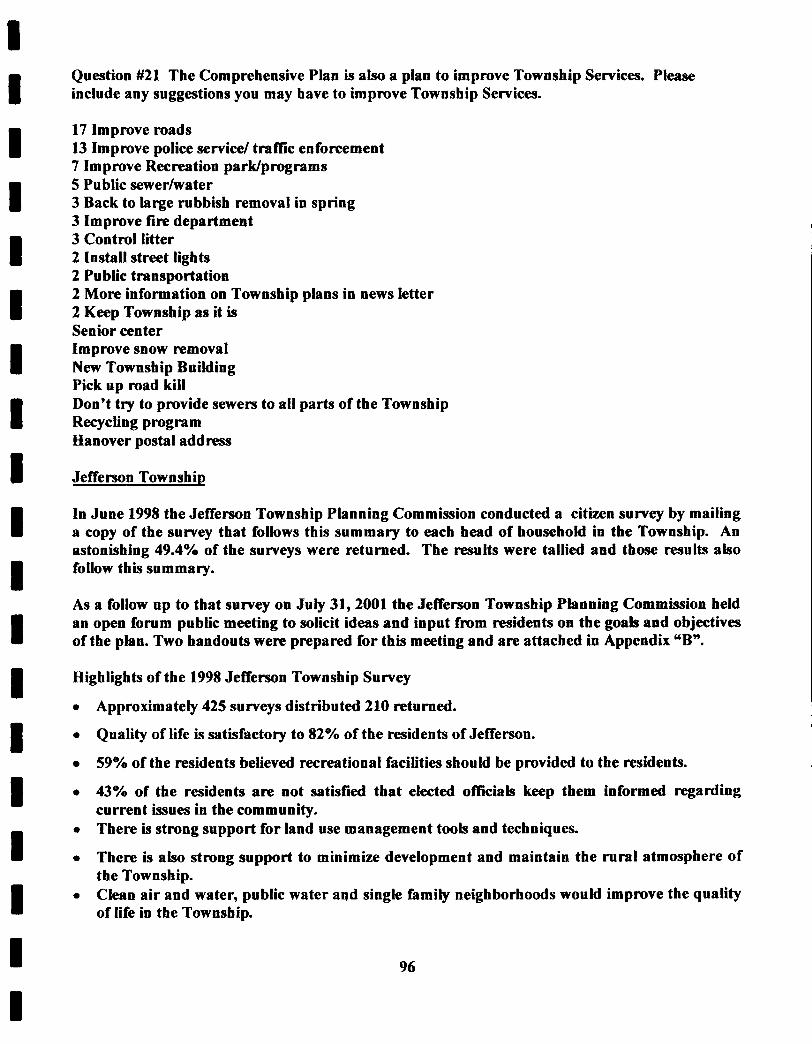
I 1 1 I I I I 1 1 I I I I 1 1 I I 1
Question #21 The Comprehensive Plan is also a plan to improve Township Services. Please include any suggestions you may have to improve Township Services.
17 Improve roads 13 Improve police service/ tramc enforcement 7 Improve Recreation parWprograms 5 Public sewedwater 3 Back to large rubbish removal in spring 3 Improve fire department 3 Control litter 2 Install street lights 2 Public transportation 2 More information on Township plans in news letter 2 Keep Township as it is Senior center Improve snow removal New Township Building Pick up road kill Don’t try to provide sewers to all parts of the Township Recycling program Hanover postal address
Jefferson Township
In June 1998 the Jefferson Township Planning Commission conducted a citizen survey by mailing a copy of the survey that follows this summary to each head of household In the Township. An astonishing 49.4% of the surveys were returned. The results were tallied and those results also follow this summary.
As a follow up to that survey on July 31,2001 the Jefferson Township Planning Commission held an open forum public meeting to solicit ideas and input from residents on the goals and objectives of the plan. Two handouts were prepared for this meeting and are attached in Appendix “B”.
Highlights of the 1998 Jefferson Township Survey
0 Approximately 425 surveys distributed 210 returned.
0 Quality of life is satisfactory to 82% of the residents of Jefferson.
0 59% of the residents believed recreational facilities should be provided to the residents.
0 43% of the residents are not satisfied that elected oficiab keep them informed regarding current issues in the community.
0 There is strong support for land use management tools and techniques.
0 There is also strong support to minimize development and maintain the rural atmosphere of the Township.
0 Clean air and water, public water aod single family neighborhoods would improve the quality of life in the Township.
96
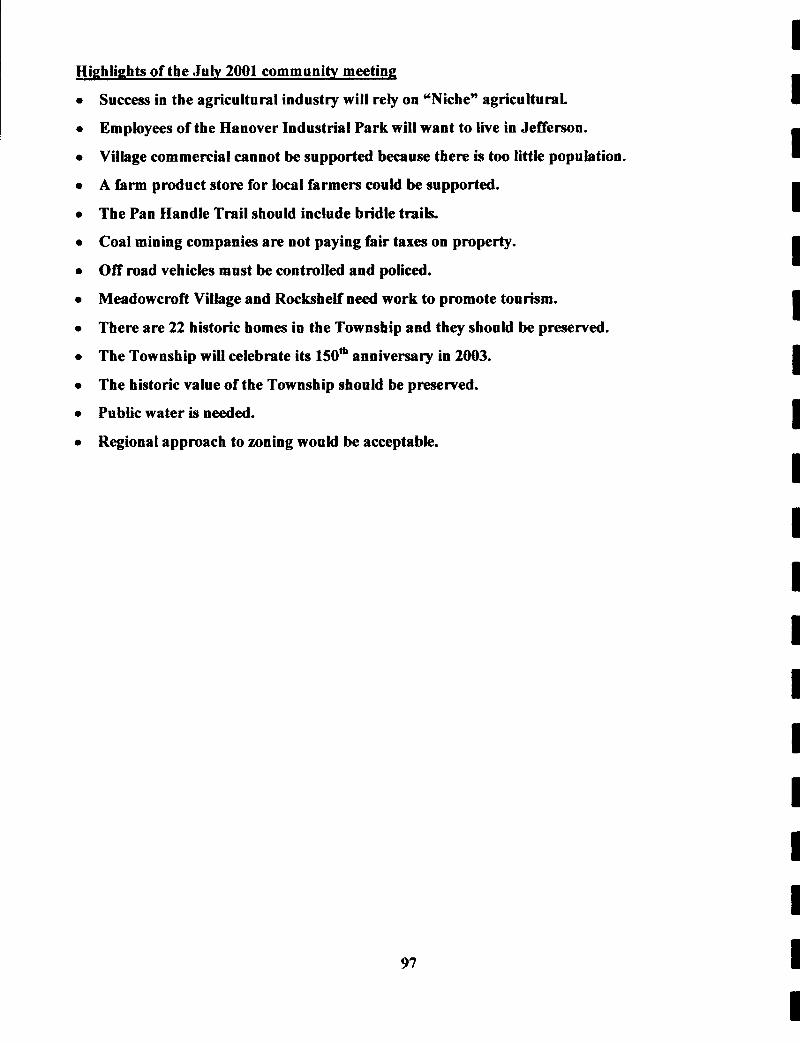
Hiphlights of the Juty 2001 community meeting 0
0
0
e
0
0
e
e
0
0
0
0
0
Success in the agricultural industry will rely on ‘Niche” agricultural.
Employees of the Hanover Industrial Park will want to live in Jefferson.
Village commercial cannot be supported because there is too little population.
A farm product store for local farmers couM be supported.
The Pan Handle Trail should include bridle trails.
Coal mining companies are not paying fair taxes on property.
Off road vehicles must be controlled and policed.
Meadowcroft Village and Rockshelf need work to promote tourism.
There are 22 historic homes in the Township and they should be preserved.
The Township will celebrate its 150* anniversary in 2003.
The historic value of the Township should be preserved.
Public water is needed.
Regional approach to zoning would be acceptable.
97
I 1 1 I I 1 I 1 I I I 1 I I I I 1 1 I
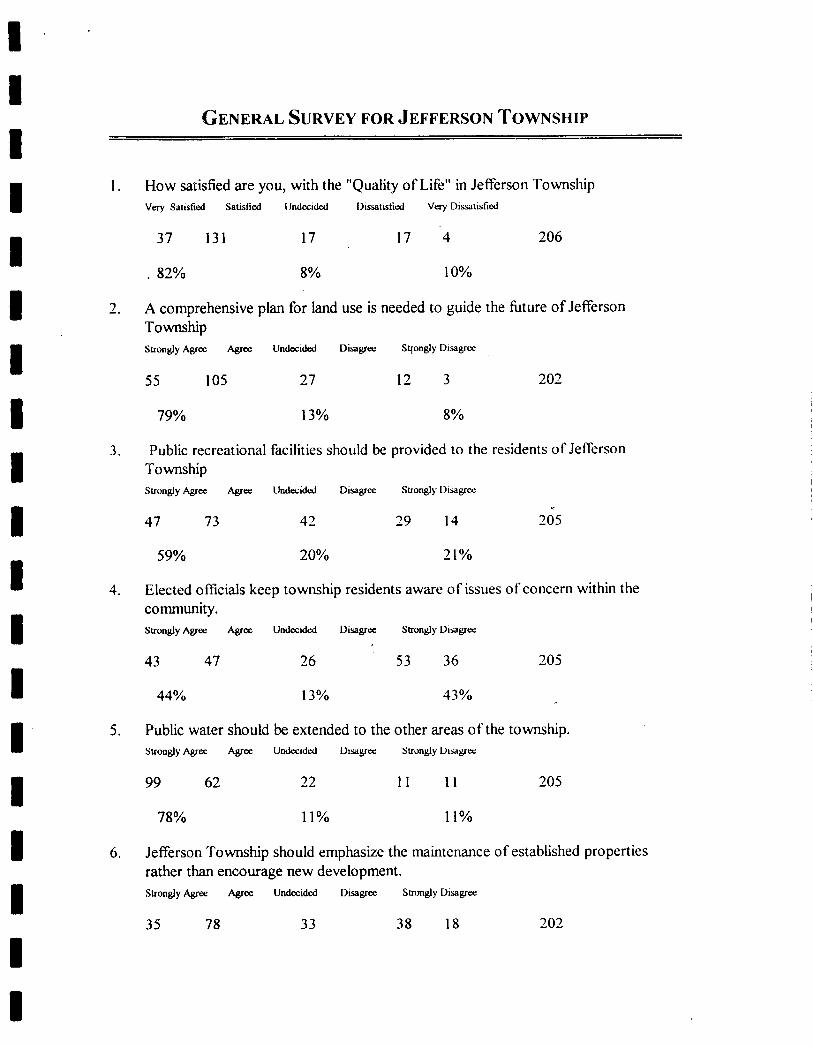
I 1 I I I I I I I I I I I
I I I I I
,I
GENERAL SURVEY FOR JEFFERSON TOWNSHIP
1 . How satisfied are you, with the "Quality of Life" in Jefferson Township Very Satistied Satisfied I Jndecided Dissatisfied Vwy Dissatisfied
37 131 17 17 4 206
. 82% 8% 10%
2. A comprehensive plan for land use is needed to guide the future of Jefferson Township Strongly Agree Agree Undecided Disagree Sqongly Disagree
55 105 27 12 3 202
79% 13% 8%
3. Public recrcational facilities should be provided to the residents of Jefferson Township Strongly Agree Agree Undecided Disagree Strongly Disagree
47 73 42 29 14 205
5 9% 20% 21%
4. Elected officials keep township residents aware o f issues of concern within the community. Strongly Agree Agree Undecided Disagree Strongly Diagrtx
43 47 26 53 36 205
44% 13% 43%
5. Public water should be extended to the other areas of the township. StrooglyAgree Agree Undecided Uisapra StrongIyUisagrtx
99 62 22 1 1 1 1 205
78% 11% 11%
6. Jefferson Township should emphasize the maintenance of established properties rather than encourage new development. Strongly Agree Agree Undecided Disagree Strongly Disagree
35 78 33 38 18 203
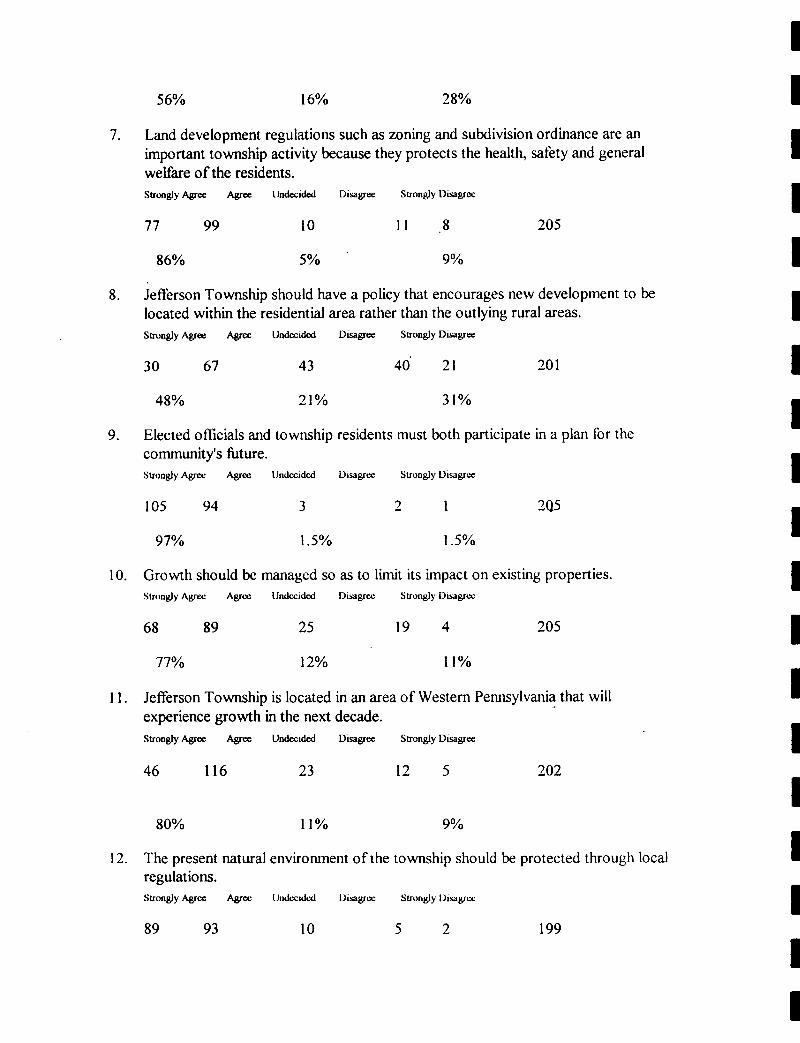
5 6% 16% 28%
7. Land development regulations such as zoning and subdivision ordinance are an important township activity because they protects the health, safety and general welfare of the residents. Strongly Agree Agree llndecided Disagree Strongly Disagree
77 99 I O 1 1 . 8 205
86% 5% 9 yo
8. Jefferson Township should have a policy that encourages new development to be located within the residential area rather than the outlying rural areas. StronglyAgree Agree Undecided Dlsagree StronglyDlsagree
30 67 43 40 21 20 1
48% 21% 31%
9. Elected officials and township residents must both participate in a plan for the community's hture. Strongly Agree Agree Undecided Disagree Strongly Diwgree
105 94 3 2 1 2Q5
97% 1.5% 1.5%
10. Growth should be managed so as to limit its impact on existing properties. Strongly Agrw Agree Undecided Disagree: Strongly Dlsapru:
68 89 25 19 4 205
77% 12% 1 1 %
1 1. Jefferson Township is located in an area of Western Pennsylvania that will experience growth in the next decade. Strongly Agree Agree Undecided Disagree Strongly Disagree
46 116 23 12 5 202
80% 11% 9%
12. The present natural environment of the township should be protected through local regulations. Strongly Agree Agree Undecided Disagree Strongly Disiagrw:
89 93 10 5 2 199
I 1 I 1 I I I I I I I I I I I I I I I
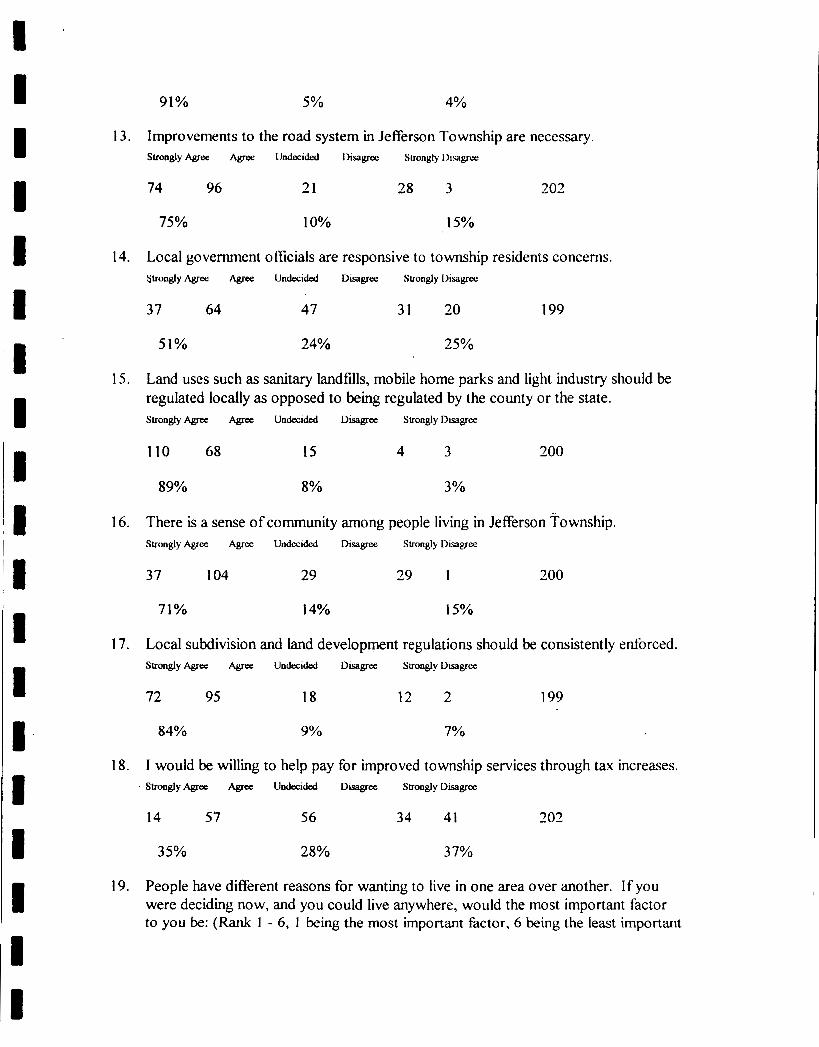
I I I 1 I I I 1 I 1 II
13.
14.
15.
16.
17.
18.
19.
91% 5 YO 4%
Improvements to the road system in Jefferson Township are necessary. Strongly Agree Agree llndecided I)isagrcc Strongly Disagrcc
74 96 21 28 3 202
75% 10% 15%
Local government officials are responsive to township residents concerns. Strongly Agree Agree Undecided Dlsagrec Strongly Disagree
37 64 47 31 20 199
51% 24% 25%
Land uses such as sanitary landfills, mobile home parks and light industry should be regulated locally as opposed to being regulated by the county or the state.
110 68 15 4 3 200
StronglyAgree Agree Undecided Disagree StronglyDisagre
89% 8% 3%
There is a sense of community among people living in Jefferson Township. Strongly Agree Agree Undecided Disagree Strongly Disagree
37 104 29 29 1 200
71% 14% 15%
Local subdivision and land development regulations should be consistently enforced. Strongly Agree Agree Undecided Disagree Suongly Disagree
72 95 18 12 2 199
84% 9% 7Y"
I would be willing to help pay for improved township services through tax increases. Strongly Agree Agree Undecided Disagree StronglyDlsagree
14 57 56 34 41 203
35% 28% 3 7%
People have different reasons for wanting to live in one area over another. If you were deciding now, and you could live anywhere, would the most important factor to you be: (Rank 1 - 6, I being the most important factor, 6 being the least important
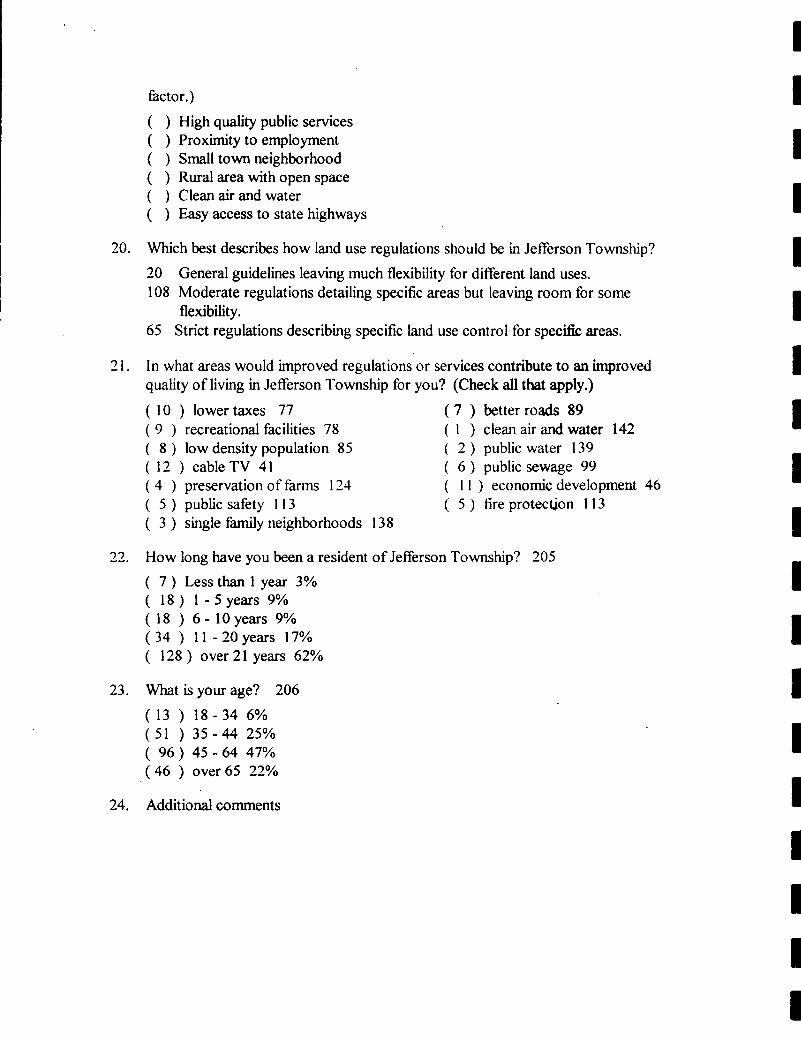
factor.)
( ) High quality public services ( ) Proximity to employment ( ) Small town neighborhood ( ) Rural area with open space ( ) Cleanair and water ( ) Easy access to state highways
Which best describes how land use regulations should be in Jefferson Township? 20 General guidelines leaving much flexibility for different land uses. 108 Moderate regulations detailing specific areas but leaving room for some
flexibility. 65 Strict regulations describing specific land use control for specific areas.
20.
2 1. In what areas would improved regulations or services contribute to an improved quality of living in Jefferson Township for you? (Check all that apply.) ( 10 ) lower taxes 77 ( 9 ) recreational facilities 78 ( 8 ) low density population 85 ( 12 ) cable TV 41 ( 4 ) preservation of f m 124 ( 5 ) public safety 1 I3 ( 3 ) single family neighborhoods 138
( 7 ) better roads 89 ( 1 ) clean air and water 142 ( 2 ) public water 139 ( 6 ) publicsewage 99 ( I 1 ) economic development 46 ( 5 ) tire protectjon 113
22. How long have you been a resident of Jefferson Township? 205
( 7 ) Less than 1 year 3% ( 18) 1-5years 9% ( 18 ) 6 - 10 years 9% ( 3 4 ) 1 1 -30years 17% ( 128 ) over 21 years 62%
23. What is your age? 206
( 1 3 ) 18-34 6% ( 51 ) 35 - 44 25% ( 96 ) 45 - 64 47% ( 46 ) over 65 22%
24. Additional comments
I 1 I I 1 I I 1 1 I 1 1 I 1 I I I I 1
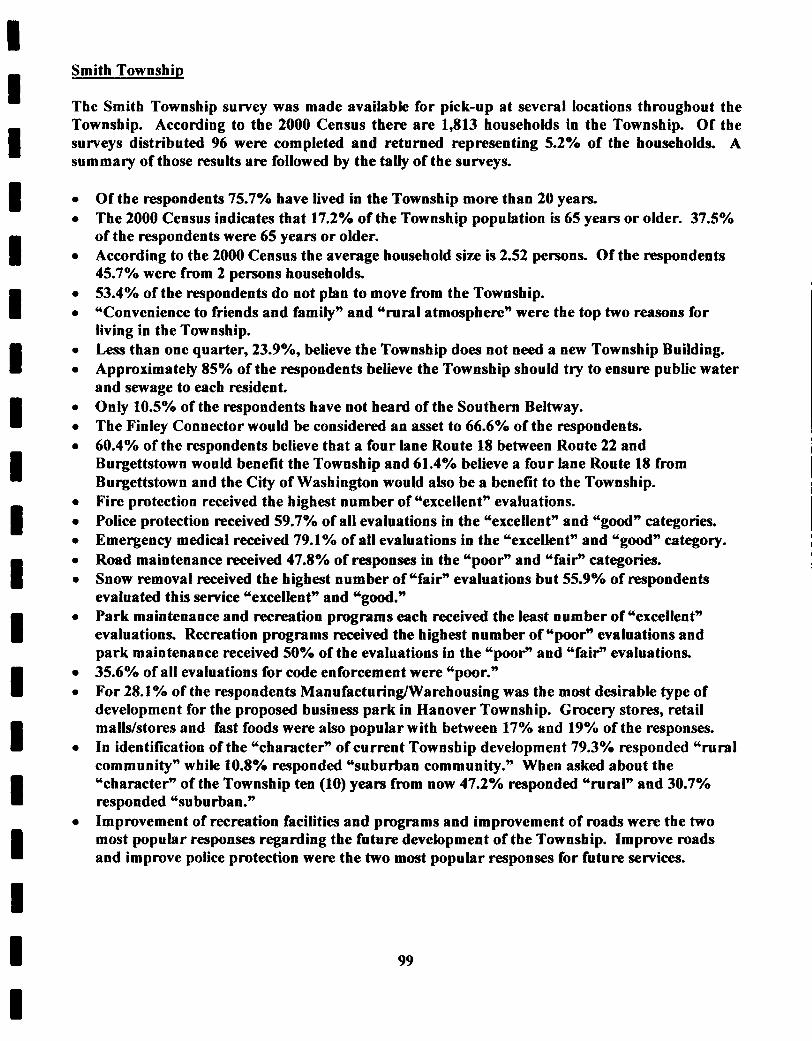
I I I 1 I I I I I I I I 1 I I I I I
Smith Township
The Smith Township survey was made available for pick-up at several locations throughout the Township. According to the 2000 Census there are 1,813 households in the Township. Of the surveys distributed 96 were completed and returned representing 5.2% of the households. A summary of those results are followed by the tally of the surveys.
Of the respondents 75.7% have lived in the Township more than 20 years. The 2000 Census indicates that 17.2% of the Township population is 65 years or older. 37.5% of the respondents were 65 years or older. According to the 2000 Census the average household size is 2.52 persons. Of the respondents 45.7% were from 2 persons households. 53.4% of the respondents do not plan to move from the Township. “Convenience to friends and family” and “rural atmosphere” were the top two reasons for living in the Township. Less than one quarter, 23.9%, betieve the Township does not need a new Township Building. Approximately 85% of the respondents believe the Township should try to ensure public water and sewage to each resident. Only 10.5% of the respondents have not heard of the Southern Beltway. The Finley Connector would be considered an asset to 66.6% of the respondents. 60.4% of the respondents believe that a four lane Route 18 between Route 22 and Burgettstown would benefit the Township and 61.4% believe a four lane Route 18 from Burgettstown and the City of Washington would also be a benefit to the Township. Fire protection received the highest number of “excellent” evaluations. Police protection received 59.7% of all evaluations in the “excellent” and “good” categories. Emergency medical received 79.1% of all evaluations in the “excellent” and “good” category. Road maintenance received 47.8% of responses in the “poor” and “fair” categories. Snow removal received the highest number of ‘fair” evaluations but 55.9% of respondents evaluated this service ”excellent” and “good.” Park maintenance and recreation programs each received the least number of “excellent” evaluations. Recreation programs received the highest number of “poor” evaluations and park maintenance received 50% of the evaluations in the “poor“ and “fair“ evaluations. 35.6% of all evaluations for code enforcement were “poor.” For 28.1% of the respondents Manufacturinflarehousing was the most desirable type of development for the proposed business park in Hanover Township. Grocery stores, retail malWstores and fast foods were also popular with between 17% and 19% of the responses. I n identification of the “character” of current Township development 79.3% responded “rural community” while 10.8% responded “suburban community.” When asked about the “character” of the Township ten (10) years from now 47.2% responded “rural” and 30.7% responded “suburban.” Improvement of recreation facilities and programs and improvement of roads were the two most popular responses regarding the future development of the Township. Improve roads and improve police protection were the two most popular responses for future services.
99
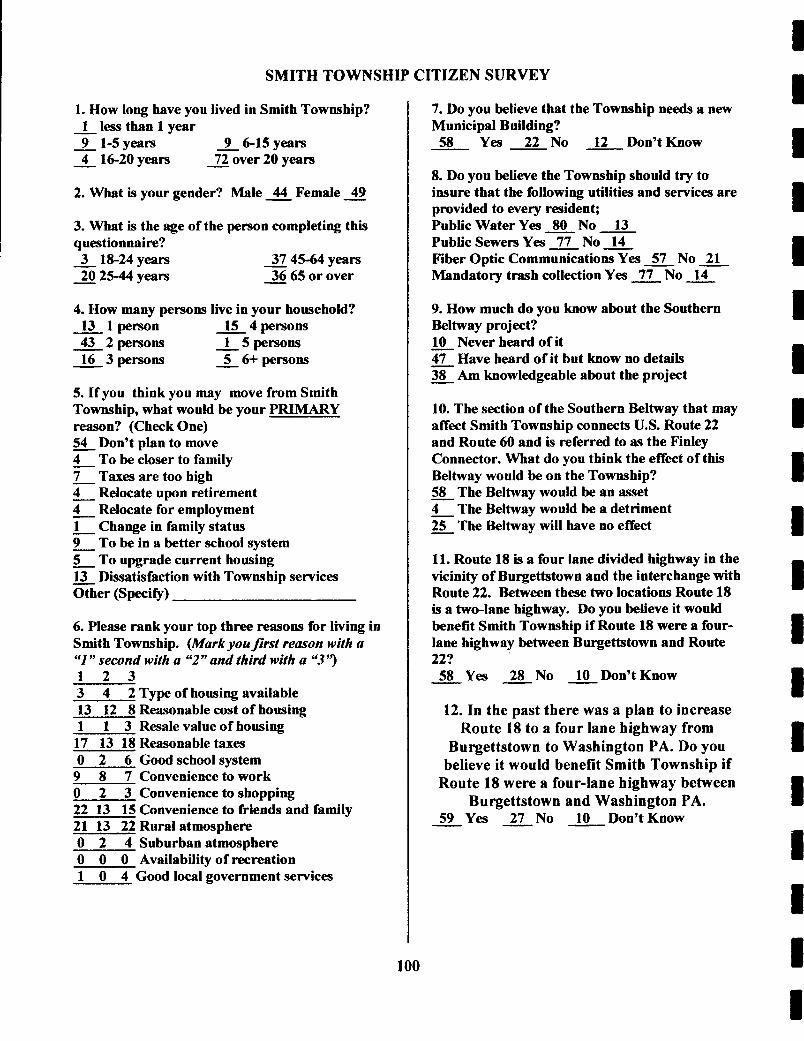
SMITH TOWNSHIP CITIZEN SURVEY
1. How long have you lived in Smith Township? - 1 less than 1 year - 9 1-5year~ 9 6-15years - 4 16-2oyears - 7 2 v e r 20 years
2. What is your gender? Male 44 Female 3
3. What is the age of the person completing this questionnaire? - 3 18-24y-r~ - 37 45-64 years - 20 25-44 years - 36 65 or over
4. How many persons live in your household? - 13 lperson - 15 4persons - 43 2persons - 1 5persons - 16 3persons - 5 btpersons
5. If you think you may move from Smith Township, what would be your PRIMARY reason? (Check One) - 54 Don’t plan to move - 4 To be closer to family - 7 Taxes are too high - 4 Relocate upon retirement - 4 Relocate for employment 1 Change in family status - 9 To be in a better school system - 5 To upgrade current housing - 13 Dissatisfaction with Township services Other (Specify)
6. Please rank your top three reasons for living in Smith Township. (Mark youfirst reason with a “I ” second with a “2” and third with a “3”) 1 2 3 3 4 2 Type of housing available 13 12 8 Reasonable cost of housing 1 1 3 Resalevalueofhousing 17 13 18 Reasonable taxes 0 2 6 Goodschoolsystem 9 8 7 Conveniencetowork 0 2 3 Convenience to shopping 22 13 15 Convenience to friends and family 21 13 22 Rural atmosphere 0 2 4 Suburbanatmosphere 0 0 0 Availability ofre-creation 1 0 4 Good local government services
LOO
7. Do you believe that the Township needs a new Municipal Building? 58 Yes 22 No 12 Don’tKnow
8. Do you believe the Township should try to insure that the following utilities and services are provided to every resident; Public Water Yes 80 No 13 Public Sewers Yes 77 No 14 Fiber Optic Communications Yes 57 No 21 Mandatory trash collection Yes 77 No 14 9. How much do you know about the Southern Beltway project? 10 Never heard of it - 47 Have heard of it but know no details - 38 Am knowledgeable about the project
-
10. The section of the Southern Beltway that may affect Smith Township connects US. Route 22 and Route 60 and is referred to as the Finley Connector. What do you think the effect of this Beltway would be on the Township? _L 58 The Beltway would be an asset - 4 The Beltway would be a detriment - 25 The Beltway will have no effect
11. Route 18 is a four lane divided highway in the vicinity of Burgettstown and the interchange with Route 22. Between these two locations Route 18 is a two-lane highway. Do you believe it would benefit Smith Township if Route 18 were a four- lane highway between Burgettstown and Route 22? - 58 Yes =No m D o n ’ t K w w
12. In the past there was a plan to increase Route 18 to a four lane highway from
Burgettstown to Washington PA. Do you believe it would benefit Smith Township if
Route 18 were a four-lane highway between Burgettstown and Washington PA.
59 Yes =No 10 Don’tKnow -
1 1 I I I I I 1 I I 1 I I I I I I I 1
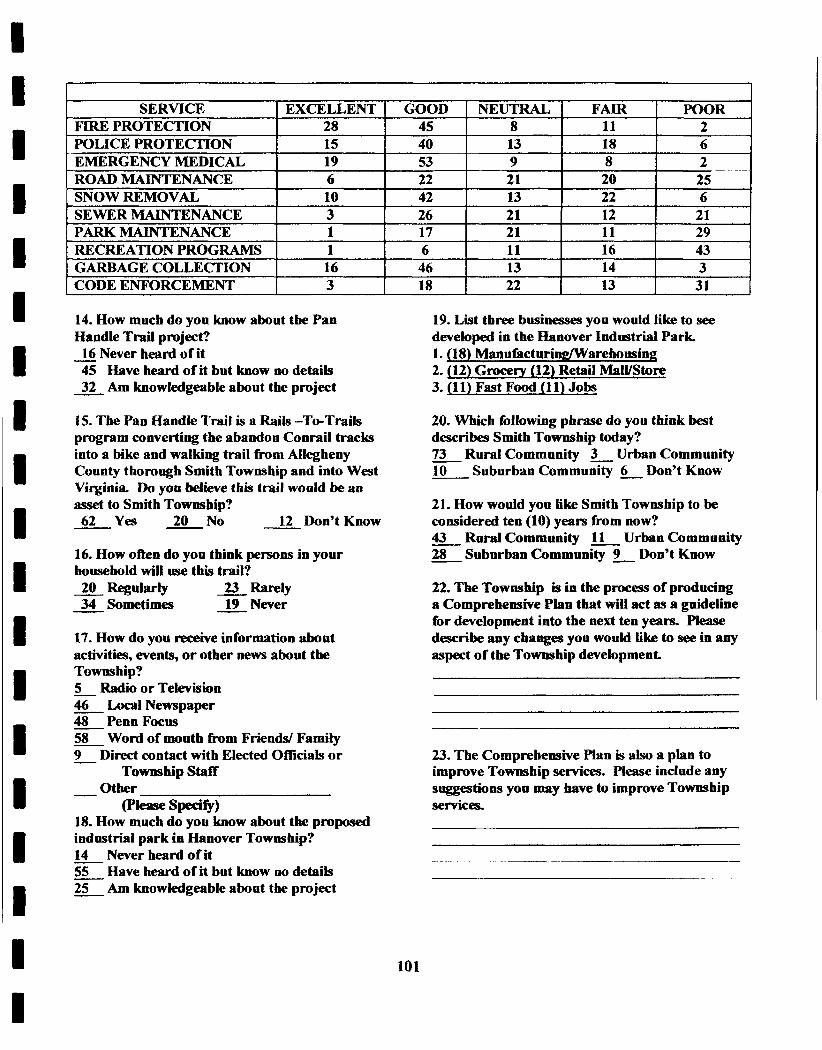
I I I I I 1 I I I I I i I I I I I I I
SERVICE EXCELLENT GOOD FIRE PROTECTION 28 45 POLICE PROTECTION 15 40 EMERGENCY MEDICAL 19 53 ROAD MAINTENANCE 6 22 SNOW REMOVAL 10 42
NEUTRAL FAIR POOR 8 11 2 13 18 6 9 8 2 21 20 25 13 22 6
14. How much do you know about the Pan Handle Trail project? - 16 Never heard of it - 45 Have heard of it but know no details - 32 Am knowledgeable about the project
15. The Pan Handle Trail is a Rails -TeTrails program converting the abandon Conrail tracks into a bike and walking trail from Allegheny County thorough Smith Township and into West Virginia. Do you believe this trail would be an asset to Smith Township? 62 Yes 20 No - 12 Don’t Know -
16. How often do yon think pemm in your household w i U use this trail? 2 o R e g u l a r i y - 23 Rarely - 34 Sometimes - 19 Never
17. How do you receive information about activities, events, or other news about the Towns hip? 5 RadioorTelevisiou - 46 LocalNewspaper - 48 PennFocus - 58 Word of mouth from Friends/ Family - 9 Direct contact with Elected Officials o r
- Other
18. How much do you kww about the proposed industrial park in Hanover Township? - 14 Never heard of it - 55 Have heard of it but know no details - 25 Am knowledgeable about the project
Township Staff
Pi- Specify)
101
19. List three businesses you would like to see developed in the Haoover Industrial Park. 1. jl8)-~nufacturinp/Wareholrsine; 2. (12) Grocery (12) Retail MalYStore 3. (1 1) Fast Food (1 1) Jobs
20. Which foilowing phrase do you think best describes Smith Township today? - 73 Rural Community 3 Urban Community - 10 Suburban Community 6 Don’t Know
21. How would you like Smith Township to be considered ten (IO) years from now? - 43 Rural Community 11 Urban Community 28 Suburban Community 9 Don’t Know
22. The Towrtship is in the process of producing a Comprehensive Plan that will act as a guideline for development into the next ten years. Please describe any changes you would Like to see in any aspect of the Township development
23. The Comprehensive Plan is also a plan to improve Township services. Please include any suggestions yon may have to improve Towuship services
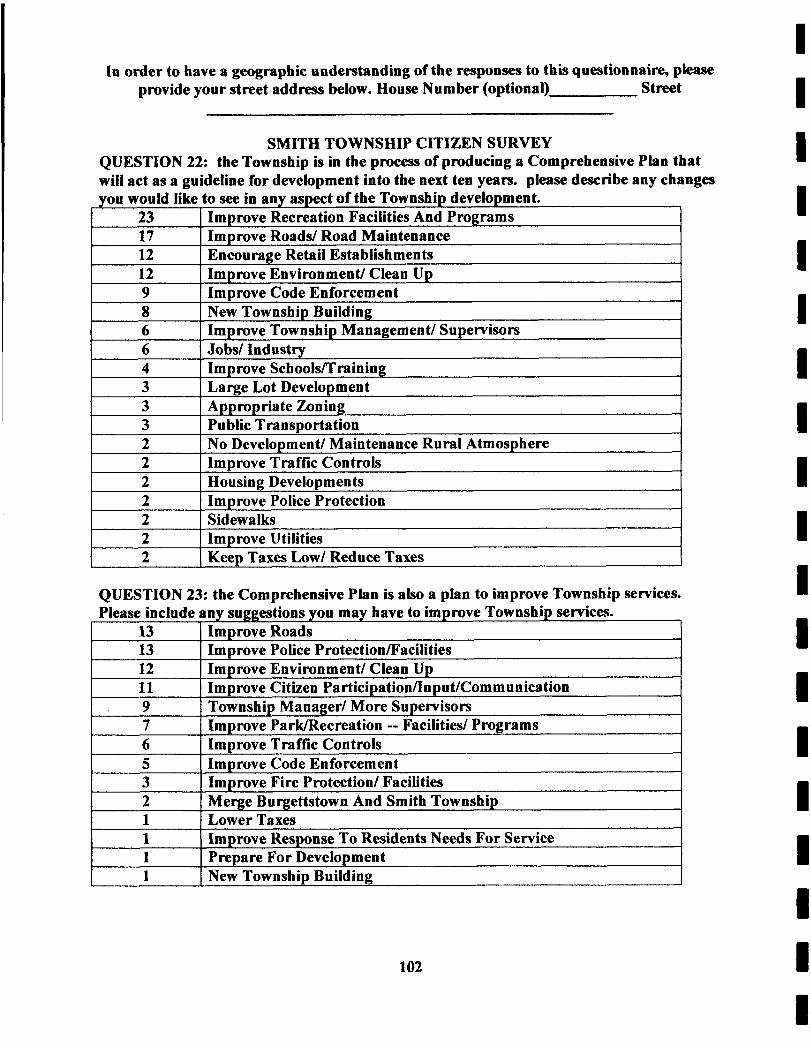
In order to have a geographic understanding of the responses to this questionnaire, please provide your street address below. House Number (optional) Street
3 2 1
SMITH TOWNSHIP CITIZEN SURVEY QUESTION 22: the Township is in the process of producing a Comprehensive Plan that will act as a guideline for development into the next ten years. please describe any changes
Improve Fire Protection/ Facilities Merge Burgettstown And Smith Township Lower Taxes
QUESTION 23: the Comprehensive Plan is also a plan to improve Township services.
1 1 1
Improve Response To Residents Needs For Service Prepare For Development New TownshiD Building
102
I I I I I I I I I II I I I ~I 11 I I I I
I
I
FUTURE LAND USE
GENERALLY Because of the differences between each of the communities in the Raccoon Valley Region, each has recognized the unique role they play in the Region. Individually there is little opportunity or demand for each of them to host a complete variety of residential, commercial or industrial land uses. Collectively, the Region provides a wide variety of current land uses and a wide variety of opportunity for future development.
The collaborate effort brought forth in the comprehensive planning project has proved beneficial for each community and has enlightened those individuals involved regarding the advantages in thinking and acting regionally. The regional approach and collaborative effort should be continued in a zoning scheme that is consistent with the multi-municipal com p rehensive plan.
Recent amendments to the Pennsylvania Municipalities Planning Code provide the opportunity for communities to pursue a regional approach to zoning without relinquishing their independence in enforcement and administration. Through an I n te rgove rn men ta I Cooperative Plan ning and Im plemen ta t ion Agreement the com m un ities in the Region can accomplish the future land use set forth in this chapter.
HANOVER TOWNSHIP U S Route 22, a four lane divided highway traversing east to west, passes through the northern third of the Region and provides access to vacant land with highway access ideal for commercial and industrial uses. The Post Gazette Pavilion is located on the south side of US 22 at the intersection of State Route 18 and is, at this time, the only major development along the US Route 22 corridor in the Region. A 1,150 acre industrial park is proposed for the north side of US Route 22 a b at the intersection of Route 18.
These two developments take full advantage of the highway access and frontage. There is a great deal of vacant land in this corridor, both privately owned and owned by the State Game Commission, that could also take full advantage of the highway access and frontage. These properties along US Route 22 are ideal for large scale commercial, industrial and recreational uses.
Route 18 is a two lane State road that traverses north and south from the northern border of Hanover Township south through the heart of Burgettstown to the southern edge of the Region in Smith Township. North of US Route 22 in Hanover Township, in the village of Florence, there are several small commercial establishments including a convenience store, service station, and take-out restaurant. Further north on Route 18 there is a mix of single family residences and light industrial uses.
The strategic location of the Village of Florence provides an excellent opportunity for the expansion of convenience commercial land uses. This are can be accessed by Route 18, US Route 22 and Old Route 22. The convergence of these three major roads provides access from most of Hanover Township to the Village.
103
The existing residential pattern in the Village consists of older single family dwellings on small lots. Most of these dwellings are in good condition and laid out in an orderly manner along Route 18 and Old Route 22. The front yard setbacks are less than desirable, given the traffic volumes on these roads. The number of driveway entrances and sight distances from those driveways are also not desirable.
The Village of Florence exists as a traditional village with a mix of residential and commercial land uses. The vacant land immediatly adjacent to the Village is ideal for high density residential uses with a pedestrian connection to the commercial establishments in the hear t of the Village. Property with frontage along Route 18 and Old Route 22 is ideal for continued convenience type commercial growth.
Along Route 18 north of Florence the mix of development includes single family dwellings, commercial recreation, industrial storage and a junk yard. Route 18 is a major arterial road through the Region and development should be concentrated in a fashion that would capitalize on its usefulness. This section of Route 18 can function as a arterial road to which collector roads from different types of residential development could connect.
Growth areas for Florence and Route 18 north have been identified on the future land use map attached at the end of this chapter. These growth areas are designed to guide development to parts of the Township that have or could easily have sewage, do have an existing network of roads to accommodate vehicular traffic and provide connections to the proposed industrial park, as well as other comme'rcial establishments in the Florence area.
West of the intersection of Route 18 and Old Route 22, along Old Route 22, there is a wide variety of land uses. Non-commercial development along this part of OM Route 22 include single family dwellings, multi-family dwellings, churches, cemeteries, the Township Building and park and private recreation facilities. Commercial development in this area includes light and heavy manufacturing, automobile and truck service, warehousing and self storage, exterior storage of equipment and vehicks and retail sales establishments. There is also much vacant land and several vacant non-residential buildings.
Some of the uses along Old Route 22, between the Villages of Florence and Paris, are incompatible. The industrial and storage uses located adjacent to residential uses have lessened the desirability of those residential uses. On the south side of Old Route 22, these storage and industrial uses dominate. On the North side of Old Route 22, the industrial and storage uses are fewer and farther apart resulting in a dominance by the residential uses and significantly less incompatibility on the north side.
The property on the south side of Old Route 22 is bound on the rear by US Route 22. These properties have visibility from US Route 22 and are suitable for light industrial and large commercial uses. There are many sites along this side of OM Route 22 that have been abandoned and light industrial and commercial reuse could be accomplished with little environmental impact.
Much of the north side of OM Route 22 consists of a mix of residential uses (single family and small multi-family buildings) throughout and industrial uses scattered along the western part of the road with the heaviest concentration in the vicinity of the Village of Pans. The mix of single family and multi-family dwellings in this area works well and
104
I I I I I I I I I I I I I I I I I I I
I I I I I
I ~D
I I
~I
provides diversity in housing for the Township. The continuation of this mix of low density multi-family and single family dwellings is appropriate in this area and should continue.
The Village of Paris, along Old Route 22, on the western end of Hanover Township, is predominately medium density single family residential development. This development has taken place on the north and south sides of Old Route 22 with development spreading further away from that road. The growth pattern formed here is appropriate and the continuation of medium density single family residential development expanding north and south of old Route 22 would also be appropriate, particularly as planned sewer extensions become available.
Therefore, growth areas around the Village of Paris have been identified on the future land use map for medium density single family development. These areas will provide opportunity for growth while concentrating that growth in areas close to the arterial roadway and in areas where public sewage is or will be available during the planning period.
The remaining parts of Hanover Township are rural in nature and should remain so to the greatest extent possible. A large part of this rural area is either State Gameland or the Hillman State Park. The majority of privately owned property in this rural area is wooded and has either been strip mined or vacant and is in the "Vacant" land use category on the existing land use map in the existing land use chapter.
BURGETTSTO W N BOROUGH Route 18, south of US Route 22, runs through the heart of Burgettstown Borough. Originally Route 18 doubled as Main Street and the main thoroughfare for the commercial district. A four lane bypass was built around Main Street practically eliminating the vehicle traffic through the commercial district. This marked the beginning of the end for many of the businesses in this area.
Many of the buildings in this area have been vacant for quite some time and several of these buildings have been abandoned and have M e n into disrepair. The buildings would need to undergo major, expensive renovations to be suitable for occupancy. These building sites also lack many of the attributes needed to accommodate successful business. The combination of expense of restoration and the inability to provide attributes like off street parking, visibility and traffic flow render these sites less desirable for businesses.
There is an opportunity in this area to redevelop. New buildings constructed so that they are oriented to the four lane bypass for vehicular access could also use Main Street to serve as pedestrian access. The double fronted commercial buildings would serve both the local population as well as the Regional population. Off street parking could be provided as part of the redevelopment effort.
Commercial development in the remainder of Burgettstown is properly located along Route 18. Most of the sites have good access and are in good condition with successful business.
The residential development in Burgettstown is primarily a mix of single family dwellings and small conversion apartments. These dwellings are laid out in an almost grid street
105
pattern that parallels Route 18. The housing is dense and creates neighborhoods on either side of Route 18.
In the past six (6) years only two new single family dwellings have been built in Burgettstown. There have been no new subdivisions in that same time period. Most of the building permits issued in Burgettstown have been for repair of existing structures, replacement of parts of those structures and some additions and improvements to those existing structures.
There is little remaining undeveloped land in Burgettstown Borough. The larger parcels are west of Route 18 and should be developed in the same small lot pattern as the rest of Burgettstown. There should also be opportunities to build multi-family dwellings in these undeveloped areas and to redevelop properties to multi-family uses in the developed areas of the Borough.
Burgettstown should continue to play the role of the concentrated population center in the region. The historic pattern of development in the Borough has the characteristics of a “traditional neighborhood.” Route 18 should continue to be the center for existing and new convenience commercial development for the Region. Along Main Street redevelopment of existing buildings and their sites should be maximized as a mix of commercial and multi- family developments. In undeveloped areas new development should be small lot single family dwellings and small garden apartments or townhouse developments.
The “traditional neighborhood development” concept that has been established in Burgettstown should continue and has the potential to be enhanced. The Pan Handle Trail, when complete, will pass through the neighborhoods west of Route 18. This pedestrian and bike trail will provide a pedestrian way that would connect the existing neighborhoods with the new neighborhoods on the west side of Route 18. A series of pedestrian paths to the Panhandle Trail could be required in the new developments or provided as part of the public recreation facilities in the Region.
The Pan Handle Trail should also connect with the new trails in the Region described in the Community Facilities chapter of this plan. These new trails would link Burgettstown with other Regional centers and facilities. The “Hanover Extension” should be developed to connect the population center of Burgettstown with the proposed industrial park in Hanover Township. This new trail could provide a connection between the Region’s most dense housing areas in Burgettstown, Slovan and Atlasburg with the Region’s new employment center in Hanover Township.
The “Slovan Extension” could connect Atlasburg and Slovan, further south on Route 18, with the Pan Handle Trail at Burgettstown, and the new Hanover Extension trail along Route 18 to the Industrial park in Hanover Township.
Open space in the dense neighborhoods of Burgettstown Borough is at a minimum. The Pan Handle Trail provides an excellent linear park for the residents of Borough. In plans for new developments and the redevelopment areas opportunities for tot-lot recreation facilities should be considered. Where possible these tot-lots should be connected via pedestrian ways to the Pan Handle Trail.
106
I I I I I I I 1 I I I I I I I 1 I I I
I I
I
The Trail by itself will provide recreation opportunities for Burgettstown residents as well as access to other parts of the Region that have other recreation facilities. Jefferson Township owns acreage along the trail and is planning recreation uses for this property which could be accessed from the trail system. There is also an opportunity to connect Burgettstown with the Smith Township municipal and recreational complex at Cherry Valley, providing additional access to recreation facilities. For the “Cherry Valley” extension from the Panhandle Trail in Joffre, the abandoned Penn Central railroad or Cherry Valley Road could be used as a connection to Cherry Valley.
SMITH TOWNSHIP In terms of land use Smith Township is the most diverse community in the Rmion. Much of the Township is rural, however, there are several small villages such as-Atlasburg, Slovan, Cherry Valley and Langloth. Smith Township is also home to the largest established industrial site in the Region.
Areas that are now rural are limited in their ability to support any large scale development. These areas lack public sewage and suitable transportation facilities. Intense development in these areas should be limited as much as possible.
Route 18 between Burgettstown and Atlasburg has scattered commercial development. This part of Route 18 is the predominant vehicular traffic corridor in the Region and is suitable for commercial development. There are several larger vacant sites that could also accommodate light industrial uses.
Slovan and Atlasburg have direct access to Route 18. These two villages also have public sewer and water. Current land uses include small lot single family dwellings, some two family dwellings and larger existing buildings converted to multi-family buildings.
These two villages are ideal for the continuation of the existing land development pattern. Continuation of the street patterns and pedestrian ways would promote the traditional neighborhood development that has been established in these villages The Route 18 frontage in these villages provides opportunity for convenience commercial development. Though some commercial uses exist at this time, an increase in population in these villages would provide economic support for more businesses.
Cherry Valley is another small village in Smith Township. The road network in this area is not as capable as that of Route 18, but Cherry Valley Road adequately serves the current population of Cherry Valley. Cherry Valley is also served by public sewers. The Township building and main park for Smith are also located in Cherry Valley. The housing is a mix of single family dwellings, two family dwellings and a row of townhouses. Non-residential development is light and includes a bar, social club and small grocery store.
Continuation of the traditional neighborhood development concept is appropriate for Cheny Valley. There are large vacant parcels adjacent to the existing neighborhood development that would be ideal for a continuation of that type of development.
JEFFERSON TOWNSHIP Jefferson Township is the most rural community in the Region. The population density is 40% of that of Smith Township, 22% of that of Washington County and .02% of
107
Burgettstown. While Hanover Township appears to be similar to Jefferson Township in population density with 58.78 persons per square mile and Jefferson Township at 53.8 persons much of Hanover Township is State Gamelands and State Park property making the inhabitants of Hanover concentrated in about two thirds (2/3) of the total area of the Township.
One major difference in the future of Hanover Township over Jefferson Township is the development potential of Hanover Township. Hanover is easily accessed by US Route 22 and Route 18, while access to Jefferson is limited to small two lane roads. The Hanover Sewer Authority is in the process of providing sewage to Paris, Florence and other parts of Hanover Township. There is no sewer authority in Jefferson Township and no plan to provide sewage to any part of that Township.
The character of development in Jefferson Township is rural. While there are small clusters of three and four houses on small lots in some parts of the Township the majority of the Township consists of single family dwellings on lots of several acres and on farms. The only village in the Township, Eldersville, is comprised of about a dozen single famity dwellings and the Eldersville Volunteer Fire Department. The Eldersville Elementary School, sold by the school district and now privately owned, was issued a building permit for conversion into apartments. The conversion was never started and the building remains vacant.
Jefferson Township is also a community with great history. As discussed in the Community Facilities cbapter of this plan, the Meadowcroft Rock Shelf documents the longest continuous habitation of one site in North America. Other historic sites in the Township include Heritage Hall, (1876) and The White Church, (1844). Both have been restored by the Jefferson Township Historical Society. There as many as twenty (20) more buildings identified by the Jefferson Township Historical Society as historically significant.
Because of poor access and no sewage, the historic significance and the rural nature of Jefferson, this Township should remain rural and as unaffected by development as possible. Even large lot single family development should be kept to a minimum. Commercial and industrial development in Jefferson would negatively impact the rural and historic nature of this community. Future land use should promote conservation and enhancement of natural, scenic and historic resources. Development density should be compatible with preservation of rural resources.
FUTURE ZONING The current zoning schemes in each of the communities is similar. In the Existing Zoning Ordinances chapter (Tables XXXV through XXXX) of the plan six (6) distinct zoning categories were identified although titled differently in some of the existing ordinances they were similar in use and area and bulk regulations.
The Raccoon Valley Region is diverse in current land uses as well as its ability to support future land use. As described earlier in this chapter because of transportation facilities, public water and sewer, prominent regional developments aad the desire of these communities for their future none of them can be expected to, or wish to, plan for all types of development.
108
I I I I I 1 I I I I I I I I I I I I I
I
I I I I I I I I
The future land use map shows an appropriate variety of land uses set in proper locations throughout the Region. A regional approach to future land use and a multi-municipal approach to planning and zoning accommodates the diversity of the Region and will fulfill the obligation of each community for growth.
FUTURE LAND USE CATEGORIES The Future Land Use Map at the end of this chapter shows growth areas in the Region for a variety of types of land uses. This map is designed to implement a multi-municipal zoning scheme. The multi-municipal approach to zoning is a concept discussed by the Planning Group as an option to resolving growth pressure issues.
MIXED USE - SPECIAL DEVELOPMENT The Mixed Use district will provide for a mix of planned multi- family residential and business development. Non-residential uses would not be limited and could include eating and drinking establishments, retail sales, retail services, offices, warehousing and wholesaling, manufacturing, truck terminals and distribution and indoor and outdoor recreation. Residential development would be limited to planned residential developments of townhouses, duplexes, quads and garden apartments.
Building lots for non-residential uses wouM be large, one (1) or two (2) acres with large setbacks, fifty (50) to one hundred (100) feet on the front and twenty five (25) to fifty (50) on the sides. Lot coverage would be minimal and plantings and green space would be required. Paved parking would be required. Exterior storage of goods and materials would be limited and as minimal as possible. Subdivisions would be required to provide pedestrian ways throughout the plan and pedestrian connections to other plans.
Residential developments would be planned residential developments requiring dwelling unit configuration that would protect environmentalty sensitive areas as well as provide usable open space for recreation purposes. Pedestrian way would be required throughout the plan as well as provide connection to adjacent pedestrian ways.
LIGHT INDUSTRIAL This district would provide for authorized uses in areas where industrial uses exist. Uses would include light manufacturing, fabrication, assembty, product finishing and industrial storage. Retail goods and services and residential uses would not be authorized.
Lot sizes would be consistent with existing lot sizes for existing uses. Lot coverage would be greater than that of the Mixed Use district. Setbacks would be smaller, twenty-five (25) to fifty (50) feet for front yards and fifteen (15) to twenty-five (25) feet on the side yards. Screening of exterior storage would be required and planting would be minimal. Paved parking would not be required.
HIGHWAY COMMERCIAL Highway Commercial uses would include retail sales of goods and services, some small scale, light, industrial uses, self storage facilities and out door display retail sales like car dealers, garden nurseries and lumber yards.
Criteria for these uses would include direct access to an arterial road. Lot sizes would be greater than one half an acre. Front yard setbacks would be large, fifty (50) to one
109
hundred (100) feet. Side yards would be small, twenty (20) or twenty-fwe (25) feet. Lot width would be seventy-five (75) or one hundred (100) feet to reduce congestion of curb cuts. Outdoor display would be visible and could be located in the front yard.
TRADITIONAL NEIGHBORHOOD - CORE This district would provide for small lot single family development, two family dwellings and local retail establishments. by permitting small lot development, small setbacks and a mix of uses consistent with those in existence.
Redevelopment in this area would be encouraged
TRADITIONAL NEIGHBORHOOD - RESIDENTIAL In the traditional neighborhood - residential, district authorized uses would include single famity dwellings, two famity dwellings, townhouses and garden apartments. Local retail establishments would also be authorized in this district on a small scale and designed to serve the neighborhood.
Dwellings in new developments would be configured in a way that would provide common open space and common open space would be configured so to connect with common open space in adjacent developments.
Lots size in the traditional neighborhood - residential zone would be ten thousand (10,000) to twenty thousand (20,000) square feet. Front yards would be twenty-five (25) feet, side yards would be five (5) feet. Lot coverage would be high and the density of dwellings would be off-set by the common open space.
SUBURBAN RESIDENTIAL This district would provide detached single famity development in areas where similar development exists and public sewer and water is availabk
Lot sizes would be twenty-two thousand square feet with a minimum lot width of one hundred (100) feet. Front yard setbacks would be fifty (50) to seventy-five (75) feet and side yards would be twenty (20) of twenty five (25) feet. Lot coverage would be minimal to provide an open suburban feel to the developments.
RURAL RESIDENTIAL This district would provide detached single family development in rural areas where no public sewer or water is available. Planned residential developments would be permitted where the development could provide public sewage treatment and public water for the development.
Lot sizes would be one acre with a minimum lot width of seventy-five (75) feet. Front yard setbacks would be fifty (50) feet and side yards would be twenty (20) feet. Lot coverage would be minimal to provide an open rural feel to the developments.
RURAL PRESERVATION Rural preservation development would provide the opportunity for large tracts of land to be divided into two acre lots for single famity development. agriculturaluses would also be permitted in this district.
110
I I I I I I I I I I I I I I I I I I I
I I I I I I 1 I I I I I
Rural residential lots would have large setbacks, one hundred (100) foot front yards, forty (40) foot side yards and very minimal lot coverage.
A MULTI-MUNICIPAL APPROACH TO PLANNING AND ZONING Prior to the Year 2000 amendments to the Pennsytvania Municipalities Planning Code (PA MPC), the only mechanism available to municipalities to undertake cooperative planning and zoning was the creation of a joint planning commission and adoption of a joint zoning ordinance. This mechanism involved adoption of a single zoning ordinance by several municipalities, enforcement by either a shared zoning oMicer or several zoning ofilcers and plan review and recommendations by a joint planning commission comprised of representatives of the participating municipatitk.
A Western Pennsylvania Example of Joint Planninp and Zoning Only a few municipalities in the Commonwealth have selected this mechanism for planning and zoning. A Western Pennsylvania example is the “CRT Joint Planning Commission” comprised of the Boroughs of Crafton, Rosslyn Farms and Thornburg. The Borough of Crafton is fully developed with a commercial core, an industrial base and a variety of housing ranging from single family to high rise apartments. Thornburg and Rosslyn Farms are primarily single family residential with little or no multifamily and non- residential development.
Under the joint zoning ordinance, the benefit for the two (2) primarily residential communities is that they are protected from exclusionary zoning challenges claiming that they fail to provide for a full array of land uses within their individual boundaries. The Borough of Crafton provides the majority of multi-tamily and non-residen tial development within the joint zoning scheme. As long as all reasonable uses are authorized somewhere within the jurisdiction of the joint zoning ordinance, all of the participating communities are protected from exclusionary challenges.
The New Approach The Year 2000 amendments replace Article XI of the PA MPC (formerly Joint Municipal Planning Commissions) with a new approach to multi-municipal planning and zoning. Amended Article XI is entitled “Intergovernmental Cooperation and Implementation Agreements.” Amended Article XI provides that any joint planning cornmission organized under the previous version of this Article may continue to exist under the amended provisions of the Article. Joint Zoning Hearing Boards were, and still are, authorized under Section 904 of the PA MPC.
The new approach provides the same protection from exclusionary challenges for all the participating communities, while allowing each participating municipality to administer and enforce its own zoning ordinance, provided that zoning ordinance remains consistent with the multi-municipal comprehensive plan adopted by all the participating municipalities. Rather than creating a joint planning commission and a single zoning ordinance, each community retains its own planning commission and zoning ordinance and the option of a shared enforcement officer or individual enforcement officers is available. Intemovernmental Cooperative Implementation Agreements The only requirement for the participating communities in a multi-municipal planning and zoning program is that they enter into an “intergovernmental cooperation agreement” under the same Pennsylvania statute (53 PA C.S. Ch. 23) that governs councils of
111
government (COGS). The intergovernmental cooperation agreements may be among a group of municipalities only or may include a group of municipalities plus one (1) or more of the following: the County, the school district, a water or sewer authority or other authority, special districts or State agencies that have a role in implementing the multi- municipal Comprehensive Plan.
Plan Content The Comprehensive Pian that is the subject of the multi-municipal Comprehensive Plan may include the following:
1.
2.
3.
4.
5.
6.
Designated growth areas, including:
a.
b.
c.
Areas where orderly residential growth is projected to occur within the next 20 years at densities of 1 unit per acre or greater; Areas for commercial, industrial and institutional land uses to provide adequate employment and tax base; and Plans to provide municipal services to such areas.
Designate potential future growth areas where future development will accompany the orderly extension and provision of municipal services.
Designated rural resource areas, including:
a. b.
c.
Areas where rural resources are planned; Development is projected at densities that are compatible with the rural resources; and Infrastructure improvements are not intended to be publicly financed, except in villages or in other areas mandated by public health and safety reasons.
A phn to accommodate all categories of land use within the geogmphic area of the plan, however, all uses need not be provided in every municipality.
A plan for developments of area-wide impact.
A plan for conservation and enhancement of the natural, scenic, historic and aesthetic resources within the geographic jurisdiction of the plan.
PA MPC Terminology In the Year 2000 Code amendments, the following terms are defined:
Desknated Growtb Area: A region within a county or counties described in a municipal or multi-municipal plan that preferably includes and surrounds a city, borough or village and within which residential and mixed use development is permitted or planned for at densities of one unit to the acre or more, commercial, industrial and institutional uses are permitted or planned for and public infrastructure services are provided or planned.
112
I I I I I I I I 1 I I I I I I I I I I
I I I I I I I I I
Future Growth Area: An area of a municipal or multi-municipal plan outside of and adjacent to a desimated growth area where residential, commercial, industrial and institutional uses and development are permitted or planned at varying densities and public infrastructure services may or may not be provided, but future development at greater densities is planned to accompany the orderly extension and provision of public facilities.
Rural Resource Area: An area described in a municipal or multi-municipal plan within which rural resource uses, including, but not limited to, avriculture, timbering, mining, quarrying and other extractive industries, forest and game lands and recreation and tourism are encouraged and enhanced, development that is compatible with or supportive of such uses is permitted and public infrastructure services are not provided, except in villages.
Traditional Neiphborhood Development: An area of land developed for compatible mixture of residential units for various income levels and nonresidential and workplace uses, including some structures that provide for a mix of uses within the same building. Residences, shops, of€ices, workplaces, public buildings and parks are interwoven within the neighborhood so that all are within relatively close proximity to each other.
Traditional neighborhood development is relatively compact, limited in size and oriented towards pedestrian activity. It has an identifiable center and a discernible &. The center of the neighborhood is on the form of a public park, commons, plaza, square or prominent intersection of two or more major streets. Generalty, there is a hierarchy of streets laid out in a rectilinear or grid pattern of interconnecting streets and blocks that provides multiple routes from origins to destinations and are appropriatety designed to serve the needs of pedestrians and vehicles equally.
I VillaPe: An unincorporated settlement that is part of a Township where residential and mixed use densities of one unit to the acre or more exist or are permitted and commercial, industrial or institutional uses exist or are permitted.
I ‘I I I I I
Public Infrastructure Area: A desipnated growth area and all or a portion of a future growth area described in a municipal or multi-municipal comprehensive plan where public infrastructure services will be provided and outside of which such public infrastructure services will not be required to be publicly financed.
Public Infrastructure Services: Services that are provided to areas with densities of one or more units to the acre, which may include sanitary sewers and facilities for the collection and treatment of sewage, water lines and facilities for the pumping or treating of water, parks and open space, streets and sidewalks, public transportation and other services that may be appropriate within the growth area, but shall exclude fire protection and emewency medical services and any other service required to protect the health and safety of residents.
113
The Implementation APreement The intergovernmental cooperative implementation agreement among several municipalities or among a group of municipalities and the County and other agencies and authorities that have a role in carrying out the goals of the multi-municipal Comprehensive Plan shall include the following:
1.
2.
3.
4.
5.
6.
A process that the participating municipalities will use to achieve general consistency between the multi-municipal Comprehensive Plan and the individual municipal zoning ordinances, subdivision ordinances and capital improvements plans in the participating municipalities.
A process for review and approval for developments of regional significance and impact that are proposed within any participating municipality.
(Note: The "host" municipality will have exclusive jurisdiction in the approval process, but the agreement should spec@ a role for the other participating municipalities to have their concerns addressed in the approval process.)
Definition of the roles and responsibilities of the participating municipalities with respect to the implementation of the adopted multi-municipal Comprehensive Plan, including the provision of infrastructure, affordable housing and the purchase of real property and dedication of easements and rights of way.
Requirement for an Annual Report to be submitted by the participating municipalities to the County Planning Commission concerning the activities undertaken under the agreement during the preceding year, including infrastructure needs, progress under the capital improvements programs, the disposition of development applications and the progress in providing for all categories of land use and affonlable housing in the region of the plan. A description of any other duties and responsibilities as may be agreed to by the participating municipalities and agencies.
A process for amending the multi-municipal Comprehensive Plan and redefining the designated growth area, future growth area and rural resource areas within the plan.
The County may convene representatives of the municipalities and other authorities and agencies responsible for providing public infrastructure identified in a multi-municipal Comprehensive Plan for the purpose of negotiating agreements for the provision of the infrastructure. The County may atso provide or contract for technical assistance, mediation or dispute resolution services to assist the parties in negotiating such agreements.
Legal Effect of Cooperative Implementation Agreements Where several municipalities have adopted a multi-municipal Comprehensive Plan and consistent local ordinances and have implemented cooperative agreements, the following shall apply:
1. State agencies shall have the power to: 114
I I I I I I I I I I I I I 1 I I II 1 I
I I I I I I I
2.
I
a. Consider and rely on the multi-municipal Comprehensive Plan and consistent zoning ordinances when reviewing applications for funding or permitting infrastructure or facilities.
b. Consider and may give priority to applications for funding or technical assistance that are consistent with the multi-municipal Comprehensive Plan.
Participating municipalities shall have the power to: a. Provide by cooperative agreement for the sharing of tax revenues and
fees by municipalities within the region of the plan.
b. Adopt a transfer of development rights program to allow transfer of rights from rural resource areas in any participating municipality to designated growth areas in any participating municipality.
c. Adopt a “specific plan” for nonresidential development areas, including transportation, utilities, density, open space and financing capital improvements. Capital projects and private development plans shall not be approved unless they are consistent with the “specific plan.”
(Note: private developers are not to be assessed for the cost of preparing the “specific plan.”)
115
FINDINGS AND CONCLUSIONS - FISCAL ANALYSIS The following findings and conclusions from the Future Land Use data are relevant the plan recommendations:
e
e
e
e
e
0
0
0
e
e
0
e
e
e
A 1,150 acre industrial park is proposed for property at the intersection of Route 18 and Route 22 in Hanover Township. The proposed industrial park and the existing Post Gazette Pavilion located in Hanover Township are developments of regional significance.
Future growth along OM Route 22 between Florence and Paris in Hanover Township can be accommodated with existing transportation facilities and proposed sewage facilities. Growth in this area can mirror existing land use patterns.
The majority of land in the northeast portion of Hanover Township will be preserved through state owned parks and gamelands.
Large parcels of the land in the northwest portion of Haaover Township are part of the current agricultural security program.
Burgettstown Borough is the most density populated community in the Region. The Borough can continue to provide small lot single family development, multi-family development, retail commercial development and mixed use development.
Burgettstown Borough can expect spin-off development from the Pan Handle Trail when it is complete.
Redevelopment and property maintenance will be the two primary land use issues facing Burgettstown Borough.
Smith Township has the most diverse existing land use pattern and can support the greatest variety of future land uses.
Route 18 provides access to the existing industrial sites and provides tbe transportation facilities for growth in industrial, commercial and residential. The Route 18 comdor is also serviced by public water and sewage.
Public sewage in Smith Township extends to the villages of Langloth and Cherry Valley providing the opportunity for single family and light multi-family development.
Large parcels of land in the southeast portion of Smith Township are designated as agricultural security properties.
Several thousand acres of land in the northern portion of Smith Township are state owned game lands.
Jefferson Township is the most rural of all the communities in the Region.
116
I I I I I 1 I I I I I I I I I I 1 I I
I I I I I I I I I
0 Jefferson Township lacks the transportation, sewage or water infrastructure to support development other than occasional single family dwellings.
0 Jefferson Township is the home of Meadowcroft Village, a significant archeological find dating back thousands of years as well as many other places of historic significance.
GOALS A N D OBJECTIVES - FUTURE LAND USE Based on the foregoing analysis, the following goats and objectives for future land use are Proposed.
GOAL: Focus future development to the parts of the Region that can support that development.
Objectives: Follow the land use scheme of the Future Land Use Map which shows future commercial and industrial development along Routes 18 and 22 in areas where sewage is, or will be available.
Objective: Concentrate more dense residential development in areas with convenient access to Routes 18 and 22 and where sewage is available.
Objective: Concentrate devebpments of regional significance like the proposed industrial park in Hanover Township in close proximity to the Route 18 and Route 22 interchange with the most direct access to this interchange as possible.
GOAL: Preserve the rural character of the Region.
Objective: Protect the State game lands, except for the area immediately adjacent to Route 22 and state park property from future development.
Objective: Continue to provide the opportunity for farmers to participate in the Agricultural Security Program.
Objective: Extend sewage in areas along Routes 18 and 22 to fill in development and keep that development as close as possible to existing development.
GOAL: Protect and enhance recreation and historic site in the Region.
Objective: Work with Washington County to develop the Pan Handle Trail and consider extending that trail north and south along Route 18 and into Cherry Valley.
Objective: Expand the efforts of the Jefferson Township Historic Society to the entire Region.
Objective: Protect the property surroundieg Meadowcroft Village and control development to ensure compatible tourist related development.
117
GOAL: Participate in a multi-municipal planning and zoning program.
objective: Agree upon a regional planning and zoning scheme that is beneficial to each community in the Region.
Objective: Reach an intergovernmental cooperative agreement providing the legal frame work for multi-municipal zoning.
Objective: Consider sharing a code enforcement officer capable of providing uniform administration of the zoning ordinance and related codes in each community.
118
1 I I I I 1 I I II I II I I I 1 1 I 1 I