Jackson Hole Real Estate Market Report | 2014 Quarter 3
4
MARKET REPORT OVERVIEW OF THE JACKSON HOLE REAL ESTATE MARKET | 2014 QUARTER 3 Christie’s International Real Estate GLOBAL AFFILIATE OF THE YEAR
-
Upload
jackson-hole-real-estate-associates -
Category
Documents
-
view
214 -
download
2
description
This report, prepared by Jackson Hole Real Estate Associates, presents an overview of trends in the Jackson Hole real estate market.
Transcript of Jackson Hole Real Estate Market Report | 2014 Quarter 3

MARKET REPORTOVERVIEW OF THE JACKSON HOLE REAL ESTATE MARKET | 2014 QUARTER 3
Christie’s International Real EstateGLOBAL AFFILIATE OF THE YEAR

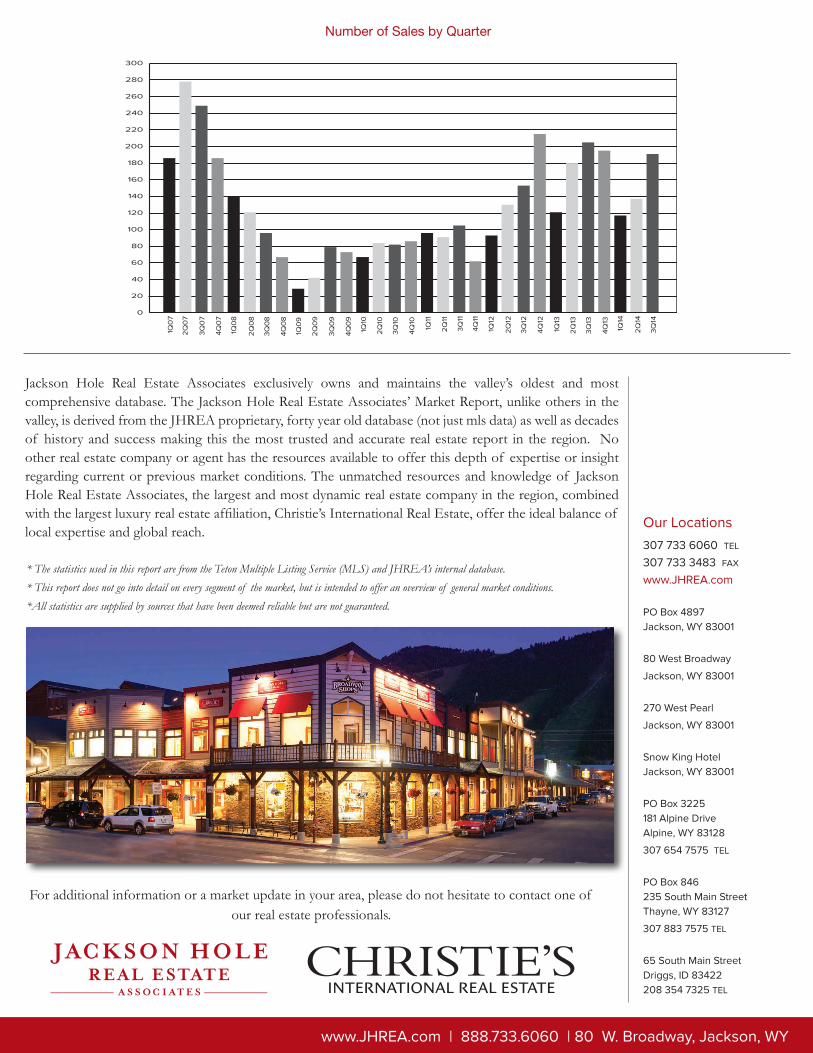
Overall MarketThe Jackson Hole real estate market finished the 3rd quarter of the year with rousing statistics. At 2014 mid-year, the market had yet to see much growth from the previous year. However, the end of the summer brought impressive gains from the previous quarter with total dollar volume remaining level compared to the same period last year with an approximate 12% drop in the number of sales. This is a shift from previous quarters in 2014 where the total dollar volume struggled to keep pace with the robust activity in 2013. The market has been able to maintain a level dollar volume of sales despite a double digit drop in the total number of transactions, it is a clear indicator that market values are increasing. When looking at the market as a whole - the average and median sale prices increased about 15% and nearly 14%, respectively. In fact, the average and median sale prices increased in every segment of the market. Market share continues to be taken away from the under $500,000 segment (down 5%) while the over $2M segment increased nearly 5%. Overall inventory continues to decrease each quarter. When compared to the third quarter of 2013, inventory is down 13%. See more detail below on each segment of the Jackson Hole real estate market.
Introduction
Market Overview by Segment
Single Family SegmentThe single family segment made incredible gains in price appreciation compared to the 3rd quarter of 2013. The median sale price of a single family home in Jackson Hole reached $1,100,000, a $300,000 increase from this time last year. The major difference being the shift from sales in the under $500,000 category (down 73%) to the sale of homes over $1M (up 15%). Finding a single family home under $500,000 can be challenging - there have been 9 this year compared to 33 this time last year. This growth is undeterred by the considerable drop in the number of transactions, which is down 22% over last year. As is typical of the single family segment, the majority of the transactions took place in the Town of Jackson and South of Jackson, albeit in much smaller quantities this year. The greatest increase in sales took place south of Wilson with a 138% increase in transactions. The single family home inventory remains low; particularly, homes under $1M with inventory down 23%.
MLS #13-1960 | $17,850,000
Sold
Active
0
50
100
150
200
250
Active vs. Sold by Market Segments(through Quarter 3)
Single Family Condo/ Townhome
Land Luxury Commercial
206
84
207
127
29
173154
78
34 39
www.JHREA.com | 888.733.6060 | 80 W. Broadway, Jackson, WY
MLS #14-1246 | $11,000,000 MLS #14-428 | $4,995,000MLS #12-1183 | $6,900,000

www.JHREA.com | 888.733.6060 | 80 W. Broadway, Jackson, WY
Condominium & Townhome SegmentCondominiums and townhomes in Jackson Hole have been on the upswing. With a more affordable price tag than single family homes, condominiums and townhomes have been very popular and transactions have remained level when compared to last year. This stability contributed to a total dollar volume increase of 5%, making this the only major segment of the market with an increase in total dollar volume. Condominiums and townhomes were among the first properties to experience appreciation and sale price gains during the market recovery. This trend has continued this year with both average and median sale prices increasing approximately 7% - 8%. The median sale price of a condominium/townhome in Jackson Hole has risen to approximately $452,000. About half of the condominium/townhome sales this year were under $500,000. At this time last year, nearly 60% of the sales were under $500,000. The lack of inventory was especially prominent in this segment of the market with active listings at the end of the 3rd quarter, down 27% from last year.
Vacant Land SegmentThe vacant land segment of the market has made continued improvement. While the number of sales were down about 20% from 3rd quarter of 2013, the average sale price was up 20%. This was spurred by a 55% increase in the number of sales between $2M and $5M, and a 34% decrease in the number of sales under $500,000. Possibly a more accurate measure of the vacant land market is the median sale price which increased 2% over last year. Historically, the Town of Jackson and the area South of Jackson compete for the most land sales of any other area. However, the Town of Jackson had a huge drop (down 78%) in land sales compared to this time last year, and the area South of Jackson proved to be a hotspot with 24 total land sales. This accounted for about 31% of all land sales this year, far more than any other area. The vacant land segment as a whole has continually improved each quarter since market recovery. Land sales have been marred by the huge amount of inventory in the past, however, this trend continues to improve, with an approximate 10% drop in the number of parcels currently listed for sale. Vacant land will become more popular with buyers as existing home inventory diminishes, as well as affordability.
Market Overview by Segment (continued)
2013 Quarter 3 2014 Quarter 3 2013 Quarter 3 2014 Quarter 3
Sales Distribution by Type Sales Distribution by Price
Condo/ Townhome
31%
Single Family44%
Vacant Land19%
Other6%
$500K - $1M34%
Under $500K31% $1M - $2M
19%
$2M - $5M14%
Over $5M3%
Condo/ Townhome
35%
Single Family39%
Vacant Land18%
Other9%
$500K - $1M32%
Under $500K36%
$1M - $2M19%
$2M - $5M11%
Over $5M2%
Luxury Market Spotlight
Sold | 14-553
Jackson Hole, Wyoming is synonymous with luxury and is an international marketplace for luxury real estate. The demand for high quality, exclusive properties has outperformed this time period last year by approximately 18% when looking at the number of transactions. The total dollar volume of those transactions accounted for over $160M in sales, an approximate 11% increase over last year.
Record Sale (through Q3): $24,500,000*
Average Sale Price Above $3M: $5,706,708
Number of Sales Above $3M: 26*listing price
Jackson Hole Real Estate Associates exclusively owns and maintains the valley’s oldest and most comprehensive database. The Jackson Hole Real Estate Associates’ Market Report, unlike others in the valley, is derived from the JHREA proprietary, forty year old database (not just mls data) as well as decades of history and success making this the most trusted and accurate real estate report in the region. No other real estate company or agent has the resources available to offer this depth of expertise or insight regarding current or previous market conditions. The unmatched resources and knowledge of Jackson Hole Real Estate Associates, the largest and most dynamic real estate company in the region, combined with the largest luxury real estate affiliation, Christie’s International Real Estate, offer the ideal balance of local expertise and global reach.
For additional information or a market update in your area, please do not hesitate to contact one of our real estate professionals.
307 733 6060 TEL
307 733 3483 FAX
www.JHREA.com
PO Box 4897Jackson, WY 83001
80 West Broadway
Jackson, WY 83001
270 West Pearl
Jackson, WY 83001
Snow King Hotel Jackson, WY 83001
PO Box 3225181 Alpine DriveAlpine, WY 83128
307 654 7575 TEL
PO Box 846235 South Main StreetThayne, WY 83127
307 883 7575 TEL
65 South Main StreetDriggs, ID 83422208 354 7325 TEL
Our Locations
www.JHREA.com | 888.733.6060 | 80 W. Broadway, Jackson, WY
* The statistics used in this report are from the Teton Multiple Listing Service (MLS) and JHREA’s internal database.* This report does not go into detail on every segment of the market, but is intended to offer an overview of general market conditions.*All statistics are supplied by sources that have been deemed reliable but are not guaranteed.
0
20
40
60
80
100
120
140
160
180
200
220
240
260
280
300
Number of Sales by Quarter
1Q0
7
2Q
07
3Q
07
4Q
07
1Q0
8
2Q
08
3Q
08
4Q
08
1Q0
9
2Q
09
3Q
09
4Q
09
1Q10
2Q
10
3Q
10
4Q
10
1Q11
2Q
11
3Q
11
4Q
11
1Q12
2Q
12
3Q
12
4Q
12
1Q13
2Q
13
3Q
13
4Q
13
1Q14
2Q
14
3Q
14