Investigation Responses of the Diagrid Structural System ...
21
25 Journal of Building Material Science | Volume 01 | Issue 02 | December 2019 Distributed under creative commons license 4.0 DOI: https://doi.org/10.30564/jbms.v1i2.2580 Journal of Building Material Science http://ojs.bilpublishing.com/index.php/jbmr ARTICLE Investigation Responses of the Diagrid Structural System of High-rise Buildings Equipped with Tuned Mass Damper Using New Dynamic Method Mansour Ghalehnovi 1 Arash Karimipour 2* Mahmoud Edalati 3 Mehdi Barani 3 1. Department of Civil engineering at Ferdowsi University of Mashhad, Mashhad, Iran 2. Department of Civil Engineering at Texas University at El Paso and the Member of Centre for Transportation Infrastructure System (CTIS), Texas, USA 3. Department of Civil engineering at Ilam University, Ilam, Iran ARTICLE INFO ABSTRACT Article history Received: 16 November 2020 Accepted: 30 November 2020 Published Online: 30 December 2020 Due to the shortage of land in cities and population growth, the significance of high rise buildings has risen. Controlling lateral displacement of structures under different loading such as an earthquake is an important issue for designers. One of the best systems is the diagrid method which is built with diagonal elements with no columns for manufacturing tall buildings. In this study, the effect of the distribution of the tuned mass damper (TMD) on the structural responses of diagrid tall buildings was investigated using a new dynamic method. So, a diagrid structural systems with variable height with TMDs was solved as an example of structure. The reason for the selection of the diagrid system was the formation of a stiffness matrix for the diagonal and angular elements. Therefore, the effect of TMDs distribution on the story drift, base shear and structural behaviour were studied. The obtained outcomes showed that the TMDs distribution does not significantly affect on improving the behaviour of the diagrid structural system during an earthquake. Furthermore, the new dynamic scheme represented in this study has good performance for analyzing different systems. Abbreviation: TMD - tuned mass damper; SATMD - semiactive-tuned mass dampers; MDOF - multiple degrees of freedom; m i - mass of ith story of the building; c i - damping coefficient of the ith story of the building; k i - stiffness of ith story of the building; x i - displacement of the ith story of the building; m d - mass of damper; c d - damping coefficient of the damper; k d - stiffness of damper; x d - displacement of TMD; M i - generalized mass of the ith normal mode; C i - generalized damping of the ith normal mode; K i - generalized stiffness of the ith normal mode; K i (t) - generalized load of the ith normal mode; Y i (t)- generalized displacement of the ith normal mode; [M] - matrices of mass; [C] - matrices of damping; {P (t)} - consequence external forces; N i (τ) - interpolation functions; [Ai] - mechanical properties of the structure. Keywords: Base shear Diagrid structural system Dynamic methods Story drift The tuned mass damper Tall building *Corresponding Author: Arash Karimipour, Department of Civil Engineering at Texas University at El Paso and the Member of Centre for Transportation Infrastructure System (CTIS), Texas, USA; Email: [email protected]
Transcript of Investigation Responses of the Diagrid Structural System ...

25
Journal of Building Material Science | Volume 01 | Issue 02 | December 2019
Distributed under creative commons license 4.0 DOI: https://doi.org/10.30564/jbms.v1i2.2580
Journal of Building Material Sciencehttp://ojs.bilpublishing.com/index.php/jbmr
ARTICLE Investigation Responses of the Diagrid Structural System of High-rise Buildings Equipped with Tuned Mass Damper Using New Dynamic Method
Mansour Ghalehnovi1 Arash Karimipour2* Mahmoud Edalati3 Mehdi Barani3
1. Department of Civil engineering at Ferdowsi University of Mashhad, Mashhad, Iran2. Department of Civil Engineering at Texas University at El Paso and the Member of Centre for Transportation Infrastructure System (CTIS), Texas, USA 3. Department of Civil engineering at Ilam University, Ilam, Iran
ARTICLE INFO ABSTRACT
Article historyReceived: 16 November 2020Accepted: 30 November 2020Published Online: 30 December 2020
Due to the shortage of land in cities and population growth, the significance of high rise buildings has risen. Controlling lateral displacement of structures under different loading such as an earthquake is an important issue for designers. One of the best systems is the diagrid method which is built with diagonal elements with no columns for manufacturing tall buildings. In this study, the effect of the distribution of the tuned mass damper (TMD) on the structural responses of diagrid tall buildings was investigated using a new dynamic method. So, a diagrid structural systems with variable height with TMDs was solved as an example of structure. The reason for the selection of the diagrid system was the formation of a stiffness matrix for the diagonal and angular elements. Therefore, the effect of TMDs distribution on the story drift, base shear and structural behaviour were studied. The obtained outcomes showed that the TMDs distribution does not significantly affect on improving the behaviour of the diagrid structural system during an earthquake. Furthermore, the new dynamic scheme represented in this study has good performance for analyzing different systems. Abbreviation: TMD - tuned mass damper; SATMD - semiactive-tuned mass dampers; MDOF - multiple degrees of freedom; mi - mass of ith story of the building; ci - damping coefficient of the ith story of the building; ki - stiffness of ith story of the building; xi - displacement of the ith story of the building; md - mass of damper; cd - damping coefficient of the damper; kd - stiffness of damper; xd - displacement of TMD; Mi - generalized mass of the ith normal mode; Ci - generalized damping of the ith normal mode; Ki - generalized stiffness of the ith normal mode; Ki (t) - generalized load of the ith normal mode; Yi (t)- generalized displacement of the ith normal mode; [M] - matrices of mass; [C] - matrices of damping; {P (t)} - consequence external forces; Ni(τ) - interpolation functions; [Ai] - mechanical properties of the structure.
Keywords:Base shearDiagrid structural systemDynamic methodsStory driftThe tuned mass damperTall building
*Corresponding Author:Arash Karimipour, Department of Civil Engineering at Texas University at El Paso and the Member of Centre for Transportation Infrastructure System (CTIS), Texas, USA; Email: [email protected]

26
Journal of Building Material Science | Volume 01 | Issue 02 | December 2019
Distributed under creative commons license 4.0
1. Introduction
Controlling the seismic behaviour of high-rise building against the lateral loading as earthquake and wind is an important issue in civil engineering
fields. So, its design was done based on lateral loads. There are different structural systems. Diagrid structural system is one of the building systems which is used mostly in high rise building for various reasons as for architectural consideration [1]. In order to reduce structural responses and control the behaviour of the structure, different mechanisms can be used. TMDs is one of the most common mechanisms for controlling displacement and providing the stability of structures. Previous studies have shown that TMDs have used mostly around the world. In 1909, the original design dynamic vibration damper was presented based on the dynamic and static studies of buffers vibration [2]. Ormond and Den Hartog
[3] presented a new complete model of buffers based on the buffers vibration and damper studies. In 1952, Bishop and Welbourn [4], studied the different system of structures using buffers vibration and damping effect. Many studies have done by Den Hartog [5], Falcon et al. [6], Petersen [7], Sladek and Klingner [8], Randall et al. [9], Warburton
[10], Shu et al. [11], Li and Liu [12] and Wu et al. [13] which show the effect of different parameters of TMDs on the behaviour of various structures under dynamic loads. In 2015, Engle et al. [14] used Hybrid Tuned Mass Damper (HTMD) for vibration control of floor slab system. In 2013, Bekdas et al. [15] studied the better performance of TMDs using a physical model based on the mass ratio parameter (Figure 1).
Figure 1. Multi-degree of freedom system with tuned mass damper [15]
In order to overcome the review of TMDs, first of all,
research was studied by Morison and Karnopp [16] (1973). Although, the first investigation on the active-tuned mass dampers (ATMDs) has been done by Lund [17], Chang and Soong [18] and Udwadia and Tabaie [19]. Also, ATMDs are more effective than passive ones in vibration control, the dependency of actively controlled systems on the external energy source is a disadvantage since power failure is always possible during strong earthquakes. Hrovat et al. [20] and Abe [21] used semiactive-tuned mass dampers (SATMD) to suppress wind and earthquake-induced vibrations. Performance-based design processes will increasingly take centre stage, making conventional prescriptive (minimum standard) codes obsolete [22]. The acceptable risk criterion for design purposes will be defined in terms of performance objectives and hazard levels, creating a more site and structure-specific standard
[23-25]. Multiple annual probability maps for spectral acceleration responses and the peak ground motion, along with more realistic predictions of the effects of site soils, topography, near-source rupture mechanisms and spatial variation, should provide a better characterization of earthquakes design and expected ground motions [26-
27]. Analytical tools for reliable prediction of structural response are essential tools in performance-based design processes which will continue to improve the behaviour of structures and include new devices and materials [28]. The area of soil-structure interaction, perhaps the least understood aspect in the field of earthquake engineering, is poised to witness the emergence of new numerical techniques to model nonlinear soils and structures in a manner that was not possible until now, due to the significant computational effort required [29-37]. The development of new structural systems and devices will continue for base isolation, passive, active and semi-active controlling systems. These will progress, in part, with the increasing proliferation of non-traditional civil engineering materials and systems [38-44]. Complete probabilistic analysis and design approach that rationally accounts for uncertainties present in the structural system will gradually replace deterministic approaches, especially in the characterization of the natural loads [45-46].
A control system consisting of the combination of the seismic isolation systems and the control devices, such as passive, active or semi-active control elements often referred to as a hybrid control system [47-52]. Among different combinations that are possible for a hybrid approach, semi-active control systems are attractive for use with base isolation systems because of their mechanical simplicity, low power requirements, and large controllable force capacity [53-56]. However, the range of applicable structures for this type of base isolation is still
DOI: https://doi.org/10.30564/jbms.v1i2.2580

27
Journal of Building Material Science | Volume 01 | Issue 02 | December 2019
Distributed under creative commons license 4.0
narrow due to technical difficulties in the isolation layer. Thus, a modified system concept needs to be defined to broaden the applicability and efficacy of these approaches to cover a wider range of structures. Previous studies showed that braced tubular systems were provided with a better shear resistance resulting diagonal member. Consequently, structural attention and system of diagrid structural due to use this system has risen, however, the history of this system came back to 1960s. Due to the complex connection and lack of technological progress, a small number of structures were by using this system. The first building constructed with diagrid structural system, Swiss Re building in London, was completed in 2004. In this structure, tubular behaviour was provided using triangular shapes element about the building. It should be mentioned that the difference in this system with the system tube is that the stability of the structure provided using configuration of triangular shape and removing outside columns. In Figs. 2 and 3, an example of the diagrid structural system and loads distribution was presented, respectively
Figure 2. diagrid structural system
Figure 3. load distribution in diagrid element a) under gravity load, b) under lateral load
In this structural system, diagrid elements are in the view of the structures. It is notable that despite the com-monly used system of diagrid structural system in high rise building, there is no a lot of information on its struc-tural behaviour. It should be mentioned that the diagonal members are connected with simple connections; so, the power of explosion or airstrikes redistributed. Further-more, because of the behaviour of the tube, these systems
suffered shear lag. The results of some studies shown that the performance of TMDs in high rise building mostly depends on the earthquake characterizes [57]. According to some researches, the mass of damper is only effective in reducing structural response when the earthquake has a small frequency range and time to belong. Given the uncertainty in the prediction of earthquakes and dynamic properties of structures such as natural frequency and the dissipation modes of vibration, this is the best way to use the number of dampers called multi tuned mass dampers (MTMDs) [58].
Recently, Asadi and Adel [59] studied the structural behaviour of diagrid system tall building. In thi study, different diagrid configurations, main factors affecting their behaviours, and related design factors and methods are assessed. Then, diagrid system for free‐form steel and concrete tall building are presented presentation the diagrid applicability for complex structures, diagrid nonlinear performance and structural control of diagrid systems. Furthermore, recentaly reseraches about the tubular and diagrid systems are discussed briefly. Finally, the diagrid potential in design of sustainable buildings is defined. In 2012, Kim and Kong [60] evaluated the progressive collapse performance of diagrid buildings based on arbitrary column removal scenario. For this aim, 33‐story buildings with cylindrical, convex, concave and gourd shapes were designed and their nonlinear static and dynamic analysis outcomes were evaluated. Furthermore, the influence of design variables such as the number of total stories, slope of diagrid elements and the location of removed members was also assessed. Outcomes demonstrated that the diagrid structures presented an appropriate progressive collapse‐resisting strength regardless of the differences in shapes when a couple of diagrids were removed from the first story. In another investigation, Mele et al. [61] assessed the structural responces of diaigrid structural element of tall buildings. In this design trend, the so‐called diagrid structures, which denote the latest change of tubular structures, play a main character due to their inherent visual quality, structural efficacy and geometrical versatility. In this research, an overview on application of such typology to high‐rise buildings is carried out; in particular, firstly, the peculiarities of diagrid systems are defined: starting from the analysis of the internal forces arising in the single diagrid module due to vertical and horizontal loads, the resisting mechanism of diagrid buildings under gravity and lateral loads is defined. Furthermore, a comparative analysis of the structural behaviour of some recent diagrid tall buildings have done and some general design statements are derived.
DOI: https://doi.org/10.30564/jbms.v1i2.2580

28
Journal of Building Material Science | Volume 01 | Issue 02 | December 2019
Distributed under creative commons license 4.0
In 2013, Montouri et al. [62] defined designing criterias for diagrid tall buildings: Stiffness versus strength. The processes and inventions recommended in this study for the design of diagrid structures start from the assumption that diagonal sizing process is directed by the stiffness requirements, as usually occurs for other, less efficient, structural types, and that member strength claim is spontaneously satisfied by the cross section resulting from the stiffness requirements. In this study, stiffness and resistance design criteria for diagrid structures are evaluated and translated in simplified formulae for quick member sizing. The application of the two approaches for the design of a 100‐storey building model, carried out for different diagrid pattern. In another research, Angelucci and Mollaioli [63] assessed the shape of diagonal element of diagrid system of tall building. In this study, a comprehensive outline of the peculiarities of diagrids, providing a complete framework of their mechanical performance and examines the accurateness of the expectations used in common practice. The study discovers, firstly, the effectiveness of the stiffness‐based methodology for optimal (69°) and nonoptimal (82°) diagonal inclinations, evaluating if the common approach leads to the definition of optimized cross sections in terms of reducing drifts and steel utilization. Furthermore, they analyzed and comparded diagrid models with non‐uniform pattern shape generated from topological valuations.
2. Research Significance
In previous studies, the effect of TMDs on the different structural systems was investigated but this mechanism did not consider in the diagrid structural system which is used for tall and high rise buildings. Moreover, in this study, a new dynamic method was employed to analysis the diagrid system of tall buildings.
3. Governing Equations of Motion of the Sys-tem
In this section, governing equations are summarized (prediction of earthquakes and dynamic properties of structures such as natural frequency and the dissipation modes of vibration, better than the number of dampers to be used more called multi tuned mass dampers (MTMDs) [64-66]. The motion equations of multiple degrees of freedom (MDOF) linear system subjected to external loading P(t) can be explained as follow:
(1)M, C, K are mass, damping and stiffness matrices,
respectively. Furthermore, x(t), x3 (t) and x(t) is the vector
of the horizontal displacements, velocity and acceleration with respect to the ground. The M, C, K matrices and x(t) vector for multi degrees of freedom system (MDOFs) represented in Eqs. 2 to 5.
(2)
(3)
(4)
(5)Where, mi, ci ,ki and xi are mass, damping coefficient,
stiffness and displacement of the ith story of the building. Correspondingly, md, cd, kd and xd are mass, damping coef-ficient, stiffness and displacement of TMD.x(t)=ΦY(t) (6)
Where, the mode-shape matrix serves to transform the generalized coordinates x(t) to the geometric coordinates. The coupled dynamics equations can be written by replacing Φi
T in Eq. 1.
(7)So, all components expect ith mode in the mass,
damping and stiffness expressions of Eq. (7) are neglected.
(8)mi, ci, Ki, Ki(t) and Yi(t) are generalized mass, damping,
stiffness, load and displacement of the ith normal mode, respectively.
4. Solution by Using the New Dynamic Method
In this method, the change of displacement is obtained by utilizing interpolation functions. The velocity and acceleration could be obtained due to the derivation of the displacement function. There are eight unknown vectors in these functions. These vectors can be found using the following conditions:
(1) The rate of displacement and velocity vector changing in the previous step to be known.
(2) The rate of displacement and velocity vector changing at the beginning step to be known.
(3) Establishing a stationary equation at the beginning of a step.
(4) Establishing a stationary equation at the end of a
DOI: https://doi.org/10.30564/jbms.v1i2.2580

29
Journal of Building Material Science | Volume 01 | Issue 02 | December 2019
Distributed under creative commons license 4.0
step. (5) Minimize the response error of the governing
equation in the step-wise range.To use these conditions in the proposed relations, the
first dynamic differential equation of motion is written as follow:
(9)[M] and [C] are matrices of mass and damping. Also,
[K]{x} and {P(t)} are the external forces vector and con-sequence external forces which {x}, {x3 } and {x} indicated the vector of displacement, velocity and acceleration, respectively. This equation was written for the first step of i time. Time at the beginning step is ti and at the end of time is . Therefore, the suggestion equation to determine displacement written as follow.
(10)Where τ is the time variable and its value varies be-
tween 0 and 1. The relationship between τ and t is as fol-lows:
(11)
Also, the function of and is called interpolation func-tions as follows:
(12)
(13)
(14)
(15)
(16)
(17)
(18)
(19)
Depending on the Differentiate of displacement, velocity and acceleration are obtained:x
(20)
(21)The vectors and are available with the
knowledge of the displacement changing rate and velocity
vectors of the previous step. The vectors {xi} and {x3 i} are also found, given the specified values of displacement and velocity at the beginning of the step. By writing the equilibrium at the beginning of the step, the vector {xi} is found in the following:
(22)The next equation is to establish a balance at the end of
the step:
(23)It should be noted that the next equality is made avail-
able by placing τ=-1 in Eq. 42. the acceleration of develop-ment of the previous step in this equality is clear:
(24)
The equation of dynamic equilibrium error is as follow during the step:
(25)
By replacing Eqs. 31, 41 and 42 in Eq. 46, end-point error equation was obtained as follows:
(26)By sorting the Eq. 39, the error equation is available to
the following:
(27)Also, the first error function is defined in the form of
Eq. 49. In order to obtain a high precision relationship, the total error must be minimized:
(28)
the remains of the unknown could be obtained by using
DOI: https://doi.org/10.30564/jbms.v1i2.2580

30
Journal of Building Material Science | Volume 01 | Issue 02 | December 2019
Distributed under creative commons license 4.0
Eqs. 43, 44, 45 and 49. Then the answer at the end of the step can be calculated:
(29)
(30)
(31)
In the previous equation, {A} is the first function and is defined as:
(32)
Also, the matrices [A1] to [A7] have mechanical properties of the structure and are accessible to the following:
(33)
(34)
(35)
(36)
(37)
(38)
(39)
With △xi, according to Eq. 50, △x3 i and △xi can be found in the following representation:
(40)
(41)
Table 1. Used ground motion properties
Record Station Component PGA (g) PVG (cm/s) PGD (cm) Record time (Sec) Magnitude
Imperial Valley 1940El Centro Array I-ELC180 0.313 29.8 13.32 36.82 7.0
El Centro Array I-ELC270 0.313 30.2 23.91 36.82 7.0
Kobe 1995Takarazuka TAZ090 0.694 85.3 16.75 40.00 6.9
Takarazuka TAZ000 0.693 68.3 26.65 40.00 6.9
Kocaeli 1999Yarimca YPT-060 0.268 65.7 57.01 35.00 7.4
Yarimca YPT-330 0.349 62.1 50.97 35.00 7.4
Loma Prieta 1989Capitola CAP000 0.529 36.5 9.11 40.00 6.9
Capitola CAP090 0.443 29.3 5.50 40.00 6.9
Northridge 1994Sylmar-Olive SYL-090 0.604 78.2 16.05 40.00 6.7
Sylmar-Olive SYL-360 0.843 129.6 32.68 40.00 6.7
Tabas 19789101 Tabas TAB-TR 0.852 121.4 94.58 33.00 6.9
9101 Tabas TAB-LN 0.836 120.7 36.92 33.00 6.9
Chi-Chi, Taiwan 1999CHY080 CHY080-N 0.902 102.4 33.97 46.00 7.6
CHY080 CHY080-W 0.968 107.5 18.60 46.00 7.6
DOI: https://doi.org/10.30564/jbms.v1i2.2580

31
Journal of Building Material Science | Volume 01 | Issue 02 | December 2019
Distributed under creative commons license 4.0
5. Modelling
In this study, three diagrid system tall building with different height were considered. The structural design was done based on the ASCE7-10 code. Three structures were investigated by using a new dynamic method under seven earthquake records as shown in Table 1. It should be mentioned that all earthquake records were scaled to the maximum acceleration of gravity (g). Response spectra of acceleration records were attained based on damping ratio of 5%. Response spectra of each record were compared with within the time period 1.5T to 2T using the square root of the sum of squares method. These responses spectra compared with standard code. So, in this period range, the average values, in any case, should not less than 4.1 times as much as in the standard value. The modelling was performed using codes according to Table 2. Also, in Tables 3 and 4 the members’ material and load properties were shown, respectively. Furthermore, the structures were analyzed by using OpenSees and the obtained outcomes were compared to those that resulted from presented new dynamic method.
Table 2. Used code
Production Code
Loading ASCE/SEI 7-10
Steel ANSI/AISC 360-05 by ANSI, 2005
Concrete ACJ 318-11 by A.C. I committee (2001)
Table 3. Materials properties
Concrete slab 4000PSI(fc'=27.6Mpa)
Concrete wall 5000PSI(fc'=34.5Mpa)
Reinforcement A615Gr60(fy=413Mpa)
steel A992Fy50(fy=345Mpa)
6. Verification
In modelling, the wide flange (WF), H and circular hollow sections (CHS) were used for the beam, column and diagonal members, respectively. The properties of the used sections are represented in Table 5.
Table 5. Member’s section properties
Member Section properties (mm)
Beam
WF: 300*150*5.5*8600*400*12*30800*300*14*22800*300*14*26900*350*14*25200*150*6*9250*125*5*8
Column H: 500*500*30*60600*600*20*40
Diagonal member
CHS: 600*50850*5
1000*1001200*1001200*120
All floor slabs were 130 mm thickness for steel deck and concrete core inside thickness was assumed 450 mm. Panels’ dimension of floors, story height and span width are 36, 4m and 4m, respectively. The modelling was verified with Garlan’s model [58]. The obtained outcomes of this validation based on the original mode period with the reference model are compared as presented in Table 6.
According to Table 6, the difference between the obtained results from the presented study and reference structure is less than 10%. So the modelling and presented a new dynamic method have good agreement with Garlan’s model [58]. The parameters of TMDs were set based on critical mode. So, the first mode was critical and TMDs were set based on the first mode. In this study, the effect of mass distribution in the least four stories has
Table 4. Load properties
Loads Loads properties
Dead
Concrete density(kN/m3)
Steel density(kN/m3)
Partitions weigh per area(kN/m2)
Flow weigh per area(kN/m2)
Roof weight per area(kN/m2)
23.60 77.00 0.96 1.58 0.10
Live
Flow weigh per area (kN/m2)
Roof weight per area (kN/m2) Lift Machines
2.40 0.96 1.33
SnowPf (kN/m2) Pg ((Lb/fc) IS Ct
0.73 20.00 1.10 1.00
windCp(face to wind) Cp(back to wind) V (Mph) Position factor Wind factor Direction factor
0.80 0.50 110.00 1.00 0.85 0.85
DOI: https://doi.org/10.30564/jbms.v1i2.2580
32
Journal of Building Material Science | Volume 01 | Issue 02 | December 2019
Distributed under creative commons license 4.0
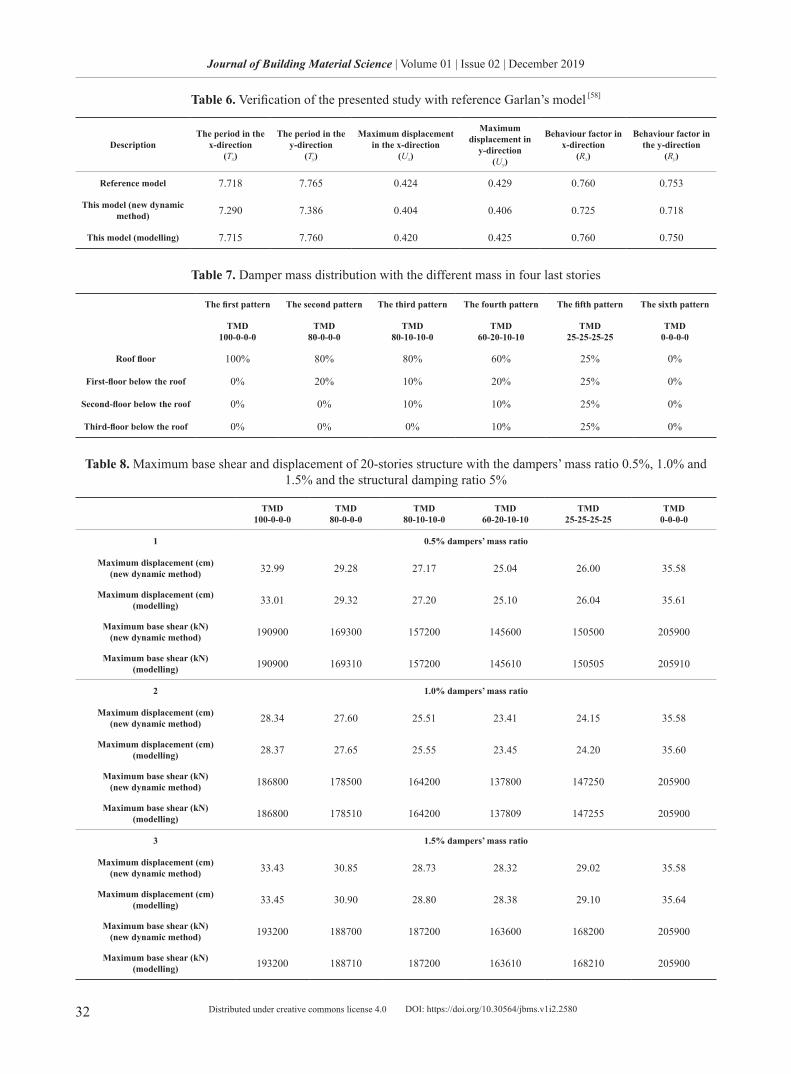
Table 6. Verification of the presented study with reference Garlan’s model [58]
DescriptionThe period in the
x-direction(Tx)
The period in the y-direction
(Ty)
Maximum displacement in the x-direction
(Ux)
Maximum displacement in
y-direction(Uy)
Behaviour factor in x-direction
(Rx)
Behaviour factor in the y-direction
(Ry)
Reference model 7.718 7.765 0.424 0.429 0.760 0.753
This model (new dynamic method) 7.290 7.386 0.404 0.406 0.725 0.718
This model (modelling) 7.715 7.760 0.420 0.425 0.760 0.750
Table 7. Damper mass distribution with the different mass in four last stories
The first pattern The second pattern The third pattern The fourth pattern The fifth pattern The sixth pattern
TMD100-0-0-0
TMD80-0-0-0
TMD80-10-10-0
TMD60-20-10-10
TMD25-25-25-25
TMD0-0-0-0
Roof floor 100% 80% 80% 60% 25% 0%
First-floor below the roof 0% 20% 10% 20% 25% 0%
Second-floor below the roof 0% 0% 10% 10% 25% 0%
Third-floor below the roof 0% 0% 0% 10% 25% 0%
Table 8. Maximum base shear and displacement of 20-stories structure with the dampers’ mass ratio 0.5%, 1.0% and 1.5% and the structural damping ratio 5%
TMD100-0-0-0
TMD80-0-0-0
TMD80-10-10-0
TMD60-20-10-10
TMD25-25-25-25
TMD0-0-0-0
1 0.5% dampers’ mass ratio
Maximum displacement (cm)(new dynamic method) 32.99 29.28 27.17 25.04 26.00 35.58
Maximum displacement (cm)(modelling) 33.01 29.32 27.20 25.10 26.04 35.61
Maximum base shear (kN)(new dynamic method) 190900 169300 157200 145600 150500 205900
Maximum base shear (kN)(modelling) 190900 169310 157200 145610 150505 205910
2 1.0% dampers’ mass ratio
Maximum displacement (cm)(new dynamic method) 28.34 27.60 25.51 23.41 24.15 35.58
Maximum displacement (cm)(modelling) 28.37 27.65 25.55 23.45 24.20 35.60
Maximum base shear (kN)(new dynamic method) 186800 178500 164200 137800 147250 205900
Maximum base shear (kN)(modelling) 186800 178510 164200 137809 147255 205900
3 1.5% dampers’ mass ratio
Maximum displacement (cm)(new dynamic method) 33.43 30.85 28.73 28.32 29.02 35.58
Maximum displacement (cm)(modelling) 33.45 30.90 28.80 28.38 29.10 35.64
Maximum base shear (kN)(new dynamic method) 193200 188700 187200 163600 168200 205900
Maximum base shear (kN)(modelling) 193200 188710 187200 163610 168210 205900
DOI: https://doi.org/10.30564/jbms.v1i2.2580

33
Journal of Building Material Science | Volume 01 | Issue 02 | December 2019
Distributed under creative commons license 4.0
been studied. Also, the masses distribution is presented in Table 7.
In Table 7, is tuned mass damper and a, b, c and d is the amount of dampers’ mass in the roof floor, the first-floor below the roof, the second-floor below the roof and the third-floor roof, respectively. So, the better mass distribution for dampers was also investigated in this study.
7. Examples
For examination, the new dynamic method for the diagrid system tall buildings equipped with TMDs was employed. The reason for this structure selection was the presence of members that were diagonal and angular with the horizon, which makes the angle for the member’s stiffness and difficult to comprehend.
Figure 4. (a) maximum base shear (b) maximum displacement of 20-stories structure with 0.5% dampers’ mass ratio and 5% structural damping ratio
Figure 5. (a) maximum base shear (b) maximum displacement of 20-stories structure with 1.0% dampers’ mass ratio and 5% structural damping ratio
Figure 6. (a) maximum base shear (b) maximum displacement of 20-stories structure with 1.5% dampers’ mass ratio and 5% structural damping ratio
DOI: https://doi.org/10.30564/jbms.v1i2.2580

34
Journal of Building Material Science | Volume 01 | Issue 02 | December 2019
Distributed under creative commons license 4.0
7.1 20-stories Structure
In this example, the outcomes of the 20-stories structure are invest igated. The maximum base shear and displacement for the dampers’ mass ratio 0.5%, 1.0% and 1.5% and the structural damping ratio 5% are obtained and presented in Table 8, and Figs 4 to 6. Then, the best model was selected between different structural modes
and then the structural responses were studied with a structural damping ratio of 3% and 8%. Furthermore, according to Table 8, presented a new dynamic method has good agreement with modelling outcomes.
Consequently, the effect of structural damping ratio 3% and 8% with the dampers’ mass ratio 0.5%, 1% and 1.5 % evaluated by using a new dynamic method as shown in Figure 7.
Figure 7. (a) minimum base shear (b) minimum displacement of 20-stories structure with the dampers’ mass ratio 0.5%, 1.0% and 1.5% with 5% structural damping ratio
Figure 8. (a) maximum base shear (b) maximum displacement of 20-stories structure with the 1% with the damping ratio 3%, 5% and 8%
Table 9. Maximum base shear and story displacement of 20-stories structure with the dampers’ mass ratio 1.0% and damping ratio 3% and 8%
Structure with no damper
Structure with 5% damping ratio
Structure with 3% damping ratio
Structure with 8% damping ratio
Story displacement (cm) 35.58 23.41 26.63 22.80
Structural differences of displacement with no damper 0.00% 34.02% 25.15% 35.91%
Base shear (kN) 205900 137800 152600 135900
Structural differences of base shear with no damper 0.00% 33.07% 25.88% 33.99%
DOI: https://doi.org/10.30564/jbms.v1i2.2580

35
Journal of Building Material Science | Volume 01 | Issue 02 | December 2019
Distributed under creative commons license 4.0
In this study, according to Figure 7, the better responses were obtained using dampers’ mass ratio 1.0% with mass distribution 60%, 20%, 10% and 10% for the roof floor, the first-floor below the roof, the second-floor below the roof and the third-floor below the roof, respectively. Also, the best model was selected and compared with the damping ratio of 3% and 8%. The obtained results are presented in Table 9.
According to Table 9, the maximum story displacement and base shear were reduced by 35.91% and 33.99% in the best damper mass distribution and damping ratio, respec-tively. Furthermore, the obtained results of the damping ratio of 5% and 8% are very close together. Consequently, according to Figure 8, the base shear and the maximum displacement with the dampers’ mass ratio 1% with 3%, 5% and 8% damping ratio is represented. According to this figure, with an increase in damping ratio of more than 5%, the structural responses are not decreased noticeably.
7.2 30-stories Structure
In this example, the results of the 30- stories structure are investigated. The maximum base shear and displacement for 0.5%, 1.0% and 1.5% dampers’ mass ratio and 5% structural damping ratio were evaluated by using new presented dynamic method and presented in Table 9, and Figs 9, 10 and 11.
Then, between different models, the best model was selected and then structural responses were evaluated with a structural damping ratio 3% and 8% and 0.5%, 1% and 1.5 % dampers’ mass ratio were evaluated as shown in Figure 12. According to Figure 12, the best responses were obtained using 1.5% dampers’ mass ratio and mass distribution 80%, 10%, 10% and 0% for the roof floor, the first-floor below the roof, the second-floor below the roof and the third-floor below the roof, respectively. Also, the best model was compared with 3% and 8% damping ratio. The obtained results are compared and presented in Table 11.
Table 10. Maximum base shear and displacement of 30-stories structure with the dampers’ mass ratio 0.5%, 1.0% and 1.5% and 5% structural damping ratio
TMD100-0-0-0
TMD80-0-0-0
TMD80-10-10-0
TMD60-20-10-10
TMD25-25-25-25
TMD0-0-0-0
1 0.5% dampers’ mass ratio
Maximum displacement (cm)(new dynamic method) 19.85 49.32 48.25 16.10 46.53 67.83
Maximum displacement (cm)(modelling) 19.90 49.38 48.30 16.15 46.55 67.95
Maximum base shear (kN)(new dynamic method) 205800 205100 204300 201600 202400 295000
Maximum base shear (kN)(modelling) 205800 205110 204310 201600 202410 295000
2 1.0% dampers’ mass ratio
Maximum displacement (cm)(new dynamic method) 46.75 45.98 45.72 46.45 47.21 67.83
Maximum displacement (cm)(modelling) 46.80 46.05 45.80 46.49 47.27 67.85
Maximum base shear (kN)(new dynamic method) 202900 199900 199200 202200 203100 295000
Maximum base shear (kN)(modelling) 202900 199910 199200 202200 203110 295010
3 1.5% dampers’ mass ratio
Maximum displacement (cm)(new dynamic method) 67.83 47.36 46.22 45.53 46.84 48.15
Maximum displacement (cm)(modelling) 67.91 47.40 46.28 45.55 46.88 48.20
Maximum base shear (kN)(new dynamic method) 295000 203400 201900 198800 203000 203900
Maximum base shear (kN)(modelling) 295000 203410 201900 198810 203000 203915
DOI: https://doi.org/10.30564/jbms.v1i2.2580

36
Journal of Building Material Science | Volume 01 | Issue 02 | December 2019
Distributed under creative commons license 4.0
Then, between different models, the best model was selected and then structural responses were evaluated with a structural damping ratio 3% and 8% and 0.5%, 1% and 1.5 % dampers’ mass ratio were evaluated as shown in Figure 12. According to Figure 12, the best responses were obtained using 1.5% dampers’ mass ratio and mass
distribution 80%, 10%, 10% and 0% for the roof floor, the first-floor below the roof, the second-floor below the roof and the third-floor below the roof, respectively. Also, the best model was compared with 3% and 8% damping ratio. The obtained results are compared and presented in Table 11.
Figure 9. (a) maximum base shear (b) maximum displacement of 30-stories structure with 0.5% dampers’ mass ratio and 5% structural damping ratio
Figure 10. (a) maximum base shear (b) maximum displacement of 30-stories structure with 1.0% dampers’ mass ratio and 5% structural damping ratio
Figure 11. (a) maximum base shear (b) maximum displacement of 30-stories structure with 1.5% dampers’ mass ratio and 5% structural damping ratio
DOI: https://doi.org/10.30564/jbms.v1i2.2580

37
Journal of Building Material Science | Volume 01 | Issue 02 | December 2019
Distributed under creative commons license 4.0
According to Table 11, the maximum displacement and base shear were reduced by 33.61% and 33.15% in the best damper mass distribution and damping ratio, respec-tively. The obtained consequences of 5% and 8% damping ratio are very close together. Thus, according to Figure 13, the base shear and the maximum displacement with 1.5%
dampers’ mass ratio and 3%, 5% and 8% damping ratio
are compared. As it is seen in Figure 13, with an increase
damping ratio than 5%, the structural responses did not
decrease substantially. So the best damping ratio is 5% in
diagrid system tall buildings.
Figure 12. (a) minimum base shear (b) minimum displacement of 30-stories structure with of 0.5%, 1.0% and 1.5% dampers’ mass ratio and 5% structural damping ratio
Table 11. Maximum base shear and story displacement of 30-stories structure with 1.5% dampers’ mass ratio and 3% and 8% damping ratio
Structure with no damper Structure with 5% damping ratio
Structure with 3% damping ratio Structure with 8% damping ratio
Story displacement (cm) 67.83 45.53 47.26 45.03
Structural differences of displacement with no damper 0.00% 32.87% 32.30% 33.61%
Base shear (kN) 295000 198800 203500 197200
Structural differences of base shear with no damper 0.00% 32.61% 30.01% 33.15%
Figure 13. (a) maximum base shear (b) maximum displacement of 20 stories structure with 1.5% and of 3%, 5% dampers’ mass ratio and 8% structural damping ratio
DOI: https://doi.org/10.30564/jbms.v1i2.2580

38
Journal of Building Material Science | Volume 01 | Issue 02 | December 2019
Distributed under creative commons license 4.0
7.3 40-stories Structure
In this example, the maximum displacement and base shear outcomes of the 40-stories structure are evaluated. The maximum base shear and displacement for the different dampers’ mass ratio: 0.5%, 1.0% and 1.5% and
the structural damping ratio 5% are represented in Table 12 and Figs. 14 to 16. Then, between different models, the best model was selected and then structural responses were studied with a structural damping ratio of 3% and 8%, respectively.
Table 12. Maximum base shear and displacement of 40-stories structure with 0.5%, 1.0% and 1.5% dampers’ mass ratio and 5% structural damping ratio
TMD100-0-0-0
TMD80-0-0-0
TMD80-10-10-0
TMD60-20-10-10
TMD25-25-25-25
TMD0-0-0-0
1 0.5% dampers’ mass ratio
Maximum displacement (cm)(new dynamic method) 57.21 55.02 54.60 52.31 53.03 81.25
Maximum displacement (cm)(modelling) 57.25 55.10 54.70 52.35 53.10 81.32
Maximum base shear (kN)(new dynamic method) 272000 262300 260600 246700 252900 355400
Maximum base shear (kN)(modelling) 272000 262310 260600 246710 252910 355400
2 1.0% dampers’ mass ratio
Maximum displacement (cm)(new dynamic method) 56.93 55.22 54.90 51.72 54.20 81.25
Maximum displacement (cm)(modelling) 57.01 55.25 55.00 51.82 54.26 81.31
Maximum base shear (kN)(new dynamic method) 271500 263400 261900 243000 258500 355400
Maximum base shear (kN)(modelling) 271500 263400 261915 243010 258512 355400
3 1.5% dampers’ mass ratio
Maximum displacement (cm)(new dynamic method) 58.23 55.14 54.72 54.10 53.26 81.25
Maximum displacement (cm)(modelling) 58.27 55.20 54.75 54.15 53.31 81.28
Maximum base shear (kN)(new dynamic method) 277700 263000 261000 258000 254000 355400
Maximum base shear (kN)(modelling) 277700 263010 261000 258019 254000 355412
Figure 14. (a) maximum base shear (b) maximum displacement of 40-stories structure with 0.5% dampers’ mass ratio and 5% structural damping ratio
DOI: https://doi.org/10.30564/jbms.v1i2.2580

39
Journal of Building Material Science | Volume 01 | Issue 02 | December 2019
Distributed under creative commons license 4.0
Moreover, the effect of structural damping ratio 3% and 8% with different including 0.5%, 1% and 1.5 % are assessed and shown in Figure 17. According to Figure 17, the best structural responses were obtained using 1% dampers’ mass ratio with mass distribution 60%, 20%, 10% and 10% in the roof floor, the first-floor below the roof, the second-floor below the roof and the third-floor
below the roof, respectively. Also, the best model was compared with 3% and 8% structural damping ratio, respectively. The obtained results are shown in Table 13.
Table 13. Maximum base shear and story displacement of 40-stories structure with 1.0% dampers’ mass ratio and structural damping ratio 3% and 8%
Figure 15. (a) maximum base shear (b) maximum displacement of 40-stories structure with 1.0% dampers’ mass ratio and 5% structural damping ratio
Figure 16. (a) maximum base shear (b) maximum displacement of 40-stories structure with 1.5% dampers’ mass ratio and 5% structural damping ratio
Figure 17. (a) minimum base shear (b) minimum displacement of 40-stories structure with 0.5%, 1.0% and 1.5% dampers’ mass ratio and 5% structural damping ratio
DOI: https://doi.org/10.30564/jbms.v1i2.2580

40
Journal of Building Material Science | Volume 01 | Issue 02 | December 2019
Distributed under creative commons license 4.0
According to Table 13, the maximum displacement and base shear were reduced by 37.45% and 31.76% in the best damper mass distribution and damping ratio, respec-tively. Furthermore, as it is seen in Figure 18, the base shear and the maximum displacement with the different
1% dampers’ mass and different structural damping ratio: 3%, 5% and 8% damping ratio are compared and present-ed. According to this figure, with an increase in damping ratio of more than 5%, the structural responses did not reduce significantly.
Table 13. Maximum base shear and story displacement of 40-stories structure with 1.0% dampers’ mass ratio and structural damping ratio 3% and 8%
Structure with no damper
Structure with damping ratio 5%
Structure with damping ratio 3%
Structure with damping ratio 3%
Story displacement (cm) 81.25 51.20 54.30 50.82
Structural differences of displacement with no damper 0.00% 36.98% 33.17% 37.45%
Base shear (kN) 355400 243000 259100 242500
Structural differences of base shear with no damper 0.00% 31.62% 27.09% 31.76%
Figure 18. (a) maximum base shear (b) maximum displacement of 40-stories structure with 1% dampers’ mass ratio and the structural damping ratio of 3%, 5% and 8%
Table 14. Story drift of 20-stories structure with the best damper mass distribution
Story Story drift with damper (cm) Percentage of Story drift with damper (%)
Story drift without damper (cm)
Percentage of Story drift without damper (%)
15 4.00 1.00 5.00 1.25
16 6.00 1.50 7.00 1.75
17 5.00 1.25 8.00 2.00
18 4.50 1.13 7.00 1.75
19 3.00 0.75 10.00 2.50
20 2.00 0.50 9.00 2.25
DOI: https://doi.org/10.30564/jbms.v1i2.2580

41
Journal of Building Material Science | Volume 01 | Issue 02 | December 2019
Distributed under creative commons license 4.0
7.4 Story Drift
To investigate the story drift, the best modelling was selected. So, the structural responses of the least 6-stories of TMDs structures were evaluated with the structure with no damper.
7.4.1 20-stories Structure
According to the obtained results of 20-stories structure analysis, the best outcomes were obtained using 1.0% dampers’ mass ratio and 8% structural damping ratio with mass distribution 60%, 20%, 10% and 10% in the roof floor, the first-floor below the roof, the second-floor below the roof and the third-floor below the roof, respectively. The story drift of this model is presented in Table 14 and Figure 19.
According to Table 13 and Figure 19, using damper made the story drift more regular. In this case, the differ-ence between the drift of the structure with and without
damper was reduced by 0.25, 0.025, 0.75, 0.50, 1.75 and 1.75 for floor 15 to floor 25, respectively.
7.4.2 30-stories Structure
According to the obtained outcomes of the analysis of 30-stories structure, the best structural consequences were achieved when 1.5% dampers’ mass ratio and 8% structural damping ratio were used with damper mass distribution 80%, 10%, 10% and 0% in the roof floor, the first-floor below the roof, the second-floor below the roof and the third-floor below the roof, respectively. The story drift of this model was assessed and shown in Table 15 and Figure 20, respectively According to Table 15 and Figure 20, the difference between the drift of the structure with and without damper was reduced about 0.25%, 0.37%, 0.37%, 0.50%, 1.00% and 1.75 from story 25 to story 30, respectively.
Figure 19. Story drift of 20-stories structure with the best damper mass distribution
Table 15. Story drift of 30-stories structure with the best damper mass distribution
Story Story drift with damper (cm) Percentage of Story drift with damper (%) Story drift without damper (cm) Percentage of Story drift without damper
(%)
25 8.00 2.00 7.00 1.75
26 7.50 1.88 9.00 2.25
27 6.50 1.63 8.00 2.00
28 5.00 1.25 7.00 1.75
29 4.00 1.00 8.00 2.00
30 2.00 0.50 9.00 2.25
Figure 20. story drift of 30-stories structure with the best damper mass distribution
DOI: https://doi.org/10.30564/jbms.v1i2.2580

42
Journal of Building Material Science | Volume 01 | Issue 02 | December 2019
Distributed under creative commons license 4.0
7.4.3 40-stories Structure
According to the obtained consequences of the analysis of 40-stories diagrid system tall building, the best structural responses were obtained using mass damper ratio 1.0% dampers’ mass ratio and 8% structural damping ratio with mass distribution 60%, 20%, 10% and 10% in the roof floor, the first-floor below the roof, the second-floor below the roof and the third-floor below the roof, respectively. The outcomes of story drift of this model are presented in Table 16 and Figure 21. As it is seen in Table 16 and Figure 21, the difference between the drift of the structure with and without damper was reduced by 0.25%, 0.125%, 0.375%, 0.25%, 0.375% and 0.50% for story 35 to story 40, respectively.
8. Conclusion
In this study, the effect of the TMDs’ mass distribution on the structural responses of the diagrid system tall buildings was investigated using a new dynamic method. For this aim different building with various height were evaluated and the effect of the TMDs’ mass distribution on the story drift, base shear and structural behaviour of structures were studied. Based on the obtained outcomes,
the following conclusions can be drawn:(1) A new represented dynamic method has an
acceptable response with different solution method. (2) This method can be used for each structure with a
different mechanism.(3) The best structural responses of diagrid system tall
buildings could be obtained responses were obtained with dampers’ mass ratio 1%, 1.5% and 1% for 20, 30 and 40 stories structure, respectively. So, it can be driven that the 1% dampers’ mass ratio can be considered for diagrid structures with different height.
(4) According to this study, the best responses for 20 and 40-stories structure were obtained by using 1% damp-ers’ mass ratio with mass distribution of 60%, 20%, 10% and 10% in the roof floor, first-floor below the roof, the second-floor below the roof and the third-floor below the roof, although, for 30 stories structure, the best responses were obtained using 1.5% dampers’ mass ratio with mass distribution of 80%, 10%, 10% and 0% for the roof floor, first-floor below the roof, the second-floor below the roof and the third-floor below the roof, respectively.
(5) The difference in the 30-stories structure with 20 and 40-stories structures may be due to differences in the diagrid network. In 20 and 40-stories structure was
Table 15. Story drift of 40-stories structure with the best damper mass distribution
Story Story drift with damper (cm)
Percentage of Story drift with damper (%)
Story drift without damper (cm)
Percentage of Story drift without damper (%)
35 8.00 2.00 7.00 1.75
36 7.50 1.88 9.00 2.25
37 6.50 1.63 8.00 2.00
38 5.00 1.25 7.00 1.75
39 4.00 1.00 8.00 2.00
40 2.00 0.50 9.00 2.25
Figure 21. Story drift of 40-stories structure with the best damper mass distribution
DOI: https://doi.org/10.30564/jbms.v1i2.2580

43
Journal of Building Material Science | Volume 01 | Issue 02 | December 2019
Distributed under creative commons license 4.0
formed 2.5 and 5 diamond diagrid network, respectively. However, in 30 stories structure was formed 3.75 diamond diagrid network. So, the diagrid system in 20 and 40 story structure are different of 30 story structure.
(6) It can be driven that the best structural behaviour of diagrid structures could be obtained when the heavy-weight damper is used in the roof floor.
(7) Using damper has made structural behaviour and story drift more regular.
(8) This is recommended that the number of designed diamond diagrid network be integral. If the number of di-amond of diagrid structural network was decimal, it con-siders a multiple of 0.5.
(9) According to this study, increasing the structural damping ratio of more than 5% to 8% didn’t make signifi-cant changes in order to reduce the structural responses.
References
[1] J.J. Connor. An introduction to structural motion con-trol. IT University Press, 2001.
[2] H. Fraham. Device for damping vibration of bodies. us patent #989958, 1909
[3] R.J. Ormond, J.P. Den Hartog. The theory of dynam-ic vibration absorber. Trans. ASME.APM, 1982.
[4] R.E.D. Bishop, D.B. Welbourn. The Problem of the Dynamic Vibration Absorber: Engineer.Lond. J. Mech. Engng. Sci, 1952., 50: 174+769.
[5] J.P. Den Hartog. Mechanical Vibration. Mc-Graw-Hill. New York, 1956.
[6] K.C. Falcon, B.J. Stone, W.D. Simcock, C. Andrew. Optimization of vibration absorbers: a graphical method for use on idealized systems with restricted damping. J. Mech. Engng. Sci, 1967, 9: 374-381.
[7] N.R. Petersen. Design of large-scale Tuned Mass Dampers. ASCE convention and Exposition, Boston, Mass, U.S.A, 1979.
[8] J.R. Sladek, R.E. Klingner. Using Tuned Mass Dampers to Reduce Seismic Response. Proceedings of the 7th World Conference on Earthquake Engi-neering, Istanbul, Turkey, 1980.
[9] S.E. Randall, D.M. Halsted, D.L. Taylor. Optimum Vibration absorbers for linear damped systems. J. Mech. Des. ASME, 1981,13: 154-183.
[10] G.B. Warburton. Optimum absorbers parameters for minimizing vibration response Earthquake Eng Struct Dynam, 1981, 10: 54-73.
[11] Z. Shu, S. Li, X. Sun, M. He. Performance-based Seismic Design of a Pendulum Tuned Mass Damper System. Engineering Accepted author version posted online, 2017, 56: 35-67.
[12] C. Li, Y. Liu. Ground motion dominant frequent ef-
fect on the design of multiple tuned mass dampers. Engineering Published online, 2008, 48: 48-82.
[13] Q. Wu, J. Dai, H. Zhu. Optimum Design of Passive Control Devices for Reducing the Seismic Response of Twin-Tower-Connected Structures. Engineering Published online, 2017, 31: 154-186.
[14] T. Engle, H. Mahmoud, A. Chulahwat. Hybrid Tuned Mass Damper and Isolation Floor Slab System Opti-mized for Vibration Control. Engineering Published online, 2015, 26: 252-273.
[15] G. Bekdas, S. Melih, A. Nigdeli. Mass ratio factor for optimum tuned mass damper strategies. International Journal of Mechanical Sciences, 2013, 142: 248-263.
[16] J. Morison, D. Karnopp. Comparison of optimized active and passive vibration absorber. Proceedings of the 14th Annual Joint Automatic Control Conference, Columbus, OH, 1973: 932-938.
[17] R.A. Lund. Active damping of large structures in winds, in H.H.E. Leipholz (Ed.), Structural Control. North Holland, New York, 1980.
[18] J. Chang, T.T. Soong. Structural control using active tuned mass dampers. American Society of Civil En-gineers Journal of Engineering Mechanics Division, 1980, 106: 1081-1088.
[19] F.E. Udwadia, S. Tabaie. Pulse control of the single degree of freedom system, American Society of Civil Engineers Journal of Engineering Mechanics Divi-sion, 1981, 107: 997-1009.
[20] D. Hrovat, P. Barak, M. Rabins. Semi-active versus passive or active tuned mass dampers for structural control. American Society of Civil Engineers Journal of Engineering Mechanics Division, 1983, 109: 691-705.
[21] M. Abe. Semi-active tuned mass dampers for seismic protection of civil structures, Earthquake Engineer-ing and Structural Dynamics, 1996, 25: 743-749.
[22] J.P. Moehle. Displacement-based design of RC struc-tures subjected to earthquakes. Earthquake Spectra, 1992, 8: 403-438.
[23] C.A. Kircher. Guidelines for the seismic rehabilita-tion of buildings: Seismic isolation and energy dissi-pation applications with existing buildings. Proceed-ings of the 15th structures Congress, Part 2, Portland, OR, USA, 1997: 1234-1238.
[24] M. Mehrain, H. Krawinkler. Guidelines for the seis-mic rehabilitation of buildings: New analysis pro-cedures developed specifically for application with existing buildings. Proceedings of the 15th structures Congress, Part 2, Portland, OR, USA, 1997: 1229-1233.
[25] D. Shapiro, C. Rojahn, L.D. Reaveley, W.T. Holmes, J.P. Moehle. Guidelines for seismic rehabilitation of
DOI: https://doi.org/10.30564/jbms.v1i2.2580

44
Journal of Building Material Science | Volume 01 | Issue 02 | December 2019
Distributed under creative commons license 4.0
buildings: An overview of the background approach and contents. Portland, OR, USA, 1996: 1224-1228.
[26] B.A. Bolt. Discussion of Enduring lessons and op-portunities lost from the San Fernando earthquake of February 9, 1971’ by Paul C. Jennings. Earthquake Spectra, 1997, 13: 545-547.
[27] A. Frankel, C. Mueller, D. Perkins, T. Barnhard, E. Leyendecker, E. Safak, S. Hanson, N. Dickman, M. Hopper. New USGS seismic hazard maps for the United States. Proceedings of the Conference on Natural Disaster Reduction, Washington, DC, USA, 1996: 173-174.
[28] K.R. Mackie, B. Stojadinovic. Four way: Graphical Tool for Performance-Based Earthquake Engineer-ing. Journal of Structural Engineering, 2006, 132: 1274-1283.
[29] G. Chen C. Chen, F.Y. Cheng. Soil-structure interac-tion effect on active control of multi-story buildings under earthquake loads. Structural Engineering and Mechanics, 2000, 10: 517-532.
[30] G. Chen, J. Wu, C. Chen, M. Lou. Recent develop-ment in structural control including soil-structure interaction effect. Proceedings of SPIE - The Inter-national Society for Optical Engineering, 2000, 398: 229-242.
[31] I. Takewaki. Closed-form sensitivity of earthquake input energy to soil structure interaction system. Journal of Engineering Mechanics, 2007, 133: 389-399.
[32] I. Takewaki, H. Fujimoto. Earthquake input energy to soil-structure interaction systems: A frequency-do-main approach. Advances in Structural Engineering, 2004, 7: 399-414.
[33] J.C. Wu, M.H. Shih, Y.Y. Lin, Y.C. Shen. Y. C. De-sign guidelines for tuned liquid column damper for structures responding to wind. Engineering Struc-tures, 2005, 27: 1893-1905.
[34] W.H. Wu. Equivalent fixed-base models for soil-structure interaction systems. Soil Dynamics and Earthquake Engineering, 1997, 16: 323-336.
[35] W.H. Wu, C.Y. Chen. Simplified soil-structure in-teraction analysis using efficient lumped-parameter models for soil. Soils and Foundations, 2002, 42: 41-52.
[36] W.H. Wu, H.A. Smith. Soil-structure interaction ef-fects for internally controlled systems. Proceedings of the ASME Winter Annual Meeting, New Orleans, LA, USA, 1993: 371-379.
[37] W.H. Wu, H.A. Smith. Efficient modal analysis for structures with soil-structure interaction. Earthquake Engineering & Structural Dynamics, 1995, 24: 283-299.
[38] J.G. Chase, G.W. Wodgers, K.J. Mulligan, J.B. Mander, R.P. Dhakal. Probabilistic Analysis and Non-Linear Semi-Active Base Isolation Spectra for Aseismic Design. 8th Pacific Conference on Earth-quake Engineering, Singapore, 2007.
[39] G.W. Housner, L.A. Bergman, T.K. Caughey, A.G. Chassiakos, R.O. Claus, S.F. Masri, R.E. Skelton, T.T. Soong, B.E. Spencer, and J.T.P. Yao. Structural Control: Past, Present, and Future. Journal of Engi-neering Mechanics, 1997, 123: 897-971.
[40] S.J. Hunt. Semi-active smart-dampers and resettable actuators for multi-level seismic hazard mitigation of steel moment resisting frames. ME Thesis, Universi-ty of Canterbury, Christchurch, New Zealand, 2002.
[41] K. Mulligan, J. Chase, A. Gue, T. Alnot, G. Rodgers, J. Mander, R. Elliott, B. Deam, L. Cleeve, D. Hea-ton. Large Scale Resettable Devices for Multi-Level Seismic Hazard Mitigation of Structures. Proc. 9th International Conference on Structural Safety and Reliability (ICOSSAR), Rome, Italy, 2005.
[42] K. Mulligan, J.G. Chase, J.B. Mander, M. Fougere, B.L. Deam, G. Danton, R.B. Elliott. Hybrid experi-mental analysis of semi-active rocking wall systems. Proc New Zealand Society of Earthquake Engineer-ing Conference (NZSEE), Napier, New Zealand, 2006.
[43] G.W. Rodgers, J.G. Chase, J.B. Mander, N.C. Leach, C.S. Denmead. Experimental development, tradeoff analysis and design implementation of high force-to-volume damping technology. Bulletin of the New Zealand Society for Earthquake Engineering, 2007, 40: 35-48.
[44] T.T. Soong, B.F.J. Spencer. Active, semi-active and hybrid control of structures. Bulletin of the New Zea-land National Society for Earthquake Engineering, 2000, 33: 387-402.
[45] T. Annaka, H. Yashiro. Uncertainties in a probabilis-tic model for seismic hazard analysis in Japan. Bolo-gna, Italy, 2000, 57: 369-378.
[46] A. Refice, D. Capolongo. Probabilistic modelling of uncertainties in earthquake-induced landslide hazard assessment. Computers and Geosciences, 2002, 28: 735-749.
[47] A.Y.I. Nishitani. Overview of the application of ac-tive/semiactive control to building structures in Ja-pan. Earthquake Engineering & Structural Dynamics, 2001, 30: 1565-1574.
[48] I. Nagashima, R. Maseki, Y. Asami, J. Hirai, H. Abiru. Performance of hybrid mass damper system applied to a 36-storey high-rise building. Earthquake Engineering & Structural Dynamics, 2001, 30: 1615-1637.
DOI: https://doi.org/10.30564/jbms.v1i2.2580

45
Journal of Building Material Science | Volume 01 | Issue 02 | December 2019
Distributed under creative commons license 4.0
[49] R.I. Skinner, W. H. Robinson, G.H. McVerry. An In-troduction to Seismic Isolation. John Wiley & Sons, Inc., New York, 1993.
[50] F. Ricciardelli, A.D. Pizzimenti, M. Mattei. M. Pas-sive and active mass damper control of the response of tall buildings to wind gustiness. Engineering Structures, 2003, 25: 1199-1209.
[51] M. Watakabe, M. Tohdo, O. Chiba, N. Izumi, H. Ebi-sawa, T. Fujita. Response control performance of a hybrid mass damper applied to a tall building. Earth-quake Engineering & Structural Dynamics, 2001, 30: 16551676.
[52] J.N. Yang, A.K. Agrawal. Semi-active hybrid control systems for nonlinear buildings against near-field earthquakes. Engineering Structures, 2002, 24: 271-280.
[53] J.G. Chase, K.J. Mulligan, A. Gue, T. Alnot, G. Rod-gers, J.B. Mander, R. Elliott, B. Deam, L. Cleeve, D. Heaton. Re-shaping hysteretic behaviour using semi-active resettable device dampers. Engineering Structures, 2006, 28: 1418-1429.
[54] M.Q. Feng. Innovative base isolation system for buildings. Proceedings of the Symposium on Struc-tural Engineering in Natural Hazards Mitigation, Irvine, CA, USA, 1993: 772-776.
[55] M.Q. Feng, M. Shinozuka. Friction controllable bearings for sliding base isolation systems. Proceed-ings of the 24th Joint Meetings on Wind and Seismic Effects. Gaithersburg, MD, USA, 1992: 189-198.
[56] M. Rezaiee-Pajand, A. Karimipour. Three stress-based triangular elements. Engineering with Comput-ers, 2019,765: 1-21.
[57] A. Kareem, S. Klein performance of multiple tuned mass dampers under random loadings. Journal of structural engineering, ASCE, 1995, 121: 348-361.
[58] G. Ramadhan. Seismic performance of Diagrid Steel structures using single and Double Friction Mass Dampers. Orgon State University- Commencement June, 2014.
[59] E. Asadi, H. Adeli Diagrid: An innovative, sustain-able, and efficient structural system. The Structural Design of Tall and Special Buildings, 2017, 8(8): e1358.
[60] J. Kim, J. Kong Progressive collapse behavior of rotor‐type diagrid buildings. The Structural Design of Tall and Special Buildings, 2013, 22(16): 1199-1214.
[61] E. Mele, M. Toreno, G. Brandonisio, A De Luca Di-agrid structures for tall buildings: case studies and design considerations. The Structural Design of Tall and Special Buildings. 2014, 23(2): 124-145.
[62] G. M. Montuori, E. Mele, G. Brandonisio, A De Luca. Design criteria for diagrid tall buildings: Stiff-ness versus strength. The Structural Design of Tall and Special Buildings, 2014, 23(17): 1294-1314.
[63] G. Angelucci, F. Mollaioli, Diagrid structural sys-tems for tall buildings: Changing pattern configura-tion through topological assessments. The Structural Design of Tall and Special Buildings, 2017, 26(18): e1396.
[64] R.W. Clough, J. Penzien. Dynamics of structures. New York: Mc Graw-Hill Book Company, 1993.
[65] G.C. Hart, K. Wong. Structural dynamics for struc-tural engineering. New York: John Wiley and Sons Inc, 1999.
[66] A. K. Chopra. Dynamics of structures: Theory and applications to earthquake engineering. 2nded. New Jersey: Prentice Hall, 2001.
DOI: https://doi.org/10.30564/jbms.v1i2.2580