Tracking Dengue Virus Intra-host Genetic Diversity during Human-to ...
Intra-Regional Sales Product Diversity and Performance in ... · Intra-regional Sales, Product...
34
Intra-regional Sales, Product Diversity, and Performance in Merchandising Multinationals By Nessara Sukpanich* And Alan Rugman** *Nessara Sukpanich Lecturer of Economics Faculty of Economics, Thammasat University 2 Phra Chan Road Bangkok, 10200 Thailand Tel: 66-2-613-2411 Fax: 66-2-224-9428 Email: [email protected] **Alan M. Rugman (Corresponding Author) L. Leslie Waters Chair in International Business and Director, IU CIBER Kelley School of Business, Indiana University 1309 E. Tenth Street Bloomington, IN 47401-1701 U.S.A. Tel: 812-855-5415 Fax: 812-855-9006 Email: [email protected] http://www.kelley.indiana.edu/rugman 7/24/06
Transcript of Intra-Regional Sales Product Diversity and Performance in ... · Intra-regional Sales, Product...

Intra-regional Sales, Product Diversity, and
Performance in Merchandising Multinationals
By
Nessara Sukpanich*
And
Alan Rugman**
*Nessara Sukpanich Lecturer of Economics
Faculty of Economics, Thammasat University 2 Phra Chan Road
Bangkok, 10200 Thailand Tel: 66-2-613-2411 Fax: 66-2-224-9428
Email: [email protected]
**Alan M. Rugman (Corresponding Author)
L. Leslie Waters Chair in International Business and Director, IU CIBER
Kelley School of Business, Indiana University 1309 E. Tenth Street
Bloomington, IN 47401-1701 U.S.A. Tel: 812-855-5415 Fax: 812-855-9006
Email: [email protected] http://www.kelley.indiana.edu/rugman
7/24/06

1
Intra-regional Sales, Product Diversity, and Performance in
Merchandising Multinationals
Abstract
This study examines the relationships between intra-regional sales, product diversity,
and performance of 45 merchandising firms using data from 1997 - 2003. The
interaction effects between product diversity and intra-regional sales on performance
are explored, using a curvilinear relationship. The analysis integrates three main
theories, namely the resource-based view, transaction costs, and organization learning
theory. The models measuring a firm’s performance by return on assets (ROA) and
return on sales (ROS) show that at high levels of intra-regional sales, small levels of
product diversity can generate greater return to a firm but high levels of product
diversity may hurt a firm’s performance. Higher levels of intra-regional sales tend to
enhance the impact of product diversity on performance. The results are sensitive to
the choice of performance measure.
Key Words: intra-regional sales; multinationality and performance; product diversity;
merchandising

2
1. Introduction
Since Rumelt’s (1974) pioneering study, a large body of literature has examined the
relationship between a firm’s diversification strategies and its performance. According to
Hitt, Hoskisson, and Ireland (1994), both product and international diversification play
important roles in the strategic behavior of large firms (Tallman/Li 1996). The resource-
based view and the transaction costs theory have been applied to explain the benefits and
costs of product and international diversification strategy (see, for example, Grant/
Jammine/Thomas 1988, Tallman/Li 1996, Geringer/Tallman/Olsen 2000).1
In the existing literature, a number of studies explore the effect of product
diversity and/or international diversity on a firm’s performance (e.g., Rumelt 1982,
Buhner 1987, Geringer/Beamish/daCosta 1989, Tallman/Li 1996, Hitt/Hoskisson/Kim
1997, Geringer/Tallman/Olsen 2000, Lu/Beamish 2001). However, these studies neglect
at least one of the following important issues.
First, they fail to examine the relationship in a regional context. Rugman and
Verbeke (2004) find that the world’s 500 largest firms average 70% of their sales within
their home regions of the triad of North America, the European Union, and Asia. This
suggests that regional analysis needs more attention.
Second, most studies examine the relationship using a sample of firms in
manufacturing industries. Only a handful of research studies focus on firms in service
industries.
Third, most existing literature has used U.S. data sources alone (e.g., Rumelt
1974, Tallman/Li 1996, Hitt/Hoskisson/Kim 1997); or the European firms alone (e.g.,
3
Buhner 1987, Grand/Jammine/Thomas 1989); or the Japanese firms alone (e.g.,
Geringer/Tallman/Olsen 2000). Some studies have compared U.S. and European firms in
their data sources (e.g., Geringer/Beamish/daCosta 1989). However, very few studies, if
any, have incorporated firms from all regions of the triad of North America, Europe, and
Asia.
Fourth, most existing studies explore the linear relationship between a firm’s
product diversity and its performance. Yet, product diversity may generate both benefits
and costs for a firm so that the relationship between product diversity and performance
may exhibit a non-linear form (Tallman/Li 1996, Geringer/Tallman/Olsen 2000).
Finally, few studies examine the interaction effects between product diversity and
international diversity on a firm’s performance. Yet, the effect of a firm’s international
diversity on its performance may depend on a firm’s level of product diversity; similarly,
the effect of a firm’s product diversity on performance is contingent on a firm’s level of
international diversity (Tallman/Li 1996, Hitt/Hoskisson/Kim 1997, Geringer/Tallman/
Olsen 2000).
Addressing all these issues simultaneously could give a more complete (even
though not a perfect) picture of the factors affecting a firm’s performance. This study
applies to existing theories of multinational enterprises (such as the resource-based view,
the transaction cost theory, and organization learning theory) in a regional context, and
tests whether these theories can be applied to service firms, especially merchandising
firms. This study also pays attention to the effect of product diversification strategy and
intra-regional strategy (measured by a firm’s level of intra-regional sales in the triad
4
regions of North America, Europe, and Asia as a proportion of total sales) together with
their interaction effect on a firm’s performance.
Accordingly, the main purposes of this study are to (1) test whether the
relationship of a firm’s product diversity and performance is in a curvilinear form, (2)
explore the effect of a firm’s level of intra-regional sales on a firm’s performance, and (3)
examine the interaction effects between product diversity and a firm’s level of intra-
regional sales on its performance. This will determine whether the performance impact of
product diversity is exacerbated by the degree of intra-regional sales. The sample used for
the analysis here is extracted from 45 merchandising companies listed in the “Fortune
Global 500” (2002), over the years 1997 – 2003, incorporating firms from all parts of the
triad.
2. Literature Review
According to Tallman and Li (1996), the existing literature of diversification strategies is
one of the largest bodies of research in business strategy. Chandler’s work (1962), one of
the pioneering studies concerning the role of diversification, outlines the motivations for
diversification and describes the general characteristics of diversified firms (Geringer/
Beamish/daCosta 1989). He suggests that diversification strategy allows a firm to create a
multidivisional structure (M form) to ensure the efficient utilization of diverse resources
(Rumelt 1974). According to Chandler (1962), this administrative structure creates a
complex managerial environment such that diversification can no longer be viewed as a
simple increase in product count (Rumelt 1974).
5
Building on the work of Chandler, Wrigley (1970) introduces the notion of core
skills, “the collective ability of a firm to efficiently and effectively combine knowledge of
a market and technology in order to permit the firm to earn profits, survive and grow in
the markets in which it competes” (Geringer/Beamish/daCosta 1989, p. 110). He
proposes four qualitative types of diversification strategy: single product, dominant
product, related product, and unrelated product. Rumelt (1974) extends Wrigley’s
typology to nine categories, and finds that firms diversified to business related to their
“core skills” tend to exhibit superior performance. According to Tallman and Li (1996),
subsequent studies have both confirmed (e.g., Berry 1975) and contradicted (e.g.,
Michael/Shaked 1984) Rumelt’s findings.
Recent diversification studies have used a more sophisticated continuous index to
measure the degree of diversity (Tallman/Li 1996). However, Hoskisson, Hitt, Johnson
and Moesel (1993) suggest that the categorical typology and the quantitative degree of
diversity appear to be related. Tallman and Li (1996), incorporating both categorical and
quantitative measures (Herfindahl index) in the analysis, find that all diversified
categories tend to perform better than the single-business category, and that moderate
degrees of diversity often predict greater performance.
A firm’s performance can be measured by different variables. The common
measures of performance include return on equity, ROE (e.g., Rumelt 1974, Buher 1987,
Grant/Jammine/Thomas 1988, Rugman/Sukpanich 2006), return on assets, ROA (e.g.,
Buhner 1987, Geringer/ Beamish/daCosta 1989, Hitt/Hoskisson/Kim 1997,
Geringer/Tallman/Olsen 2000), and return on sales, ROS (e.g., Grant/Jammine/Thomas
1988, Geringer/Beamish/daCosta 1989, Tallman/Li 1996, Geringer/Tallman/Olsen 2000).
6
The empirical findings concerning the relationship between diversity and
performance are somewhat contradictory (Geringer/Tallman/Olsen 2000). According to
Grant, Jammine, and Thomas (1988), the relationship appears to be sensitive to choices
concerning method of analysis, profitability measure, time period, and control variables.
Geringer, Tallman, and Olsen (2000) suggest that the discrepancies across studies may
result from underlying non-linearity in the diversification. Tallman and Li (1996) find a
curvilinear relationship (inverted U-curve relationship) between product diversity and
performance
Many studies suggest that diversification strategy is not limited to product
diversification. Geographic (sometimes inappropriately called international)
diversification also plays an important role to explain a firm’s performance (Buhner
1987, Tallman/Li 1996, Hitt/Hoskisson/Kim 1997, Geringer/Tallman/Olsen 2000). Many
empirical studies use different proxies to measure degree of international diversity or
degree of multinationality. The common proxies are the percentage of foreign sales to
total sales (e.g., Rugman 1976, Geringer/Beamish/daCosta 1989, Tallman/Li 1996,
Geringer/Tallman/Olsen 2000, Ruigrok/Wagner 2003); foreign assets to total assets (e.g.,
Daniel/Bracker 1989, Collins 1990); the entropy index (Hitt/Hoskisson/Kim 1997); and
the composite index of various variables (Sullivan 1994).
The empirical results concerning the relationship between international diversity
and performance are inconclusive (Hitt/Hoskisson/Kim 1997). Some studies find a
positive relationship (e.g., Buhner 1987, Grant 1987), and some find a negative
relationship (e.g., Michael/Shaked 1986, Collins 1990). According to Ruigrok and
Wagner (2003), most recent findings indicate that the relationship between the degree of

7
multinationality and performance may exhibit a non-linear form such as inverted U-curve
or inverted J-curve form (e.g., Daniels/Bracker 1989, Gomes/Ramaswamy 1999); U-
curved or J-curved form (e.g., Lu/Beamish 2001, Ruigrok/Wagner 2003); and a
horizontal S-curve form (e.g., Sullivan 1994, Riahi-Belkaoui 1998, Contractor/Kundu/
Hsu 2003).
Although some studies examine the effects of both product and international
diversity on a firm’s performance (see, for example, Buhner 1987, Geringer/Beamish/
daCosta 1989), they do not consider the interaction effects between the two strategies.
Tallman and Li (1996) suggest that there may be interaction effects between both
measures of diversification on performance. Kim, Hwang, and Burgers (1989) show that
the effect of product diversification categories on performance depends on the degree of
multinationality. Tallman and Li (1996) test whether international diversity moderates the
performance impact of product diversity (specifically the curvilinear relationship between
product diversity and performance), but do not find significant interaction effects. Hitt,
Hoskisson, and Kim (1997), on the other hand, find that product diversification
moderates the relationship between international diversity and performance. While Hitt,
Hoskisson, and Kim (1997) treat linear product diversity effects as moderating the
curvilinear international effect, Geringer, Tallman, and Li (2000) treat linear international
effects as moderating a curvilinear product effect (similar to Tallman/Li 1996) but do not
find strong interactive diversity effects.

8
3. Theoretical Framework and Hypotheses
This study analyzes the effects of a firm’s product diversity and intra-regional sales on a
firm’s performance based on three main theories: the resource-based theory, transaction
cost theory, and organization learning theory. This section provides a theoretical
framework for the analysis and proposes three main hypotheses. The section is divided
into three main parts including the relationship between product diversity and
performance; intra-regional sales and performance; and the interaction effects of the two
strategies on a firm’s performance.
3.1. Product Diversity
The resource-based view of the firm is now an important concept in strategic
management studies (Birkinshaw 2001). This theory suggests that a firm’s unique
resources and heterogeneous capabilities can generate competitive advantages, which can
lead to sustainable superior returns (Barney 1991, Rugman/Verbeke 2002). As a firm
diversifies, it can leverage these unique resources to gain benefits from economies of
scope in addition to appropriating rents from consumers (Tallman/Li 1996). According to
Geringer, Tallman, and Olsen (2000), as long as the diversification stays within the scope
of existing rent-yielding resources and capabilities, it should provide greater rents.
However, if a firm diversifies into businesses in which existing capabilities cannot be
exploited, it will not necessary provide additional rents (Tallman/Li 1996, Geringer/
Tallman/Olsen 2000).
Nevertheless, diversification is not costless. Based on transaction cost theory,
Jones and Hills (1988) suggest that diversification beyond a certain degree can generate
9
higher internal governance costs leading to a firm’s lower performance. According to
Grant, Jammine, and Thomas (1988), increasing the level of diversification can lead to a
greater level of management control and coordination costs, inflexibility, and
inefficiencies arising from inability to adapt to environmental change. In that case, the
costs of excessive product diversity may outweigh its benefits from economies of scale
and scope, leading to lower profitability level.
According to the resource-based theory and the transaction cost theory described
above, we propose that there may exist a non-linear relationship between the degree of
product diversity and performance. That is, product diversity can generate better
performance when the strategic resources and capabilities are increasing, but may lower
performance as the product scope exceeds the range of rent-yielding resources once the
governance costs surpass management capabilities (Tallman/Li 1996). In other words,
product diversity can generate greater performance up to a certain point, after which, it
reduces performance as the costs exceed its benefits. This leads to the following
hypothesis.
Hypothesis 1: The relationship between product diversification and a firm’s
performance is nonlinear, with a positive slope at low levels of product
diversification and a negative slope at high levels of product diversification.
3.2 Intra-Regional Sales
The resource-based and the transaction costs theories can be applied to international
diversification. Geringer, Beamish, and daCosta (1989) suggest that a firm can achieve
similar benefits of product diversity through geographic expansion. According to Hitt,

10
Hoskisson, and Kim (1997), using the resource-based view of the firm, international
diversity provides greater opportunities to leverage strategic resources to new markets,
while simultaneously diversifying geographic market risk (see also Kim/Hwang/Burgers
1993). International diversity also provides greater opportunities to achieve economies of
scale; to apply core competences in international markets; and to exploit market
imperfections across countries (Hitt/Hoskisson/Kim 1997). However, transaction cost
theory suggests that international expansion is also associated with significant transaction
costs and information-processing demands (Jones/Hill 1988, Hitt/Hoskisson/Ireland
1994). Zaheer and Mosakowski (1997) propose that a firm operating abroad may
encounter the liability of foreignness, a comparative disadvantage compared to a local
firm. According to Ruigrok and Wagner (2003), these liabilities can be related to internal
costs (such as higher coordination and control costs) and external costs (such as financial
risk and changes in government regulations).
According to Hitt, Hoskisson, and Kim (1997, p. 767), “international
diversification may be defined as expansion across the borders of global regions and
countries into different geographic locations, or markets.” Here we focus on a firm’s
regional expansion (especially, in the context of the triad regions of North America,
Europe, and Asia). As a result, the theories related to benefits and costs of international
expansion need to be applied within a regional framework. That is, according to the
resource-based view, inter-regional expansion (expansion from the home-region to
another or other triad region(s)) can generate the benefits of economies of scale,
economies of scope, and the exploitation of regional differences. However, inter-regional
expansion is also associated with liabilities of inter-regional foreignness

11
(Rugman/Verbeke 2004). These liabilities may include greater internal costs from
increasing coordination and control costs, and higher external costs from financial and
political risks across regions. Using the sample of 89 firms listed in the Fortune Global
500 for year 2001 data, Sukpanich (2005) found that there exists a positive linear (rather
than a curvilinear relationship, second and third order effects) between a firms’ level of
intra-regional sales and its performance. Since the differences across regions could be
greater than those of international differences within the region, it is possible that
liabilities of inter-regional expansion are stronger than the liabilities of foreignness from
international expansion. Accordingly, the costs of inter-regional expansion might surpass
its benefits so that the firm might perform better within its home region. This leads to the
second hypothesis of the study.
Hypothesis 2: Performance should vary positively with a firm’s level of intra-
regional sales.
3.3 Interaction Effects of Product Diversity and Intra-Regional Sales
Geringer, Tallman, and Olsen (2000) state that the analyses of the effects of product and
international diversification on a firm’s performance are related to the issues of
economies of scope of strategic rent-yielding resources and of efficient transaction
governance, either across business or geographic boundaries. According to Tallman and
Li (1996), the similarities in theoretical framework of product and international
diversification suggest potential significant interaction effects on a firm’s performance.
While Tallman and Li (1996) suggest that international diversity may help in
extending the reach of strategic resources of single-business firms, Hitt, Hoskisson, and

12
Kim (1997) argue that administrators in single-business firms may lack the experience to
manage the complexity generated by geographic (international) diversification. In terms
of the relatedness of product diversification, Jones and Hill (1988) suggest that related
product diversification may require intensive interaction (and intensive management)
more than unrelated diversification. As a result, once international diversity is added to
related diversified firms, the increasing management and control costs may well suppress
the benefits of diversification compared to unrelated diversified firms. However,
according to the organization learning viewpoint, highly product diversified firm may
learn from their experience of diversification and enhance a firm’s efficient structure,
governance, and managerial capabilities, when international diversity strategy is added
(Hitt/Hoskisson/Kim 1997). In that case, geographic (international) diversification may
improve the performance effect of product diversification in highly product diversified
firms.
According to transaction cost theory, resource-based view, and organization
learning theory (given that the relationship between product diversity and performance
exhibits a non-linear form, inverted-U curve or inverted-J curve), it is expected that
greater levels of international diversity should moderate a positive performance impact of
product diversity at lower product diversity levels, and reduce the negative second-order
effects of high levels of product diversity. In other words, it is expected that international
diversity should moderate the performance impact of product diversity (Tallman/Li 1996,
Geringer/ Tallman/Olsen 2000).
This study advances on this prior work by examining the interaction effects of
product diversification and a firm’s level of intra-regional sales on a firm’s performance.
13
Applying transaction cost, resource-based, and organization learning theories suggests
that greater levels of intra-regional sales should enhance the positive relationship between
product diversity and performance at low levels of product diversity, and enhance the
negative second-order effects of product diversity on performance at high levels of
product diversity (given that there exists a curvilinear relationship, inverted-U curve or
inverted-J curve, between a firm’s product diversity level and performance). This leads to
the following hypothesis.
Hypothesis 3: Intra-regional sales should enhance the performance impact of
product diversity.
(More specifically, intra-regional sales should enhance the curvilinear
relationship, inverted-U curve or inverted-J curve, between product diversity and
a firm’s performance).
4. Data Sample and Variables
The analysis in this study is based on an unbalanced panel dataset containing 283
observations of 45 merchandising firms for the years 1997 – 2003.2 These are large
merchandising firms listed in the “Fortune Global 500” for at least one year. Out of 45
firms used in the analysis; 4 firms are Asian (3 Japanese and 1 Australian); 5 firms are
European (1 firm from each of the following countries; Germany, Netherland, Belgium,
Great Britain, and France); 36 firms are North American firms (all of them are
American).
The data for the variables used in the analysis of this study are obtained mainly
from the Standard & Poor’s COMPUSTAT North America database (the database

14
providing financial statistics and market information covering publicly traded companies
in the United States and Canada). The data on a firm’s performance and other accounting
variables are derived from the annual industrial section of the COMPUSTAT North
America database. The data on a firm’s level of intra-regional sales and product diversity
are derived from the geographic segment section and the business segment section of the
COMPUSTAT North America database. Further searching on annual reports also adds
more information concerning firms’ geographic and business segment sales to some
missing values from the COMPUSTAT database.
This study measures a firm’s performance by three proxies including return on
equity (ROE), return on assets (ROA), and return on sales (ROS).3 A firm’s level of intra-
regional sales is measured by a firm’s proportion of intra-regional sales in the triad of
North America, Europe, and Asia 4. A firm’s level of product diversity is measured by the
product diversity index (PDI), defining as )],/1ln([ ii i BSSBSSPDI ×= ∑ where BSSi is
the proportion of sales attributed to business segment i, and ln(1/BSSi) is the weight given
to each business segment.5 According to Hitt, Hoskisson, and Kim (1997), this entropy
index can capture both the number of business segments in which a firm operates and the
proportion of total sales represented by each segment.
We also control for other variables that might affect a firm’s performance. Those
variables include firm size, marketing ability, and financial leverage. According to
Tallman and Li (1996), firm size is a commonly used control variable expected to be
related to levels of product diversity. Moreover, it can be used to control for economies
and diseconomies of scale at the corporate level (Hitt/Hoskisson/Kim 1997). In this
study, firm size is measured by a firm’s log of total assets (logasset). Lu and Beamish

15
(2001) suggest that proprietary asset marketing ability may affect a firm’s performance.
In this study, the variable selling and general administrative expenses as a proportion of
total sales (selladminpsale) is used as a proxy for a firm’s marketing ability. According to
Hitt and Smart (1994), capital structure, especially debt, can also affect a firm’s
performance. Accordingly, we control for a firm’s financial leverage (FL), measured by a
firm’s total debt (debt in current liabilities plus total long term debt) as a proportion of
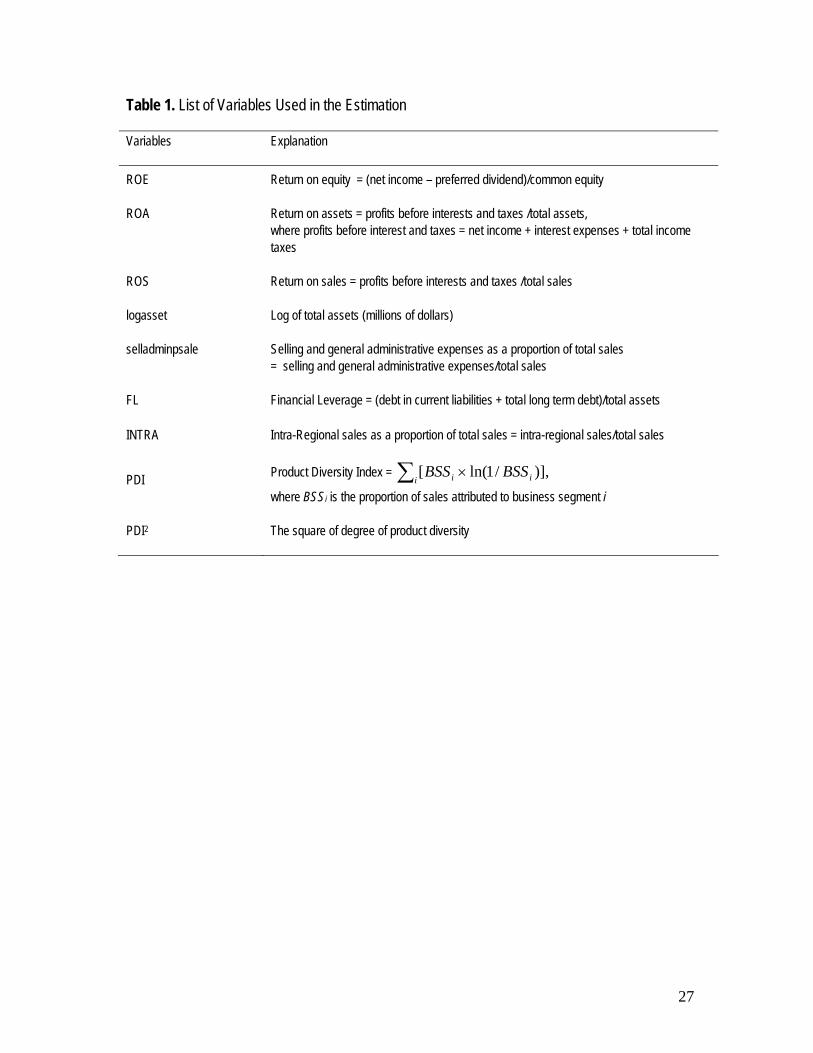
total assets, (see Table 1 for a detailed description of variables used in the analysis, and
Table 2 for the summary statistics of the variables).
Table 1 here
Table 2 here
5. Methodology and Results
Most existing diversification studies with multiple-year data tend to use the method of
averaging all variables and use Ordinary Least Squares regressions to estimate the
models. However, Geringer, Tallman, and Olsen (2000) suggest that although the method
can smooth the significant effects over years, it may change the effects if the variables are
averaged by many years. Another possibility is to use the Ordinary Least Squares (OLS)
method on pooled cross-sectional time-wise data and incorporate year dummies as the
control variables. However, pooling data may violate basic assumptions of OLS models
(Geringer/Tallman/Olsen 2000). For example, if the unobserved individual heterogeneity
(or unobserved firm effect for this study), unobserved time-constant factors affecting
dependent variables (performance for this study), is correlated with other explanatory
variables, the OLS estimators will be biased and inconsistent (Greene 2000). For this

16
study, it is possible that the unobserved firm effect (such as the ability of a firm’s
executive, the strength of the brand, and a firm’s connection with local and international
governments) may be correlated with the explanatory variable such as the size of firm.
Accordingly, this study employs the fixed effects (FE) method to estimate the effect of
product diversity and level of intra-regional sales on a firm’s performance based on the
unbalanced panel dataset of 45 merchandising firms.6
Controlling for firm size (measured by logasset), marketing ability (measured by
sellgenadminpsale), financial leverage (measured by FL), and the year dummies, Table 3
reports the results of estimation of the effects of product diversity (PDI and PDI2), intra-
regional sales (INTRA), and the interaction terms (PDI *INTRA and PDI2*INTRA) on a
firm’s performance (measured by ROE in column 1, ROA in column 2, and ROS in
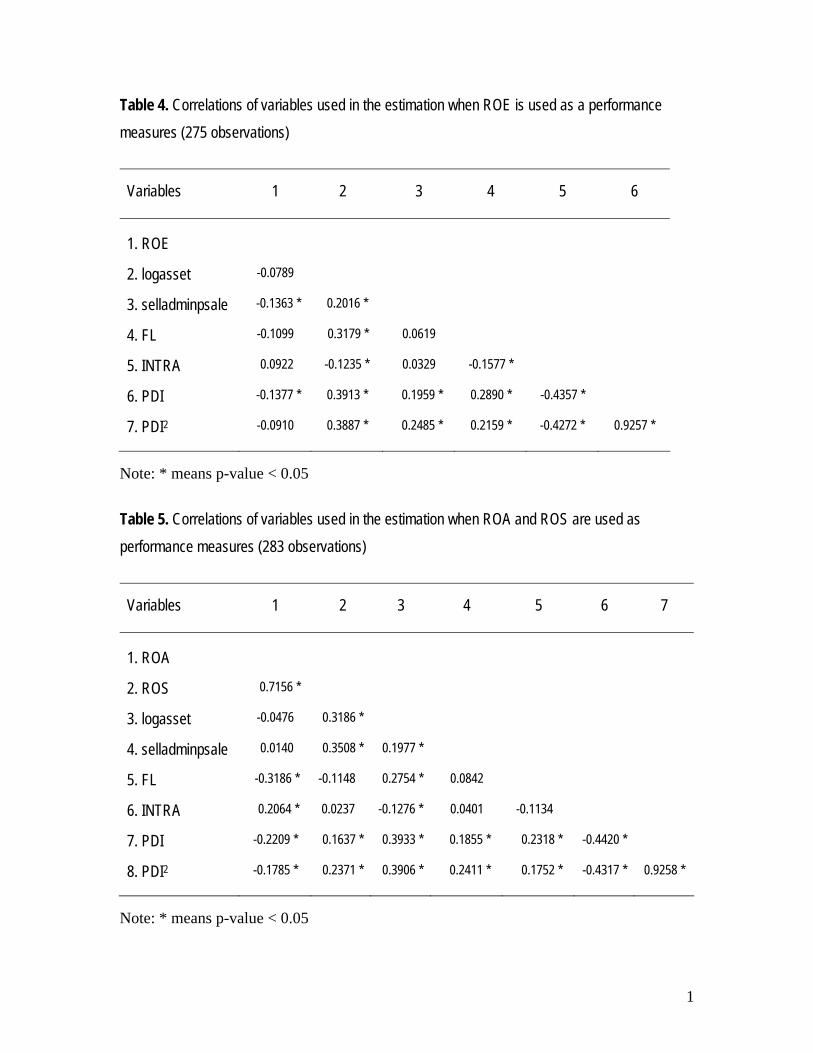
column 3).7,8 Table 4 reports the correlation values of all variables used in the estimation
when ROE is used as a performance measure (275 observations are used in the
estimation). Table 5 reports the correlation values of all variables used in the estimation
when ROA and ROS are used as performance measures (283 observations are used in the
estimation).
Table 3 here
Table 4 here
Table 5 here
The results from column 1 of Table 3 show that when ROE is used as a
performance measure, the coefficients on INTRA, PDI, PDI2, PDI *INTRA and
PDI2*INTRA are not significant at the 5% significant level. Besides, the coefficient on
the two interaction terms (PDI *INTRA and PDI2*INTRA) are jointly insignificant at the

17
5% significant level. Therefore, all three hypotheses cannot be supported when using
ROE as a performance measure.
According to Table 3, the results of the estimation of the models measuring a
firm’s performance by ROA (in column 2) and ROS (in column 3) show that the
coefficients on INTRA, PDI, PDI2, PDI *INTRA and PDI2*INTRA are all significant at
the 5% significant level with positive, negative, positive, positive, and negative values,
respectively. The coefficients on the two interaction terms (PDI *INTRA and
PDI2*INTRA) are also jointly significant at the 5% significant level. That means
PDI*INTRA and PDI2*INTRA jointly determine a firm’s level of ROA and ROS.
This study controls for the effects of firm size, financial leverage, and marketing
ability in all models (the models in column 1, column 2, and column 3 of Table 3). The
significant results of the coefficients on most control variables imply that any test that
does not control for such variables may show spurious results (in the model using ROE as
a performance measure, the coefficients on all control variables except for selladminpsale
are significant at the 5% significant level; the coefficients on all control variables except
for logasset in the model using ROA as a performance measure are significant at the 5%
significant level; the coefficients on all control variables in the model measuring a firm’s
performance by ROS are significant at the 5% significant level).
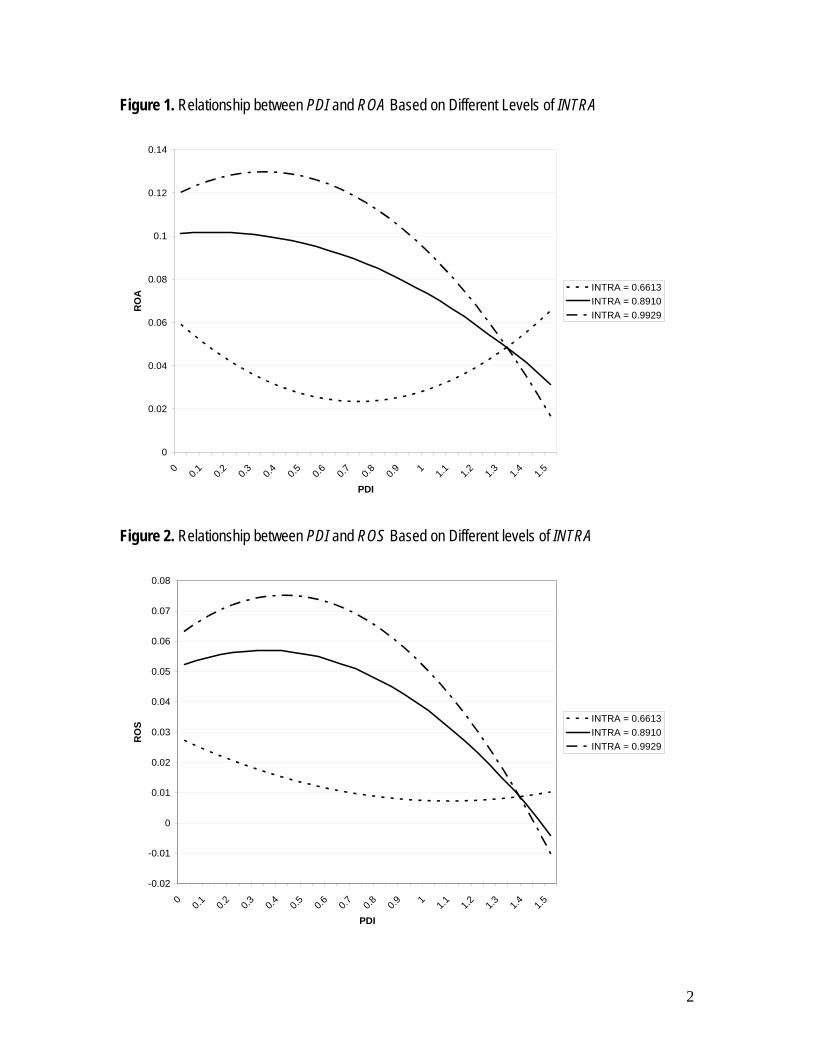
Figure 1 shows the relationship between product diversity and ROA with different
levels of a firm’s proportion of intra-regional sales (INTRA), while Figure 2 shows
similar relationship by using ROS as a performance measure. Of the total sample of 283
observations, the average value of a firm’s proportion of intra-regional sales is 0.891.
Out of the total 283 observations, there are 87 observations with the proportion of intra-

18
regional sales less than 0.891, and the average value of intra-regional sales of these firms
is 0.6613. On the other hand, there are 196 observations with the proportion of the intra-
regional sales greater than 0.891, and the average value of the intra-regional sales of these
firms is 0.9929. Accordingly, Figure 1 and Figure 2 show the relationship between
product diversity and performance (measured by ROA for Figure 1 and ROS for Figure 2)
when values of intra-regional sales (INTRA) are equal to 0.6613, 0.891, and 0.9929. The
curves are drawn based on the mean value of all variables, except for INTRA and for the
year dummies, where all the year dummies are equal to zero (see Table 2 for the
summary statistics of all variables used in the analysis). That is, the relationship shown is
drawn for the based year of 1997.
Figure 1 here
Figure 2 here
According to Figure 1 and Figure 2, at the average level of intra-regional sales
(INTRA = 0.891), the relationships between product diversity and ROA and between
product diversity and ROS are in the form of inverted-J curve, with the turning point at
PDI equals to 0.1192 for Figure 1 and 0.3292 for Figure 2 (the average level of PDI is
0.2600). At a higher level of intra-regional sales (INTRA = 0.9929), product diversity still
affects ROA and ROS in a curvilinear, inverted J-curve, form with the turning point at
PDI equals to 0.3492 for Figure 1 and 0.4095 for Figure 2. However, at a lower level of
intra-regional sales (INTRA = 0.6613), the relationships between product diversity and
ROA and between product diversity and ROS exhibit U-curve form with the turning point
at PDI equals to 0.7227 for Figure 1 and 1.0819 for Figure 2.

19
These results show that at high levels of INTRA, the relationship between a firm’s
product diversity and performance (measured by ROA and ROS) is non-linear and in the
form of an inverted-J curve; however the non-linear relationship could be in the form of
U curve at low levels of intra-regional sales. Accordingly, hypothesis 1 is only supported
when the levels of INTRA are high. That is, at high levels of intra-regional sales, product
diversity can generate greater performance (measured by ROA and ROS) up to a certain
point, after which, it reduces performance as the costs exceed its benefits. These results
support the prediction based on the resource-based view and transaction cost theory.
According to the results from column 2 of Table 3 and Figure 1, INTRA can
generate greater ROA when PDI is less than 1.3226, but lower ROA when PDI is greater
than 1.3226. The results from column 3 of Table 3 and Figure 2 show that INTRA can
increase a firm’s ROS when PDI is less than 1.3719, but lower ROS when PDI is greater
than 1.3719. Based on the unbalanced panel dataset used in the analysis, out of 283
observations, only 11 observations have PDI greater than 1.3226 and 9 observations have
PDI greater than 1.3719. Accordingly, it can be concluded that for most cases, intra-
regional sales generate greater ROA and ROS. Therefore, hypothesis 2 is supported when
ROA and ROS are used as measures of a firm’s performance.
The next step is to compare the impact of product diversity on a firm’s
performance at different levels of INTRA. First is to compare the effect when INTRA
equals to 0.891 (average level of INTRA) and when INTRA equals to 0.9929. The results
from Figure 1 and 2 show that at this higher level of intra-regional sales (INTRA =
0.9929), for low levels of product diversity, the returns on product diversity tends to
increase in a slightly greater rate than those of the average level of intra-regional sales

20
(INTRA = 0.891) curve. That means that at low levels of product diversity, greater levels
of intra-regional sales slightly enhance the positive effect of product diversity on a firm’s
ROA and ROS. On the other hand, for greater levels of product diversity, the returns on
product diversity of the curve with a higher level of intra-regional sales (INTRA =
0.9929) are decreasing at a faster rate than those of the curve with an average level of
intra-regional sales (INTRA = 0.891). This means that at higher levels of product
diversity, a greater value of intra-regional sales enhances the negative relationship
between product diversity and performance (measured by ROA and ROS). These findings
support hypothesis 3 stating that intra-regional sales should enhance the performance
impact of product diversity.
According to Figure 1 and Figure 2, we can also examine the relationship between
product diversity and performance when the proportion of intra-regional sales is equal to
0.6613 (less than the average level of intra-regional sales of 0.891). Hypothesis 3
suggests that a lower level of intra-regional sales should moderate the performance
impact of product diversity. Comparing the curve with a lower level of intra-regional
sales (INTRA = 0.6613) and the curve with an average level of intra-regional sales
(INTRA = 0.891), Figure 1 and Figure 2 show that at the very low levels of product
diversity, a lower level of intra-regional sales not only moderate the positive impact of
product diversity on ROA and ROS, but even turns the positive impact into a negative
relationship between product diversity and performance. In addition, at higher levels of
product diversity, the curve with a lower level of intra-regional sales (INTRA = 0.6613)
tends to decrease at a slower rate than those of the curve with the average level of intra-
regional sales (INTRA = 0.891). That means that at higher levels of product diversity, a

21
lower level of intra-regional sales tends to moderate the negative relationship between
product diversity and performance. Moreover, at the very high levels of product diversity
(PDI > 0.7227 for Figure 1 and PDI > 1.0819 for Figure 2), this lower level of intra-
regional sales (INTRA = 0.6613) not only moderates the negative impact of product
diversity on performance, but even turns the negative relationship into positive returns on
product diversity.
These findings support the expectation that a lower level of intra-regional sales
moderates the performance impact of product diversity. However, it is noted that at a
sufficiently low level of intra-regional sales, the lower level of intra-regional sales may
even turn the impact of product diversity on a firm’s performance from the curvilinear
inverted J-curve relationship into the U-curve relationship.
The results from Figure 1 and Figure 2 provide support for the theoretical
arguments from the transaction cost theory, resource based view, and organization
learning theory. That is, firms with lower levels of product diversity may not have
enough experience managing the complexity of diversification and inter-regional
expansion. Accordingly, intra-regional sales could be a better strategy to enhance the
positive impact of product diversity. In contrast, organization learning theory suggests
that firms with higher levels of product diversity may learn from their experience of
product diversification such that further inter-regional expansion (a lower level of intra-
regional sales) could moderate the negative impact of product diversity on a firm’s
performance. In other words, a higher level of intra-regional sales may enhance the
negative relationship between product diversity and performance. The results of Figure 1
and Figure 2 tend to support these arguments. Thus, they support hypothesis 3. However,
22
it is worth noting that these findings are based on using ROA and ROS as performance
measures, rather than ROE.
The findings in this study suggest that to enhance a firm’s performance, managers
of merchandising companies need to take into account a firm’s product diversification
strategy simultaneously with its level of intra-regional sales. Designing these two
strategies separately may result in an unexpected performance impact. The results of the
study show that higher levels of intra-regional sales enhance the impact of a firm’s
product diversification on its performance.
6. Limitations
This study has some limitations. First, the study does not report any analysis of a firm’s
structure and its managerial capability. This is a distinct limitation of studies such as this
one using secondary data. According to Bartlett and Ghoshal (1989), the method of
managing diversification is at least as important as the level of diversification itself
(Tallman and Li 1996). Accordingly, future research on the regional effect of
multinationality may try to collect data regarding a firm’s structure and its managerial
method from primary sources and incorporate these variables in the analysis.
Second, this study measures a firm’s performance by accounting financial
indicators, including return on equity (ROE), return on assets (ROA), and return on sales
(ROS). The performance measures in terms of a market value variable (such as Tobin’s q-
value and risk-adjusted returns) and operational performance (such as operating costs as a
percentage of total sales) are not incorporated in the estimation. This study does not aim
to expand on these existing performance measures. The main contribution of this study is
23
to redefine multinationality to capture the regional presence by introducing a variable for
a firm’s level of intra-regional sales. However, for robustness of the results, future studies
may test other performance measures. The new performance measures in terms of return
on foreign assets (ROFA) and return on regional assets (RORA) could be used to measure
a firm’s international and regional performance.
6. Conclusions
The main contributions of this study are: 1) to examine the relationship between
diversification strategies and performance in a regional context by introducing a variable
for a firm’s level of intra-regional sales, and 2) to test the relationship based on a sample
of firms in merchandising, one of the service industry categories, rather than a sample of
manufacturing firms used in other studies.
The results are sensitive to the choice of performance measure. Product diversity
and intra-regional sales do not significantly affect a firm’s performance when ROE is
used as a performance measure. However, when ROA and ROS are used to measure
performance, the results show that at high levels of intra-regional sales, there exists a
non-linear relationship (inverted J-curve form) between product diversity and a firm’s
performance. This supports the arguments based on the resource-based and transaction
cost theories that although small levels of product diversity may improve a firm’s
performance, excessive levels of product diversification are associated with higher
coordination and control costs that may surpass the benefits of economies of scope,
thereby lowering a firm’s performance. The results from most models (except for the one
using ROE as a performance measure) also show that performance tends to vary

24
positively with a firm’s level of intra-regional sales. That is, the liabilities of inter-
regional expansion in terms of both internal costs (such as coordination and management
costs) and external costs (such as financial and political risks across regions) are so high
that a firm performs better by keeping its sales within its home region of the triad.
Moreover, using ROA and ROS as performance measures, the results show that the effect
of product diversity strategy on a firm’s performance depends on its level of intra-
regional sales. More specifically, higher levels of intra-regional sales tend to enhance the
performance impact of product diversity.
Findings in this study suggest more complicated relationships between product
diversity, intra-regional sales, and a firm’s performance than one might expect.
Accordingly, further research on diversification should take into account the non-linear
relationship and the interaction effects of product and international diversification
strategies. Moreover, the choice of performance measure affects the empirical results.
Therefore, to improve the robustness of the results further studies should perform tests
based on various measures of performance. The finding regarding the significant impact
of intra-region sales on performance also suggests that further research on business
strategy should pay more attention to the strategic decision in a regional dimension.

25
References
Bartlett, C. and Ghoshal, S. 1989. Managing Across Boarders: The Transnational Solution. Harvard Business School Press: Boston.
Barney, J., 1991. Firm resources and sustained competitive advantages. Journal of Management. 17 (1), 99-120. Berry, C. H., 1975. Corporate Growth and Diversification. Princeton University Press: Princeton. Birkinshaw, J., 2001. Strategy and management in MNE subsidiaries, in: Rugman, A., Brewer, T. L. (Eds.), The Oxford Handbook of International Business, New York, pp. 380-401. Buhner, R., 1987. Assessing international diversification of West German corporations. Strategic Management Journal. 8 (1), 25-37. Chandler, A. D., 1962. Multinational Enterprise and Structure. MIT Press: Cambridge. Collins, J. M., 1990. A market performance comparison of U.S. firms active in domestic, developed and developing countries. Journal of International Business Studies.
21(2), 271-287. Contractor, F. J., Kundu, S. K., Hsu, C., 2003. A three-stage theory of international expansion: The link between multinationalilty and performance in the service sector. Journal of International Business Studies. 34(1), 5-18. Daniels, J. D., Bracker J., 1989. Profit performance: Do foreign operations make a Difference. Management International Review. 29(1), 46-56. Geringer, J. M., Beamish P. W., DaCosta R. C., 1989. Diversification strategy and internationalization: Implications for MNE performance. Strategic Management Journal. 10(2), 109-119. Geringer, J. M., Tallman S., Olsen D. M., 2000. Product and international diversification among Japanese multinational firms. Strategic Management Journal, 21(1), 51-80. Gomes, L., Ramaswamy K., 1999. An empirical examination of the form of the relationship between multinationality and performance. Journal of International Business Studies. 30(1), 173-187. Grant, R.M., 1987. Multinationality and performance among British manufacturing Companies. Journal of International Business Studies. 18(3), 79-89. Grant, R. M., Jammine A. P., Thomas H., 1988. Diversity, Diversification, and Profitability among British manufacturing companies, The Academy of Management Journal. 31 (4), 771-801. Greene, W. H., 2000. Econometric Analysis, (fourth ed). Prentice Hall Inc., Upper Saddle River. Hitt, M. A., Hoskisson R. E., Ireland, R.D., 1994. A mid-range theory of the interactive effects of international and product diversification on innovation and performance, Journal of Management. 20(2), 297-326. Hitt, M. A., Hoskisson, R. E., Kim, H., 1997. International Diversification: Effects on innovation and firm performance in product-diversified firms. The Academy of Management Journal. 40(4), 767-798. Hitt, M. A., Smart D., 1994. Debt: A disciplining force for managers or a debilitating force for organizations? Journal of Management Inquiry. 3, 144–152.

26
Hoskisson, R. E., Hitt M. A., Johnson R. A., Moessel D. D., 1993. Construct validity of an objective (entropy) categorical measure of diversification strategy. Strategic Management Journal. 14(3), 215-235. Jones, G. R., Hill C. W. L., 1988. Transaction cost analysis of strategy-structure choice, Strategic Management Journal 9, 159-172. Kim, W. C., Hwang P., Burgers W. P., 1989. Global diversification strategy and corporate profit performance. Strategic Management Journal. 10(1), 45-57. Lu, J. W., Beamish P. W., 2001. The international and performance of SMEs. Strategic Management Journal. 22, 565-586. Michael, A., Shaked I., 1984. Does business diversification affect performance? Financial Management. 13 (4), 18-24. Peteraf, M. E., 1993. The cornerstones of competitive advantage: A resource-based view, Strategic Management Journal. 14(3), 179-191. Riahi-Belkaoui A., 1998. The effects of the degree of internationalization on firm Performance. International Business Review. 7, 315-321. Rugman, A. M., 2005. The regional multinationals. Cambridge University Press: Cambridge. Rugman, A. M., 1979. International diversification and the multinational enterprise. D.C Health: Lexington, MA. Rugman, A. M., Sukpanich N., 2006. Firm-Specific Advantages Intra-Regional Sales and
Performance of Multinational Enterprises. The International Trade Journal 20 (3), 355-382.
Rugman, A. M., Verbeke A., 2004. A perspective on regional and global strategies of multinational enterprises. Journal of International Business Studies 35(1), 3-18. Rugman, A. M., Verbeke A., Edith Penrose’s contribution to the resource-based view of strategic management. Strategic Management Journal. 23, 769-780. Ruigrok, W., Wagner H., 2003. Internationalization and performance: An organization learning perspective. Management International Review. 43(1), 63-83. Rumelt, R. P., 1982. Diversification strategy and profitability. Strategic Management Journal. 3 359-370. Rumelt, R. P., 1974. Strategy, structure and economic performance. Harvard University Press, Boston. Sukpanich, N., 2005. Firm-Specific Advantages, Intra-Regional Sales, Product Diversity, and Performance. Ph.D. Dissertation. Indiana University. Sullivan, D., 1994. The threshold of internalization: Replication, extension, and Reinterpretation. Management International Review, 34(2), 165-186. Tallman, S., Li J., 1996. Effects of international diversity and product diversity on the performance of multinational firms. Academy of Management Journal. 39(1), 179-196. Wrigley, L., 1970. Divisional autonomy and diversification, Unpublished Doctoral Dissertation, Harvard Business School. Zaheer, S., Mosakowski E., 1997. The dynamics of the liability of foreignness: A global study of survival of financial services. Strategic Management Journal. 18(6), 439-464.
27
Table 1. List of Variables Used in the Estimation Variables Explanation ROE Return on equity = (net income – preferred dividend)/common equity ROA Return on assets = profits before interests and taxes /total assets, where profits before interest and taxes = net income + interest expenses + total income taxes ROS Return on sales = profits before interests and taxes /total sales logasset Log of total assets (millions of dollars) selladminpsale Selling and general administrative expenses as a proportion of total sales = selling and general administrative expenses/total sales FL Financial Leverage = (debt in current liabilities + total long term debt)/total assets INTRA Intra-Regional sales as a proportion of total sales = intra-regional sales/total sales
PDI Product Diversity Index = )],/1ln([ ii i BSSBSS ×∑
where BSSi is the proportion of sales attributed to business segment i PDI2 The square of degree of product diversity
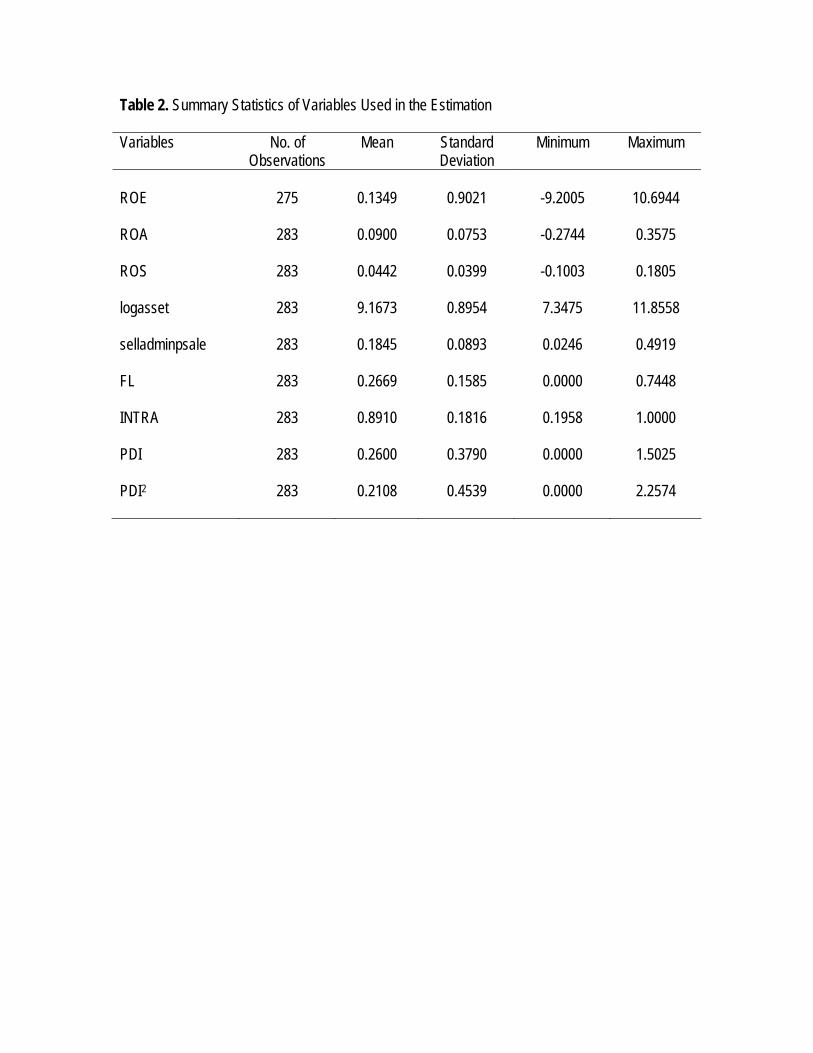
Table 2. Summary Statistics of Variables Used in the Estimation Variables No. of
Observations Mean Standard
Deviation Minimum Maximum
ROE 275 0.1349 0.9021 -9.2005 10.6944 ROA 283 0.0900 0.0753 -0.2744 0.3575 ROS 283 0.0442 0.0399 -0.1003 0.1805 logasset 283 9.1673 0.8954 7.3475 11.8558 selladminpsale 283 0.1845 0.0893 0.0246 0.4919 FL 283 0.2669 0.1585 0.0000 0.7448 INTRA 283 0.8910 0.1816 0.1958 1.0000 PDI 283 0.2600 0.3790 0.0000 1.5025 PDI2 283 0.2108 0.4539 0.0000 2.2574

Table 3. The FE Estimation of the Effect of Product Diversity, Intra-Regional Sales, and the Interaction Effect of the two Strategies on a Firm’s Performance Dependent Variable
ROE
ROA
ROS
FE FE FE Independent Variables
logasset
-0.1784 ** (-2.99)
0.0036 (0.32)
0.0153 ** (2.92)
selladminpsale
-0.7257 (-0.68)
-0.8005 ** (-3.88)
-0.4189 ** (-4.32)
FL
0.7497 * (2.44)
-0.1154 * (-2.10)
-0.0621 * (-2.41)
INTRA
0.0948 (0.22)
0.1840 * (2.07)
0.1085 ** (2.60)
PDI
-1.7419 (-1.79)
-0.4106 * (-2.09)
-0.2279 * (-2.47)
PDI2
1.2937 (1.68)
0.3739 * (2.41)
0.1944 ** (2.66)
PDI*INTRA 2.0595 (1.89)
0.4707 * (2.14)
0.2887 ** (2.80)
PDI2*INTRA
-1.6035 (-1.81)
-0.4611 * (-2.57)
-0.2681 ** (-3.19)
constant 1.6685 * (2.39)
0.0830 (0.62)
-0.0909 (-1.44)
Number of observations Joint significant test of PDI*INTRA and PDI2*INTRA F-statistic p-value
275
1.80 0.1677
283
3.50 ** 0.0317
283
5.16 ** 0.0065
Note: 1) Values in the parenthesis are t-statistic value, **means p-value < 0.01, and * means p-value < 0.05 2) Year dummies are omitted 3) For the model using ROE as a performance measure, the number of observations used in the estimation is 275 (rather than 283 observations as in the models using ROA and ROS as performance measures). This is due to the exclusion of six observations that have negative values of common equity and one observation that has a value of ROE less than – 9.
1
Table 4. Correlations of variables used in the estimation when ROE is used as a performance measures (275 observations)
Variables
1
2
3
4
5
6
1. ROE 2. logasset -0.0789 3. selladminpsale -0.1363 * 0.2016 * 4. FL -0.1099 0.3179 * 0.0619 5. INTRA 0.0922 -0.1235 * 0.0329 -0.1577 * 6. PDI -0.1377 * 0.3913 * 0.1959 * 0.2890 * -0.4357 * 7. PDI2 -0.0910 0.3887 * 0.2485 * 0.2159 * -0.4272 * 0.9257 *
Note: * means p-value < 0.05 Table 5. Correlations of variables used in the estimation when ROA and ROS are used as performance measures (283 observations)
Variables
1
2
3
4
5
6
7
1. ROA 2. ROS 0.7156 * 3. logasset -0.0476 0.3186 * 4. selladminpsale 0.0140 0.3508 * 0.1977 * 5. FL -0.3186 * -0.1148 0.2754 * 0.0842 6. INTRA 0.2064 * 0.0237 -0.1276 * 0.0401 -0.1134 7. PDI -0.2209 * 0.1637 * 0.3933 * 0.1855 * 0.2318 * -0.4420 * 8. PDI2 -0.1785 * 0.2371 * 0.3906 * 0.2411 * 0.1752 * -0.4317 * 0.9258 *
Note: * means p-value < 0.05
2
Figure 1. Relationship between PDI and ROA Based on Different Levels of INTRA
0
0.02
0.04
0.06
0.08
0.1
0.12
0.14
0 0.1 0.2 0.3 0.4 0.5 0.6 0.7 0.8 0.9 1 1.1 1.2 1.3 1.4 1.5
PDI
RO
A INTRA = 0.6613INTRA = 0.8910INTRA = 0.9929
Figure 2. Relationship between PDI and ROS Based on Different levels of INTRA
-0.02
-0.01
0
0.01
0.02
0.03
0.04
0.05
0.06
0.07
0.08
0 0.1 0.2 0.3 0.4 0.5 0.6 0.7 0.8 0.9 1 1.1 1.2 1.3 1.4 1.5
PDI
RO
S INTRA = 0.6613INTRA = 0.8910INTRA = 0.9929
3
Endnotes 1 In the recent management strategy literature, the term “international diversification” is mistakenly used as a measure of internationalization, usually shown by the degree of foreign to total sales and assets. International diversification should be used as a risk measure, as in Rugman (1979). However, in this study, we shall reluctantly use “international diversification” as misused in the literature of international management. 2 The samples used in this study are extracted from 77 merchandising firms listed in the “Fortune Global 500” (2002), the Fortune annual ranking of the world’s largest corporations in 2001. Rugman (2005) defines firms in the merchandising industry category as firms listed in one of the following seven Fortune’s industry categories: food and drug stores; general merchandisers; special retailers; trading; wholesalers in electronics and office equipment; wholesalers in food and grocery; and wholesalers in health care. 3 ROA and ROS are used as performance measures to follow the existing literature studying the interaction effects between product diversity and degree of multinationality on a firm’s performance (especially the study of Tallman/Li 1996, Hitt/Hoskisson/Kim 1997, Geringer/Tallman/Olsen 2000). 4 The geographic segment section of the COMPUSTAT North America database provides data on a firm’s geographic segment sales, a firm’s sales in each geographic region. However, different firms have different ways of defining geographic boundaries, such as in terms of country segment, regional segment (each regional segment could be defined differently), or both. Accordingly, this study reassigns the sales reported in each geographic segment into a firm’s sales in the broad triad regions of North America, Europe, and Asia. Then, a firm’s proportion of intra-regional sales is calculated based on its region of origin. 5 The business segment section of the COMPUSTAT North America database provides data on business segment sales, which can be used to calculate the degree of product diversity. The sales data in each business segment are reported with the North American Industry Classification System (NAICS) codes. However, it is possible that different segments could be associated with the same NAICS code. Accordingly, this study combines segments with the same four digit NAICS code into one segment. 6 Indeed fixed effects (FE) or random effects (RE) estimation can be used to analyze panel data. According to Greene (2000), the choice of FE and RE depends on whether each of the explanatory variables is correlated with the unobserved firm effect. If the unobserved firm effects are uncorrelated with all explanatory variables, then it is more appropriate to use the random effects method. In contrast, if the unobserved firm effects are correlated with some explanatory variables (the possible case in this study), then the fixed effects method is needed since it is consistent, whereas the random effects method will be generally inconsistent.
4
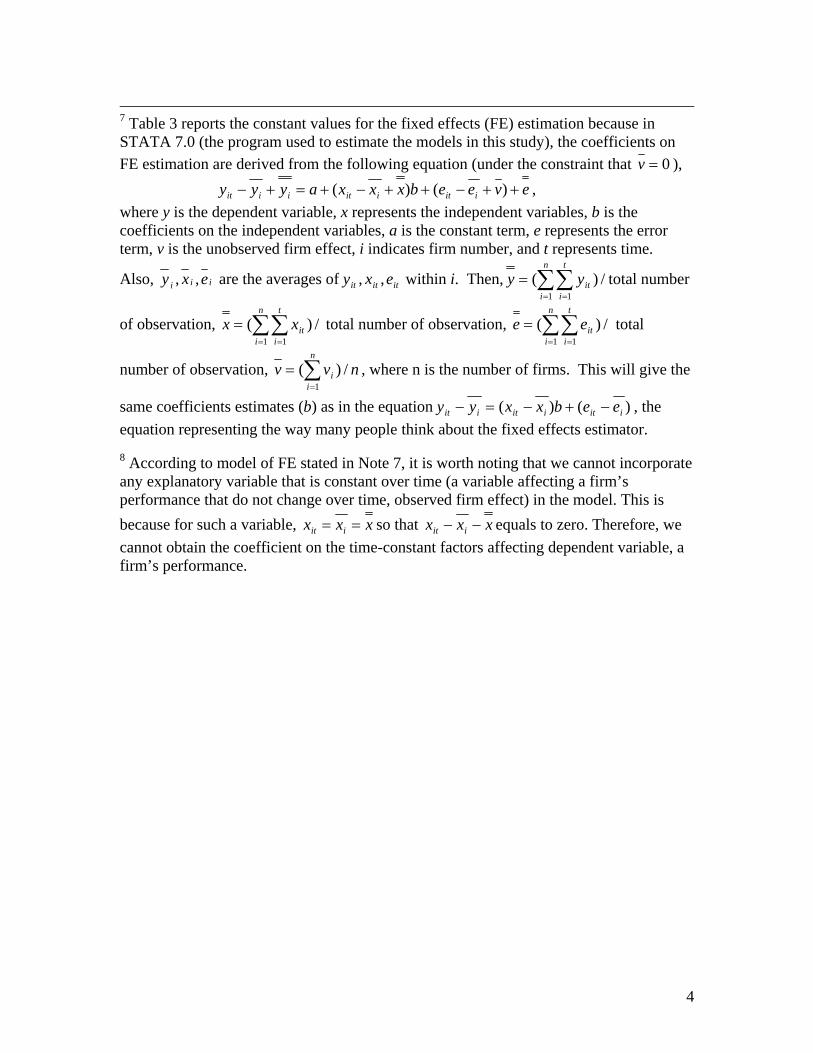
7 Table 3 reports the constant values for the fixed effects (FE) estimation because in STATA 7.0 (the program used to estimate the models in this study), the coefficients on FE estimation are derived from the following equation (under the constraint that 0=v ), eveebxxxayyy iitiitiiit ++−++−+=+− )()( , where y is the dependent variable, x represents the independent variables, b is the coefficients on the independent variables, a is the constant term, e represents the error term, v is the unobserved firm effect, i indicates firm number, and t represents time.
Also, iii exy ,, are the averages of ititit exy ,, within i. Then, /)(1 1∑∑= =
=n
i
t
iityy total number
of observation, /)(1 1∑∑= =
=n
i
t
iitxx total number of observation, /)(
1 1∑∑= =
=n
i
t
iitee total
number of observation, nvvn
ii /)(
1∑=
= , where n is the number of firms. This will give the
same coefficients estimates (b) as in the equation )()( iitiitiit eebxxyy −+−=− , the equation representing the way many people think about the fixed effects estimator. 8 According to model of FE stated in Note 7, it is worth noting that we cannot incorporate any explanatory variable that is constant over time (a variable affecting a firm’s performance that do not change over time, observed firm effect) in the model. This is because for such a variable, xxx iit == so that xxx iit −− equals to zero. Therefore, we cannot obtain the coefficient on the time-constant factors affecting dependent variable, a firm’s performance.