Subtracting Fractions Get ready to become an expert at subtracting fractions & mixed numbers!

1

2
Sustainable Profitable Growth through Innovation
Severin Schwan | Chief Executive OfficerRoche Group

3
This presentation contains certain forward-looking statements. These forward-looking statements may be identified by words such as ‘believes’, ‘expects’, ‘anticipates’, ‘projects’, ‘intends’, ‘should’, ‘seeks’, ‘estimates’, ‘future’ or similar expressions or by discussion of, among other things, strategy, goals, plans or intentions. Various factors may cause actual results to differ materially in the future from those reflected in forward-looking statements contained in this presentation, among others:
1 pricing and product initiatives of competitors;2 legislative and regulatory developments and economic conditions;3 delay or inability in obtaining regulatory approvals or bringing products to market; 4 fluctuations in currency exchange rates and general financial market conditions; 5 uncertainties in the discovery, development or marketing of new products or new uses of existing products,
including without limitation negative results of clinical trials or research projects, unexpected side-effects of pipeline or marketed products;
6 increased government pricing pressures; 7 interruptions in production 8 loss of or inability to obtain adequate protection for intellectual property rights; 9 litigation;10 loss of key executives or other employees; and11 adverse publicity and news coverage.
Any statements regarding earnings per share growth is not a profit forecast and should not be interpreted to mean that Roche’s earnings or earnings per share for this year or any subsequent period will necessarily match or exceed the historical published earnings or earnings per share of Roche.
For marketed products discussed in this presentation, please see full prescribing information on our website –www.roche.com
All mentioned trademarks are legally protected
4
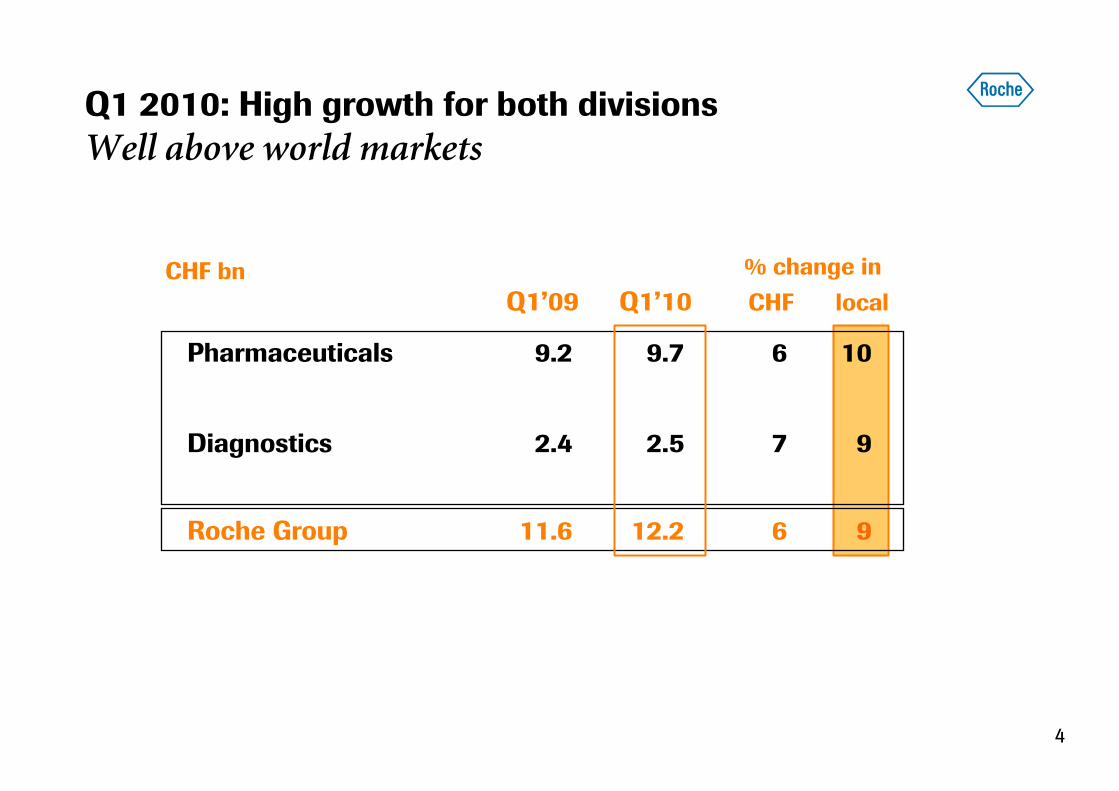
Pharmaceuticals 9.2 9.7 6 10
Diagnostics 2.4 2.5 7 9
Roche Group 11.6 12.2 6 9
CHF bn
Q1’09 Q1’10 CHF local
% change in
Q1 2010: High growth for both divisions
Well above world markets

5
Q1 2010: More than CHF 1 bn organic growth
Negative currency impact mainly from the USD
1'059
203
668
856
-391
1 avg full year 2009 to avg YTD Mar 10 fx local absolute values at avg 2009 fx
+10 % +9 % +9 % +6 %
PharmaDivision
DiagnosticsDivision
Group Fx1 GroupCHF
CHF m

6
Financial impact
2010: ~CHF 200 m (Medicaid and hospitals rebates)
2011+ : 2010 + Excise tax
2013+ : offset impact by volume
Impact of US healthcare reform
Extending coverage to an additional 32 million* Americans
Biosimilars
• 12 years data exclusivity
• 2 routes for biosimilar approval:
- Proof of similarity- Proof of inter-changeability
Both requiring clinical trials (still to be specified by FDA)
No change in guidance
* By 2019; Congressional Budget Office estimate

7
Our long term view

8
RocheSales
Vitamin synthesise.g. Vitamin C
Benzodiazepinese.g. Valium
Monoclonal antibodiese.g. MabThera, Avastin
Anti-bacterialse.g. Rocephin
19901896 1930 1960 20091980 2000
PCR
Medical breakthroughs have always driven our business

9
Why the model still works

10
Pre-1950s 1950/60’s 1970/80’s 1990/00’s
Cells/Organisms
Today
DNA Structure Genetic Code Human Genome
Disease Mechanisms
# Plausible Targets
1000’s
10’s
100
Pathways
Basic Biological Mechanisms
Observational Biology
Why we believe in innovation
Only now we begin to understand causes of disease
Dramatic increase in novel plausible biological targets

11
Roche: Focused on medically differentiated therapies
Generics
Differentiation
Focus
MedTech
OTC
Value
DiaPharma

12
What makes Roche unique
13
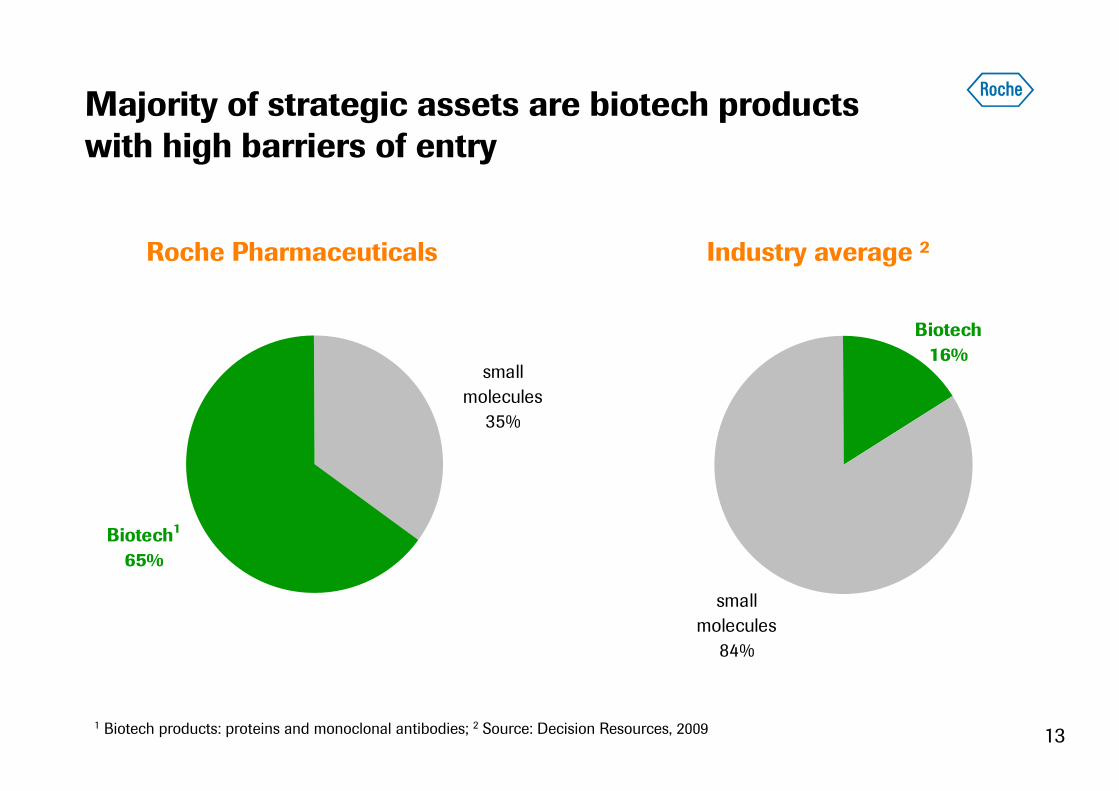
Majority of strategic assets are biotech products with high barriers of entry
Roche Pharmaceuticals Industry average 2
Biotech
16%
small
molecules
84%
Biotech1
65%
small
molecules
35%
1 Biotech products: proteins and monoclonal antibodies; 2 Source: Decision Resources, 2009

14
Limited patent exposure provides window of opportunity
% Sales Lost calculated by subtracting given year sales (‘10, ’11, ‘12, ‘13) from full year sales from year prior to LOE.Data excludes sales lost impact of products with LOE prior to 2010.Source: Evaluate Pharma
40%
35%
30%
25%
0%
20%
10%
15%
5%
% of US Sales Lost to Generics / Biosimilars
Genente
ch / Roche
Pfizer / Wyeth
GlaxoSm
ithKline
Sanofi-Aventis
Novartis
AstraZeneca
Johnson &
Johnson
Eli Lilly
Merck
/ Schering Plough
2010 2011 2012 2013

15
2007 2008 2009 2010E
Late-stage pipeline continues to build up
Expanding into new therapeutic areas
Number of NMEs
2
4
10Metabolic
Oncology
Inflammation
ocrelizumab
dalcetrapib
pertuzumab
dalcetrapib
taspoglutide
Actemra
ocrelizumab
aleglitazar
dalcetrapib
taspoglutide
aleglitazar
SGLT2 inh*
CNS
taspoglutide
ocrelizumab
GlyT-1 inh
ocrelizumab MS*
pertuzumab
T-DM1
Hedgehog inh
BRAF inhibitor
RG7159 (CLL)
GlyT-1 inh
pertuzumab
BRAF inhibitor
T-DM1
Hedgehog inh
RG7159 (CLL, NHL)
up to 13
lebrikizumab *
HCV pol inh *
Virology
* LIP or phase III decision pending

16
Unique diversity of approaches
Autonomous centers
GenentechR&ED*
Diversity Scale, Reach, Speed
“Federation” of >150 partners
* R&ED = Research & Early Development
RocheR&ED* Research
Early Dev.
Worldwideexecution
Roche Dx
Chugai
Global Product Development
Manufacturing
Commercialisation

17
Personalised Healthcare at the center of our business
Diagnostics input - from discovery to market
Unrestricted know-how and IP exchange
Faster adoptionof medicines
Research Commercialisation
Clinically validated IVD assay
Development
Technically validated IVD assay
Research assay
Rx
Dx

18
How much money to invest in R&D?

19
Majority of R&D investment goes into product development
Split of R&D costs for Pharma (Roche and Genentech)CHF 8.0 billion in 2009*
research & preclinical
phase I, II and III
phase IV
More than 70 % of our R&D investments go into product development
* Excluding Chugai and one-off impairments of intangible assets
20
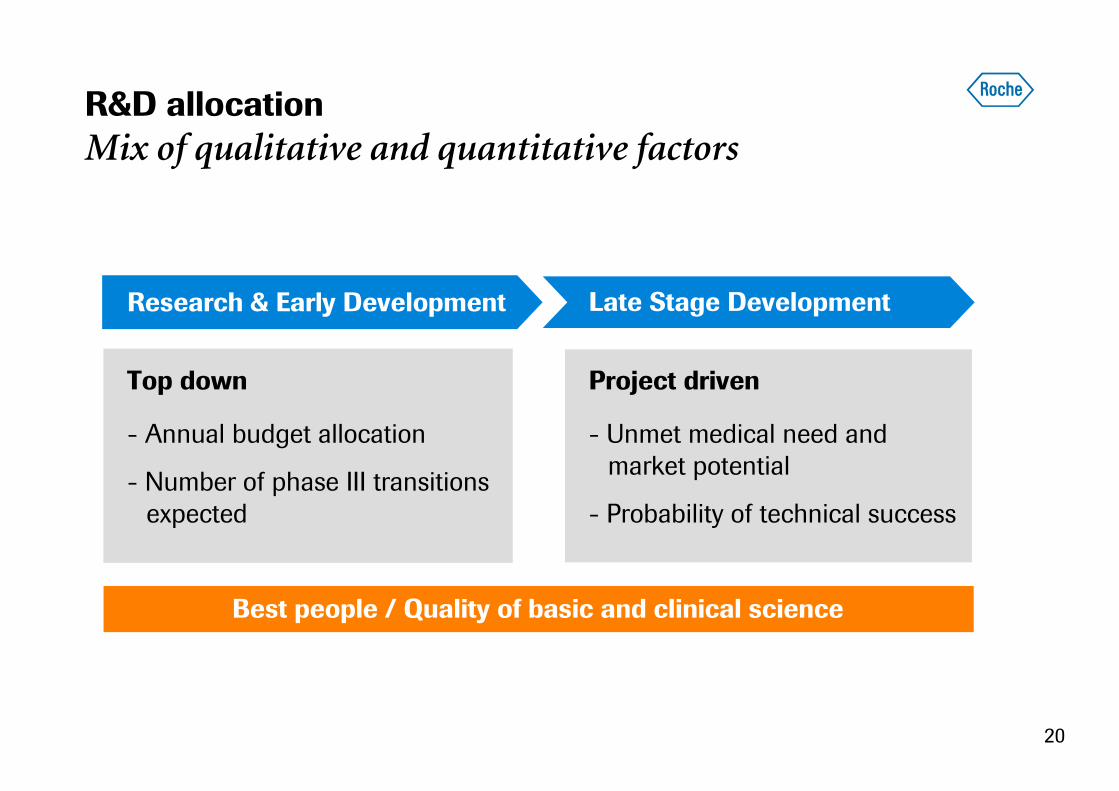
R&D allocation
Mix of qualitative and quantitative factors
Best people / Quality of basic and clinical science
Research & Early Development Late Stage Development
Top down Project driven
- Annual budget allocation
- Number of phase III transitionsexpected
- Unmet medical need and market potential
- Probability of technical success

21
R&D investment in a rich pipeline
Securing long-term growth while prioritising resources
7.4
8.48.8
9.9
0
2
4
6
8
10
12
2006 2007 2008 2009 2010
+12%+5%
CHF (bn)
+14%2010: Slightly below 2009 level
• Peak in ramp up of trials in Oncology and Metabolism (Avastin, CETPi, GLP-1)
• Q4: Substantial streamlining of development portfolio
• Lower life cycle investment for Oncology and Inflammation partly offset by CNS and Metabolism
• New phase III initiations in indications requiring smaller studies
• Transfer/ closure of Palo Alto

22
Strong late-stage portfolio of NMEs
Limited risk due to rigorous proof of concept studies
Probability of technical success
Peak sales
CHF 2 bn
0% 50% 100%
aleglitazarocrelizumab MS*
GlyT-1 inhGA101
pertuzumabtaspoglutide
T-DM1
BRAF inh (Melanoma)Hedgehog inh (BCC)
CHF 5 bn
dalcetrapib
T-DM1 (early launch)
* Phase III “go/no go” decision pending

23
Roche: Uniquely positioned to deliver long-term growth
Combination of biotech portfolio and strong pipeline
NMEs
Existing portfolio
Roche Pharmaceuticalssales
• Long patent protection of existing portfolio
• 35 line extensionscould be filed by end 2014
• Defendable base post patent expiries (biotech)
• Stronglate-stagepipeline
2009 2020
Illustrative
24
Our 5 years ambitions (by the end of 2014)
Business results
• Pharma: deliver top quartile sales growth within peer group
• Diagnostics: deliver sales growth above market
• Achieve a leading market rank in China
Pharmaceuticals Pipeline
• Achieve at least 20 LIP* transitions
• Launch at least 6 new products (NMEs)
* LIP=Lifecycle Investment Point, i.e. transition to late-stage development

25
0utlook for 2010
Barring unforeseen events;Total Tamiflu sales of CHF 1.2 bn assumed for 2010; LC=Local Currency* Continuous increase in dividend pay-out ratio over the period 2008-2010
Sales growth (in LC) Group & Pharma (excl. Tamiflu): mid single-digitDiagnostics: significantly above market
Core EPS growth (in LC) Double-digit
Synergies 2010: CHF 800 m2011: CHF 1,000 m
Debt 2010: 25% reduction of debt initially raised2015: Aim to return to net cash position
3 yr Dividend outlook Maintained (as announced in 2008)*
R&D investment Slightly below 2009 level

26