INDONESIA HOTEL WATCH 2017 - Hotel News … · INDONESIA HOTEL WATCH 2017. INDONESIA HOTEL WATCH...
20
HVS Singapore | 137 Market Street, #04-02 Grace Global Raffles, Singapore 048943 HVS.com INDONESIA HOTEL WATCH 2017
Transcript of INDONESIA HOTEL WATCH 2017 - Hotel News … · INDONESIA HOTEL WATCH 2017. INDONESIA HOTEL WATCH...
HVS Singapore | 137 Market Street, #04-02 Grace Global Raffles, Singapore 048943HVS.com
INDONESIAHOTEL WATCH 2017
INDONESIA HOTEL WATCH 2017| PAGE 1
Foreword
HVS Singapore is pleased to publish the fifth edition of the Indonesia HotelWatch (IHW) 2017. This publication provides an insight into the top ten hotelmarkets in Indonesia, the world's largest archipelago.
Growth in the global economy is likely to be uneven and imbalanced over thenext few years, as the world continues to struggle to meet its sustainabledevelopment goals. Geopolitical risks as well as policy and regulatorydecisions will largely determine economic outcomes and the global operatingenvironment. Economists expect emerging-market regions to continueoutperforming developed-world markets. However, the overall outlook issomewhat subdued, as growth drivers rebalance short-term growth and long-term sustainability.
Through this IHW 2017 publication, we present detailed research andunbiased opinions to encourage data-driven fundamental analysis to take leadin the decision-making process. We have analysed the overall hospitalitylandscape in Indonesia, highlighting the demand and supply dynamics andfuture growth potential. Given the strong growing domestic middle class, HVShas decided to provide greater insight on its growth in Indonesia.
2017 started on a sluggish note but is expected to improve following a strong5% GDP growth in 2Q2017. Of the ten markets we track, five markets havepositive RevPAR change from 2015 to 2016. In addition, three markets areforecasted to have positive RevPAR growth for 3-year CAGR.
Special thanks to our Singapore and India teams for their efforts in thepreparation of this publication.
I trust you will find this report informative and do contact us if you require anyclarifications.
We welcome your comments.
Thank you
Yours sincerely,
Chee Hok YeanManaging Partner - Asia PacificHVS

INDONESIA HOTEL WATCH 2016| PAGE 3INDONESIA HOTEL WATCH 2016| PAGE 2
INDONESIA HOTEL WATCH 2017| PAGE 3
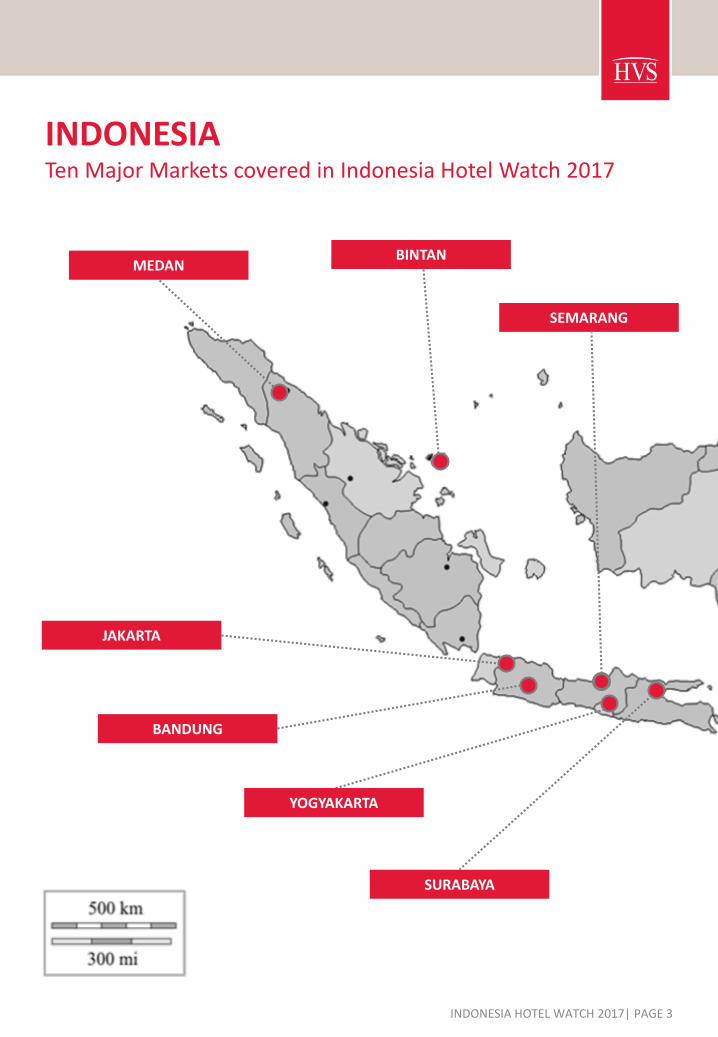
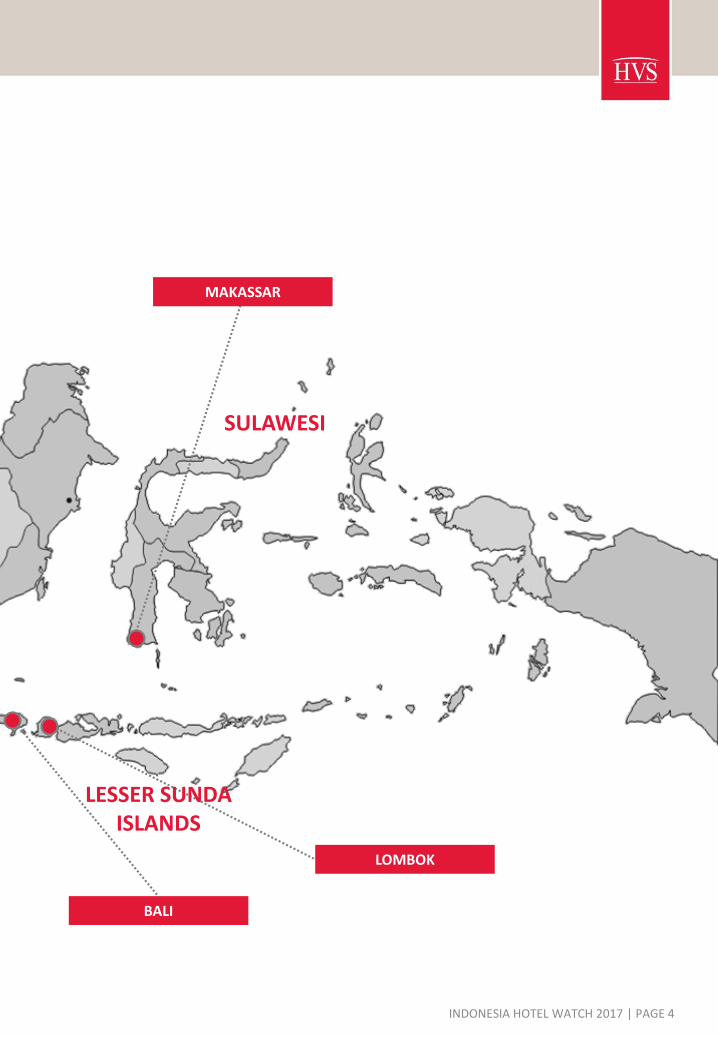
INDONESIATen Major Markets covered in Indonesia Hotel Watch 2017
MEDANBINTAN
SEMARANG
JAKARTA
BANDUNG
SURABAYA
YOGYAKARTA
INDONESIA HOTEL WATCH 2017 | PAGE 4
MAKASSAR
BALI
LOMBOK
SULAWESI
LESSER SUNDA ISLANDS
INDONESIA HOTEL WATCH 2017| PAGE 5
MACRO-OVERVIEW – INDONESIA
Economic Performance
Inflation & Currency Exchange
Indonesia is one of the fastest growing economies in Southeast Asia with a population of around 255 millioninhabitants in 2015. While 2016 has been an uncertain year on a global level with the United States (US)presidential election leading to a slowdown in trade and economic deceleration in China, Indonesia’seconomy picked up as the local government initiated major infrastructure projects and inaugurated policiesto ease restrictions on foreign investment.
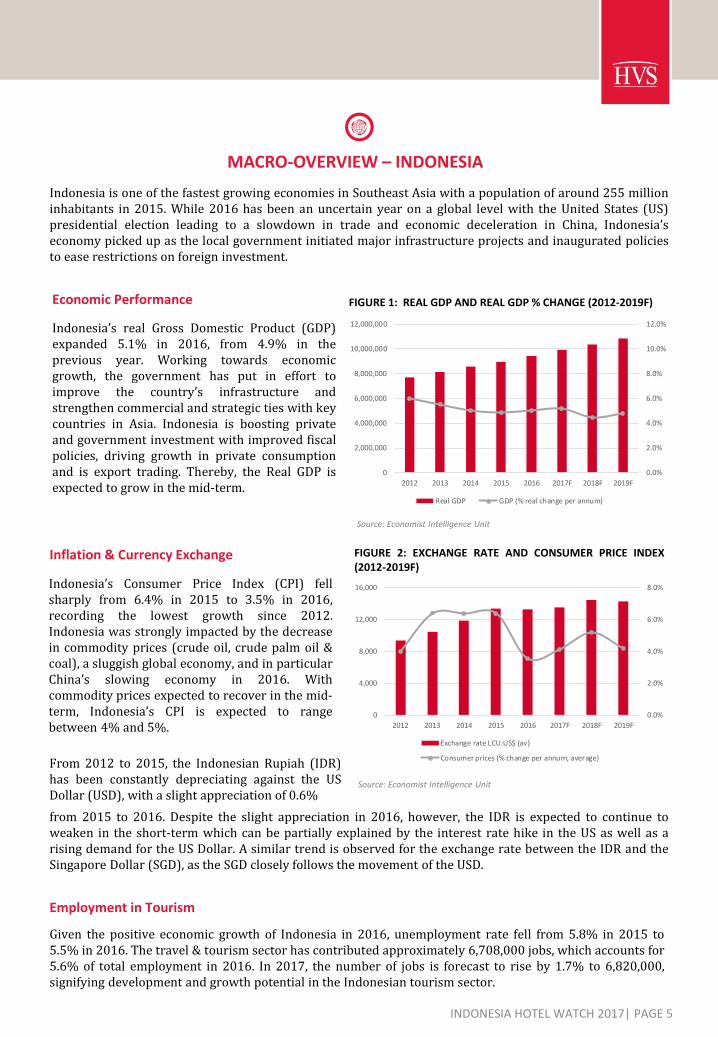
Indonesia’s real Gross Domestic Product (GDP)expanded 5.1% in 2016, from 4.9% in theprevious year. Working towards economicgrowth, the government has put in effort toimprove the country’s infrastructure andstrengthen commercial and strategic ties with keycountries in Asia. Indonesia is boosting privateand government investment with improved fiscalpolicies, driving growth in private consumptionand is export trading. Thereby, the Real GDP isexpected to grow in the mid-term.
FIGURE 1: REAL GDP AND REAL GDP % CHANGE (2012-2019F)
Source: Economist Intelligence Unit
Indonesia’s Consumer Price Index (CPI) fellsharply from 6.4% in 2015 to 3.5% in 2016,recording the lowest growth since 2012.Indonesia was strongly impacted by the decreasein commodity prices (crude oil, crude palm oil &coal), a sluggish global economy, and in particularChina’s slowing economy in 2016. Withcommodity prices expected to recover in the mid-term, Indonesia’s CPI is expected to rangebetween 4% and 5%.
FIGURE 2: EXCHANGE RATE AND CONSUMER PRICE INDEX(2012-2019F)
from 2015 to 2016. Despite the slight appreciation in 2016, however, the IDR is expected to continue toweaken in the short-term which can be partially explained by the interest rate hike in the US as well as arising demand for the US Dollar. A similar trend is observed for the exchange rate between the IDR and theSingapore Dollar (SGD), as the SGD closely follows the movement of the USD.
Employment in Tourism
Given the positive economic growth of Indonesia in 2016, unemployment rate fell from 5.8% in 2015 to5.5% in 2016. The travel & tourism sector has contributed approximately 6,708,000 jobs, which accounts for5.6% of total employment in 2016. In 2017, the number of jobs is forecast to rise by 1.7% to 6,820,000,signifying development and growth potential in the Indonesian tourism sector.
Source: Economist Intelligence Unit
0.0%
2.0%
4.0%
6.0%
8.0%
10.0%
12.0%
0
2,000,000
4,000,000
6,000,000
8,000,000
10,000,000
12,000,000
2012 2013 2014 2015 2016 2017F 2018F 2019F
Real GDP GDP (% real change per annum)
0.0%
2.0%
4.0%
6.0%
8.0%
0
4,000
8,000
12,000
16,000
2012 2013 2014 2015 2016 2017F 2018F 2019F
Exchange rate LCU:US$ (av)
Consumer prices (% change per annum; average)From 2012 to 2015, the Indonesian Rupiah (IDR)has been constantly depreciating against the USDollar (USD), with a slight appreciation of 0.6%
INDONESIA HOTEL WATCH 2017| PAGE 6
MACRO-OVERVIEW – INDONESIA
Future Geo-Political Relations
Infrastructure
According to the World Economic Forum (WEF)’s Global Competitiveness Report 2015-2016, Indonesia ranks62nd out of 140 economies for infrastructure development. As both infrastructure development andmacroeconomic growth go hand-in-hand, Indonesia’s economic development has been limited as the countrystruggles to cope with absorbing larger flows of goods and people that travel across the country. The Indonesiangovernment has recognised the need to improve quality and quantity of both ‘hard’ and ‘soft’ infrastructure. Thus,a larger infrastructure development budget has been allocated in 2017 at approximately IDR388 trillion ascompared to IDR317 trillion in 2016, of which IDR184 trillion will be funded by regional governments andIDR154 trillion will be spent from the central government fund.
Indonesia
Singapore
Australia Chile
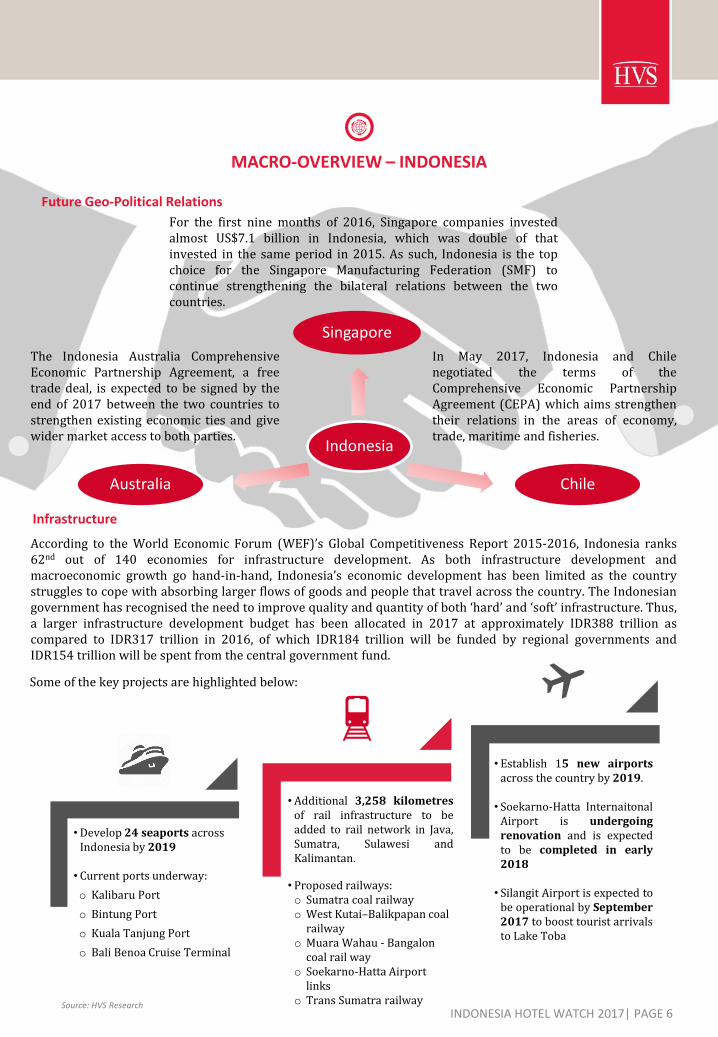
The Indonesia Australia ComprehensiveEconomic Partnership Agreement, a freetrade deal, is expected to be signed by theend of 2017 between the two countries tostrengthen existing economic ties and givewider market access to both parties.
In May 2017, Indonesia and Chilenegotiated the terms of theComprehensive Economic PartnershipAgreement (CEPA) which aims strengthentheir relations in the areas of economy,trade, maritime and fisheries.
For the first nine months of 2016, Singapore companies investedalmost US$7.1 billion in Indonesia, which was double of thatinvested in the same period in 2015. As such, Indonesia is the topchoice for the Singapore Manufacturing Federation (SMF) tocontinue strengthening the bilateral relations between the twocountries.
Some of the key projects are highlighted below:
Railway & Road
Seaport
•Develop 24 seaports across Indonesia by 2019
• Current ports underway:
o Kalibaru Port
o Bintung Port
o Kuala Tanjung Port
o Bali Benoa Cruise Terminal
•Additional 3,258 kilometresof rail infrastructure to beadded to rail network in Java,Sumatra, Sulawesi andKalimantan.
• Proposed railways: o Sumatra coal railwayo West Kutai–Balikpapan coal
railwayo Muara Wahau - Bangalon
coal rail wayo Soekarno-Hatta Airport
linkso Trans Sumatra railway
• Establish 15 new airportsacross the country by 2019.
• Soekarno-Hatta InternaitonalAirport is undergoingrenovation and is expectedto be completed in early2018
• Silangit Airport is expected tobe operational by September2017 to boost tourist arrivalsto Lake Toba
Source: HVS Research
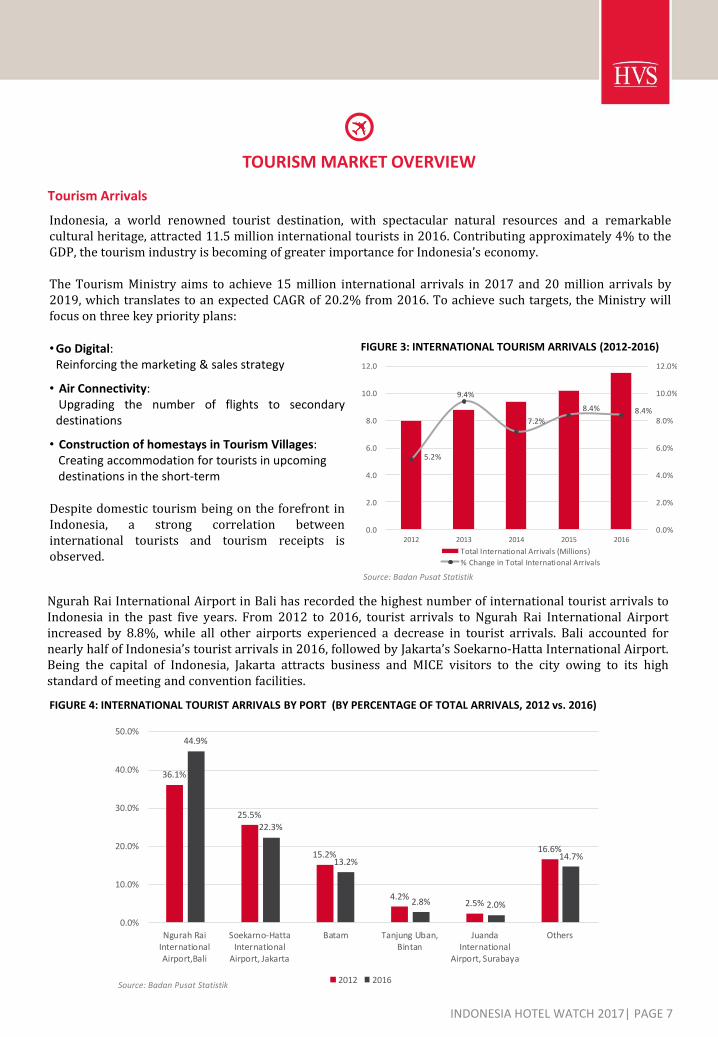
36.1%
25.5%
15.2%
4.2%2.5%
16.6%
44.9%
22.3%
13.2%
2.8% 2.0%
14.7%
0.0%
10.0%
20.0%
30.0%
40.0%
50.0%
Ngurah RaiInternationalAirport,Bali
Soekarno-HattaInternational
Airport, Jakarta
Batam Tanjung Uban,Bintan
JuandaInternational
Airport, Surabaya
Others
2012 2016
INDONESIA HOTEL WATCH 2017| PAGE 7
TOURISM MARKET OVERVIEW
Tourism Arrivals
Indonesia, a world renowned tourist destination, with spectacular natural resources and a remarkablecultural heritage, attracted 11.5 million international tourists in 2016. Contributing approximately 4% to theGDP, the tourism industry is becoming of greater importance for Indonesia’s economy.
The Tourism Ministry aims to achieve 15 million international arrivals in 2017 and 20 million arrivals by2019, which translates to an expected CAGR of 20.2% from 2016. To achieve such targets, the Ministry willfocus on three key priority plans:
FIGURE 3: INTERNATIONAL TOURISM ARRIVALS (2012-2016)
Ngurah Rai International Airport in Bali has recorded the highest number of international tourist arrivals toIndonesia in the past five years. From 2012 to 2016, tourist arrivals to Ngurah Rai International Airportincreased by 8.8%, while all other airports experienced a decrease in tourist arrivals. Bali accounted fornearly half of Indonesia’s tourist arrivals in 2016, followed by Jakarta’s Soekarno-Hatta International Airport.Being the capital of Indonesia, Jakarta attracts business and MICE visitors to the city owing to its highstandard of meeting and convention facilities.
FIGURE 4: INTERNATIONAL TOURIST ARRIVALS BY PORT (BY PERCENTAGE OF TOTAL ARRIVALS, 2012 vs. 2016)
Source: Badan Pusat Statistik
•Go Digital:Reinforcing the marketing & sales strategy
• Air Connectivity:Upgrading the number of flights to secondarydestinations
• Construction of homestays in Tourism Villages:Creating accommodation for tourists in upcomingdestinations in the short-term
Despite domestic tourism being on the forefront inIndonesia, a strong correlation betweeninternational tourists and tourism receipts isobserved.
Source: Badan Pusat Statistik
5.2%
9.4%
7.2%
8.4% 8.4%
0.0%
2.0%
4.0%
6.0%
8.0%
10.0%
12.0%
0.0
2.0
4.0
6.0
8.0
10.0
12.0
2012 2013 2014 2015 2016
Total International Arrivals (Millions)
% Change in Total International Arrivals
INDONESIA HOTEL WATCH 2017| PAGE 8
Foreign and Domestic Tourism
As of 2016, demand growth across all provinces outpaced supply growth in both the mid and long-term.Classified hotel rooms are predominantly in DKI Jakarta, Bali, West Java, and Kepuluan Riau, while non-classified hotel rooms dominate the market in West Nusa Tengarra, South Sulawesi, North Sumatera, Centraland East Java as well as DI Yogyakarta. In the mid as well as long term, however, classified hotel room supplyincreased at a faster pace than non-classified hotels rooms.
With the exception of foreign guests in classified hotels in Bali, domestic guests form a very large portion ofhotel market demand in most of the provinces. With the rise of the local middle class in Indonesia, domesticguests are expected to outnumber foreign guests in the immediate future.
HOTEL DEMAND AND SUPPLY ANALYSIS INDONESIA – BY PROVINCE
Source Markets
While the top five international source markets forIndonesia have remained unchanged in the past fiveyears, China was the only country among the topfive improving its share.
In 2016, China outpaced Singapore, becoming thenumber one source market for Indonesia. With aCAGR of 21%, China increased its share by 4.5%from 2012 to 2016, accounting for the largestnumber of foreign tourist arrivals to Indonesia.
Over the five-year period, Bangladesh, accountingfor 0.3% of foreign arrivals, recorded the highestCAGR of 59.7%, followed by Sri Lanka with a CAGRof 28.9% at a share of 0.2%.
Russia’s share decreased by a CAGR of 2.9% toreach only 0.8% of total foreign arrivals in 2016.
FIGURE 5: TOP 5 INTERNATIONAL SOURCE MARKETS(PERCENTAGE SHARE, 2012 vs. 2016)
Source: Badan Pusat Statistik
16.5%15.8%
11.8%
9.0%
5.8%
13.2% 13.4%
11.3%
13.5%
4.7%
0.0%
2.0%
4.0%
6.0%
8.0%
10.0%
12.0%
14.0%
16.0%
18.0%
Singapore Malaysia Australia China Japan
2012 2016
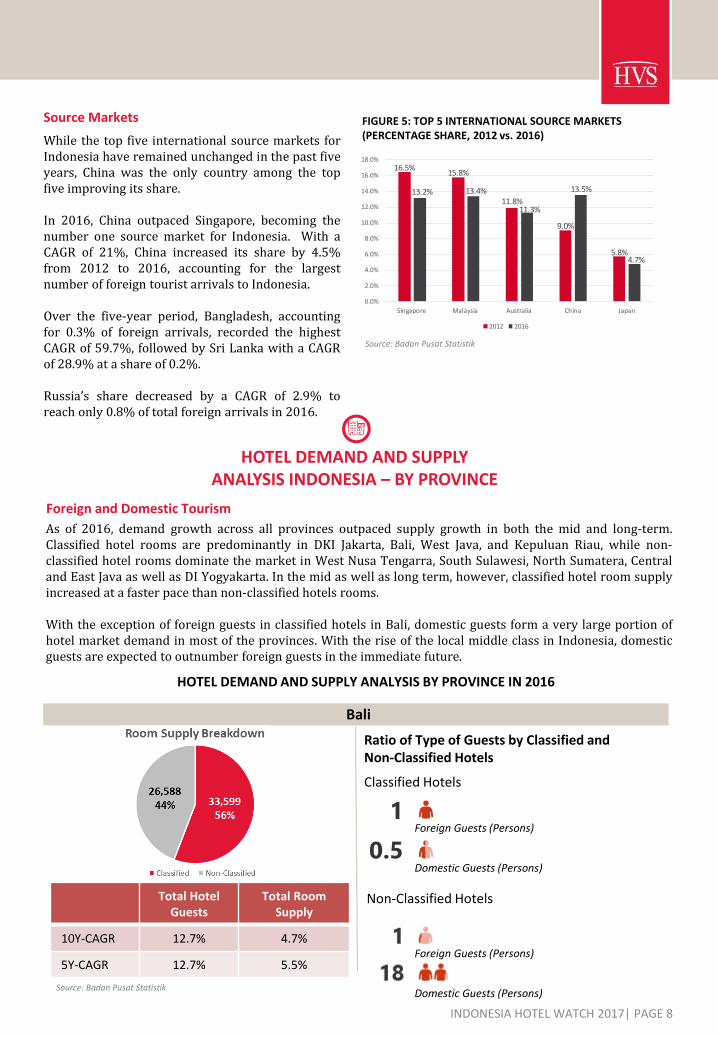
HOTEL DEMAND AND SUPPLY ANALYSIS BY PROVINCE IN 2016
Bali
Total Hotel Guests
Total Room Supply
10Y-CAGR 12.7% 4.7%
5Y-CAGR 12.7% 5.5%
Source: Badan Pusat Statistik
Foreign Guests (Persons)
Domestic Guests (Persons)
Foreign Guests (Persons)
Domestic Guests (Persons)
Ratio of Type of Guests by Classified and Non-Classified Hotels
Classified Hotels
Non-Classified Hotels
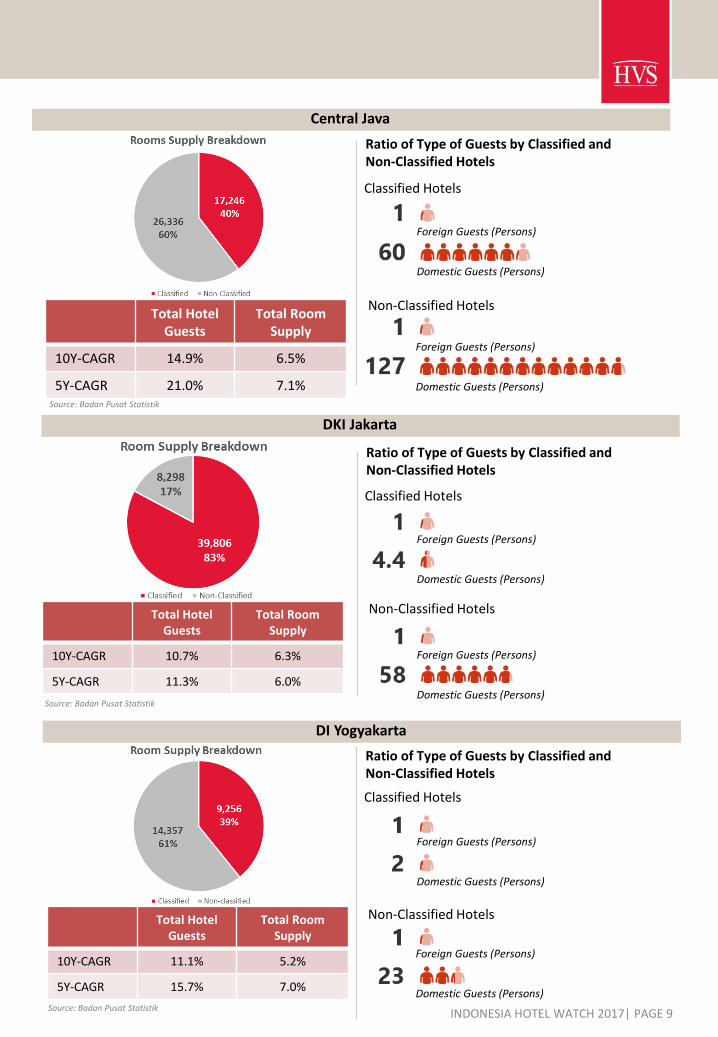
INDONESIA HOTEL WATCH 2017| PAGE 9
Total Hotel Guests
Total Room Supply
10Y-CAGR 10.7% 6.3%
5Y-CAGR 11.3% 6.0%
Source: Badan Pusat Statistik
Source: Badan Pusat Statistik
Source: Badan Pusat Statistik
Central Java
DKI Jakarta
DI Yogyakarta
Total Hotel Guests
Total Room Supply
10Y-CAGR 11.1% 5.2%
5Y-CAGR 15.7% 7.0%
Ratio of Type of Guests by Classified and Non-Classified Hotels
Classified Hotels
Non-Classified Hotels
Ratio of Type of Guests by Classified and Non-Classified Hotels
Classified Hotels
Non-Classified Hotels
Foreign Guests (Persons)
Domestic Guests (Persons)
Foreign Guests (Persons)
Domestic Guests (Persons)
Foreign Guests (Persons)
Domestic Guests (Persons)
Ratio of Type of Guests by Classified and Non-Classified Hotels
Classified Hotels
Non-Classified Hotels
Foreign Guests (Persons)
Domestic Guests (Persons)
Foreign Guests (Persons)
Domestic Guests (Persons)
Foreign Guests (Persons)
Domestic Guests (Persons)
Total Hotel Guests
Total Room Supply
10Y-CAGR 14.9% 6.5%
5Y-CAGR 21.0% 7.1%
INDONESIA HOTEL WATCH 2017| PAGE 10
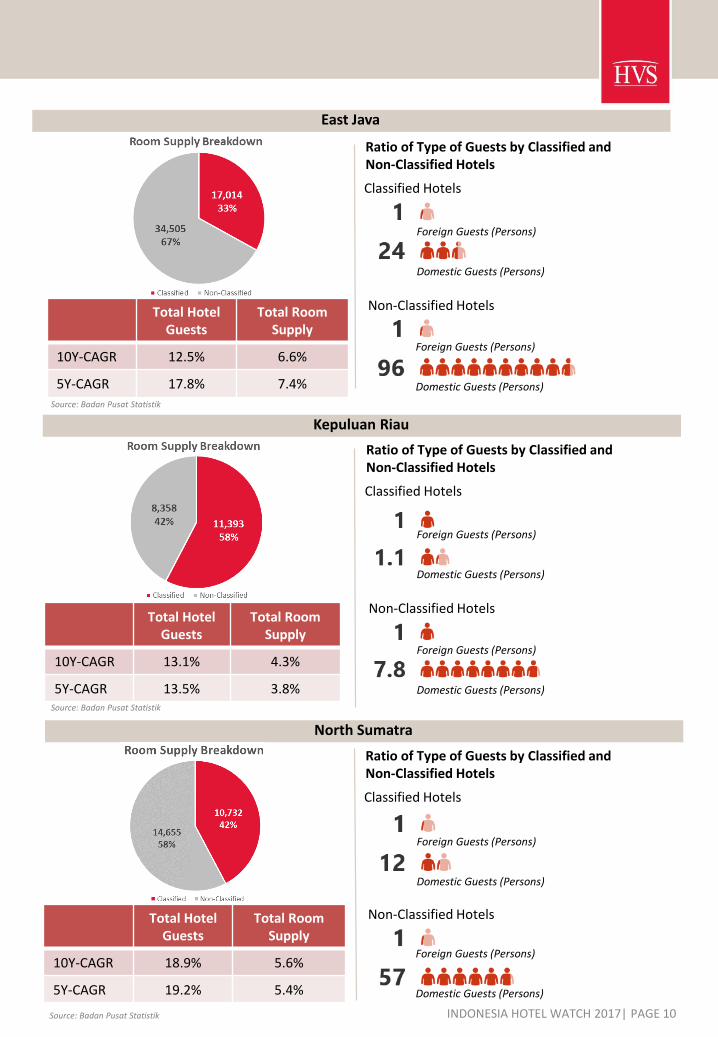
Total Hotel Guests
Total Room Supply
10Y-CAGR 18.9% 5.6%
5Y-CAGR 19.2% 5.4%
Source: Badan Pusat Statistik
Total Hotel Guests
Total Room Supply
10Y-CAGR 12.5% 6.6%
5Y-CAGR 17.8% 7.4%
Total Hotel Guests
Total Room Supply
10Y-CAGR 13.1% 4.3%
5Y-CAGR 13.5% 3.8%
Source: Badan Pusat Statistik
East Java
Source: Badan Pusat Statistik
Kepuluan Riau
North Sumatra
Ratio of Type of Guests by Classified and Non-Classified Hotels
Classified Hotels
Non-Classified Hotels
Ratio of Type of Guests by Classified and Non-Classified Hotels
Classified Hotels
Non-Classified Hotels
Ratio of Type of Guests by Classified and Non-Classified Hotels
Classified Hotels
Non-Classified Hotels
Foreign Guests (Persons)
Domestic Guests (Persons)
Foreign Guests (Persons)
Domestic Guests (Persons)
Foreign Guests (Persons)
Domestic Guests (Persons)
Foreign Guests (Persons)
Domestic Guests (Persons)
Foreign Guests (Persons)
Domestic Guests (Persons)
Foreign Guests (Persons)
Domestic Guests (Persons)
INDONESIA HOTEL WATCH 2017| PAGE 11
Source: Badan Pusat Statistik
Ratio of Type of Guests by Classified and Non-Classified Hotels
Classified Hotels
Non-Classified Hotels
Source: Badan Pusat Statistik
Source: Badan Pusat Statistik
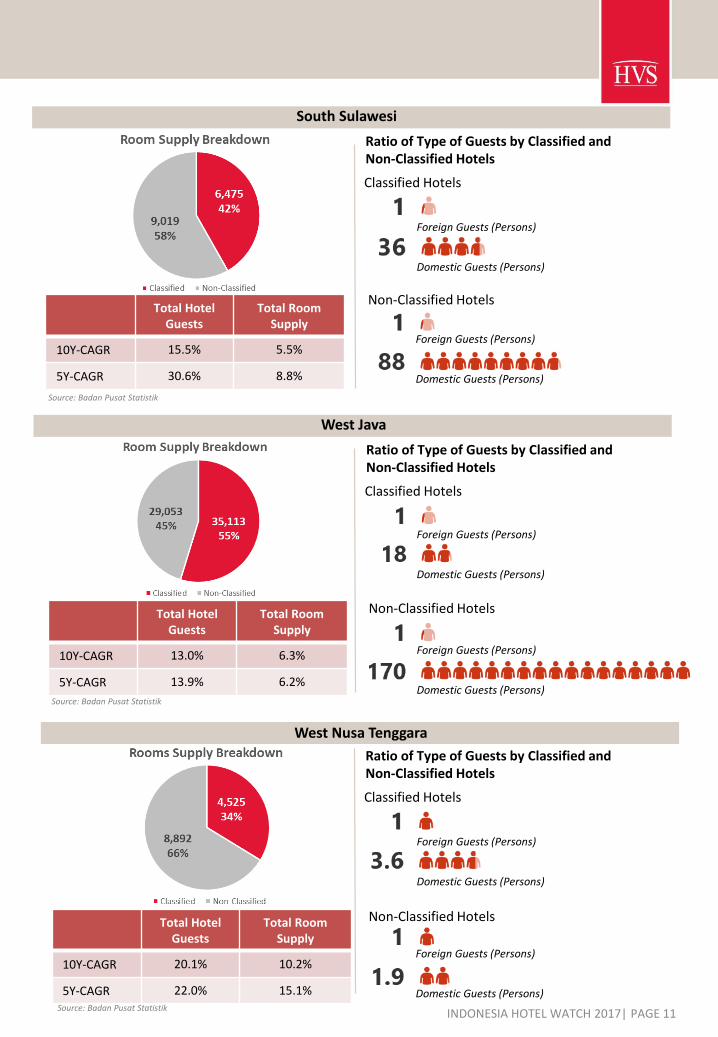
South Sulawesi
West Java
West Nusa Tenggara
Total Hotel Guests
Total Room Supply
10Y-CAGR 15.5% 5.5%
5Y-CAGR 30.6% 8.8%
Total Hotel Guests
Total Room Supply
10Y-CAGR 13.0% 6.3%
5Y-CAGR 13.9% 6.2%
Total Hotel Guests
Total Room Supply
10Y-CAGR 20.1% 10.2%
5Y-CAGR 22.0% 15.1%
Foreign Guests (Persons)
Domestic Guests (Persons)
Foreign Guests (Persons)
Domestic Guests (Persons)
Ratio of Type of Guests by Classified and Non-Classified Hotels
Classified Hotels
Non-Classified Hotels
Ratio of Type of Guests by Classified and Non-Classified Hotels
Classified Hotels
Non-Classified Hotels
Foreign Guests (Persons)
Domestic Guests (Persons)
Foreign Guests (Persons)
Domestic Guests (Persons)
Foreign Guests (Persons)
Domestic Guests (Persons)
Foreign Guests (Persons)
Domestic Guests (Persons)
INDONESIA HOTEL WATCH 2017| PAGE 12
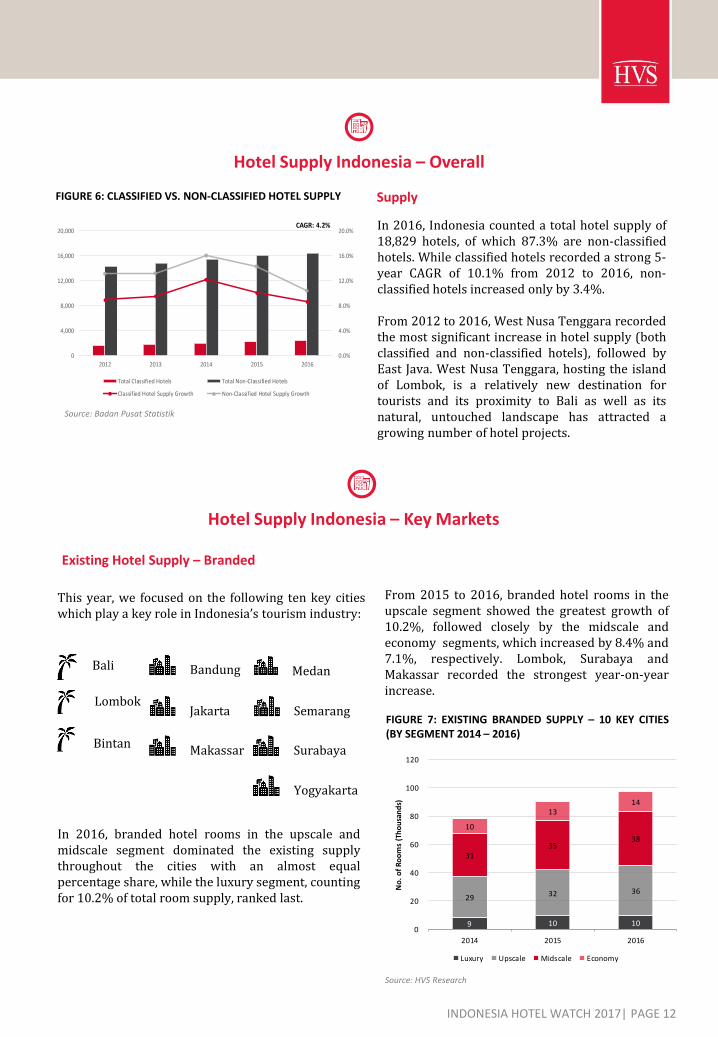
Hotel Supply Indonesia – Overall
Supply
In 2016, Indonesia counted a total hotel supply of18,829 hotels, of which 87.3% are non-classifiedhotels. While classified hotels recorded a strong 5-year CAGR of 10.1% from 2012 to 2016, non-classified hotels increased only by 3.4%.
From 2012 to 2016, West Nusa Tenggara recordedthe most significant increase in hotel supply (bothclassified and non-classified hotels), followed byEast Java. West Nusa Tenggara, hosting the islandof Lombok, is a relatively new destination fortourists and its proximity to Bali as well as itsnatural, untouched landscape has attracted agrowing number of hotel projects.
Hotel Supply Indonesia – Key Markets
FIGURE 6: CLASSIFIED VS. NON-CLASSIFIED HOTEL SUPPLY
Source: Badan Pusat Statistik
0.0%
4.0%
8.0%
12.0%
16.0%
20.0%
0
4,000
8,000
12,000
16,000
20,000
2012 2013 2014 2015 2016
Total Classified Hotels Total Non-Classified Hotels
Classified Hotel Supply Growth Non-Classified Hotel Supply Growth
CAGR: 4.2%
Existing Hotel Supply – Branded
This year, we focused on the following ten key citieswhich play a key role in Indonesia’s tourism industry:
In 2016, branded hotel rooms in the upscale andmidscale segment dominated the existing supplythroughout the cities with an almost equalpercentage share, while the luxury segment, countingfor 10.2% of total room supply, ranked last.
Bali
Bintan
Lombok
Bandung
Jakarta
Makassar
Medan
Semarang
Surabaya
Yogyakarta
FIGURE 7: EXISTING BRANDED SUPPLY – 10 KEY CITIES(BY SEGMENT 2014 – 2016)
Source: HVS Research
9 10 10
29 32 36
31 35
38
10
13 14
0
20
40
60
80
100
120
2014 2015 2016
No
. o
f R
oo
ms
(Th
ou
san
ds)
Luxury Upscale Midscale Economy
From 2015 to 2016, branded hotel rooms in theupscale segment showed the greatest growth of10.2%, followed closely by the midscale andeconomy segments, which increased by 8.4% and7.1%, respectively. Lombok, Surabaya andMakassar recorded the strongest year-on-yearincrease.
INDONESIA HOTEL WATCH 2017| PAGE 13
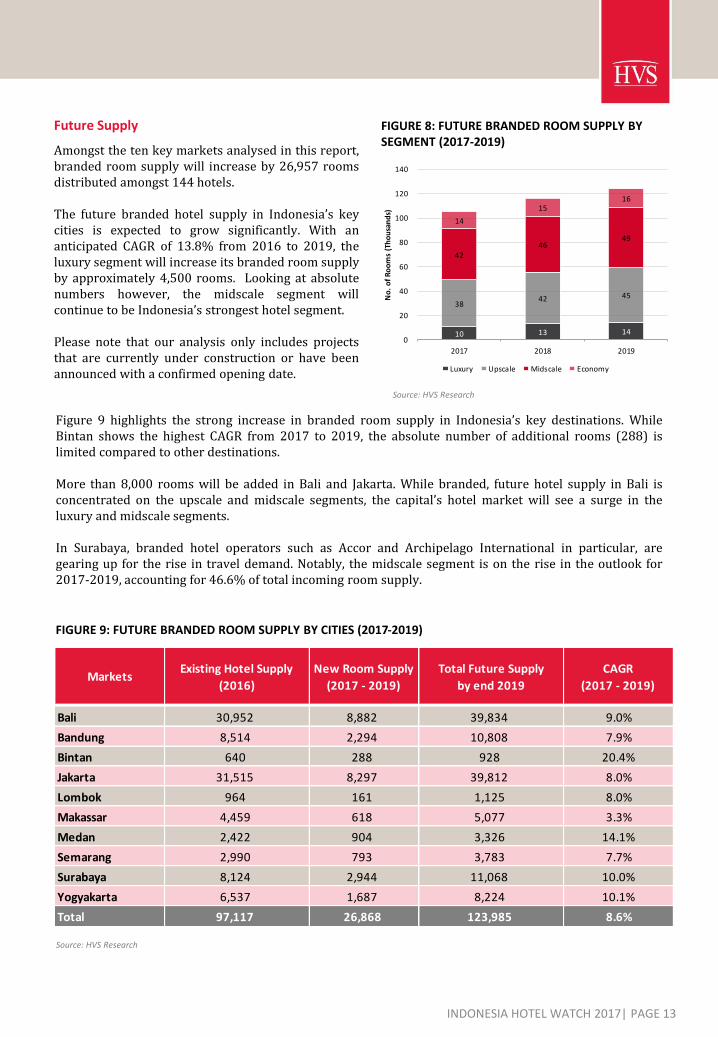
Future Supply
Amongst the ten key markets analysed in this report,branded room supply will increase by 26,957 roomsdistributed amongst 144 hotels.
The future branded hotel supply in Indonesia’s keycities is expected to grow significantly. With ananticipated CAGR of 13.8% from 2016 to 2019, theluxury segment will increase its branded room supplyby approximately 4,500 rooms. Looking at absolutenumbers however, the midscale segment willcontinue to be Indonesia’s strongest hotel segment.
Please note that our analysis only includes projectsthat are currently under construction or have beenannounced with a confirmed opening date.
FIGURE 8: FUTURE BRANDED ROOM SUPPLY BY SEGMENT (2017-2019)
Source: HVS Research
FIGURE 9: FUTURE BRANDED ROOM SUPPLY BY CITIES (2017-2019)
Source: HVS Research
Figure 9 highlights the strong increase in branded room supply in Indonesia’s key destinations. WhileBintan shows the highest CAGR from 2017 to 2019, the absolute number of additional rooms (288) islimited compared to other destinations.
More than 8,000 rooms will be added in Bali and Jakarta. While branded, future hotel supply in Bali isconcentrated on the upscale and midscale segments, the capital’s hotel market will see a surge in theluxury and midscale segments.
In Surabaya, branded hotel operators such as Accor and Archipelago International in particular, aregearing up for the rise in travel demand. Notably, the midscale segment is on the rise in the outlook for2017-2019, accounting for 46.6% of total incoming room supply.
14
1516
42 46
49
38 42 45
10 13 14 0
20
40
60
80
100
120
140
2017 2018 2019
No
. o
f R
oo
ms
(Th
ou
san
ds)
Luxury Upscale Midscale Economy
MarketsExisting Hotel Supply
(2016)
New Room Supply
(2017 - 2019)
Total Future Supply
by end 2019
CAGR
(2017 - 2019)
Bali 30,952 8,882 39,834 9.0%
Bandung 8,514 2,294 10,808 7.9%
Bintan 640 288 928 20.4%
Jakarta 31,515 8,297 39,812 8.0%
Lombok 964 161 1,125 8.0%
Makassar 4,459 618 5,077 3.3%
Medan 2,422 904 3,326 14.1%
Semarang 2,990 793 3,783 7.7%
Surabaya 8,124 2,944 11,068 10.0%
Yogyakarta 6,537 1,687 8,224 10.1%
Total 97,117 26,868 123,985 8.6%
Projects expected to support tourism growth
INDONESIA HOTEL WATCH 2017| PAGE 14
Spotlight Performance – Key Markets
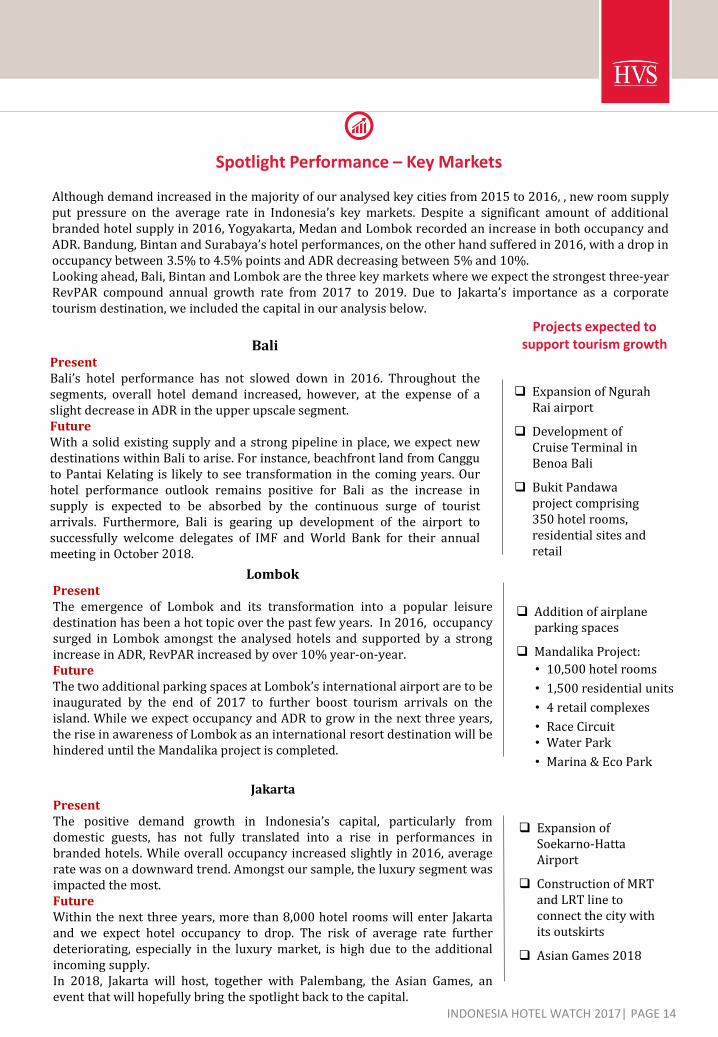
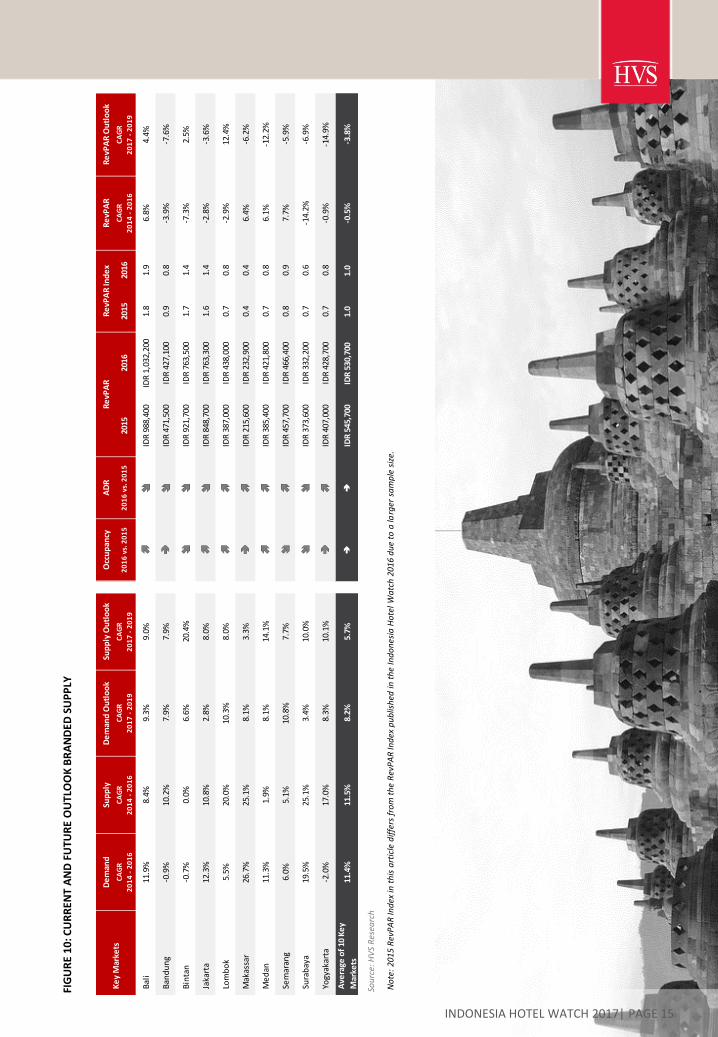
Although demand increased in the majority of our analysed key cities from 2015 to 2016, , new room supplyput pressure on the average rate in Indonesia’s key markets. Despite a significant amount of additionalbranded hotel supply in 2016, Yogyakarta, Medan and Lombok recorded an increase in both occupancy andADR. Bandung, Bintan and Surabaya’s hotel performances, on the other hand suffered in 2016, with a drop inoccupancy between 3.5% to 4.5% points and ADR decreasing between 5% and 10%.Looking ahead, Bali, Bintan and Lombok are the three key markets where we expect the strongest three-yearRevPAR compound annual growth rate from 2017 to 2019. Due to Jakarta’s importance as a corporatetourism destination, we included the capital in our analysis below.
BaliPresentBali’s hotel performance has not slowed down in 2016. Throughout thesegments, overall hotel demand increased, however, at the expense of aslight decrease in ADR in the upper upscale segment.FutureWith a solid existing supply and a strong pipeline in place, we expect newdestinations within Bali to arise. For instance, beachfront land from Cangguto Pantai Kelating is likely to see transformation in the coming years. Ourhotel performance outlook remains positive for Bali as the increase insupply is expected to be absorbed by the continuous surge of touristarrivals. Furthermore, Bali is gearing up development of the airport tosuccessfully welcome delegates of IMF and World Bank for their annualmeeting in October 2018.
Expansion of NgurahRai airport
Development of Cruise Terminal in Benoa Bali
Bukit Pandawaproject comprising 350 hotel rooms, residential sites and retail
LombokPresentThe emergence of Lombok and its transformation into a popular leisuredestination has been a hot topic over the past few years. In 2016, occupancysurged in Lombok amongst the analysed hotels and supported by a strongincrease in ADR, RevPAR increased by over 10% year-on-year.FutureThe two additional parking spaces at Lombok’s international airport are to beinaugurated by the end of 2017 to further boost tourism arrivals on theisland. While we expect occupancy and ADR to grow in the next three years,the rise in awareness of Lombok as an international resort destination will behindered until the Mandalika project is completed.
Addition of airplane parking spaces
Mandalika Project:
• 10,500 hotel rooms
• 1,500 residential units
• 4 retail complexes
• Race Circuit• Water Park
• Marina & Eco Park
JakartaPresentThe positive demand growth in Indonesia’s capital, particularly fromdomestic guests, has not fully translated into a rise in performances inbranded hotels. While overall occupancy increased slightly in 2016, averagerate was on a downward trend. Amongst our sample, the luxury segment wasimpacted the most.FutureWithin the next three years, more than 8,000 hotel rooms will enter Jakartaand we expect hotel occupancy to drop. The risk of average rate furtherdeteriorating, especially in the luxury market, is high due to the additionalincoming supply.In 2018, Jakarta will host, together with Palembang, the Asian Games, anevent that will hopefully bring the spotlight back to the capital.
Expansion of Soekarno-Hatta Airport
Construction of MRT and LRT line to connect the city with its outskirts
Asian Games 2018
Sou
rce:
HV
SR
esea
rch
FIG
UR
E1
0:C
UR
REN
TA
ND
FUTU
RE
OU
TLO
OK
BR
AN
DED
SUP
PLY
INDONESIA HOTEL WATCH 2017| PAGE 15
No
te:
2015
Rev
PA
R In
dex
in t
his
art
icle
dif
fers
fro
m t
he
Rev
PA
R In
dex
pu
blis
hed
in t
he
Ind
on
esia
Ho
tel W
atc
h 2
016
du
e to
a la
rger
sa
mp
le s
ize.
De
man
dSu
pp
lyD
em
and
Ou
tlo
ok
Sup
ply
Ou
tlo
ok
Occ
up
ancy
AD
RR
evP
AR
Re
vPA
R O
utl
oo
k
CA
GR
20
14
- 2
01
6
CA
GR
20
14
- 2
01
6
CA
GR
20
17
- 2
01
9
CA
GR
20
17
- 2
01
92
01
6 v
s. 2
01
52
01
6 v
s. 2
01
520
1520
1620
1520
16C
AG
R
20
14
- 2
01
6
CA
GR
20
17
- 2
01
9
Bal
i11
.9%
8.4%
9.3%
9.0%
IDR
988
,400
IDR
1,0
32,2
001.
81.
96.
8%4.
4%
Ban
du
ng
-0.9
%10
.2%
7.9%
7.9%
IDR
471
,500
IDR
427
,100
0.9
0.8
-3.9
%-7
.6%
Bin
tan
-0.7
%0.
0%6.
6%20
.4%
IDR
921
,700
IDR
763
,500
1.7
1.4
-7.3
%2.
5%
Jaka
rta
12.3
%10
.8%
2.8%
8.0%
IDR
848
,700
IDR
763
,300
1.6
1.4
-2.8
%-3
.6%
Lom
bo
k5.
5%20
.0%
10.3
%8.
0%ID
R 3
87,0
00ID
R 4
38,0
000.
70.
8-2
.9%
12.4
%
Mak
assa
r26
.7%
25.1
%8.
1%3.
3%ID
R 2
15,6
00ID
R 2
32,9
000.
40.
46.
4%-6
.2%
Me
dan
11.3
%1.
9%8.
1%14
.1%
IDR
385
,400
IDR
421
,800
0.7
0.8
6.1%
-12.
2%
Sem
aran
g6.
0%5.
1%10
.8%
7.7%
IDR
457
,700
IDR
466
,400
0.8
0.9
7.7%
-5.9
%
Sura
bay
a19
.5%
25.1
%3.
4%10
.0%
IDR
373
,600
IDR
332
,200
0.7
0.6
-14.
2%-6
.9%
Yogy
akar
ta-2
.0%
17.0
%8.
3%10
.1%
IDR
407
,000
IDR
428
,700
0.7
0.8
-0.9
%-1
4.9%
Ave
rage
of
10 K
ey
Mar
kets
11.4
%11
.5%
8.2%
5.7%
IDR
545
,700
IDR
530
,700
1.0
1.0
-0.5
%-3
.8%
Ke
y M
arke
tsR
evP
AR
Ind
ex
Re
vPA
R
INDONESIA HOTEL WATCH 2017| PAGE 16
Investment
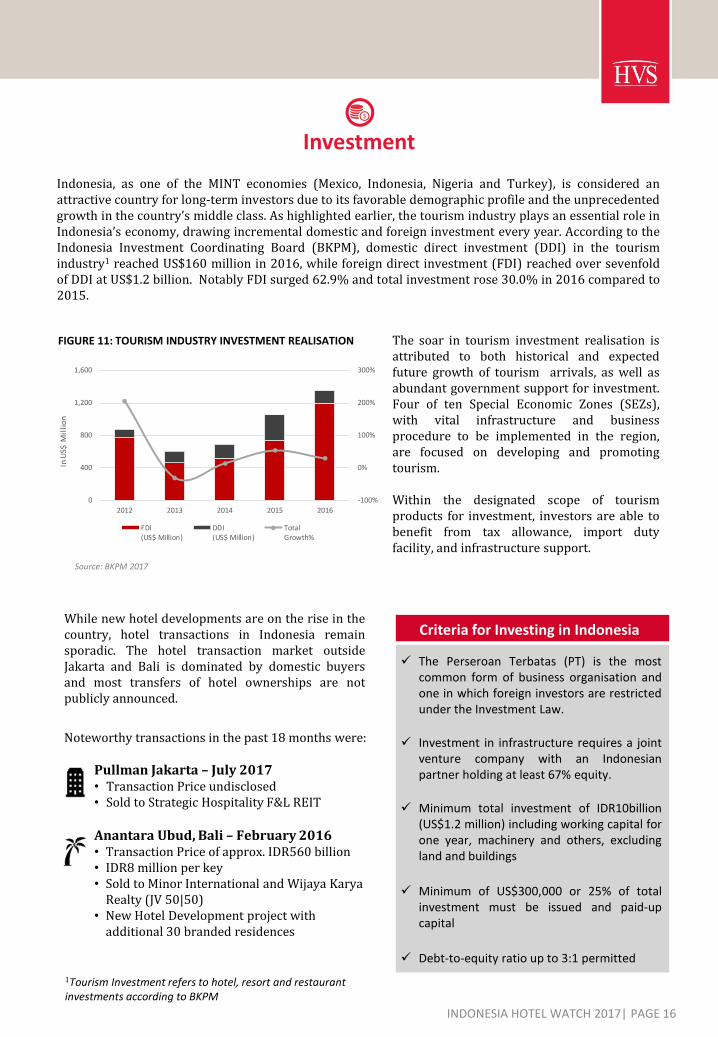
Indonesia, as one of the MINT economies (Mexico, Indonesia, Nigeria and Turkey), is considered anattractive country for long-term investors due to its favorable demographic profile and the unprecedentedgrowth in the country’s middle class. As highlighted earlier, the tourism industry plays an essential role inIndonesia’s economy, drawing incremental domestic and foreign investment every year. According to theIndonesia Investment Coordinating Board (BKPM), domestic direct investment (DDI) in the tourismindustry1 reached US$160 million in 2016, while foreign direct investment (FDI) reached over sevenfoldof DDI at US$1.2 billion. Notably FDI surged 62.9% and total investment rose 30.0% in 2016 compared to2015.
1Tourism Investment refers to hotel, resort and restaurant investments according to BKPM
The soar in tourism investment realisation isattributed to both historical and expectedfuture growth of tourism arrivals, as well asabundant government support for investment.Four of ten Special Economic Zones (SEZs),with vital infrastructure and businessprocedure to be implemented in the region,are focused on developing and promotingtourism.
Within the designated scope of tourismproducts for investment, investors are able tobenefit from tax allowance, import dutyfacility, and infrastructure support.
FIGURE 11: TOURISM INDUSTRY INVESTMENT REALISATION
Source: BKPM 2017
-100%
0%
100%
200%
300%
0
400
800
1,200
1,600
2012 2013 2014 2015 2016
In U
S$ M
illi
on
FDI(US$ Million)
DDI(US$ Million)
TotalGrowth%
While new hotel developments are on the rise in thecountry, hotel transactions in Indonesia remainsporadic. The hotel transaction market outsideJakarta and Bali is dominated by domestic buyersand most transfers of hotel ownerships are notpublicly announced.
Noteworthy transactions in the past 18 months were:
Pullman Jakarta – July 2017• Transaction Price undisclosed• Sold to Strategic Hospitality F&L REIT
Anantara Ubud, Bali – February 2016• Transaction Price of approx. IDR560 billion• IDR8 million per key• Sold to Minor International and Wijaya Karya
Realty (JV 50|50)• New Hotel Development project with
additional 30 branded residences
Criteria for Investing in Indonesia
✓ The Perseroan Terbatas (PT) is the mostcommon form of business organisation andone in which foreign investors are restrictedunder the Investment Law.
✓ Investment in infrastructure requires a jointventure company with an Indonesianpartner holding at least 67% equity.
✓ Minimum total investment of IDR10billion(US$1.2 million) including working capital forone year, machinery and others, excludingland and buildings
✓ Minimum of US$300,000 or 25% of totalinvestment must be issued and paid-upcapital
✓ Debt-to-equity ratio up to 3:1 permitted
INDONESIA HOTEL WATCH 2017| PAGE 17
Concluding Remarks and Outlook
Following strong domestic tourism growth over thepast five years, HVS has identified three provinces tolook out for over the next 12 months:
East Nusa TenggaraOwing to its beautiful natural scenery,Indonesia’s most southern tip has potential todevelop sustainable resorts. Over the past fiveyears there has already been a positive trendfor both domestic and foreign arrivals, with astrong growth rate in classified hotel rooms.
West SulawesiWith a strong demand surge in domesticarrivals as well as an increase in non-classifiedhotel supply, there is an opportunity for WestSulawesi’s natural and cultural tourismdevelopment.
North MalukuBacked by the tourism ministry, foreigninvestors are eyeing Morotai Island, which notonly benefits from its natural landscape butalso its underwater relics of World War II.International and domestic tourists are gaininginterest for North Maluku, showing stronggrowth rates in both classified and non-classified hotels.
After a sluggish start to the year 2017, Indonesia'seconomy is expected to pick up following a stronger5% GDP growth in the second quarter.
Achieving successful development of itsinfrastructure is a key challenge Indonesia facestoday.While the government has aspirations to connect thecountry by air, sea as well as rail, infrastructure mustbe improved sooner rather than later for tourismarrival targets to be reached.
Tourism arrival numbers in Indonesia are on anupward trend and overall, the country has greatpotential to develop additional destinations otherthan Bali and Jakarta. Yet, the target of 20 millioninternational visitor arrivals by 2019 appearsambitious.
This year, we analysed the supply and demand byprovince to highlight the importance of domestictourism in Indonesia’s provinces. With the exceptionof Bali, the country is highly dependent on domestictourism, largely driven by the governmental and thecorporate segment. However, leisure tourismsupports provinces such as DI Yogyakarta and JawaBarat particularly on the weekends, with a greatvariety of food and shopping options the regions haveto offer.
INDONESIA HOTEL WATCH 2017| PAGE 18

HVS | 137 Market Street, #04-02 Grace Global Raffles, Singapore 048943HVS.com
Notable contributions were made by Ho Mei Leng, Jeremy Teo, Kyu Baek Kim, Jill Gu, Xiaomei Zhong and Deepika Thadani fromour Singapore and new Delhi offices.
Victoria Chan is a SeniorAnalyst with HVS Singapore. Shegraduated with a Bachelor ofScience degree in InternationalHospitality Management fromÉcole hôtelière de Lausanne.During her time with HVS, shehas covered market research,feasibility studies and valuationsacross regional markets, that
include Indonesia, Malaysia, Maldives, New Zealand,Papua New Guinea, Thailand, South Korea andSingapore. [email protected]
About HVSHVS, the world’s leading consulting and services organizationfocused on the hotel, mixed-use, shared ownership, gaming,and leisure industries, celebrated its 35th anniversary in2015. Established in 1980, the company performs 4,500+assignments each year for hotel and real estate owners,operators, and developers worldwide. HVS principals areregarded as the leading experts in their respective regions ofthe globe. Through a network of over 40 offices and morethan 350 professionals, HVS provides an unparalleled rangeof complementary services for the hospitality industry.HVS.com
Superior Results through Unrivalled Hospitality Intelligence. Everywhere.
HVS ASIA PACIFIC is represented by eight offices inSingapore, Bangkok, Beijing, Hong Kong, Mumbai, New Delhi,Shanghai and Shenzhen. HVS also hosts four of the mainannual industry events in the region, namely the China HotelInvestment Conference (CHIC), Hotel Investment Conference- South Asia (HICSA), Tourism, Hotel Investment &Networking Conference (THINC) Indonesia and THINC SriLanka. Additionally, HVS publishes a wide range of leadingresearch reports, articles and surveys, which can bedownloaded from our online library (HVS.com/Library).
HVS SINGAPORE has worked on a broad array of projectsthat include economic studies, valuations, feasibility studies,operator search and management contract negotiation,development strategies for new brands, asset management,research reports and investment advisory for hotels, resorts,serviced residences and branded residential developmentprojects.
About the Authors
Stephanie Bernhard is a SeniorAssociate with HVS Singaporeand holds a BA (Hons) inHospitality Finance & RevenueManagement from Glion Instituteof Higher Education. Prior tojoining HVS, she worked with thevaluation & consulting team atBNP Paribas Real Estate Hotels inParis for three years. Since joining
Hok Yean Chee is the ManagingPartner of HVS Singapore. Shehas over 30 years of experiencein more than 30 markets across19 countries in Asia Pacific,providing real estate investmentadvisory services for a widespectrum of property assets. Herforte lies in providing investmentadvisory on hotels and
serviced apartments including brokerage, strategicanalyses, operator search, market feasibility studies,valuations and litigation support. [email protected]
HVS, Stephanie has been involved in valuations, marketand benchmark studies in Singapore, Malaysia andIndonesia. [email protected]