Indonesia Hotel Watch 2015 - Hotel News Resource effects have been felt heavily in some markets, and...
61
HVS.com HVS SINGAPORE | 6 Temasek Boulevard #23-01A Suntec Tower Four Singapore 038986 SEPTEMBER 2015 INDONESIA HOTEL WATCH 2015
Transcript of Indonesia Hotel Watch 2015 - Hotel News Resource effects have been felt heavily in some markets, and...

HVS.com HVS SINGAPORE | 6 Temasek Boulevard #23-01A Suntec Tower Four Singapore 038986
SEPTEMBER 2015
INDONESIAHOTEL WATCH 2015
Table of Contents
FOREWORD . . . . . . . . . . . . . . . . . . . . . . . . . . . . . . . . . . . . . . . . . . . . . . . . . . . . . . . . . . . 3
INDONESIA . . . . . . . . . . . . . . . . . . . . . . . . . . . . . . . . . . . . . . . . . . . . . . . . . . . . . . . . . . . 4
BALI . . . . . . . . . . . . . . . . . . . . . . . . . . . . . . . . . . . . . . . . . . . . . . . . . . . . . . . . . . . . . . . . 14
JAKARTA . . . . . . . . . . . . . . . . . . . . . . . . . . . . . . . . . . . . . . . . . . . . . . . . . . . . . . . . . . . . . 21
SURABAYA . . . . . . . . . . . . . . . . . . . . . . . . . . . . . . . . . . . . . . . . . . . . . . . . . . . . . . . . . . . 26
BINTAN . . . . . . . . . . . . . . . . . . . . . . . . . . . . . . . . . . . . . . . . . . . . . . . . . . . . . . . . . . . . . . 30
LOMBOK . . . . . . . . . . . . . . . . . . . . . . . . . . . . . . . . . . . . . . . . . . . . . . . . . . . . . . . . . . . . 36
BANDUNG . . . . . . . . . . . . . . . . . . . . . . . . . . . . . . . . . . . . . . . . . . . . . . . . . . . . . . . . . . . 42
YOGYAKARTA . . . . . . . . . . . . . . . . . . . . . . . . . . . . . . . . . . . . . . . . . . . . . . . . . . . . . . . . . 46
BOGOR . . . . . . . . . . . . . . . . . . . . . . . . . . . . . . . . . . . . . . . . . . . . . . . . . . . . . . . . . . . . . . 50
MEDAN . . . . . . . . . . . . . . . . . . . . . . . . . . . . . . . . . . . . . . . . . . . . . . . . . . . . . . . . . . . . . 54
Indonesia Hotel Watch 2015 | PAGE 2

Foreword
HVS is pleased to publish the third edition of the Indonesia Hotel Watch (IHW), a comprehensive report discussing the tourism and hotel industry performance in nine major markets of the world's largest archipelago. Our deepest thanks to the hoteliers, investors and other industry stakeholders who have both supported this publication over the years and participated in the market studies which have made IHW 2015 possible.
The effect of Indonesia's growing economy on its tourism industry has been profound. Rising disposable income levels have given rise to a healthy demand for domestic travel. The marked increase in visitation from countries in the ASEAN, together with the expanding air transport network in the region have been strong catalysts for the growth of tourism in Indonesia.
2015 has been a year of change and opportunities for Indonesia's hospitality industry, with various political and economic factors affecting the country, which have in turn had varying levels of impact across its different markets. Policies anticipated to make a lasting impression on the industry's performance include the controversial ban on government meetings in hotels and the ban on foreign currencies in domestic transactions. The effects have been felt heavily in some markets, and in others the full impact of these policies remains to be seen.
While Indonesia's tourism juggernaut Bali continues to achieve record numbers in annual visitor arrivals, other markets such as Jakarta, Surabaya and Medan have seen flatter rates of growth. Among the markets covered in this publication, the upcoming location of Bintan Island, situated in the Riau province, has the potential to grow as a popular leisure destination. Going forward, the planned development of new and existing destinations, together with improved infrastructure, destination diversification and sustained economic progress, will present significant opportunities for all stakeholders in Indonesia.
Through the 2015 edition of IHW, we aim to provide hotel owners, investors and other stakeholders with unbiased market intelligence on the dynamics that influence each market. I hope you find the report informative and useful and welcome your questions or comments.
Thank you
Yours sincerely
Manav Thadani, MRICSChairman - Asia PacificHVS
Indonesia Hotel Watch 2015 | PAGE 3

Indonesia Hotel Watch 2015 | PAGE 4
INDONESIA

Indonesia Hotel Watch 2015 | PAGE 5
•B
inta
n
•M
ed
an
•Ja
kart
a•
Bo
gor
•B
and
un
g
• Yogy
akar
ta
• Su
rab
aya
•Lo
mb
ok
•B
ali
Ind
on
esi
a

transactions so as to reduce dependence on foreign currencies and control capital outflows. Although the law empowering this ban was passed some years ago, the central bank of Indonesia has only announced its enforcement over the three months leading up to July 2015.
While GDP growth has been slowing since 2012, the general outlook for Indonesia's economy is positive, with its GDP expected to grow by 4.9% in 2015. Additionally, the country's inflationary levels are forecast to lower in the second half of 2015 on the back of decreased demand for food and fuel in months following the religious festivities. However, one of the key areas of focus for Indonesia, going forward, will be to gain further control on its current account balance, which deteriorated from being surplus prior to 2012 to negative in recent times owing to the introduction of fuel subsidies previously. The current account deficit, which narrowed to 1.8% of GDP in the first quarter this year (January-March 2015) from 2.6% in the previous quarter (October-December 2014) owing to weak global oil prices, is set to widen in the coming quarters due to recovering global oil prices and an anticipated hike in demand for capital goods imports as major government-sanctioned infrastructure projects commence. Nevertheless, the deficit in 2015 is likely to be narrower than last year according to EIU forecasts.
In an attempt to reduce the budget deficit, Indonesia's president Joko Widodo banned civil servants from hosting meetings in hotels and spending lavishly on entertainment, since he came to power in October 2014. These cuts in expenditure were projected to save the country IDR24 trillion (US$1.9 billion) in 2015. The ban, however, has left many hotels in secondary and tertiary cities that are largely dependent on the government meeting segment struggling. Cities such as Sulawesi, Lampung and West Kalimantan were amongst the most affected; occupancy rates dropped by 11–17 percentage points in December 2014, in comparison to 2013. Owing to its detrimental impact on the tourism and hospitality industry, the ban was officially revoked in April 2015 according to ministerial decree PermenPan Number 6/2015. Despite this, government officials are still obliged to abide by strict guidelines and bureaucratic procedures aimed at ensuring financial efficiency. Although hotels impacted by the government meetings ban are still experiencing low frequency of bookings in the aftermath of the ban's reversal, hoteliers reportedly feel cautiously optimistic about seeing a pick-up in government business in the fourth quarter of 2015.
The effect of Indonesia's growing economy on its tourism industry has been profound. Between 2002 and 2012, the total contribution of travel and tourism toward the nation's GDP grew at a compound annual growth rate (CAGR) of 13.4%. According to the World Travel and Tourism Council, the direct contribution of travel and tourism to Indonesia's GDP in 2014 was IDR325,467 billion constituting 3.2% of the total GDP, and growing by 15% over the previous year. This is estimated to rise by 6% to IDR345,102 billion in 2015. Direct contribution from Indonesia's travel and tourism industry to GDP is forecasted to grow by a further 5.3% per annum to reach IDR581,091 billion by 2025.
Indonesia
Overview
The Republic of Indonesia has approximately 17,508¹ islands, making the nation the largest archipelago in the world. It is also the 19th largest country globally in terms of land mass, which spans 1,919,440 square kilometres (741,099 square miles). The archipelago, which lies between the Indian Ocean and the Pacific Ocean, comprises five main islands – Sumatra, Kalimantan, Sulawesi, Irian Jaya and Java/Madura – that are separated into 34 provinces. Of these, eight have been created since 1999, with the latest province, North Kalimantan, being formed in 2012. Running along the equator for 5,000 kilometres, Indonesia is geographically positioned south of Singapore, Malaysia and Brunei.
Indonesia has a population of approximately 253.6 million people, making it the fourth-most populous country in the world. Its geographical distribution, however, is uneven, with approximately 60% of the total population living on the islands of Java and Bali, and the five most populous provinces being West Java, East Java, Central Java, North Sumatra and Banten. Current estimates place Indonesia's population at 366 million by 2050, which will make it the fifth-most populous country on earth.
Economic Update
The Indonesian economy has grown from strength to strength in the last decade and currently ranks as the 16th largest economy in the world, according to World Bank estimates. However, the economy has faced challenges in the past couple of years: in 2014, growth in gross domestic product (GDP) slowed for a second consecutive year, from 6.0% in 2012 to 5.6% in 2013 and to 5.0% in 2014. Furthermore, owing to strong food prices driven mainly by raw food inflation, consumer prices rose by 7.2% year-on-year in May 2015, up from 6.8% in April. Inflated raw food prices are expected to persist through the mid-term, during the period of Ramadan and Eid festivities. Another contributing factor to the high inflation is the rise in global oil prices in April and May 2015, which was further exacerbated by the Indonesian government's fuel subsidy reform introduced in January 2015. Under the new fuel reform, prices follow market rates and are adjusted monthly. Fixed retail prices for subsidised diesel were scrapped in favour of a fixed per-unit subsidy of IDR1,000 per litre and subsidy for petrol has been eliminated entirely. Other factors contributing to the high inflation were currency depreciation and a rise in nominal wages in the agriculture and construction sectors.
The Indonesian rupiah had a difficult year in 2014 and, similar to other emerging markets in the region, it underwent a decline in value, from IDR10,461 to the US dollar in 2013, to IDR11,865 in 2014. The rupiah depreciated a further 16% year-on-year to reach IDR13,400 to the US dollar as of July 2015. Per the Economist Intelligence Unit (EIU) forecast, the rupiah is envisaged to average IDR12,884 to the US dollar in 2015. In a bid to control the falling rupiah, Bank Indonesia implemented a ban on foreign currencies, including the US dollar, in domestic
Indonesia Hotel Watch 2015 | PAGE 61 CIA World Factbook

The marked increase in visitation from countries in the ASEAN region, coupled with the domestic market's rising disposable income levels and the expanding air transport network, have been strong catalysts for growth of tourism in Indonesia. Rise in international arrivals is expected to continue as the rupiah's exchange rate against the US dollar is anticipated to stay attractive for these markets in the short-term. In the mid-term, Indonesia's burgeoning tourism industry, coupled with Bank Indonesia's implementation of the ban on the use of foreign currencies, may prove to be a valuable source of foreign exchange for the economy, enabling the curb of the excessive depreciation of the rupiah to some extent. The reforms in fuel subsidy policy may, in the long run, serve to moderate Indonesia's current account balance, which has been in the red since 2012.
This corresponds to a 6% increase over 2014. According to the latest statistics released by Indonesian tourism authorities, international arrivals to Indonesia show no signs of slowing down. Through May 2015 total visitations were recorded at 3,842,669 visitors, a 5% increase over the same period last year, slightly short of the official estimates.
Apart from the increasing accessibility to the country via an ever-widening network of low-cost carriers, and to a lesser extent, an increasing number of long-haul connections, part of the growing attractiveness of Indonesia as a tourist destination has been attributed to the rupiah's depreciation against the US dollar over the past several years. Bali has been one of the main benefactors of demand growth following the rupiah's slide, evident from the fact that in 2014, the popular tourist destination received a total of 3.7 million direct international arrivals, once more exceeding its target of 3.5 million. Additionally, the much debated visa-free travel regulation, which finally came into effect on 9 June 2015, will serve to further increase Indonesia's attractiveness as a destination in Southeast Asia. Citizens from some of Indonesia's top feeder markets including China, Japan and South Korea may now travel visa-free to Indonesia. In the short-term, foreign tourist arrivals are estimated to reach 10 million by the end of 2015.
Despite the fact that Indonesia has experienced commendable economic growth over the years, this growth is not distributed equally across its seven economic corridors, namely Sumatra, Java, Bali, Nusa Tenggara, Sulawesi, Maluku and Papua. The contribution to the country's economy is primarily generated in the western provinces, with more than 60% of the GDP coming from Jakarta, Java and Riau alone.
However, in recent years, economies of a number of the eastern provinces have gained momentum posting record increases. Granted that these regions have a lower base, but double digit CAGR of over 16% in Maluku, South Sulawesi and Lampung, and 29.5% in West Papua, over the five-year period between 2008 and 2013, are noteworthy. Such growth can predominantly be attributed to the mining industry, agricultural production and other commodity extractive industries (such as wood or rubber) operating in these areas. Having said that, in the short-to-medium term, eastern Indonesia's impressive growth rates are expected to taper off, on the back of dwindling exports and the ban on mineral ore export introduced in March 2014.
Tourism Overview
Indonesia's tourism industry has considerable potential given the high cultural diversity among its provinces. Year 2014 has proven to be another record year in terms of international arrivals to Indonesia. The country welcomed 9.4 million international travellers, which translated to a 7.2% growth from 2013. This was a record-setting figure which met the Ministry of Tourism's target to achieve 9.3 to 9.5 million international visitations in 2014.
The official visitor arrival target for Indonesia in 2015, as set out by the Ministry of Tourism, is to reach 10 million international and 254 million domestic arrivals by the end of the year.
TOP 10 FASTEST GROWING PROVINCES (2008–2013)
Source: Badan Pusat Statistik Indonesia
Indonesia Hotel Watch 2015 | PAGE 7
Province
GDP in 2008
(IDR billion)
GDP in 2013
(IDR billion) CAGR
Fastest Growing Economies
West Papua 13,975 50,909 29.5%
Lampung 73,719 164,393 17.4%
South Sulawesi 85,143 184,783 16.8%
Maluku 6,270 13,245 16.1%
Jambi 41,056 85,558 15.8%
Central Sulawesi 28,728 58,641 15.3%
North Maluku 3,862 7,725 14.9%
Gorontalo 5,907 11,752 14.8%
West Sulawesi 8,297 16,184 14.3%
Central Kalimantan 32,760 63,515 14.2%
Largest Economies
DKI Jakarta 677,045 1,255,926 13.2%
East Java 621,392 1,136,327 12.8%
West Java 633,283 1,070,177 11.1%
Central Java 367,136 623,750 11.2%
Riau 276,400 522,241 13.6%
Indonesia 4,271,045 7,578,119 12.2%
ECONOMIC FORECAST (2011–2017F)
Source: Economist Intelligence Unit
Economic Indicators 2011 2012 2013 2014 2015F 2016F 2017F
GDP Growth (%) 6.2 6.0 5.6 5.0 4.9 5.3 5.6Inflation (%) 5.4 4.0 6.4 6.4 5.5 4.3 5.4Exchange Rate IDR:US$ 8,770 9,387 10,461 11,865 12,884 12,648 12,439Lending Interest Rate 12.4 11.8 11.7 12.6 12.4 11.4 11.1Current Account Balance (% of GDP) 0.2 -2.7 -3.9 -3.7 -3.4 -2.7 -2.7

In 2014, international arrivals to Indonesia were mainly through Bali's Ngurah Rai International Airport and Jakarta's Soekarno-Hatta International Airport, which together accounted for 64% of all international arrivals to the country. Of the country's six busiest ports of entry, Batam witnessed the strongest growth in international arrivals in 2014, recording an 8.8% increase compared to 2013 levels.
provide a further impetus to the rise in international arrivals to Indonesia over the medium-to-long term.
The top source markets for the country have remained the same over the years, with Association of Southeast Asian Nations (ASEAN) accounting for a large part of the visitor arrivals. This is largely due to low intra-ASEAN flight fares and the ease of entry between ASEAN states. Of these, Singapore and Malaysia are the top two feeder countries, each accounting for 16% of total international arrivals into Indonesia in 2013. They are followed by the growing markets of Australia (11%), China (10%) and Japan (6%). Specifically, China has become one of the fastest growing feeder markets for Indonesia, with visitation from the country increasing at a CAGR of 39% between 2003 and 2013. More recently, from 2012 to 2013, the highest growth in visitations by country was recorded from Bangladesh and Vietnam at 36% and 29%, respectively. On the other hand, the “region” that contributed the highest growth in visitations was Middle East and Africa, at 27%.
Under the government's Master Plan for Acceleration and Expansion of Economic Development 2011–2025 (MP3EI), ongoing improvements in infrastructure network, such as the expansion of airports including Soekarno-Hatta and Juanda, and a pipeline of 30 new airport development sites, are envisaged to
Going forward, the Asia Pacific countries are expected to continue to dominate the country's inbound arrivals, with Singapore and Malaysia anticipated to account for more than 4.3 million visitors by 2018. Arrivals from China are also set to increase with Indonesia expanding its range of travel connections to this market.
Even though the number of tourist visits to Indonesia has continued to increase over the past few years, the country lags behind other ASEAN members in absolute number of annual international visits. In 2014, Malaysia received 27.4 million foreign tourists, Thailand received 24.8 million, and Singapore witnessed 15.1 million inbound international travellers, compared to 9.4 million international arrivals recorded by Indonesia. Bearing in mind that Indonesia is a larger economy compared to the aforementioned nations, it has a lot of catching up to do in terms of international arrivals.
Indonesia Hotel Watch 2015 | PAGE 8
Source: Badan Pusat Statistik Indonesia
TOP SOURCE MARKETS TO INDONESIA (2013)
Source: Badan Pusat Statistik Indonesia
INTERNATIONAL ARRIVALS (2010–MAY 2015 YTD)
0%
1%
2%
3%
4%
5%
6%
7%
8%
9%
10%
0
1,000
2,000
3,000
4,000
5,000
6,000
7,000
8,000
9,000
10,000
2010 2011 2012 2013 2014 May YTD 2014
May YTD 2015
% C
han
ge
Inte
rna�
on
al A
rriv
als
(Th
ou
san
ds)
Interna�onal Arrivals % Change
Source: Badan Pusat Statistik Indonesia
INTERNATIONAL ARRIVALS BY PORT OF ENTRY (2013–2014)
Port of Entry YOY % ChangeMarket Share
2013Market Share
2014Ngurah Rai 4.6% 37% 40%
Soekarno-Hatta 0.3% 25% 24%Batam 8.8% 15% 15%Tanjung Uban 0.9% 4% 3%Polonia 4.1% 3% 2%
Juanda -3.5% 3% 2%Others 1.3% 14% 13%Total Indonesia 7.2%
MARKET SHARE (2014)
Ngurah Rai40%
Soekarno-Hatta24%
Batam15%
Tanjung Uban
3%
Polonia3%
Juanda2%
Others13%
16%
16%
11%
10%6%
41%
Singapore
Malaysia
Australia
China
Japan
Others

As arrivals in 2014 hit a record high, so did Indonesia's foreign tourism receipts, which reached US$11.2 billion, up 16% from the previous year, making tourism the fourth-largest contributor to the nation's total income behind the oil and gas sector, coal industry and palm oil industry. Tourism receipts grew at a CAGR of 2.3% between 2008 and 2014 with strong growth expected to continue.
Indonesians are increasingly able to afford outbound travel as well. Those with highest propensity to travel outside the country are residents from East Java, Central Java, West Java, Jakarta, North Sumatra, and Bali.
According to a study performed recently by MasterCard, international outbound leisure trips made by Indonesians are estimated at 6.8 million in 2014. This is forecast to grow at a higher rate than Indonesia's economy, at approximately 7.5% per annum to 10.6 million outbound trips in 2020. The number of short business trips as well as those over weekends, mainly to countries in close proximity to Indonesia, such as Singapore, Malaysia, and Hong Kong, are expected to increase. Apart from the geographic convenience that these markets pose, short-haul markets are expected to remain the focus of the Indonesian outbound traveller owing to the depreciation of the rupiah limiting the spending propensity of Indonesians in foreign countries.
Infrastructure Development
Indonesia's infrastructure challenges are increasing under the soaring growth of international and domestic demand for air travel. As of March 2015, there are 237 operating airports in Indonesia connecting its 34 provinces and 17,508 islands. By some estimates, select Indonesian airports are operating at two to three times their designed capacity and are in need of urgent attention and adequate investment. Additionally, economists note that the government has to urgently address problems such as congested ports and the extension and renovation of roads if it is to have any hope of competing for investment with other fast-growing Asian nations.
The need to improve airport infrastructure development is further fueled by the open skies policy mandated from 2015 by the ASEAN Single Aviation Market (SAM). This open skies agreement aims to deregulate the airspace within ASEAN, removing restrictions and allowing airlines to transit across national airspaces under a single unified air transport agreement. The objectives of the ASEAN-SAM are to increase regional and domestic connectivity, integrate production networks and enhance regional trade. Under the agreement, access points are expected to be Soekarno-Hatta International Airport (Jakarta), and airports in Surabaya, Medan, Makassar and Bali.
Source: World Travel and Tourism Council
DOMESTIC TOURISM RECEIPTS (2008–2014)
Domestic Tourism and Outbound Travel
According to the Ministry of Tourism, Indonesia has experienced a consistent growth in domestic tourism in the past five years. Domestic visits stood at 245.3 million in 2012, and grew by 1.9% to reach 250 million domestic arrivals in 2013. The continuous, albeit shrinking growth of the Indonesian economy is boosting average disposable incomes and allowing more Indonesians to take vacation/leisure trips to holiday destinations or their hometowns. Moreover, the weakening rupiah has also increased the appeal of domestic travel compared to outbound destinations. Despite increasing food cost and recovering fuel prices, private consumption continued to grow in 2014. Domestic tourism spending reached US$36.7 billion, a growth of 6.6% from 2013. The CAGR of domestic tourism spending is 3.4% from 2008 to 2014.
Source: World Travel and Tourism Council
FOREIGN TOURISM RECEIPTS (2008–2014)
Indonesia Hotel Watch 2015 | PAGE 9
Source: HVS Research
INTERNATIONAL ARRIVALS COMPARISON (2013–2014)
0
5
10
15
20
25
30
Indonesia Singapore Malaysia Thailand
Mill
ion
s
2013 2014
-30%
-25%
-20%
-15%
-10%
-5%
0%
5%
10%
15%
20%
0
2
4
6
8
10
12
2008 2009 2010 2011 2012 2013 2014
% C
han
ge
Fore
ign
To
uri
sm R
ece
ipts
(U
S$ b
illio
n)
Foreign Tourism Receipts % Change
-4%
-2%
0%
2%
4%
6%
8%
10%
0
5
10
15
20
25
30
35
40
2008 2009 2010 2011 2012 2013 2014
% C
han
ge
Do
me
stic
To
uri
sm R
ece
ipts
(U
S$ b
illio
n)
Domestic Tourism Receipts % Change

Improving national connectivity has been highlighted as a key pillar of the government's Master Plan for the Acceleration and Expansion of Economic Development 2011–2025 (MP3EI), announced in May 2011. Six economic corridors – Sumatra, Java, Kalimantan, Sulawesi, Bali and Papua – have been identified as priorities for economic development. In 2015 the Ministry of Transport (MoT) released an updated plan on infrastructure development in Indonesia, outlining locations of new airports, as well as the development plans for maritime and land connectivity. After lacking government funding for years, in addition to land-related disputes hindering the expansion and upgrading of airports, the government announced, in October 2014, plans to finance the construction of 165 airports in various cities across the archipelago. Furthermore, 103 existing airports will undergo renovation in the years to come with 29 being outfitted to handle international arrivals.
Regarding the lack of financial resources, the Indonesian government intends to enhance cooperation with the private sector to overcome this issue, through public-private partnerships (PPPs) for infrastructure projects. Under the PPP scheme, the government will support the private sector with various incentives (tax incentives, fiscal contribution, government guarantees, etc.) to increase investment appeal and reduce the associated risks involved in airport developments. Various structures of the PPP are available depending on the economic and financial viability of the development. There are currently 10 airports under this scheme open for tender by the MoT, to be managed by the private sector.
Works are already underway at a large number of airports, and a significant number of new projects are in the early stages of planning.
According to the Airport Council International (ACI) Traffic Report, Soekarno-Hatta International Airport is one of the three busiest airports in Asia Pacific. Total passenger arrivals to Soekarno-Hatta have grown at a CAGR of 7% between 2010 and 2014. Foreign and domestic arrivals in 2014 were approximately 2.2 million and 55 million, respectively; having grown by 53% and 78% since 2010. Growth has slowed in the recent years, mainly attributed to the worsening congestion at the airport's various terminals (both for airlines and passengers). In a bid to ease traffic, plans are underway to build a third runway and expand the airport's three terminals. As of January 2014, selected commercial flights have been rerouted to Halim Perdanakusuma International Airport (HPIA), to the West of Jakarta. The number of aircraft aprons is also expected to increase from 125 to 174 and additional supporting infrastructure such as new cargo terminals, new bus stations, taxiways and train access will be developed alongside it. Should all the new projects be realised, the annual passenger capacity at Soekarno-Hatta will rise to 90 million with hourly flight capacity increasing to 86.
Surabaya’s Juanda International Airport has seen strong growth in passenger arrivals in recent years with a CAGR of 16% between 2009 and 2013. In October 2014, year-to-date total arrivals reached 7.1 million passengers. In 2014, Surabaya experienced a dip in international arrivals as Juanda airport was
closed for several days following volcanic eruptions from Mount Kelud and Mount Sinabung, which resulted in unsafe flying conditions. Surabaya is the capital city of East Java and second largest city in Indonesia. In order to keep up with the growing demand, PT Angkasa Pura I, state-owned airport services company operating in eastern part of Indonesia, plans to expand Juanda with three more runways by 2017; however, according to the airport authorities, construction has yet to commence.
A new airport in West Java, the Karawang International Airport, is being developed to ease the pressure at Jakarta's Soekarno-Hatta International Airport. The new airport, around 50 kilometres east of Jakarta, will be developed in several phases, eventually reaching a capacity of 70 million passengers per year.
Lion Group, parent company of budget airline Lion Air has obtained approval to commence construction on another new airport in Banten, southwest of Jakarta. The site for the new airport spans approximately 4,000 hectares, roughly twice the size of Soekarno-Hatta International Airport. Plans include four runways, one of which will be able to handle the Airbus A380, enabling the airport to cater to long-haul flights. Lion Group has the intention to develop the new airport as a multimodal hub of the domestic cargo market for the region. Currently, there are plans for a commercial centre and integrated rail links to the new airport.
The new Bintan Airport, which is expected to commence operations in 2016, is located in Lobam close to the Industrial Estate and Free Trade Zone. The new airport is a partnership between Garuda Indonesia and Singapore-based Gallant Ventures, who will jointly develop the airport as the national carrier's new hub. The partnership aims to improve the accessibility to Bintan Island and connectivity between East and West Indonesia, as well as other international destinations through Garuda's network of flights. The airport will be connected by ferry to Singapore and thus draw on demand travelling to east or west Indonesia. This highly anticipated project is expected to spur tourism development on Pulau Bintan. The success of new large scale developments on the island (in the Special Economic Zone) will depend on airlift facilities and improved connectivity to source markets. Total airport arrivals to Bintan Island have grown at 11% CAGR between 2009 and 2013 to reach an estimated 240,000 according to CAPA.
Government Initiatives
Given Indonesia's growth in tourism, the country has identified 88 Strategic Destination clusters and 88 major destinations, of which 16 will be given priority development in the mid-term through the inception of the Indonesian National Tourism Master Plan (RIPPARNAS). Apart from Bali, these destinations include Lombok, Old Batavia, Borobudur Temple, Bromo-Tengger-Semeru National Park, Raja Ampat and Flores-Komodo, among others. The master plan will be expanded to include all the 88 destinations by 2025.
Besides this targeted approach towards destination development, seven special categories have been identified in this strategy to promote tourism: culture and heritage; nature
Indonesia Hotel Watch 2015 | PAGE 10
and ecotourism; sport; cruise; culinary and shopping; health and wellness and MICE (meeting, incentives, convention and exhibitions).
MICE Tourism is perceived by the Ministry of Tourism as a market with huge potential to attract more international visitation. Also, the Ministry has identified a number of cities and destinations (16 in total) deemed to have potential to attract or further develop MICE demand such as Bali, Jakarta, and Surabaya among others.
Other initiatives, apart from coordinated promotional efforts, include the formulation of a focused approach towards capacity building in these cities, as well as the coordination of local stakeholders for destination development, such as improving infrastructure.
Additionally, tourism promotional efforts are being geared towards the rapidly emerging source markets such as China and India, while consistently targeting existing well-performing feeder markets such as Malaysia and Singapore. To further improve Indonesia's appeal as a travel destination, the government has relaxed visa regulations for citizens of 30 additional countries. China, Japan, South Korea, the UK and USA are some countries among Indonesia's top 10 feeder markets that are now allowed visa-free entry. Despite being Indonesia's third largest feeder market, Australia, which brought close to one million arrivals to the country in 2013, is not included in the list. Under the Presidential Regulation Number 69/2015, which came into effect in June 2015, foreign visitors from the 30 countries are permitted to enter Indonesia visa-free for a period of 30 days at nine stipulated immigration check-points. These check-points are Soekarno-Hatta (Jakarta), Ngurah Rai (Bali), Kuala Namu (Medan), Juanda (Surabaya), Hang Nadim (Batam), Pelabuhan Laut Sri Bintan, Pelabuhan Laut Sekupang, Pelabuhan Laut Batam Center and Pelabuhan Laut Tanjung Uban (Riau).
On the whole, Asia continues to be perceived as the key region for growth in international arrivals to Indonesia. The government is targeting 10 million arrivals in 2015, with the majority anticipated to come from the Asia Pacific region.
Tourism Investment
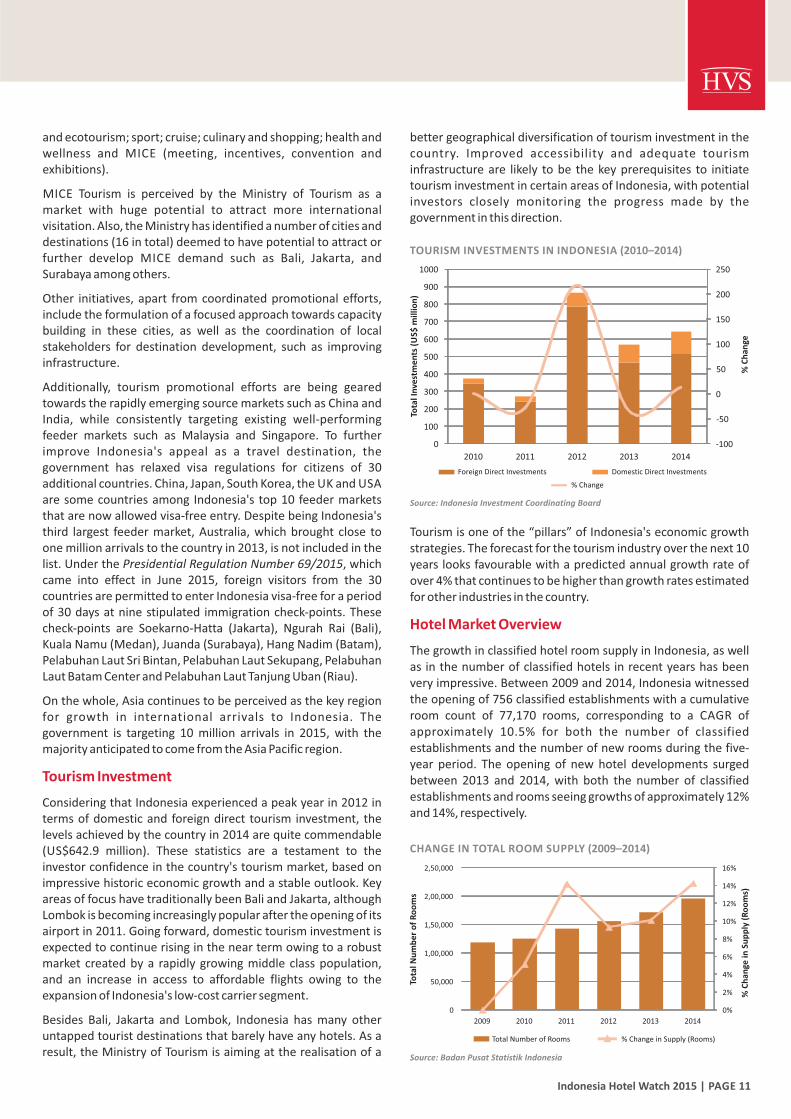
Considering that Indonesia experienced a peak year in 2012 in terms of domestic and foreign direct tourism investment, the levels achieved by the country in 2014 are quite commendable (US$642.9 million). These statistics are a testament to the investor confidence in the country's tourism market, based on impressive historic economic growth and a stable outlook. Key areas of focus have traditionally been Bali and Jakarta, although Lombok is becoming increasingly popular after the opening of its airport in 2011. Going forward, domestic tourism investment is expected to continue rising in the near term owing to a robust market created by a rapidly growing middle class population, and an increase in access to affordable flights owing to the expansion of Indonesia's low-cost carrier segment.
Besides Bali, Jakarta and Lombok, Indonesia has many other untapped tourist destinations that barely have any hotels. As a result, the Ministry of Tourism is aiming at the realisation of a
better geographical diversification of tourism investment in the country. Improved accessibility and adequate tourism infrastructure are likely to be the key prerequisites to initiate tourism investment in certain areas of Indonesia, with potential investors closely monitoring the progress made by the government in this direction.
Tourism is one of the “pillars” of Indonesia's economic growth strategies. The forecast for the tourism industry over the next 10 years looks favourable with a predicted annual growth rate of over 4% that continues to be higher than growth rates estimated for other industries in the country.
Hotel Market Overview
The growth in classified hotel room supply in Indonesia, as well as in the number of classified hotels in recent years has been very impressive. Between 2009 and 2014, Indonesia witnessed the opening of 756 classified establishments with a cumulative room count of 77,170 rooms, corresponding to a CAGR of approximately 10.5% for both the number of classified establishments and the number of new rooms during the five-year period. The opening of new hotel developments surged between 2013 and 2014, with both the number of classified establishments and rooms seeing growths of approximately 12% and 14%, respectively.
Source: Badan Pusat Statistik Indonesia
CHANGE IN TOTAL ROOM SUPPLY (2009–2014)
Indonesia Hotel Watch 2015 | PAGE 11
Source: Indonesia Investment Coordinating Board
TOURISM INVESTMENTS IN INDONESIA (2010–2014)
-100
-50
0
50
100
150
200
250
0
100
200
300
400
500
600
700
800
900
1000
2010 2011 2012 2013 2014
% C
han
ge
Tota
l In
vest
me
nts
(U
S$ m
illio
n)
Foreign Direct Investments Domestic Direct Investments
% Change
0%
2%
4%
6%
8%
10%
12%
14%
16%
0
50,000
1,00,000
1,50,000
2,00,000
2,50,000
2009 2010 2011 2012 2013 2014
% C
han
ge in
Su
pp
ly (
Ro
om
s)
Tota
l Nu
mb
er
of
Ro
om
s
Total Number of Rooms % Change in Supply (Rooms)

The following tables outline the growth in the supply of classified hotels in key areas of Indonesia between 2009 and 2014, in addition to providing an overview of the emerging hot spots. Java has seen the strongest growth in terms of absolute number of rooms, with an average annual growth rate of 11.6% for the western, eastern and central Java markets combined.
The vast majority of hotel supply growth in recent years can be attributed to the development of budget and economy class hotels. The expanding middle class, growth of Indonesia's aviation industry (and subsequently increasing network), and buoyant international and domestic tourism economy, have bolstered investments in hotels and restaurants by more than 13% since 2013².
Belhotel International, and Achipelago International as well as local operators, such as Tauzia Hotel Management, Parador Hotels and Santika Indonesia Hotels.
PT Lippo Karawaci Tbk. has a pipeline of 50 planned openings across luxury, upscale and midscale brands by 2020. On the other hand, Archipelago International already operates more than 80 hotels with 12,000 rooms and is looking to reach a total of 150 properties with more than 22,000 guest rooms by 2015. In the next five years, Parador Hotels and Resorts will expand across the Indonesian archipelago with 33 new hotels in destinations such as Jakarta, Yogyakarta, Surabaya, Lombok, Tangerang, and Papua. Other local operators such as Santika Indonesia Hotels, Tauzia Hotel Management and Dafam Hotels will together add 140 new hotels by the end of 2015.
International operators are being equally aggressive. PT Carlson Panorama Hospitality (CPH), a joint venture between the Panorama Group (one of the largest Indonesian integrated groups in the hospitality business) and Carlson Rezidor Hotel Group has, since its inception in March 2013, signed five hotel management agreements targeting openings in markets such as Makassar, Batan, Lampung, Uluwatu and Cengkareng between 2015 and 2017. Moreover, the company is targeting 20 new hotels under the Radisson and Park Inn by Radisson brands over the next seven years.
Swiss-Belhotel International, which currently operates 48 hotels with three more projected to open in the third-quarter of 2015, intends to expand its presence to 97 hotels and resorts in Indonesia.
Accor, which has more than 100 hotels currently under construction in Indonesia, aims to establish a network of 200 hotels by 2020, while Premier Inn has firmly set its eyes on expanding its footprint in the midscale segment.
Best Western has also announced plans to create a portfolio of 31 hotels with over 6,000 rooms by 2015, whereas IHG is will open at least 11 more Holiday Inn Express hotels over the next five years.
Market Outlook
Indonesia's tourism sector holds great potential. The country's economic growth, coupled with a fast-growing middle class population, is resulting in an increasing demand for hotels. For the domestic market, key opportunities will be identified mainly in the midscale and upscale sector, particularly in areas boasting of strong economic growth with enhanced infrastructure and good accessibility.
While creating global awareness about Indonesia as a tourist destination in general, and for select destinations in particular (through government sponsored programs) is critical, there are other intrinsic issues that need to be dealt with prior, such as improving the tourism infrastructure and bringing the country's labour pool up to speed with the industry's growth.
In addressing Indonesia's lagging position vis-à-vis regional competitors such as Singapore, Malaysia and Thailand in terms
2 Indonesia Investment Coordinating Board Indonesia Hotel Watch 2015 | PAGE 12
Yogyakarta, Papua and Kalimantan witnessed the greatest growth in new hotel openings in the last five years. Specifically in Yogyakarta, the rising number of visitors, supported by a robust economy, is driving the rapid development of new hotels in the budget and mid-range segment proving to be very attractive for investors.
Source: Badan Pusat Statistik Indonesia
GROWTH IN CLASSIFIED HOTEL SUPPLY: FIVE LARGEST HOTEL MARKETS IN INDONESIA (2009–2014)
Source: Badan Pusat Statistik Indonesia
GROWTH IN CLASSIFIED HOTEL SUPPLY: NUMBER OF HOTELS BY AREA (2009–2014)
Moreover, in Kalimantan, the buoyant economy driven by the timber, oil and natural gas industries has sparked the need for more hotel rooms.
On the back of a surge in demand for low-cost accommodation in Indonesia, new hotel openings are being led by branded international operators such as Accor, Starwood, IHG, Swiss-
Province 2009 2010 2011 2012 2013 2014 CAGR
DKI Jakarta-rooms 26,179 27,685 28,783 30,135 32,297 35,504 6%
-establishments 153 160 162 175 185 205 6%
Bali-rooms 18,684 21,133 22,794 24,215 24,860 28,811 9%
-establishments 149 170 199 218 227 249 11%
West Java-rooms 13,719 14,201 16,732 18,643 20,894 23,005 11%
-establishments 165 174 199 208 229 253 9%
Central Java-rooms 7,002 7,031 8,736 9,756 11,572 13,917 15%
-establishments 114 119 131 139 166 186 10%
East Java-rooms 8,589 8,598 9,311 10,039 12,195 13,773 10%
-establishments 84 84 90 98 113 127 9%
Area 2009 2010 2011 2012 2013 2014 CAGR
DI Yogyakarta 34 34 42 52 61 74 17%Papua 19 21 23 30 33 40 16%Kalimantan 74 77 100 112 122 134 13%Bali 149 170 199 218 227 249 11%Sumatera 132 129 147 174 196 218 11%Sulawesi 81 95 96 104 106 130 10%Riau 83 82 105 111 121 132 10%Nusa Tenggara 46 45 52 58 65 73 10%Java 363 377 420 445 508 566 9%Banten 37 39 46 42 43 52 7%DKI Jakarta 153 160 162 175 185 205 6%
Others 66 77 97 102 111 123 13%Indonesia 1,237 1,306 1,489 1,623 1,778 1,996 10%

of the number of international arrivals, the role of destination diversification, development, as well as direct flight accessibility between key (regional) growth markets and the Indonesian archipelago are paramount in the country's quest to rise up the ranks. Existing government initiatives such as the Indonesian National Tourism Master Plan and airport infrastructure development plans are encouraging signs indicative of the new government's efforts to grow Indonesia's tourism and hotel industry.
Indonesia Hotel Watch 2015 | PAGE 13

Indonesia Hotel Watch 2015 | PAGE 14
BALI

Indonesia Hotel Watch 2015 | PAGE 15
Pro
po
sed
New
N
ort
h B
ali A
irp
ort
Bal
i

star resorts, this area is located 10 kilometres southeast of Denpasar and represents a planned luxury enclave. The area was developed in the 1980s with advice from the World Bank and includes sports centres, a golf course and a shopping centre. The area immediately south of the golf course is one of the fastest developing areas of Bali, which was earmarked for the development of large international resorts including Grand Hyatt Bali, The Westin Resort Nusa Dua, Bali and St Regis Bali Resort.
Ubud – Perched on the slopes leading towards the central mountains east of the Ayung River, the village of Ubud stands roughly 30 kilometres northwest of Denpasar, in the district of Gianyar. For more than a century, the village has been the pre-eminent centre for fine arts, dance and music, and has attracted a number of artists, backpackers and bohemians during the years. In the past 15 years, Ubud has developed into a niche deluxe hotel market, and an array of boutique hotels and exclusive villas have sprung up among the scenic rice fields surrounding Ubud. Despite the development of new hotels and visitor attractions in the area, Ubud remains one of the most interesting areas of Bali and the numerous surrounding scenic and historic sites contribute to the uniqueness of this destination.
Karangasem – Karangasem is one of the districts in the regency of Karangasem, situated in the eastern part of Bali occupying an area of approximately 840 square kilometres. Many midscale hotels and resorts are along the coastline, driving down from the main road of Jalan Raya Candidasa. The area features extraordinary variety of scenic landscapes, including low and high mountain ranges that intermingle with upland plains, tropical forests, terraced rice fields, beautiful beaches, and archaeological remains rich in culture and history with traditional 'Bali Aga' villages.
Accessibility
Ngurah Rai International Airport is the main international gateway to Bali and one of the busiest international airports in Indonesia. The airport is 13 kilometres south of Denpasar metropolitan area, approximately a 30-minute-drive south of downtown Denpasar. Ngurah Rai International Airport serves 10 domestic airlines, including Garuda Indonesia, Indonesia AirAsia and Lion Air. It also serves 37 international airlines, including KLM Royal Dutch Airlines, Hong Kong Airlines, EVA Air, Thai Airways, Singapore Airlines and Virgin Australia. Direct long-haul destinations include Amsterdam and Moscow-Sheremetyevo.
Accessibility to Bali has increased with Garuda Indonesia recently announcing the increment of three new flights weekly from Denpasar to Beijing. The airline will also offer chartered services to various Chinese cities such as Chengdu, Chong Qin, Ningbo, Kunming, Jinan, Harbin, Xian, Shenyang and Chengzhou.
Due to AirAsia's unfortunate incident with QZ8501, the ministry of transport has increased the minimum price floor of Indonesian airlines, as of 30 December 2014, with the perception that increased prices will improve safety compliance. The price floor will be set at 40% of the highest priced ticket
Bali
Overview
Located eight degrees south of the equator in the midst of the 17,508-island Indonesian archipelago, Bali measures approximately 140 by 80 kilometres and has an area of 5,620 square kilometres. Immediately east of Java, Bali is the first of the Sunda Islands.
Denpasar, the main town in Bali, is located in Badung district in the southern part of the island. As the most densely populated district, Badung is the centre of commerce and government administration. The island's economy is primarily agrarian, with farming and fishing being the most common activities. Tourism plays a considerable role in the local economy, providing a market for Balinese arts and crafts.
The main tourist attractions in Bali are its well-preserved marine environment, wildlife, beaches, water sports activities, traditional art and culture, caves and temples. Bali's main tourism centres are summarised below.
Sanur – Stretching down the southeast coast 18 kilometres northeast of Ngurah Rai International Airport, the three-kilometre-long Sanur Beach is one of Bali's oldest tourist destinations and is characterised by a high concentration of resorts and a variety of restaurants, bars and shopping centres. It is the more peaceful part of southern Bali where relaxation and enjoyment are sought after. Sanur is also a place for water sports activities as many of south Bali's water sports facilities are centred here.
Kuta – The Kuta region is located a few kilometres southwest of Denpasar. The area contains a high concentration of hotels, motels, resorts, bars, restaurants, nightclubs and shopping venues. North of Kuta, the villages of Legian and Seminyak-Kerobokan represent a quieter alternative and are characterised by a growing number of boutique hotels, villas and high-quality restaurants that stretch up the coastline towards the world-renowned Tanah Lot Temple.
Jimbaran – South of Bali's international airport, Jimbaran Bay has transformed from a fishing village into one of Bali's most exclusive destinations. The coastline between Jimbaran and the Uluwatu Temple has witnessed the development of a number of five-star deluxe resorts/ hotels such as the Four Seasons Bali at Jimbaran Bay (1993), the Ayana Resort and Spa Bali (1996), and InterContinental Bali Resort (1993).
Uluwatu – Located on the southern peninsula of the island, Uluwatu is considered one of the best surfing spots in Bali and attracts surfers from around the world. Approximately 30 minutes from the island's international airport, Uluwatu is also home to one of Bali's oldest and most sacred temples. Lodging developments such as Bulgari Bali and the Alila Villas Uluwatu are located on towering cliffs offering breathtaking views of the sea. Bukit Pandawa has been earmarked as the new integrated resort development within Uluwatu.
Nusa Dua – Comprising a collection of large four-star and five-
Indonesia Hotel Watch 2015 | PAGE 16

Tourism Market Overview
As one of Indonesia's most appealing tourist destinations, Bali's tourism arrivals have enjoyed continuous growth over the last 10 years. This period saw international arrivals at Ngurah Rai International Airport surge from approximately 1.53 million visitors in 2004 to 3.39 million visitors in 2014; a compound annual growth rate (CAGR) of 8.3% making Bali one of Indonesia's fastest growing tourism markets. The year 2013 was the first time international visitor arrivals surpassed the three million visitor mark to reach 3.24 million, and 2014 saw a further growth of 4.6%. Arrivals through March 2015 were registered at approximately 917,000 visitors, an increase of 12.3% over the same period last year, which saw approximately 816,000 visitors to Bali.
Despite the remarkable rise in international visitation, domestic arrivals in Bali often surpass international arrivals. Domestic demand in Bali encompasses both leisure and MICE demand from a variety of regions in Indonesia. In 2013, domestic arrivals at Ngurah Rai International Airport peaked at approximately 6.98 million, more than twice the number of international arrivals. In 2014, this figure had declined by 8.4% to 6.39 million domestic arrivals, as compared to 3.77 million international arrivals. The domestic arrivals market more than doubled in the five years between 2010 and 2014 at a CAGR of 8.3%.
available, which will see ticket prices increase by as much as 70% during low seasons. Analysts are skeptical of this move and fear the negative impact that this may have on tourism arrivals. The impact of this new change, however, may be cushioned by the decision of the Indonesian government to grant visa- free entry to 30 more countries as an attempt to increase arrivals from these source markets, starting in April 2015. Under the proposed exemptions, 45 countries would be free from having to pay the US$35 visa on arrival fee, which grants them a 30-day stay in Indonesia. Through the visa-free policy, the government aims to attract an additional three million tourists in 2015.
AirAsia commenced its long-haul low fare service from Melbourne to Bali starting with two flights per week on 18 March 2015, and increasing to five flights per week from 1 April 2015.
Dubai-based Emirates Airlines has announced a non-stop daily flight service from Dubai to Bali, starting from 3 June 2015, operated by Boeing 777-300ER aircraft. This is expected to positively impact Bali, providing the Middle Eastern markets convenient access to the city, and travellers to Bali from further afield, who wish to connect in Dubai.
Efforts are underway by the regional government of Bali to speed up preparations and planning for a new airport in the Buleleng Regency. The local authorities have taken steps to acquire the required land, but this is a lengthy and cumbersome process. The new airport is expected to ease the surge of air traffic capacity entering into Ngurah Rai International Airport. The site would be located 15 kilometres east of Singaraja, the capital of Buleleng Regency, and is estimated to be 3,000 hectares in size. The new airport is anticipated to have two runways and a 125-metre bridge connecting it to the mainland.
As cruise and maritime tourism is increasing in popularity in Indonesia, Bali's Benoa port is undergoing a wave of developments. New improvements planned for the port include an expansion of the current wharf, deepening of the yacht basin and renovations of the cruise terminal. These upgrades have been ongoing since 2012 and are anticipated to be completed in 2015 at a cost of US$62.2 million. Further upgrades were planned in 2014, to build a domestic passenger terminal at Benoa port, improve docking facilities and introduce a security system certified by the International Maritime Organization. Additionally, a master plan to develop Benoa into a hub port is currently pending approval from provincial authorities, Denpasar city administration and the transport ministry. Benoa is anticipated to begin operation as a hub port by 2017; according to the master plan, it will take approximately 10 months to complete facility improvements.
Moreover, the regional government of Bali has announced plans to build a toll road connecting Badung and Buleleng to improve access to the new Buleleng Airport currently in the pipeline. Development is anticipated to begin once the project opens for tender in 2016. Additionally, several existing main roads in the north are undergoing improvement works, and a ring road between Denpasar and Badung is currently in the process of development.
Indonesia Hotel Watch 2015 | PAGE 17
Source: Bali Government Tourism Office
INTERNATIONAL VISITOR ARRIVALS – NGURAH RAI INTERNATIONAL AIRPORT (2004–MAR 2015 YTD)
-15%
-10%
-5%
0%
5%
10%
15%
20%
25%
30%
35%
0
500
1,000
1,500
2,000
2,500
3,000
3,500
4,000
2004 2005 2006 2007 2008 2009 2010 2011 2012 2013 2014 Mar 2014 YTD
% C
han
ge
Inte
rnat
ion
al A
rriv
als
(Th
ou
san
ds)
Mar 2015 YTD
Interna�onal Arrivals % Change
Source: Bali Government Tourism Office
TOP SOURCE MARKETS TO BALI (2014)
26%
15%
6%6%
5%
42%
Australia
China
Malaysia
Japan
Singapore
Others

The peak period in Bali is typically from December to January, and then again in June and July; this coincides with the year-end holidays and the summer season, respectively. March through May, as well as August through October are the shoulder months. The low season in Bali is in the months of February and November.
The average length of stay for international guests in classified hotels in Bali was 3.33 days in 2014, recording a gradual decline from 3.86 days registered in 2006. Average length of stay of domestic guests increased from 3.02 days in 2006 to 3.26 days in 2014.
Hotel Performance Overview
Bali is often cited as the epicentre of Indonesian tourism on both domestic and international fronts. The main drivers for hotel demand in Bali are the flourishing international tourism market, as well as the domestic MICE and leisure segments. However, in recent times, a large influx of hotel rooms has hindered occupancy growth on the island.
Upper Luxury hotels in Bali saw occupancy drop from 61% to 60% from 2012 to 2013 owing to new supply entering this section of the market. Average room rate grew from US$540 in 2012 to US$594 in 2014. Factoring in the drop in occupancy and the increase in rate, the RevPAR for the upper luxury market in Bali increased at a rate of 6% per year between 2012 and 2014.
The upper luxury market's room rate growth is expected to moderate in 2015 and 2016 as a result of new supply entering Bali in the short-to-medium term. This applies to expected market occupancy in 2015 and 2016 as well, where forecasted occupancy levels are expected to take a hit from 2015 onwards, when several new upper luxury hotels open in Bali, especially in 2016.
Australia is historically the single largest international feeder market for Bali. In 2014, it retained its top market share at 26%, from 25% in 2013. However, Bali may see its top feeder market's share shrink in 2015. This is in view of the rupiah's continuous appreciation against the Australian dollar over last year, after it touched its lowest point in June 2014. On the other hand, there has been strong growth in demand from the emerging market of China, its market share increasing from 11.82% in 2013 to 15.57% in 2014. Among Bali's top five feeder markets in 2014, China showed the strongest growth in arrivals at 51.3%, reaching over 586,000 arrivals. This was followed closely by the traditionally strong markets of Singapore and Malaysia with 29.9% and 13.2% increase in arrivals from the year before, respectively.
Malaysia, Japan and Singapore also remained in the top five feeder markets to Bali in 2014, with Malaysia displacing Japan as the third largest. While Bali saw an increase in visitor arrivals from all three feeder markets, the share of the Japanese and Malaysian markets have fallen from 6.35% to 5.77%, and 6.08% to 5.99% respectively. Singaporean arrivals accounted for 4.77% of the market in 2014, an increase from 4.22% in 2013.
Source: Bali Government Tourism Office
SEASONALITY OF ARRIVALS TO BALI (2009–2014)
-
200
400
600
800
1,000
1,200
1,400
Jan Feb Mar Apr May Jun Jul Aug Sep Oct Nov Dec
Vis
ito
r A
rriv
als
(Th
ou
san
ds)
2009 2010 2011 2012 2013 2014
Source: Badan Pusat Statistik Bali Province
AVERAGE LENGTH OF STAY OF INTERNATIONAL AND DOMESTIC GUESTS IN CLASSIFIED HOTELS IN BALI (2006–2014)
2.00
2.50
3.00
3.50
4.00
4.50
2006 2007 2008 2009 2010 2011 2012 2013 2014
Ave
rage
Le
ngt
h o
f St
ay (
Day
s)
International Guests Domestic Guests
Indonesia Hotel Watch 2015 | PAGE 18
Source: HVS Research
UPPER LUXURY HOTEL MARKET PERFORMANCE (2012–2016F)
50%
55%
60%
65%
70%
0
100
200
300
400
500
600
700
2012 2013 2014 2015F 2016F
Occ
up
ancy
(%
)
Ave
rage
Dai
ly R
ate
& R
evP
AR
(U
S$)
Estimated Upper Luxury ADR (US$) Estimated Upper Luxury RevPAR (US$)
Estimated Upper Luxury Occupancy (%)
Source: HVS Research
GROWTH OUTLOOK FOR UPPER LUXURY HOTEL MARKET
Upper Luxury
Hotel Market
Occupancy
(%)
ADR
(US$)
RevPAR
(US$)
2015F
2016F
-1%
-3%
0%
1%
-1%
-4%

The upscale hotel market has seen growth in performance over the last three years from 2012 to 2014. Occupancy dropped slightly from 78% in 2012 to 76% in 2013, and increased back to 78% in 2014. Average rates have been increasing moderately from US$103 in 2012 to US$121 in 2014.
Going forward, Bali will witness larger amount of new supply enter the market from 2015 onwards compared to 2013 and 2014. However, demand growth is unlikely to follow suit over the next few years, and it appears inevitable that occupancy will be affected. At the upscale level, the market is expected to record occupancy of 75% in 2015 and 71% in 2016 in anticipation of a larger influx of new supply. ADR is however expected to moderately grow by about 2% in 2015 and 2016.
New Developments & Hotel Supply
The hotel supply in Bali has been increasing over the years ranging from budget positioning to the upper luxury end of the market. A fast-growing middle class population in Indonesia is also fueling demand for hotel accommodation. The rapid increase in hotel supply is not centered on a specific location in Bali, but is all across the island. Most of the growth is witnessed in high-tourist traffic areas such as Kuta, Nusa Dua, Legian and Ubud.
The wave of expansion is supported not only by international hotel management chains, but domestic chains and independent developers as well. Proposed hotels cover a wide range of service and market positioning levels.
In 2015 and 2016, the luxury and upper luxury segments are expected to see 10 new hotels with approximately 1,800 rooms being introduced into the market, with some properties scheduled to be completed 2017 onwards.
In the upscale segment, eight hotels will come into the market with a total room count of approximately 1,800 within 2015 and 2016, with many more in the following years.
Source: HVS Research
LUXURY HOTEL MARKET PERFORMANCE (2012–2016F)
0%
10%
20%
30%
40%
50%
60%
70%
80%
90%
100%
0
50
100
150
200
250
2012 2013 2014 2015F 2016F
Occ
up
ancy
(%
)
Ave
rage
Dai
ly R
ate
& R
evP
AR
(U
S$)
Estimated Luxury ADR (US$) Estimated Luxury RevPAR (US$)
Estimated Luxury Occupancy (%)
Indonesia Hotel Watch 2015 | PAGE 19
Source: HVS Research
GROWTH OUTLOOK FOR LUXURY HOTEL MARKET
Luxury Hotel
Market
Occupancy
(%)
ADR
(US$)
RevPAR
(US$)
2015F
2016F
0%
0%
2%
3%
2%
3%
Source: HVS Research
UPSCALE HOTEL MARKET PERFORMANCE (2012–2016F)
Estimated Upscale ADR (US$) Estimated Upscale RevPAR (US$)
Estimated Upscale Occupancy (%)
0%
10%
20%
30%
40%
50%
60%
70%
80%
90%
100%
0
20
40
60
80
100
120
140
2012 2013 2014 2015F 2016F
Occ
up
ancy
(%
)
Ave
rage
Dai
ly R
ate
& R
evP
AR
(U
S$)
Source: HVS Research
GROWTH OUTLOOK FOR UPSCALE HOTEL MARKET
Upscale Hotel
Market
Occupancy
(%)
ADR
(US$)
RevPAR
(US$)
2015F
2016F
-3%
-4%
2%
2% -5%
-1%
Historically, the luxury market (excluding high-end, upper luxury hotels) in Bali has fared well, with year-on-year occupancy and room rate growth until 2014.
The occupancy rate has grown moderately owing to the influx of new supply, from 69% in 2012 to 72% in 2014. Average rate grew from US$220 in 2012 to US$223 in 2013, dipping slightly in 2014 to US$213 as a result of the weakening rupiah.
It is forecasted that the RevPAR performance will grow in 2015 and 2016 due to continuous growth in ADR following new hotel product offerings in this segment. Occupancy is expected to stay flat in 2015 and 2016.

Market Outlook & Development Opportunities
Bali has long enjoyed the benefit of growing demand from domestic and regional markets across all segments. However, the continuously increasing new supply expected to enter the market across all positioning over the next few years is likely to result in subdued RevPAR growth levels in the short to mid-term. In the long term, with the continuing rise in demand, the island's hotel market is expected to recover.
As Bali's hotel market develops at such a rapid pace, the current improvements to infrastructure and the limited landing capacity of the airport may seem rather inadequate to serve the increasing demand. It is, therefore, essential that these infrastructure-related problems are reviewed regularly and addressed in order to sustain Bali's growth as a premier tourist destination.
Additionally, as land availability becomes scarcer (particularly beach front parcels in the more populated areas of the island), and as land prices soar in these areas, new hotel developments will in all probability succeed only if they offer a highly-differentiated product and experience compared to other hotels/resorts in the region.
Source: HVS Research
CHANGE IN UPPER LUXURY HOTEL SUPPLY (2012–2016F)
0%
5%
10%
15%
20%
25%
30%
35%
0
5
10
15
20
25
2012 2013 2014 2015F 2016F%
Ch
ange
in S
up
ply
(R
oo
ms)
Nu
mb
er
of
Ho
tels
Total Number of Hotels % Change in Supply (Rooms)
Source: HVS Research
CHANGE IN LUXURY HOTEL SUPPLY (2012–2016F)
0%
5%
10%
15%
20%
25%
30%
35%
0
5
10
15
20
25
2012 2013 2014 2015F 2016F
% C
han
ge in
Su
pp
ly (
Ro
om
s)
Nu
mb
er
of
Ho
tels
Total Number of Hotels % Change in Supply (Rooms)
Source: HVS Research
CHANGE IN UPSCALE HOTEL SUPPLY (2012–2016F)
0%
2%
4%
6%
8%
10%
12%
14%
0
5
10
15
20
25
30
35
40
2012 2013 2014 2015F 2016F
% C
han
ge in
Su
pp
ly (
Ro
om
s)
Nu
mb
er
of
Ho
tels
Total Number of Hotels % Change in Supply (Rooms)
Indonesia Hotel Watch 2015 | PAGE 20

JAKARTA
Indonesia Hotel Watch 2015 | PAGE 21

As an alternate solution to the expansion of SHIA, there are several additional airport projects under development in Jakarta. One of these is the proposal for another airport in East Jakarta, the Karawang International Airport, which has a large service area overlap of around 40% with that of SHIA, and is expected to aid in reducing congestion at SHIA. However, the development of Karawang International Airport has been hindered by other competing developments further east of Jakarta, which see Karawang as a potential threat in terms of catchment area. As such, the new airport has yet to receive governmental approval.
In another airport project, Lion Group, the parent company of Lion Air, has announced that they have received a construction permit for another airport to the south of Jakarta, in Lebak, Banten Province. The new Lebak airport is scheduled to break ground this year, on a 4,000-hectare site, twice the size of SHIA. Boasting four runways, the airport is envisaged to reach a capacity of 50 million passengers a year and also grow into Indonesia's largest cargo airport.
With several plans to boost the arrival capacity to Jakarta, the city is likely to face an even greater challenge in its local transport infrastructure. At present, the city sees extreme traffic congestions during peak hours and is often touted as having the worst traffic in the world. Several measures have been made to try to alleviate this situation such as the “three-in-one” rule (whereby private cars need to carry at least three passengers while travelling though certain areas) and the construction of a metropolitan rapid transit system.
The Jakarta Mass Rapid Transit (MRT), which entered administrative planning over 20 years ago, has officially commenced construction as of late 2013. Backed by a US$1 billion loan from the Japan International Cooperation Agency and US$120 million from the city, the first phase of the MRT will connect Lebak Bulus in South Jakarta to the Hotel Indonesia roundabout and is slated to open in the first quarter of 2018. However, as of May 2015, the MRT project cost has been forecasted to increase by US$40 million due to delays in land acquisition. When complete, the first phase will aim to serve over 200,000 passengers per day, dramatically reducing traffic congestions within the city centre.
Tourism Market Overview
International arrivals at SHIA have increased steadily over the last six years, growing by an average of around 10% per year from 2009 through 2014. In terms of absolute figures, international arrivals increased from 1.4 million to 2.2 million during this period. In 2014, there was stagnation in growth owing to the economic and political uncertainty surrounding the Indonesian presidential and parliamentary elections held that year. Many businesses employed a wait-and-see attitude and scaled back operations, leading to an abnormally slow growth in international arrivals of 0.3%. While March 2015 YTD arrival numbers show a 4% decline, the market is likely to rebound in the latter part of the year as businesses regain traction and investor confidence increases.
Jakarta
Overview
Serving as the capital of the Republic of Indonesia, the Special Capital Region of Jakarta, or just Jakarta as more commonly referred to, is a sprawling metropolis, home to more than 10 million people. Situated on the northern coast of West Java, Jakarta comprises of six municipalities: South, East, Central West and North Jakarta as well as the Thousand Islands. The greater urban area covers a total of 664 square kilometres, making Jakarta one of the most densely populated cities in the world.
Jakarta was first established as a Sundanese training port in the fourth century before serving as the capital of the Dutch East Indies. With a deep and rich history, the city eventually assumed the role as the hub of Indonesia's commercial, economical, cultural and political environments. Jakarta enjoys a special status as a Special Capital Region and receives increased autonomy from the central government.
The thriving economy of Jakarta is heavily supported by the service sector, predominantly in banking and finance, alongside the manufacturing and trade sector in industries such as electronics, automotive, raw materials, chemicals, mechanical engineering and health sciences. Replete with shopping malls and traditional markets, Jakarta is also one of Indonesia's shopping hubs and sees large volumes of domestic travels during the annual “Jakarta Great Sale” usually held over June and July.
Accessibility
As the primary port of entry to Indonesia, Jakarta is predominantly served by the Soekarno-Hatta International Airport (SHIA), located about 20 kilometres west of the city. While primarily used for military, private and governmental purposes, Jakarta's second airport, the Halim Perdanakusuma International Airport (HPIA), also serves several domestic air routes. A third point of entry, in the form of Tanjong Priok port, also exists to the North of Jakarta. However, the port, one of Indonesia's busiest, accounts for just a small percentage of arrivals to Jakarta.
According to the Airport Council international (ACI) Traffic Report, Soekarno-Hatta International Airport is one of the three busiest airports in the Asia Pacific region. Total passenger arrivals to SHIA have grown at a CAGR of 7% between 2010 and 2014. Foreign and domestic arrivals in 2014 were 2.2 million and 55 million, respectively.
With the airport running at overcapacity, growth has slowed in recent years, mainly due to the worsening congestion at the airport's various terminals (both for airlines and passengers). In a bid to ease traffic, SHIA's airport management company PT Angkasa Pura II is currently looking to acquire more land to the north of the airport to construct a third runway. The third runway is expected to be completed by 2017 and reach full operational capacity of 430,000 aircraft landings by 2018. Additionally, Angkasa Pura II has long term plans to add a fourth runway in 2024.
Indonesia Hotel Watch 2015 | PAGE 22

Jakarta traditionally sees Malaysia as its top feeder market and this remained unchanged in 2014, with the nation accounting for 14% of total international arrivals. The Chinese market, while experiencing a 5% decline in visitors due to an economic slowdown and increased government scrutiny of foreign investments, has still managed to retain its status as the second largest feeder market to Jakarta. Japan and Singapore also constitute a significant part of international arrivals to the city at 9% and 8% of total arrivals, respectively.
In recent times, there has been growing interest in Jakarta as a destination for Sharia tourism and investment among Middle-Eastern countries such as Saudi Arabia, which saw arrivals increase by 26% from approximately 110,000 in 2013 to 140,000 in 2014. It was the fastest growing source market in 2014, inching past South Korea to become the fifth largest source market to Jakarta.
INTERNATIONAL VISITOR ARRIVALS – SOEKARNO-HATTA INTERNATIONAL AIRPORT (2003–MAR 2015 YTD)
Source: Badan Pusat Statistik Indonesia
-10%
-5%
0%
5%
10%
15%
20%
25%
30%
35%
0
500
1,000
1,500
2,000
2,500
2003 2004 2005 2006 2007 2008 2009 2010 2011 2012 2013 2014 Mar 2014 YTD
Mar 2015 YTD
% C
han
ge
Inte
rnat
ion
al A
rriv
als
(Th
ou
san
ds)
International Arrivals % Change
Source: Badan Pusat Statistik Indonesia
TOP SOURCE MARKETS TO JAKARTA (2014)
Seasonality in Jakarta has maintained a relatively similar pattern over the past few years, with demand peaking in July and declining due to the Ramadan holidays that follow. There is a similar decline in December as business activity slows down during the holiday period. However, with the strong growth in demand from the Middle-Eastern market, we have already noticed a change in these seasonality trends, with August 2014seeing a significant increase in demand from the Middle East. We anticipate similar shifts in seasonality trends in the future.
Source: Badan Pusat Statistik Indonesia
SEASONALITY OF INTERNATIONAL ARRIVALS TO JAKARTA (2010–MAR 2015 YTD)
50
100
150
200
250
Jan Feb Mar Apr May Jun Jul Aug Sep Oct Nov Dec
Inte
rnat
ion
al A
rriv
als
(Th
ou
san
ds)
2010 2011 2012 2013 2014 Mar 2015 YTD
The average length of stay for international guests in classified hotels in Jakarta was 2.4 days in 2013, a slight drop from an average length of stay of 2.6 days in 2012. Average length of stay amongst international visitors sees strong fluctuation, often tied to the economic and political environment in Indonesia.
Unlike international visitors, the average length of stay for domestic travellers is relatively consistent, ranging from 1.8 to 2.0 days in the last eight years from 2006 to 2013. This is unlikely to change in the short term.
Source: Badan Pusat Statistik D.I. Jakarta
AVERAGE LENGTH OF STAY OF INTERNATIONAL AND DOMESTIC GUESTS IN CLASSIFIED HOTELS IN JAKARTA (2006–2013)
1.0
1.5
2.0
2.5
3.0
3.5
2006 2007 2008 2009 2010 2011 2012 2013
Ave
rage
Le
ngt
h o
f St
ay (
Day
s)
International Guests Domestic Guests
Hotel Performance Overview
As the commercial, financial and governmental capital of Indonesia, Jakarta has long seen healthy demand for hotel rooms. In 2013, the luxury segment fared well and saw an increase in ADR of approximately 4%. However, there was a slight dip in occupancy with the opening of the 140-room Keraton as well as the implementation, by several hotels, of aggressive rate growth strategies at the expense of hotel occupancy. As a result, while the average rate increased, the marketwide RevPAR remained stable in 2013 as compared to 2012.
Indonesia Hotel Watch 2015 | PAGE 23
14%
10%
9%
8%
6%
53%
Malaysia
China
Japan
Singapore
Saudi Arabia
Others

However, in the last year, the market has seen a decline in demand, a direct result of the economic and political uncertainty surrounding the outcome of the 2014 presidential elections. Luxury hotel performance therefore declined significantly in 2014. Marketwide average rate declined by roundly 2% as hotels dropped rates in an attempt to be more competitive and increase occupancy levels. Despite these efforts, low demand levels saw marketwide occupancy fall by almost three percentage points resulting in an overall decline of 5% in marketwide RevPAR.
Looking forward, with the conclusion of the elections and investor confidence returning to Indonesia, the short-term outlook remains positive with hotel demand slated to increase. Additionally, the closure of the Four Seasons Jakarta for extensive renovations will see its demand base being absorbed by other hotels in the luxury market. As such, occupancy levels and average rates are likely to exhibit healthy growth in 2015, with RevPAR growth estimated to be in the 7% range for the year.
The luxury market, however, will face some challenges in terms of the sheer amount of new supply entering the market particularly in and around the Jalan Jenderel Sudirman and the Central Business District. Considering the new supply and projected demand growth for Jakarta, we anticipate that occupancy levels will decrease slightly in 2016 while ADR will show little to no growth.
Historically, the upscale hotel market has performed well, demonstrating strong RevPAR growth of 5% from 2012 to 2013 fuelled by a 3% growth in ADR and a jump in occupancy of 2%.
Source: HVS Research
LUXURY HOTEL MARKET PERFORMANCE (2012–2016F)
50%
55%
60%
65%
70%
75%
80%
100
120
140
160
180
200
220
240
2012 2013 2014 2015F 2016F
Occ
up
ancy
(%
)
Ave
rage
Dai
ly R
ate
& R
evP
AR
(U
S$)
Estimated Luxury ADR (US$) Estimated Luxury RevPAR (US$)
Estimated Luxury Occupancy (%)
New Developments & Hotel Supply
In the foreseeable future, Jakarta is set to see a huge wave of new supply entering the market that has never been witnessed before. At the regionally and internationally branded levels, approximately 12,000 rooms are poised to open in the next five years, from 2015 through to 2020.
New hotel supply is relatively evenly split between luxury and upscale, and midscale and budget. The luxury and upscale segment is expecting 6,000 new rooms, or 52% of total new supply, which translates to an average of 252 rooms across 24 new hotels. A host of international hotel companies are represented, and included in this list are Accor, Alila, Ascott, Hilton, InterContinental, Langham, Marriott, MGM, Regent, Rosewood and Starwood. The Four Seasons is expected to reopen in 2018 following extensive renovations.
Source: HVS Research
UPSCALE HOTEL MARKET PERFORMANCE (2012–2016F)
50%
55%
60%
65%
70%
75%
80%
60
70
80
90
100
110
120
130
140
150
2012 2013 2014 2015F 2016F
Occ
up
ancy
(%
)
Ave
rage
Dai
ly R
ate
& R
evP
AR
(U
S$)
Estimated Upscale ADR (US$) Estimated Upscale RevPAR (US$)
Estimated Upscale Occupancy (%)
Indonesia Hotel Watch 2015 | PAGE 24
Source: HVS Research
GROWTH OUTLOOK FOR LUXURY HOTEL MARKET
Luxury Hotel
Market
Occupancy
(%)
ADR
(US$)
RevPAR
(US$)
2015F
2016F
3%
-2%
3%
1%
7%
-1%
Upscale Hotel
Market
Occupancy
(%)
ADR
(US$)
RevPAR
(US$)
2015F
2016F
1%
0%
2%
2%
4%
2%
Source: HVS Research
GROWTH OUTLOOK FOR UPSCALE HOTEL MARKET
However, the 2014 elections had the same effect on the upscale hotel market performance as it did on the luxury hotel market, with declines in both occupancy and average rate. As a result, RevPAR decreased by close to 4% in 2014 as compared to 2013.
It is expected that with the city's aggressive supply pipeline in the upscale segment, marketwide RevPAR will remain under pressure in 2015 and 2016. Occupancy is expected to show minimal increases in 2015 and remain stagnant in 2016. On the other hand, average rate for this category is expected to increase by 2% annually in 2015 and 2016.

At the midscale and budget level, 25 hotels equating to 5,500 rooms are anticipated to open between 2015 and 2017. A large majority of the new midscale and budget supply consists of multiple hotels under the same brands, such as Holiday Inn and Holiday Inn Express (Five hotels), Ibis and Ibis Styles (Seven hotels), Premier Inn (Two hotels), Swiss-Belhotel (Three hotels), YELLO (Three hotels) and Zest (Three hotels).
the MRT project is a step in the right direction, the question of whether this is sufficient has to be raised. Should these issues be resolved, Jakarta has the potential to become one of the region's prime hotel markets.
The total classified room supply is expected to increase from 35,500 rooms in 2014 to 40,000 rooms in 2015, a 12% increase. The year 2016 will see a similar 11% increase in supply. A majority of the total proposed supply will enter the market in 2015 and 2016, with these years accounting for 38% and 36% of total new supply, respectively. 2017 will see another 9% of total new supply while 2018 and beyond will see the entry of the remaining 17%.
Market Outlook & Development Opportunities
Jakarta, over the next several years, is expected to see a surge in new hotel developments. As the Indonesian economy improves, hotel demand is expected to remain strong. However, the sheer volume of new supply is expected to negatively impact occupancy and average rate performance in the short term. In the long term, the market should be able to support such a strong increase in the number of rooms. However, in order to get there, several key infrastructural issues must be addressed.
The airport system, for one, needs to be overhauled. SHIA is already running at near full capacity and the immediate proximity of the airport is often overwhelmed with passenger cars and buses trying to reach the facility. While there are other airports under development or consideration, which will help to alleviate the congestion at SHIA, proper procedures must be executed to allow these new airports to meet their intended purpose.
Additionally, given Jakarta's severe road congestions and strained public transport network, key advancements in infrastructure and transport policy will need to be made. While
Source: HVS Research
CHANGE IN MARKETWIDE HOTEL SUPPLY (2011–2016F)
0%
2%
4%
6%
8%
10%
12%
14%
16%
0
50
100
150
200
250
300
2011 2012 2013 2014 2015F 2016F
% C
han
ge in
Su
pp
ly (
Ro
om
s)
Nu
mb
er
of
Ho
tels
Total Number of Hotels % Change in Supply (Rooms)
Indonesia Hotel Watch 2015 | PAGE 25

SURABAYA
Indonesia Hotel Watch 2015 | PAGE 26
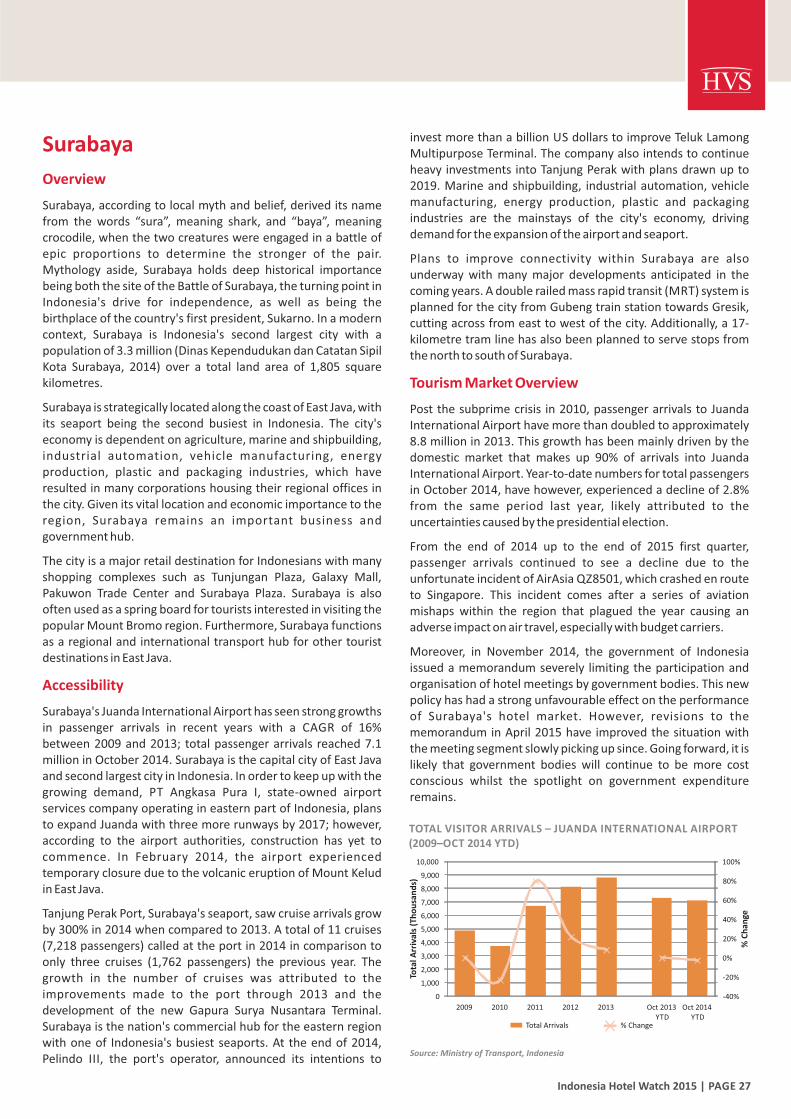
Indonesia Hotel Watch 2015 | PAGE 27
Surabaya
Overview
Surabaya, according to local myth and belief, derived its name from the words “sura”, meaning shark, and “baya”, meaning crocodile, when the two creatures were engaged in a battle of epic proportions to determine the stronger of the pair. Mythology aside, Surabaya holds deep historical importance being both the site of the Battle of Surabaya, the turning point in Indonesia's drive for independence, as well as being the birthplace of the country's first president, Sukarno. In a modern context, Surabaya is Indonesia's second largest city with a population of 3.3 million (Dinas Kependudukan dan Catatan Sipil Kota Surabaya, 2014) over a total land area of 1,805 square kilometres.
Surabaya is strategically located along the coast of East Java, with its seaport being the second busiest in Indonesia. The city's economy is dependent on agriculture, marine and shipbuilding, industrial automation, vehicle manufacturing, energy production, plastic and packaging industries, which have resulted in many corporations housing their regional offices in the city. Given its vital location and economic importance to the region, Surabaya remains an important business and government hub.
The city is a major retail destination for Indonesians with many shopping complexes such as Tunjungan Plaza, Galaxy Mall, Pakuwon Trade Center and Surabaya Plaza. Surabaya is also often used as a spring board for tourists interested in visiting the popular Mount Bromo region. Furthermore, Surabaya functions as a regional and international transport hub for other tourist destinations in East Java.
Accessibility
Surabaya's Juanda International Airport has seen strong growths in passenger arrivals in recent years with a CAGR of 16% between 2009 and 2013; total passenger arrivals reached 7.1 million in October 2014. Surabaya is the capital city of East Java and second largest city in Indonesia. In order to keep up with the growing demand, PT Angkasa Pura I, state-owned airport services company operating in eastern part of Indonesia, plans to expand Juanda with three more runways by 2017; however, according to the airport authorities, construction has yet to commence. In February 2014, the airport experienced temporary closure due to the volcanic eruption of Mount Kelud in East Java.
Tanjung Perak Port, Surabaya's seaport, saw cruise arrivals grow by 300% in 2014 when compared to 2013. A total of 11 cruises (7,218 passengers) called at the port in 2014 in comparison to only three cruises (1,762 passengers) the previous year. The growth in the number of cruises was attributed to the improvements made to the port through 2013 and the development of the new Gapura Surya Nusantara Terminal. Surabaya is the nation's commercial hub for the eastern region with one of Indonesia's busiest seaports. At the end of 2014, Pelindo III, the port's operator, announced its intentions to
invest more than a billion US dollars to improve Teluk Lamong Multipurpose Terminal. The company also intends to continue heavy investments into Tanjung Perak with plans drawn up to 2019. Marine and shipbuilding, industrial automation, vehicle manufacturing, energy production, plastic and packaging industries are the mainstays of the city's economy, driving demand for the expansion of the airport and seaport.
Plans to improve connectivity within Surabaya are also underway with many major developments anticipated in the coming years. A double railed mass rapid transit (MRT) system is planned for the city from Gubeng train station towards Gresik, cutting across from east to west of the city. Additionally, a 17-kilometre tram line has also been planned to serve stops from the north to south of Surabaya.
Tourism Market Overview
Post the subprime crisis in 2010, passenger arrivals to Juanda International Airport have more than doubled to approximately 8.8 million in 2013. This growth has been mainly driven by the domestic market that makes up 90% of arrivals into Juanda International Airport. Year-to-date numbers for total passengers in October 2014, have however, experienced a decline of 2.8% from the same period last year, likely attributed to the uncertainties caused by the presidential election.
From the end of 2014 up to the end of 2015 first quarter, passenger arrivals continued to see a decline due to the unfortunate incident of AirAsia QZ8501, which crashed en route to Singapore. This incident comes after a series of aviation mishaps within the region that plagued the year causing an adverse impact on air travel, especially with budget carriers.
Moreover, in November 2014, the government of Indonesia issued a memorandum severely limiting the participation and organisation of hotel meetings by government bodies. This new policy has had a strong unfavourable effect on the performance of Surabaya's hotel market. However, revisions to the memorandum in April 2015 have improved the situation with the meeting segment slowly picking up since. Going forward, it is likely that government bodies will continue to be more cost conscious whilst the spotlight on government expenditure remains.
Source: Ministry of Transport, Indonesia
TOTAL VISITOR ARRIVALS – JUANDA INTERNATIONAL AIRPORT (2009–OCT 2014 YTD)
Total Arrivals % Change
-40%
-20%
0%
20%
40%
60%
80%
100%
0
1,000
2,000
3,000
4,000
5,000
6,000
7,000
8,000
9,000
10,000
2009 2010 2011 2012 2013 Oct 2013 YTD
Oct 2014 YTD
% C
han
ge
Tota
l Arr
ival
s (T
ho
usa
nd
s)

The domestic market accounts for 90% of arrivals to Juanda International Airport; most of these arrivals originate from Jakarta. Surabaya is also a domestic leisure destination for its surrounding cities during weekends and public holidays, with tourists arriving mainly for its retail offerings.
Source countries for international arrivals to Juanda International Airport are mostly from the Asia Pacific region. Malaysia (31%) and Singapore (15%) make up the largest segments of inbound travellers, driven by the availability of direct air connections across several carriers. China (9%), Taiwan (7%) and Japan (4%) are the other top feeder markets, contributing a sizeable proportion of the airport arrivals to Surabaya.
The average length of stay of international guests in classified hotels in East Java was 2.93 days in 2014, recording an increase from 2.74 days registered in 2011. The average length of stay of domestic guests increased from 1.79 days in 2011 to 1.84 days in 2014. The increase in the average length of stay could be indicative of the region's increasing appeal as a leisure destination.
Hotel Performance Overview
Surabaya's hotel market is generally driven by individual business and corporate demand during weekdays. Additionally, the city is often visited as a transit hub to leisure destinations in East Java such as Mount Bromo, Malang and Batu, among others. Visitation to Surabaya peaks on weekends when leisure demand arises from cities in East Java mainly for shopping. Moreover, rapidly improving infrastructure, facilities and economic growth have aided the establishment of Surabaya's MICE market in recent years.
In the upscale and luxury segment, occupancy hovered around 66% to 67% between 2011 and 2013, subsequently declining in 2014 to 63% primarily owing to events such as the presidential election, government's MICE policy, Mount Kelud eruption, and the AirAsia accident. In contrast, the ADR performance of this segment was commendable, growing at a healthy pace from IDR665,000 in 2012 to IDR720,000 in 2014.
Going forward, we expect the segment wide RevPAR performance to decline slightly in 2015 and 2016, owing to the opening of various new hotels. Although the government's MICE policy has been recently reviewed to allow selective events to take place in prescribed hotels, the market remains cautious. Considering the above and the challenges in the beginning of 2015, where a travel warning was issued especially for travellers from the USA and Australia, it is expected that the occupancy for 2015 and 2016 will decrease by 3% and 2%, respectively. Meanwhile, ADR is anticipated to continue rising, although at a relatively moderate pace, owing to hotels pricing the rooms competitively to attract more guests. It is expected that the segment's ADR will grow by 3% and 5% in 2015 and 2016, respectively.
Surabaya does not have a distinct seasonality with pronounced peaks and troughs. Arrivals to Surabaya, however, tend to increase towards the latter half of the year. This increase in arrivals is mainly driven by the demand during year-end school holidays in Indonesia, Malaysia and Singapore. Though data for the months of November and December 2014 have yet to be released, it is expected that the first quarter of 2015 will see a steep decline in arrivals mainly due to the recent aviation mishaps in the region.
Source: Ministry of Transport, Indonesia
SEASONALITY OF ARRIVALS TO SURABAYA (2011–OCT 2014 YTD)
400
450
500
550
600
650
700
750
800
850
Jan Feb Mar Apr May Jun Jul Aug Sep Oct Nov Dec
Vis
ito
r A
rriv
als
(Th
ou
san
ds)
2011 2012 2013 2014
Source: HVS Research Indonesia Hotel Watch 2015 | PAGE 28
Source: Badan Pusat Statistik East Java
TOP SOURCE MARKETS TO SURABAYA (2014)
31%
15%
9%7%
4%
34%
Malaysia
Singapore
China
Taiwan
Japan
Others
UPSCALE AND LUXURY HOTEL MARKET PERFORMANCE (2012–2016F)
40%
45%
50%
55%
60%
65%
70%
75%
80%
0
1,00,000
2,00,000
3,00,000
4,00,000
5,00,000
6,00,000
7,00,000
8,00,000
9,00,000
2012 2013 2014 2015F 2016F
Occ
up
ancy
(%
)
Ave
rage
Dai
ly R
ate
& R
evP
AR
(ID
R)
Estimated Upscale and Luxury ADR (IDR) Estimated Upscale and Luxury RevPAR (IDR)
Estimated Upscale and Luxury Occupancy (%)

New Developments & Hotel Supply
The total number of rooms in Surabaya has grown by 30% from 6,383 rooms in 2011 to an estimated 8,257 rooms in 2014. The majority of properties fall within the Bed and Breakfast and Economy category of accommodations. This segment makes up approximately 65% of all properties and 41% of all rooms in the market. The midscale segment makes up 21% of all properties and 31% of all rooms, whilst the upscale segment makes up 11% of all properties and 22% of all rooms. Luxury hotels within the city, however, are limited, making up the remaining 3% of properties and 6% of rooms. Currently, there are only a few existing internationally branded properties in the city with a total count of 11 hotels.
continue to result in increased demand for accommodation. The hotel development opportunities in Surabaya in the short- to mid-term will most likely be identified in the budget to midscale sectors, and to a lesser extent, the upscale market. Despite the presence of international five-star hotel brands in the city, opportunities for luxury hotels will remain limited as long as rate levels in the market are growing marginally.
The market also anticipates that more leisure attractions within Surabaya will help grow its leisure segment in addition to its corporate and business segments.
A temporary demand and supply imbalance could occur when the proposed supply hits the market. However, due to the city's i m p r e s s i v e d e m a n d g ro w t h fo r b u d g e t / m i d s c a l e accommodation, such imbalances are expected to iron out in the mid-term.
Source: Badan Pusat Statistik Surabaya, HVS Research
CHANGE IN MARKETWIDE HOTEL SUPPLY (2011–2016F)
0%
2%
4%
6%
8%
10%
12%
14%
16%
0
20
40
60
80
100
120
140
160
2011 2012 2013 2014 2015F 2016F
% C
han
ge in
Su
pp
ly (
Ro
om
s)
Nu
mb
er
of
Ho
tels
Total Number of Hotels % Change in Supply (Rooms)
There are currently 34 properties anticipated to enter Surabaya between now and 2017. The majority of these are expected to open by 2015; however, it is unlikely that all of them will open in time, with many experiencing delays. The potential risk of oversupply is a looming concern within the market.
Market Outlook & Development Opportunities
The acceleration of Surabaya's economic growth, mostly due to the rapidly expanding industrial and business sectors, is set to transform the city's hotel landscape in the near future. Improved connectivity via the airport, ports and major highways will
Indonesia Hotel Watch 2015 | PAGE 29
Source: HVS Research
GROWTH OUTLOOK FOR UPSCALE AND LUXURY HOTEL MARKET
Upscale and
Luxury Hotel
Market
Occupancy
(%)
ADR
(IDR)
RevPAR
(IDR)
2015F
2016F
3%
5%
-3%
-2%
-2%
2%

Indonesia Hotel Watch 2015 | PAGE 30
BINTAN

Indonesia Hotel Watch 2015 | PAGE 31
Bintan
Overview
Bintan is part of the Riau Islands' province of Indonesia. Located approximately 48 kilometres southeast of Singapore, it is the largest of 3,200 islands in the Riau Archipelago. Batam Island and Sumatra lie to the west and further west, respectively. The capital of Bintan, Tanjung Pinang, is situated on the southwestern shore of the island. Bintan has a population of around 300,000 inhabitants.
Bintan experiences warm and sunny weather all year round with day temperatures ranging between 23°C and 32°C. Humidity levels on this island fall between 61% and 96%. However, due to its direct exposure to the South China Sea, Bintan gets cooler during the monsoon months between October and March, when there is more rainfall and stronger winds.
Bintan, along with Batam Island, is under the 1989 Sijori Growth Triangle agreement between Singapore, Johor of Malaysia and Riau of Indonesia. As part of the agreement Singapore would provide expertise, infrastructure and capital to complement the natural and labour resources of the other two countries, with an aim to create a development attractive to international and regional investors. A special tax-free economic zone was created in Bintan to facilitate growth, namely the Bintan Industrial Estate (BIE) in the Lomban region. This subsequently resulted in Bintan being transformed into a vibrant industrial hinterland for Singapore and an attractive special investment zone to global industrial companies, which generated employment for thousands residing in the region. Singapore signed another agreement with Indonesia to lease 23,000 hectares of the northern region of the island for development of leisure resorts and facilities for Singaporeans. Thus today, Bintan consists of three main areas, the Bintan Beach International Resort (BBIR) region, the BIE region, and its capital, Tanjung Pinang. These tourism and industrial areas are the main drivers of Bintan's economy.
Accessibility
Raja Haji Fisabilillah Airport, located approximately nine kilometres east of Tanjung Pinang City, is currently the only operational airport on the island of Bintan. The airport serves a domestic network of three local airlines including Lion Air, Sriwijaya Air, and the national carrier, Garuda Indonesia, which connects Bintan to Jakarta. Raja Haji Fisabilillah Airport is currently undergoing expansion works for a new international terminal.
Between 2009 and 2013, Raja Haji Fisabilillah Airport recorded a compound annual growth rate of 11.1% in total passenger movements. Passenger traffic peaked at 291,400 in 2012 before declining 17.7% in 2013 to 239,900.
The new Bintan Airport is a development project located in Lobam, proximate to the Industrial Estate and Free trade Zone, and approximately 5.7 kilometres southwest of the new Lagoi Bay Resort development in the north of Bintan. The new airport
is at an estimated driving distance of 30 minutes from Lagoi Bay area and is expected to replace the current airport.
Construction of the airport is currently underway, and the project's first phase will include the development of a runway and a terminal. It has been projected that the airport will be operational by 2016 with a 3,000-metre runway and a capacity to accommodate 3.5 million passengers annually. Owing to the undeveloped land area surrounding the site, the new Bintan Airport can be further expanded into a multi-terminal international airport with additional runways.
The new airport development project is a partnership between Garuda Indonesia and Gallant Venture Limited, who will jointly develop the airport as the national carrier's new hub. Upon its completion, Bintan Airport holds the potential to connect East and West Indonesia, and become a meeting point for Garuda's international flights to Europe and the Far East, hence improving the island's outbound and inbound connectivity. With access being vital to stimulate tourism demand, the completed airport is expected to drive demand to the Lagoi Bay resort developments and further promote Bintan as an international tourism destination.
The daily ferry from Singapore is currently the main mode of transport for visitors to Bintan. Total annual visitor arrivals to Bintan Bandar Telani Ferry Terminal have been flat in the last five years, showing little change, from approximately 314,000 in 2010 to nearly 321,000 in 2014. Year-to-date arrivals have seen a 7.7% decline from 53,901 in February 2014 to 49,730 in February 2015. Annual visitor arrivals at Bintan Bandar Telani Ferry Terminal are seasonal, peaking between the months of June and August, as well as in December. A flat trend in arrivals to Bintan in the past years is likely due to the fact that the island has not seen much change in terms of hotel supply and new attractions, whereas the recent decline likely correlates to the decline in visitation from Singapore and the overall slowdown in international arrivals to Indonesia.
Tourism Market Overview
Despite being one of Indonesia's developing tourist destinations, Bintan's total visitor arrivals have experienced fluctuations over the past five years. Total visitor arrivals were estimated based on tourist arrivals at three of Bintan's major ports of entry – Bandar Bentan Telani terminal, Tanjung Pinang terminal and Raja Haji Fasibilillah Airport. Total visitor arrivals grew from approximately 575,000 in 2010 to 675,000 and 732,000 in 2011 and 2012 respectively, before eventually dropping in 2013 to 658,000, translating into a compound annual growth rate of 4.6%.
In 2011 the Indonesian government launched its 'Wonderful Indonesia' campaign, which aimed to increase Indonesia's presence on the international tourism stage. The concept placed emphasis on Indonesia's unique and ‘wonderful’ aspects of nature, culture, people, cuisine and value for money. The campaign was successful in growing Indonesia's visibility in non-traditional feeder markets such as China, South Korea, and Japan. This international marketing movement led to a boost in

international tourism demand for Bintan. As a result, total visitor arrivals increased 17.4%, from approximately 575,000 in 2010 to 675,000 in 2011. In 2012, Bintan yet again recorded growth in visitor arrivals, albeit at a slower rate of 8.4% to peak at 732,000.
Following 2012, Bintan experienced a year of decline in which total visitor arrivals decreased 10.1% to 658,000 in 2013. This decline is mainly attributed to a fall in tourist arrivals from all of Bintan's traditional source markets, apart from China.
A similar decline in visitor arrivals is also observed in other key source markets including Japan, South Korea, India, United Kingdom, Malaysia, Australia, Philippines and Hong Kong over the last three years. China, Bintan's second largest source market, is the only country that has recorded an increase in visitor arrivals from 38,914 in 2012 to 65,602 in 2014, growing at a compound annual rate of 19.2%. The increasing visitor arrivals from China offsets the decline in other key sources markets; consequently, Bintan has experienced only a slight decrease in overall annual international visitor arrivals, from 336,547 in 2012 to 320,861 in 2014, a negative compound annual growth rate of 1.6%.
Seasonality in Bintan follows a typical resort demand pattern dictated by public holidays, school holidays and other periods of high leisure demand. For Bintan these are closely related to Singapore's public and school holidays, due to proximity of the two islands. Bintan is the closest 'long weekend getaway' destination from Singapore. The market, therefore, has a pronounced weekend/weekday demand pattern, mainly because of tourists coming in from Singapore for the weekends.
Source: Badan Pusat Statistik Indonesia*excluding airport arrivals
TOTAL VISITOR ARRIVALS – TANJUNG PINANG, BANDAR BENTAN TELANI AND RAJA HAJI FISABILILLAH AIRPORT (2010–FEB 2015 YTD)
-40%
-30%
-20%
-10%
0%
10%
20%
30%
0
100
200
300
400
500
600
700
800
2010 2011 2012 2013 2014* Feb 2014 YTD
Feb 2015 YTD
% C
han
ge
Toal
Arr
ival
s (T
ho
usa
nd
s)
Total Arrivals % Change
Our research shows that the primary source countries for visitation to Bintan are Singapore, China, Japan, South Korea, India, United Kingdom, Malaysia, Australia, Philippines and Hong Kong. However, it is to be noted that the official visitor statistics are recorded based on the passport country, and not the country of residence. Consequently, foreign residents of Singapore who vacation in Bintan are classified based on their home country and not Singapore, despite being either temporarily or permanently housed there, thus skewing the statistics on key feeder markets.
We note that visitor arrivals to Bintan in the initial years (before 2012) were mainly made up of Singaporeans as well as residents of Singapore. However, arrivals from the top source market have since declined, falling from 98,274 in 2012 to 84,075 in 2014, recording a negative compound annual growth rate of 5.1%.
20
25
30
35
40
45
50
Jan Feb Mar Apr May Jun Jul Aug Sep Oct Nov Dec
Inte
rnat
ion
al A
rriv
als
(Th
ou
san
ds)
2010 2011 2012 2013 2014 Feb 2015 YTD
Source: Badan Pusat Statistik Indonesia
SEASONALITY OF INTERNATIONAL ARRIVALS TO BINTAN (2010–FEB 2015 YTD)
Being a developing tourism destination with growing international awareness, Bintan enjoys leisure visitations all year round. However, in general, peak periods for Bintan are between June and August, and December is the busiest month. The peak season is dominated by high-spending holidaymakers from Singapore, China, Japan and South Korea. The months of April and May, and September through November represent the off-peak season, while January through March are the shoulder months for Bintan. Tourism demand during the shoulder months is driven mainly by the Chinese festive holiday of Lunar Year (which occurred in February in 2013 and in January in 2014). With 10 days of festive holidays, Chinese travellers are predominant in Bintan during this period as it is a popular stop-over on travel itineraries to Southeast Asia.
Indonesia Hotel Watch 2015 | PAGE 32
Source: Badan Pusat Statistik Riau
TOP SOURCE MARKETS TO RIAU (2014)
26%
20%
6%6%
6%
36%
Singapore
China
Japan
South Korea
India
Others

Hotel Performance Overview
Resorts and hotels in Bintan are mostly located at the north side of the island, widely known as Lagoi area, while the others are situated at Tanjung Pinang or Trikora Beach. In recent times, Lagoi area has been continuously growing in terms of supply to accommodate the increasing interest and popularity of Bintan as a tourist destination.
Bintan in general witnessed steady growth in terms of occupancy and average rate until 2011. Then in 2012, Bintan resorts and hotels, overall, experienced a modest growth in average rate (4%) and RevPAR (2%), whereas in 2013, they recorded a decline in RevPAR (2%) due to lower occupancy stemming from decreasing number of arrivals.
The performance of Bintan resorts and hotels in 2014 is as outlined below. Going forward, Bintan's hotel market is anticipated to be favourable as a result of the expected opening of the new international airport, extensive proposed resort developments and the strong marketing effort to promote the island.
Bintan will witness a large amount of new supply expected to enter the market from 2015 onwards. However, in the first few years, demand growth is unlikely to follow suit, and it appears inevitable that occupancy growth will be adversely affected. As the market stabilises, Bintan is anticipated to experience an eventual healthy growth in both occupancy and average rate.
The luxury hotel market in Bintan saw an additional 30 keys from the Sanchaya, comprising suites and villas, at the end of 2014.
Between 2011 and 2014, the luxury segment in Bintan witnessed a decline in terms of occupancy largely due to a decrease in the number of overall visitor arrivals to the island. In contrast, average rate of this segment was maintained at around S$240 during the same period.
In the upcoming years, owing to the island's supply pipeline in the luxury segment, RevPAR performance is expected to come under pressure in 2015 and 2016. Occupancy is expected to decline by 2% in 2015 and by 4% in 2016. Meanwhile, average rate for this category is expected to continue to stay flat in 2015 and marginally grow in 2016.
With the completion of the new airport and given the anticipated increase in tourist arrivals from source markets beyond the neighbouring Singapore, the market is expected to grow towards healthier occupancy and average rate 2017 onwards.
The upscale hotel market has seen a similar trend in performance over the last four years, from 2011 to 2014. Occupancy dropped from approximately 54% in 2011 to 50% in 2014, while average daily rates went up in 2012 before declining in 2013 and 2014. The slight decline in occupancy was a result of the fact that Bintan has been stagnant in the past few years in terms of tourist attractions and hotel supply.
With strong additional supply anticipated to enter this segment, marketwide occupancy is expected to fall sharply to 42% in 2015
and 38% in 2016. Thereafter, the full operation of the new airport in a few years might change the direction of where the market would go in terms of occupancy. Particularly, we expect the MICE and Group segments to drive up the performance of the upscale hotel market. Meanwhile the average rate is projected to experience moderate growth during this period, largely following the introduction of newer brands and products in Bintan's hotel market.
Estimated Luxury ADR (S$) Estimated Luxury RevPAR (S$)
Estimated Luxury Occupancy (%)
40%
45%
50%
55%
60%
65%
70%
0
50
100
150
200
250
300
2011 2012 2013 2014 2015F 2016F
Occ
up
ancy
(%
)
Ave
rage
Dai
ly R
ate
& R
evP
AR
(S$
)
Source: HVS Research
LUXURY HOTEL MARKET PERFORMANCE (2011–2016F)
Indonesia Hotel Watch 2015 | PAGE 33
Source: HVS Research
GROWTH OUTLOOK FOR LUXURY HOTEL MARKET
0%
0.5%
-4%
-8%
-2%
-4%
Luxury Hotel
Market
Occupancy
(%)
ADR
(S$)
RevPAR
2015F
2016F
(S$)
Source: HVS Research
UPSCALE HOTEL MARKET PERFORMANCE (2011–2016F)
0%
5%
10%
15%
20%
25%
30%
35%
40%
45%
50%
55%
60%
0
50
100
150
200
250
2011 2012 2013 2014 2015F 2016F
Occ
up
ancy
(%
)
Ave
rage
Dai
ly R
ate
& R
evP
AR
(S$
)
Estimated Upscale ADR (S$) Estimated Uspcale RevPAR (S$)
Estimated Upscale Occupancy (%)

The midscale hotel market has seen more or less a flat performance over the last three years. Occupancy dropped from 62% in 2012 to 58% in 2013 before recovering slightly to 60% in 2014, whereas average rate remained flat at S$112 in 2012 and 2013, rising to S$116 in 2014. The relative stability of occupancy and average rate reflected the stagnant supply in this market.
Considering that the additional supply in Bintan is anticipated to primarily enter the luxury and upscale segments, the growth outlook of the midscale hotel market is expected to be rather flat. In 2015, we estimate the occupancy to grow slightly by 0.3% in view of Bintan being promoted heavily through the anticipated openings of developments around Lagoi Bay estate. This growth is likely to continue in 2016 (by 1%) considering the increasing popularity of Bintan. Consequently, the midscale segment is also expected to maintain its average rate over the next two years. Beyond that, the overall hotel market in Bintan will be more concentrated towards luxury and upscale segments, in line with the hotel and resort pipeline that will be completed within the next two to three years.
New Developments & Hotel Supply
Resorts and hotels in Bintan are generally concentrated in three locations: Lagoi (around 1,600 rooms), Tanjung Pinang (around 1,100 rooms) and Trikora Beach (around 400 rooms). Most internationally branded and more established hotels and resorts are located in Lagoi area.
Hotel room supply in Bintan is expected to increase significantly with a number of hotels opening in 2015, 2016 and 2017. In 2011, there were a total of 10 star-rated hotels on the northern side of the island, which is in the Special Economic Zone, where most of the resort hotels are located. The number has remained the same until the opening of the Sanchaya in late 2014 and the Swiss-Belhotel in June 2015. Along with these two hotels, the Lagoi Bay area and Treasure Bay are expecting approximately 1,300 new rooms by 2017. The rapid increase in hotel supply will not be just centered around the northern side of the island, but also cover the Trikora Beach area towards the northeast, outside the Special Economic Zone.
Source: HVS Research
MIDSCALE HOTEL MARKET PERFORMANCE (2012–2016F)
50%
55%
60%
65%
70%
75%
80%
0
20
40
60
80
100
120
140
2012 2013 2014 2015F 2016F
Occ
up
ancy
(%
)
Ave
rage
Dai
ly R
ate
& R
evP
AR
(S$
)
Estimated Midscale ADR (S$) Estimated Midscale RevPAR (S$)
Estimated Midscale Occupancy (%)
Source: HVS Research
Source: HVS Research
CHANGE IN MARKETWIDE HOTEL SUPPLY (2011–2016F)
-5%
0%
5%
10%
15%
20%
25%
30%
35%
40%
0
5
10
15
20
25
2011 2012 2013 2014 2015F 2016F
% C
han
ge in
Su
pp
ly (
Ro
om
s)
Nu
mb
er
of
Ho
tels
Total Number of Hotels % Change in Supply (Rooms)
The wave of expansion in Bintan is supported by international hotel operators, as well as domestic hotel chains and independent developers. Proposed hotels cover a wide range of service and market positioning levels. Hotel supply in Bintan is expected to increase to approximately 15 hotels in 2015 and to 20 hotels in 2016.
Most of the new supply is expected to enter the market at the upscale and luxury levels with more than 1,000 additional rooms across nine new hotels, within a time span of two to three years.
Market Outlook & Development Opportunities
Bintan has long enjoyed the benefit of being located close to Singapore, from where most tourist arrivals to the island originate. However, in the past few years, Bintan has been rather stagnant in terms of hotel supply and new tourist attractions, which have resulted in a gradually declining hotel market performance. Until 2014, the last new hotel property to open was more than 10 years ago. Moreover, cyclical nature of Bintan's resorts and hotels as well as the advent of low-cost
Indonesia Hotel Watch 2015 | PAGE 34
Source: HVS Research
GROWTH OUTLOOK FOR UPSCALE HOTEL MARKET
-14%
-6%
-8%
-4%
Upscale Hotel
Market
Occupancy
(%)
ADR (S$)
RevPAR (S$)
2015F
2016F
2%
4%
GROWTH OUTLOOK FOR MIDSCALE HOTEL MARKET
1%
2%
0.3%
1%
Midscale Hotel
Market
Occupancy
(%)
ADR (S$)
RevPAR (S$)
2015F
2016F
0%
0%

airlines and direct connectivity to other destinations within Indonesia has led to the decline in Bintan's tourist arrivals.
Going forward, the additional new supply expected to enter the market across luxury and upscale segments over the next few years is likely to result in subdued occupancy growth levels in the short- to mid-term. In the long term with the continuing rise in demand, the island's hotel market is expected to recover.
In anticipation of several new integrated resorts and development projects, as well as strong regional economic growth and the potential of tourism demand from emerging markets such as India and China, the investment community is optimistic about the island's future. Furthermore, Bintan's new airport will give the island an opportunity to compete for its own domestic leisure segment. Additionally, improved accessibility and adequate facilities to capture the growing MICE demand will allow the island's hotel market to effectively target a wide range of demand segments.
With the aggressive marketing of Lagoi Bay, Treasure Bay and other integrated resort developments, Bintan's visibility is anticipated to improve. The new supply of internationally branded resorts and boutique hotels will further increase the attractiveness of Bintan as a tourist destination. Moreover, the new residential developments in Bintan with marinas, entertainment facilities and retail enclaves will complement its resorts going forward.
The above positive changes on the island, coupled with the new visa fee waiver policy applicable to 45 countries recently announced by the Indonesian government, are expected to boost Bintan's hotel market even further.
Indonesia Hotel Watch 2015 | PAGE 35

LOMBOK
Indonesia Hotel Watch 2015 | PAGE 36

Indonesia Hotel Watch 2015 | PAGE 37
Lombok
Overview
Lombok is one of the two major islands that make up the West Nusa Tenggara province of Indonesia. The land area of Lombok measures approximately 4,739 square kilometres and has a population of about 3.2 million inhabitants. The island is divided into four regencies: West Lombok, North Lombok, Central Lombok and East Lombok.
Strategically located near the tourism epicentres, Bali and Komodo Island, Lombok is a rising tourism destination in Indonesia. The island possesses a wealth of attractive characteristics that are favourable for the development of tourism such as the island's distinctive cultural mosaic, which is a blend of the main Sasak culture alongside Balinese, Javanese and other cultures. Additionally, the beautiful natural landscapes and settings, especially the famous Mount Rinjani and its long stretches of pristine beaches, have tremendous potential to be developed for special-interest tourism activities, such as diving, rafting, rock-climbing and caving.
Tourism is an important source of income for Lombok. While most of the tourism activity is currently centered in the township of Senggigi, many unexplored and underdeveloped sites around the island remain untapped. Some of the major areas slated for development include the south and southwest of Lombok. The southern part of the island, in particular, is seeing a surge in development interest, further to the relocation of the international airport from Mataram to this place.
Lombok is currently undergoing a wave of resort development activity and the new Lombok International Airport that opened in October 2011 can be considered as the primary driver of this development. The new airport was constructed to replace the old Selaparang Airport, and in doing so has effectively increased the annual passenger capacity from 850,000 to three million. The Lombok International Airport boasts of a modern arrival terminal and has facilities that are able to cater to the largest of aircrafts. Its opening has helped facilitate the growth of tourism on the island.
The major tourism centres in Lombok are highlighted in the following paragraphs:
Mataram – Mataram is the largest city in Lombok and the capital of the West Nusa Tenggara province. The city is situated within the West Lombok Regency and lies on the western side of the island. It measures around 61 square kilometres and has a population of approximately 413,000 inhabitants. There are three main districts within the city: Ampenan (to the west), Mataram (in the centre) and Cakranegara (to the east). Ampenan is located closest to the coastal areas and is home to the now-defunct Selaparang Airport. Mataram is the administrative centre where government departments, offices, educational institutions and other important services are concentrated. Cakranegara is the major commercial centre where Mataram Mall, the only shopping mall in the entire city of Lombok at the moment, and other shopping facilities are
located. Development of two new large malls, Mataram Sunset Beach and Lombok Epicentrum Mall, is scheduled for completion in 2015. The developments are expected to be integrated with hotels and other tourist attractions in the island, and are targeted to create employment opportunities and improve general economic growth for the local residents.
Senggigi – The Senggigi region is the main tourist strip in Lombok that stretches out several kilometres along the west coast. It is located within the West Lombok Regency and lies just north of the capital, Mataram. The whole area is interspersed with pockets of tourism developments and stretches of open undeveloped land. It is served by a two-lane coastal road that runs through three main districts: Batu Bolong (to the south), Senggigi (in the centre) and Mangsit (to the north). Batu Bolong is the gateway to Senggigi and has a spread out collection of hotels, restaurants and nightlife establishments. The central Senggigi area is a hive of activity and has a concentration of relatively large-scale four- and five-star hotels such as Santosa Villas & Resort and Sheraton Senggigi. Mangsit is generally less developed, but has several well-established hotels that are located along the long stretches of tranquil beaches. On the whole, the focus of Batu Bolong and Mangsit is more on the beachfront hotels whereas the central Senggigi area has an additional element of vibrancy and street feel. Despite the rapid growth of other tourist destinations in Lombok in recent years, Senggigi still remains a popular port of call, especially among international tourists.
Tanjung – Tanjung is a developing tourist destination in Lombok and the administrative capital of the new North Lombok Regency. It is located on the northwest coast of the island and is accessible via a long winding two-lane coastal road that circumnavigates the entire north region. It also lies at the foot of Mount Rinjani, the third highest mountain in Indonesia and one of the most popular trekking destinations in Southeast Asia. The area along with the two nearby peninsulas, Medana and Sire, are home to Lombok's most prestigious resorts such as The Oberoi and Tugu Lombok Hotel.
Kuta – Kuta is a coastal town in the south of Lombok and a tourism hotspot. It is located within the Central Lombok Regency and lies on the south coast of the island. With the opening of the new Lombok International Airport near Praya, Kuta is now a convenient 30-minute drive from the airport. While Kuta has a wide variety of accommodations and restaurants that cater to tourists, ranging from the four-star Novotel Lombok to backpacker lodges, the area has retained most of its natural, laid back character.
Gili Islands – The famous Gili Islands, which consist of Gili Trawangan, Gili Air and Gili Meno, are among the most popular tourist destinations in Lombok. The islands are located just off the northwest tip of Lombok Island. Out of the three islands, Gili Trawangan is the largest and the most visited. The island is also home to a variety of accommodations and restaurants, including luxury hotels such as Villa Ombak and Queen Villa. While there has been increasing development and influx of tourists over the years, the focal activities on Gili Islands remain the same: diving, snorkelling and partying.

Accessibility
At present, the Lombok International Airport serves six domestic airlines, which include Garuda Indonesia, Lion Air, Merpati Air, Trans Nusa Air, Wings Air and Citilink Indonesia. These domestic airlines travel to/from seven different cities within Indonesia, including Jakarta, Denpasar and Surabaya, accounting for about 224 inbound flights to Lombok per week.
Among international carriers, Silk Air and AirAsia are already flying to/from Lombok, apart from a Siberian charter called Nordwind Airlines. Jetstar Airways, which ran the only direct flights between Australia (Perth) and Lombok, halted all services between the two destinations from October 2014, due to a lack of demand for the route. Jetstar reportedly lost around US$4 million over the span of 11 months servicing the Perth-Lombok route. The severing of a direct Australian connection may have an adverse impact on the future arrivals, particularly from the Australian feeder market.
On the other hand, starting 23 January 2015, AirAsia increased flight frequencies for the Kuala Lumpur-Lombok route to 14 weekly flights from the previous 10 weekly flights. Around the same time, the airline also introduced a new direct route from Singapore thrice a week.
Low-cost carrier Tiger Airways had plans to operate three flights weekly between Singapore and Lombok starting November 2013, with the objective of bringing in more international tourists from Singapore, especially budget travellers. However, in April 2014, Tiger Airways suspended its Singapore-Lombok route as part of its operations restructuring. The Singapore-based airline attributed this decision to a reduction in yield and load factor. The group was reported to have incurred a net loss of S$223 million in the year ending 31 March 2014, which was significantly higher compared to the net loss of S$45 million in the previous year. Evidently, weak demand, despite efforts to promote Lombok as a destination, is generally the main challenge faced by many international airlines.
Nonetheless, moving forward, it has been reported that Cathay Pacific is considering introducing direct flights between Hong Kong and Lombok. This could potentially connect the island to other medium-haul markets outside of the Southeast Asian region, particularly the massive China market. However, there have been no recent developments towards this end.
As an alternative to flying to Lombok International Airport, the island is also accessible via sea through Lembar Ferry Terminal.
Tourism Market Overview
International arrivals to Lombok remained fairly consistent prior to 2013. Years 2010, 2011 and 2012 registered 17,300, 17,900 and 17,000 international arrivals, respectively. Moreover, even during the global financial crisis in 2009, Lombok experienced only a marginal decline (3%) in international arrivals unlike other parts of Indonesia.
However, 2013 witnessed the island achieving a milestone of sorts in terms of international visitors; arrivals stood at
approximately 40,400, corresponding to an astounding 137% growth from the year before. Furthermore, till May 2014, 27,900 international arrivals were registered, nearly three times the recorded number of arrivals (9,800) during the same period last year. Such unprecedented levels of growth are attributable to the island's increasing popularity as an alternative leisure destination to Bali, as well as the increasing availability of flights to Lombok from both domestic and international destinations.
Between 2007 and 2013, the total number of international and domestic visitor arrivals at star-rated hotels in West Nusa Tenggara grew at a compound annual growth rate of 21.7%. Specifically, over the same period, domestic visitor arrivals outgrew international visitor arrivals, recording growth rates of 22.9% and 27.8%, respectively.
In particular, domestic arrivals increased from 253,642 in 2012 to an estimated 422,200 in 2013, a sharp growth of 66.5%. The significant change in domestic arrivals in recent years is largely due to the efforts of the provincial government in promoting Lombok and Sumbawa as new travel destinations to the domestic market.
Source: Badan Pusat Statistik Indonesia
TOTAL VISITOR ARRIVALS – NUSA TENGGARA BARAT, INCLUDING SELAPARANG AND LOMBOK INTERNATIONAL AIRPORT (2004–2013)
Total Arrivals % Change
- 5%
0%
5%
10%
15%
20%
25%
30%
35%
40%
45%
0
200
400
600
800
1,000
1,200
2004 2005 2006 2007 2008 2009 2010 2011 2012 2013
% C
han
ge
Tota
l Arr
ival
s (T
ho
usa
nd
s)
The total number of arrivals to Lombok via the Lombok International Airport (and previously Selaparang Airport) registered a compound annual growth rate of approximately 11.4%, from approximately 372,000 passengers in 2004 to around 985,000 passengers in 2013.
In 2012, despite the opening of the new airport, the growth in airport arrivals remained fairly moderate, increasing by only 4% over the previous year. The limited growth could be due to the lack of international inbound flights to Lombok.
Indonesia Hotel Watch 2015 | PAGE 38

The primary source countries for visitation to Lombok are Malaysia, Singapore, Australia and South Korea. Based on past trends, it can be concluded that the top few international feeder markets for Lombok are typically countries with direct flight access to the island. Per 2013 data, the top feeder market for Lombok was Malaysia contributing 43% of the total arrivals, followed closely by Singapore at 29%, and Australia accounting for 11% of all arrivals.
The rapid growth of Malaysia as a feeder market is largely owing to the availability of direct flights between the two destinations as well as the increasing popularity of the island among leisure travellers. Furthermore, it is also gathered that Cathay Pacific is considering introducing direct flights between Hong Kong and Lombok. This could potentially connect the island to other medium-haul markets outside of the Southeast Asian region, particularly the massive China market.
July, August, September and late December usually witness more arrivals to Lombok than other months. These coincide with the dry monsoon season, which lasts from May to August, and the festive period in the last two weeks of December. On the other hand, a slight decline in visitor arrivals is usually observed during the wet monsoon season, especially in late January and February, as well as during Ramadan.
Based on the preceding chart, one can observe that generally, the seasonality of visitor arrivals to Lombok has remained fairly constant throughout the year prior to 2013 and 2014. This is largely due to stronger marketing efforts to introduce Lombok as a tourist destination in the recent years, and growth and improvements in existing and upcoming hotel and resort developments on the island.
The average length of stay of visitors in three- to five-star hotels is shown in the following chart. The scope of the data covers the volume of visitor arrivals at star-rated hotels for the whole of West Nusa Tenggara. This is due to the lack of tourism data that specifically captures the Lombok market. Nonetheless, as most of the star-rated hotels in the province are concentrated in Lombok, the data should offer a fairly accurate representation of the trend of visitation to the island.
Source: Official Airline Guide (OAG)
TOP SOURCE MARKETS TO LOMBOK (2013)
Source: Badan Pusat Statistik Indonesia
SEASONALITY OF INTERNATIONAL ARRIVALS TO LOMBOK (2010–MAR 2015 YTD)
2010 2011 2012 2013 2014 Mar 2015 YTD
-
1,000
2,000
3,000
4,000
5,000
6,000
7,000
8,000
9,000
Jan Feb Mar Apr May Jun Jul Aug Sep Oct Nov Dec
Inte
rnat
ion
al A
rriv
als
(Th
ou
san
ds)
Source: Badan Pusat Statistik Indonesia
AVERAGE LENGTH OF STAY OF INTERNATIONAL AND DOMESTIC GUESTS IN CLASSIFIED HOTELS IN LOMBOK (2006–2013)
International Guests Domestic Guests
1.50
2.00
2.50
3.00
3.50
4.00
4.50
2006 2007 2008 2009 2010 2011 2012 2013
Ave
rage
Le
ngt
h o
f St
ay (
Day
s)
Hotel Performance Overview
The tourism market in Lombok has enjoyed positive overall growth in recent years. This is largely due to the provincial government's efforts in the areas of regional planning and place marketing. Additionally, the beach in the southern part of Lombok has been earmarked as 1 of the 88 Indonesia Tourism Strategic Areas by the Indonesian Ministry of Tourism and Creative Economy. On the whole, these strategic areas are likely to represent the key growth areas driving the overall development of the tourism sector in Lombok.
At present, the average occupancies for most of the hotels and resorts in the market are around the mid-70s. Since 2012, occupancy has been steadily increasing following the growth in international arrivals and absence of new hotel supply. While we expect arrivals in Lombok to continue increasing over the next couple of years, seasonality characteristics combined with the absence of new resort supply in the short-term may put a cap on occupancy growth. Nonetheless, we do anticipate continuous rise in average room rate for the market.
Average rates have been increasing at a strong pace in recent years. The marketwide ADR increased by 13% from US$84 in
Indonesia Hotel Watch 2015 | PAGE 39
43%
29%
11%
5%
12%
Malaysia
Singapore
Australia
South Korea
Others

Source: HVS Research
CHANGE IN MARKETWIDE HOTEL SUPPLY (2011–2016F)
2012 to US$94 in 2013. This high level of rate growth is expected to continue through 2014 and 2015, as demand for good quality resort products in Lombok continues to rise, and new supply remains muted in the short term. As a destination, Lombok holds a lot of potential for both high occupancy and rate growth, similar to high-end resort locations in neighbouring Bali. In 2014, occupancy is estimated to have increased by two percentage points to 74%, while ADR is estimated to have risen by 7% to approximately US$101. Going forward, 2015 and 2016 are anticipated to record slightly lower growth rates than the previous year due to new supply entering the market. Occupancy is expected to stay at 74% and 75% respectively, while ADR is likely to increase by 3% to US$104 in 2015 and 5% to US$109 in 2016.
resumed construction. The Sundancer development will be rolled out in six stages and will offer a mix of hotel, residential and commercial developments spread across 49.5 hectares.
Another major project is the Mandalika Resort Development, which is a sprawling 1,175-hectare development to the south of Lombok governed by the Bali Tourism Development Corporation, the same company which successfully operates the Nusa Dua hotel complex. Plans for this integrated resort development include five luxury resorts and hotels, theme parks, a marina, golf courses, and a convention centre, all surrounded by a nature conservation zone.
Source: HVS Research
LUXURY AND UPSCALE HOTEL MARKET PERFORMANCE (2012–2016F)
50%
55%
60%
65%
70%
75%
80%
85%
90%
95%
100%
0
20
40
60
80
100
120
2012 2013 2014 2015F 2016F
Occ
up
ancy
(%
)
Ave
rage
Dai
ly R
ate
& R
evP
AR
(U
S$)
Estimated Luxury and Upscale ADR (US$) Estimated Luxury and Upscale RevPAR (US$)
Estimated Luxury and Upscale Occupancy (%)
New Developments & Hotel Supply
As a number of new projects are anticipated to enter the market beyond 2016, it is likely that the market will see a swift and rapid rise in new developments after this period.
However, there are two major masterplan developments – the Sundancer Resort and the Mandalika Bay project – that will add significant amount of rooms to the market, when the later phases of these developments are realised.
Following the opening of the Lombok International Airport, the previously delayed Sundancer Resort project in Sekotong
0%
2%
4%
6%
8%
10%
12%
14%
0
10
20
30
40
50
60
2011 2012 2013 2014 2015F 2016F
% C
han
ge in
Su
pp
ly (
Ro
om
s)
Nu
mb
er
of
Ho
tels
Total Number of Hotels % Change in Supply (Rooms)
Additionally, between 2015 and 2018, 12 more hotels, including the Sundancer, Royal Kamuela and Renaissance are expected to open in Lombok, adding approximately 1,500 rooms to the market.
Moreover, a fairly large number of hotels are rumoured, or are speculative, such as the proposed Four Seasons Hotel, a proposed Alila hotel and a proposed hotel development by a Singaporean Company, all to come online in Lombok at some point. However, these developments, their branding and key counts have not been confirmed. Trisara too is rumoured to enter the Lombok market in the mid-term.
Market Outlook & Development Opportunities
The tourism sector in Indonesia continues to expand, as evident from the constant year-on-year growth in international tourist arrivals over the past few years. In particular, there is a growing interest in emerging resort destinations, with many market players and travellers taking note of their massive potential.
Specifically, in the case of Lombok, the central and provincial governments are actively promoting the destination, alongside the neighbouring island of Sumbawa, as Indonesia's next big tourism hot spot. Moving forward, new growth areas in the south coast of Lombok will witness the largest waves of tourism-
Indonesia Hotel Watch 2015 | PAGE 40
Source: HVS Research
GROWTH OUTLOOK FOR LUXURY AND UPSCALE HOTEL MARKET
Luxury and
Upscale Hotel
Market
Occupancy
(%)
ADR (US$)
RevPAR (US$)
2015F
2016F
3%
5%
3%
6%
0%
1%

related development, with the impending completion of the Sundancer Resort and the early phases of the Mandalika Resort, plus many other pristine sites earmarked for development within convenient proximity of the airport.
The establishment of the Mandalika Resort project is a milestone in Lombok's development as a premier tourist destination in Indonesia. The project is anticipated to create a new surge in demand and will likely bring in high volumes of international visitors to the market. This substantial growth will be readily supported by the new Lombok International Airport. As Bali faces challenges of oversupply and soaring land costs, investors might turn to Lombok as an attractive alternate site for hotel investments.
Buoyed by the opening of the new airport and the sustained growth in tourist arrivals, Lombok is poised to enter the next phase of development, building on its growing reputation to become a top tourist destination in the medium-term. Lombok's international arrivals have seen a remarkable jump in the last two years. Arrivals in 2013 doubled from the year before and 2014 YTD data seems to indicate that this feat might be repeated. With a strong growth in regional travel and an optimistic domestic market the island's growth seems imminent.
Furthermore, high average rate growth alongside consistent and relatively high occupancy levels in Lombok's star-rated market is priming the island for development opportunities across a wider range of market positioning, from midscale hotels and resorts, to luxury resorts.
While efforts to improve accessibility have been made in recent times, a lot more remains to be done. Better domestic and international connectivity is a prerequisite to continuous growth of visitation to the island, which at the moment looks uncertain.
Indonesia Hotel Watch 2015 | PAGE 41

BANDUNG
Indonesia Hotel Watch 2015 | PAGE 42

Bandung
Overview
Bandung is the capital of West Java and is located approximately 200 kilometres southeast of Jakarta. With a population of 3.4 million (as of 2012), the city has the third-largest population in Indonesia. The city is landlocked, with Lembang province at a distance of 15 kilometres to its immediate north, Garut province 80 kilometres to its south, the city of Purwakarta 70 kilometres to its northwest and Subang Regency 170 kilometres to its northeast.
Bandung's location on fertile volcanic soils from the Tangkuban Perahu Volcano in the northern part of the city has enabled the production of rice, fruit, tea, tobacco and coffee. The Dutch had established the town as a tea plantation in the eighteenth century and it later went on to become the bustling city it is now.
Due to its easy accessibility from Jakarta, Bandung serves as a leisure getaway for domestic travellers during weekends. The city is located in a river basin and surrounded by the Parahyangan Mountains; its cooler temperature and generally pleasant weather is a great draw for tourists. Bandung also boasts of cheap retail options, with factory outlets offering branded wear or locally manufactured clothing at relatively lower prices. This attracts weekend tourists from Jakarta as well as from Singapore and Malaysia.
The majority of Bandung's population are Sudanese while Javanese are the biggest minority. Other minorities include Arabs, Chinese, Indians and Malay. Sundanese is the primary language and the means of informal communication; Bahasa, on the other hand, remains a secondary language and is the medium of instruction in school and means of communication in business.
Accessibility
Bandung is accessible via land and air, but most domestic travellers prefer to drive to Bandung. Visitors from Jakarta typically use the Jakarta-Cikampek Toll Road and Toll Road Cipularang, taking approximately four hours to reach Bandung. It has been reported that difficult traffic conditions can extend the journey to up to six hours during the day. Before the Cipularang Toll Road opened in 2005, travellers would take twice the time to reach Bandung that they take now.
Bandung has its own international airport, Husein Sastranegara International Airport, located approximately five kilometres northwest of the city centre. The airport connects Bandung to 17 major cities in Indonesia that include Surabaya, Bali, Medan and Yogyakarta. International connectivity is offered to Kuala Lumpur, Singapore and Johor Bahru, via AirAsia, Silk Air and Malindo. The airport presently serves low cost carriers, with Garuda Airlines being the only full service carrier.
International visitation to Bandung is relatively limited, when compared with other Indonesian cities such as Bali, Denpasar, Jakarta and Surabaya. In 2014, a mere 180,000 international
tourists entered the city via the airport. The airport is currently undergoing expansion and is expected to increase its capacity five-fold to 3.4 million passengers by next year.
The government has also planned the Bandung Majalengka International Airport, which will replace the existing airport and will be located 90 kilometres east of Bandung. However due to ownership issues the project has been stalled for more than a year.
Tourism Market Overview
Bandung is primarily a domestic market, with the segment contributing 95% of total tourist arrivals in 2014. Total domestic travellers into Bandung via all modes of transport grew at a CAGR of 5.4% from 2009-2014.
Source: Badan Pusat Statistik Indonesia*2014 Domestic Arrivals have been estimated
DOMESTIC VISITOR ARRIVALS – HUSEIN SASTRANEGARA INTERNATIONAL AIRPORT (2009–2014 ESTIMATE)
Domestic Arrivals % Change
-20%
-15%
-10%
-5%
0%
5%
10%
15%
20%
25%
30%
35%
0
500
1,000
1,500
2,000
2,500
3,000
3,500
4,000
4,500
2009 2010 2011 2012 2013 2014*
% C
han
ge
Do
me
stic
Arr
ival
s (T
ho
usa
nd
s)
International arrivals at the Husein Sastranegara International Airport increased steadily from 2008-2014, with a CAGR of 19.2%. In 2014, however, the growth in arrivals dropped sharply to 2% over the previous year as opposed to 11.1% in 2013. There were a few notable incidents which led to this decline: the mid-year election, which resulted in a slowdown in domestic travel; the unfortunate aviation mishaps; and a slowdown in meeting and conference demand due to the new government policy limiting spending.
Source: Badan Pusat Statistik Indonesia
INTERNATIONAL VISITOR ARRIVALS – HUSEIN SASTRANEGARA INTERNATIONAL AIRPORT (2008–2014)
0%
5%
10%
15%
20%
25%
30%
35%
0
20
40
60
80
100
120
140
160
180
200
2008 2009 2010 2011 2012 2013 2014
% C
han
ge
Inte
rnat
ion
al A
rriv
als
(Th
ou
san
ds)
International Arrivals % Change
Indonesia Hotel Watch 2015 | PAGE 43

Bandung's international feeder markets are primarily within the ASEAN region and have direct flight connectivity with the city. The top two source countries for Bandung are Malaysia and Singapore. As of March 2015, of the top five feeder markets, these two countries contributed more than 90% arrivals into Bandung, with the remaining 10% contributed by the United States, India, Australia and others.
properties by Accor, Hilton, IHG and Starwood, and domestic market participants Aston, Santika, Horison and Swiss-Belhotel. Overall, the branded supply made up approximately 3,300 rooms in Bandung as of year-end 2014.
Bandung's hotel market sees more than 90% of its contribution from the domestic segment. The international market continues to remain relatively untapped. There is potential here for the larger convention hotels and international branded hotels to attract more leisure and corporate MICE demand from Singapore and Malaysia. With the devaluation of the IDR, the destination has become cheaper and thus more attractive for international visitors and corporate groups.
Bandung's main hotel market segments are Domestic Leisure, Business and MICE, with Jakarta being a major feeder market due to proximity and easy access. In recent times, owing to new government policies, the city hotels have witnessed a slowdown in MICE demand from the government sector, resulting in an overall decline in accommodated room nights from this segment. However, it is to be noted that branded hotels in the city continue to do well in capturing the weekend leisure demand from Jakarta and the international market. The city hotels also witness corporate MICE demand, from the factories, industries and business houses located in Bandung.
Leisure demand is characterized by a short stay over the weekend, and most of the tourists travel to Bandung via road from Jakarta to enjoy the pleasant weather, retail and dining options.
The branded hotel supply, comprising approximately 3,300 rooms in Bandung, saw occupancy decline from 66% to 64% from 2012 to 2014 owing to an approximately 50% increase in branded supply in the past two years. However, despite this decline in marketwide occupancy, accommodated room nights for the market increased by 36% in 2014 over 2013. Average room rate, on the other hand, grew from IDR650,000 in 2012 to IDR763,000 in 2014 at an annual average growth rate of 8%. The improved room rate may be attributed to the entry of branded hotels such as the Mercure and Ibis, which entered the market at a higher rate positioning. The recent hotel openings in 2015 have further exerted supply pressures on the market in the short term, and are expected to lead to an overall decline in occupancy to 60% (rounded) this year. Average rate, on the other hand, is expected to increase on the back of the entry of branded hotels at a higher positioning, such as the InterContinental and the Crowne Plaza.
Going forward, Bandung's hotel market is anticipated to absorb the additional inventory across positioning. This displays the continued growth in the demand for the market. April 2015 saw the large Asia Africa Conference being hosted in Bandung, with delegates from 29 countries flocking the city to attend the 60-year-old conference and carnival. Moreover, some hotels in Bandung are anticipating large corporate group events in the second half of 2015, which are likely to revive the current slowdown. Additionally, the hotels are expecting a rebound in the MICE demand from the government sector over the next
Bandung experiences seasonality in tourist arrivals, in line with key holidays and religious festivals such as Ramzan. Bandung is primarily a domestic market, with travel often slowing down during Ramzan in the late summer months in July and August. This seasonality is also reflected in the international visitation, as the main feeder market is Malaysia which is predominantly Muslim. Peak demand tends to coincide with the summer holiday months and the Christmas and New Year holidays. Beginning September through December, demand is characterised by group blocks at most hotels, and occupancy and rate levels are higher during this period.
Source: Badan Pusat Statistik Indonesia
SEASONALITY OF INTERNATIONAL ARRIVALS TO BANDUNG (2010–MAR 2015 YTD)
2010 2011 2012 2013 2014 Mar 2015 YTD
0
5
10
15
20
25
30
Jan Feb Mar Apr May Jun Jul Aug Sep Oct Nov Dec
Inte
rnat
ion
al A
rriv
als
(Th
ou
san
ds)
Indonesia Hotel Watch 2015 | PAGE 44
Source: Badan Pusat Statistik West Java
TOP SOURCE MARKETS TO BANDUNG (MAR 2015 YTD)
71%
20%
1%1% 0%
7%
Malaysia
Singapore
USA
India
Australia
Others
Hotel Performance Overview
Although Bandung is dominated by mid-tier and budget hotels catering to the domestic traveller, it has branded hotels across all segments – from budget to upscale positioning. These include

12-14 months, and 2016 is forecasted to witness an increase in overall hotel performance.
from the domestic market. Additionally, the city's attractions have helped it draw visitors from Malaysia and Singapore.
In the past two years, Bandung has witnessed a substantial increase in its hotel inventory, which has exerted some supply pressures on its hotel performance. The hotel pipeline over the next few years is likely to result in subdued RevPAR growth in the short term. In the medium term, with the continued growth in domestic demand, the city's hotel market is expected to recover. The devaluation in Indonesia's currency has resulted in a fall in outbound tourism and an increase in domestic travel; this improved trend in domestic travel is certain to continue to benefit Bandung's hotel market.
The current airport expansion is anticipated to open the city to more international connections and the new international airport serving West Java, when it is built, will further generate more inbound tourism for Bandung. These factors are expected to have a positive impact on the development and performance of the hotel market.
Source: HVS Research
MARKETWIDE HOTEL PERFORMANCE (2012–2016F)
Estimated Marketwide ADR (IDR) Estimated Marketwide RevPAR (IDR)
Estimated Marketwide Occupancy (%)
50%
55%
60%
65%
70%
0
1,00,000
2,00,000
3,00,000
4,00,000
5,00,000
6,00,000
7,00,000
8,00,000
9,00,000
2012 2013 2014 2015F 2016F
Occ
up
ancy
(%
)
Ave
rage
Dai
ly R
ate
& R
evP
AR
(ID
R)
New Developments & Hotel Supply
The city's hotel market has seen a 38% increase in supply in the past year, with multiple hotels openings. In 2014 Bandung saw the opening of the 193-room Bandung Braga, the 147-room Ibis Bandung Pasteur, the 210-room Harris Convention Hotel and the 160-room Fave Hotel.
The wave of expansion is supported not only by international hotel management chains, but domestic chains and independent developers as well. Proposed hotels cover a range of service and market positioning levels. Hotel supply is expected to increase by 30% in 2015, and 9% in 2016.
Half of the new supply is expected to enter the market at the midmarket and upscale levels with 670 rooms across four new hotels, and across international brands such as InterContinental, Crowne Plaza, Pullman and Four Points. In the budget category pipeline, the city is expected to see the country's first Premier Inn, featuring 112 keys, which is expected to come online by the third quarter of 2015, and a YELLO property by Tauzia Hotel Management scheduled to open in 2015.
Market Outlook & Development Opportunities
Bandung has enjoyed the benefits of its location within Java and within close proximity to Jakarta. Its location on Indonesia's most populous island has helped it witness growing demand
Indonesia Hotel Watch 2015 | PAGE 45
Source: HVS Research
GROWTH OUTLOOK FOR BANDUNG HOTEL MARKET
-4%
2%
2%
5%
-5%
9%
Marketwide Occupancy
(%)
ADR
(IDR)
RevPAR
2015F
2016F
(IDR)

YOGYAKARTA
Indonesia Hotel Watch 2015 | PAGE 46

Yogyakarta
Overview
Yogyakarta is the capital city of Yogyakarta Special Region in Java, and is one of Indonesia's 32 provinces. The Yogyakarta Special Region is among the most densely populated areas in Indonesia, stretching from Mount Merapi to the Indian Ocean. The city has an area of approximately 32.5 square kilometres, and has humid tropical climate.
Yogyakarta offers many historical sites, museums and monuments, along with a lively art and cultural heritage, golf courses, volcanic mountains and exciting shopping destinations. It is renowned as a centre for classical Javanese fine arts such as batik, and performance arts that include ballet, drama, music, poetry and puppet shows. Furthermore, Yogyakarta is also a prominent centre for higher education in Indonesia, with a multitude of universities, in particular the Gadjah Mada University, which is one of the country's most prestigious universities.
Formerly, Yogyakarta relied on the many historic UNESCO sites, which lie in proximity to the city, to draw in tourists; these include Borobudur, Prambanan Temple and Ratu Boko Palace. In recent years, however, the government of Yogyakarta has been aggressively promoting the cultural heritage of the many villages within the province to attract more tourism to the city. While Yogyakarta has historically been popular with both international and domestic tourists, it has an especially strong domestic segment. Going forward, the weakening of the Indonesian rupiah against the dollar and improved accessibility are expected to generate growth in international and domestic arrivals over the next few years.
Accessibility
Yogyakarta's Adisucipto International Airport, located six kilometres from the city centre, is operating at overcapacity necessitating the development of the new Kulon Progo Airport. Kulon Progo International Airport will be built on a 645-hectare plot of land in the Glagah and Congot sub-districts of Kulon Progo. The new airport will have a 3.6-kilometre runway and an annual passenger-handling capacity of up to 10 million. The new airport, which was initially planned to replace the existing airport by 2016, has encountered many delays over the controversial acquisition of land from the surrounding farms, which has yet to be resolved. It is most probable that the airport would only be ready by 2018 at the earliest.
International flights to the current airport have also been very limited. Often international tourists travelling to Yogyakarta have to transit through Singapore, Kuala Lumpur, Bali or Jakarta, thereby increasing travel time and costs, reducing the appeal of the destination.
There are plans to develop an airport city surrounding the new airport, which will include a hotel, shopping centres and hospitals. There will also be an airport railway built to facilitate transport between the airport and the city of Yogyakarta in
cooperation with the state railway company PT Kereta Api Indonesia (KAI). The much-anticipated improvements to the airport infrastructure of Yogyakarta will, once completed, give an added boost to its tourism economy.
Tourism Market Overview
Yogyakarta is the second-most popular domestic travel destination in Indonesia, next to Bali. Domestic travel to the market makes up approximately 90% of travellers into Yogyakarta; 70% of these come from Jakarta whilst the rest come from its surrounding cities.
The MICE segment makes up 70% of the market in Yogyakarta and is a significant demand generator for many hotels. Government meetings, in particular, are estimated to constitute 20% of business in five-star hotels and 40% of business in three-star and four-star hotels. Consequently, like many markets in Indonesia, Yogyakarta was badly affected by the ban on government meetings in hotels in November 2014 that carried forward into the first quarter of 2015. Hotels have since responded by focusing their efforts on trying to gain a bigger share of the corporate meetings segment.
As of April 2015, the government has issued a new regulation, Permenpan RB No. 6/2015, that supersedes the previous regulation in November. Though a positive step forward for the hotels, with permissible guidelines dictated, the regulation continues to restrict holding a meeting in a hotel. Hence, the industry remains affected by the regulation seeing a slow recovery of a major demand segment.
TOTAL VISITOR ARRIVALS – GREATER YOGYAKARTA (2005–2013)
Source: Badan Pusat Statistik D.I. Yogyakarta
-15%
-10%
-5%
0%
5%
10%
15%
20%
25%
0
500
1,000
1,500
2,000
2,500
3,000
3,500
4,000
4,500
2005 2006 2007 2008 2009 2010 2011 2012 2013
% C
han
ge
Tota
l Arr
ival
s (T
ho
usa
nd
s)
Total Arrivals % Change
Leisure travel is generally driven by the domestic market, often from the surrounding cities such as Semarang and Solo. Domestic travellers tend to take advantage of long weekends and public holidays to travel to Yogyakarta, often filling up hotels. With the weakening of the rupiah against the US dollar, an increase in domestic arrivals to Yogyakarta seeking an alternative holiday destination is expected in 2015 and early 2016. Top international feeder markets into Yogyakarta include the Netherlands, Japan, Malaysia, France and Singapore.
Indonesia Hotel Watch 2015 | PAGE 47

Peak months in Yogyakarta are typically from August to December, driven by the MICE segment and the summer holiday season for many European markets. In 2014, various events through the year negatively impacted arrivals. The eruption of Mount Kelud resulted in a five-day closure of Adisucipto Airport and the subsequent cancellation of many travel plans to Yogyakarta in February. Moreover, uncertainties caused by presidential elections in that year were reflected in a slowdown in the growth of international arrivals in the third quarter of the year. Finally, in November 2014, the ban on government meetings affected the tourism market in Yogyakarta significantly. The effects of this regulation carried into 2015 with the situation starting to improve since revisions to the ban were made in April.
Hotel Performance Overview
Yogyakarta is often viewed as the historical and cultural centre of Indonesia, anchored on the appeal of the UNESCO sites that include the Borobudur and Prambanan Temples. Located in the central portion of Java, Yogyakarta has also evolved into a popular destination for the meetings segment, being a convenient midpoint.
The hotel market in Yogyakarta is predominantly made up of bed and breakfast accommodation and economy hotels that account for 80% of all properties and 39% of all rooms. Midscale hotels make up 15% of all properties whilst they alone represent approximately 48% of the room supply. The upscale category of hotels forms the smallest share of the market, making up approximately 5% of all properties and 13% of all rooms. According to Badan Pusat Statistik Kota Yogyakarta, marketwide occupancy for classified hotels performed at an average of 61% in 2013.
In 2013, upscale hotels in Yogyakarta recorded an occupancy of 74% with an average rate (ADR) of approximately IDR600,000. Overall performance in 2014 declined amidst the volcanic eruption in February and the uncertainty brought about by the presidential elections. Thereafter, the period from November 2014 up to the first half of 2015 witnessed a further slump in performance with the limitations on the participation and organisation of hotel meetings by government bodies. As a result, the upscale segment's performance for 2014 generally declined with hotels attaining occupancies of approximately 67% whilst almost maintaining their average rate at IDR615,000.
Hotel performance has started to pick up since the revision of the government meeting regulation in April 2015. Though the ban on government meetings in hotels has been moderated, the industry remains under pressure. The impact of the regulation is expected to continue to affect hotels, especially those with large meeting facilities, even through 2016. This factor, together with new additions to supply, will lead to a slow and gradual recovery of the market.
Based on our analysis, 2015 is expected to close with an average occupancy of 62%, a decline of five percentage points from the previous year. ADR is expected to increase by 2% resulting in an overall decline of RevPAR by 6%. Annual performance for 2016 is expected to see gradual improvements through the year with occupancy closing at 63% and ADR experiencing a growth of 3%, translating into a 5% increase in RevPAR.
Source: Ministry of Transport, Indonesia
SEASONALITY OF ARRIVALS TO YOGYAKARTA (2011–2014)
140
160
180
200
220
240
260
280
300
320
Jan Feb Mar Apr May Jun Jul Aug Sep Oct Nov Dec
Vis
ito
r A
rriv
als
(Th
ou
san
ds)
2011 2012 2013 2014
The average length of stay for international guests in classified hotels in Yogyakarta was 1.97 days in 2013, recording a gradual decline from 2.31 days registered in 2008. The average length of stay of domestic guests also declined from 1.45 days in 2008 to 1.38 days in 2013. This decline in the average length of stay can be attributed to the growing popularity of Yogyakarta as a MICE destination, which usually sees business travellers with shorter lengths of stay.
Indonesia Hotel Watch 2015 | PAGE 48
TOP SOURCE MARKETS TO YOGYAKARTA (2013)
Source: Badan Pusat Statistik D.I. Yogyakarta*The Netherlands, Japan, Malaysia, France, Singapore
Domestic
International - Other
International*
90%
6%4%

New Developments & Hotel Supply
Between 2011 and 2014, total rooms supply within Yogyakarta increased by almost 70%, while demand grew by 66%. In the next two years, 11 more properties are expected to enter the market with about 2,000 rooms, more than doubling the 2011 rooms supply. The government has started to regulate and limit hotel development and is no longer issuing new building permits for hotels within the city centre of Yogyakarta. Building permits for areas near the city such as Sleman, however, are still available.
Following the decline in RevPAR in 2014 and the projected decline in 2015, we anticipate only a gradual recovery of performance beginning in 2016 owing to modest demand growth and sizeable new supply entering the market.
Market Outlook & Development Opportunities
A slow recovery of the government meetings segment, coupled with a new wave of supply entering the market, are the two main factors limiting the growth in hotel performance in Yogyakarta.
In the long-run, however, Yogyakarta as a destination stands to benefit from the developments of new internationally branded hotels and a new international airport. These developments are expected to induce demand into the destination and complement the existing UNESCO sites, which are expected to retain their long lasting appeal. The possibility of increasing connectivity to other aviation hubs within the region should also be explored. Such an action will inevitably grow the international tourist segment and provide the tourism industry with an added boost.
Yogyakarta has relied heavily on its cultural and historical appeal, which is expected to continue to be the basis for its position as an attractive tourist destination. With Yogyakarta located at the centre of Java, the city has the makings of becoming a major economic transit point between east and west Java or a tourism transit point between Jakarta and Bali.
UPSCALE HOTEL MARKET PERFORMANCE (2012–2016F)
Source: HVS Research
0%
10%
20%
30%
40%
50%
60%
70%
80%
0
1,00,000
2,00,000
3,00,000
4,00,000
5,00,000
6,00,000
7,00,000
2012 2013 2014 2015F 2016F
Occ
up
ancy
(%
)
Ave
rage
Dai
ly R
ate
& R
evP
AR
(ID
R)
Estimated Upscale ADR (IDR) Estimated Upscale RevPAR (IDR)
Estimated Upscale Occupancy (%)
Source: BPS Kota Yogyakarta, HVS Research
CHANGE IN CLASSIFIED HOTEL SUPPLY (2011–2016F)
0%
5%
10%
15%
20%
25%
30%
35%
40%
0
10
20
30
40
50
60
70
2011 2012 2013 2014 2015F 2016F
% C
han
ge in
Su
pp
ly (
Ro
om
s)
Nu
mb
er
of
Ho
tels
Total Number of Hotels % Change in Supply (Rooms)
Indonesia Hotel Watch 2015 | PAGE 49
Source: HVS Research
GROWTH OUTLOOK FOR UPSCALE HOTEL MARKET
2015F
2016F
-5%
1%
2%
3%
-6%
5%
Upscale Hotel
Market
Occupancy
(%)
ADR
(IDR)
RevPAR
(IDR)

BOGOR
Indonesia Hotel Watch 2015 | PAGE 50

Toll Road, the first toll road in Indonesia. Completed in 1973, the toll road links Jakarta to Bogor and Ciawi, and hence the name Jagorawi, an acronym of the three areas it serves. The Jagorawi Toll Road was supposed to be extended and subdivided into four additional sections. These extensions were to link Ciawi, Cigombong, Cibadak, West-Sukabumi and East-Sukabumi. However, due to problems surrounding land ownership and acquisition rights, the project has been delayed and is at a standstill since 2013. Commuter trains also serve Bogor and these train lines run from Jakarta and Sukabumi.
Although the city of Bogor experiences regular traffic congestions during peak hours, there are no reported initiatives for a new public transport infrastructure.
Tourism Market Overview
Bogor's arrival profile is predominantly domestic. Prior to 2013, visitation growth to Bogor had been relatively stable, with the exception of 2009 when visitation numbers dropped due to the global financial crisis. From 2007 to 2012, total visitor arrivals to Bogor grew at an average of 8% per year.
However, Bogor's historical moderate pace of growth was interrupted in 2013 when arrivals to the city grew by almost 80%, up from 1.87 million in 2012 to 3.38 million in 2013. This phenomenal growth was primarily the result of strong domestic leisure demand from Jakarta and neighbouring regencies. The huge growth in tourism was spurred by the launch of large scale tourist attractions such as the Jungle Water Park in 2013, in addition to the existing heritage and cultural sites such as the Bogor Presidential Palace (Istana Bogor) and the acclaimed botanical gardens (Kebun Raya Bogor). These have helped to elevate Bogor's position on the regional destination map. International arrivals, however, declined slightly, from 111,000 visitors in 2012 to 105,000 visitors in 2013, a 6% drop.
While official arrival statistics for 2014 are yet to be compiled by Badan Pusat Statistik, it is anticipated that total arrivals to Bogor would have dropped marginally that year due to the uncertainty surrounding the presidential elections and the resulting slowdown in business and government demand. However, as the majority of arrivals to Bogor are domestic, and from immediate regions, visitation to the city is unlikely to have been as severely affected as other parts of Indonesia.
Between the end of 2014 and the first half of 2015, the hotel market in Bogor was adversely affected by the new regulation restricting government meetings. The government meetings' segment made up approximately 30% of the clientele in the city's hotels in 2014; consequently, the imposition of the regulation caused marketwide hotel occupancy to decline by 10 percentage points between November 2014 and March 2015. Revisions to the regulation were made in April 2015, resulting in a slow pick up of business since. Special certificates have since been issued to major branded hotels in Bogor as recommended venues for government officials to organise their meetings. Though this certification is expected to further improve the situation, it is likely that the recovery of the segment will continue to be slow.
Bogor
Overview
Bogor, situated in the West Java province and approximately 60 kilometres south of Jakarta, consists of Bogor City (Kota Bogor) and Bogor Regency (Kabupaten Bogor). The greater Bogor Regency spans a larger area and is home to over five million residents, while Bogor City or Bogor, as it is more commonly known, is much smaller and administratively independent of Bogor Regency. Sentul, while not officially part of Bogor, is a small satellite city located close to it, sharing a lot of overlapping demand with Bogor. Herein, going forward, Bogor refers to both the city itself as well as the greater Sentul area.
Bogor, with a population surpassing one million, is located in the middle of Bogor Regency and is a well-recognised economic, cultural and tourist centre of the country. Despite Bogor covering an area of 119 square kilometres, the majority of the population resides in a small area spanning only 20 square kilometres at the heart of the city. As such, the Bogor city centre is one of the most densely populated areas in Indonesia and often sees heavy traffic congestion during peak hours.
Bogor is a popular tourist destination for residents in and around the greater Jakarta region. Strong cultural and historical identity coupled with modern amusement centres and water parks have helped develop the city's leisure demand, primarily over the weekend and public holidays. Owing to the numerous industrial and commercial estates situated on the outskirts of the city, Bogor is also popular with the business and corporate segments.
The city also serves as a popular meeting destination for Jakarta-based government and corporate entities. Weekday demand is almost exclusively composed of these meeting groups. However, in their bid to increase operational efficiency, the Bureaucratic Reform Ministry, in November 2014, issued a memorandum severely limiting the participation in and organisation of hotel meetings by government bodies. This policy has had a strong adverse impact on the performance of the Bogor hotel market.
As of April 2015, the government has issued a new regulation, Permenpan RB No. 6/2015, that supersedes the previous one. Though a positive step forward for the hotels, with permissible guidelines dictated, the regulation continues to restrict holding a meeting in a hotel. Hence, the industry remains affected by the regulation seeing a slow recovery of a major demand segment.
Accessibility
The city of Bogor is not served directly by its own international or domestic airport; instead, it is served by the Soekarno-Hatta International Airport (SHIA) in Jakarta, which is approximately a 90-minute drive in good traffic conditions. However, as mentioned earlier, a vast majority of the visitors to Bogor are from Jakarta itself. Moreover, there is an option of arriving into the city by air via specially arranged helicopter charters from SHIA to Atang Senjaya Airport, which is a military airport in Bogor.
Primary access to Bogor from Jakarta is offered by the Jagorawi
Indonesia Hotel Watch 2015 | PAGE 51

Domestic travel accounted for approximately 97% of the total visitation to Bogor in 2013. Jakarta, along with the greater Jakarta area (including Tangerang and Depok) accounted for about 90% of the domestic visitors to Bogor. The remaining 10% originated from within Bogor Regency. On the other hand, international visitors made up only about 3% of the total visitors to Bogor; among these, Singapore, Malaysia, Japan, China and the Netherlands were the largest feeder markets accounting for more than 60% of all international arrivals. Given the strong dependency on domestic demand for Bogor, it is unlikely that the contribution of international arrivals to the total visitation will change drastically in the foreseeable future.
held during the year and the overall stability of the economy and political situation. Hotels in 2013 saw average occupancies of 80% at an average rate of IDR583,000. Year 2014, however, experienced a dip in performance amidst concerns over the uncertainty of the presidential elections that were held mid-year and dragged on until the third quarter. Thereafter, performance in November 2014 was negatively impacted by the enforcement of the new government meeting regulation, which saw demand from a major segment in the market plummet. With these changes, occupancy declined by approximately five percentage points to 75%, and average rate declined by 6% to IDR546,000 in 2014.
Revisions to the meeting regulation and new initiatives to address its impact were implemented in the second quarter of 2015, resulting in a gradual pick up of performance. Going forward, despite these improvements, it is unlikely that hotel performance will return to the same levels that were recorded in 2013 in the near future. Furthermore, with an estimated 1,700 new rooms entering into the market in the next two years, hotel performance is anticipated to be under pressure. Having said that, between 2015 and the first half of 2016, the domestic leisure segment is anticipated to increase due to the weakening rupiah (against the US dollar) limiting international outbound travel. This is expected to minimize the decline in occupancy due to the factors aforementioned.
Source: Badan Pusat Statistik Indonesia*2014 Total Arrivals have been estimated
TOTAL VISITOR ARRIVALS – BOGOR CITY (2007–2014 ESTIMATE)
-20%
0%
20%
40%
60%
80%
100%
0
500
1,000
1,500
2,000
2,500
3,000
3,500
4,000
2007 2008 2009 2010 2011 2012 2013 2014 *
% C
han
ge
Tota
l Arr
ival
s (T
ho
usa
nd
s)
Total Arrivals % Change
Hotel Performance Overview
Situated in proximity to Jakarta and with good accessibility from the city, Bogor's hospitality industry has benefitted from its location. Bogor is within comfortable driving distance of Jakarta; this is in contrast to other competing leisure and meeting destinations near Jakarta such as Bandung or Ciawi. The city's location has allowed commuters to save on both time as well as associated travel expenses.
Hotel performance in 2013 in Bogor was undisputedly the best in the past few years. This was mainly due to the many meetings
MARKETWIDE HOTEL PERFORMANCE (2012–2016F)
Source: HVS Research
Estimated Marketwide ADR (IDR) Estimated Marketwide RevPAR (IDR)
Estimated Marketwide Occupancy (%)
20%
30%
40%
50%
60%
70%
80%
90%
0
1,00,000
2,00,000
3,00,000
4,00,000
5,00,000
6,00,000
7,00,000
2012 2013 2014 2015F 2016F
Occ
up
ancy
(%
)
Ave
rage
Dai
ly R
ate
& R
evP
AR
(ID
R)
Based on our analysis, it is most likely that the overall hotel market in 2015 will continue to underperform compared to the previous year mainly due to the impact that the government meeting regulation has had on the first half of the year, and
Indonesia Hotel Watch 2015 | PAGE 52
TOP SOURCE MARKETS TO BOGOR (2013)
Source: HVS Research*Singapore, Malaysia, Japan, China & the Netherlands
Domestic
International*
International - Other
97%
2% 1%
Source: HVS Research
GROWTH OUTLOOK FOR BOGOR HOTEL MARKET
-6%
0%
-5%
3%
-13%
9%
Marketwide Occupancy
(%)
ADR
(IDR)
RevPAR
2015F
2016F
(IDR)

owing to the new supply entering the market. It is anticipated that 2015 will close with an average occupancy of 69%, declining by six percentage points from the year before, and ADR will decline by 5% to IDR518,000. This performance will result in an overall decline of 13% in RevPAR to an average of IDR376,000.
In 2016, though actual demand is expected to recover, the introduction of 13 new hotels will most likely see occupancy levels stagnate. Room rates would most probably see a recovery (+3%), with the growth in demand hampered by competitive forces exerted by new supply resulting in an average ADR of IDR534,000.
New Developments & Hotel Supply
Supply increase in Bogor had previously been rather gradual. However, in recent years, the city began to attract the attention of investors owing to its past strong performance, with interest peaking in 2013 when hotel performance was at a record high. This has now resulted in the surge of new supply expected in 2016. The introduction of new branded hotels such as Park Royal, Golden Tulip, Pullman and Hyatt Regency, to name a few, may bring along with it fresh induced demand resulting in new competitive dynamics within the market.
Moreover, the market continues to benefit from the many leisure attractions that were developed in 2013. It is inevitable for Bogor's tourism industry to continue growing in popularity as domestic travel gains pace.
Hotel performance in the near future may be challenging given the expected competitive landscape in the coming years. This, however, should not negate the true potential of the destination once appropriate initiatives to spur demand are in place and the market stabilises.
Source: Badan Pusat Statistik West Java
CHANGE IN MARKETWIDE HOTEL SUPPLY (2011–2016F)
Total Number of Hotels % Change in Supply (Rooms)
0%
10%
20%
30%
40%
50%
60%
70%
80%
0
10
20
30
40
50
60
70
80
2011 2012 2013 2014 2015F 2016F
% C
han
ge in
Su
pp
ly (
Ro
om
s)
Nu
mb
er
of
Ho
tels
Market Outlook & Development Opportunities
Since 2014, hotel performance in Bogor has been on a decline due to various factors that affected the market as a whole. However, the overall performance is anticipated to witness gradual improvement in 2016 when demand is expected to recover, although the notable increase in supply will continue to put pressure on occupancies.
There remains much potential for the city of Bogor to develop its standing as a meetings destination. The industry could explore the possibility of holding more international meetings in the coming years; this may be an alternative to circumvent the current domestic meeting regulation and alleviate the strain that is presently felt on the market.
Indonesia Hotel Watch 2015 | PAGE 53

MEDAN
Indonesia Hotel Watch 2015 | PAGE 54

Medan
Overview
Medan is the capital of the province of North Sumatra and is located along the Straits of Malacca. The island of Sumatra (or Sumatera) consists of eight different provinces, of which North Sumatra is the second-most Northern Province after Aceh. With an estimated population of 2.1 million inhabitants, this former Dutch colony and trading post is one of the largest cities in Indonesia.
As part of MP3E¹ Sumatra has been identified as a centre for production and processing of natural resources and Medan, already considered an economic and commercial hub for northern Indonesia, has been earmarked as an international hub and the future western logistics gateway for the country. Sumatra's economy is founded upon the production of key commodities such as palm oil, coffee, cocoa, nickel, gold, tin and oil and gas.
Major attractions within and around Medan include the famous Lake Toba, the Great Mosque and the Palace of the Sultan of Deli. Medan is also often visited for its historical past as a major Dutch colonial trading post and the influence that this rich history has had on its architecture. In addition, the city is also visited for its golf courses and shopping.
Accessibility
Medan's new international airport, Kualanamu International Airport, is Indonesia's second-largest airport after Jakarta's Soekarno-Hatta International Airport. The airport is well connected to key domestic markets, acting as a hub for Garuda Indonesia, Indonesia AirAsia, Lion Air and Susi Air. Kualanamu is able to handle approximately eight times the capacity of the old Polonia International Airport which it replaced in July 2013. The airport is located outside the city of Medan, in Deli Serdang.
Greater connectivity between Medan city, Kualanamu International Airport and Perbarakan is expected with the development of a new toll road connecting Medan, Kualanamu and Tebing Tinggi. The government expects the first two sections of the toll road to be complete by June 2017 though the project is still only in its initial stage of development. This toll road will be part of a much larger Trans-Sumatra toll road development that will link Aceh to Lampung. Medan is located further up north, away from other metropolitan cities in southern Sumatra. Improvements to connectivity are expected to stimulate travel and trade and increase potential for economic growth throughout Sumatra.
In January 2015, the government commenced the expansion of Belawan port's shipping container terminals as well as the deepening of the sea channel to transform it into a maritime highway. The expansion of the port is expected to double the port's capacity and allow for larger vessels to dock in the port. Belawan Port, located in northwest Medan, is one of Indonesia's busiest cargo ports. Belawan is on the Straits of Malacca, across from Penang, a major shipping port of Malaysia since the 1800s. The government intends to develop Belawan into a major logistics gateway, located along the shipping route
between the Bay of Bengal through the Straits of Malacca to China.
The development of the Trans-Sumatra toll road and Belawan Seaport are two significant initiatives, part of the government's MP3E plans to improve connectivity in Sumatra. With these two major initiatives and the recently-built airport, we can expect a greater influx of corporate travel to Medan as the economy grows and develops.
Tourism Market Overview
Medan, the largest city in northern Indonesia, is the economic hub and commercial centre for North Sumatra and its surrounding provinces. The city benefits from steady commercial demand and, until recently, constant government demand for hotel accommodation. Total passengers arriving in Kualanamu almost doubled between 2009 and 2013 to a total of 4.1 million.
In 2014, a decline in total arrivals to Kualanamu was attributed to the uncertainty caused by the presidential elections. Between November and the first half of 2015, domestic arrivals to Medan are expected to continue to experience a decline, mainly due to the new regulation restricting government meetings that was passed in November 2014.
In April 2015, the government issued, Permenpan RB No. 6/2015, which supersedes the previous regulation in November. Although the new regulation's guidelines are more liberal, there still continue to be restrictions on meetings in hotels. While the new regulation is certainly a positive step forward for hotels, the industry continues to remain affected seeing a slow recovery to a major segment of theirs.
The corporate segment is very much dependent on domestic demand from the various surrounding cities as well as Jakarta. Over three quarters of business travel to hotels in Medan originates in Jakarta. Since the restrictions on government meeting venues came into effect (in November 2014), midscale hotels in Medan have experienced a strong decline in demand from government agencies and related corporate groups, up to 25% decline at some hotels. Upscale hotels, which have traditionally been beyond the budgets of the government segment, maintained a healthy performance through the changes in policies, sustained by other market segments.
Indonesia Hotel Watch 2015 | PAGE 551 Master Plan Acceleration and Expansion of Indonesia Economic Development 2011–2025
Source: Ministry of Transport, Indonesia
TOTAL VISITOR ARRIVALS – KUALANAMU INTERNATIONAL AIRPORT (2009–OCT 2014 YTD)
-10%
-5%
0%
5%
10%
15%
20%
25%
0
500
1,000
1,500
2,000
2,500
3,000
3,500
4,000
4,500
2009 2010 2011 2012 2013 Oct 2013 YTD
Oct 2014 YTD
% C
han
ge
Tota
l Arr
ival
s (T
ho
usa
nd
s)
Total Arrivals % Change

The leisure travel demand for Medan is mainly dependent on domestic travel from the surrounding areas within Sumatra. The Acehnese, who visit Medan for the weekend, are a notable demand segment. International leisure travellers mainly originating from Malaysia and Singapore visit the city for golf, shopping, historic landmarks and meeting friends and family. Medan is commonly viewed as a transit leisure destination for tourists intending to visit Lake Toba as part of their itinerary before visiting other destinations across Sumatra.
Visitor arrivals to Medan are reliant on domestic travellers that make up approximately 80% of all airport arrivals to the city. Foreign arrivals to Medan are predominantly driven by the Malaysian market, which made up 58% of all international arrivals in 2013.
With Medan growing as a tourism destination, the average length of stay of foreign and domestic travellers have continued to grow; this trend is expected to continue in the near future.The average length of stay for international guests in hotels in Medan was 2.51 days in 2013, recording an increase of 20% from 2.08 days registered in 2009. Average length of stay of domestic guests also increased from 1.37 days in 2009 to 1.55 days in 2013.
The seasonality in Medan coincides with the many Indonesian public holidays throughout the year. December usually receives the highest volume of travellers due to the end of year school holidays as well as the festive season of Christmas and New Year.
Source: Ministry of Tourism Indonesia
SEASONALITY OF ARRIVALS TO MEDAN (2012–OCT 2014 YTD)
250
270
290
310
330
350
370
390
410
Jan Feb Mar Apr May Jun Jul Aug Sep Oct Nov Dec
Vis
ito
r A
rriv
als
(Th
ou
san
ds)
2012 2013 Oct 2014 YTD
Indonesia Hotel Watch 2015 | PAGE 56
Hotel Performance Overview
Medan's tourism has predominantly been driven by the domestic corporate segment. Many hotels have suffered from the regulations regarding government meetings and demand from this segment has significantly declined. With slow growth in the corporate segment and leisure travel still a nascent segment, hotels have not yet been able to replace the loss of government demand with another demand segment. Hotels are currently starting to see slight improvements in the second half of this year since the revision of the government policy. It is, however, most likely that the situation will only see notable improvements towards the third quarter of 2015 or the start of 2016.
The hotel market in Medan is largely made up of independent local hotels with only a handful of locally branded properties. Economy hotels and bed-and-breakfasts currently make up approximately 55% of total supply of rooms within the market with the remaining split between midscale (17%) and upscale (28%). As of 2013, the market in Medan is estimated to have just under 9,200 rooms. The overall market sentiment is that there is an oversupply of rooms and any increment will only worsen the situation. As of now, Medan's market performance indicates that only its key branded hotels are outperforming the market. Badan Pusat Statistik reported that in 2013, average marketwide occupancy was approximately 53%.
Unlike other sectors of the market, upscale hotels saw little impact on their performance in the first half of 2015. The occupancies of these hotels have fallen by approximately two percentage points; however, their ADRs have risen by approximately 6% to IDR650,000. The upscale segment in Medan has traditionally not been as dependent on the government meeting segment as midscale hotels, and has thus managed to maintain a stable performance.
Source: Badan Pusat Statistik Kota Medan
TOP SOURCE MARKETS TO MEDAN (2013)
Malaysia
Singapore
China
Netherlands
Australia
Others
58%
7%
3%
3%2%
27%

Overall occupancy for the upscale market in 2015 is expected to decline slightly with the slowdown in the first half of the year. Hotels in this segment, however, have managed to realise a growth in their ADRs in the first half of 2015 and are expected to continue to maintain this growth as they enter into the peak season towards the end of year. The forecasted 4% increase in ADR is expected to offset the decline in occupancy thereby translating into a RevPAR growth of 1%. Occupancies and ADRs are expected to continue to grow in 2016; however, it is anticipated that new competition will put pressure on ADRs, limiting their growth.
New Developments & Hotel Supply
Room supply in Medan has remained relatively stable over the past few years. At present there are six hotels expected to open before 2017, but several of these are facing delays. Though planned to open by the end of 2015, Hotel Neo and Hotel Adimulia are both facing delays and unlikely to open on schedule.
Market Outlook & Development Opportunities
The recent imposition of the ban on government meetings has generally had a big impact on most sectors of the market, with upscale hotels an exception to this. It is anticipated that there may be further adjustments to the regulations on government meetings that would most likely act in favour of the hotels. The intrinsic lure of the destination would most likely see tourist arrivals return to its former strength driven by corporate demand.
With new developments poised to improve connectivity and boost Medan's economy, optimism for future growth in tourism abounds. With Kualanamu International Airport acting as a major hub in Northern Sumatra, Medan stands to benefit from tourism developments planned for other surrounding destinations such as the Mentawai Island, a popular surfing and eco destination.
Though an oversupply may be experienced in most hotel sectors, the number of branded hotels in the market is still limited. Potential growth in demand for the city may usher in new opportunities and growth in ADR for hotels that are well established in the market.
Source: HVS Research
UPSCALE HOTEL MARKET PERFORMANCE (2012–2016F)
50%
55%
60%
65%
70%
75%
80%
0
1,00,000
2,00,000
3,00,000
4,00,000
5,00,000
6,00,000
7,00,000
2012 2013 2014 2015F 2016F
Occ
up
ancy
(%
)
Ave
rage
Dai
ly R
ate
& R
evP
AR
(ID
R)
Estimated Upscale ADR (IDR) Estimated Upscale RevPAR (IDR)
Estimated Upscale Occupancy (%)
Source: HVS Research
CHANGE IN UPSCALE HOTEL SUPPLY (2012–2016F)
-5%
0%
5%
10%
15%
20%
25%
155
160
165
170
175
180
185
190
195
200
205
2012 2013 2014 2015F 2016F
% C
han
ge in
Su
pp
ly (
Ro
om
s)
Nu
mb
er
of
Ho
tels
Total Number of Hotels % Change in Supply (Rooms)
Indonesia Hotel Watch 2015 | PAGE 57
Source: HVS Research
GROWTH OUTLOOK FOR UPSCALE HOTEL MARKET
Upscale Hotel
Market
Occupancy
(%)
ADR
(IDR)
RevPAR
(IDR)
2015F
2016F
-2%
1%
4%
3%
1%
4%

7574
7574O
UR
PR
OJE
CT
EXPE
RIE
NC
E
CH
INA
CA
MB
OD
IA
IND
ON
ES
IA
MA
LA
YS
IA
SIN
GA
PO
RE
(TH
E)
MA
LD
IVE
S
SE
YC
HE
LLE
S
MY
AN
MA
R
TH
AIL
AN
DV
IET
NA
LA
OS
M
an
go
n
BH
UTA
No
SR
I L
AN
KA
JAP
AN
(TH
E)
PH
ILIP
PIN
ES
AU
ST
RA
LIA
NE
W Z
EA
LA
ND
NO
RT
H
MA
RIA
NA
IS
LA
ND
S
(SO
UT
H)
KO
RE
A
Pro
vin
ces
Mu
nic
ipa
liti
es
Au
ton
om
ou
s R
eg
ion
s
Gre
ate
r C
hin
a
• Dae
gu
Ad
elai
de
Ag
nes
Wat
erBe
nd
igo
Cai
rns
Co
ffs
Har
bo
ur
Cre
swic
kH
erve
y Ba
yM
acka
yPo
rt A
ug
ust
aPo
rt C
amp
bel
lTa
mar
Val
ley
Wo
llon
go
ng
Hai
ph
on
gPh
u Q
uo
cTu
y H
oa
Fuku
oka
Hiro
shim
aH
yog
oN
ish
ihar
aSa
ga
Sen
dai
Bog
or
Lom
bo
kM
agel
ang
Pala
ng
ka R
aya
Pon
tian
akSe
ntu
lSu
mb
awa
Ch
ach
eon
gsa
oPr
ach
uap
Kh
iri K
han
Khao
Yai Be
nto
taBe
ruw
ela
Ch
ilaw
Ham
ban
tota
Tan
gal
leJo
ho
r Bah
ruKu
anta
nPe
nan
gSe
lan
go
r
OU
R PR
OJE
CT E
XPER
IEN
CE

HVS Asia Pacific
Indonesia Hotel Watch 2015 | PAGE 59
Bangkok62 Soi Langsuan, Ploenchit RoadUnit 2302, 23rd Fl., The Millennia Tower Bangkok 10330Thailand
BeijingUnit 2423, South Tower, Beijing Kerry Centre 1 Guanghua Road, Chaoyang District, Beijing 100020PR China
Hong KongLevel 21, The Center99 Queen's Road CentralHong Kong
JakartaIndonesia Stock Exchange Building, Tower II, 17th FloorJl. Jenderal Sudirman Kav 52-53Jakarta 12190Indonesia
Mumbai501, 5th floor, Landmark136, Hill Road, Bandra (West), Mumbai 400050India
New Delhi6th Floor, Tower - CBuilding No. 8DLF Cyber City Phase IIGurgaon 122002 India
Shanghai51F Raffles City Centre268 Xi Zang Middle RoadHuangpu District Shanghai 200001 PR China
ShenzhenOriental Plaza, Room 5091072 Jianshe RoadShenzhen 518001PR China
Singapore6 Temasek Boulevard#23-01A Suntec Tower FourSingapore 038986
HVS Services
• Consulting & Valuation
• Executive Search
• Investment Banking
• Asset Management & Advisory
• Hotel Management
• Parking
• Gaming
• Property Tax
• Convention, Sports & Entertainment Facilities Consulting
• Design
• Shared Ownership
• Golf
• Energy & Sustainability
• Risk Management
• Marketing Communications
• Professional Skills Development
HVS Offices
North America
• Atlanta
• Boston
• Boulder
• Chicago
• Dallas
• Denver
• Houston
• Las Vegas
• Los Angeles
• Mexico City
• Miami
• Minneapolis
• New Orleans
• New York
• Newport
• Portland
• Philadelphia
• San Francisco
• St. Louis
• Toronto
• Vancouver
• Washington, D.C.
The Caribbean
• Bahamas
South America
• São Paulo
Europe
• Athens
• London
• Milan
Middle East
• Dubai
Africa
• Cape Town
Superior Results through Unrivalled Hospitality Intelligence.
Everywhere.
HVS.com

Superior Results through Unrivalled Hospitality Intelligence. Everywhere.
With HVS by your side, you achieve success for your
hospitality assets
HVS.com
Consulting & Valuation
Ÿ Hotels
Ÿ Casinos/Gaming
Ÿ Golf
Ÿ Shared Ownership
Ÿ Property Tax
Ÿ Convention, Sports & Entertainment Facilities
Executive Search
Investment Banking
Asset Management
Management
Ÿ Hotels
Ÿ Parking
Design
Energy & Sustainability
Risk Management
Marketing Communications
Professional Skills Development

HVS.com HVS SINGAPORE | 6 Temasek Boulevard #23-01A Suntec Tower Four Singapore 038986
About HVSHVS, the world’s leading consulting and services organization focused on the hotel,
mixed-use, shared ownership, gaming, and leisure industries, celebrates its 35th
anniversary this year. Established in 1980, the company performs 4,500+
assignments each year for hotel and real estate owners, operators, and developers
worldwide. HVS principals are regarded as the leading experts in their respective
regions of the globe. Through a network of more than 35 offices and more than 450
professionals, HVS provides an unparalleled range of complementary services for
the hospitality industry. HVS.com
Superior Results through Unrivalled Hospitality Intelligence. Everywhere.
HVS ASIA PACIFIC is represented by eight offices: Singapore, New Delhi, Bangkok,
Beijing, Shenzhen, Shanghai, Hong Kong and Jakarta. HVS hosts three of the main
annual industry events in the region, namely the China Hotel Investment
Conference (CHIC), Hotel Investment Conference - South Asia (HICSA) and the
Tourism, Hotel Investment & Networking Conference (THINC) Indonesia, in
addition to Hotel Operations Summit India (HOSI). Additionally, HVS publishes a
wide range of leading research reports, articles and surveys, which can be
downloaded from our online library. ( ) hvs.com/library
HVS SINGAPORE team has worked on a broad array of projects that include
economic studies, hotel valuations, operator search and management contract
negotiations, development strategies for new brands, asset management,
research reports and investment advisory for hotels, resorts, serviced residences
and branded residential development projects. For more information, please visit
( ) hvs.com/Offices/Singapore
Bhoom i j a Va d e h ra ,SeniorAssociatewithHVSSingapore, is responsiblef o r c o n s u l t i n g a n dvaluation assignmentsundertaken by the officei n c l u d i n g f e a s i b i l i t y
studies,marketstudiesandvaluationsintheAsiaPacificregion.bvadehra@hvs.com
About the Authors
Feny Sindarta is SeniorAnalystwithHVSSingapores p e c i a l i z i n g i n h o t e lvaluation and consultancy.She has conducted variousvaluations,marketresearch
andfeasibilitystudiesforawiderangeofhotelsandresortsinIndonesiaaswellasotherAsiaPacificregions.fsindarta@hvs.com
S aman tha Poh i s a nAnalystatHVSSingapore.Inh e r r o l e , S a m a n t h aspecialises in researchstudies and publicationsandprovidestheconsulting
andvaluationteamwithenvironmentalana lys is for markets across [email protected]
Manav Thadani , MRICSChairman-HVSAsiaPacific,joinedthecompanyin1995in its New York Office. Hewent on to start the Indiaoperationsin1997andwasHVS’firstemployeeinAsia.
Presently,besidesservingasamentortoHVSSouthAsia,ManavprovidesdirectiontothelargerteamacrossAPAC,ensuringthat all offices in the region operatecohesivelyandeffectively.Additionally,heruns three conferences in the region –HotelInvestmentConference-SouthAsia(HICSA) , Ch ina Hote l InvestmentConference (CHIC) and Tourism, HotelInvestment & Networking Conference(THINC)[email protected]