INDONESIA ECONOMIC PROSPECTS
65
Transcript of INDONESIA ECONOMIC PROSPECTS

INDONESIA ECONOMIC PROSPECTS Boosting the Recovery
June 2021

Preface
The Indonesia Economic Prospects (IEP) is a bi-annual World Bank report that assesses recent macroeconomic developments, outlook and risks, as well as specific development challenges for the Indonesian economy. In doing so, the IEP aims to inform the public policy debate and is geared towards a wide audience, including the general public, the government, the private sector, civil society organizations, and other domestic and international stakeholders. The IEP has two main parts. Part A highlights key developments in the Indonesian economy over recent months, and places these in a longer-term context. Based on these developments, and on policy changes over the period, the IEP regularly updates the outlook for Indonesia’s economy. The ongoing COVID-19 pandemic highlights the continued need for sound macroeconomic monitoring to help the economy weather the impact of the crisis. Part B provides an in-depth examination of selected economic and policy issues, and an analysis of the country’s medium-term development challenges. The IEP is a product of the World Bank Jakarta office and receives strategic guidance from an editorial board chaired by Satu Kahkonen, Country Director for Indonesia and Timor-Leste. The report is prepared by the Macroeconomics, Trade, and Investment (MTI) Global Practice team, under the guidance of Lars Christian Moller (Practice Manager) and Habib Rab (Lead Economist). The report is led by Abdoulaye Sy (Senior Economist) and prepared by a core team composed of Alief Aulia Rezza, Angella Faith Lapukeni, Anthony Obeyesekere, Assyifa Szami Ilman, Dara Lengkong, Dwi Endah Abriningrum, Galuh Chandra Wibowo, Gracia Hadiwidjaja, Imam Setiawan, Indira Maulani Hapsari, Josefina Posa-das, Kathleen Victoria Tedi, Neni Lestari, Ou Nie, Yus Medina, Ralph Van Doorn, Ratih Dwi Rahmadanti, Sara Giannozzi and Virgi Agita Sari. Deviana Djalil provided administrative support and coordinated the organization of the report launch event. Dissemination is organized by Jerry Kurniawan and Nugroho Nurdikiawan Sunjoyo under the guidance of Lestari Boediono Qureshi. The report was formatted by Arsianti and edited by Janani Kandhadai. Part A of this edition of the IEP was prepared by Abdoulaye Sy (report lead), Indira Maulani Hapsari (real sector), Anthony Obeyesekere (fiscal sector) and Dwi Endah Abriningrum (external sector), Dara Lengkong, Ou Nie and Neni Lestari (financial sector), Josefina Posadas and Gra-cia Hadiwidjaja (labor market), Virgi Agita Sari, Rabia Ali, Bambang Suharnoko Sjahrir and Imam Setiawan (poverty) and Sara Giannozzi (social protection) and benefited from inputs and comments from Ralph Van Doorn, Francesco Strobbe, Ketut Kusuma, Achim Daniel Schmillen, Sailesh Tiwari and Somil Nagpal. The report also benefited comments from Ekaterina T. Vashakmadze, Ergys Islamaj and Daisuke Fukuzawa on behalf of the World Bank Chief Economist Office for East Asia and Pacific. Part B was prepared by Maria Monica Wihardja, Anna O’Donnell, Wendy Cunningham, and Kate Anna Shanahan with inputs from Rinku Murgai, Abdoulaye Sy, Achim Daniel Schmillen, Habib Rab, Ririn Purnamasari, Josefina Posadas, Sara Giannozzi, Indira Maulani Hapsari, Hasan Dudu, Rythia Afkar, and Abror Tegar Pradana. This report is a product of the staff of the International Bank for Reconstruction and Development/the World Bank and is supported by funding from the Australian government under the Australia-World Bank Indonesia Partnership (ABIP). The findings, interpretations, and conclusions expressed in this report do not necessarily reflect the views of the Executive Directors of the World Bank or the governments they represent, or the Australian government. The World Bank does not guarantee the accuracy of the data included in this work. The data cut-off date for this report was May 31, 2021. The boundaries, colors, denominations, and other information shown on any map in this work do not imply any judgment on the part of the World Bank concerning the legal status of any territory or the endorsement or acceptance of such boundaries. The Photograph is by Didik Setiawan/ https://www.shutterstock.com/g/Didik+Setiawan/ All rights reserved.
This report is available for download in English and Indonesian via: worldbank.org/iep Previous report editions:
• December 2020: Towards a Secure and Fast Recovery
• July 2020: The Long Road to Recovery
• December 2019: Investing in People To receive the IEP and related publications by email, please email [email protected]. For questions and comments, please email [email protected] and [email protected] For information about the World Bank and its activities in Indonesia, please visit:
www.worldbank.org/id instagram.com/worldbank
@BankDunia #IEPBankDunia www.linkedin.com/company/the-world-bank
BankDunia
Abbreviations
APBN Anggaran Pendapatan dan Belanja Negara IT Information Technology
ASEAN Association of Southeast Asian Nations LHS Left Hand Side
Banpres Bantuan Presiden LMIS Labor Market Informatiom System
BI Bank Indonesia MoF Ministry of Finance
BKPM Badan Koordinasi Penanaman Modal MPO Macro Poverty Outlook
BLT Bantuan Langsung Tunai MSME Micro Small Medium Enterpise
BoP Balance of Payments MTI Macroeconomics, Trade And Investment
BPJS Badan Penyelenggara Jaminan Sosial NER Net Enrolment Rates
BPNT Bantuan Pangan Non Tunai NEER Nominal Effective Exchange Rate
BPS Biro Pusat Statistik NFA Net Foreign Assets
BST Bantuan Sosial Tunai NPL Non-Performing Loan
CMEA Coordinating Ministry for Economic Af-fairs
OECD Organization for Economic Co-Operation and Development
COVID-19 Corona Virus Disease OJK Otoritas Jasa Keuangan
CGE Computable General Equilibrium OMO Open Market Operation
CPI Consumer Price Index PIAAC Program for The International Assessment of Adult Competencies
CVI Corporate Vulnerability Index PISA Programme for International Student Assess-ment
DTKS Data Terpadu Kesejahteraan Sosial PKH Program Keluarga Harapan
EAP East Asia Pacific PPP Purchasing Power Parity
EAPGIL East Asia Pacific Gender Innovation Lab REER Real Effective Exchange Rate
EBIT Earnings Before Income Tax RHS Right Hand Side
ECED Early Childhood And Education Develop-ment
ROA Return on Assets
EM Emerging Market ROE Return on Equity
EMDE Emerging Market And Development Economy
SA Social Assistance
EME Emerging Market Economies SAM Social Accounting Matrix
F&B Food and Beverage SME Small Medium Enterprises
FDI Foreign Direct Investment STEM Science, Technology, Engineering, and Math-ematics
FLFPR Female Labor Force Participation Rate Sakernas Survei Angkatan Kerja Nasional
GDP Gross Domestic Product Susenas Survei Sosial Ekonomi Nasional
GPI Gender Parity Index TVET Technical and Vocational Education Training
GVC Global Value Chain UCT Unconditional Cash Transfer
HHE Household Enterprises UMKM Usaha Mikro, Kecil, dan Menengah
ICLS International Conference of Labor Statis-tician
UNDP United Nation Development Programme
ICR Interest Coverage Ratio UNICEF United Nations Children’s Fund
ICT Information And Communication Technology
VAT Value Added Tax
IEP Indonesia Economic Prospects WDI World Development Indicator
ILO International Labour Organization WEO World Economic Outlook
IMF International Monetary Fund
Table of Contents
PREFACE ................................................................................................................................... I
ABBREVIATIONS ..................................................................................................................... II
EXECUTIVE SUMMARY: BOOSTING THE RECOVERY ......................................................... 1
A. ECONOMIC AND FISCAL UPDATE ..................................................................................... 6
1. A Diagnostic of the Recovery ........................................................................................................................................................ 6 2. The Policy Response ................................................................................................................................................................... 11 3. The Outlook ................................................................................................................................................................................ 21 4. Policy Recommendations to Bolster the Recovery and Medium-term Prospects ........................................................................23
B. TOWARDS HIGHER QUALITY AND MORE INCLUSIVE JOB CREATION ...................... 28
1. Introduction .................................................................................................................................................................................28 2. What is inhibiting the transition to middle class jobs? ................................................................................................................29 3. What is holding back women’s economic participation? .............................................................................................................36 4. A transition challenged: the labor market impact of COVID-19 .................................................................................................. 41 5. Policy Recommendations ............................................................................................................................................................43
REFERENCES ......................................................................................................................... 47
ANNEXES ................................................................................................................................ 52
Annex 1. COVID-19 Social Assistance Package 2020-2021 – Continued and Discontinued Programs ............................................52 Annex 2. Estimates of fiscal multipliers for Indonesia ....................................................................................................................54
FIGURES
Figure A.1:The Recession Exacted a Heavy Toll on Families, Firms, and Individuals.................................................................... 6 Figure A.2: Illustration of The Estimation of The Recovery Gap and Recovery Speed .................................................................... 9 Figure A.3: Indonesia Has Been Recovering More Gradually than Peers ........................................................................................ 9 Figure A.4: Indonesia’s Recovery Speed Has Been Lower than Peers ............................................................................................. 9 Figure A.5: …As Growth Remained Subdued .................................................................................................................................. 9 Figure A.6: The Recovery Gap Remained Elevated for Domestic Demand and in Contact-intensive Services .............................. 10 Figure A.7: Retail Sales Have Been Weak Compared to Peers but Rebounded Strongly in April ................................................... 10 Figure A.8: Manufacturing Has Been Rebounding Strongly ........................................................................................................... 10 Figure A.9: COVID-19 Cases and Test Positivity Rates Have Declined from Their Peak at the Start of the Year .......................... 10 Figure A.10: The Vaccine Rollout Has Accelerated But Is Below the Government Target for Herd Immunity and Some Peer
Countries. .................................................................................................................................................................................. 10 Figure A.11: Consumer Sentiment Has Improved but Short-term Expectations Remained Depressed. ......................................... 10 Figure A.12: Large Portfolio Outflows During the First Quarter of This Year Contributed to External Financing Pressures ........ 12 Figure A.13: Indonesia Relied Heavily on Foreign Exchange Interventions and Moderately on Exchange Rate Flexibility to
Manage Past External Financing Pressures .............................................................................................................................. 12 Figure A.14: External Buffers Have Strengthened but Budget Financing Conditions Have Tightened Compared to The 2013
Taper Tantrum .......................................................................................................................................................................... 12 Figure A.15: Real Policy Rates are High Relative to Inflation Deviation from Official Targets ...................................................... 12 Figure A.16: M2 Growth is Low Relative to Inflation ...................................................................................................................... 13 Figure A.17: BI Balance Sheet Expansion Has Been Moderate as Government Financing Rose While Private Sector Credit
Plummeted. ............................................................................................................................................................................... 13 Figure A.18: Credit Growth Has Collapsed ..................................................................................................................................... 15 Figure A.19: Asset Quality Is Generally High But Loans-at-risk Have Risen Sharply ..................................................................... 15 Figure A.20: Non-financial Corporates Balance Sheets Vulnerabilities Have Increased During the Pandemic, But Remained Low
Except in Some Sectors ............................................................................................................................................................. 15 Figure A.21: Vulnerable Companies Are More Leveraged and Have Lower Debt Repayment Capacity ......................................... 15 Figure A.22: Fiscal Policy Has Expanded in Response to The Crisis in Indonesia and EMDEs ................................................... 17 Figure A.23: Indonesia’s Budget Financing Constraints Triggered Relatively Large BI Support amid Higher Financing Needs . 17 Figure A.24: The Interest payments-to-revenue Ratio is High Relative to Indonesia’s Low Level of Government Debt ................ 17 Figure A.25: The Deficit in 2020 was Driven More by a Drop in Revenue than An Increase in Expenditure ................................. 17 Figure A.26: Fiscal Imbalances Have Led to a Sharp Rise in Overall Government Debt, which Remained Low Overall ............... 17 Figure A.27: Revenue Buoyancy Has Been Low ............................................................................................................................. 17 Figure A.28: All Taxes Have Declined Sharply Over the Course of 2020 ......................................................................................... 18 Figure A.29: Real Spending Increased Sharply Albeit from a Low Base ......................................................................................... 18 Figure A.30: Actual and Simulated Poverty Rates, 2019-2021 ...........................................................................................................20 Figure A.31: Some of the Discontinued or Reduced SA Programs in 2021 Have Relatively Higher Coverage Among Those Near
the Poverty Line ......................................................................................................................................................................... 21 Figure A.1.1: Poverty Increased in More Impacted Provinces .......................................................................................................... 8 Figure A.1.2: …Particularly in Urban Areas ..................................................................................................................................... 8 Figure A.2.1: The “Indonesia Premium” After Controlling for Macro and Financial Market Variables .......................................... 18 Figure A.3.1: Execution of The 2020 COVID-19 Fiscal Package ..................................................................................................... 19 Figure A.3.2: COVID-19 Fiscal Package in 2020 and 2021 ............................................................................................................... 19 Figure A.5.1: Government Revenues May Not Fully Recover in the Absence of Reforms as Evident in the Post-Global Financial
Crisis Period ..............................................................................................................................................................................26 Figure A.5.2: A Fiscal Deficit of 3 Percent of GDP Starting in 2023 Could Be Achieved Through a Mix of Spending and Revenue
Reforms .....................................................................................................................................................................................26 Figure A.5.3: Size of Expenditure Cuts and Revenue Improvements to Achieve a 3 Percent of GDP Fiscal Deficit Starting in 2023
...................................................................................................................................................................................................26 Figure A.5.4: Financing Needs, Public Debt and Interest-to-revenue Ratio ...................................................................................26 Figure B.1: Almost half of jobs created between 2008 and 2018 have accrued to low-end, low-wage services .................................30 Figure B.2: The total contribution of structural change to growth in Indonesia is muted compared to other comparator countries
................................................................................................................................................................................................... 31 Figure B.3: Higher productivity growth is associated with higher employment growth ................................................................. 31 Figure B.4: More productive sectors tend to pay better wages, but employ a minority of workers .................................................32 Figure B.5: Almost two thirds of employees work without any written work contract while another one fifth work under fixed-
term (or temporary) contracts ....................................................................................................................................................33 Figure B.6: Job creation in medium and large manufacturing sector halted during the ‘hollowing-out’ decade amounting to a
decade of lost middle-class jobs ................................................................................................................................................34 Figure B.7: Average firm size does not begin to increase until a firm is 22 years old ......................................................................34 Figure B.8: Indonesia’s FLFPR is on par with other countries at its level of development, it is significantly below other
developing countries in EAP including Cambodia and Vietnam ..............................................................................................37 Figure B.9: Marriage and childbearing continue to be big predictors of dropout from the labor market… ....................................40 Figure B.10: ...while having secondary education makes the largest difference to women’s labor force participation during the
main reproductive age ...............................................................................................................................................................40
Figure B.11: The crisis has led to negative net employment impacts for men of all ages but positive net employment impacts for women, except those in early childbearing years (19-29) ...........................................................................................................43
Figure B.12: The impact of the pandemic was positive on employment in the agriculture sector for both women and men, and also in trade, accommodation and F&B for women only ...........................................................................................................43
TABLES
Table ES.1: The Recovery is Projected to Strengthen But Uncertainty Remains Exceptionally High ............................................. 2 Table A.1: Key Macroeconomic Indicators, 2019-2022 .....................................................................................................................23 Table A.2: Possible Medium-term Tax Policy and Administration Reforms ...................................................................................27 Table A.5.1: Illustrative Scenarios to Achieve the Government’s 3 percent of GDP Fiscal Deficit Goal in 2023 ..............................25 Table B.1: Household enterprises host close to 90 percent of informal workers in both the agriculture and non-agriculture sector
in Indonesia ...............................................................................................................................................................................33
BOXES
Box A.1: The Impact of COVID-19 on Poverty in 2020 ..................................................................................................................... 8 Box A.2: Determinants of Local currency Sovereign Bond Yields in Indonesia .............................................................................. 18 Box A.3: Execution and Adjustments to The Government’s COVID-19 Fiscal Package ................................................................. 19 Box A.4: Outlook Assumptions and Downside Risks ......................................................................................................................22 Box A.5: Achieving the Fiscal Deficit Ceiling by 2023: Scenario Analysis .......................................................................................25 Box B.1: Definition of Middle-Class Jobs ........................................................................................................................................28 Box B.2: Estimating the growth returns for women’s economic participation ................................................................................38 Box B.3: Women and the Work-Care Nexus ...................................................................................................................................40
B o o s t i n g t h e R e c o v e r y I n d o n e s i a E c o n o m i c P r o s p e c t s
J u n e 2 0 2 1 T H E W O R L D B A N K | B A N K D U N I A
1
Executive Summary: Boosting the Recovery
COVID-19 has taken a heavy economic and human toll globally and in Indonesia. According to official statistics, over 3.8 million people have died from COVID as of May 2021. The global economy experi-enced one of the most severe recessions, shrinking by 3.5 percent in 2020 compared to 1.7 percent in 2009 during the global financial crisis. The recession in Indo-nesia (-2.1 percent) was milder than among Emerging Markets and Developing Economies, EMDEs (-4.3 percent excluding China). Small and medium-sized firms and businesses in contact-intensive services sec-tors were severely affected. About 1.8 million Indone-sians became unemployed between February 2020 and 2021 and another 3.2 million people exited the labour force. Three hundred thousand fewer youth entered the labour market. About 2.8 million people have fallen into poverty as of September 2020 with the govern-ment’s social assistance program mitigating a potentially worse outcome. Indonesia’s recovery has been relatively gradual until the first quarter of 2021 but has accelerated more recently. Indonesia’s recovery gap – the differ-ence between real GDP and its pre-crisis trend – nar-rowed from -7.5 to -7.1 percent between Q2 and Q4 2020. By comparison, the average ‘recovery gap’ among regional and G20 peers shrank from -13.6 to -5.1 per-cent. The recovery gap remained elevated at -7.9 per-cent during the first quarter this year. Consumption and investment growth have been subdued due to the still weak labor market and high uncertainty while trade has recovered more strongly. The recovery gap in contact-intensive services sectors, such as transport and accom-modation, has also been elevated compared to manu-facturing industries due to social distancing and stronger external demand in manufacturing. But retail sales increased by 11 percent between March and April while the manufacturing continued to expand suggest-ing a stronger rebound during the second quarter. New COVID-19 cases have declined, though pan-demic related risks loom large. New cases have de-clined from their peak in January-February. Neverthe-less, Indonesia remains vulnerable to new waves driven by more transmissible strains as experienced by other countries as well as potentially higher mobility and viral transmission during festivities. These vulnerabilities highlight the importance of rapid mass vaccination. De-spite an earlier and stronger start than regional peers, the free vaccine rollout has started to lag behind some
large G20 peers such as India, Brazil, and Turkey. The number of vaccine doses administered reached 10 per-cent of the population in May, compared to 10, 15, 32 and 34 percent in Malaysia, India, Brazil, and Turkey, respectively. Despite a strong crisis response, monetary policy had to strike a difficult balance between managing external financing pressures and stimulating the recovery. Bank Indonesia (BI) deployed a large local currency government bond purchase program in 2020 to stabilize the economy and help finance the fiscal def-icit (3.7 percent of GDP of which 84 percent in the pri-mary market). It also cut the benchmark interest rate from 5 to 3.5 percent between January 2020 and Feb-ruary 2021. The low inflation rate and high negative output gap suggest that there may have been space to cut further, though external vulnerabilities may have prevented further easing. Therefore, real interest rates have also been high relative to inflation deviation from the official target, especially when compared to other EMDEs. Despite higher lending to government, BI’s balance sheet and broad money supply have not ex-panded markedly as private credit contracted sharply. The authorities managed recent external financing pressures by maintaining exchange rate flexibility and avoiding further monetary tightening. Indone-sia experienced large debt selloff by foreign investors during the first quarter of 2021 amid rising US Treasury yields in March. Net portfolio outflows reached 0.1 per-cent of GDP in March 2021 compared to 0.4 percent in June 2013 during the taper tantrum. This pushed short and long-term sovereign bond yields up by 16 to 39 basis points between February and March. The real effective exchange rate depreciated by 1.1 percent year-to-March 2021. BI kept its benchmark policy rate un-changed. This policy response is consistent with rela-tively stronger external and monetary buffers on the one hand, and a weaker fiscal position on the other. Private credit growth has fallen despite healthy bank balance sheets and moderate corporate vul-nerability. Credit growth has declined sharply during the crisis. This is particularly pronounced for foreign-owned banks and to a lesser extent for domestic ones, whereas state-owned banks and regional development banks have been playing a more countercyclical role. Capital adequacy, loan provisioning, bank liquidity and profitability have remained healthy. Although corporate
B o o s t i n g t h e R e c o v e r y I n d o n e s i a E c o n o m i c P r o s p e c t s
J u n e 2 0 2 1 T H E W O R L D B A N K | B A N K D U N I A
2
vulnerability has increased, it remained overall compa-rable to peers except in sectors such as consumer ser-vices and among firms that are more leveraged or expe-rienced significant declines in earnings. The credit con-traction is due to a combination of supply and demand factors, including weak and declining effectiveness of monetary transmission, low take-up of risk sharing mechanisms such as guarantees and historically low re-liance on banking credit among MSMEs. But further analysis is needed to fully identify and address the policy roots of weak credit. The fiscal response to COVID-19 has been strong but spending adjustments have been made in 2021. The fiscal deficit increased from 2.2 to 6.2 percent of GDP in 2019- 2020 but it was driven more by declining revenues than higher spending. Nevertheless, spending increased strongly, and the 3.8 percent of GDP COVID-19 fiscal package in 2020 was substantial com-pared to peers. Public debt rose from 30.2 to 39.4 per-cent of GDP in 2019-2020 but remains low compared to peers and well below the legal ceiling (60 percent of GDP). The budgeted 2021 fiscal response package was increased to 4.5 percent of GDP through March this year. But social assistance budget allocations were cut by 0.3 percentage points of GDP. This is to accommo-date increased spending on health, including for vaccine rollout, and on priority sectors and firm support pro-grams such as food security and ICT. The available fiscal space has been limited by structural revenue and budget financing con-straints. First, the small size of domestic debt markets led the authorities to rely on unconventional monetary financing. BI local-currency government bond pur-chases reached 3.7 percent of GDP in 2020 compared to 1.7 percent of GDP among EMDEs. However, this is appropriate considering the exceptional circum-stances, muted inflation pressures and the authorities’ commitment to keep the program time-bound and con-sistent with monetary policy objectives. Second, Indo-nesia has a high interest-to-revenue ratio despite low levels of government debt. This is related to Indonesia’s
high sovereign bond yields and low revenue base com-pared to peers. Lastly, the narrow revenue base con-strains fiscal space and spending more generally. Maintaining the 2020 SA package in 2021 has the potential to mitigate against risks of higher pov-erty. Household surveys show that the need for social assistance remained high during the first quarter of 2021 due to the still weak labor market (World Bank High Frequency Survey, March 2021). World Bank sim-ulations show that if the 2020 SA package was main-tained in 2021, the poverty rate could potentially drop from 10.2 in 2020 to 9.5 percent, compared to 9.2 per-cent before the crisis. On the other hand, the lower so-cial assistance for 2021 could potentially increase pov-erty to 11.2 percent. This is because the programs that have been discontinued or reduced have high coverage among vulnerable households. Nevertheless, the gov-ernment has room to adjust spending building on the flexibility in the Budget and its frequent monitoring of the COVID response.
The economy is expected to start rebounding in 2021 and to gradually strengthen in 2022. Growth is projected to reach 4.4 percent in 2021 driven by a base effect and a gradual improvement in domestic demand, and positive spillovers from a stronger global economy (Table ES.1). On the domestic front, this is predicated on containing the pandemic and a gradual strengthen-ing in labor market conditions. On the external front, the US fiscal stimulus package would have positive spill-overs on global growth and Indonesia’s export com-modity prices. Growth could accelerate to 5.0 percent in 2022 driven by reduced uncertainty and improved confidence provided that the vaccine rollout reaches a critical mass of the population starting in the fourth quarter of 2021. Growth in contact-intensive services sectors is expected to remain muted in the near term. Stronger recoveries in advanced countries and some emerging market economies would support external de-mand and growth in mining and export-oriented man-ufacturing sectors.
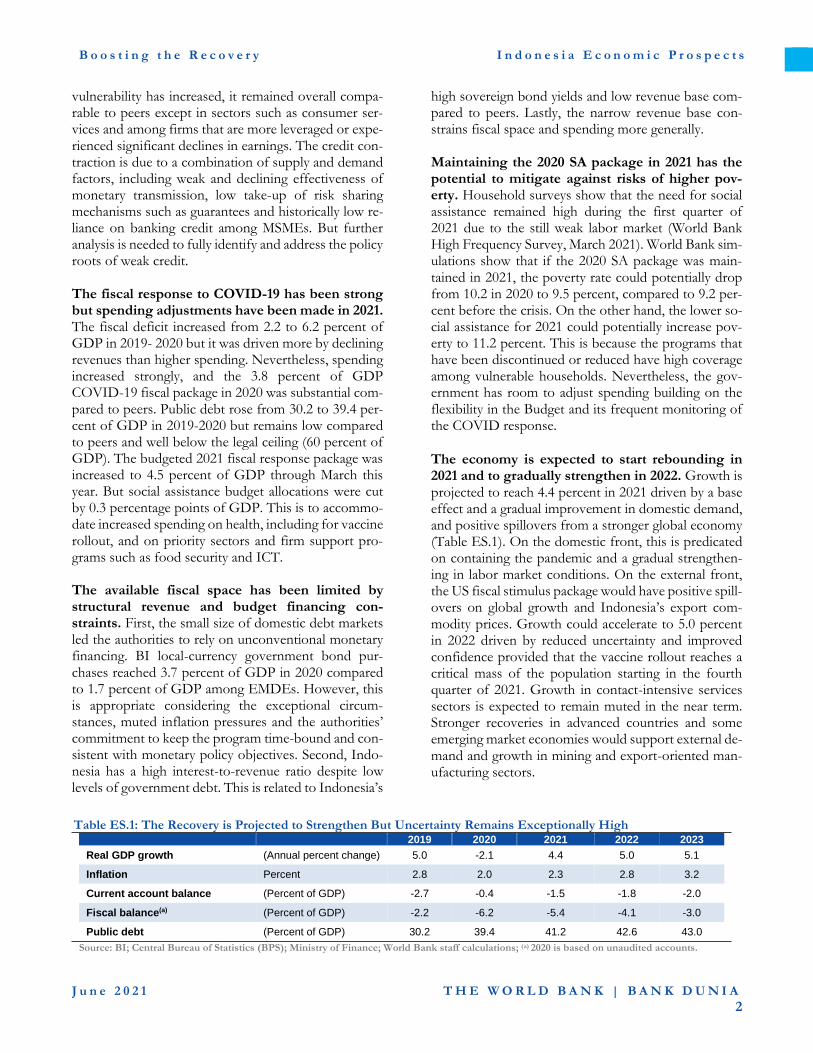
Table ES.1: The Recovery is Projected to Strengthen But Uncertainty Remains Exceptionally High 2019 2020 2021 2022 2023
Real GDP growth (Annual percent change) 5.0 -2.1 4.4 5.0 5.1
Inflation Percent 2.8 2.0 2.3 2.8 3.2
Current account balance (Percent of GDP) -2.7 -0.4 -1.5 -1.8 -2.0
Fiscal balance(a) (Percent of GDP) -2.2 -6.2 -5.4 -4.1 -3.0
Public debt (Percent of GDP) 30.2 39.4 41.2 42.6 43.0
Source: BI; Central Bureau of Statistics (BPS); Ministry of Finance; World Bank staff calculations; (a) 2020 is based on unaudited accounts.

B o o s t i n g t h e R e c o v e r y I n d o n e s i a E c o n o m i c P r o s p e c t s
J u n e 2 0 2 1 T H E W O R L D B A N K | B A N K D U N I A
3
This baseline is subject to significant downside risks. There is considerable uncertainty around the fu-ture path of the pandemic, global financial conditions, banking and financial sector performance and stress, and scarring effects of the crisis. In a downside scenario with slower-than-expected improvement in vaccine rollout and lower confidence, combined with weaker global growth. could lower Indonesia’s growth to 2.1 percent in 2021 and 3.1 percent in 2022. Structural reforms are needed to lift growth in the medium term. Growth is projected to improve to 5.1 percent per annum on average in the medium term which is the average growth rate in 2017-2019. How-ever, a return to pre-COVID-19 growth rates would not be sufficient to compensate for the losses during the crisis and output would remain below its pre-crisis trend. Moreover, potential growth is projected to drop by at least 0.7 percentage point below pre-COVID-19 levels to 4.6 percent on average in 2021-2023. This highlights the need for further reforms to lift growth and support faster quality job creation. The implemen-tation of such reforms is also important to support growth as the planned fiscal consolidation could dampen medium-term growth. Looking ahead Indonesia will face three critical policy tests in its efforts to boost the recovery and improve medium-term prospects. The first is to ac-celerate the vaccine rollout to win the race between in-fections and vaccinations. The second test is to main-tain an accommodative monetary stance and stimulate private credit while managing external financing pres-sures and banking and financial sector vulnerabilities. The third policy test relates to the tradeoff between short-term fiscal needs and medium-term fiscal sustain-ability. Specific policy recommendations to address each test are discussed below. It is important to establish effective vaccine rollout, testing-tracing-isolation, and other non-pharma-ceutical interventions to win the race against infec-tions. It is important in the very short term to continue to prioritize vaccination of vulnerable health groups and in geographic locations where transmission rates are the highest. In the near term, effective procurement and global cooperation will be important to maintain adequate vaccine supply. The success of the vaccination campaign will also depend on the effectiveness of non-pharmaceutical interventions, such as testing-tracing-isolation and mobility restrictions where appropriate.
Meanwhile it is vital to monitor the advent of new var-iants and develop strategies to rapidly suppress their transmission. Indonesia could face challenging monetary policy trade-offs going forward. Though Indonesia has maintained access to external financing, rising US yields create headwinds. Current economic conditions call for an accommodative monetary stance and exchange rate flexibility. Premature monetary tightening could raise government borrowing costs, exacerbate the lack of credit impulse, and delay medium-term recovery if ex-ternal financing pressures force further rate hikes down the road. While exchange rate flexibility could contrib-ute to higher debt servicing costs in the short-term, the burden could be offset by a faster recovery, stronger exports and foreign investment inflows. Plus, the use of reserves in the short-term could deplete buffers as ex-ternal financing pressures start to augment. Adjust-ments to the current stance should therefore be in-formed by close coordination with fiscal policy, supply side developments, and external vulnerabilities. Banking sector credit could also play a more prom-inent role in supporting the real sector. To further support credit growth, policymakers could improve the effectiveness of borrower-support programs, includ-ing debt repayment relief, credit guarantees, interest rate subsidies etc. More generally, it is important to fur-ther analyze the policy causes of the weak credit impulse and adjust policies accordingly. A clear medium-term fiscal strategy would allow the government to credibly signal its plans to re-turn to the fiscal deficit ceiling while supporting the recovery in the short term. It is estimated that an adjustment of about 1.2 percent of GDP in the primary balance is needed to return to the legal deficit ceiling in 2023. But premature fiscal consolidation risks deepen-ing the economic crisis and paradoxically delaying the achievement of the deficit limit. A strong medium-term fiscal plan could bolster investor confidence at a time of high financing needs. The medium-term fiscal strat-egy could be designed in three phases using specific economic indicators as trigger points for sequencing. In the first phase it is important to continue providing re-lief to affected households and to viable firms. Similarly, it is essential that fiscal policy continues to build confi-dence in the vaccination program and pandemic control as discussed previously. In a second phase, the budget could start cutting back on public transfers where needs are lower, or inefficiencies are high as key economic in-dicators firmly improve. In the last phase, fiscal policy

B o o s t i n g t h e R e c o v e r y I n d o n e s i a E c o n o m i c P r o s p e c t s
J u n e 2 0 2 1 T H E W O R L D B A N K | B A N K D U N I A
4
could subsequently start rebalancing efforts towards capital expenditure and longer-term tax reforms. In the short-term, it is critical to maintain adequate social assistance until the green shoots of recovery are stronger. It is also recommended to fur-ther strengthen the effectiveness and preparedness of SA systems by improving the quality and timeliness of socioeconomic data used for targeting and expand-ing its coverage beyond the bottom 40 percent of households. More generally, it is important that medium-term expenditure adjustments target areas with clear in-efficiencies and avoid critical social and capital spending. The unwinding of exceptional spending measures could be first focused on areas where pro-grams are ineffective or where needs are lower thanks, for instance, to a stronger economic situation. It is therefore essential to establish transparent monitoring and evaluation of fiscal programs. Containing ineffi-cient energy subsidies would also help improve fiscal space for higher social and capital spending. Medium-term tax reforms are critical for a strong rebound in revenues that can facilitate a more growth-friendly fiscal consolidation and improve fiscal space. Tax buoyancy is historically low, and rev-enues may not recover strongly after economic shocks without proactive reforms. There are several avenues for boosting revenues in the medium and long term while achieving equity, efficiency, environmental and health benefits. Medium-term measures could focus on, among other things:
(i) Corporate income tax: Expand the tax
base by incorporating more SMEs.
(ii) Personal income tax: Change marginal tax
brackets so that the current top marginal
rates apply to lower incomes, increase the
rate on the top bracket, and improve over-
sight of the wealthiest individuals.
(iii) Value-added tax: Lower the registration
threshold and enforce registration, filing,
reporting and payment.
(iv) Excises on products with negative health
impact: Introduce an excise on sugar-
1 Using the international poverty line of US$1.90 a day (2011 PPP). Source: World Development Indicator 2 Middle class income is defined as an income sufficient to afford a middle-class living standard for a family of four people. The estimated minimum
sweetened beverages; increase tobacco ex-
cise rates and simplify the excise regime.
(v) Environmental taxes: Introduce an excise
on all single-use plastics and an adjustable
fuel excise; introduce a carbon tax.
These reforms can be complemented with tax admin-istration measures that prioritize improved compliance of those who already have tax obligations. Over the longer term, it is recommended that the government fo-cuses on accelerating business tax collections, closing tax gaps, collaborating with international partners to limit base erosion and profit shifting, and implementing its digital transformation.
Lastly, advancing structural reforms will be critical to boost inclusive growth and job creation. The adoption of the Omnibus Law on Job Creation and its implementing regulations - including those aimed at boosting foreign investment - and the focus on financial sector reform are important steps in this direction. Part B of this report proposes additional and complemen-tary reforms to unleash the creation of more middle-class jobs. To reach its aspirations of a higher income coun-try, Indonesia will need to create more productive jobs for both men and women. Strong job creation during the past decades contributed to higher growth and income as well as poverty reduction in Indonesia. Indonesia created an average of 2.4 million jobs each year in 2009-2019. Job and labor productivity growth boosted GDP per capita growth which led to a sharp decline in the poverty rate1 from 15.5 percent of the population in 2009 to 2.9 percent in 2019. However, most new jobs were in low productivity sectors with earnings insufficient to raise workers to middle-class status. Among the 85 million paid workers before the pandemic, only 13 million or 15 percent were middle class income earners.2 The COVID-19 crisis has exac-erbated the jobs situation. The share of middle-class jobs declined by about 5.2 percentage points between 2019 and 2020.3 This trend, if not reversed, threatens the gains during the past decades.
Indonesia’s transition to higher productivity and inclusive jobs faces five key impediments. First, jobs created through structural transformation – the transi-tion of the workforce across economic sectors over
middle-class income is 3,752,000 Rupiah per month in 2018. Income earn-ers include wage employees, casual workers and self-employed. The Labor Force Survey (Sakernas) data does not report income for the 15 million un-paid workers or profits for the 24 million employers with workers. 3 Sakernas August 2019, 2020
B o o s t i n g t h e R e c o v e r y I n d o n e s i a E c o n o m i c P r o s p e c t s
J u n e 2 0 2 1 T H E W O R L D B A N K | B A N K D U N I A
5
time including out of agriculture - have not brought suf-ficient productivity gains to create middle-class jobs. Over the past two decades, most new jobs were in low productivity services, whose labor productivity is not significantly higher than in agriculture. Second, Indone-sian enterprises are created and remain small. They are not significant middle-class job creators. Third, Indone-sia’s workforce is not equipped with the skills needed for middle-class jobs. An Indonesian child entering the education system today is expected to complete 12.4 years of schooling but they only learn the equivalent of 7.8 years.4 Fourth, although women have been holding more wage employment in the past decades, the labor force participation, job quality and earnings gaps be-tween men and women remain high. This results in un-der-representation of women among middle-class job holders. More generally, low female labor force partici-pation constrains economic growth. If women’s labor force participation increased from 52 to 58.5 percent between 2019 and 2025, annual GDP growth rates would increase by up to 0.7 percentage points. Fifth, the negative impact of COVID-19 on jobs, including for new graduates, if not addressed could lead to long-term losses in human capital. A five-pronged reform strategy could help address these challenges and build forward better: First, maintain adequate job relief measures to mitigate jobs losses and scarring. Two short-term job relief measures can help protect formal and infor-mal firms and workers. First, fiscal, credit and cash as-sistance can continue to help viable firms cope with the crisis and improve worker retention. Information from the existing social security database (Badan Penyeleng-gara Jaminan Sosial Keternagakerjaan, BPJS Ketenagakerjaan) can be used to direct support to for-mal sector workers. Second, social assistance programs such as the family conditional cash transfer program, and nonconditional village cash transfer can protect
vulnerable workers, especially those in the informal sec-tor. In parallel, strengthening the socio-economic data used for targeting these programs and introducing on-demand application mechanisms would help better pre-pare for future shocks. Second, accelerate productivity growth across the board. To avoid repeating the stagnant firm creation that characterized the lost decade after the Asian finan-cial crisis, unlock new firm entry and growth to create competition and innovation. This includes, among other things, addressing remaining trade and invest-ment reform agenda that are not yet addressed in the Omnibus Law on Job Creation, such as non-tariff bar-riers on intermediate inputs. Third, transition workers to jobs-friendly sectors and firms. To redirect structural transformation to-ward more productive jobs, Indonesia could prioritize the promotion of foreign direct investments that create more productive and higher-skill middle-class jobs. This can be done by reworking the current strategic roadmap of the Investment Coordinating Board through a framework of middle-class job creation and continuing to develop and implement the Jobs Loss Guarantee Program to support workers’ transitions up the job ladder. Fourth, build a middle-class workforce. Indonesia will need to deeply invest in the training systems and programs to upskill the current workforce to hold mid-dle-class jobs, including by supporting the development and access to online distance learning in short technical and vocational education and training courses, while adapting the education system to prepare the future workforce for middle-class jobs. Fifth, unlock women’s productive potential in the labor market. This can be done by providing quality and affordable care and reform labor legislations to make the workplace friendlier for women.
4 Human Capital Index 2020 <https://data-bank.worldbank.org/data/download/hci/HCI_1pager_IDN.pdf>
B o o s t i n g t h e R e c o v e r y I n d o n e s i a E c o n o m i c P r o s p e c t s
J u n e 2 0 2 1 T H E W O R L D B A N K | B A N K D U N I A
6
A. Economic and Fiscal Update
1. A Diagnostic of the Recovery
Indonesia’s recovery has been relatively gradual until the first quarter of 2021 but has accelerated more re-cently.
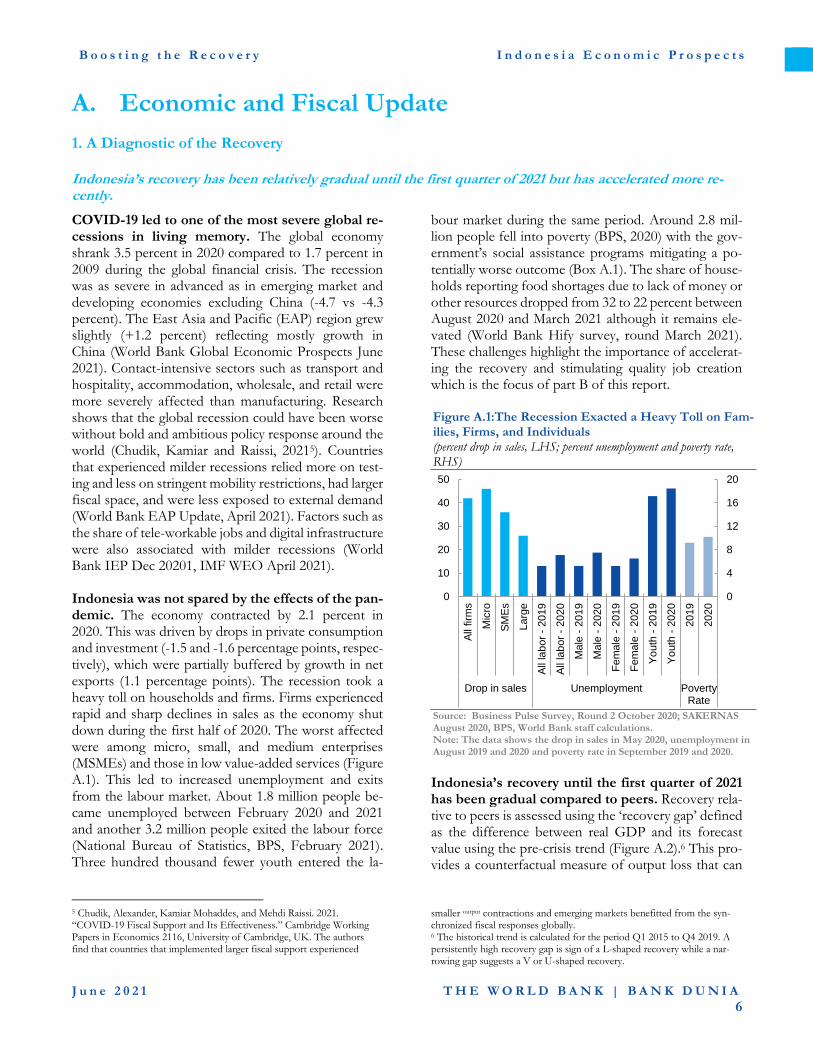
COVID-19 led to one of the most severe global re-cessions in living memory. The global economy shrank 3.5 percent in 2020 compared to 1.7 percent in 2009 during the global financial crisis. The recession was as severe in advanced as in emerging market and developing economies excluding China (-4.7 vs -4.3 percent). The East Asia and Pacific (EAP) region grew slightly (+1.2 percent) reflecting mostly growth in China (World Bank Global Economic Prospects June 2021). Contact-intensive sectors such as transport and hospitality, accommodation, wholesale, and retail were more severely affected than manufacturing. Research shows that the global recession could have been worse without bold and ambitious policy response around the world (Chudik, Kamiar and Raissi, 20215). Countries that experienced milder recessions relied more on test-ing and less on stringent mobility restrictions, had larger fiscal space, and were less exposed to external demand (World Bank EAP Update, April 2021). Factors such as the share of tele-workable jobs and digital infrastructure were also associated with milder recessions (World Bank IEP Dec 20201, IMF WEO April 2021). Indonesia was not spared by the effects of the pan-demic. The economy contracted by 2.1 percent in 2020. This was driven by drops in private consumption and investment (-1.5 and -1.6 percentage points, respec-tively), which were partially buffered by growth in net exports (1.1 percentage points). The recession took a heavy toll on households and firms. Firms experienced rapid and sharp declines in sales as the economy shut down during the first half of 2020. The worst affected were among micro, small, and medium enterprises (MSMEs) and those in low value-added services (Figure A.1). This led to increased unemployment and exits from the labour market. About 1.8 million people be-came unemployed between February 2020 and 2021 and another 3.2 million people exited the labour force (National Bureau of Statistics, BPS, February 2021). Three hundred thousand fewer youth entered the la-
5 Chudik, Alexander, Kamiar Mohaddes, and Mehdi Raissi. 2021. “COVID-19 Fiscal Support and Its Effectiveness.” Cambridge Working Papers in Economics 2116, University of Cambridge, UK. The authors find that countries that implemented larger fiscal support experienced
bour market during the same period. Around 2.8 mil-lion people fell into poverty (BPS, 2020) with the gov-ernment’s social assistance programs mitigating a po-tentially worse outcome (Box A.1). The share of house-holds reporting food shortages due to lack of money or other resources dropped from 32 to 22 percent between August 2020 and March 2021 although it remains ele-vated (World Bank Hify survey, round March 2021). These challenges highlight the importance of accelerat-ing the recovery and stimulating quality job creation which is the focus of part B of this report.
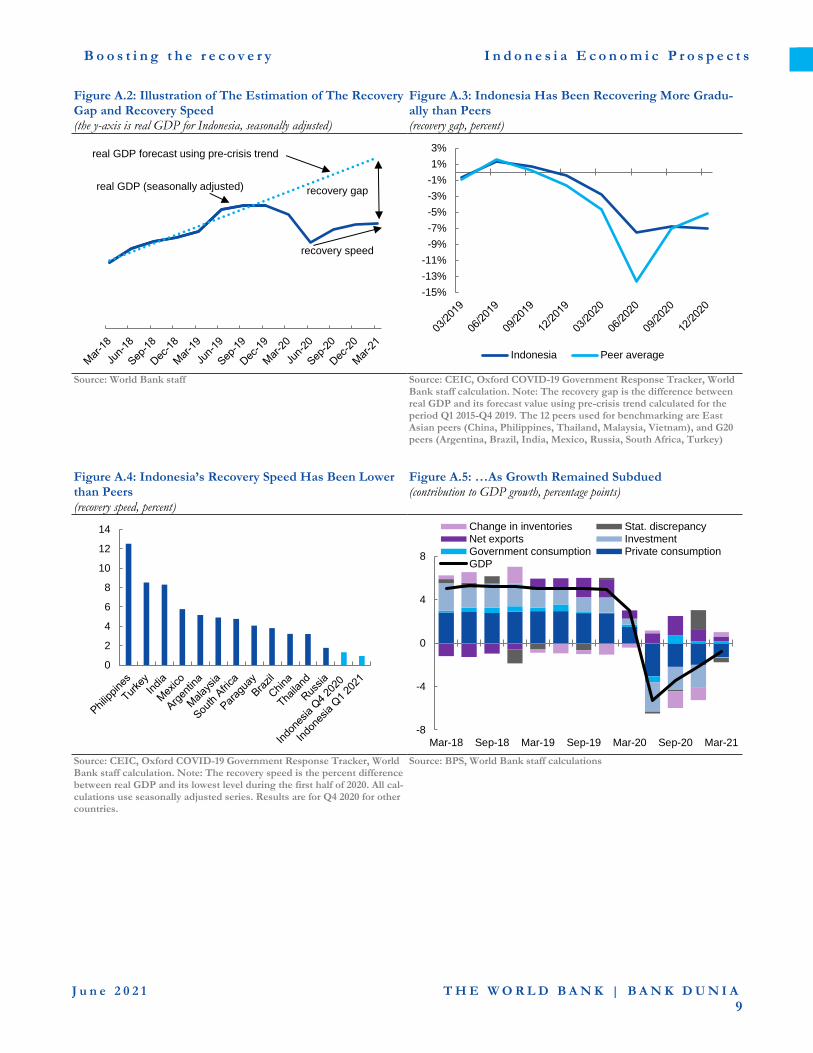
Indonesia’s recovery until the first quarter of 2021 has been gradual compared to peers. Recovery rela-tive to peers is assessed using the ‘recovery gap’ defined as the difference between real GDP and its forecast value using the pre-crisis trend (Figure A.2).6 This pro-vides a counterfactual measure of output loss that can
smaller output contractions and emerging markets benefitted from the syn-chronized fiscal responses globally. 6 The historical trend is calculated for the period Q1 2015 to Q4 2019. A persistently high recovery gap is sign of a L-shaped recovery while a nar-rowing gap suggests a V or U-shaped recovery.
Figure A.1:The Recession Exacted a Heavy Toll on Fam-ilies, Firms, and Individuals (percent drop in sales, LHS; percent unemployment and poverty rate, RHS)
Source: Business Pulse Survey, Round 2 October 2020; SAKERNAS August 2020, BPS, World Bank staff calculations. Note: The data shows the drop in sales in May 2020, unemployment in August 2019 and 2020 and poverty rate in September 2019 and 2020.
0
4
8
12
16
20
0
10
20
30
40
50A
ll firm
s
Mic
ro
SM
Es
Larg
e
All
lab
or
- 2019
All
lab
or
- 2020
Ma
le -
2019
Ma
le -
2020
Fe
male
- 2
019
Fe
male
- 2
020
Yo
uth
- 2
019
Yo
uth
- 2
020
2019
2020
Drop in sales Unemployment PovertyRate
B o o s t i n g t h e R e c o v e r y I n d o n e s i a E c o n o m i c P r o s p e c t s
J u n e 2 0 2 1 T H E W O R L D B A N K | B A N K D U N I A
7
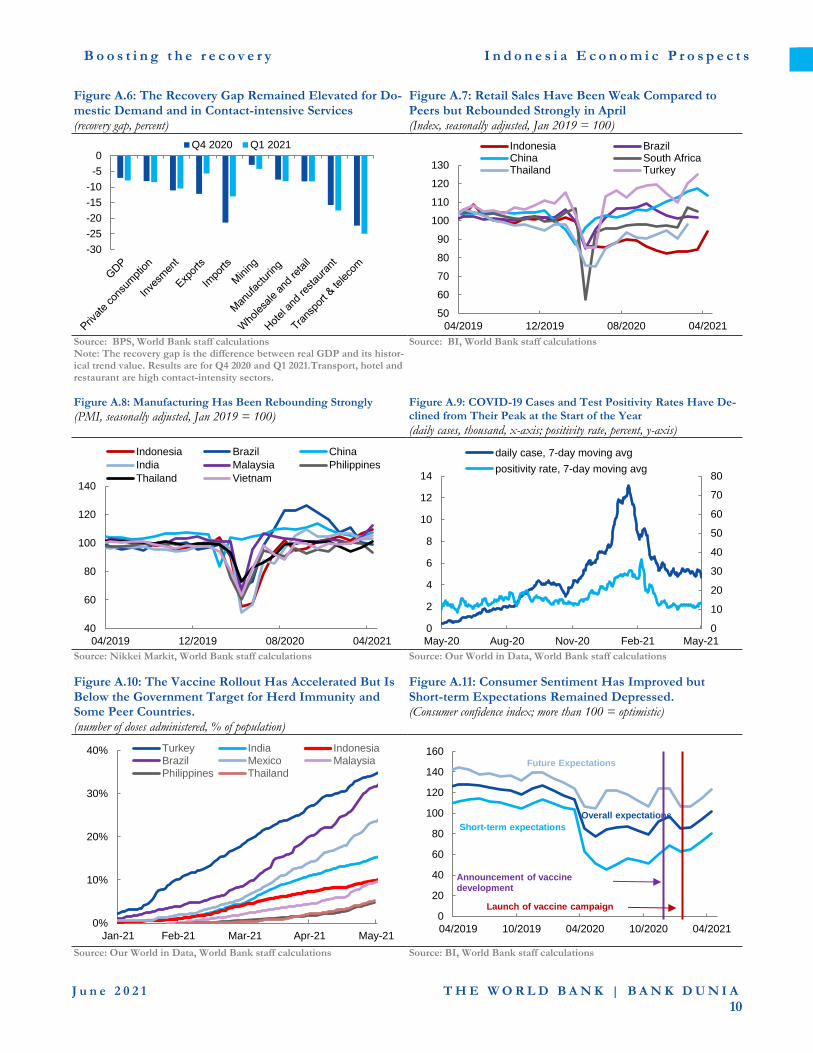
be monitored and benchmarked.7 Figure A.3 shows the recovery gap narrowed from -7.5 to -7.1 percent be-tween Q2 and Q4 2020 while for the average peer it shrank from -13.6 to -5.1 percent.8 The ‘recovery speed’ – defined as the average growth rate between fourth quarter and the second in 2020 – was 1.3 percent, the lowest among peers (Figure A.4). With weak during the first quarter of 2021 (Figure A.5), the recovery gap has remained elevated at -7.9 percent (Figure A.6). Con-sumption and investment growth have been subdued due to the still weak labor market and high uncertainty while stronger imports led to a build-up in inventories. The recovery gap in contact-intensive services sectors has also been elevated compared to manufacturing in-dustries due to social distancing and stronger external demand in manufacturing (Figure A.6). Leading indicators suggest a stronger rebound during the second quarter of 2021. Retail sales, which have been weak compared to peers since the beginning of the pandemic, increased by 11 percent between March and April (Figure A.7). Manufacturing activity, as measured by the Purchasing Manager’s Index, has been expanding steadily and strongly compared to peers driven by more upbeat external demand and commod-ity prices (Figure A.8). New COVID-19 cases have been declining from their peak at the start of the year. New cases subsided from 10,000 per day in January-February to 5,000 per day in April 2021, Figure A.7. Test positivity rates have also steadily declined from their peak at 36.2 percent in February to 12-13 percent in April, although they have remained relatively high. Although daily testing has im-proved to 2 tests per ten thousand people in April 2021 from 1 test per ten thousand people in December 2020, it is still significantly lower than peers such as the Phil-ippines (5), Thailand (10), India (12) and Turkey (36). Nevertheless, Indonesia remains vulnerable to new waves driven by more transmissible strains as experi-enced by other countries9 as well as higher mobility dur-ing the end of Ramadan festivities. The ongoing vulner-ability to the pandemic highlights the importance of rapid vaccine rollout. The COVID-19 vaccine rollout has accelerated but is below the government target for herd immunity. The national vaccination campaign began in January
7 The 12 peers used for benchmarking are East Asian peers (China, Philip-pines, Thailand, Malaysia, Vietnam), and G20 peers (Argentina, Brazil, In-dia, Mexico, Russia, South Africa, Turkey)
2021 with the government committing to free access for all citizens. The first phase, targeting health workers and government officials, was implemented in Febru-ary-March. The second phase is now targeting the el-derly. Daily inoculations reached a peak of 500,000 in April which is still about half of what is needed to reach herd immunity by March 2022 as announced by the government. Moreover, despite an earlier and stronger start than regional peers, the vaccine rollout has started to lag higher performing emerging markets such as In-dia, Brazil, and Turkey. The number of vaccine doses administered reached 10 percent of the population in May, compared to 10, 15, 32 and 34 percent in Malaysia, India, Brazil, and Turkey, respectively (Figure A.8). Vaccine shortages and logistical challenges pose threats to the program which are exacerbated by the spread of more transmissible virus mutations around the world. Effective pandemic control and rapid vaccine rollout are critical to reducing uncertainty and lift-ing sentiment. Business and consumer sentiment play an important role in short and medium-term spending and investment decisions, especially given the possibil-ity of pent-up demand. Consumer confidence declined sharply during the pandemic due to perceptions of weak current economic conditions (less than six months). Announcements of vaccine development in November 2020 and the launch of the free vaccination campaign in January 2021 provided some boost to sentiment (Fig-ure A.9). But the impact may have been lowered by ris-ing cases in December-February. Consumer confidence crossed the optimistic threshold, equal to 100, in April 2021 for the first time since the pandemic began driven by expectations of improved future conditions. Short-term expectations also improved but remained largely pessimistic.
8 As a test of robustness, we estimate that the output gap using a produc-tion function approach is -8.5 percent in 2020. But the production function approach cannot be implemented for infra-annual data. 9 These new waves have however been less disruptive to economic activity (World Bank Global Economic Prospects, June 2021)
B o o s t i n g t h e R e c o v e r y I n d o n e s i a E c o n o m i c P r o s p e c t s
J u n e 2 0 2 1 T H E W O R L D B A N K | B A N K D U N I A
8
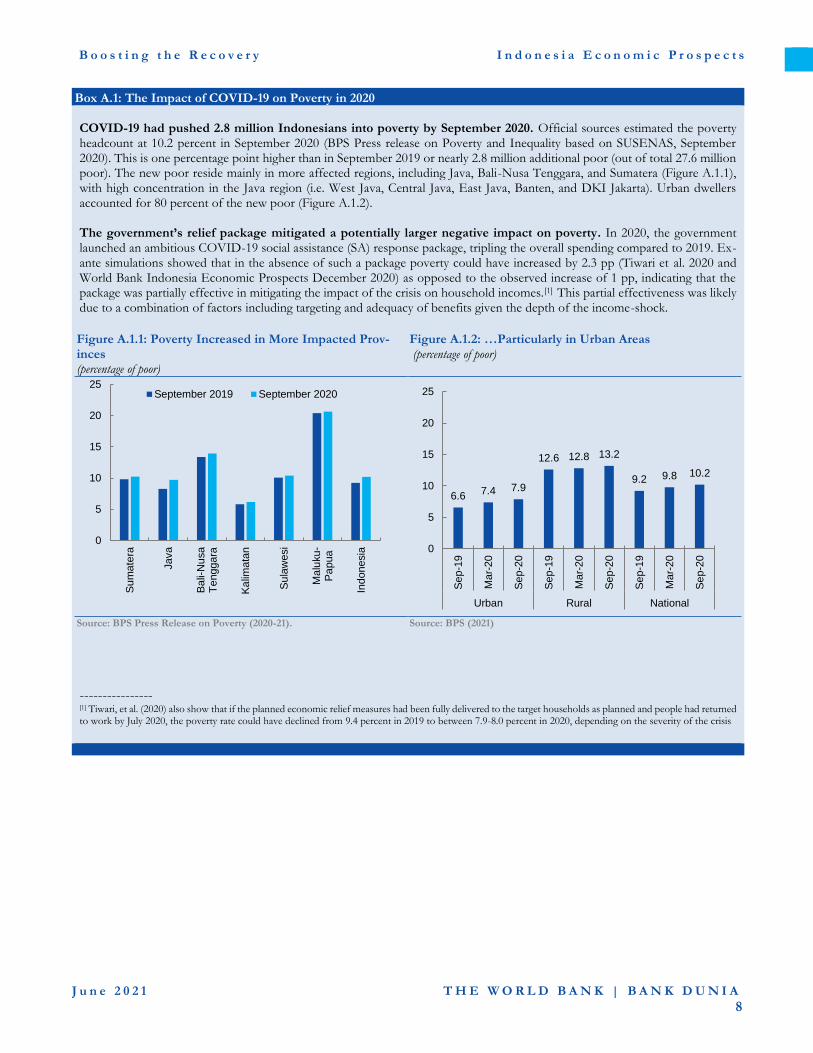
Box A.1: The Impact of COVID-19 on Poverty in 2020 COVID-19 had pushed 2.8 million Indonesians into poverty by September 2020. Official sources estimated the poverty headcount at 10.2 percent in September 2020 (BPS Press release on Poverty and Inequality based on SUSENAS, September 2020). This is one percentage point higher than in September 2019 or nearly 2.8 million additional poor (out of total 27.6 million poor). The new poor reside mainly in more affected regions, including Java, Bali-Nusa Tenggara, and Sumatera (Figure A.1.1), with high concentration in the Java region (i.e. West Java, Central Java, East Java, Banten, and DKI Jakarta). Urban dwellers accounted for 80 percent of the new poor (Figure A.1.2). The government’s relief package mitigated a potentially larger negative impact on poverty. In 2020, the government launched an ambitious COVID-19 social assistance (SA) response package, tripling the overall spending compared to 2019. Ex-ante simulations showed that in the absence of such a package poverty could have increased by 2.3 pp (Tiwari et al. 2020 and World Bank Indonesia Economic Prospects December 2020) as opposed to the observed increase of 1 pp, indicating that the package was partially effective in mitigating the impact of the crisis on household incomes.[1] This partial effectiveness was likely due to a combination of factors including targeting and adequacy of benefits given the depth of the income-shock.
Figure A.1.1: Poverty Increased in More Impacted Prov-inces (percentage of poor)
Figure A.1.2: …Particularly in Urban Areas (percentage of poor)
Source: BPS Press Release on Poverty (2020-21). Source: BPS (2021)
---------------- [1] Tiwari, et al. (2020) also show that if the planned economic relief measures had been fully delivered to the target households as planned and people had returned to work by July 2020, the poverty rate could have declined from 9.4 percent in 2019 to between 7.9-8.0 percent in 2020, depending on the severity of the crisis
0
5
10
15
20
25
Su
mate
ra
Java
Ba
li-N
usa
Te
nggara
Ka
limata
n
Su
law
esi
Ma
luku-
Pa
pua
Indonesia
September 2019 September 2020
6.67.4 7.9
12.6 12.8 13.2
9.2 9.8 10.2
0
5
10
15
20
25
Se
p-1
9
Ma
r-20
Se
p-2
0
Se
p-1
9
Ma
r-20
Se
p-2
0
Se
p-1
9
Ma
r-20
Se
p-2
0
Urban Rural National
B o o s t i n g t h e r e c o v e r y I n d o n e s i a E c o n o m i c P r o s p e c t s
J u n e 2 0 2 1 T H E W O R L D B A N K | B A N K D U N I A
9
Figure A.2: Illustration of The Estimation of The Recovery Gap and Recovery Speed (the y-axis is real GDP for Indonesia, seasonally adjusted)
Figure A.3: Indonesia Has Been Recovering More Gradu-ally than Peers (recovery gap, percent)
Source: World Bank staff Source: CEIC, Oxford COVID-19 Government Response Tracker, World
Bank staff calculation. Note: The recovery gap is the difference between real GDP and its forecast value using pre-crisis trend calculated for the period Q1 2015-Q4 2019. The 12 peers used for benchmarking are East Asian peers (China, Philippines, Thailand, Malaysia, Vietnam), and G20 peers (Argentina, Brazil, India, Mexico, Russia, South Africa, Turkey)
Figure A.4: Indonesia’s Recovery Speed Has Been Lower than Peers (recovery speed, percent)
Figure A.5: …As Growth Remained Subdued (contribution to GDP growth, percentage points)
Source: CEIC, Oxford COVID-19 Government Response Tracker, World Bank staff calculation. Note: The recovery speed is the percent difference between real GDP and its lowest level during the first half of 2020. All cal-culations use seasonally adjusted series. Results are for Q4 2020 for other countries.
Source: BPS, World Bank staff calculations
recovery gap
real GDP forecast using pre-crisis trend
real GDP (seasonally adjusted)
recovery speed
-15%
-13%
-11%
-9%
-7%
-5%
-3%
-1%
1%
3%
Indonesia Peer average
0
2
4
6
8
10
12
14
-8
-4
0
4
8
Mar-18 Sep-18 Mar-19 Sep-19 Mar-20 Sep-20 Mar-21
Change in inventories Stat. discrepancyNet exports InvestmentGovernment consumption Private consumptionGDP
B o o s t i n g t h e r e c o v e r y I n d o n e s i a E c o n o m i c P r o s p e c t s
J u n e 2 0 2 1 T H E W O R L D B A N K | B A N K D U N I A
10
Figure A.6: The Recovery Gap Remained Elevated for Do-mestic Demand and in Contact-intensive Services (recovery gap, percent)
Figure A.7: Retail Sales Have Been Weak Compared to Peers but Rebounded Strongly in April (Index, seasonally adjusted, Jan 2019 = 100)
Source: BPS, World Bank staff calculations Note: The recovery gap is the difference between real GDP and its histor-ical trend value. Results are for Q4 2020 and Q1 2021.Transport, hotel and restaurant are high contact-intensity sectors.
Source: BI, World Bank staff calculations
Figure A.8: Manufacturing Has Been Rebounding Strongly
(PMI, seasonally adjusted, Jan 2019 = 100) Figure A.9: COVID-19 Cases and Test Positivity Rates Have De-clined from Their Peak at the Start of the Year
(daily cases, thousand, x-axis; positivity rate, percent, y-axis)
Source: Nikkei Markit, World Bank staff calculations Source: Our World in Data, World Bank staff calculations
Figure A.10: The Vaccine Rollout Has Accelerated But Is Below the Government Target for Herd Immunity and Some Peer Countries. (number of doses administered, % of population)
Figure A.11: Consumer Sentiment Has Improved but Short-term Expectations Remained Depressed. (Consumer confidence index; more than 100 = optimistic)
Source: Our World in Data, World Bank staff calculations Source: BI, World Bank staff calculations
-30
-25
-20
-15
-10
-5
0Q4 2020 Q1 2021
50
60
70
80
90
100
110
120
130
04/2019 12/2019 08/2020 04/2021
Indonesia BrazilChina South AfricaThailand Turkey
40
60
80
100
120
140
04/2019 12/2019 08/2020 04/2021
Indonesia Brazil China
India Malaysia Philippines
Thailand Vietnam
0
10
20
30
40
50
60
70
80
0
2
4
6
8
10
12
14
May-20 Aug-20 Nov-20 Feb-21 May-21
daily case, 7-day moving avg
positivity rate, 7-day moving avg
0%
10%
20%
30%
40%
Jan-21 Feb-21 Mar-21 Apr-21 May-21
Turkey India Indonesia
Brazil Mexico MalaysiaPhilippines Thailand
0
20
40
60
80
100
120
140
160
04/2019 10/2019 04/2020 10/2020 04/2021
Overall expectations
Short-term expectations
Future Expectations
Announcement of vaccine development
Launch of vaccine campaign
B o o s t i n g t h e r e c o v e r y I n d o n e s i a E c o n o m i c P r o s p e c t s
J u n e 2 0 2 1 T H E W O R L D B A N K | B A N K D U N I A
11
2. The Policy Response
Despite a strong crisis response, monetary policy had to strike a difficult balance between managing external financing pressures and stimulating the recovery.
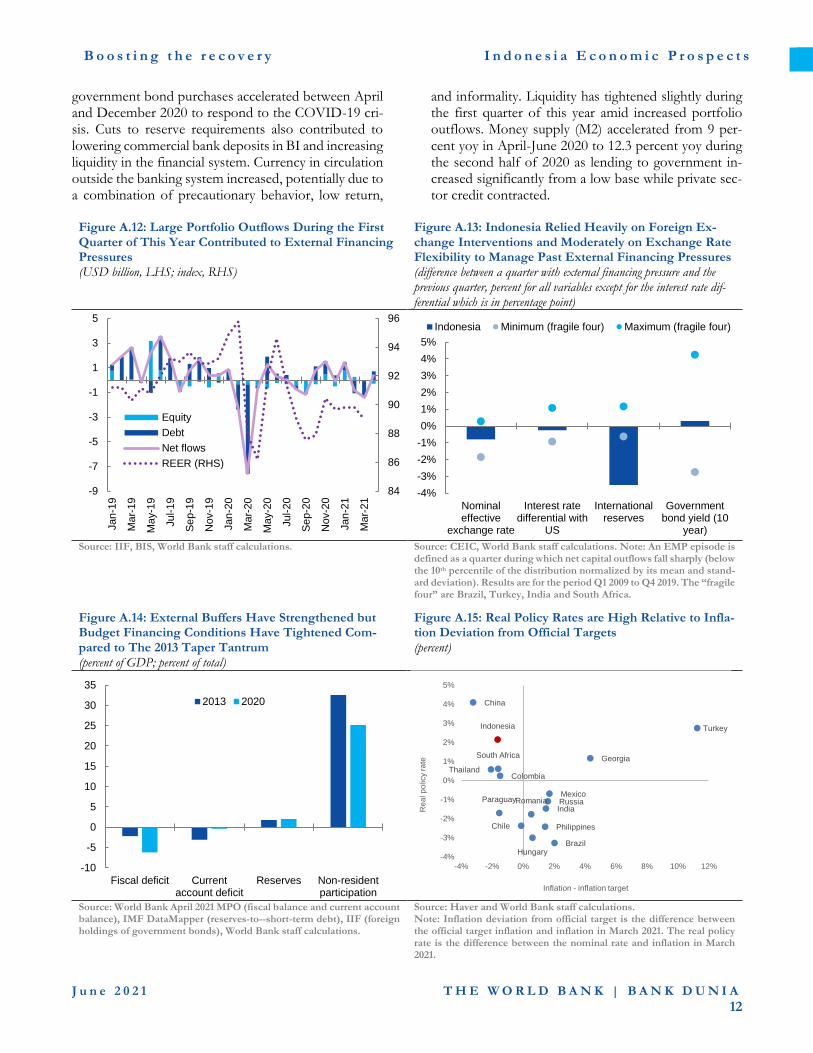
The authorities managed recent external financing pressures by maintaining exchange rate flexibility and avoiding premature monetary tightening. US Treasury yields rose sharply in March driven by stronger economic prospects with the adoption of a large fiscal stimulus package. This led to sudden and large capital outflows from Indonesia (Figure A.12) and other emerging markets. Net portfolio outflows from Indo-nesia reached 0.1 percent of 2020 GDP in March this year, compared to a peak of 0.4 percent of GDP in June 2013 during the taper tantrum. The outflows were driven by debt selloff by foreign investors. This pushed short- and long-term yields up by 16 and 39 basis points, respectively, to 4.1 and 6.9 percent between February and March. The nominal effective exchange rate (NEER) and the real effective exchange rate (REER) depreciated by 0.7 and 1.1 percent year-to-March,10 respectively, and reserves dropped slightly by 0.7 percent over the same period. BI kept its benchmark policy rate unchanged. Portfolio flows started stabiliz-ing in April with net inflows reaching 0.04 percent of 2020 GDP (Figure A.10).
Indonesia managed past external financing pres-sures through significant foreign exchange inter-ventions, and moderate currency depreciation and interest rate hikes. Episodes of large net portfolio and other investment outflows in 2009-2019 (Figure A.13)11 were associated with significant drop in gross reserves. They declined by 3.5 percent on average during the typ-ical quarter with large net outflows relative to the pre-vious quarter. Consequently, the Rupiah depreciated on average by 0.8 percent in nominal terms). On the mon-etary side, the policy rate differential with the US dropped by 30 basis points on average indicating meas-ured interest rate hikes to avoid hurting growth. The depreciation of the currency together with the policy rate hike improved attractiveness of government bonds thereby containing the rise in the 10-year government bond yield which increased on average by 0.3 percent.12
10 For the other fragile four countries (Brazil, Turkey, India, South Africa), the NEER depreciated by 0.4 percent while the REER was broadly stable. 11 We find 8 episodes of large net portfolio and other investment outflows between Q1 2009 and Q4 2019, namely Q2 2009, Q3 and Q4 2011, Q1 2013, Q2 and Q3 2015, Q1 and Q3 2018, using the definition that net out-flows are large if they fall below the 10th percentile of the distribution (the distribution is normalized by its mean and standard deviation).
The authorities’ response to the recent external fi-nancing pressures has been consistent with changes to external, monetary, and fiscal vulnera-bilities and buffers. It is important that the strategy to manage current and future financing pressures adapts to external and domestic economic conditions and vul-nerabilities. A combination of relatively stronger exter-nal and monetary buffers but weaker fiscal position amid high output gaps calls for maintaining exchange rate flexibility and avoiding premature monetary tight-ening. Indeed, external buffers -measured by the cur-rent account deficit and the ratio of reserves to short-term external debt - have strengthened (Figure A.14). Moreover, the monetary policy space is significant given the substantial negative output gap, muted infla-tion pressures and relatively high real policy rates as dis-cussed below. While financial vulnerabilities have in-creased, the banking sector appears well capitalized with significant liquidity. On the other hand, fiscal buffers have weakened. Government financing needs increased from 6 to 10 percent of GDP in 2019-2020. While the share of external funding of the fiscal deficit has dropped, it remains elevated relative to peers.
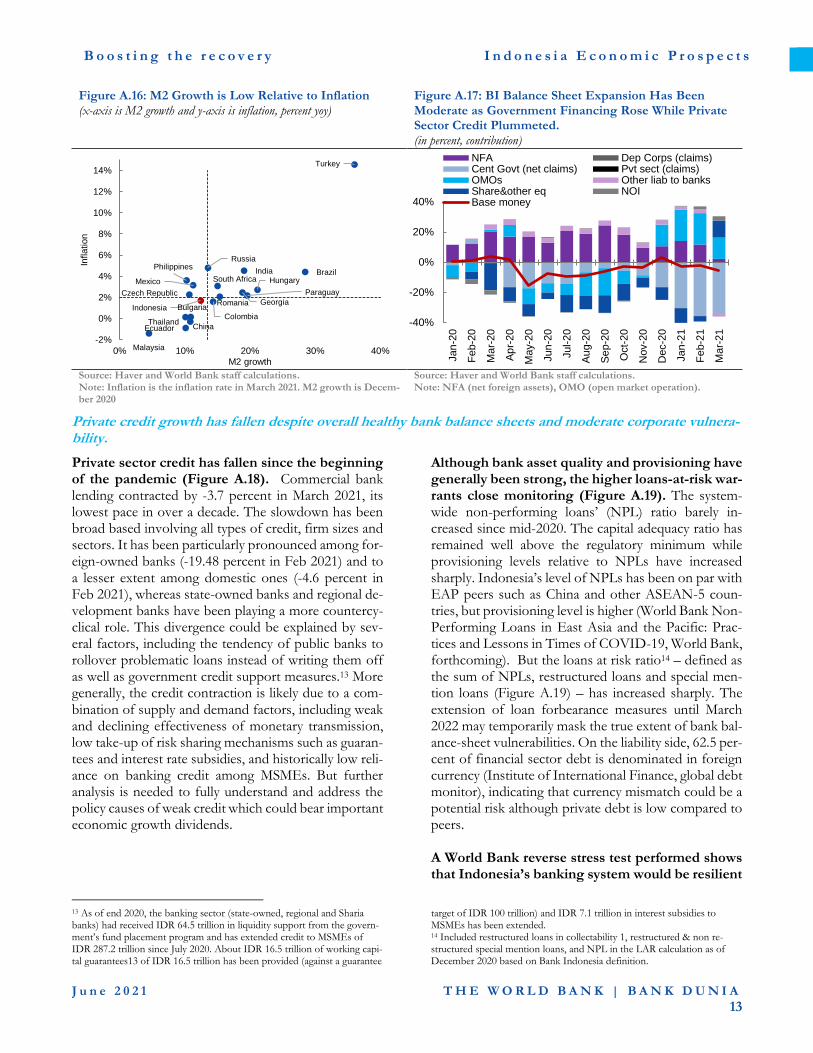
Real interest rates have remained elevated relative to domestic economic conditions potentially to maintain the attractiveness of domestic bonds. BI cut its benchmark interest rate by a total of 150 basis points since January 2020 down to 3.5 percent by Feb-ruary 2021. But nominal rates have remained high rela-tive to inflation and the output gap. Moreover, headline and core inflation have declined during the crisis and averaged 1.4 percent yoy in January-March, falling be-low BI’s 2 percent lower band target. Consequently, real interest rates have also been high relative to inflation deviation from the official BI target, especially when compared to other EMs (Figure A.15).
Despite higher lending to government, BI’s bal-ance sheet and broad money supply have not ex-panded markedly (Figure A.16 and Figure A.17). BI liquidity injections through open market operations and
12 A similar analysis of periods of a dry up in portfolio and other invest-ment inflows shows lower drop in reserves (-1 percent) and similar cur-rency depreciation (-0.6 percent) while the effect on the interest rate differ-ential and the 10-year government bond yield is similar.
B o o s t i n g t h e r e c o v e r y I n d o n e s i a E c o n o m i c P r o s p e c t s
J u n e 2 0 2 1 T H E W O R L D B A N K | B A N K D U N I A
12
government bond purchases accelerated between April and December 2020 to respond to the COVID-19 cri-sis. Cuts to reserve requirements also contributed to lowering commercial bank deposits in BI and increasing liquidity in the financial system. Currency in circulation outside the banking system increased, potentially due to a combination of precautionary behavior, low return,
and informality. Liquidity has tightened slightly during the first quarter of this year amid increased portfolio outflows. Money supply (M2) accelerated from 9 per-cent yoy in April-June 2020 to 12.3 percent yoy during the second half of 2020 as lending to government in-creased significantly from a low base while private sec-tor credit contracted.
Figure A.12: Large Portfolio Outflows During the First Quarter of This Year Contributed to External Financing Pressures (USD billion, LHS; index, RHS)
Figure A.13: Indonesia Relied Heavily on Foreign Ex-change Interventions and Moderately on Exchange Rate Flexibility to Manage Past External Financing Pressures (difference between a quarter with external financing pressure and the previous quarter, percent for all variables except for the interest rate dif-ferential which is in percentage point)
Source: IIF, BIS, World Bank staff calculations. Source: CEIC, World Bank staff calculations. Note: An EMP episode is
defined as a quarter during which net capital outflows fall sharply (below the 10th percentile of the distribution normalized by its mean and stand-ard deviation). Results are for the period Q1 2009 to Q4 2019. The “fragile four” are Brazil, Turkey, India and South Africa.
Figure A.14: External Buffers Have Strengthened but Budget Financing Conditions Have Tightened Com-pared to The 2013 Taper Tantrum (percent of GDP; percent of total)
Figure A.15: Real Policy Rates are High Relative to Infla-tion Deviation from Official Targets (percent)
Source: World Bank April 2021 MPO (fiscal balance and current account balance), IMF DataMapper (reserves-to--short-term debt), IIF (foreign holdings of government bonds), World Bank staff calculations.
Source: Haver and World Bank staff calculations. Note: Inflation deviation from official target is the difference between the official target inflation and inflation in March 2021. The real policy rate is the difference between the nominal rate and inflation in March 2021.
84
86
88
90
92
94
96
-9
-7
-5
-3
-1
1
3
5
Jan
-19
Ma
r-19
Ma
y-1
9
Jul-1
9
Se
p-1
9
Nov-1
9
Jan
-20
Ma
r-20
Ma
y-2
0
Jul-2
0
Se
p-2
0
Nov-2
0
Jan
-21
Ma
r-21
Equity
Debt
Net flows
REER (RHS)
-4%
-3%
-2%
-1%
0%
1%
2%
3%
4%
5%
Nominaleffective
exchange rate
Interest ratedifferential with
US
Internationalreserves
Governmentbond yield (10
year)
Indonesia Minimum (fragile four) Maximum (fragile four)
-10
-5
0
5
10
15
20
25
30
35
Fiscal deficit Currentaccount deficit
Reserves Non-residentparticipation
2013 2020
Brazil
Chile
China
Colombia
Georgia
Hungary
India
Indonesia
MexicoParaguay
Philippines
Romania Russia
South Africa
Thailand
Turkey
-4%
-3%
-2%
-1%
0%
1%
2%
3%
4%
5%
-4% -2% 0% 2% 4% 6% 8% 10% 12%
Rea
l p
olicy r
ate
Inflation - inflation target
B o o s t i n g t h e r e c o v e r y I n d o n e s i a E c o n o m i c P r o s p e c t s
J u n e 2 0 2 1 T H E W O R L D B A N K | B A N K D U N I A
13
Figure A.16: M2 Growth is Low Relative to Inflation (x-axis is M2 growth and y-axis is inflation, percent yoy)
Figure A.17: BI Balance Sheet Expansion Has Been Moderate as Government Financing Rose While Private Sector Credit Plummeted. (in percent, contribution)
Source: Haver and World Bank staff calculations. Note: Inflation is the inflation rate in March 2021. M2 growth is Decem-ber 2020
Source: Haver and World Bank staff calculations. Note: NFA (net foreign assets), OMO (open market operation).
Private credit growth has fallen despite overall healthy bank balance sheets and moderate corporate vulnera-bility.
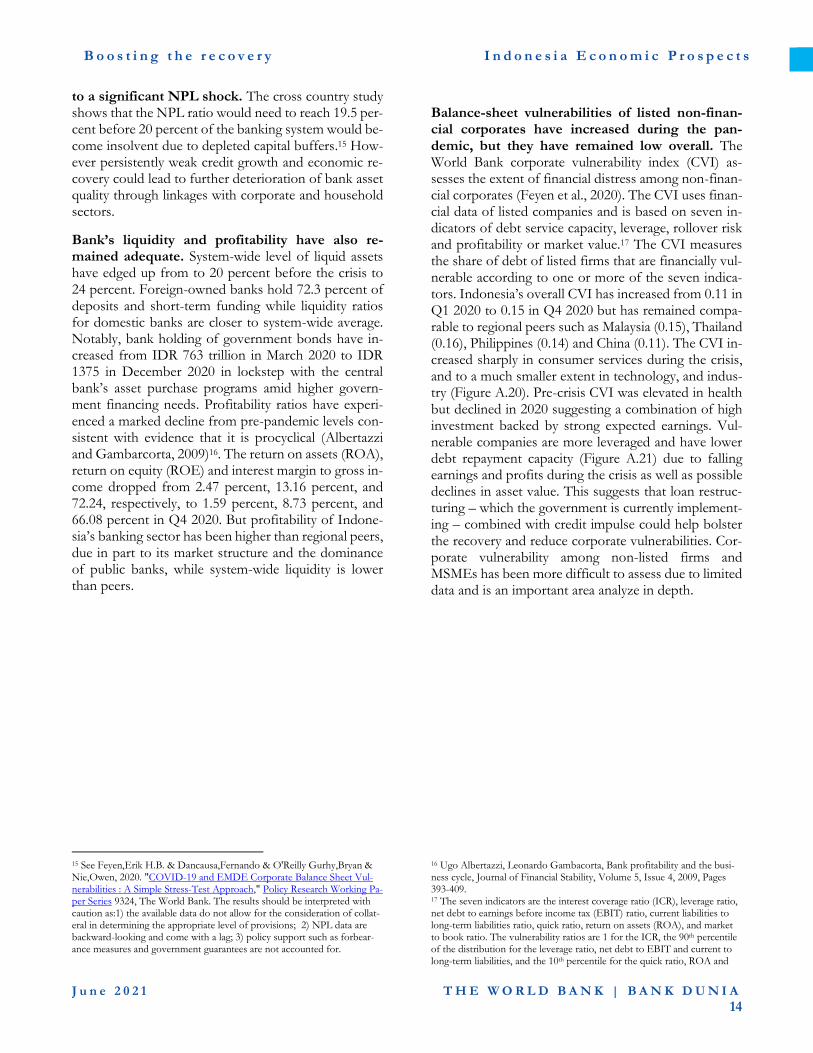
Private sector credit has fallen since the beginning of the pandemic (Figure A.18). Commercial bank lending contracted by -3.7 percent in March 2021, its lowest pace in over a decade. The slowdown has been broad based involving all types of credit, firm sizes and sectors. It has been particularly pronounced among for-eign-owned banks (-19.48 percent in Feb 2021) and to a lesser extent among domestic ones (-4.6 percent in Feb 2021), whereas state-owned banks and regional de-velopment banks have been playing a more countercy-clical role. This divergence could be explained by sev-eral factors, including the tendency of public banks to rollover problematic loans instead of writing them off as well as government credit support measures.13 More generally, the credit contraction is likely due to a com-bination of supply and demand factors, including weak and declining effectiveness of monetary transmission, low take-up of risk sharing mechanisms such as guaran-tees and interest rate subsidies, and historically low reli-ance on banking credit among MSMEs. But further analysis is needed to fully understand and address the policy causes of weak credit which could bear important economic growth dividends.
13 As of end 2020, the banking sector (state-owned, regional and Sharia banks) had received IDR 64.5 trillion in liquidity support from the govern-ment’s fund placement program and has extended credit to MSMEs of IDR 287.2 trillion since July 2020. About IDR 16.5 trillion of working capi-tal guarantees13 of IDR 16.5 trillion has been provided (against a guarantee
Although bank asset quality and provisioning have generally been strong, the higher loans-at-risk war-rants close monitoring (Figure A.19). The system-wide non-performing loans’ (NPL) ratio barely in-creased since mid-2020. The capital adequacy ratio has remained well above the regulatory minimum while provisioning levels relative to NPLs have increased sharply. Indonesia’s level of NPLs has been on par with EAP peers such as China and other ASEAN-5 coun-tries, but provisioning level is higher (World Bank Non-Performing Loans in East Asia and the Pacific: Prac-tices and Lessons in Times of COVID-19, World Bank, forthcoming). But the loans at risk ratio14 – defined as the sum of NPLs, restructured loans and special men-tion loans (Figure A.19) – has increased sharply. The extension of loan forbearance measures until March 2022 may temporarily mask the true extent of bank bal-ance-sheet vulnerabilities. On the liability side, 62.5 per-cent of financial sector debt is denominated in foreign currency (Institute of International Finance, global debt monitor), indicating that currency mismatch could be a potential risk although private debt is low compared to peers. A World Bank reverse stress test performed shows that Indonesia’s banking system would be resilient
target of IDR 100 trillion) and IDR 7.1 trillion in interest subsidies to MSMEs has been extended. 14 Included restructured loans in collectability 1, restructured & non re-structured special mention loans, and NPL in the LAR calculation as of December 2020 based on Bank Indonesia definition.
Brazil
Bulgaria
China
Colombia
Czech Republic
Ecuador
Georgia
HungaryIndia
Indonesia
Malaysia
Mexico
Paraguay
Philippines
Romania
Russia
South Africa
Thailand
Turkey
-2%
0%
2%
4%
6%
8%
10%
12%
14%
0% 10% 20% 30% 40%
Inflation
M2 growth
-40%
-20%
0%
20%
40%
Jan
-20
Feb-2
0
Ma
r-20
Ap
r-20
May-2
0
Jun
-20
Jul-2
0
Au
g-2
0
Se
p-2
0
Oct-
20
Nov-2
0
Dec-2
0
Jan
-21
Fe
b-2
1
Ma
r-21
NFA Dep Corps (claims)Cent Govt (net claims) Pvt sect (claims)OMOs Other liab to banksShare&other eq NOIBase money
B o o s t i n g t h e r e c o v e r y I n d o n e s i a E c o n o m i c P r o s p e c t s
J u n e 2 0 2 1 T H E W O R L D B A N K | B A N K D U N I A
14
to a significant NPL shock. The cross country study shows that the NPL ratio would need to reach 19.5 per-cent before 20 percent of the banking system would be-come insolvent due to depleted capital buffers.15 How-ever persistently weak credit growth and economic re-covery could lead to further deterioration of bank asset quality through linkages with corporate and household sectors.
Bank’s liquidity and profitability have also re-mained adequate. System-wide level of liquid assets have edged up from to 20 percent before the crisis to 24 percent. Foreign-owned banks hold 72.3 percent of deposits and short-term funding while liquidity ratios for domestic banks are closer to system-wide average. Notably, bank holding of government bonds have in-creased from IDR 763 trillion in March 2020 to IDR 1375 in December 2020 in lockstep with the central bank’s asset purchase programs amid higher govern-ment financing needs. Profitability ratios have experi-enced a marked decline from pre-pandemic levels con-sistent with evidence that it is procyclical (Albertazzi and Gambarcorta, 2009)16. The return on assets (ROA), return on equity (ROE) and interest margin to gross in-come dropped from 2.47 percent, 13.16 percent, and 72.24, respectively, to 1.59 percent, 8.73 percent, and 66.08 percent in Q4 2020. But profitability of Indone-sia’s banking sector has been higher than regional peers, due in part to its market structure and the dominance of public banks, while system-wide liquidity is lower than peers.
15 See Feyen,Erik H.B. & Dancausa,Fernando & O'Reilly Gurhy,Bryan & Nie,Owen, 2020. "COVID-19 and EMDE Corporate Balance Sheet Vul-nerabilities : A Simple Stress-Test Approach," Policy Research Working Pa-per Series 9324, The World Bank. The results should be interpreted with caution as:1) the available data do not allow for the consideration of collat-eral in determining the appropriate level of provisions; 2) NPL data are backward-looking and come with a lag; 3) policy support such as forbear-ance measures and government guarantees are not accounted for.
Balance-sheet vulnerabilities of listed non-finan-cial corporates have increased during the pan-demic, but they have remained low overall. The World Bank corporate vulnerability index (CVI) as-sesses the extent of financial distress among non-finan-cial corporates (Feyen et al., 2020). The CVI uses finan-cial data of listed companies and is based on seven in-dicators of debt service capacity, leverage, rollover risk and profitability or market value.17 The CVI measures the share of debt of listed firms that are financially vul-nerable according to one or more of the seven indica-tors. Indonesia’s overall CVI has increased from 0.11 in Q1 2020 to 0.15 in Q4 2020 but has remained compa-rable to regional peers such as Malaysia (0.15), Thailand (0.16), Philippines (0.14) and China (0.11). The CVI in-creased sharply in consumer services during the crisis, and to a much smaller extent in technology, and indus-try (Figure A.20). Pre-crisis CVI was elevated in health but declined in 2020 suggesting a combination of high investment backed by strong expected earnings. Vul-nerable companies are more leveraged and have lower debt repayment capacity (Figure A.21) due to falling earnings and profits during the crisis as well as possible declines in asset value. This suggests that loan restruc-turing – which the government is currently implement-ing – combined with credit impulse could help bolster the recovery and reduce corporate vulnerabilities. Cor-porate vulnerability among non-listed firms and MSMEs has been more difficult to assess due to limited data and is an important area analyze in depth.
16 Ugo Albertazzi, Leonardo Gambacorta, Bank profitability and the busi-ness cycle, Journal of Financial Stability, Volume 5, Issue 4, 2009, Pages 393-409. 17 The seven indicators are the interest coverage ratio (ICR), leverage ratio, net debt to earnings before income tax (EBIT) ratio, current liabilities to long-term liabilities ratio, quick ratio, return on assets (ROA), and market to book ratio. The vulnerability ratios are 1 for the ICR, the 90th percentile of the distribution for the leverage ratio, net debt to EBIT and current to long-term liabilities, and the 10th percentile for the quick ratio, ROA and
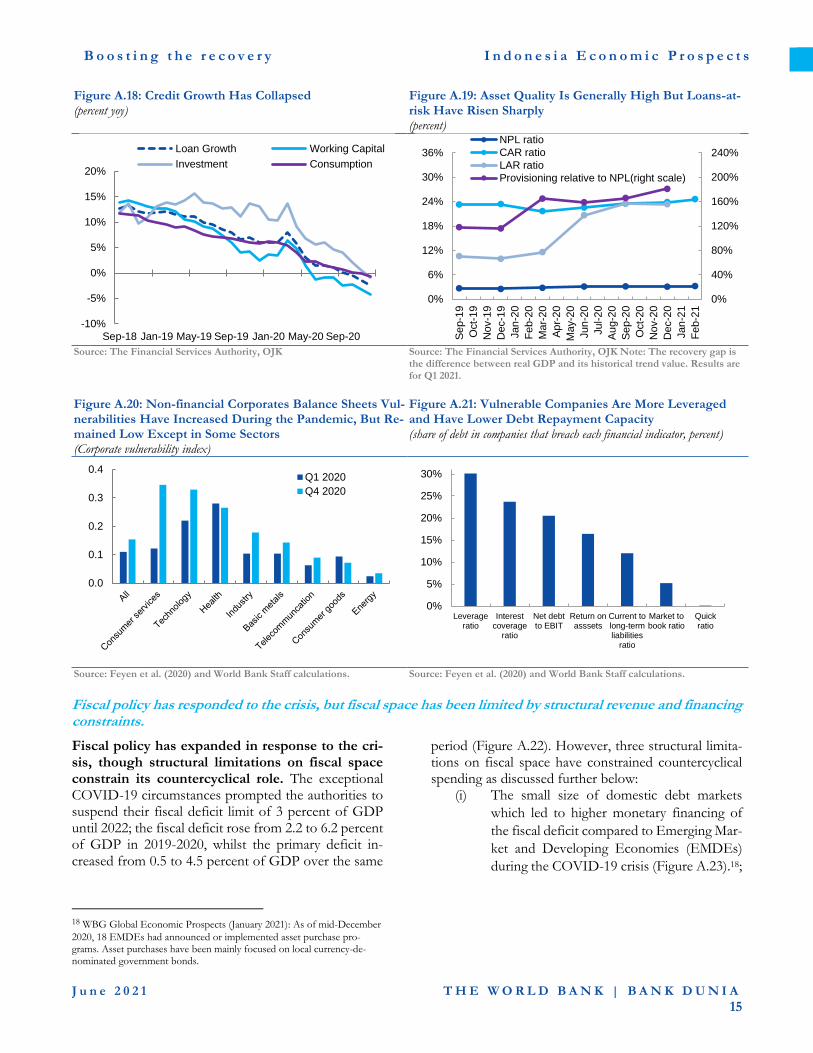
B o o s t i n g t h e r e c o v e r y I n d o n e s i a E c o n o m i c P r o s p e c t s
J u n e 2 0 2 1 T H E W O R L D B A N K | B A N K D U N I A
15
Figure A.18: Credit Growth Has Collapsed (percent yoy)
Figure A.19: Asset Quality Is Generally High But Loans-at-risk Have Risen Sharply (percent)
Source: The Financial Services Authority, OJK Source: The Financial Services Authority, OJK Note: The recovery gap is
the difference between real GDP and its historical trend value. Results are for Q1 2021.
Figure A.20: Non-financial Corporates Balance Sheets Vul-nerabilities Have Increased During the Pandemic, But Re-mained Low Except in Some Sectors (Corporate vulnerability index)
Figure A.21: Vulnerable Companies Are More Leveraged and Have Lower Debt Repayment Capacity (share of debt in companies that breach each financial indicator, percent)
Source: Feyen et al. (2020) and World Bank Staff calculations. Source: Feyen et al. (2020) and World Bank Staff calculations.
Fiscal policy has responded to the crisis, but fiscal space has been limited by structural revenue and financing constraints.
Fiscal policy has expanded in response to the cri-sis, though structural limitations on fiscal space constrain its countercyclical role. The exceptional COVID-19 circumstances prompted the authorities to suspend their fiscal deficit limit of 3 percent of GDP until 2022; the fiscal deficit rose from 2.2 to 6.2 percent of GDP in 2019-2020, whilst the primary deficit in-creased from 0.5 to 4.5 percent of GDP over the same
18 WBG Global Economic Prospects (January 2021): As of mid-December
2020, 18 EMDEs had announced or implemented asset purchase pro-grams. Asset purchases have been mainly focused on local currency-de-nominated government bonds.
period (Figure A.22). However, three structural limita-tions on fiscal space have constrained countercyclical spending as discussed further below:
(i) The small size of domestic debt markets
which led to higher monetary financing of
the fiscal deficit compared to Emerging Mar-
ket and Developing Economies (EMDEs)
during the COVID-19 crisis (Figure A.23).18;
-10%
-5%
0%
5%
10%
15%
20%
Sep-18 Jan-19 May-19 Sep-19 Jan-20 May-20 Sep-20
Loan Growth Working Capital
Investment Consumption
0%
40%
80%
120%
160%
200%
240%
0%
6%
12%
18%
24%
30%
36%
Se
p-1
9
Oct-
19
Nov-1
9
Dec-1
9
Jan
-20
Fe
b-2
0
Ma
r-20
Ap
r-20
May-2
0
Jun
-20
Jul-2
0
Au
g-2
0
Se
p-2
0
Oct-
20
Nov-2
0
Dec-2
0
Jan
-21
Fe
b-2
1
NPL ratio
CAR ratio
LAR ratio
Provisioning relative to NPL(right scale)
0.0
0.1
0.2
0.3
0.4Q1 2020
Q4 2020
0%
5%
10%
15%
20%
25%
30%
Leverageratio
Interestcoverage
ratio
Net debtto EBIT
Return onasssets
Current tolong-termliabilities
ratio
Market tobook ratio
Quickratio
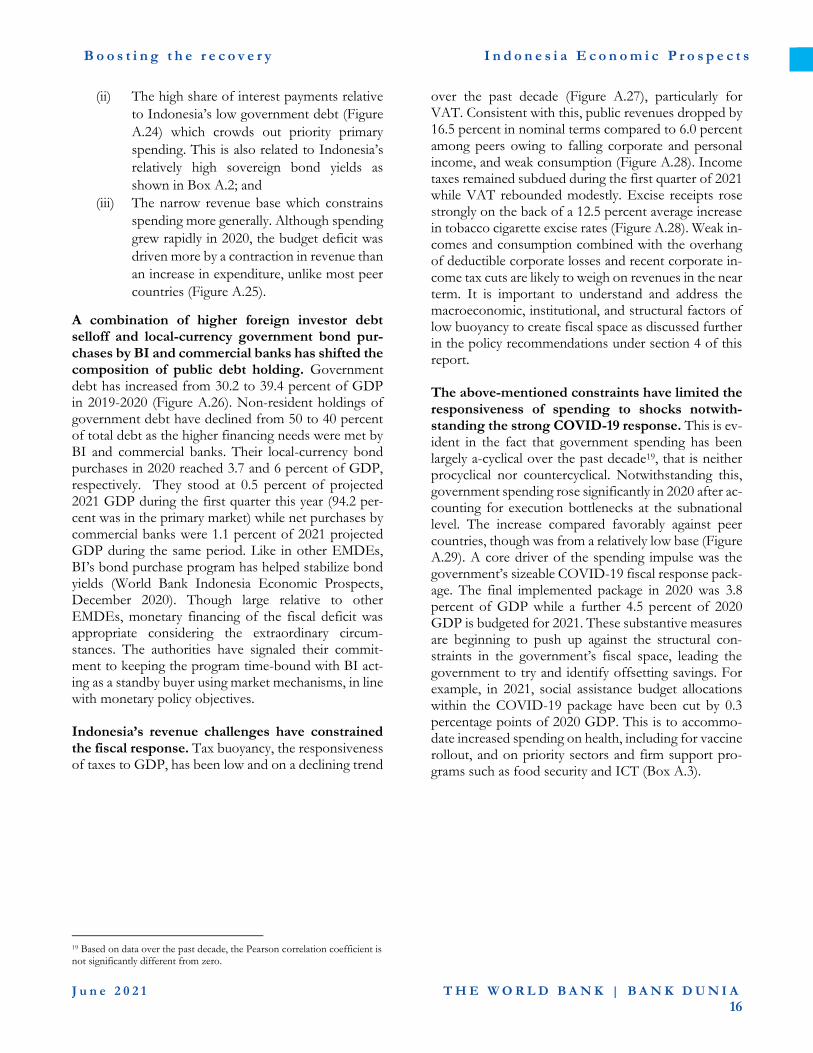
B o o s t i n g t h e r e c o v e r y I n d o n e s i a E c o n o m i c P r o s p e c t s
J u n e 2 0 2 1 T H E W O R L D B A N K | B A N K D U N I A
16
(ii) The high share of interest payments relative
to Indonesia’s low government debt (Figure
A.24) which crowds out priority primary
spending. This is also related to Indonesia’s
relatively high sovereign bond yields as
shown in Box A.2; and
(iii) The narrow revenue base which constrains
spending more generally. Although spending
grew rapidly in 2020, the budget deficit was
driven more by a contraction in revenue than
an increase in expenditure, unlike most peer
countries (Figure A.25).
A combination of higher foreign investor debt selloff and local-currency government bond pur-chases by BI and commercial banks has shifted the composition of public debt holding. Government debt has increased from 30.2 to 39.4 percent of GDP in 2019-2020 (Figure A.26). Non-resident holdings of government debt have declined from 50 to 40 percent of total debt as the higher financing needs were met by BI and commercial banks. Their local-currency bond purchases in 2020 reached 3.7 and 6 percent of GDP, respectively. They stood at 0.5 percent of projected 2021 GDP during the first quarter this year (94.2 per-cent was in the primary market) while net purchases by commercial banks were 1.1 percent of 2021 projected GDP during the same period. Like in other EMDEs, BI’s bond purchase program has helped stabilize bond yields (World Bank Indonesia Economic Prospects, December 2020). Though large relative to other EMDEs, monetary financing of the fiscal deficit was appropriate considering the extraordinary circum-stances. The authorities have signaled their commit-ment to keeping the program time-bound with BI act-ing as a standby buyer using market mechanisms, in line with monetary policy objectives. Indonesia’s revenue challenges have constrained the fiscal response. Tax buoyancy, the responsiveness of taxes to GDP, has been low and on a declining trend
over the past decade (Figure A.27), particularly for VAT. Consistent with this, public revenues dropped by 16.5 percent in nominal terms compared to 6.0 percent among peers owing to falling corporate and personal income, and weak consumption (Figure A.28). Income taxes remained subdued during the first quarter of 2021 while VAT rebounded modestly. Excise receipts rose strongly on the back of a 12.5 percent average increase in tobacco cigarette excise rates (Figure A.28). Weak in-comes and consumption combined with the overhang of deductible corporate losses and recent corporate in-come tax cuts are likely to weigh on revenues in the near term. It is important to understand and address the macroeconomic, institutional, and structural factors of low buoyancy to create fiscal space as discussed further in the policy recommendations under section 4 of this report. The above-mentioned constraints have limited the responsiveness of spending to shocks notwith-standing the strong COVID-19 response. This is ev-ident in the fact that government spending has been largely a-cyclical over the past decade19, that is neither procyclical nor countercyclical. Notwithstanding this, government spending rose significantly in 2020 after ac-counting for execution bottlenecks at the subnational level. The increase compared favorably against peer countries, though was from a relatively low base (Figure A.29). A core driver of the spending impulse was the government’s sizeable COVID-19 fiscal response pack-age. The final implemented package in 2020 was 3.8 percent of GDP while a further 4.5 percent of 2020 GDP is budgeted for 2021. These substantive measures are beginning to push up against the structural con-straints in the government’s fiscal space, leading the government to try and identify offsetting savings. For example, in 2021, social assistance budget allocations within the COVID-19 package have been cut by 0.3 percentage points of 2020 GDP. This is to accommo-date increased spending on health, including for vaccine rollout, and on priority sectors and firm support pro-grams such as food security and ICT (Box A.3).
19 Based on data over the past decade, the Pearson correlation coefficient is not significantly different from zero.

B o o s t i n g t h e r e c o v e r y I n d o n e s i a E c o n o m i c P r o s p e c t s
J u n e 2 0 2 1 T H E W O R L D B A N K | B A N K D U N I A
17
Figure A.22: Fiscal Policy Has Expanded in Response to The Crisis in Indonesia and EMDEs (increase in primary deficit between 2019 and 2020, percentage point of GDP)
Figure A.23: Indonesia’s Budget Financing Constraints Triggered Relatively Large BI Support amid Higher Fi-nancing Needs (percent of GDP)
Source: World Bank Macro Poverty Outlook, April 2021
Source: WB Global Economic Prospects (January 2021), Haver Analyt-ics, WB Staff assessment Note: Based on announced or completed purchases (where no an-nouncement) relative to 2019 nominal GDP as of Nov 2020. For Indone-sia, based on 2020 actual data
Figure A.24: The Interest payments-to-revenue Ratio is High Relative to Indonesia’s Low Level of Government Debt (x-axis: Debt-to-GDP ratio; y-axis: interest payments-to-revenue ratio, 2019 unless otherwise stated)
Figure A.25: The Deficit in 2020 was Driven More by a Drop in Revenue than An Increase in Expenditure (contribution of revenues to the deficit, proportion, 2019-2020)
Source: WDI, World Bank staff calculation Note: Interest payments-to-revenue ratio for China and India are from 2018
Sources: IMF WEO, World Bank staff calculation Note: Selection limited to peer countries for which revenues declined and expenditures increased.
Figure A.26: Fiscal Imbalances Have Led to a Sharp Rise in Overall Government Debt, which Remained Low Overall (percent of GDP)
Figure A.27: Revenue Buoyancy Has Been Low (yoy change in nominal taxes (4-quarter rolling) as a ratio of yoy change in Nominal GDP (4-quarter rolling))
Source: World Bank Macro Poverty Outlook Sources: Haver Analytics, WB Staff calculations
0
1
2
3
4
5
6
7
8
9
Bra
zil
Pe
ru
Sout…
Russia
Chin
a
India
Thail…
Colo…
Arme…
Philip…
Indon…
Mala…
Me
xic
o
Tu
rkey
Vietn…
0
1
2
3
4
Indonesia
EC
A
LA
C
EA
P
SS
A
SA
R
avg-min max-avg
Armenia
Brazil
China
Colombia
India
IndonesiaMalaysiaMexico
Peru
Philippines
Russia
South Africa
Thailand
TurkeyVietnam
0
5
10
15
20
25
0 20 40 60 80
0
20
40
60
80
100G
uate
mala
Me
xic
o
Pa
raguay
Bra
zil
Georg
ia
Chin
a
So
uth
Afr
ica
India
Th
aila
nd
Ph
ilippin
es
Indonesia
Jord
an
Ma
laysia
0
20
40
60
80
100 2019 2020
0.0
0.5
1.0
1.5
2.0
Dec-1
1
Dec-1
2
Dec-1
3
Dec-1
4
Dec-1
5
Dec-1
6
Dec-1
7
Dec-1
8
Dec-1
9
Tax Income Tax VAT
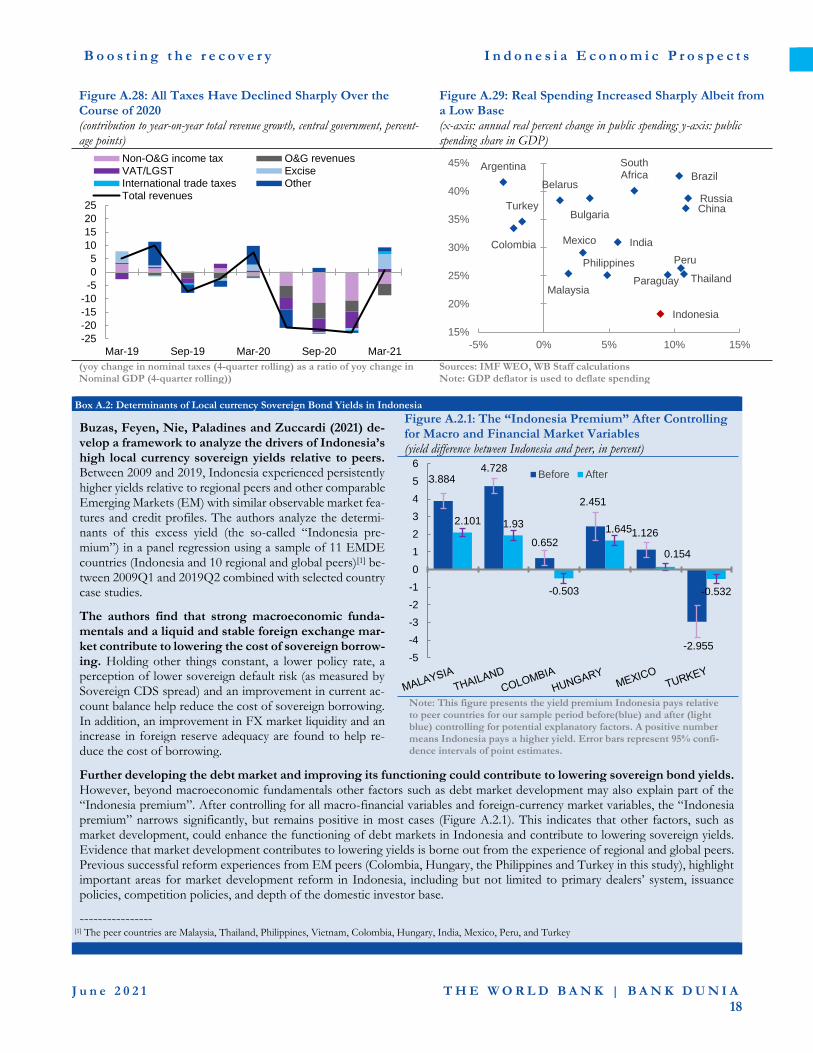
B o o s t i n g t h e r e c o v e r y I n d o n e s i a E c o n o m i c P r o s p e c t s
J u n e 2 0 2 1 T H E W O R L D B A N K | B A N K D U N I A
18
Figure A.28: All Taxes Have Declined Sharply Over the Course of 2020 (contribution to year-on-year total revenue growth, central government, percent-age points)
Figure A.29: Real Spending Increased Sharply Albeit from a Low Base (x-axis: annual real percent change in public spending; y-axis: public spending share in GDP)
(yoy change in nominal taxes (4-quarter rolling) as a ratio of yoy change in Nominal GDP (4-quarter rolling))
Sources: IMF WEO, WB Staff calculations Note: GDP deflator is used to deflate spending
Box A.2: Determinants of Local currency Sovereign Bond Yields in Indonesia
Buzas, Feyen, Nie, Paladines and Zuccardi (2021) de-velop a framework to analyze the drivers of Indonesia’s high local currency sovereign yields relative to peers. Between 2009 and 2019, Indonesia experienced persistently higher yields relative to regional peers and other comparable Emerging Markets (EM) with similar observable market fea-tures and credit profiles. The authors analyze the determi-nants of this excess yield (the so-called “Indonesia pre-mium”) in a panel regression using a sample of 11 EMDE countries (Indonesia and 10 regional and global peers)[1] be-tween 2009Q1 and 2019Q2 combined with selected country case studies.
The authors find that strong macroeconomic funda-mentals and a liquid and stable foreign exchange mar-ket contribute to lowering the cost of sovereign borrow-ing. Holding other things constant, a lower policy rate, a perception of lower sovereign default risk (as measured by Sovereign CDS spread) and an improvement in current ac-count balance help reduce the cost of sovereign borrowing. In addition, an improvement in FX market liquidity and an increase in foreign reserve adequacy are found to help re-duce the cost of borrowing.
Further developing the debt market and improving its functioning could contribute to lowering sovereign bond yields. However, beyond macroeconomic fundamentals other factors such as debt market development may also explain part of the “Indonesia premium”. After controlling for all macro-financial variables and foreign-currency market variables, the “Indonesia premium” narrows significantly, but remains positive in most cases (Figure A.2.1). This indicates that other factors, such as market development, could enhance the functioning of debt markets in Indonesia and contribute to lowering sovereign yields. Evidence that market development contributes to lowering yields is borne out from the experience of regional and global peers. Previous successful reform experiences from EM peers (Colombia, Hungary, the Philippines and Turkey in this study), highlight important areas for market development reform in Indonesia, including but not limited to primary dealers’ system, issuance policies, competition policies, and depth of the domestic investor base.
---------------- [1] The peer countries are Malaysia, Thailand, Philippines, Vietnam, Colombia, Hungary, India, Mexico, Peru, and Turkey
Figure A.2.1: The “Indonesia Premium” After Controlling for Macro and Financial Market Variables (yield difference between Indonesia and peer, in percent)
Note: This figure presents the yield premium Indonesia pays relative to peer countries for our sample period before(blue) and after (light blue) controlling for potential explanatory factors. A positive number means Indonesia pays a higher yield. Error bars represent 95% confi-dence intervals of point estimates.
-25
-20
-15
-10
-5
0
5
10
15
20
25
Mar-19 Sep-19 Mar-20 Sep-20 Mar-21
Non-O&G income tax O&G revenuesVAT/LGST ExciseInternational trade taxes OtherTotal revenues
Argentina
BelarusBrazil
BulgariaChina
Colombia India
Indonesia
Malaysia
Mexico
Paraguay
PeruPhilippines
Russia
South Africa
Thailand
Turkey
15%
20%
25%
30%
35%
40%
45%
-5% 0% 5% 10% 15%
3.8844.728
0.652
2.451
1.126
-2.955
2.101 1.93
-0.503
1.645
0.154
-0.532
-5
-4
-3
-2
-1
0
1
2
3
4
5
6Before After
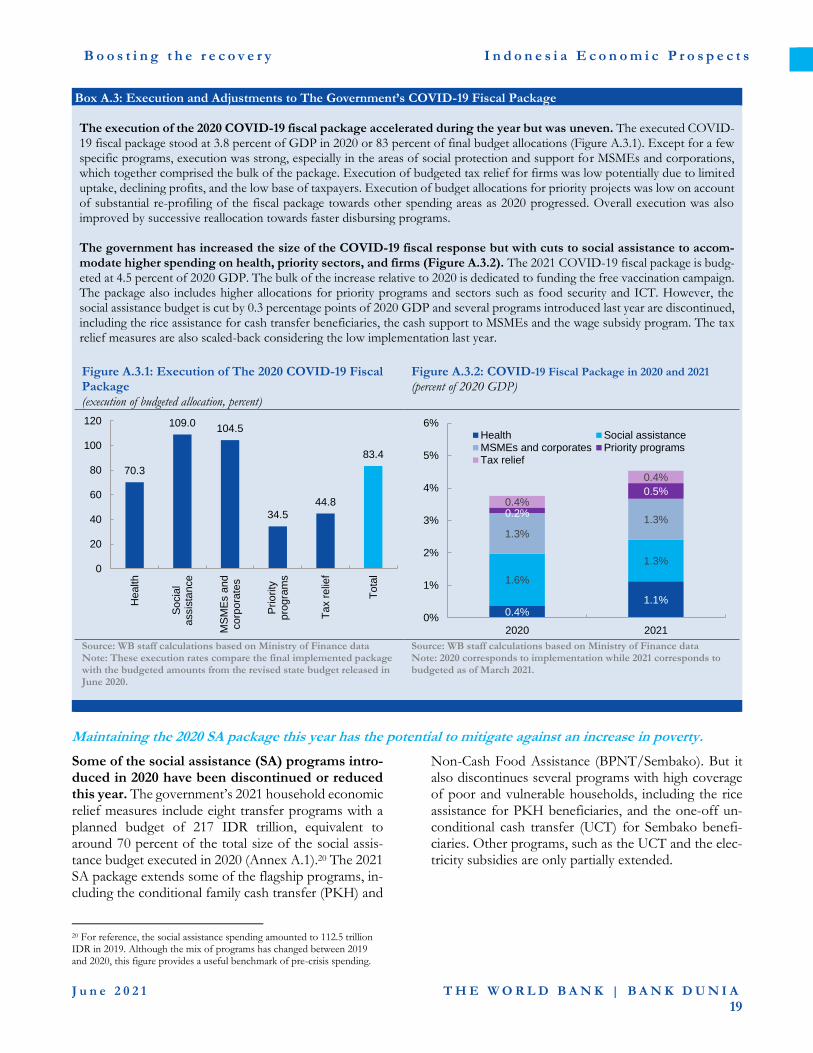
B o o s t i n g t h e r e c o v e r y I n d o n e s i a E c o n o m i c P r o s p e c t s
J u n e 2 0 2 1 T H E W O R L D B A N K | B A N K D U N I A
19
Box A.3: Execution and Adjustments to The Government’s COVID-19 Fiscal Package The execution of the 2020 COVID-19 fiscal package accelerated during the year but was uneven. The executed COVID-19 fiscal package stood at 3.8 percent of GDP in 2020 or 83 percent of final budget allocations (Figure A.3.1). Except for a few specific programs, execution was strong, especially in the areas of social protection and support for MSMEs and corporations, which together comprised the bulk of the package. Execution of budgeted tax relief for firms was low potentially due to limited uptake, declining profits, and the low base of taxpayers. Execution of budget allocations for priority projects was low on account of substantial re-profiling of the fiscal package towards other spending areas as 2020 progressed. Overall execution was also improved by successive reallocation towards faster disbursing programs. The government has increased the size of the COVID-19 fiscal response but with cuts to social assistance to accom-modate higher spending on health, priority sectors, and firms (Figure A.3.2). The 2021 COVID-19 fiscal package is budg-eted at 4.5 percent of 2020 GDP. The bulk of the increase relative to 2020 is dedicated to funding the free vaccination campaign. The package also includes higher allocations for priority programs and sectors such as food security and ICT. However, the social assistance budget is cut by 0.3 percentage points of 2020 GDP and several programs introduced last year are discontinued, including the rice assistance for cash transfer beneficiaries, the cash support to MSMEs and the wage subsidy program. The tax relief measures are also scaled-back considering the low implementation last year.
Figure A.3.1: Execution of The 2020 COVID-19 Fiscal Package (execution of budgeted allocation, percent)
Figure A.3.2: COVID-19 Fiscal Package in 2020 and 2021
(percent of 2020 GDP)
Source: WB staff calculations based on Ministry of Finance data Note: These execution rates compare the final implemented package with the budgeted amounts from the revised state budget released in June 2020.
Source: WB staff calculations based on Ministry of Finance data Note: 2020 corresponds to implementation while 2021 corresponds to budgeted as of March 2021.
Maintaining the 2020 SA package this year has the potential to mitigate against an increase in poverty.
Some of the social assistance (SA) programs intro-duced in 2020 have been discontinued or reduced this year. The government’s 2021 household economic relief measures include eight transfer programs with a planned budget of 217 IDR trillion, equivalent to around 70 percent of the total size of the social assis-tance budget executed in 2020 (Annex A.1).20 The 2021 SA package extends some of the flagship programs, in-cluding the conditional family cash transfer (PKH) and
20 For reference, the social assistance spending amounted to 112.5 trillion IDR in 2019. Although the mix of programs has changed between 2019 and 2020, this figure provides a useful benchmark of pre-crisis spending.
Non-Cash Food Assistance (BPNT/Sembako). But it also discontinues several programs with high coverage of poor and vulnerable households, including the rice assistance for PKH beneficiaries, and the one-off un-conditional cash transfer (UCT) for Sembako benefi-ciaries. Other programs, such as the UCT and the elec-tricity subsidies are only partially extended.
70.3
109.0104.5
34.5
44.8
83.4
0
20
40
60
80
100
120
Health
So
cia
lassis
tance
MS
ME
s a
nd
corp
ora
tes
Prio
rity
pro
gra
ms
Ta
x r
elie
f
To
tal
0.4%1.1%
1.6%
1.3%
1.3%
1.3%0.2%
0.5%0.4%
0.4%
0%
1%
2%
3%
4%
5%
6%
2020 2021
Health Social assistanceMSMEs and corporates Priority programsTax relief
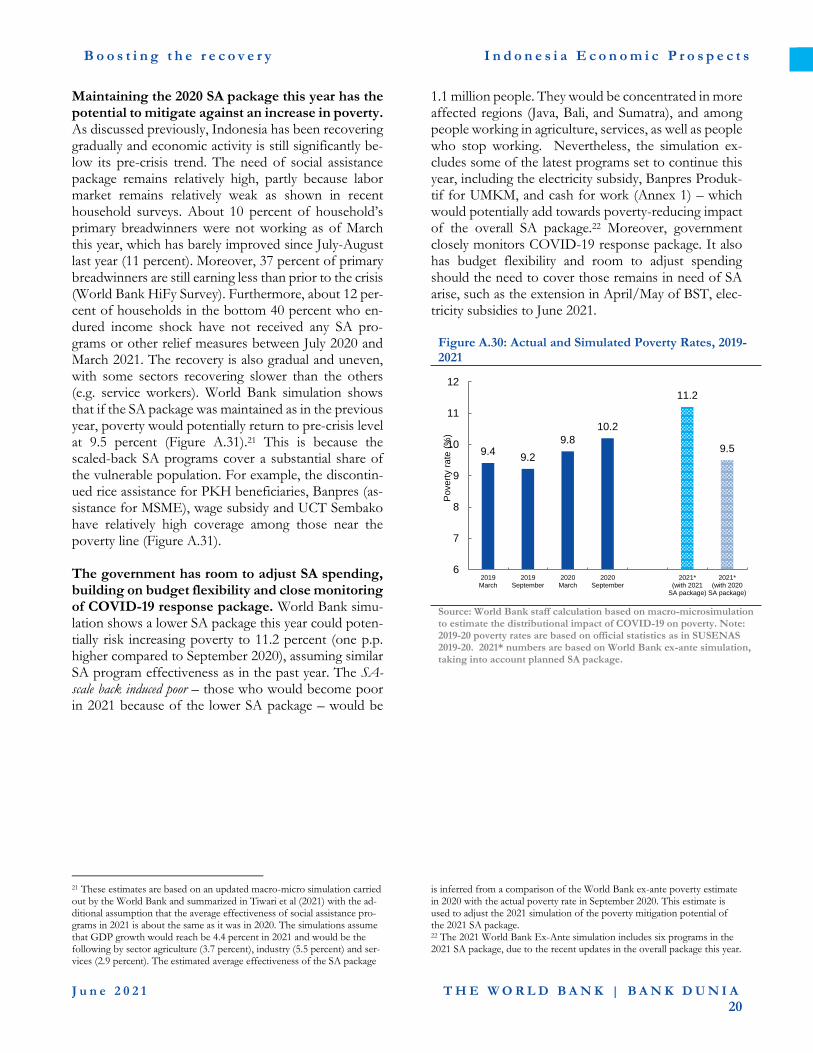
B o o s t i n g t h e r e c o v e r y I n d o n e s i a E c o n o m i c P r o s p e c t s
J u n e 2 0 2 1 T H E W O R L D B A N K | B A N K D U N I A
20
Maintaining the 2020 SA package this year has the potential to mitigate against an increase in poverty. As discussed previously, Indonesia has been recovering gradually and economic activity is still significantly be-low its pre-crisis trend. The need of social assistance package remains relatively high, partly because labor market remains relatively weak as shown in recent household surveys. About 10 percent of household’s primary breadwinners were not working as of March this year, which has barely improved since July-August last year (11 percent). Moreover, 37 percent of primary breadwinners are still earning less than prior to the crisis (World Bank HiFy Survey). Furthermore, about 12 per-cent of households in the bottom 40 percent who en-dured income shock have not received any SA pro-grams or other relief measures between July 2020 and March 2021. The recovery is also gradual and uneven, with some sectors recovering slower than the others (e.g. service workers). World Bank simulation shows that if the SA package was maintained as in the previous year, poverty would potentially return to pre-crisis level at 9.5 percent (Figure A.31).21 This is because the scaled-back SA programs cover a substantial share of the vulnerable population. For example, the discontin-ued rice assistance for PKH beneficiaries, Banpres (as-sistance for MSME), wage subsidy and UCT Sembako have relatively high coverage among those near the poverty line (Figure A.31). The government has room to adjust SA spending, building on budget flexibility and close monitoring of COVID-19 response package. World Bank simu-lation shows a lower SA package this year could poten-tially risk increasing poverty to 11.2 percent (one p.p. higher compared to September 2020), assuming similar SA program effectiveness as in the past year. The SA-scale back induced poor – those who would become poor in 2021 because of the lower SA package – would be
1.1 million people. They would be concentrated in more affected regions (Java, Bali, and Sumatra), and among people working in agriculture, services, as well as people who stop working. Nevertheless, the simulation ex-cludes some of the latest programs set to continue this year, including the electricity subsidy, Banpres Produk-tif for UMKM, and cash for work (Annex 1) – which would potentially add towards poverty-reducing impact of the overall SA package.22 Moreover, government closely monitors COVID-19 response package. It also has budget flexibility and room to adjust spending should the need to cover those remains in need of SA arise, such as the extension in April/May of BST, elec-tricity subsidies to June 2021.
Figure A.30: Actual and Simulated Poverty Rates, 2019-2021
Source: World Bank staff calculation based on macro-microsimulation to estimate the distributional impact of COVID-19 on poverty. Note: 2019-20 poverty rates are based on official statistics as in SUSENAS 2019-20. 2021* numbers are based on World Bank ex-ante simulation, taking into account planned SA package.
21 These estimates are based on an updated macro-micro simulation carried out by the World Bank and summarized in Tiwari et al (2021) with the ad-ditional assumption that the average effectiveness of social assistance pro-grams in 2021 is about the same as it was in 2020. The simulations assume that GDP growth would reach be 4.4 percent in 2021 and would be the following by sector agriculture (3.7 percent), industry (5.5 percent) and ser-vices (2.9 percent). The estimated average effectiveness of the SA package
is inferred from a comparison of the World Bank ex-ante poverty estimate in 2020 with the actual poverty rate in September 2020. This estimate is used to adjust the 2021 simulation of the poverty mitigation potential of the 2021 SA package. 22 The 2021 World Bank Ex-Ante simulation includes six programs in the 2021 SA package, due to the recent updates in the overall package this year.
9.49.2
9.8
10.2
11.2
9.5
6
7
8
9
10
11
12
2019March
2019September
2020March
2020September
2021*(with 2021
SA package)
2021*(with 2020
SA package)
Povert
y ra
te (
%)
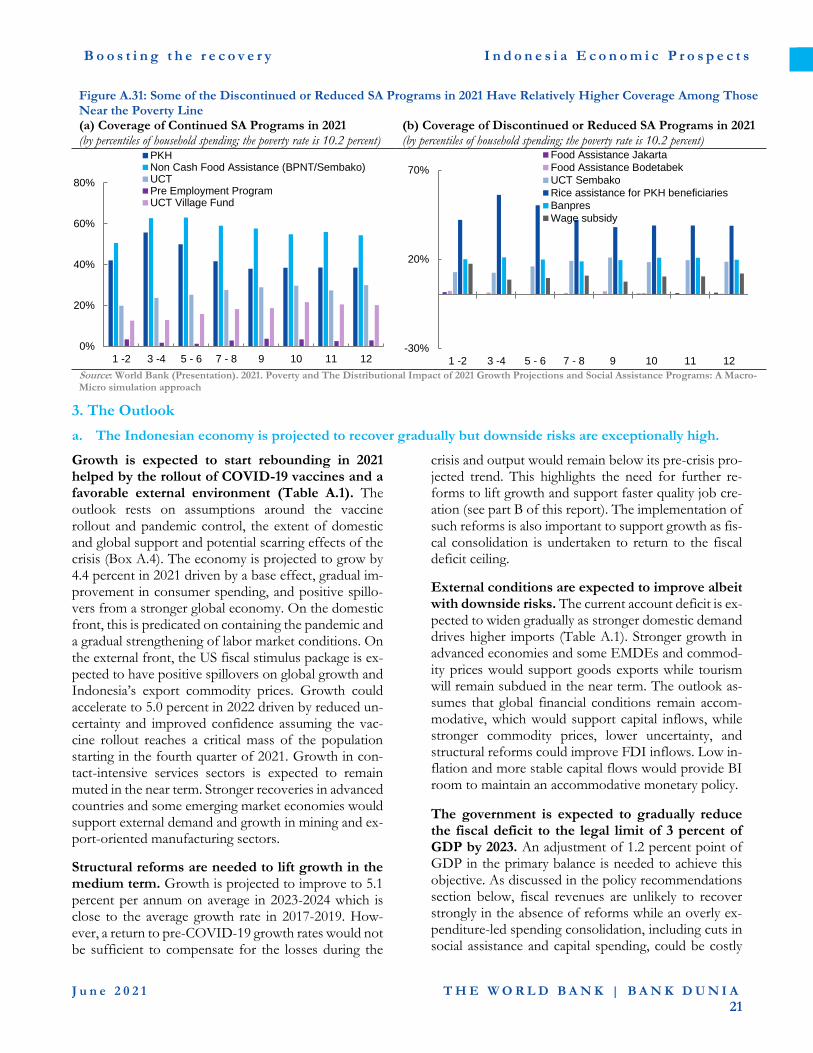
B o o s t i n g t h e r e c o v e r y I n d o n e s i a E c o n o m i c P r o s p e c t s
J u n e 2 0 2 1 T H E W O R L D B A N K | B A N K D U N I A
21
Figure A.31: Some of the Discontinued or Reduced SA Programs in 2021 Have Relatively Higher Coverage Among Those Near the Poverty Line (a) Coverage of Continued SA Programs in 2021 (by percentiles of household spending; the poverty rate is 10.2 percent)
(b) Coverage of Discontinued or Reduced SA Programs in 2021 (by percentiles of household spending; the poverty rate is 10.2 percent)
Source: World Bank (Presentation). 2021. Poverty and The Distributional Impact of 2021 Growth Projections and Social Assistance Programs: A Macro-Micro simulation approach
3. The Outlook
a. The Indonesian economy is projected to recover gradually but downside risks are exceptionally high.
Growth is expected to start rebounding in 2021 helped by the rollout of COVID-19 vaccines and a favorable external environment (Table A.1). The outlook rests on assumptions around the vaccine rollout and pandemic control, the extent of domestic and global support and potential scarring effects of the crisis (Box A.4). The economy is projected to grow by 4.4 percent in 2021 driven by a base effect, gradual im-provement in consumer spending, and positive spillo-vers from a stronger global economy. On the domestic front, this is predicated on containing the pandemic and a gradual strengthening of labor market conditions. On the external front, the US fiscal stimulus package is ex-pected to have positive spillovers on global growth and Indonesia’s export commodity prices. Growth could accelerate to 5.0 percent in 2022 driven by reduced un-certainty and improved confidence assuming the vac-cine rollout reaches a critical mass of the population starting in the fourth quarter of 2021. Growth in con-tact-intensive services sectors is expected to remain muted in the near term. Stronger recoveries in advanced countries and some emerging market economies would support external demand and growth in mining and ex-port-oriented manufacturing sectors.
Structural reforms are needed to lift growth in the medium term. Growth is projected to improve to 5.1 percent per annum on average in 2023-2024 which is close to the average growth rate in 2017-2019. How-ever, a return to pre-COVID-19 growth rates would not be sufficient to compensate for the losses during the
crisis and output would remain below its pre-crisis pro-jected trend. This highlights the need for further re-forms to lift growth and support faster quality job cre-ation (see part B of this report). The implementation of such reforms is also important to support growth as fis-cal consolidation is undertaken to return to the fiscal deficit ceiling.
External conditions are expected to improve albeit with downside risks. The current account deficit is ex-pected to widen gradually as stronger domestic demand drives higher imports (Table A.1). Stronger growth in advanced economies and some EMDEs and commod-ity prices would support goods exports while tourism will remain subdued in the near term. The outlook as-sumes that global financial conditions remain accom-modative, which would support capital inflows, while stronger commodity prices, lower uncertainty, and structural reforms could improve FDI inflows. Low in-flation and more stable capital flows would provide BI room to maintain an accommodative monetary policy.
The government is expected to gradually reduce the fiscal deficit to the legal limit of 3 percent of GDP by 2023. An adjustment of 1.2 percent point of GDP in the primary balance is needed to achieve this objective. As discussed in the policy recommendations section below, fiscal revenues are unlikely to recover strongly in the absence of reforms while an overly ex-penditure-led spending consolidation, including cuts in social assistance and capital spending, could be costly
0%
20%
40%
60%
80%
1 -2 3 -4 5 - 6 7 - 8 9 10 11 12
PKHNon Cash Food Assistance (BPNT/Sembako)UCTPre Employment ProgramUCT Village Fund
-30%
20%
70%
1 -2 3 -4 5 - 6 7 - 8 9 10 11 12
Food Assistance Jakarta
Food Assistance Bodetabek
UCT Sembako
Rice assistance for PKH beneficiaries
Banpres
Wage subsidy
B o o s t i n g t h e r e c o v e r y I n d o n e s i a E c o n o m i c P r o s p e c t s
J u n e 2 0 2 1 T H E W O R L D B A N K | B A N K D U N I A
22
socially and for long-term growth. It is assumed in the baseline that the government’s fiscal consolidation plan will be balanced and combine unwinding of exceptional measures, cuts in inefficient spending and income and consumption tax reforms (see policy recommendation section for a presentation of possible revenue and spending reforms). Revenues are projected to increase by 1.4 percentage point of GDP between 2021 and 2024, while spending will fall by 0.9 percentage point of GDP over the same period. Gross financing needs would be contained at 7.1 percent of GDP in 2023-2024 but would remain above pre-crisis levels of 5.9 percent of GDP in 2019. This indicates that monetary financing of the fiscal deficit could decline provided that external financing improves. The debt-to-GDP ra-tio projected to rise to 43.5 percent by 2024, but still
well below the legal ceiling of 60 percent. Lastly, interest payments are projected to increase from 14.1 percent of fiscal revenues in 2019 to an average of 20.6 percent in 2023-2024, highlighting that fiscal space would remain tight.
The materialization of some downside risks would slow the recovery. The forecasts are subject to consid-erable uncertainty on the future path of the pandemic, global financial conditions, banking and financial sector performance and stress and scarring effects of the crisis (Box A.4). A slower-than-expected improvement in vaccine rollout, confidence, and social distancing do-mestically, combined with weaker global growth could lower Indonesia’s growth to 2.1 percent in 2021 and 3.1 percent in 2022.
Box A.4: Outlook Assumptions and Downside Risks
The forecasts are built on the following assumptions on the vaccine rollout, the extent of global and domestic policy support, and potential scarring effects of the crisis.
• Vaccine rollout and confidence: the vaccine rollout is assumed to progress steadily driven by increased vaccine production by manufacturers [1] and reduced procurement bottlenecks. This would help contain the pandemic and improve consumer confidence which is assumed to return to be firmly optimistic starting in the fourth quarter this year (consumer confidence index above 100).
• Global and domestic support and spillovers: fiscal and monetary support is expected to be maintained in the near term with only gradual unwinding. The baseline assumes that the large US fiscal stimulus package approved in February this year would have positive spillovers on Indonesia through increased global demand and the price of commodity exports. Oil, metal, coal, and agricultural prices are projected to increase this year by 36, 25, 28, and 12 percent, respectively and global trade is expected to increase by 5.5 to 6.3 percent in 2021-2022 (World Bank Commodity Market Outlook, April 2021). On the domestic front, it is assumed that monetary policy would remain accommodative and fiscal support would be maintained until 2022.
• Scarring: the crisis could damage Indonesia’s growth potential through lower investment, weak productivity growth, and loss in human capital. Potential growth is projected to drop by at least 0.7 percentage points below pre-COVID-19 levels to 4.6 percent on average in 2021-2023, driven largely by depressed investment. Potential growth could drop further in the medium term if the crisis were to deepen or to spill over to the banking and financial sector. Under the baseline, growth would return to its pre-COVID-19 potential by 2024 assuming implementation of structural reforms.
Risks to the outlook are severely skewed to the downside. The forecasts are subject to considerable uncertainty on the future path of the pandemic, global financial conditions, banking and financial sector performance and stress and scarring effects of the crisis:
• The pandemic, vaccine rollout and new variants: On the downside, the pandemic could last more than expected due the emer-gence of more transmissible variants. This could increase the incidence and frequency of flare-ups. Vaccine rollout could also be slower-than-expected due to vaccine supply shortages and distribution bottlenecks. Tackling logistics and distribution challenges in Indonesia’s large archipelago remains paramount.
• Global financial conditions: The large US fiscal support could lead to higher inflation and monetary tightening with important spillover effects on Indonesia. Capital outflows and rupiah depreciation could increase thereby tightening financing of the twin deficit and potentially fueling inflation and financial pressure on corporations.
• Banking and financial sector performance and stress: The ongoing weak credit impulse could slow down the recovery. At the same time, a wave of corporate default could trigger a crisis or weaken the banking system and its ability to provide credit during the crisis.
• Scarring from the crisis: Potential and actual output could take longer to recover due to deeper scars on firms’ balance sheets and potentially higher bankruptcies, human capital loss of the unemployed and discouraged workers, weaker human capital accumulation of children and youth, etc.
---------------- [1] At least 10 separate manufacturers have set production targets of more than 1 billion vaccines each by the end of the year which would make available 12 billion doses by December 2021, more than enough to inoculate 70 percent of the world population (World Bank Global Economic Prospects, June 2021).
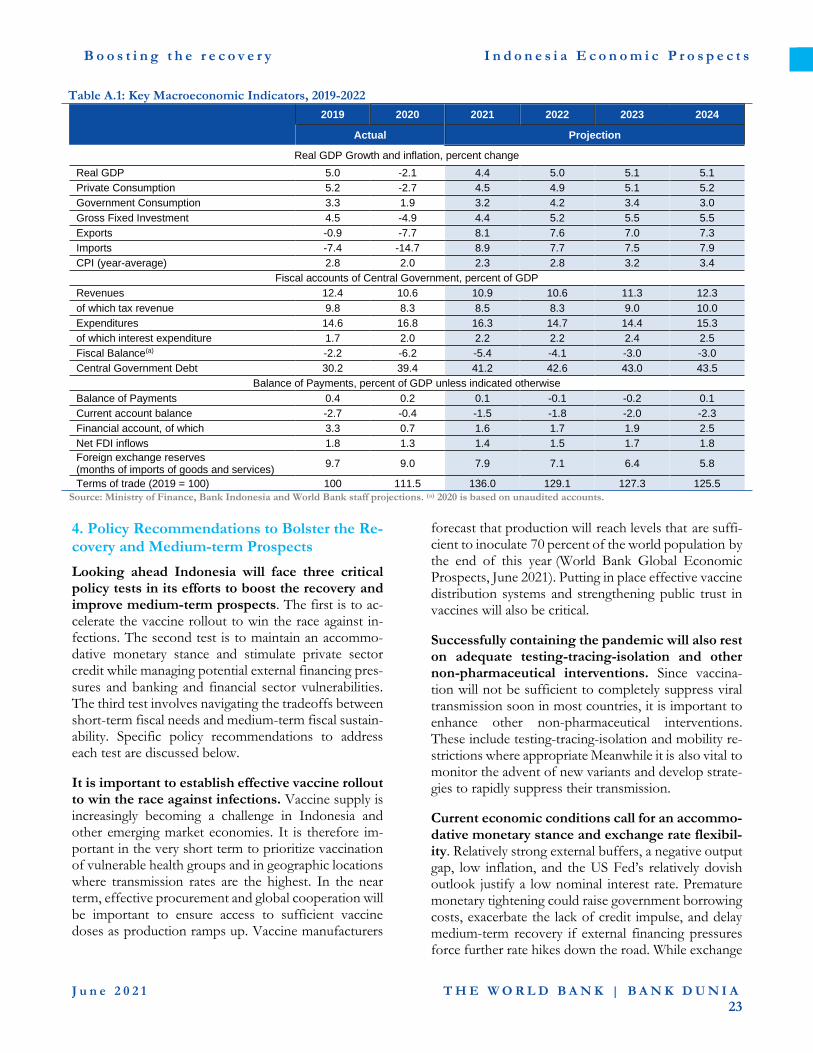
B o o s t i n g t h e r e c o v e r y I n d o n e s i a E c o n o m i c P r o s p e c t s
J u n e 2 0 2 1 T H E W O R L D B A N K | B A N K D U N I A
23
Table A.1: Key Macroeconomic Indicators, 2019-2022
2019 2020 2021 2022 2023 2024
Actual Projection
Real GDP Growth and inflation, percent change
Real GDP 5.0 -2.1 4.4 5.0 5.1 5.1
Private Consumption 5.2 -2.7 4.5 4.9 5.1 5.2
Government Consumption 3.3 1.9 3.2 4.2 3.4 3.0
Gross Fixed Investment 4.5 -4.9 4.4 5.2 5.5 5.5
Exports -0.9 -7.7 8.1 7.6 7.0 7.3
Imports -7.4 -14.7 8.9 7.7 7.5 7.9
CPI (year-average) 2.8 2.0 2.3 2.8 3.2 3.4
Fiscal accounts of Central Government, percent of GDP
Revenues 12.4 10.6 10.9 10.6 11.3 12.3
of which tax revenue 9.8 8.3 8.5 8.3 9.0 10.0
Expenditures 14.6 16.8 16.3 14.7 14.4 15.3
of which interest expenditure 1.7 2.0 2.2 2.2 2.4 2.5
Fiscal Balance(a) -2.2 -6.2 -5.4 -4.1 -3.0 -3.0
Central Government Debt 30.2 39.4 41.2 42.6 43.0 43.5
Balance of Payments, percent of GDP unless indicated otherwise
Balance of Payments 0.4 0.2 0.1 -0.1 -0.2 0.1
Current account balance -2.7 -0.4 -1.5 -1.8 -2.0 -2.3
Financial account, of which 3.3 0.7 1.6 1.7 1.9 2.5
Net FDI inflows 1.8 1.3 1.4 1.5 1.7 1.8
Foreign exchange reserves (months of imports of goods and services)
9.7 9.0 7.9 7.1 6.4 5.8
Terms of trade (2019 = 100) 100 111.5 136.0 129.1 127.3 125.5
Source: Ministry of Finance, Bank Indonesia and World Bank staff projections. (a) 2020 is based on unaudited accounts.
4. Policy Recommendations to Bolster the Re-covery and Medium-term Prospects
Looking ahead Indonesia will face three critical policy tests in its efforts to boost the recovery and improve medium-term prospects. The first is to ac-celerate the vaccine rollout to win the race against in-fections. The second test is to maintain an accommo-dative monetary stance and stimulate private sector credit while managing potential external financing pres-sures and banking and financial sector vulnerabilities. The third test involves navigating the tradeoffs between short-term fiscal needs and medium-term fiscal sustain-ability. Specific policy recommendations to address each test are discussed below.
It is important to establish effective vaccine rollout to win the race against infections. Vaccine supply is increasingly becoming a challenge in Indonesia and other emerging market economies. It is therefore im-portant in the very short term to prioritize vaccination of vulnerable health groups and in geographic locations where transmission rates are the highest. In the near term, effective procurement and global cooperation will be important to ensure access to sufficient vaccine doses as production ramps up. Vaccine manufacturers
forecast that production will reach levels that are suffi-cient to inoculate 70 percent of the world population by the end of this year (World Bank Global Economic Prospects, June 2021). Putting in place effective vaccine distribution systems and strengthening public trust in vaccines will also be critical.
Successfully containing the pandemic will also rest on adequate testing-tracing-isolation and other non-pharmaceutical interventions. Since vaccina-tion will not be sufficient to completely suppress viral transmission soon in most countries, it is important to enhance other non-pharmaceutical interventions. These include testing-tracing-isolation and mobility re-strictions where appropriate Meanwhile it is also vital to monitor the advent of new variants and develop strate-gies to rapidly suppress their transmission.
Current economic conditions call for an accommo-dative monetary stance and exchange rate flexibil-ity. Relatively strong external buffers, a negative output gap, low inflation, and the US Fed’s relatively dovish outlook justify a low nominal interest rate. Premature monetary tightening could raise government borrowing costs, exacerbate the lack of credit impulse, and delay medium-term recovery if external financing pressures force further rate hikes down the road. While exchange
B o o s t i n g t h e r e c o v e r y I n d o n e s i a E c o n o m i c P r o s p e c t s
J u n e 2 0 2 1 T H E W O R L D B A N K | B A N K D U N I A
24
rate flexibility could contribute to higher debt servicing costs in the short-term, the burden could be offset by a faster recovery, stronger exports and foreign invest-ment inflows. Plus, the use of reserves in the short-term could lower buffers as external financing pressures start to augment.
Adjustments to the current stance should therefore be informed by several factors. This includes close coordination with fiscal policy, which is likely to play an important role in supporting the recovery in domestic demand. This in turn should support a recovery on the supply side, which will require monetary policy support. Therefore, continued monitoring of leading indicators on the labor market, capacity utilization, credit impulse, and other indicators will help assess monetary policy tradeoffs in terms of managing external vulnerabilities versus supporting the real sector. Banking sector credit could also play a more prom-inent role in supporting the real sector. The lack of a credit impulse, despite monetary easing, is surprising given the healthy bank balance sheets and high levels of banking sector liquidity. To further support credit growth, policymakers could improve the effectiveness of borrower-support programs. Examples of such pro-grams include debt repayment relief, credit guarantees etc. For instance, to increase coverage among SMEs, the Ministry of Finance eased loan guarantee eligibility rules in April .202123 More generally, it is important to adjust programs to support borrowers and banks to re-flect their effectiveness, the scope for more targeted and time-bound measures, and the estimated impact on banks’ capital, earnings, and liquidity. These factors have been found to influence banks’ willingness to lend under the current environment (IMF Global Financial Stability Report, April 2021). More generally, it is im-portant to further analyze and address the policy causes of the weak credit impulse.
A medium-term fiscal strategy would allow the government to credibly signal its plans to return to the fiscal deficit ceiling and improve the fiscal space while supporting the recovery in the short-term. Indeed, premature fiscal consolidation risks deepening the economic crisis and paradoxically delay-ing the achievement of the deficit limit. Although fiscal multipliers for Indonesia are estimated to be small (see
23 The new MOF Regulation No 32/PMK.08/2021 allows businesses that employ a minimum of 100 staff, or as few as 50 employees in some sectors, to apply for a government guarantee for new working capital loans at com-mercial banks; whereas the previous scheme launched in July 2020 had a threshold of 300 staff. The relaxation also includes allowing guarantee for
Annex 2), fiscal policy has been instrumental to control the pandemic and help households and firms cope with the crisis. A continued robust response could further support the recovery and contribute to improving me-dium-term fiscal prospects. On the other hand, unclear medium-term fiscal plans could undermine investor confidence at a time of high financing needs. The me-dium-term fiscal strategy could be designed in three phases using specific economic indicators as be guided by trigger points to transition to the different phases: to guide shifts in fiscal policy.
(i) In the short term it is important to con-tinue providing relief to households, as dis-cussed below, and to viable firms. Simi-larly, it is essential that fiscal policy contin-ues to support the recovery in private de-mand by building confidence in the vac-cination program and pandemic control as discussed previously.
(ii) The budget could start cutting back on public transfers where needs are lower or inefficiencies are high as key economic in-dicators firmly improve such as private consumption and investment, employ-ment, capacity utilization, credit expansion etc.
(iii) Fiscal policy could subsequently start re-balancing efforts towards capital expendi-ture and longer-term tax reforms. Addi-tional trigger points could be used to coor-dinate fiscal and monetary policy including price pressures, exchange rate stability, for-eign exchange reserves, private sector credit, and external imbalances.
In the short-term, it is critical to maintain adequate social assistance until the green shoots of recovery are stronger. It is recommended that the government uses the flexibility built in the Budget to maintain pro-grams that are important for the poor and vulnerable households. As discussed above this has the potential to mitigate the poverty impact of a slower and une-ven recovery this year. Moreover, given pre-crisis gaps in coverage, maintaining the momentum of some of the temporary SA expansion during the crisis would help ensure a minimum assistance to all poor and vulnerable, including families without children and the elderly.24 In addition, the social response could also
loans of up to three years versus the earlier scheme of up to one-year ma-turity and halving the minimum loan size to IDR5 billion. 24 Even before the crisis two areas were considered critical for ensuring a more modern, comprehensive and responsive social protection system: im-proving inclusion and improving the system’s dynamism/responsiveness.
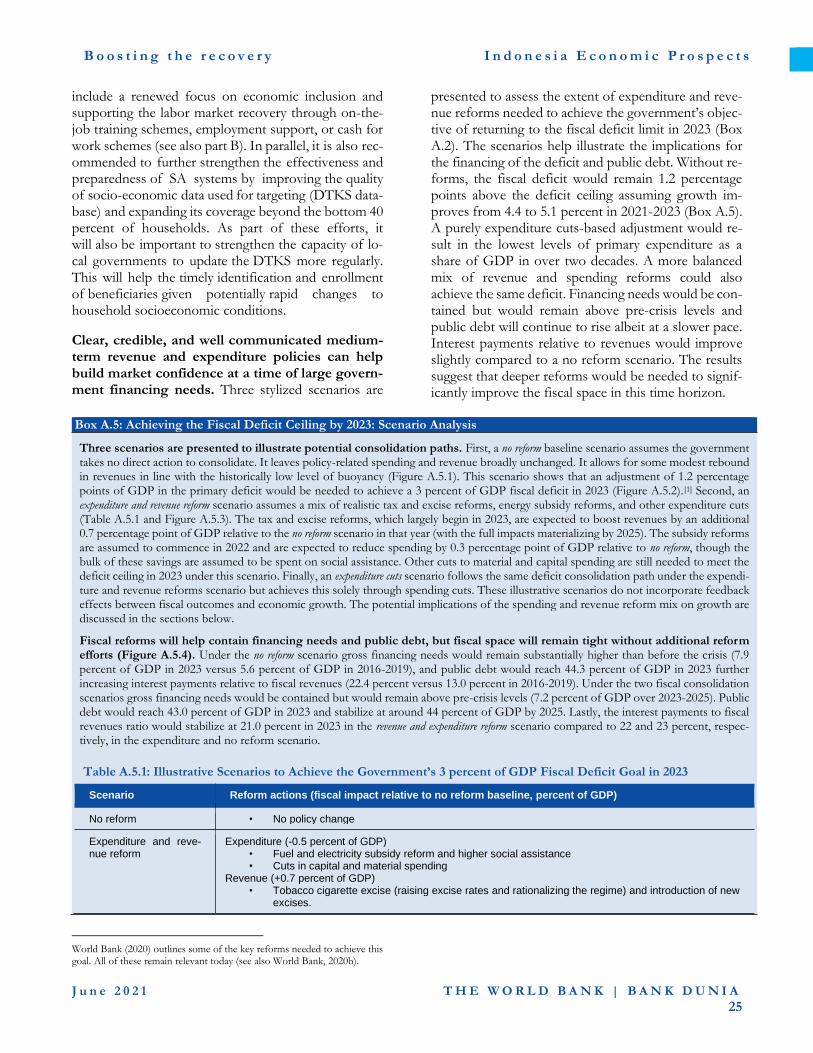
B o o s t i n g t h e r e c o v e r y I n d o n e s i a E c o n o m i c P r o s p e c t s
J u n e 2 0 2 1 T H E W O R L D B A N K | B A N K D U N I A
25
include a renewed focus on economic inclusion and supporting the labor market recovery through on-the-job training schemes, employment support, or cash for work schemes (see also part B). In parallel, it is also rec-ommended to further strengthen the effectiveness and preparedness of SA systems by improving the quality of socio-economic data used for targeting (DTKS data-base) and expanding its coverage beyond the bottom 40 percent of households. As part of these efforts, it will also be important to strengthen the capacity of lo-cal governments to update the DTKS more regularly. This will help the timely identification and enrollment of beneficiaries given potentially rapid changes to household socioeconomic conditions.
Clear, credible, and well communicated medium-term revenue and expenditure policies can help build market confidence at a time of large govern-ment financing needs. Three stylized scenarios are
presented to assess the extent of expenditure and reve-nue reforms needed to achieve the government’s objec-tive of returning to the fiscal deficit limit in 2023 (Box A.2). The scenarios help illustrate the implications for the financing of the deficit and public debt. Without re-forms, the fiscal deficit would remain 1.2 percentage points above the deficit ceiling assuming growth im-proves from 4.4 to 5.1 percent in 2021-2023 (Box A.5). A purely expenditure cuts-based adjustment would re-sult in the lowest levels of primary expenditure as a share of GDP in over two decades. A more balanced mix of revenue and spending reforms could also achieve the same deficit. Financing needs would be con-tained but would remain above pre-crisis levels and public debt will continue to rise albeit at a slower pace. Interest payments relative to revenues would improve slightly compared to a no reform scenario. The results suggest that deeper reforms would be needed to signif-icantly improve the fiscal space in this time horizon.
Box A.5: Achieving the Fiscal Deficit Ceiling by 2023: Scenario Analysis
Three scenarios are presented to illustrate potential consolidation paths. First, a no reform baseline scenario assumes the government takes no direct action to consolidate. It leaves policy-related spending and revenue broadly unchanged. It allows for some modest rebound in revenues in line with the historically low level of buoyancy (Figure A.5.1). This scenario shows that an adjustment of 1.2 percentage points of GDP in the primary deficit would be needed to achieve a 3 percent of GDP fiscal deficit in 2023 (Figure A.5.2).[1] Second, an expenditure and revenue reform scenario assumes a mix of realistic tax and excise reforms, energy subsidy reforms, and other expenditure cuts (Table A.5.1 and Figure A.5.3). The tax and excise reforms, which largely begin in 2023, are expected to boost revenues by an additional 0.7 percentage point of GDP relative to the no reform scenario in that year (with the full impacts materializing by 2025). The subsidy reforms are assumed to commence in 2022 and are expected to reduce spending by 0.3 percentage point of GDP relative to no reform, though the bulk of these savings are assumed to be spent on social assistance. Other cuts to material and capital spending are still needed to meet the deficit ceiling in 2023 under this scenario. Finally, an expenditure cuts scenario follows the same deficit consolidation path under the expendi-ture and revenue reforms scenario but achieves this solely through spending cuts. These illustrative scenarios do not incorporate feedback effects between fiscal outcomes and economic growth. The potential implications of the spending and revenue reform mix on growth are discussed in the sections below.
Fiscal reforms will help contain financing needs and public debt, but fiscal space will remain tight without additional reform efforts (Figure A.5.4). Under the no reform scenario gross financing needs would remain substantially higher than before the crisis (7.9 percent of GDP in 2023 versus 5.6 percent of GDP in 2016-2019), and public debt would reach 44.3 percent of GDP in 2023 further increasing interest payments relative to fiscal revenues (22.4 percent versus 13.0 percent in 2016-2019). Under the two fiscal consolidation scenarios gross financing needs would be contained but would remain above pre-crisis levels (7.2 percent of GDP over 2023-2025). Public debt would reach 43.0 percent of GDP in 2023 and stabilize at around 44 percent of GDP by 2025. Lastly, the interest payments to fiscal revenues ratio would stabilize at 21.0 percent in 2023 in the revenue and expenditure reform scenario compared to 22 and 23 percent, respec-tively, in the expenditure and no reform scenario.
Table A.5.1: Illustrative Scenarios to Achieve the Government’s 3 percent of GDP Fiscal Deficit Goal in 2023
Scenario Reform actions (fiscal impact relative to no reform baseline, percent of GDP)
No reform • No policy change
Expenditure and reve-nue reform
Expenditure (-0.5 percent of GDP) • Fuel and electricity subsidy reform and higher social assistance • Cuts in capital and material spending
Revenue (+0.7 percent of GDP) • Tobacco cigarette excise (raising excise rates and rationalizing the regime) and introduction of new
excises.
World Bank (2020) outlines some of the key reforms needed to achieve this goal. All of these remain relevant today (see also World Bank, 2020b).
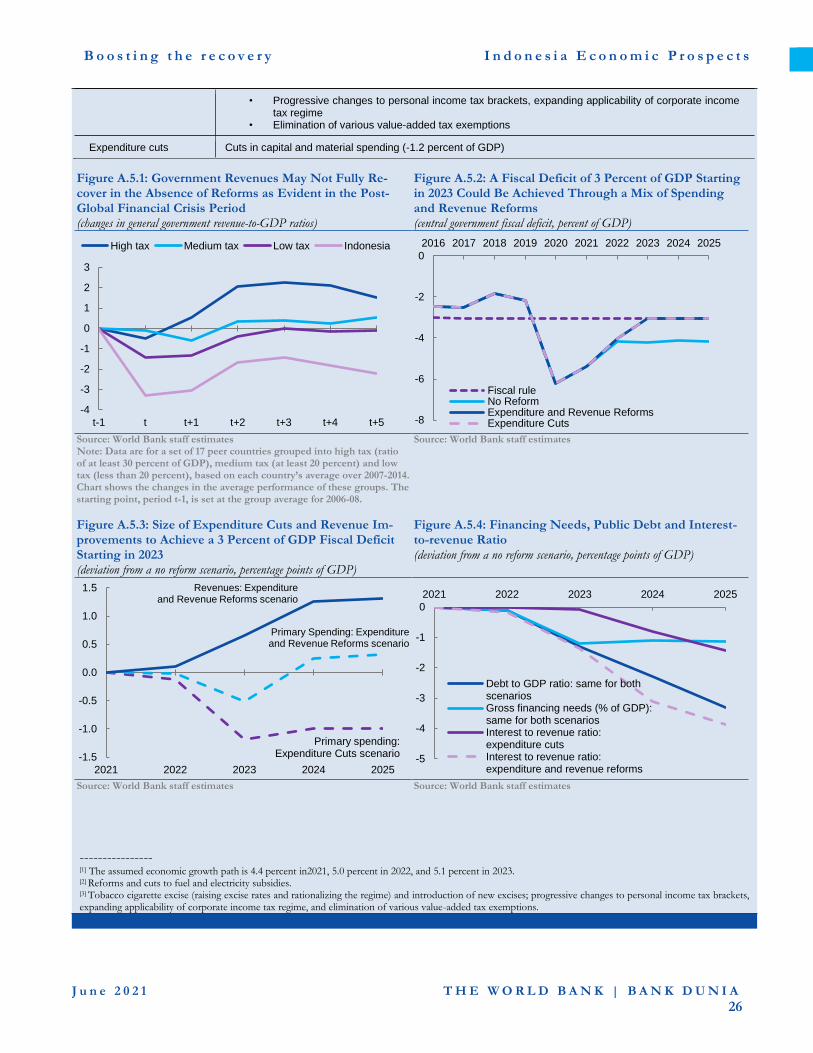
B o o s t i n g t h e r e c o v e r y I n d o n e s i a E c o n o m i c P r o s p e c t s
J u n e 2 0 2 1 T H E W O R L D B A N K | B A N K D U N I A
26
• Progressive changes to personal income tax brackets, expanding applicability of corporate income tax regime
• Elimination of various value-added tax exemptions
Expenditure cuts Cuts in capital and material spending (-1.2 percent of GDP)
Figure A.5.1: Government Revenues May Not Fully Re-cover in the Absence of Reforms as Evident in the Post-Global Financial Crisis Period (changes in general government revenue-to-GDP ratios)
Figure A.5.2: A Fiscal Deficit of 3 Percent of GDP Starting in 2023 Could Be Achieved Through a Mix of Spending and Revenue Reforms (central government fiscal deficit, percent of GDP)
Source: World Bank staff estimates Note: Data are for a set of 17 peer countries grouped into high tax (ratio of at least 30 percent of GDP), medium tax (at least 20 percent) and low tax (less than 20 percent), based on each country’s average over 2007-2014. Chart shows the changes in the average performance of these groups. The starting point, period t-1, is set at the group average for 2006-08.
Source: World Bank staff estimates
Figure A.5.3: Size of Expenditure Cuts and Revenue Im-provements to Achieve a 3 Percent of GDP Fiscal Deficit Starting in 2023 (deviation from a no reform scenario, percentage points of GDP)
Figure A.5.4: Financing Needs, Public Debt and Interest-to-revenue Ratio
(deviation from a no reform scenario, percentage points of GDP)
Source: World Bank staff estimates Source: World Bank staff estimates
---------------- [1] The assumed economic growth path is 4.4 percent in2021, 5.0 percent in 2022, and 5.1 percent in 2023. [2] Reforms and cuts to fuel and electricity subsidies. [3] Tobacco cigarette excise (raising excise rates and rationalizing the regime) and introduction of new excises; progressive changes to personal income tax brackets, expanding applicability of corporate income tax regime, and elimination of various value-added tax exemptions.
-4
-3
-2
-1
0
1
2
3
t-1 t t+1 t+2 t+3 t+4 t+5
High tax Medium tax Low tax Indonesia
-8
-6
-4
-2
0
2016 2017 2018 2019 2020 2021 2022 2023 2024 2025
Fiscal ruleNo ReformExpenditure and Revenue ReformsExpenditure Cuts
-1.5
-1.0
-0.5
0.0
0.5
1.0
1.5
2021 2022 2023 2024 2025
Revenues: Expenditure and Revenue Reforms scenario
Primary spending: Expenditure Cuts scenario
Primary Spending: Expenditure and Revenue Reforms scenario
-5
-4
-3
-2
-1
0
2021 2022 2023 2024 2025
Debt to GDP ratio: same for bothscenariosGross financing needs (% of GDP):same for both scenariosInterest to revenue ratio:expenditure cutsInterest to revenue ratio:expenditure and revenue reforms
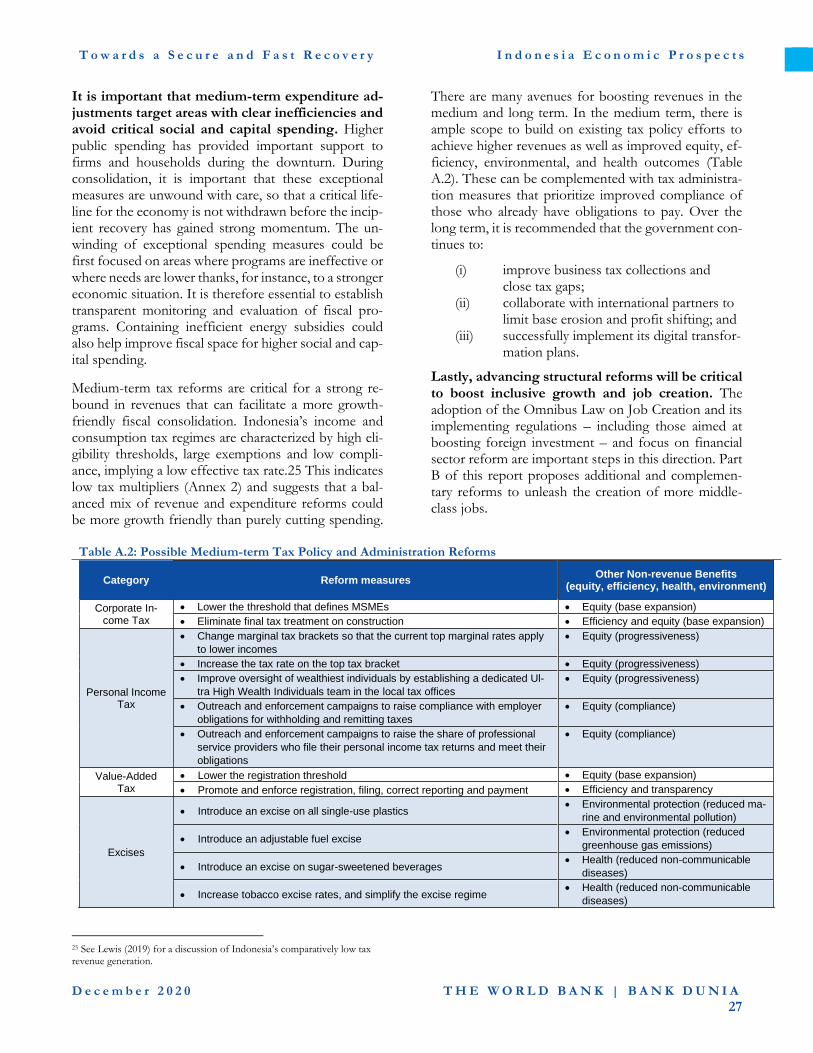
T o w a r d s a S e c u r e a n d F a s t R e c o v e r y I n d o n e s i a E c o n o m i c P r o s p e c t s
D e c e m b e r 2 0 2 0 T H E W O R L D B A N K | B A N K D U N I A
27
It is important that medium-term expenditure ad-justments target areas with clear inefficiencies and avoid critical social and capital spending. Higher public spending has provided important support to firms and households during the downturn. During consolidation, it is important that these exceptional measures are unwound with care, so that a critical life-line for the economy is not withdrawn before the incip-ient recovery has gained strong momentum. The un-winding of exceptional spending measures could be first focused on areas where programs are ineffective or where needs are lower thanks, for instance, to a stronger economic situation. It is therefore essential to establish transparent monitoring and evaluation of fiscal pro-grams. Containing inefficient energy subsidies could also help improve fiscal space for higher social and cap-ital spending.
Medium-term tax reforms are critical for a strong re-bound in revenues that can facilitate a more growth-friendly fiscal consolidation. Indonesia’s income and consumption tax regimes are characterized by high eli-gibility thresholds, large exemptions and low compli-ance, implying a low effective tax rate.25 This indicates low tax multipliers (Annex 2) and suggests that a bal-anced mix of revenue and expenditure reforms could be more growth friendly than purely cutting spending.
There are many avenues for boosting revenues in the medium and long term. In the medium term, there is ample scope to build on existing tax policy efforts to achieve higher revenues as well as improved equity, ef-ficiency, environmental, and health outcomes (Table A.2). These can be complemented with tax administra-tion measures that prioritize improved compliance of those who already have obligations to pay. Over the long term, it is recommended that the government con-tinues to:
(i) improve business tax collections and close tax gaps;
(ii) collaborate with international partners to limit base erosion and profit shifting; and
(iii) successfully implement its digital transfor-mation plans.
Lastly, advancing structural reforms will be critical to boost inclusive growth and job creation. The adoption of the Omnibus Law on Job Creation and its implementing regulations – including those aimed at boosting foreign investment – and focus on financial sector reform are important steps in this direction. Part B of this report proposes additional and complemen-tary reforms to unleash the creation of more middle-class jobs.
Table A.2: Possible Medium-term Tax Policy and Administration Reforms
Category Reform measures Other Non-revenue Benefits
(equity, efficiency, health, environment)
Corporate In-come Tax
• Lower the threshold that defines MSMEs • Equity (base expansion)
• Eliminate final tax treatment on construction • Efficiency and equity (base expansion)
Personal Income Tax
• Change marginal tax brackets so that the current top marginal rates apply
to lower incomes
• Equity (progressiveness)
• Increase the tax rate on the top tax bracket • Equity (progressiveness)
• Improve oversight of wealthiest individuals by establishing a dedicated Ul-
tra High Wealth Individuals team in the local tax offices
• Equity (progressiveness)
• Outreach and enforcement campaigns to raise compliance with employer
obligations for withholding and remitting taxes
• Equity (compliance)
• Outreach and enforcement campaigns to raise the share of professional
service providers who file their personal income tax returns and meet their
obligations
• Equity (compliance)
Value-Added Tax
• Lower the registration threshold • Equity (base expansion)
• Promote and enforce registration, filing, correct reporting and payment • Efficiency and transparency
Excises
• Introduce an excise on all single-use plastics • Environmental protection (reduced ma-
rine and environmental pollution)
• Introduce an adjustable fuel excise • Environmental protection (reduced
greenhouse gas emissions)
• Introduce an excise on sugar-sweetened beverages • Health (reduced non-communicable
diseases)
• Increase tobacco excise rates, and simplify the excise regime • Health (reduced non-communicable
diseases)
25 See Lewis (2019) for a discussion of Indonesia’s comparatively low tax revenue generation.
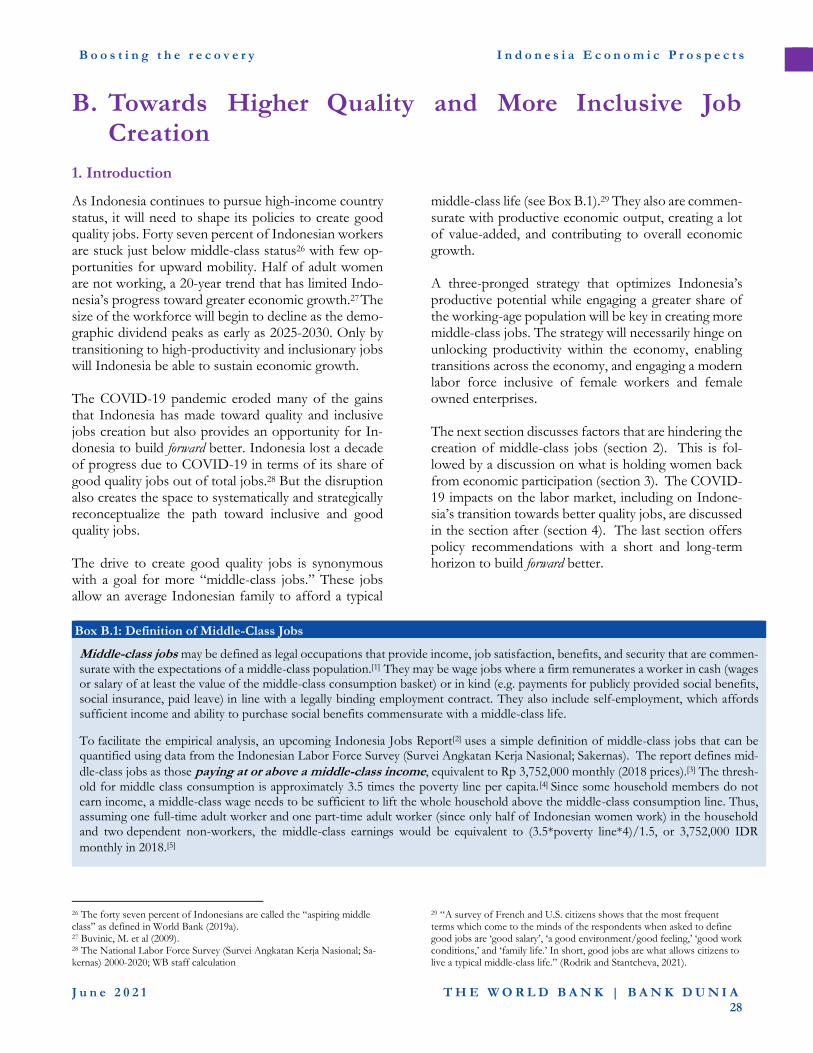
B o o s t i n g t h e r e c o v e r y I n d o n e s i a E c o n o m i c P r o s p e c t s
J u n e 2 0 2 1 T H E W O R L D B A N K | B A N K D U N I A
28
B. Towards Higher Quality and More Inclusive Job Creation
1. Introduction
As Indonesia continues to pursue high-income country status, it will need to shape its policies to create good quality jobs. Forty seven percent of Indonesian workers are stuck just below middle-class status26 with few op-portunities for upward mobility. Half of adult women are not working, a 20-year trend that has limited Indo-nesia’s progress toward greater economic growth.27 The size of the workforce will begin to decline as the demo-graphic dividend peaks as early as 2025-2030. Only by transitioning to high-productivity and inclusionary jobs will Indonesia be able to sustain economic growth. The COVID-19 pandemic eroded many of the gains that Indonesia has made toward quality and inclusive jobs creation but also provides an opportunity for In-donesia to build forward better. Indonesia lost a decade of progress due to COVID-19 in terms of its share of good quality jobs out of total jobs.28 But the disruption also creates the space to systematically and strategically reconceptualize the path toward inclusive and good quality jobs. The drive to create good quality jobs is synonymous with a goal for more “middle-class jobs.” These jobs allow an average Indonesian family to afford a typical
middle-class life (see Box B.1).29 They also are commen-surate with productive economic output, creating a lot of value-added, and contributing to overall economic growth. A three-pronged strategy that optimizes Indonesia’s productive potential while engaging a greater share of the working-age population will be key in creating more middle-class jobs. The strategy will necessarily hinge on unlocking productivity within the economy, enabling transitions across the economy, and engaging a modern labor force inclusive of female workers and female owned enterprises. The next section discusses factors that are hindering the creation of middle-class jobs (section 2). This is fol-lowed by a discussion on what is holding women back from economic participation (section 3). The COVID-19 impacts on the labor market, including on Indone-sia’s transition towards better quality jobs, are discussed in the section after (section 4). The last section offers policy recommendations with a short and long-term horizon to build forward better.
Box B.1: Definition of Middle-Class Jobs
Middle-class jobs may be defined as legal occupations that provide income, job satisfaction, benefits, and security that are commen-surate with the expectations of a middle-class population.[1] They may be wage jobs where a firm remunerates a worker in cash (wages or salary of at least the value of the middle-class consumption basket) or in kind (e.g. payments for publicly provided social benefits, social insurance, paid leave) in line with a legally binding employment contract. They also include self-employment, which affords sufficient income and ability to purchase social benefits commensurate with a middle-class life.
To facilitate the empirical analysis, an upcoming Indonesia Jobs Report[2] uses a simple definition of middle-class jobs that can be quantified using data from the Indonesian Labor Force Survey (Survei Angkatan Kerja Nasional; Sakernas). The report defines mid-
dle-class jobs as those paying at or above a middle-class income, equivalent to Rp 3,752,000 monthly (2018 prices).[3] The thresh-old for middle class consumption is approximately 3.5 times the poverty line per capita.[4] Since some household members do not earn income, a middle-class wage needs to be sufficient to lift the whole household above the middle-class consumption line. Thus, assuming one full-time adult worker and one part-time adult worker (since only half of Indonesian women work) in the household and two dependent non-workers, the middle-class earnings would be equivalent to (3.5*poverty line*4)/1.5, or 3,752,000 IDR
monthly in 2018.[5]
26 The forty seven percent of Indonesians are called the “aspiring middle class” as defined in World Bank (2019a). 27 Buvinic, M. et al (2009). 28 The National Labor Force Survey (Survei Angkatan Kerja Nasional; Sa-kernas) 2000-2020; WB staff calculation
29 “A survey of French and U.S. citizens shows that the most frequent terms which come to the minds of the respondents when asked to define good jobs are ‘good salary’, ‘a good environment/good feeling,’ ‘good work conditions,’ and ‘family life.’ In short, good jobs are what allows citizens to live a typical middle-class life.” (Rodrik and Stantcheva, 2021).
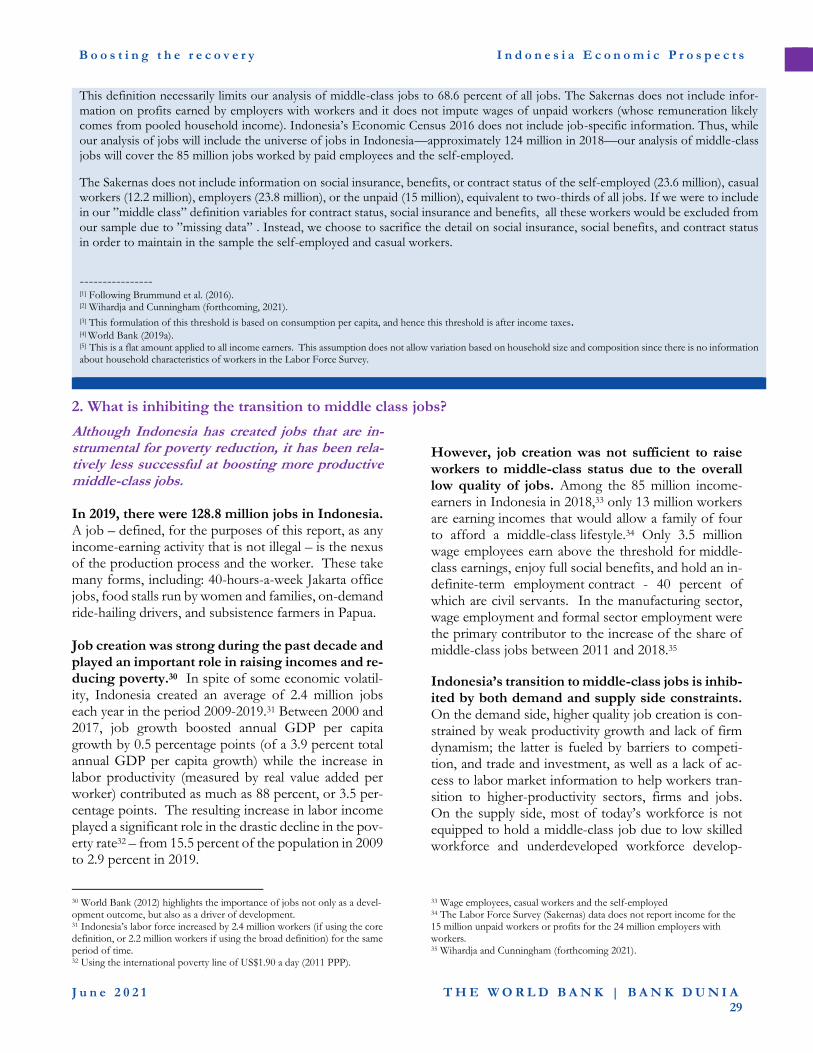
B o o s t i n g t h e r e c o v e r y I n d o n e s i a E c o n o m i c P r o s p e c t s
J u n e 2 0 2 1 T H E W O R L D B A N K | B A N K D U N I A
29
This definition necessarily limits our analysis of middle-class jobs to 68.6 percent of all jobs. The Sakernas does not include infor-mation on profits earned by employers with workers and it does not impute wages of unpaid workers (whose remuneration likely comes from pooled household income). Indonesia’s Economic Census 2016 does not include job-specific information. Thus, while our analysis of jobs will include the universe of jobs in Indonesia—approximately 124 million in 2018—our analysis of middle-class jobs will cover the 85 million jobs worked by paid employees and the self-employed.
The Sakernas does not include information on social insurance, benefits, or contract status of the self-employed (23.6 million), casual workers (12.2 million), employers (23.8 million), or the unpaid (15 million), equivalent to two-thirds of all jobs. If we were to include in our ”middle class” definition variables for contract status, social insurance and benefits, all these workers would be excluded from our sample due to ”missing data” . Instead, we choose to sacrifice the detail on social insurance, social benefits, and contract status in order to maintain in the sample the self-employed and casual workers.
---------------- [1] Following Brummund et al. (2016). [2] Wihardja and Cunningham (forthcoming, 2021).
[3] This formulation of this threshold is based on consumption per capita, and hence this threshold is after income taxes. [4] World Bank (2019a). [5] This is a flat amount applied to all income earners. This assumption does not allow variation based on household size and composition since there is no information about household characteristics of workers in the Labor Force Survey.
2. What is inhibiting the transition to middle class jobs?
Although Indonesia has created jobs that are in-strumental for poverty reduction, it has been rela-tively less successful at boosting more productive middle-class jobs. In 2019, there were 128.8 million jobs in Indonesia. A job – defined, for the purposes of this report, as any income-earning activity that is not illegal – is the nexus of the production process and the worker. These take many forms, including: 40-hours-a-week Jakarta office jobs, food stalls run by women and families, on-demand ride-hailing drivers, and subsistence farmers in Papua. Job creation was strong during the past decade and played an important role in raising incomes and re-ducing poverty.30 In spite of some economic volatil-ity, Indonesia created an average of 2.4 million jobs each year in the period 2009-2019.31 Between 2000 and 2017, job growth boosted annual GDP per capita growth by 0.5 percentage points (of a 3.9 percent total annual GDP per capita growth) while the increase in labor productivity (measured by real value added per worker) contributed as much as 88 percent, or 3.5 per-centage points. The resulting increase in labor income played a significant role in the drastic decline in the pov-erty rate32 – from 15.5 percent of the population in 2009 to 2.9 percent in 2019.
30 World Bank (2012) highlights the importance of jobs not only as a devel-opment outcome, but also as a driver of development. 31 Indonesia’s labor force increased by 2.4 million workers (if using the core definition, or 2.2 million workers if using the broad definition) for the same period of time. 32 Using the international poverty line of US$1.90 a day (2011 PPP).
However, job creation was not sufficient to raise workers to middle-class status due to the overall low quality of jobs. Among the 85 million income-earners in Indonesia in 2018,33 only 13 million workers are earning incomes that would allow a family of four to afford a middle-class lifestyle.34 Only 3.5 million wage employees earn above the threshold for middle-class earnings, enjoy full social benefits, and hold an in-definite-term employment contract - 40 percent of which are civil servants. In the manufacturing sector, wage employment and formal sector employment were the primary contributor to the increase of the share of middle-class jobs between 2011 and 2018.35
Indonesia’s transition to middle-class jobs is inhib-ited by both demand and supply side constraints. On the demand side, higher quality job creation is con-strained by weak productivity growth and lack of firm dynamism; the latter is fueled by barriers to competi-tion, and trade and investment, as well as a lack of ac-cess to labor market information to help workers tran-sition to higher-productivity sectors, firms and jobs. On the supply side, most of today’s workforce is not equipped to hold a middle-class job due to low skilled workforce and underdeveloped workforce develop-
33 Wage employees, casual workers and the self-employed 34 The Labor Force Survey (Sakernas) data does not report income for the 15 million unpaid workers or profits for the 24 million employers with workers. 35 Wihardja and Cunningham (forthcoming 2021).
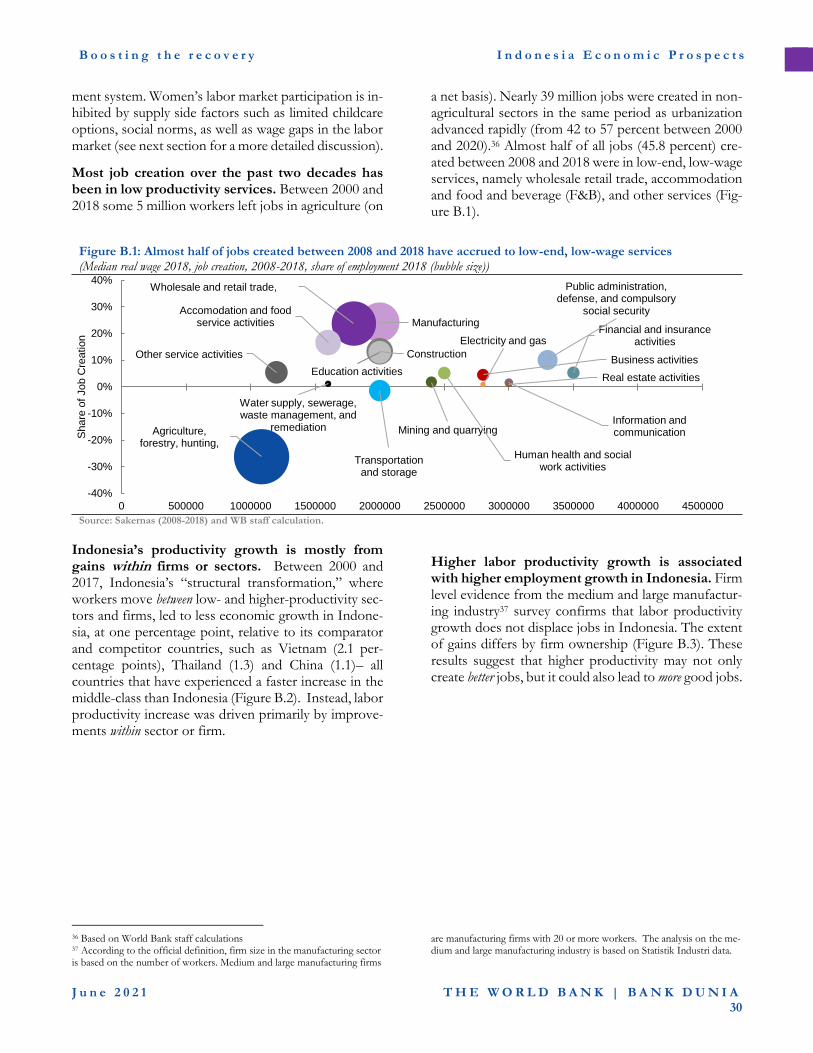
B o o s t i n g t h e r e c o v e r y I n d o n e s i a E c o n o m i c P r o s p e c t s
J u n e 2 0 2 1 T H E W O R L D B A N K | B A N K D U N I A
30
ment system. Women’s labor market participation is in-hibited by supply side factors such as limited childcare options, social norms, as well as wage gaps in the labor market (see next section for a more detailed discussion).
Most job creation over the past two decades has been in low productivity services. Between 2000 and 2018 some 5 million workers left jobs in agriculture (on
a net basis). Nearly 39 million jobs were created in non-agricultural sectors in the same period as urbanization advanced rapidly (from 42 to 57 percent between 2000 and 2020).36 Almost half of all jobs (45.8 percent) cre-ated between 2008 and 2018 were in low-end, low-wage services, namely wholesale retail trade, accommodation and food and beverage (F&B), and other services (Fig-ure B.1).
Figure B.1: Almost half of jobs created between 2008 and 2018 have accrued to low-end, low-wage services (Median real wage 2018, job creation, 2008-2018, share of employment 2018 (bubble size))
Source: Sakernas (2008-2018) and WB staff calculation.
Indonesia’s productivity growth is mostly from gains within firms or sectors. Between 2000 and 2017, Indonesia’s “structural transformation,” where workers move between low- and higher-productivity sec-tors and firms, led to less economic growth in Indone-sia, at one percentage point, relative to its comparator and competitor countries, such as Vietnam (2.1 per-centage points), Thailand (1.3) and China (1.1)– all countries that have experienced a faster increase in the middle-class than Indonesia (Figure B.2). Instead, labor productivity increase was driven primarily by improve-ments within sector or firm.
Higher labor productivity growth is associated with higher employment growth in Indonesia. Firm level evidence from the medium and large manufactur-ing industry37 survey confirms that labor productivity growth does not displace jobs in Indonesia. The extent of gains differs by firm ownership (Figure B.3). These results suggest that higher productivity may not only create better jobs, but it could also lead to more good jobs.
36 Based on World Bank staff calculations 37 According to the official definition, firm size in the manufacturing sector is based on the number of workers. Medium and large manufacturing firms
are manufacturing firms with 20 or more workers. The analysis on the me-dium and large manufacturing industry is based on Statistik Industri data.
Agriculture, forestry, hunting,
Mining and quarrying
Manufacturing
Electricity and gas
Water supply, sewerage, waste management, and
remediation
Construction
Wholesale and retail trade,
Transportation and storage
Accomodation and food service activities
Information and communication
Financial and insurance activities
Real estate activities
Business activities
Public administration, defense, and compulsory
social security
Education activities
Human health and social work activities
Other service activities
-40%
-30%
-20%
-10%
0%
10%
20%
30%
40%
0 500000 1000000 1500000 2000000 2500000 3000000 3500000 4000000 4500000
Share
of
Job C
reation
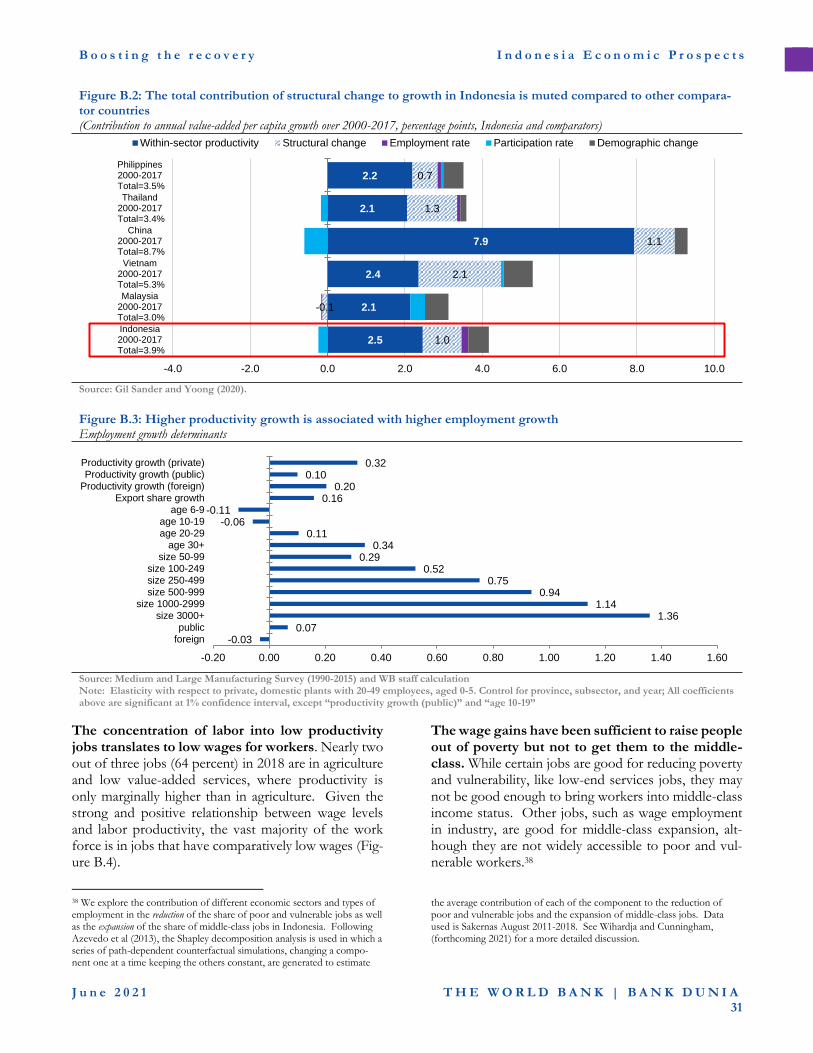
B o o s t i n g t h e r e c o v e r y I n d o n e s i a E c o n o m i c P r o s p e c t s
J u n e 2 0 2 1 T H E W O R L D B A N K | B A N K D U N I A
31
Figure B.2: The total contribution of structural change to growth in Indonesia is muted compared to other compara-tor countries (Contribution to annual value-added per capita growth over 2000-2017, percentage points, Indonesia and comparators)
Source: Gil Sander and Yoong (2020).
Figure B.3: Higher productivity growth is associated with higher employment growth Employment growth determinants
Source: Medium and Large Manufacturing Survey (1990-2015) and WB staff calculation Note: Elasticity with respect to private, domestic plants with 20-49 employees, aged 0-5. Control for province, subsector, and year; All coefficients above are significant at 1% confidence interval, except “productivity growth (public)” and “age 10-19”
The concentration of labor into low productivity jobs translates to low wages for workers. Nearly two out of three jobs (64 percent) in 2018 are in agriculture and low value-added services, where productivity is only marginally higher than in agriculture. Given the strong and positive relationship between wage levels and labor productivity, the vast majority of the work force is in jobs that have comparatively low wages (Fig-ure B.4).
38 We explore the contribution of different economic sectors and types of employment in the reduction of the share of poor and vulnerable jobs as well as the expansion of the share of middle-class jobs in Indonesia. Following Azevedo et al (2013), the Shapley decomposition analysis is used in which a series of path-dependent counterfactual simulations, changing a compo-nent one at a time keeping the others constant, are generated to estimate
The wage gains have been sufficient to raise people out of poverty but not to get them to the middle-class. While certain jobs are good for reducing poverty and vulnerability, like low-end services jobs, they may not be good enough to bring workers into middle-class income status. Other jobs, such as wage employment in industry, are good for middle-class expansion, alt-hough they are not widely accessible to poor and vul-nerable workers.38
the average contribution of each of the component to the reduction of poor and vulnerable jobs and the expansion of middle-class jobs. Data used is Sakernas August 2011-2018. See Wihardja and Cunningham, (forthcoming 2021) for a more detailed discussion.
2.5
2.1
2.4
7.9
2.1
2.2
1.0
-0.1
2.1
1.1
1.3
0.7
-4.0 -2.0 0.0 2.0 4.0 6.0 8.0 10.0
Indonesia2000-2017
Total=3.9%
Malaysia2000-2017
Total=3.0%
Vietnam2000-2017
Total=5.3%
China2000-2017
Total=8.7%
Thailand2000-2017
Total=3.4%
Philippines2000-2017
Total=3.5%
Within-sector productivity Structural change Employment rate Participation rate Demographic change
-0.030.07
1.361.14
0.940.75
0.520.29
0.340.11
-0.06-0.11
0.160.20
0.100.32
-0.20 0.00 0.20 0.40 0.60 0.80 1.00 1.20 1.40 1.60
foreignpublic
size 3000+size 1000-2999
size 500-999size 250-499size 100-249
size 50-99age 30+
age 20-29age 10-19
age 6-9Export share growth
Productivity growth (foreign)Productivity growth (public)
Productivity growth (private)
B o o s t i n g t h e r e c o v e r y I n d o n e s i a E c o n o m i c P r o s p e c t s
J u n e 2 0 2 1 T H E W O R L D B A N K | B A N K D U N I A
32
Figure B.4: More productive sectors tend to pay better wages, but employ a minority of workers (Log of sector productivity as a share of total productivity, real median monthly wage (IDR million), the sector’s share of total employment, in 2018)
Source: Source: Sakernas (August 2018) and World Bank staff calculations Note: Public sector is included in community, personal and other services. Size of the bubble denotes the sector’s share of total employment in 2018. Labor productivity is calculated as real output (value added) per worker. The national median monthly wage is IDR1.2 million.
Most jobs are informal and do not provide standard worker protection benefits, reflecting the high prevalence of micro household enterprises. Three quarters of Indonesia’s labor market can be classified as ‘informal’.39 Less than 10 percent of jobs are covered by a permanent contract and subject to full worker protec-tion benefits as defined in legislation (Figure B.5).40 In-donesia’s share of vulnerable workers (based on ILO’s definition of ‘vulnerable’ workers which are self-em-ployment and family workers) is 48.3 percent, above that of some regional peers - the Philippines (33.2 per-cent), Malaysia (32.9 percent) and Singapore (9.2 per-cent) - yet lower than Vietnam (52.3 percent) and on par with Thailand (47.7 percent) in 2018. High infor-mality partly reflects the fact that household enterprises (HHEs) are ubiquitous in Indonesia, employing 83 mil-lion workers. They host close to 90 percent of informal workers in both the agriculture and non-agriculture sec-tor (Table B.1): HHE owners (48.5 percent), employees
39 Using the revised definition of formality/informality based on the Inter-national Conference of Labor Statistician (ICLS)-17 that combines employ-ment type, workplace unit, contract status and social benefits, Indonesia’s formality rate in 2019 dropped from 44.3 if using the Statistics Indonesia’s simplified definition (51.5 if using the Statistics Indonesia’s official defini-tion) to 25.1 percent. 40 In 2019, 38.2 percent of all workers were firm owners, while 61.8 percent were employees. Among firm owners, more than half are self-employed (firm owners without any other worker). Among employees, almost two
and casual workers with no written contract (26 per-cent) and unpaid family workers (15.3 percent) work at these HHE.
Improving marginal productivity of household en-terprises and developing their ecosystem could strengthen their contribution to middle-class jobs. Nine percent of HHE owners are classified as middle-class. Middle-class household enterprise owners have a minimum of senior secondary school, have more work experience, use the internet, have financial accounts, and have their enterprises located in urban areas or in Java Island. Policy to support HHE is a critical strategy due to the large number of people working in these types of businesses.
thirds were working without any work contract (they are wage employee with no-written contract, casual workers and unpaid family workers) while another one fifth work under fixed-term (or temporary) contracts. Uncon-tracted jobs tend to be lower-paid, riskier and do not carry social benefits. However, even contracted wage employees face vulnerability due to low compliance under the current worker protection policies. In 2019, only 43.5 percent of wage employees with permanent contract receive the full worker protection benefits and receive wage above the minimum wage, or 10 percent of total wage employees.
agriculture mining and quarrying
manufacturing
utilities
constructionWholesale retail trade, hotels,
restaurants
transport and communications
financial servicescommunity, personal, and other services
0.0
0.5
1.0
1.5
2.0
2.5
-1.5 -1.0 -0.5 0.0 0.5 1.0 1.5 2.0 2.5
Real m
edia
n m
onth
ly w
age in
2018,
IDR
mill
ions
Log of sector productivity as a share of total productivity, 2018
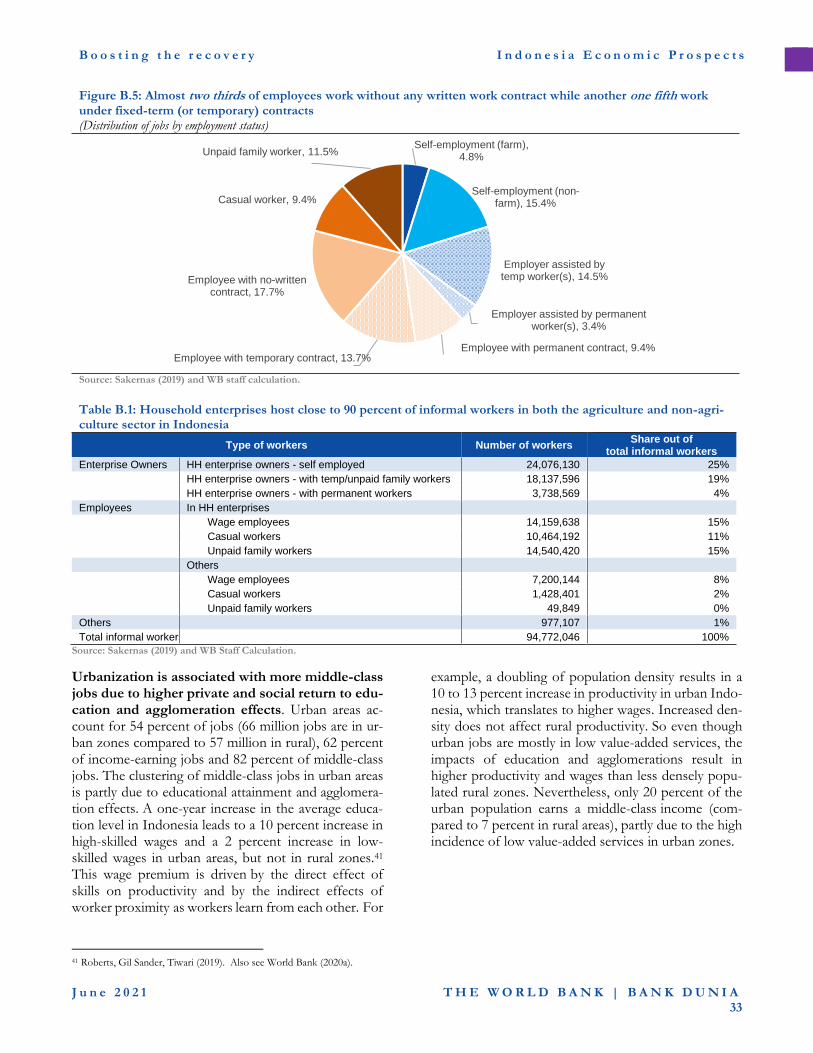
B o o s t i n g t h e r e c o v e r y I n d o n e s i a E c o n o m i c P r o s p e c t s
J u n e 2 0 2 1 T H E W O R L D B A N K | B A N K D U N I A
33
Figure B.5: Almost two thirds of employees work without any written work contract while another one fifth work under fixed-term (or temporary) contracts (Distribution of jobs by employment status)
Source: Sakernas (2019) and WB staff calculation.
Table B.1: Household enterprises host close to 90 percent of informal workers in both the agriculture and non-agri-culture sector in Indonesia
Type of workers Number of workers Share out of
total informal workers
Enterprise Owners HH enterprise owners - self employed 24,076,130 25% HH enterprise owners - with temp/unpaid family workers 18,137,596 19% HH enterprise owners - with permanent workers 3,738,569 4%
Employees In HH enterprises
Wage employees 14,159,638 15% Casual workers 10,464,192 11% Unpaid family workers 14,540,420 15% Others
Wage employees 7,200,144 8% Casual workers 1,428,401 2% Unpaid family workers 49,849 0%
Others 977,107 1%
Total informal workers 94,772,046 100%
Source: Sakernas (2019) and WB Staff Calculation.
Urbanization is associated with more middle-class jobs due to higher private and social return to edu-cation and agglomeration effects. Urban areas ac-count for 54 percent of jobs (66 million jobs are in ur-ban zones compared to 57 million in rural), 62 percent of income-earning jobs and 82 percent of middle-class jobs. The clustering of middle-class jobs in urban areas is partly due to educational attainment and agglomera-tion effects. A one-year increase in the average educa-tion level in Indonesia leads to a 10 percent increase in high-skilled wages and a 2 percent increase in low-skilled wages in urban areas, but not in rural zones.41 This wage premium is driven by the direct effect of skills on productivity and by the indirect effects of worker proximity as workers learn from each other. For
example, a doubling of population density results in a 10 to 13 percent increase in productivity in urban Indo-nesia, which translates to higher wages. Increased den-sity does not affect rural productivity. So even though urban jobs are mostly in low value-added services, the impacts of education and agglomerations result in higher productivity and wages than less densely popu-lated rural zones. Nevertheless, only 20 percent of the urban population earns a middle-class income (com-pared to 7 percent in rural areas), partly due to the high incidence of low value-added services in urban zones.
41 Roberts, Gil Sander, Tiwari (2019). Also see World Bank (2020a).
Self-employment (farm), 4.8%
Self-employment (non-farm), 15.4%
Employer assisted by temp worker(s), 14.5%
Employer assisted by permanent worker(s), 3.4%
Employee with permanent contract, 9.4%Employee with temporary contract, 13.7%
Employee with no-written contract, 17.7%
Casual worker, 9.4%
Unpaid family worker, 11.5%
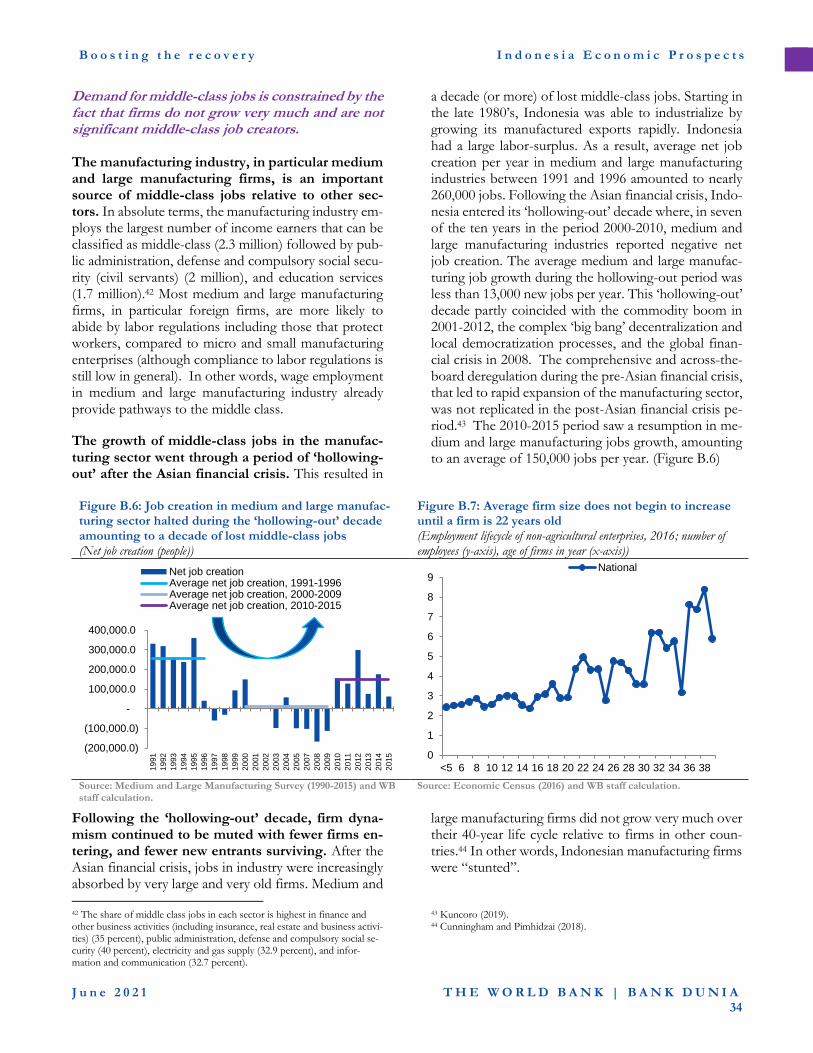
B o o s t i n g t h e r e c o v e r y I n d o n e s i a E c o n o m i c P r o s p e c t s
J u n e 2 0 2 1 T H E W O R L D B A N K | B A N K D U N I A
34
Demand for middle-class jobs is constrained by the fact that firms do not grow very much and are not significant middle-class job creators. The manufacturing industry, in particular medium and large manufacturing firms, is an important source of middle-class jobs relative to other sec-tors. In absolute terms, the manufacturing industry em-ploys the largest number of income earners that can be classified as middle-class (2.3 million) followed by pub-lic administration, defense and compulsory social secu-rity (civil servants) (2 million), and education services (1.7 million).42 Most medium and large manufacturing firms, in particular foreign firms, are more likely to abide by labor regulations including those that protect workers, compared to micro and small manufacturing enterprises (although compliance to labor regulations is still low in general). In other words, wage employment in medium and large manufacturing industry already provide pathways to the middle class.
The growth of middle-class jobs in the manufac-turing sector went through a period of ‘hollowing-out’ after the Asian financial crisis. This resulted in
a decade (or more) of lost middle-class jobs. Starting in the late 1980’s, Indonesia was able to industrialize by growing its manufactured exports rapidly. Indonesia had a large labor-surplus. As a result, average net job creation per year in medium and large manufacturing industries between 1991 and 1996 amounted to nearly 260,000 jobs. Following the Asian financial crisis, Indo-nesia entered its ‘hollowing-out’ decade where, in seven of the ten years in the period 2000-2010, medium and large manufacturing industries reported negative net job creation. The average medium and large manufac-turing job growth during the hollowing-out period was less than 13,000 new jobs per year. This ‘hollowing-out’ decade partly coincided with the commodity boom in 2001-2012, the complex ‘big bang’ decentralization and local democratization processes, and the global finan-cial crisis in 2008. The comprehensive and across-the-board deregulation during the pre-Asian financial crisis, that led to rapid expansion of the manufacturing sector, was not replicated in the post-Asian financial crisis pe-riod.43 The 2010-2015 period saw a resumption in me-dium and large manufacturing jobs growth, amounting to an average of 150,000 jobs per year. (Figure B.6)
Figure B.6: Job creation in medium and large manufac-turing sector halted during the ‘hollowing-out’ decade amounting to a decade of lost middle-class jobs (Net job creation (people))
Figure B.7: Average firm size does not begin to increase until a firm is 22 years old (Employment lifecycle of non-agricultural enterprises, 2016; number of employees (y-axis), age of firms in year (x-axis))
Source: Medium and Large Manufacturing Survey (1990-2015) and WB staff calculation.
Source: Economic Census (2016) and WB staff calculation.
Following the ‘hollowing-out’ decade, firm dyna-mism continued to be muted with fewer firms en-tering, and fewer new entrants surviving. After the Asian financial crisis, jobs in industry were increasingly absorbed by very large and very old firms. Medium and
42 The share of middle class jobs in each sector is highest in finance and other business activities (including insurance, real estate and business activi-ties) (35 percent), public administration, defense and compulsory social se-curity (40 percent), electricity and gas supply (32.9 percent), and infor-mation and communication (32.7 percent).
large manufacturing firms did not grow very much over their 40-year life cycle relative to firms in other coun-tries.44 In other words, Indonesian manufacturing firms were “stunted”.
43 Kuncoro (2019). 44 Cunningham and Pimhidzai (2018).
(200,000.0)
(100,000.0)
-
100,000.0
200,000.0
300,000.0
400,000.0
19
91
19
92
19
93
19
94
19
95
19
96
19
97
19
98
19
99
20
00
20
01
20
02
20
03
20
04
20
05
20
07
20
08
20
09
20
10
20
11
20
12
20
13
20
14
20
15
Net job creationAverage net job creation, 1991-1996Average net job creation, 2000-2009Average net job creation, 2010-2015
0
1
2
3
4
5
6
7
8
9
<5 6 8 10 12 14 16 18 20 22 24 26 28 30 32 34 36 38
National
B o o s t i n g t h e r e c o v e r y I n d o n e s i a E c o n o m i c P r o s p e c t s
J u n e 2 0 2 1 T H E W O R L D B A N K | B A N K D U N I A
35
Although foreign-owned firms tend to be a source of good jobs, especially for women, Indonesia’s legislation had been constraining their entry. In In-donesia as in many other countries, medium and large manufacturing plants that are foreign owned tend to generate more jobs and pay higher wages on average. However, until recently, with the implementation of the Omnibus Law on Job Creation (Law N0.11/2020), In-donesia had some of the tightest restrictions in terms of foreign direct investment (FDI), including strict rules on minimum local content and limits on foreign own-ership. Costly access to intermediate inputs and high barriers to access foreign skills in shortage also under-mined Indonesia’s attractiveness to foreign investors. More generally, firm structure, growth and dyna-mism has been too weak to create more jobs, in-cluding middle-class jobs. Most enterprises in Indo-nesia are very small and do not grow very much, and hence are not significant job creators, let alone middle-class job creators. In 2016, an average non-agricultural enterprise in Indonesia had less than three employees by the fifth year of establishment and needed another 15 years to grow to an enterprise of five employees (Fig-ure B.7). In fact, nearly all (99 percent) enterprises in Indonesia in 2014 were micro-enterprises45, 46, defined as having fewer than 5 employees. While the number of micro enterprises is growing – thus creating jobs –, em-ployment growth within these firms is limited. Addi-tionally, in the manufacturing sector, for example, mi-cro-firms tend to be operating at low productivity - ac-counting for 91.6 percent of total number of establish-ments in 2015 but only 6.2 percent of total value added (in market price) – which is often associated with low profits and wages to boost firm owners and employees into middle-class status. Some services sectors are also key to middle-class jobs creation although firm-level data in services is lacking. The services sector could become a more im-portant source to create middle-class jobs as global manufacturing becomes more competitive due to shift-ing trade patterns. However, empirical research on the demand side of jobs in the service sector is incomplete due to limited firm-level data in the sector. This war-rants attention due to the service sector’s potential to create middle-class jobs (inclusive of all workers), global
45 OECD (2018a). 46 Data from the Ministry of Co-operatives and SMEs refer to establish-ments, rather than enterprises, and include the agricultural sector. 47 Interpersonal skill is the ability to analyze and process information and to manage people and relationships in order to successfully perform a range of job-related tasks.
deindustrialization patterns and the large size of the ser-vice sector. The workforce does not currently have sufficient education and skills to engage in more middle-class jobs.
Most of today’s workforce is not equipped to hold a middle-class job. Middle-class jobs tend to be in more-skilled occupations – managers, professionals, and high-level technicians/associates in manufacturing and services industries – that require strong cognitive, analytical, interpersonal47, and digital skills as well as knowledge in science, technology, engineering and mathematics (STEM) and business administration. However, 57 percent of the labor force has only a lower-secondary education (8 years of school) or less. While Indonesia’s labor force may have levels of educa-tion on par with middle-income East Asian countries, it has acquired fewer labor-market relevant skills than its education level might suggest. Standardized tests of adult skills (PIAAC) ranks Indonesia last among OECD and middle-income countries48; Indonesia’s best per-formers score worse than the average performer in the OECD workforce. The wage premium for each addi-tional year of education is 6.7 percent in Indonesia49, compared to 10.4 percent for East Asia and 10 percent for Vietnam. Nearly 14 percent of firms interviewed in the 2015 Doing Business Survey in Indonesia report that “workforce education” is a major or severe obsta-cle to doing business, as compared to 8.4 percent of employers in the Philippines and 2.5 percent in Thai-land. The shortage is particularly severe among more-skilled occupations, including managers. The future workforce is lagging, with poor learning outcomes.50 An Indonesian child entering the educa-tion system today can expect to complete 12.4 years of schooling but they only learn the equivalent of 7.8 years51 due to poor quality in many Indonesian primary and secondary schools, as well as limited early child-hood education coverage. Combined with other edu-cation and health indicators, a child born in Indonesia today will only be 54 percent as productive when she grows us as she could be if she enjoyed complete edu-cation and full health.52 This is lower than the average
48 The MIC surveyed were Czech Republic, Estonia, Slovak Republic, Chile, Indonesia (Jakarta only), Lithuania, Slovenia, and Turkey. 49 Wihardja and Cunningham (forthcoming 2021). 50 See also World Bank (2019b). 51 Human Capital Index 2020 <https://data-bank.worldbank.org/data/download/hci/HCI_1pager_IDN.pdf> 52 ibid
B o o s t i n g t h e r e c o v e r y I n d o n e s i a E c o n o m i c P r o s p e c t s
J u n e 2 0 2 1 T H E W O R L D B A N K | B A N K D U N I A
36
for East Asia & Pacific region and upper-middle in-come countries. Indonesia does not have the systems in place to help the large existing workforce acquire the skills that a structurally transformed, more productive Indonesia will need. For those who are no longer in school, opportunities for upskilling and reskilling is minimal. Indonesia’s training system has more than 45,000 technical and vocational education and training (TVET) institutions, managed by dozens of ministries and levels of government, serving millions of students each year. Some good practices are in place, but the complex system is not conducive to efficiently provid-ing training services that are demanded by the labor market, particularly in an environment when the skills profile of jobs is rapidly evolving.53 The government has started to identify critical occupations54 and the fast-est growing jobs,55 but these labor market trends are not yet shaping the publicly managed training institutions.
Efforts to develop quality assurance mechanisms are in motion, but the quality control system is still frag-mented, duplicative, and incomplete. Both the educa-tion and training system are still largely divorced from the business sector despite government’s efforts, which further exacerbates the mismatch between education and training services and good jobs. The firm sector does little to fill the gap; only 13 percent of Indonesia’s firms provide training to their workers, as compared to 32 percent of firms in the East Asia and Pacific region. And when training is provided, it is primarily in firm-specific technologies rather than broader and more mo-bile skills sets. Labor legislation could be improved to play a larger role in improving job quality. The interna-tional literature shows that well-designed minimum wage policies can lift the wages of the poorest and, in some cases, have (muted) spillover effects on workers who earn higher wages.56 However, Indonesia’s mini-mum wages do not uniformly increase wages of the
poorest, 57 with 43 percent of employees earning below the provincial minimum wage. Similarly, well-designed labor legislation – such as paid maternity and paternity leave, limits on work hours, protection from unfair dis-missal, and equal rights in the workplace – can pro-tect workers on the job without causing significant
53 Moreover, many women face particular challenges in accessing work-force development and training programs, because of constraints to mobil-ity, the timing of programs, or conflicts with expectations of domestic work and caring responsibilities (World Bank, 2020c). 54 See World Bank and CMEA (2020). Critical occupations is a list of oc-
cupations that were identified as being in shortage and of strategic im-portance to the Indonesian economy.
harm to firms. The policy challenge is finding the bal-ance between setting a minimum wage that is well-de-fined and understood by workers, but not so high that firms want to evade, and labor legislation that protects workers while not over-burdening firms. The Omnibus Law on Job Creation is introducing new minimum wage-setting processes and modifying other labor legis-lation in an effort to strike a better balance between worker protection and labor market flexibility.58 In the next section, we will discuss in detail about fac-tors that is holding back women’s economic participa-tion and the potential economic gains if more women joined the labor market. In the following section after that, we will discuss how COVID-19 has interrupted Indonesia’s transition towards better quality jobs dis-cussed above and impacted women’s economic partici-pation.
3. What is holding back women’s economic participation?
Several structural and cultural factors contribute to overall low and stagnant labor force participation rates among women and limit women’s access to middle class jobs. Women are doing better than ever in some areas. They have seen substantial increases in education rates over the past 20 years. Fertility rates are falling, and women have been increasingly holding wage employ-ment. However, significant gender gaps remain. The gaps in job quality and earnings between men and women remain high. These may be explained by a range of structural and cultural factors, including norms around women’s role in the family including care for children and elderly and the unmet need for child and elder care services. Women’s economic participation is stagnant thus limiting Indonesia’s economic growth potential.
Indonesia’s work force is dominated by men, changing little over the past 20 years. While men and women are equally represented in the working age pop-ulation, only 39 percent of workers are women. Ap-proximately half of working-age women (age 15-64) hold a job, as compared to 80 percent of men, with
55 World Bank and Bappenas (2020). 56 Cunningham (2007); Del Carpio and Pabón (2014) 57 Hohberg and Lay (2015); Alatas and Cameron (2008); Harrison and Scorse (2010); Chun and Khor (2010) 58 An additional challenge is to improve compliance; see Weber and Kudo (2020)
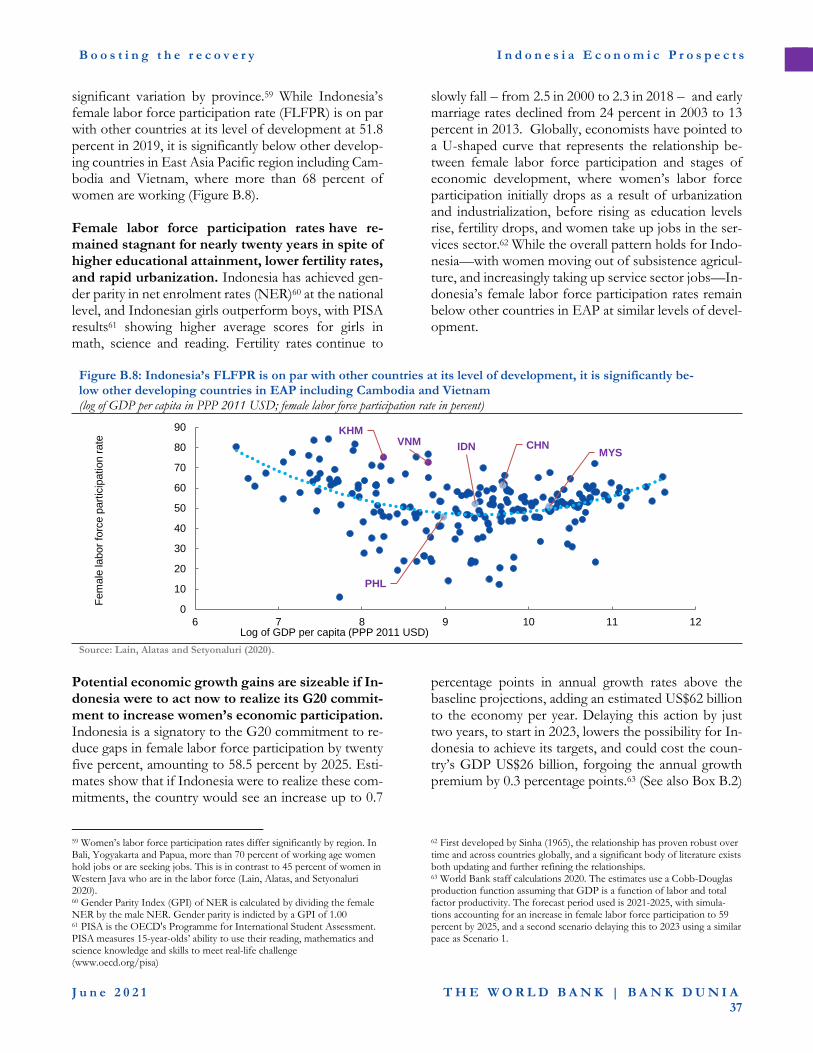
B o o s t i n g t h e r e c o v e r y I n d o n e s i a E c o n o m i c P r o s p e c t s
J u n e 2 0 2 1 T H E W O R L D B A N K | B A N K D U N I A
37
significant variation by province.59 While Indonesia’s female labor force participation rate (FLFPR) is on par with other countries at its level of development at 51.8 percent in 2019, it is significantly below other develop-ing countries in East Asia Pacific region including Cam-bodia and Vietnam, where more than 68 percent of women are working (Figure B.8). Female labor force participation rates have re-mained stagnant for nearly twenty years in spite of higher educational attainment, lower fertility rates, and rapid urbanization. Indonesia has achieved gen-der parity in net enrolment rates (NER)60 at the national level, and Indonesian girls outperform boys, with PISA results61 showing higher average scores for girls in math, science and reading. Fertility rates continue to
slowly fall – from 2.5 in 2000 to 2.3 in 2018 – and early marriage rates declined from 24 percent in 2003 to 13 percent in 2013. Globally, economists have pointed to a U-shaped curve that represents the relationship be-tween female labor force participation and stages of economic development, where women’s labor force participation initially drops as a result of urbanization and industrialization, before rising as education levels rise, fertility drops, and women take up jobs in the ser-vices sector.62 While the overall pattern holds for Indo-nesia—with women moving out of subsistence agricul-ture, and increasingly taking up service sector jobs—In-donesia’s female labor force participation rates remain below other countries in EAP at similar levels of devel-opment.
Figure B.8: Indonesia’s FLFPR is on par with other countries at its level of development, it is significantly be-low other developing countries in EAP including Cambodia and Vietnam (log of GDP per capita in PPP 2011 USD; female labor force participation rate in percent)
Source: Lain, Alatas and Setyonaluri (2020).
Potential economic growth gains are sizeable if In-donesia were to act now to realize its G20 commit-ment to increase women’s economic participation. Indonesia is a signatory to the G20 commitment to re-duce gaps in female labor force participation by twenty five percent, amounting to 58.5 percent by 2025. Esti-mates show that if Indonesia were to realize these com-mitments, the country would see an increase up to 0.7
59 Women’s labor force participation rates differ significantly by region. In Bali, Yogyakarta and Papua, more than 70 percent of working age women hold jobs or are seeking jobs. This is in contrast to 45 percent of women in Western Java who are in the labor force (Lain, Alatas, and Setyonaluri 2020). 60 Gender Parity Index (GPI) of NER is calculated by dividing the female NER by the male NER. Gender parity is indicted by a GPI of 1.00 61 PISA is the OECD's Programme for International Student Assessment. PISA measures 15-year-olds’ ability to use their reading, mathematics and science knowledge and skills to meet real-life challenge (www.oecd.org/pisa)
percentage points in annual growth rates above the baseline projections, adding an estimated US$62 billion to the economy per year. Delaying this action by just two years, to start in 2023, lowers the possibility for In-donesia to achieve its targets, and could cost the coun-try’s GDP US$26 billion, forgoing the annual growth premium by 0.3 percentage points.63 (See also Box B.2)
62 First developed by Sinha (1965), the relationship has proven robust over time and across countries globally, and a significant body of literature exists both updating and further refining the relationships. 63 World Bank staff calculations 2020. The estimates use a Cobb-Douglas production function assuming that GDP is a function of labor and total factor productivity. The forecast period used is 2021-2025, with simula-tions accounting for an increase in female labor force participation to 59 percent by 2025, and a second scenario delaying this to 2023 using a similar pace as Scenario 1.
CHNIDN
KHM
MYS
PHL
VNM
0
10
20
30
40
50
60
70
80
90
6 7 8 9 10 11 12
Fem
ale
labor
forc
e p
art
icip
ation r
ate
Log of GDP per capita (PPP 2011 USD)
B o o s t i n g t h e r e c o v e r y I n d o n e s i a E c o n o m i c P r o s p e c t s
J u n e 2 0 2 1 T H E W O R L D B A N K | B A N K D U N I A
38
Box B.2: Estimating the growth returns for women’s economic participation
Policies to support closing Indonesia’s female labor force participation gap by just twenty-five percent by 2025 (or to a rate of 58.5 percent) are estimated to lead to growth gains to Indonesia of US$62 billion to the economy, or an increase of 0.7 percentage points in annual growth between 2021-2025.[1] But Indonesia would need to act now to capitalize on these growth returns. A delay of just two years in achieving a 59 percent female labor force participation rate (i.e. achieving this in 2023) is estimated to cost the Indonesian economy US$5 billion annually, leading to 0.3 percent less in annual GDP growth, and would see 2.5 million fewer jobs created for women.[2]
So how can Indonesia increase its female labor force participation? Emerging evidence points to the critical role of childcare services as a key constraint to women’s labor force participation (see Box B.3). Using an applied CGE model (MANAGE)[3], several simula-tions conducted assess the macroeconomic and distributional consequences of introducing fiscal policy interventions designed to boost access and affordable childcare services. Specifically, it focuses on reducing the cost of childcare by introducing budget neutral subsidies, simulating both a 25 percent subsidy and a 10 percent subsidy. The MANAGE model uses a 2018 Indonesia Social Ac-counting Matrix (SAM), and introduces childcare activities (for ages 0-2 and 3-6), through both public and private provision, as well as social reproduction activities. The model is calibrated to imitate the base year of 2018 SAM. The analysis focused on selected interventions, namely subsidizing childcare services, and the introduction of increased total factor productivity together with subsi-dies.
1. Subsidizing childcare services. Model simulations in this scenario projected the impacts of two different subsidy levels, namely a twenty five percent and a ten percent subsidy on childcare costs, through both consumption and production of childcare. Both subsidies positively impacted growth, with the higher subsidy scenario leading to slightly higher Gross Do-mestic Product (GDP), namely an increase of 3.4 percentage points at 25% subsidy, and over 3.2 percentage points at the 10% subsidy by 2030 compared to the business as usual scenarios. Overall economic activity is stimulated in all sectors of the economy. The expanding economic activity also favors female labor, both through the provision of childcare (to free up women’s time from care work), as well as through job creation in the care sector. Demand for labor increases by 0.8 million under the higher subsidy scenario and by 0.04 million in the lower subsidy scenario, with most of the jobs created going towards women. The subsidies are estimated to cost around US$1.6 billion (0.8 percent of Government Budget) for a 25 percent subsidy and US$0.5 billion (0.3 percent of Government Budget) for a 10 percent subsidy in 2021. More affordable childcare services and rising employment increase the welfare of all income groups in Indonesia. However, the subsidy ben-efits the lower income groups more than the high-income groups, with lower income groups experiencing welfare gains of between 3.8-4.2 percent, depending on the size of the subsidy.
2. Increasing productivity. Emerging empirical evidence has drawn links between the availability of pre-schools and total factor productivity (see Box B.3). Based on these findings, model simulations projected the impacts of a doubling the availa-bility of childcare services (for the 0-2 age range) and increasing preschool density[4] (for the 3-6 range) that, in turn, is estimated to lead to productivity gains of 2.2 percent. These gains are assumed to be derived from increasing availability, access, and affordability of full-time childcare services for working families. The gains in productivity are added into simula-tions to subsidize childcare services as outlined in the previous scenario. Results from this simulation shows increases in GDP above the simple subsidy scenario, estimating a 3.6 percentage change over business as usual. The new economic structure also favors female labor, with an estimated 3.7 million women added to the labor markets by 2030. Higher total factor produc-tivity brings additional welfare gains, especially for the low-income groups, of around 5 percentage points higher than business as usual estimates. As in the previous scenario, the impact of the subsidies is budget neutral, and are estimated to cost around 0.8 percent of the annual expenditures for 2021.
Overall, the analysis shows that there are significant gains in women’s employment, overall welfare, and economic growth that could be derived from investments in the care economy. Investments to expand the access and affordability of childcare services are esti-mated to lead to growth in GDP, and also have positive welfare gains especially for the middle- and lower-income populations. Costs of these investments are progressive, with the impacts of the higher investments in this sector falling on higher income households and are estimated to cost around one percent of the Government’s annual expenditure. These findings indicate that investments in the care economy have significant potential returns to the economy and to addressing gaps in female labor force participation and productivity.
---------------- [1] These estimates where derived using a Cobb-Douglas production function, and calculated the projected growth impacts of an overall increase of the female labor force participation rates to 59 percent by 2025 from the current rate of 53 percent if this were to be achieved in 2021 [2] World Bank staff calculations [3] MANAGE is a recursive dynamic single country competitive CGE model that has been modified to account for gender specific analysis related to labor supply decisions and the relationship between savings rate and dependency ratios. [4] Draws on Halim et al (2020) to define preschool density as the number of preschools per 1,000 preschool-aged children aged 3-6, in each district, and draws estimates from Cali et al (forthcoming) on estimated increases in productivity for firms from increasing preschool density from mean values covering 2003-2014.

B o o s t i n g t h e r e c o v e r y I n d o n e s i a E c o n o m i c P r o s p e c t s
J u n e 2 0 2 1 T H E W O R L D B A N K | B A N K D U N I A
39
Under-representation of women among middle-class jobs holders is due to occupational sorting, employment type and gender wage gaps, under-pinned by traditional gender roles. While women hold 35 percent of income-earning jobs, they only hold 28.6 percent of middle-class jobs. About 12.3 percent of the 30 million income-earning women have jobs that earn at least a middle-class wage (3.6 million women), as compared to 16.5 percent of the 55 million income-earning men (9.1 mil-lion). Women’s under-representation among middle-class job holders is due to occupational sorting (e.g. low-paying teachers and nurses rather than high-paying engineers and physicians), employment-type (e.g. un-paid family workers), and gender wage gaps, under-pinned by traditional gender roles.64
Middle-class jobs are commonly employees in higher-paying occupations. However, women - es-pecially married women with children and female household heads - are under-represented among em-ployees, holding 35 percent of employee jobs but 39 percent of all jobs. Their self-selection into unpaid em-ployment or self-employment65 seems to reflect child-care duties66 and social norms that undervalue women’s jobs.67
Even if men and women did acquire similar occu-pations and work types, the gender wage gap per-sists, which keeps women at a distance from men in acquiring jobs that pay a middle-class in-come. Indonesian men earn 25 percent more for an hour of work than do Indonesian women (down from 38 percent in 2001)68,69; this is double the gender wage gap in other Southeast Asian countries. Gender gaps are becoming increasingly difficult to explain through different ‘endowments’ of education, experience, and
64 Chapter 5, Wihardja and Cunningham (forthcoming, 2021) 65 Women with young children in the household are 1.1-1.9 percentage point more likely to be self-employed than are women without young chil-dren in the household and compared to men, who are 0.1 – 1.4 percentage point more likely. Women who are household heads are 17 percentage point more likely to be self-employed than women who are not household heads, compared to 8 percentage point of male household heads. 66 Indraswari (2006) finds that Indonesian women choose to open small-scale businesses (and become own-account workers) with an aim to con-tribute to the family’s income, but without needing to enter the formal la-bor market and sacrifice her position as a mother. 67 Fagertun (2017) reports that men and women in the Bali tourism indus-try perceive that women’s work is supplementary to their husbands or male kin. 68 All available earnings data cover only income earners (wage-employed, own account workers, and casual workers). Blinder-Oaxaca-style decompo-sition is implemented using technique described by Elder, Goddeeris, and Haider 2010. Control variables used are: age; educational attainment; ur-banicity; and province fixed effects. Data source is Sakernas 2001-2018. See Lain, Alatas and Setyonaluri (2020).
location. Moreover, the gender wage gap is not ex-plained by different occupations, sectors, or types of work.70 Qualitative data suggests that social norms may play a role. For example, in Indonesia, nearly one-third of respondents in a perception survey disagreed with the statement “it is perfectly acceptable for any women in their family to have a paid job outside the home if she wants one”.71 The perception that women’s work is supplementary to their husbands or male kin72 may dis-courage women from pursuing careers or staying at-tached to a labor market in which they can move up the earnings ladder. Women may trade-off income in favor of jobs with family-friendly benefits. While gender wage gaps fa-vor men, and the gap is smaller in middle-class jobs, women enjoy greater non-pecuniary bene-fits. Women holding middle-class jobs are about 5 per-centage points more likely than men to have written contracts,73 hold family-friendly benefits (annual, sick, or maternity leave), and work shorter hours than men.74 This evidence aligns with recent analytical work in Vi-etnam, which finds that women “trade-off” higher wages for family friendly social benefits.75 The unmet need for child- and elder-care services adversely affects women’s decisions to participate in the labor force.
Differences between women and men emerge dur-ing school to work transitions, with marriage and childbirth being the biggest predictors of women not making the transition to the labor market. At the age of 15, virtually all women and men are studying. In this sense, the labor market ‘baseline’ does not differ much by gender. However, even as early as age 17 or 18, domestic work starts to become a more common activity for women and girls: as such, many women
69 The hourly wage gap is 45 percent among the poorest (first decile) of workers and nearly absent among the tenth decile of workers. 70 Adding fixed effects for job status (wage work versus own account work versus casual work), sector, and occupation reduces the gender earnings gap by just 1-2 percentage points. Thus, even after accounting for sorting between different types of jobs, unexplained gender earnings gaps remain large. Source: Lain, Alatas and Setyonaluri, 2020. 71 This compares to India and Saudi Arabia, where 25% and 22% disagree with this statement respectively, while in Canada, 0% disagree. Source: OECD (2019). 72 Fagertun (2017). 73 Approximately 92 (88) percent of women (men) holding middle-class jobs have a written contract and 50 (45) percent of women (men) without middle-class jobs have a written contract. 74 Women work a median of 40 hours weekly, as compared to men who work a median of 45 hours weekly. 75 Chowdhury et al. (2018).
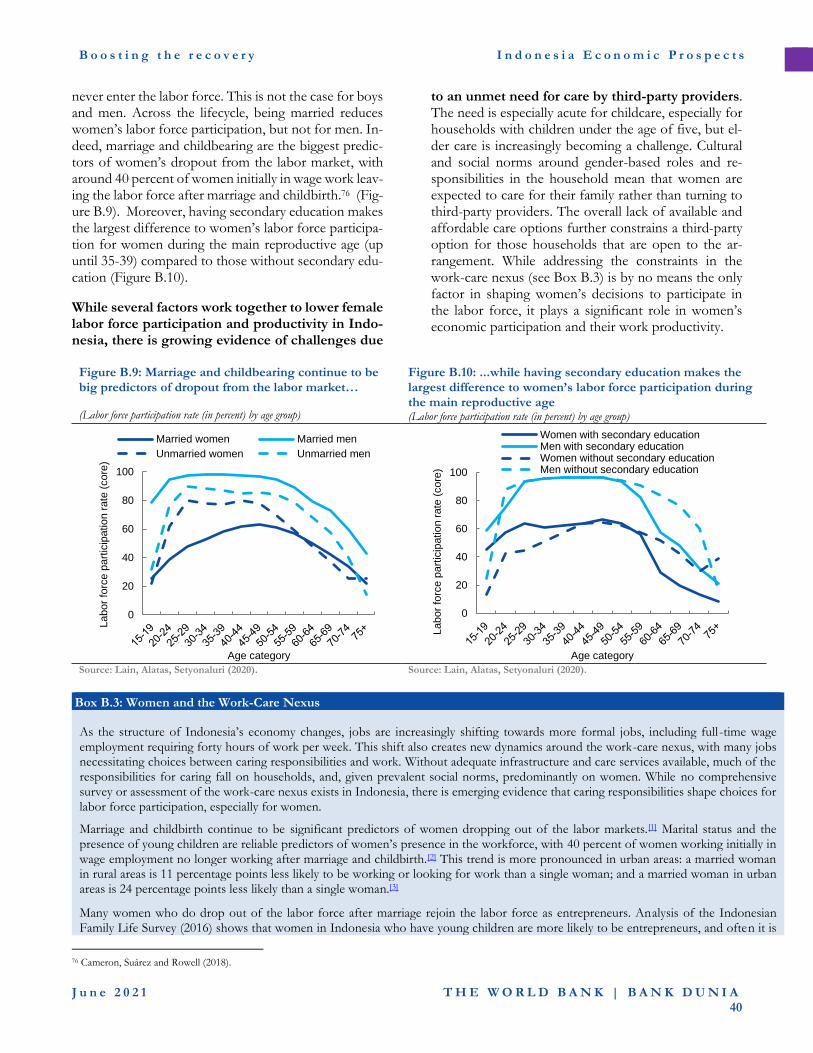
B o o s t i n g t h e r e c o v e r y I n d o n e s i a E c o n o m i c P r o s p e c t s
J u n e 2 0 2 1 T H E W O R L D B A N K | B A N K D U N I A
40
never enter the labor force. This is not the case for boys and men. Across the lifecycle, being married reduces women’s labor force participation, but not for men. In-deed, marriage and childbearing are the biggest predic-tors of women’s dropout from the labor market, with around 40 percent of women initially in wage work leav-ing the labor force after marriage and childbirth.76 (Fig-ure B.9). Moreover, having secondary education makes the largest difference to women’s labor force participa-tion for women during the main reproductive age (up until 35-39) compared to those without secondary edu-cation (Figure B.10).
While several factors work together to lower female labor force participation and productivity in Indo-nesia, there is growing evidence of challenges due
to an unmet need for care by third-party providers. The need is especially acute for childcare, especially for households with children under the age of five, but el-der care is increasingly becoming a challenge. Cultural and social norms around gender-based roles and re-sponsibilities in the household mean that women are expected to care for their family rather than turning to third-party providers. The overall lack of available and affordable care options further constrains a third-party option for those households that are open to the ar-rangement. While addressing the constraints in the work-care nexus (see Box B.3) is by no means the only factor in shaping women’s decisions to participate in the labor force, it plays a significant role in women’s economic participation and their work productivity.
Figure B.9: Marriage and childbearing continue to be big predictors of dropout from the labor market… (Labor force participation rate (in percent) by age group)
Figure B.10: ...while having secondary education makes the largest difference to women’s labor force participation during the main reproductive age (Labor force participation rate (in percent) by age group)
Source: Lain, Alatas, Setyonaluri (2020). Source: Lain, Alatas, Setyonaluri (2020).
Box B.3: Women and the Work-Care Nexus
As the structure of Indonesia’s economy changes, jobs are increasingly shifting towards more formal jobs, including full-time wage employment requiring forty hours of work per week. This shift also creates new dynamics around the work-care nexus, with many jobs necessitating choices between caring responsibilities and work. Without adequate infrastructure and care services available, much of the responsibilities for caring fall on households, and, given prevalent social norms, predominantly on women. While no comprehensive survey or assessment of the work-care nexus exists in Indonesia, there is emerging evidence that caring responsibilities shape choices for labor force participation, especially for women.
Marriage and childbirth continue to be significant predictors of women dropping out of the labor markets.[1] Marital status and the presence of young children are reliable predictors of women’s presence in the workforce, with 40 percent of women working initially in wage employment no longer working after marriage and childbirth.[2] This trend is more pronounced in urban areas: a married woman in rural areas is 11 percentage points less likely to be working or looking for work than a single woman; and a married woman in urban areas is 24 percentage points less likely than a single woman.[3]
Many women who do drop out of the labor force after marriage rejoin the labor force as entrepreneurs. Analysis of the Indonesian Family Life Survey (2016) shows that women in Indonesia who have young children are more likely to be entrepreneurs, and often it is
76 Cameron, Suárez and Rowell (2018).
0
20
40
60
80
100
Labor
forc
e p
art
icip
atio
n r
ate
(core
)
Age category
Married women Married men
Unmarried women Unmarried men
0
20
40
60
80
100
Labor
forc
e p
art
icip
atio
n r
ate
(core
)
Age category
Women with secondary educationMen with secondary educationWomen without secondary educationMen without secondary education
B o o s t i n g t h e r e c o v e r y I n d o n e s i a E c o n o m i c P r o s p e c t s
J u n e 2 0 2 1 T H E W O R L D B A N K | B A N K D U N I A
41
after the birth of their first child that women shift from wage work to entrepreneurship and remain engaged in entrepreneurship even after their children reach school age.[4] Evidence from Indonesia’s Labor Force Survey 2019 shows that of about 58.1 percent of internet-using women who left their previous jobs due to childbirth or domestic work were engaged in e-commerce, suggesting e-commerce as a possible pathway to return to work after pregnancy/childbirth. While women entrepreneurs were found to spend a similar number of hours working as wage workers, entrepreneurship seems to offer more flexibility in the among of time that women spend working[5], and seems to allow households to better manage the work-care nexus.
Emerging evidence points to the positive impacts that increasing care options could deliver. Current options for affordable and quality care in Indonesia, especially childcare, are relatively limited.[6] A 2017 study found that urban women without access to informal childcare provided by grandparents forego approximately US$1,300 in earnings due to extended absences from the labor force [7]. A recent study found that the provision of an additional public preschool per 1,000 children raises the employment of mothers of eligible children by 9.1 percent or 4.8 percentage points[8]. In addition, the same additional preschool availability was found to increase work participation of fathers of children of eligible age, primarily driven by self-employment[9]. Another forthcoming study finds that preschool availability increases firm productivity, potentially due to lower turnover or the fact that entry into the labor market of mothers enables firms to find better matched workers for the jobs.[10]
Investments in care services in Indonesia could not only unlock significant gains to households with young children, it could also con-tribute to greater job growth in care services and have a positive impact on women’s labor force participation.
---------------- [1] Cameron, Suárez, Rowell (2018) [2] Cameron (2018) [3] Cameron, Suárez, Rowell (2018) [4] Johnson and Perova (forthcoming) [5] ibid [6] Indonesia has increased the provision of early childhood education and development services in recent years. However, much of the increase in service providers is attributed to kindergartens and playgroups, for children aged 4—5 years creating a large care deficit for many families wanting to place their children in early childhood education or childcare while they are working. [7] Halim, Johnson and Perova (2017) [8] Halim, Johnson and Perova. (forthcoming, 2021) [9] Dervisevic et al. (forthcoming) [10] Cali, Johnson, Perova and Ryandiansyah (forthcoming)
4. A transition challenged: the labor market impact of COVID-19
The COVID-19 crisis has exacerbated the jobs sit-uation. The share of middle-class jobs declined by about 5.2 percentage points by August 2020, compared to August 2019.77 This trend, if not reversed, threatens the gains from Indonesia’s 30 years of structural trans-formation towards better-quality jobs. While the world has yet to see the end of the pandemic and uncertainties are still looming, the COVID-19 crisis is expected to continue to manifest itself through several channels and thus to continue to have deep and widespread negative effects.78
First, the crisis triggered by COVID-19 is a broad-based economic crisis. Some industries have been af-fected by the external shock, such as mining, planta-tions, tourism, and some labor-intensive manufacturing industries, where demand has dried up. Other sectors, such as trade, transport, and hotels and restaurants have been affected by domestic restrictions on movement. Except for a handful of sectors, which includes those
77 Sakernas August 2019 & 2020
providing certain medical goods and services, e-com-merce, and less contact-intensive activities including fi-nance, education, communications, and telecommuni-cations, most sectors have been somewhat or severely affected by global and domestic measures to contain the virus. Firms across the board are feeling the impacts, and this includes firms operating in sectors in which middle-class jobs are clustered.
Second, sectors in which urban microbusinesses are concentrated, including offline low-end food and beverages and motorcycle ride-hailing trans-portation, have been severely hit. These enterprises have little inventory or savings, and limited access to financing. With social distancing measures, many have failed. Providing financial support to these urban mi-crobusinesses is difficult since a large share of the self-employed, daily-wage workers, digital gig workers, and
78 Much of the comparison in this report with the Asian financial crisis is based on an understanding of transmission channels.Quantitative analysis has not yet been carried out.
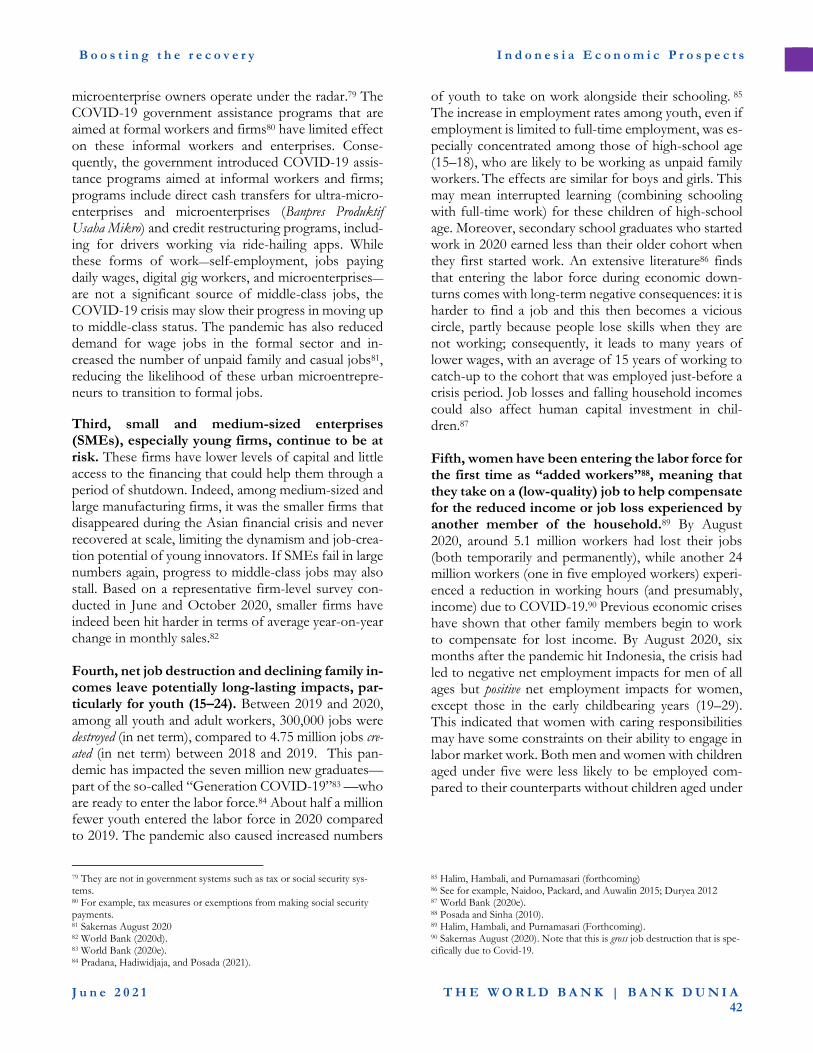
B o o s t i n g t h e r e c o v e r y I n d o n e s i a E c o n o m i c P r o s p e c t s
J u n e 2 0 2 1 T H E W O R L D B A N K | B A N K D U N I A
42
microenterprise owners operate under the radar.79 The COVID-19 government assistance programs that are aimed at formal workers and firms80 have limited effect on these informal workers and enterprises. Conse-quently, the government introduced COVID-19 assis-tance programs aimed at informal workers and firms; programs include direct cash transfers for ultra-micro-enterprises and microenterprises (Banpres Produktif Usaha Mikro) and credit restructuring programs, includ-ing for drivers working via ride-hailing apps. While these forms of work—self-employment, jobs paying daily wages, digital gig workers, and microenterprises—
are not a significant source of middle-class jobs, the COVID-19 crisis may slow their progress in moving up to middle-class status. The pandemic has also reduced demand for wage jobs in the formal sector and in-creased the number of unpaid family and casual jobs81, reducing the likelihood of these urban microentrepre-neurs to transition to formal jobs.
Third, small and medium-sized enterprises (SMEs), especially young firms, continue to be at risk. These firms have lower levels of capital and little access to the financing that could help them through a period of shutdown. Indeed, among medium-sized and large manufacturing firms, it was the smaller firms that disappeared during the Asian financial crisis and never recovered at scale, limiting the dynamism and job-crea-tion potential of young innovators. If SMEs fail in large numbers again, progress to middle-class jobs may also stall. Based on a representative firm-level survey con-ducted in June and October 2020, smaller firms have indeed been hit harder in terms of average year-on-year change in monthly sales.82
Fourth, net job destruction and declining family in-comes leave potentially long-lasting impacts, par-ticularly for youth (15–24). Between 2019 and 2020, among all youth and adult workers, 300,000 jobs were destroyed (in net term), compared to 4.75 million jobs cre-ated (in net term) between 2018 and 2019. This pan-demic has impacted the seven million new graduates—part of the so-called “Generation COVID-19”83 —who are ready to enter the labor force.84 About half a million fewer youth entered the labor force in 2020 compared to 2019. The pandemic also caused increased numbers
79 They are not in government systems such as tax or social security sys-tems. 80 For example, tax measures or exemptions from making social security payments. 81 Sakernas August 2020 82 World Bank (2020d). 83 World Bank (2020e). 84 Pradana, Hadiwidjaja, and Posada (2021).
of youth to take on work alongside their schooling. 85 The increase in employment rates among youth, even if employment is limited to full-time employment, was es-pecially concentrated among those of high-school age (15–18), who are likely to be working as unpaid family workers. The effects are similar for boys and girls. This may mean interrupted learning (combining schooling with full-time work) for these children of high-school age. Moreover, secondary school graduates who started work in 2020 earned less than their older cohort when they first started work. An extensive literature86 finds that entering the labor force during economic down-turns comes with long-term negative consequences: it is harder to find a job and this then becomes a vicious circle, partly because people lose skills when they are not working; consequently, it leads to many years of lower wages, with an average of 15 years of working to catch-up to the cohort that was employed just-before a crisis period. Job losses and falling household incomes could also affect human capital investment in chil-dren.87 Fifth, women have been entering the labor force for the first time as “added workers”88, meaning that they take on a (low-quality) job to help compensate for the reduced income or job loss experienced by another member of the household.89 By August 2020, around 5.1 million workers had lost their jobs (both temporarily and permanently), while another 24 million workers (one in five employed workers) experi-enced a reduction in working hours (and presumably, income) due to COVID-19.90 Previous economic crises have shown that other family members begin to work to compensate for lost income. By August 2020, six months after the pandemic hit Indonesia, the crisis had led to negative net employment impacts for men of all ages but positive net employment impacts for women, except those in the early childbearing years (19–29). This indicated that women with caring responsibilities may have some constraints on their ability to engage in labor market work. Both men and women with children aged under five were less likely to be employed com-pared to their counterparts without children aged under
85 Halim, Hambali, and Purnamasari (forthcoming) 86 See for example, Naidoo, Packard, and Auwalin 2015; Duryea 2012 87 World Bank (2020e). 88 Posada and Sinha (2010). 89 Halim, Hambali, and Purnamasari (Forthcoming). 90 Sakernas August (2020). Note that this is gross job destruction that is spe-cifically due to Covid-19.
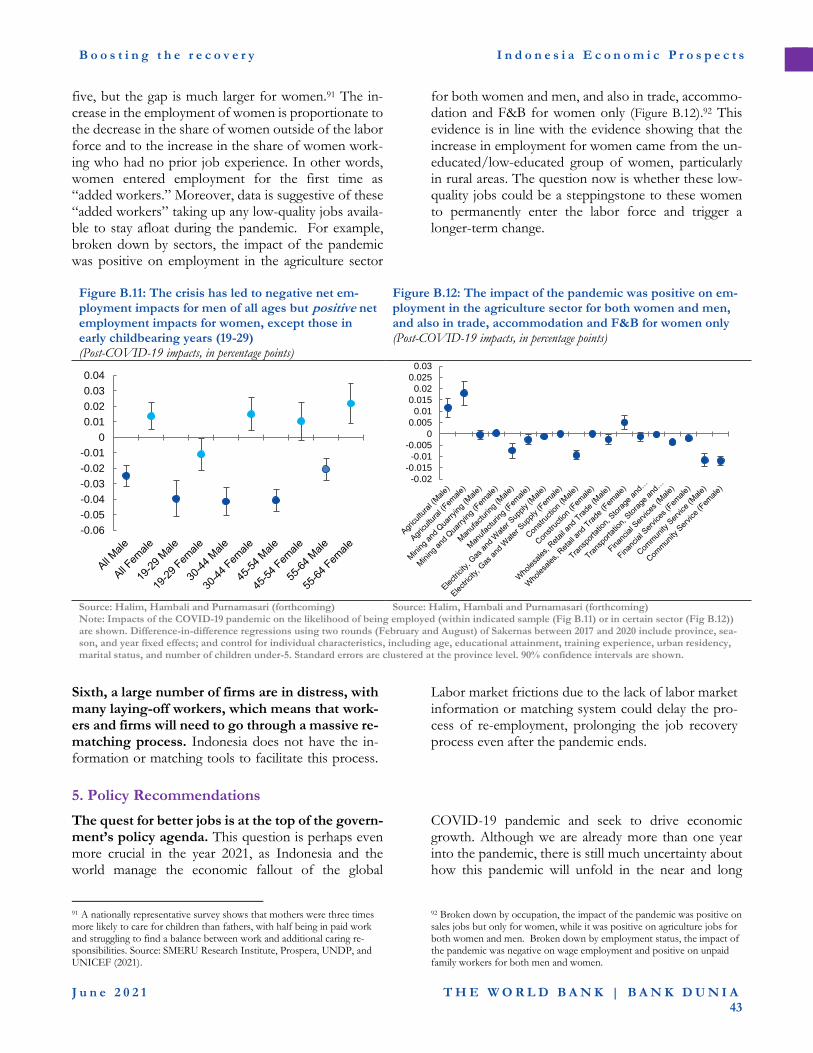
B o o s t i n g t h e r e c o v e r y I n d o n e s i a E c o n o m i c P r o s p e c t s
J u n e 2 0 2 1 T H E W O R L D B A N K | B A N K D U N I A
43
five, but the gap is much larger for women.91 The in-crease in the employment of women is proportionate to the decrease in the share of women outside of the labor force and to the increase in the share of women work-ing who had no prior job experience. In other words, women entered employment for the first time as “added workers.” Moreover, data is suggestive of these “added workers” taking up any low-quality jobs availa-ble to stay afloat during the pandemic. For example, broken down by sectors, the impact of the pandemic was positive on employment in the agriculture sector
for both women and men, and also in trade, accommo-dation and F&B for women only (Figure B.12).92 This evidence is in line with the evidence showing that the increase in employment for women came from the un-educated/low-educated group of women, particularly in rural areas. The question now is whether these low-quality jobs could be a steppingstone to these women to permanently enter the labor force and trigger a longer-term change.
Figure B.11: The crisis has led to negative net em-ployment impacts for men of all ages but positive net employment impacts for women, except those in early childbearing years (19-29) (Post-COVID-19 impacts, in percentage points)
Figure B.12: The impact of the pandemic was positive on em-ployment in the agriculture sector for both women and men, and also in trade, accommodation and F&B for women only (Post-COVID-19 impacts, in percentage points)
Source: Halim, Hambali and Purnamasari (forthcoming) Source: Halim, Hambali and Purnamasari (forthcoming) Note: Impacts of the COVID-19 pandemic on the likelihood of being employed (within indicated sample (Fig B.11) or in certain sector (Fig B.12)) are shown. Difference-in-difference regressions using two rounds (February and August) of Sakernas between 2017 and 2020 include province, sea-son, and year fixed effects; and control for individual characteristics, including age, educational attainment, training experience, urban residency, marital status, and number of children under-5. Standard errors are clustered at the province level. 90% confidence intervals are shown.
Sixth, a large number of firms are in distress, with many laying-off workers, which means that work-ers and firms will need to go through a massive re-matching process. Indonesia does not have the in-formation or matching tools to facilitate this process.
Labor market frictions due to the lack of labor market information or matching system could delay the pro-cess of re-employment, prolonging the job recovery process even after the pandemic ends.
5. Policy Recommendations
The quest for better jobs is at the top of the govern-ment’s policy agenda. This question is perhaps even more crucial in the year 2021, as Indonesia and the world manage the economic fallout of the global
91 A nationally representative survey shows that mothers were three times more likely to care for children than fathers, with half being in paid work and struggling to find a balance between work and additional caring re-sponsibilities. Source: SMERU Research Institute, Prospera, UNDP, and UNICEF (2021).
COVID-19 pandemic and seek to drive economic growth. Although we are already more than one year into the pandemic, there is still much uncertainty about how this pandemic will unfold in the near and long
92 Broken down by occupation, the impact of the pandemic was positive on sales jobs but only for women, while it was positive on agriculture jobs for both women and men. Broken down by employment status, the impact of the pandemic was negative on wage employment and positive on unpaid family workers for both men and women.
-0.06
-0.05
-0.04
-0.03
-0.02
-0.01
0
0.01
0.02
0.03
0.04
-0.02
-0.015
-0.01
-0.005
0
0.005
0.01
0.015
0.02
0.025
0.03
B o o s t i n g t h e r e c o v e r y I n d o n e s i a E c o n o m i c P r o s p e c t s
J u n e 2 0 2 1 T H E W O R L D B A N K | B A N K D U N I A
44
term. Given this uncertainty, we propose policy reform areas with different time horizons: first is a set of policy recommendations to respond to the shock; and second is a set of policy recommendations to recover from it while addressing pre-pandemic structural challenges in creating middle-class jobs and harnessing women’s eco-nomic potential in order to build forward better. Responding to COVID-19 shocks
Short-term job relief measures to firms and workers in both formal and informal sectors can protect jobs from being lost. Without such measures, the cri-sis would lead to short-term job losses and losses of livelihood (even lives) of workers. Job losses might be difficult to recover, among others due to labor market frictions especially since Indonesia’s labor market infor-mation or matching system is still underdeveloped. If a business is forced to fire workers, it must devote man-agerial time and financial resources to rehire workers, as well as face search and matching frictions. Job relief measures must be time-bound and could cover the fol-lowing two interconnected areas.93 First, keep firms’ lights on by continuing to provide liquidity support but link it to worker retention tar-gets.94 Liquidity support to firms can be done in two ways to avoid receiving firms letting go of their workers despite receiving support: put conditionalities to receiv-ing firms to retain workers or give direct wage subsidies to workers.95 The government has provided fiscal, credit and cash assistance to firms since the pandemic started, however, they are not yet linked to a worker re-tention target. Implementation has also been con-strained by several issues, including the lack of (consol-
93 World Bank (2020e). 94 The argument to tie jobs-related criteria to emergency response pro-grams supporting firms is made in World Bank (2020g) and Levy (2020). Evidence of how effective some of these jobs-retention programs are can be found in Balleer et al (2016). The continuation of liquidity support to firms should consider the available fiscal space. 95 To ease the financial burden of firms, the design of the current wage subsidy program can be improved by linking it to reduced wage payment (World Bank, 2020d) and further linking it to a worker retention target. 96 The lack of databases is partly because most Indonesian enterprises are not registered. Data from Economic Census 2016 shows that 93 percent of non-agricultural enterprises in Indonesia did not have any legal status. Those that were registered were also biased among large and medium en-terprises. Around 94.2 percent of large non-agricultural enterprises and 81 percent of medium non-agricultural enterprises had legal entity compared to only 4.3 percent for micro and 17.9 percent for small non-agricultural enterprises. As a result, some government assistance to firms is not acces-sible to smaller enterprises. A World Bank firm-level survey on the im-pacts of Covid-19 on firms confirms that larger firms were much more likely to receive fiscal incentives and credit assistance (World Bank, 2021a). For example, by March 2021, while 44 percent of large firms received fiscal
idated) databases of intended program beneficiaries (es-pecially for programs targeting micro firms),96the lack of awareness about government assistance,97 and un-clear mechanisms of transferring funds.98 To cope, some programs targeted at micro firms were channeled through the social assistance beneficiary databases.. The government has also provided support targeted di-rectly at workers, including wage subsidies, income tax exemption and social security contribution exemption, but many of these programs are not accessible to infor-mal workers.99 Second, provide assistance to vulnerable workers including those in the informal sector.100 Programs targeted at formal firms and workers are ineffective at supporting the income of informal workers. Instead, uncovered workers living in poor and vulnerable house-holds can be supported through poverty-targeted social assistance programs such as cash transfers, cash-for-work programs or electricity subsidies. As most infor-mal workers are either employers or employees of household enterprises and household enterprises do not have separate family and business financial ac-counts (for example, spending on electricity is shared between family and business function), poverty-tar-geted social assistance helps both mitigate income losses and support livelihoods. In fact, Indonesia has already supported workers in the informal sector as part of its large social package for those that suffered sudden income losses due to COVID-19. A recent survey among digital merchants101 shows that 62 percent of merchants who received a cash transfer via Indonesia’s Family Conditional Cash Transfer Program (PKH) used the transfers not only for consumption or savings
incentives, only 5 percent of micro firms and 14 percent of small and me-dium firms did. If more firms were registered, more firms would have re-ceived more government assistance. 97 A World Bank firm-level survey on the impacts of Covid-19 on firms shows that program awareness is an issue (World Bank, 2021a). For exam-ple, by March 2021, only 16 percent and 43 percent of firms surveyed were aware of government’s fiscal incentives and wage subsidy program respec-tively. 98 Temenggung et al, (2021). 99 A World Bank firm-level survey shows that around 80 percent of large firms had received wage subsidies, as compared to only around 23 percent of small and medium firms, and less than 3 percent of micro firms (World Bank, 2021a). Income tax exemption, by definition, is only for workers who are registered in the tax system, while social security contribution ex-emption, by definition, is also only for workers registered in Indonesia’s so-cial security agency (BPJS) system. The numbers of workers registered in the government’s tax and social security system are few compared to Indo-nesia’s 128 million labor market pool. 100 Note that social assistance programs focus on the bottom 40 percent of the population so not all workers could be covered. Also, see World Bank (2020f), section B.6 for more discussion on social assistance during COVID-19. 101 World Bank (2021b).
B o o s t i n g t h e r e c o v e r y I n d o n e s i a E c o n o m i c P r o s p e c t s
J u n e 2 0 2 1 T H E W O R L D B A N K | B A N K D U N I A
45
but also for business purposes. For recipients of non-conditional village cash transfer (BLT Desa) the figure was 44 percent. Improving tracking systems of benefi-ciaries of these programs would provide greater insights on gender dimensions of recovery. Strengthening the socio-economic data used for targeting of programs and introducing on-demand application mechanisms would help better prepare for future shocks.102 Indonesia has a unique unified socio-economic database containing information on households in the bottom 40 percent of income distri-bution (DTKS), that is used for many (but not all) pov-erty-targeted programs. Several of the interventions in the social package for crisis mitigation have used DTKS to target beneficiaries and were able to distribute relief quite fast.103 However, DTKS’ capacity to accommo-date on-demand applications is currently limited and it is not geared towards capturing sudden income losses of households that are not already poor or vulnerable. Going forward, there is room to further strengthen DTKS by introducing more dynamic updating mecha-nisms, and on-demand applications mechanisms for specific programs. If done properly, (digital) technolo-gies could be utilized to improve databases in Indone-sia, for example, by moving towards digital ID.104 Recovering from COVID-19 shocks and building forward better
In the medium term, when containment measures have been lifted but workers and firms remain vul-nerable, a policy package, which mixes some job relief and job recovery measures is recom-mended.105 In the medium term, it is recommended to begin phasing out some of the job relief measures that help businesses survive and retain workers, and let mar-ket forces begin to play a role, while continuing income protection through social assistance.106 These job relief measures should also be time-bound. In parallel, it is
102 See also World Bank (2020f), section B.6 103 These include the coverage expansion (and increased benefits) of PKH, food vouchers, electricity subsidy, cash-for-work programs, and other non-conditional cash transfer programs, as well as repurposing the Pre-Employ-ment Card program as partly social assistance. 104 See World Bank (forthcoming 2021). 105 World Bank (2020e) and IMF (2021). 106 See part A of the report. As discussed in Part A of the report, continu-ing some of the government’s social assistance response to COVID-19 has the potential to cushion the poverty impact of the crisis although improved effectiveness is critical to meeting the full impact of the social assistance re-sponse. It is therefore important that the Government does not end COVID-19 social assistance prematurely. Locking-in some of the social as-sistance programs introduced during the pandemic could help fill pre-exist-ing gaps in coverage.
recommended to introduce job recovery measures to fos-ter job creation and link labor demand and supply. Re-covery measures may include both support to formal and informal enterprises with the goal of fostering job creation such as providing direct wage subsidies107 and combining employment assistance, on-the-job training, and training stipends that act as wage subsidies108, with a gradual shift from job retention to job creation goal109, and support to workers via employment services and training as well as public works. In the medium term, firms could also make remote work more effective by changing workplace culture and investing in IT infra-structure.110 A job recovery agenda could also address pre-pan-demic structural challenges on building more mid-dle-class jobs and harnessing women’s economic potentials to build forward better. Immediate action is expected to have substantial impacts in the medium- and long-term while delaying action will only delay the structural shifts needed to put Indonesia on a higher path. We propose a four-prong reform strategy that build on the on-going comprehensive policy interven-tions to close infrastructure, human capital and financial service gaps,111 which serve as the foundations of the pathways to middle-class jobs. Reform Strategy 1: Accelerate Across the Board Productivity Growth
Promote productivity growth across the board, not least in sectors with low value added. The most promising route to increasing productivity is enacting competition-enhancing policies that will help firms en-ter the marketplace and grow, and that will spur inno-vation. Competition-enhancing policies include those that lower the high cost of trade, increase access to for-eign talent currently in shortage, and attract export-ori-ented, efficiency-seeking foreign direct investment with links to global value chains. These policies also include those that improve domestic regulations and create a
107 For example, Korea is providing retention subsidies of 66%-90% of wages for 3 months. 108 For example, Jovenes programs in Latin America 109 Some of the current government supports to firms could be linked to a job-retention target, and when green shoots are on the horizon in the me-dium term, this target could shift to a job-creation target. 110 Azis (2020). 111 Pathways to middle-class jobs creation needs an efficient financial sector that is less costly, faster, safer and more transparent to mobilize domestic savings and allocate them across time and space to the more productive sectors, firms and workers. An efficient financial sector also enables firms and households to cope with economic uncertainties by hedging, pooling, sharing, and pricing risks, which helps savers and investors to make better decisions in terms of allocating their money and financial assets. The fi-nancial sector in Indonesia is however still rife with many challenges that could impede allocative efficiency of resources to the most productive uses.
B o o s t i n g t h e r e c o v e r y I n d o n e s i a E c o n o m i c P r o s p e c t s
J u n e 2 0 2 1 T H E W O R L D B A N K | B A N K D U N I A
46
more predictable and fair level playing field for firms, and those that strengthen institutions that promote competition and sound business regulation. Indonesia will also need to make a concerted effort to support productivity growth in household, small, and medium-sized enterprises, who provide a large share of Indone-sia’s jobs, but many operate at a low level of productiv-ity. Reform Strategy 2: Transition Workers to Jobs-Friendly Sectors and Firms Facilitate a more decisive shift in economic activity and workers toward more productive and higher-paying firms, sectors, and jobs. Even if reforms to increase productivity across the board are sector blind, Indonesia could prioritize certain policy reforms in sec-tors in which middle-class jobs are likely to be created. For example, it could prioritize investment promotion strategies for foreign direct investment attraction and generation in sectors and projects (including infrastruc-ture projects) likely to be a source of middle-class jobs. Tax incentives are often considered in this context, but this instrument is inferior to non-fiscal incentives. In-donesia already collects less taxes than most of its peers and as a result has a revenue base that is already too limited to sustainably fund the public services such as infrastructure that could attract more high-quality in-vestments. For example, Indonesia could establish a unit at the Investment Coordinating Board (BKPM) that is dedicated to priority sectors, projects, countries, or investors. Moreover, if workers are to transition across sectors, firms, and occupations, they will need robust information systems, a strong job-matching mechanism, legislation that does not disincentivize job changes, and support for job movements—including unemployment insurance—so that they may appropri-ately prepare for, and advance to, these better jobs. Reform Strategy 3: Build a Middle-Class Work-force Build a workforce that has the necessary skills to take on the new jobs in higher value added and in-ternationally competitive sectors. This will require changes to the education system to better prepare to-day’s youth for modern jobs. Perhaps more challenging, it will also require innovations to upskill the current
adult labor force to meet the skills standards of middle-class jobs and to be able to take advantage of potential technology transfers and knowledge spillovers from multinational corporations. Additional measures to at-tract women and youth into the workforce is increas-ingly necessary as the share of the working age popula-tion begins to shrink.
Reform strategy 4: Investing in the care economy to boost women’s economic participation. Expand the provision of quality and affordable care. Policy areas of intervention could include the de-velopment of a national framework for investing in the care economy.112 This could also outline specific measures to stimulate the provision of quality and af-fordable care services, both in the public and the private sector, including expansion of private care centers, community and home based care, and public provision of care services. Support job creation in the care economy. Expand-ing care services will also create jobs in the sector, which could be supported through the development of a na-tionally approved training curriculum for care workers, alongside core competencies, certification standards, and accreditation processes for prospective care facili-ties; and the rollout of training program for care work-ers that subsidizes participation and addresses possible gendered constraints, including norms, mobility and timing of training programs. Finally, new opportunities in the care sector could be highlighted through a na-tional campaign, including job fairs, and job matching services between training facilities and prospective em-ployers; information campaigns to shift social norms, and campaigns to support certification of home-based care workers. Indonesia is at a crossroads. It can plan a short-term recovery from the COVID-19 crisis without addressing the pre-existing structural challenges and limit its pro-gress toward middle-class jobs, as it did after the Asian financial crisis. Or it can take bold steps by systemati-cally and strategically mapping out a “building forward better” recovery agenda that focuses on productivity and good jobs, and a middle-class Indonesia.
112 This national framework or roadmap should have clarity on the regula-tory framework, roles and responsibilities of relevant line ministries, quality
of care standards, oversight, enforcement, training and qualifications, fi-nancing, and provision
E c o n o m i c R e c o v e r y a n d F o o d S e c u r i t y I n d o n e s i a E c o n o m i c P r o s p e c t s
J u n e 2 0 2 1 T H E W O R L D B A N K | B A N K D U N I A
47
References
PART A
Auerbach, A. J. and Y. Gorodnichenko. 2013. “Fiscal Multipliers in Recession and Expansion”. In Fiscal Policy and the Financial Crisis, edited by Alesina, A. and F. Giavazazzi, 63-98. University of Chicago Press.
Batini, N., L. Eyraud, L. Forni and A. Weber. 2014. “Fiscal Multipliers: Size, Determinants, and Use in Macroeconomic Projections.” IMF Technical Notes and Manuals. Washington, DC: International Monetary Fund.
Bracco, J., L. Galeano, P. Juarros, D. Riera-Crichton and G. Vuletin. 2021. “Social Transfer Multipliers in Developed and Emerging Countries: The Role of Hand-to-Mouth Consumers.” Policy Research Working Paper, No. 9627. Wash-ington, DC: World Bank.
Breuer, L. E., J. Guajardo and T. Kinda. 2018. Realizing Indonesia's Economic Potential. Washington, DC: International Monetary Fund.
Canzoneri, M., F. Collard, H. Dellas and B. Diba. 2015. “Fiscal Multipliers in Recessions." The Economic Journal, Vol. 126, Issue 590, 75-108.
Carter, J., N. Diop, A. Nair and A. Sienaert. 2016. “Closing Indonesia’s infrastructure gap: the key role of fiscal policy reforms.” Macroeconomics & Fiscal Management: MFM Practice Notes. No. 13. Washington, DC: World Bank.
Gechert, S. and A. Rannenberg. 2018. “Which Fiscal Multipliers are Regime-Dependent? A Meta-Regression Analysis.” Journal of Economic Surveys, Vol. 32, No. 4, 1160-1182.
Izquierdo, A., J. P. Medina, D. Riera-Crichton, C. A. Vegh, and G. Vuletin. 2019. “Is the Public Investment Multiplier Higher in Developing Countries? An Empirical Investigation.” NBER Working Paper 26478.
Lewis, Christine. 2019. “Raising more public revenue in Indonesia in a growth- and equity-friendly way.” OECD Eco-nomics Department Working Papers, No. 1534, Paris: OECD Publishing.
Tang, H. C., P. Liu and E. C. Cheung. 2010. “Changing Impact of Fiscal Policy on Selected ASEAN Countries.” ADB Working Paper Series on Regional Economic Integration. No. 70. December 2010. Asian Development Bank.
World Bank Group. 2015. Indonesia Systematic Country Diagnostic: Connecting the Bottom 40 Percent to the Prosperity Generation. Washington, DC: World Bank.
World Bank Group. 2020. Indonesia Systematic Country Diagnostic Update. Washington, DC: World Bank
World Bank. 2020b. Indonesia Economic Prospects, July 2020: The Long Road to Recovery. Washington, DC: World Bank.
PART B Alatas, Vivi, and Lisa A. Cameron. 2008. “The Impact of Minimum Wages on Employment in a Low-Income Country:
A Quasi-Natural Experiment in Indonesia.” Industrial and Labor Relations Review 61 (2): 201–23.
Anas, Titik, Carlos Mangunsong, and Nur Afni Panjaitan. 2017. “Indonesian SME Participation in ASEAN Economic Integration.” Journal of Southeast Asian Economies 34 (1) 77–117.
Azevedo, Joao Pedro; Inchauste, Gabriela; Olivieri, Sergio; Saavedra, Jaime & Winkler, Hernan. 2013. Is Labor Income Responsible for Poverty Reduction? A Decomposition Approach. Policy Research Working Paper;No. 6414. World Bank, Washington, DC
Azis, Iwan. 2020. “Coronavirus-Driven Crisis: This Time Is Different.” Slide presentation at an Australian National University webinar, held on June 3.
E c o n o m i c R e c o v e r y a n d F o o d S e c u r i t y I n d o n e s i a E c o n o m i c P r o s p e c t s
J u n e 2 0 2 1 T H E W O R L D B A N K | B A N K D U N I A
48
Balleer, Almut, Britta Gehrke, Wolfgang Lechthaler, and Christian Merkl. 2016. “Does Short-time Work Save Jobs? A Business Cycle Analysis.” European Economic Review 84: 99-122.
Brummund, Peter, Christopher Mann, and Carlos Rodriguez-Castelan. 2016. “Job Quality and Poverty in Latin Amer-ica.” Policy Research Working Paper 7927, World Bank, Washington, DC.
Buvinic, M. et al. 2009. “Gender, Poverty and Demography: An Overview” The World Bank Economic Review, Vol 23, No 3: 2009, pp 347-369
Cali, Johnson, Perova and Ryandiansyah (forthcoming) “Economic Competitiveness Impacts of Preschools” World Bank Working Paper
Cameron, Lisa. 2018. Gender Inequality in the Indonesian Labour Market. July 24, 2018. Melbourne: University of Melbourne.
Cameron, Lisa, Diana Contreras Suárez, and William Rowell. 2018. “Female Labour Force Participation in Indonesia: Why Has It Stalled?” Bulletin of Indonesian Economic Studies. 55(2): 157 – 192.
Chowdhury, Iffat, Elizaveta Perova, Aneesh Mannava, and Hillary C. Johnson. 2018. “Gender Gap in Earnings in Vietnam: Why Do Vietnamese Women Work in Lower Paid Occupations?” Policy Research Working Paper 8433, World Bank, Washington, DC. https://ssrn.com/abstract=3176321.
Chun, Natalie, and Niny Khor. 2010. “Minimum Wages and Changing Wage Inequality in Indonesia.” ADB Economics Working Paper Series No. 196, Asian Development Bank, Manila.
Cunningham, Wendy. 2007. Minimum Wages and Social Policy in Latin America. Washington DC: World Bank Group.
Cunningham, Wendy, and Obert Pimhidzai. 2018. Vietnam's Future Jobs : Leveraging Mega-Trends for Greater Prosperity: Main Report (Vietnamese). Washington, DC: World Bank.
Del Carpio, Ximena, and Laura Pabón. 2014. Minimum Wage Policy: Lessons with a Focus on the ASEAN Region. Washington DC: World Bank.
Dervisevic et al. (forthcoming) “Impact of public preschools on fathers’ labor market outcomes” World Bank Working Paper
Duryea, Suzanne. 2012. “Economic Crisis and School-to-Work Transition.” In Children and Youth in Crisis: Protecting and Promoting Human Development in Times of Economic Shocks, edited by Mattias Lundberg and Alice Wuermli. Wash-ington, DC: World Bank.
Elder, Todd E. & Goddeeris, John H. & Haider, Steven J., 2010. "Unexplained gaps and Oaxaca-Blinder decomposi-tions," Labour Economics 17(1): 284-290.
Fagertun, Anette. 2017. “Labour in Paradise: Gender, Class and Social Mobility in the Informal Tourism Economy of Urban Bali, Indonesia.” Journal of Development Studies 53 (3): 331–45.
Gil Sander, Frederico, and Pui Shen Yoong. 2020. “Structural Transformation and Labor Productivity in Indonesia: Where Are All the Good Jobs?” Background Paper to Indonesia Jobs Report: Pathways Towards Middle-Class Jobs. Draft February 2020.
Halim, Daniel, Hillary Johnson and Elizaveta Perova. 2017. “Could Childcare Services Improve Women’s Labor Market Outcomes in Indonesia?” East Asia & Pacific Gender Policy Brief Issue 1, March 2017. Washington, DC: World Bank.
Halim, Daniel, Hillary Johnson and Elizaveta Perova. Forthcoming, 2021. “Preschool availability and women’s employ-ment: Evidence from Indonesia.” Economic Development and Cultural Change
Halim, Daniel, Sean Hambali, Ririn Purnamasari. Forthcoming. “Assessing the Gendered Impacts of the COVID-19 Pandemic on Indonesia’s Labor Market.”
E c o n o m i c R e c o v e r y a n d F o o d S e c u r i t y I n d o n e s i a E c o n o m i c P r o s p e c t s
J u n e 2 0 2 1 T H E W O R L D B A N K | B A N K D U N I A
49
Hallward-Driemeier, Mary, and Gaurav Nayyar. 2018. Trouble in the Making? The Future of Manufacturing-Led Development. Washington, DC: World Bank. doi:10.1596/978-1-4648-1174-6. License: Creative Commons Attribution CC BY 3.0 IGO.
Harrison, Ann, and Jason Scorse. 2010. “Multinationals and Anti-sweatshop Activism.” American Economic Review 100 (1): 247–73.
Hohberg, Maike, and Jann Lay. 2015. “The Impact of Minimum Wages on Informal and Formal Labor Market Out-comes: Evidence from Indonesia.” IZA Journal of Labor and Development 4 (1): 14.
International Monetary Fund (IMF). 2021. “Recessions and Recoveries in Labor Markets: Patterns, Policies, and Re-sponses to the Covid-19 Shock.” In World Economic Outlook: Managing Divergent Recoveries. Washington, DC: IMF.
Indraswari. 2006. “Women and Warung in an Urban Kampung.” PhD thesis, The Australian National University.
International Finance Corporation (IFC). 2016. Women-owned SMEs in Indonesia: A Golden Opportunity for Local Financial Institutions: Market Research Study. Jakarta, Indonesia: IFC.
Johnson, Hillary and Elizaveta Perova. Forthcoming. “Design differently: Addressing the challenges of female entre-preneurs in Southeast Asia,” Draft Paper, May 2021
Kuncoro, Ari. 2019. “Trends in the Manufacturing Sector under the Jokowi Presidency: Legacies of Past Administra-tions.” In The Indonesian Economy in Transition: Policy Challenges in the Jokowi Era and Beyond, edited by Hal Hill and Siwage Dharma Negara. Singapore: ISEAS.
Lain, Jonathan, Hamidah Alatas, and Diahhadi Setyonaluri Setyonaluri. 2020. “Women at Work in Indonesia.” Back-ground Paper to Indonesia Jobs Report: Pathways Towards Middle-Class Jobs. Draft March 2020.
Levy, Santiago. 2020. Suggestions for the Emergency. UNDP Latin America and the Caribbean. COVID-19 Policy Document Series.
Naidoo, Darian, Truman Packard, and Ilmiawan Auwalin. 2015. “Mobility, Scarring and Job Quality in Indonesia’s Labor Market.” Policy Research Working Paper 7484, World Bank, Washington, DC.
OECD (Organisation for Economic Co-operation and Development). 2018a. SME and Entrepreneurship Policy in Indonesia 2018. OECD Studies on SMEs and Entrepreneurship. Paris: OECD Publishing.
OECD. 2018b. Mapping of Investment Promotion Agencies in OECD Countries. Paris: OECD Publishing. www.oecd.org/in-vestment/Mapping-of-Investment-Promotion-Agencies-in-OECD-Countries.pdf.
OECD. 2019. SIGI 2019 Global Report: Transforming Challenges into Opportunities, Social Institutions and Gender Index. Paris: OECD Publishing. https://doi.org/10.1787/bc56d212-en.
Posadas, Josefina, and Nitish Sinha. Persistence of the added worker effect: Evidence using panel data from Indonesia. Mimeo, World Bank, Washington, DC, 2010.
Pradana, Abror Tegar, Grace Hadiwidjaja, and Josefina Posada. 2021. “Labor Market Dynamics during the COVID-19 Pandemic.” World Bank internal document.
Roberts, Mark, Frederico Gil Sander, and Sailesh Tiwari, eds. 2019. Time to ACT: Realizing Indonesia’s Urban Potential. Washington, DC: World Bank. doi:10.1596/978-1-4648-1389-4. License: Creative Commons Attribution CC BY 3.0 IGO
Rodrik, Dani, and Stefanie Stantcheva. 2021. “A Policy Matrix for Inclusive Prosperity.” National Bureau of Economic Research (NBER) Working Paper 28736, National Bureau of Economic Research, Cambridge, MA.
E c o n o m i c R e c o v e r y a n d F o o d S e c u r i t y I n d o n e s i a E c o n o m i c P r o s p e c t s
J u n e 2 0 2 1 T H E W O R L D B A N K | B A N K D U N I A
50
Sinha, J. N. (1965), Dynamics of female participation in economic activity in a developing economy, in World Population Conference, Belgrade (Vol. 4). Survey report
SMERU Research Institute, Prospera, UNDP (United Nations Development Programme), and the United Nations Children’s Fund (UNICEF). 2021. Executive Summary Report: The Social and Economic Impacts of Covid-19 on House-holds and Strategic Policy Recommendations for Indonesia.
Temenggung, Della, Adhi Saputro, Rullan Rinaldi & Deasy Pane. 2021. “Managing Recovery and Seizing Reform Op-portunities, Bulletin of Indonesian Economic Studies, 57:1, 1-28, DOI: 10.1080/00074918.2021.1908207
Weber, Michael, and Arvo Kudo. 2020. “Labor Regulations in Indonesia: An Assessment.” Social Protection and Jobs Global Practice. World Bank.
Wihardja, Maria Monica and Wendy Cunningham. Forthcoming 2021. Indonesia Jobs Report: Pathways Towards Middle-Class Jobs. Washington, DC: World Bank.
World Bank. 2012. World Development Report 2013: Jobs. Washington, DC. © World Bank. https://openknowledge.worldbank.org/handle/10986/11843 License: CC BY 3.0 IGO.
World Bank. 2019a. Aspiring Indonesia: Expanding the Middle Class. Washington, DC: World Bank.
World Bank. 2019b. The Promise of Education in Indonesia: Consultation Edition: Overview (English). Washington, DC: World Bank Group.
World Bank. 2020a. No One Left Behind: Rural Poverty in Indonesia. Washington, DC: World Bank.
World Bank. 2020b. World Development Report 2020: Trading for Development in the Age of Global Value Chains. Washington, DC: World Bank. doi:10.1596/978-1-4648-1457-0. License: Creative Commons Attribution CC BY 3.0 IGO.
World Bank, 2020c. Indonesia Country Gender Assessment: Investing in Opportunities for Women Washington DC: World Bank
World Bank. 2020d. “Covid-19 Impact on Firms in Indonesia: Results from the Covid-19 Business Pulse Survey, Round 2 (October 2020).” World Bank.
World Bank. 2020e. “The Jobs Response to Covid-19 in East Asia Pacific.” Note prepared by Social Protection and Jobs Global Practice (version 05/27/2020).
World Bank. 2020f. Indonesia Economic Prospects: The Long Road to Recovery. July 2020.
World Bank. 2020. Protecting People and Economies : Integrated Policy Responses to COVID-19. World Bank, Wash-ington, DC. © World Bank. https://openknowledge.worldbank.org/handle/10986/33770 License: CC BY 3.0 IGO.”
World Bank. 2021a. “Covid-19 Impact on Firms in Indonesia: Results from the Covid-19 Business Pulse Survey, Round 3 (March 2021).” World Bank.
World Bank. 2021b. “Insights from the Covid-19 Digital Merchant Survey 2021.” World Bank.
World Bank. 2021c. Program Document for a Proposed Loan: Indonesia Investment and Trade Development Policy Loan.
World Bank. Forthcoming. “Growth prospects for the self-employed / micro firms in Indonesia.” Presentation as part of a series of work on firm productivity, innovation, and entrepreneurship in Indonesia. Findings will be pre-sented in a final report: the innovation Public Expenditure Review.
World Bank. Forthcoming 2021. Digital Economy and Inclusion in Indonesia. Washington, DC: World Bank.
E c o n o m i c R e c o v e r y a n d F o o d S e c u r i t y I n d o n e s i a E c o n o m i c P r o s p e c t s
J u n e 2 0 2 1 T H E W O R L D B A N K | B A N K D U N I A
51
World Bank and Bappenas. 2021. “Indonesia’s Occupational Employment Outlook 2020.” Social Protection and Jobs Global Practice, The World Bank.
World Bank and CMEA (Coordinating Ministry for Economic Affairs). 2020. Indonesia’s Critical Occupations List 2018. Social Protection and Jobs Global Practice, World Bank. http://documents.worldbank.org/cu-rated/en/763611585857010121/Indonesias-Critical-Occupations-List-2018-Technical-Report
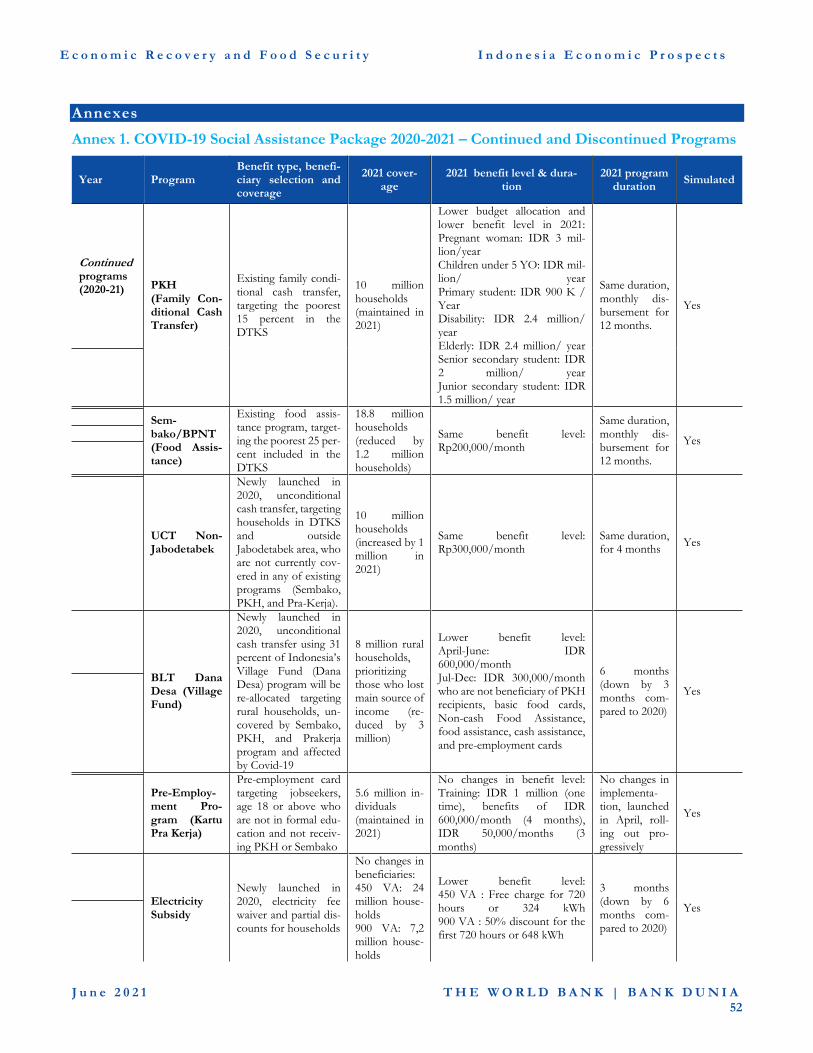
E c o n o m i c R e c o v e r y a n d F o o d S e c u r i t y I n d o n e s i a E c o n o m i c P r o s p e c t s
J u n e 2 0 2 1 T H E W O R L D B A N K | B A N K D U N I A
52
Annexes
Annex 1. COVID-19 Social Assistance Package 2020-2021 – Continued and Discontinued Programs
Year Program Benefit type, benefi-ciary selection and coverage
2021 cover-age
2021 benefit level & dura-tion
2021 program duration
Simulated
Continued programs (2020-21) PKH
(Family Con-ditional Cash Transfer)
Existing family condi-tional cash transfer, targeting the poorest 15 percent in the DTKS
10 million households (maintained in 2021)
Lower budget allocation and lower benefit level in 2021: Pregnant woman: IDR 3 mil-lion/year Children under 5 YO: IDR mil-lion/ year Primary student: IDR 900 K / Year Disability: IDR 2.4 million/ year Elderly: IDR 2.4 million/ year Senior secondary student: IDR 2 million/ year Junior secondary student: IDR 1.5 million/ year
Same duration, monthly dis-bursement for 12 months.
Yes
Sem-bako/BPNT (Food Assis-tance)
Existing food assis-tance program, target-ing the poorest 25 per-cent included in the DTKS
18.8 million households (reduced by 1.2 million households)
Same benefit level: Rp200,000/month
Same duration, monthly dis-bursement for 12 months.
Yes
UCT Non-Jabodetabek
Newly launched in 2020, unconditional cash transfer, targeting households in DTKS and outside Jabodetabek area, who are not currently cov-ered in any of existing programs (Sembako, PKH, and Pra-Kerja).
10 million households (increased by 1 million in 2021)
Same benefit level: Rp300,000/month
Same duration, for 4 months
Yes
BLT Dana Desa (Village Fund)
Newly launched in 2020, unconditional cash transfer using 31 percent of Indonesia’s Village Fund (Dana Desa) program will be re-allocated targeting rural households, un-covered by Sembako, PKH, and Prakerja program and affected by Covid-19
8 million rural households, prioritizing those who lost main source of income (re-duced by 3 million)
Lower benefit level: April-June: IDR 600,000/month Jul-Dec: IDR 300,000/month who are not beneficiary of PKH recipients, basic food cards, Non-cash Food Assistance, food assistance, cash assistance, and pre-employment cards
6 months (down by 3 months com-pared to 2020)
Yes
Pre-Employ-ment Pro-gram (Kartu Pra Kerja)
Pre-employment card targeting jobseekers, age 18 or above who are not in formal edu-cation and not receiv-ing PKH or Sembako
5.6 million in-dividuals (maintained in 2021)
No changes in benefit level: Training: IDR 1 million (one time), benefits of IDR 600,000/month (4 months), IDR 50,000/months (3 months)
No changes in implementa-tion, launched in April, roll-ing out pro-gressively
Yes
Electricity Subsidy
Newly launched in 2020, electricity fee waiver and partial dis-counts for households
No changes in beneficiaries: 450 VA: 24 million house-holds 900 VA: 7,2 million house-holds
Lower benefit level: 450 VA : Free charge for 720 hours or 324 kWh 900 VA : 50% discount for the first 720 hours or 648 kWh
3 months (down by 6 months com-pared to 2020)
Yes
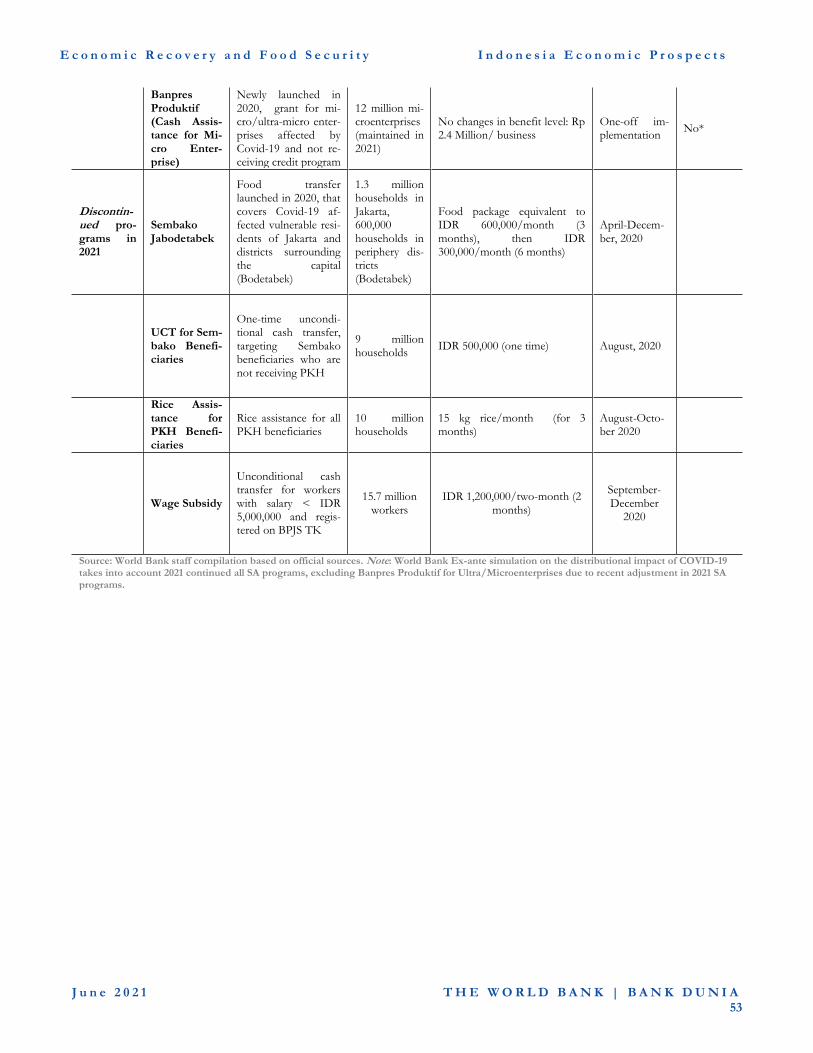
E c o n o m i c R e c o v e r y a n d F o o d S e c u r i t y I n d o n e s i a E c o n o m i c P r o s p e c t s
J u n e 2 0 2 1 T H E W O R L D B A N K | B A N K D U N I A
53
Banpres Produktif (Cash Assis-tance for Mi-cro Enter-prise)
Newly launched in 2020, grant for mi-cro/ultra-micro enter-prises affected by Covid-19 and not re-ceiving credit program
12 million mi-croenterprises (maintained in 2021)
No changes in benefit level: Rp 2.4 Million/ business
One-off im-plementation
No*
Discontin-ued pro-grams in 2021
Sembako Jabodetabek
Food transfer launched in 2020, that covers Covid-19 af-fected vulnerable resi-dents of Jakarta and districts surrounding the capital (Bodetabek)
1.3 million households in Jakarta, 600,000 households in periphery dis-tricts (Bodetabek)
Food package equivalent to IDR 600,000/month (3 months), then IDR 300,000/month (6 months)
April-Decem-ber, 2020
UCT for Sem-bako Benefi-ciaries
One-time uncondi-tional cash transfer, targeting Sembako beneficiaries who are not receiving PKH
9 million households
IDR 500,000 (one time) August, 2020
Rice Assis-tance for PKH Benefi-ciaries
Rice assistance for all PKH beneficiaries
10 million households
15 kg rice/month (for 3 months)
August-Octo-ber 2020
Wage Subsidy
Unconditional cash transfer for workers with salary < IDR 5,000,000 and regis-tered on BPJS TK
15.7 million workers
IDR 1,200,000/two-month (2 months)
September-December
2020
Source: World Bank staff compilation based on official sources. Note: World Bank Ex-ante simulation on the distributional impact of COVID-19 takes into account 2021 continued all SA programs, excluding Banpres Produktif for Ultra/Microenterprises due to recent adjustment in 2021 SA programs.
E c o n o m i c R e c o v e r y a n d F o o d S e c u r i t y I n d o n e s i a E c o n o m i c P r o s p e c t s
J u n e 2 0 2 1 T H E W O R L D B A N K | B A N K D U N I A
54
Annex 2. Estimates of fiscal multipliers for Indonesia
To assess the effects of public expenditure composition on GDP, a Structural Vector Autoregression model is con-
structed for the period of 2005Q1-2019Q4 period with four variables (quarterly series, seasonally adjusted, deflated by
GDP deflator, in dlog): (1) Net Taxes (tax receipts net of public transfers); (2) Recurrent Expenditure; (3) Capital Ex-
penditure; (4) GDP.
The structural presentation of a VAR model is:
A0Xt = A(L)Xt-1 + Bεt (1)
A0 is the matrix of contemporaneous impact between the variables, Xt is a 4x1 vector of the 4 variables. A(L) is 4x4
matrix of lag-length L, representing impulse-response functions of the shocks to the elements of Xt. B is a 4x4 matrix
that captures the linear relations between structural shocks and εt is a 4x1 vector of structural shocks.
As a first step for estimating the SVAR model, the reduced form is obtained by multiplying the inverse matrix A0-1.
Xt = C(L)Xt-1 + ut (2)
where C(L) = A0-1 A(L) and ut = A0
-1 Bεt
The relation between structural shocks and reduced form shocks is:
A0ut = Bεt (3)
The variables are ordered as follows (from exogenous to endogenous): (1) Net Taxes (tax receipts net of public trans-
fers), which are assumed not to be contemporaneously affected by other shocks; (2) Recurrent Expenditure, assumed
to be contemporaneously affected by net taxes; (3) Capital Expenditure, assumed to be contemporaneously affected by
net taxes and recurrent expenditure; and (4) GDP, assumed to be contemporaneously affected by all variables:
These assumptions show the relationships between reduced shocks only in the first period, while later every shock can
be affected by any other shock.
With these assumptions imposed, A matrix is the following:
ntax rec cap gdp
ntax 1 0 0 0
rec NA 1 0 0
cap NA NA 1 0
gdp NA NA NA 1
Model estimates find overall small fiscal multipliers for Indonesia as shown in the graphs below. Recurrent expenditure
and net taxes have small positive multiplier effects on growth in the short term while the multiplier effect of capital
spending on the other hand is not significant in the short-term. This could be due to several reasons including high
propensity to import, informality, and public expenditure and revenue administration inefficiencies (WBG Public Ex-
penditure Review, 2020), all of which dampen the multiplier.
Fiscal multiplier estimates in the literature vary significantly but those for emerging market economies, such as Indone-
sia, have tended to be relatively small (for instance, see discussion in Batini et al. (2014) and Tang, Liu and Cheung
(2010)). Generally, they have been found to be larger during downturns (Auerbach and Gorodnichenko, 2013; Can-
zoneri et al., 2015; Gechert and Rannenberg, 2018). Those for public investment tend to be higher in developing coun-
tries and relatively more persistent, cautioning against sharp cuts to the capital budget (Izquierdo et al., 2019). This is
especially pertinent in Indonesia where infrastructure gaps are large (World Bank, 2015; Carter et al., 2016; World Bank,
2020b); the reason for insignificant multiplier effects above in the case of Indonesia might be due to the historically low
levels of government capital expenses and the exclusion of SOE capital investments in above estimates. Multipliers for
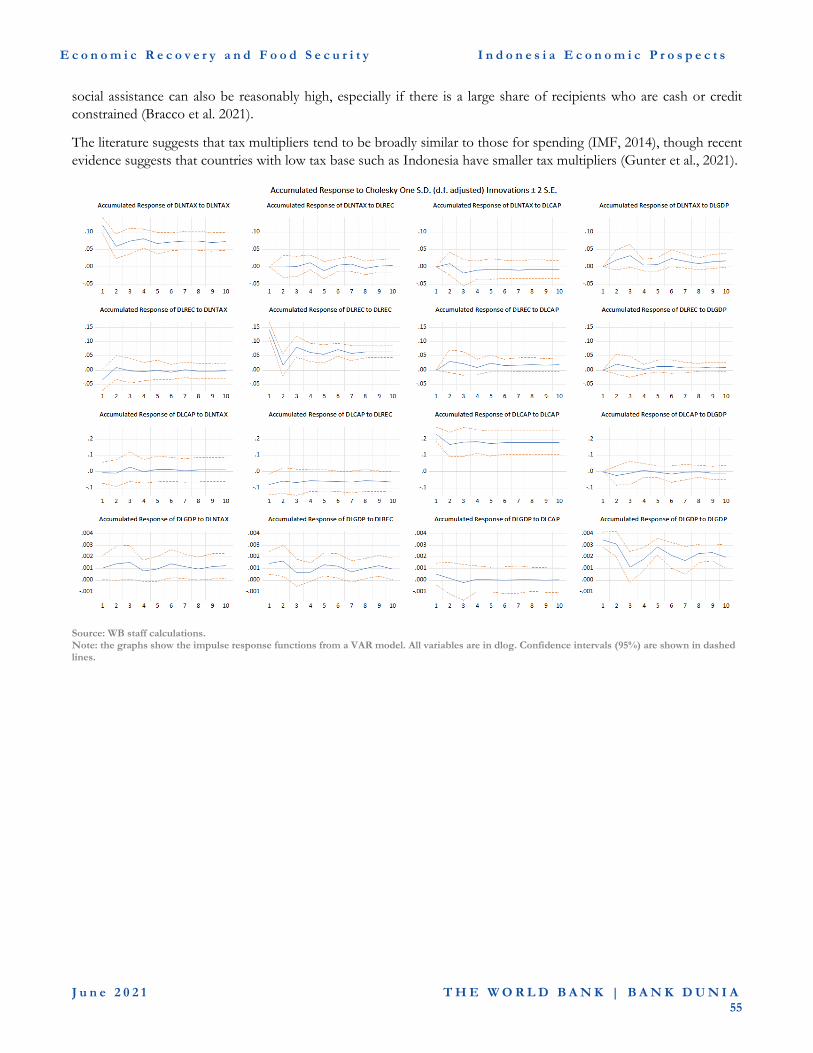
E c o n o m i c R e c o v e r y a n d F o o d S e c u r i t y I n d o n e s i a E c o n o m i c P r o s p e c t s
J u n e 2 0 2 1 T H E W O R L D B A N K | B A N K D U N I A
55
social assistance can also be reasonably high, especially if there is a large share of recipients who are cash or credit
constrained (Bracco et al. 2021).
The literature suggests that tax multipliers tend to be broadly similar to those for spending (IMF, 2014), though recent
evidence suggests that countries with low tax base such as Indonesia have smaller tax multipliers (Gunter et al., 2021).
Source: WB staff calculations. Note: the graphs show the impulse response functions from a VAR model. All variables are in dlog. Confidence intervals (95%) are shown in dashed lines.