
Individual differences in premotor and motor recruitment ... · Individual differences in premotor...
13
Neuropsychologia 50 (2012) 1380–1392 Contents lists available at SciVerse ScienceDirect Neuropsychologia j ourna l ho me pag e: ww w.elsevier.com/locate/neuropsychologia Individual differences in premotor and motor recruitment during speech perception Gayaneh Szenkovits ∗ , Jonathan E. Peelle 1 , Dennis Norris, Matthew H. Davis Medical Research Council, Cognition and Brain Sciences Unit, 15 Chaucer Road, Cambridge CB2 7EF, England, UK a r t i c l e i n f o Article history: Received 29 June 2011 Received in revised form 13 December 2011 Accepted 25 February 2012 Available online 12 April 2012 Keywords: Speech perception Dual stream model Premotor cortex Motor cortex Individual differences fMRI a b s t r a c t Although activity in premotor and motor cortices is commonly observed in neuroimaging studies of spoken language processing, the degree to which this activity is an obligatory part of everyday speech comprehension remains unclear. We hypothesised that rather than being a unitary phenomenon, the neural response to speech perception in motor regions would differ across listeners as a function of individual cognitive ability. To examine this possibility, we used functional magnetic resonance imaging (fMRI) to investigate the neural processes supporting speech perception by comparing active listening to pseudowords with matched tasks that involved reading aloud or repetition, all compared to acoustically matched control stimuli and matched baseline tasks. At a whole-brain level there was no evidence for recruitment of regions in premotor or motor cortex during speech perception. A focused region of interest analysis similarly failed to identify significant effects, although a subset of regions approached signifi- cance, with notable variability across participants. We then used performance on a battery of behavioural tests that assessed meta-phonological and verbal short-term memory abilities to investigate the reasons for this variability, and found that individual differences in particular in low phonotactic probability pseudoword repetition predicted participants’ neural activation within regions in premotor and motor cortices during speech perception. We conclude that normal listeners vary in the degree to which they recruit premotor and motor cortex as a function of short-term memory ability. This is consistent with a resource-allocation approach in which recruitment of the dorsal speech processing pathway depends on both individual abilities and specific task demands. © 2012 Elsevier Ltd. All rights reserved. 1. Introduction A prevailing question in cognitive science is the degree to which the cognitive and neural systems engaged in a particular task are consistent across individuals. In most domains there is an assumption that these systems are relatively uniform, which enables the construction of generalisable neuroanatomically con- strained models of cognitive processes in both health and disease. However, there is an increasing awareness of the role that individ- ual differences in cognitive ability play in this process: because the availability of cognitive and neural resources varies across indi- viduals, the particular instantiation of neural support for a given task will also vary (Seghier & Price, 2009). In the current study we examine how these individual differences manifest in speech pro- cessing, with a particular focus on the role of the motor system in speech perception. Although studies of speech perception generally ∗ Corresponding author. Tel.: +44 1223 273 631; fax: +44 1223 359 062. E-mail address: [email protected] (G. Szenkovits). 1 Present address: Department of Neurology, University of Pennsylvania, Philadelphia, USA. reveal some involvement of premotor and motor regions (Devlin & Aydelott, 2009) there remains disagreement about whether this activity is an obligatory part of speech processing (D’Ausilio et al., 2009; Meister, Wilson, Deblieck, & Wu, 2007; Wilson, Saygin, & Sereno, 2004), or might instead reflect other associated processes (Hickok, 2010; Hickok et al., 2008; Scott & Wise, 2004; Scott, Mcgettigan, & Eisner, 2009). We hypothesised that inter-individual variability in cognitive ability may be one factor that contributes to the seemingly inconsistent pattern of results present in the litera- ture. In the current study, we used a set of pseudoword processing tasks to investigate the role of motor areas in speech perception, and most importantly, whether the level of activity could be related to individual differences in behavioural measures. Early models of spoken language processing suggested that sen- sory representations of speech interface with at least two systems: an articulatory motor system and a conceptual semantic system (e.g. Lichtheim, 1885/2006). This idea remains at the heart of con- temporary neurocognitive models of speech processing (Hickok & Poeppel, 2007; Scott & Johnsrude, 2003). According to these dual-stream accounts, acoustic processing (in Heschl’s gyrus and the superior temporal gyrus) is followed by at least two diverg- ing processing streams. The ventral stream that projects towards 0028-3932/$ – see front matter © 2012 Elsevier Ltd. All rights reserved. doi:10.1016/j.neuropsychologia.2012.02.023
Transcript of Individual differences in premotor and motor recruitment ... · Individual differences in premotor...
Ip
GM
a
ARR1AA
KSDPMIf
1
wtaesHuavtecs
P
0d
Neuropsychologia 50 (2012) 1380– 1392
Contents lists available at SciVerse ScienceDirect
Neuropsychologia
j ourna l ho me pag e: ww w.elsev ier .com/ locate /neuropsychologia
ndividual differences in premotor and motor recruitment during speecherception
ayaneh Szenkovits ∗, Jonathan E. Peelle1, Dennis Norris, Matthew H. Davisedical Research Council, Cognition and Brain Sciences Unit, 15 Chaucer Road, Cambridge CB2 7EF, England, UK
r t i c l e i n f o
rticle history:eceived 29 June 2011eceived in revised form3 December 2011ccepted 25 February 2012vailable online 12 April 2012
eywords:peech perceptionual stream modelremotor cortexotor cortex
ndividual differencesMRI
a b s t r a c t
Although activity in premotor and motor cortices is commonly observed in neuroimaging studies ofspoken language processing, the degree to which this activity is an obligatory part of everyday speechcomprehension remains unclear. We hypothesised that rather than being a unitary phenomenon, theneural response to speech perception in motor regions would differ across listeners as a function ofindividual cognitive ability. To examine this possibility, we used functional magnetic resonance imaging(fMRI) to investigate the neural processes supporting speech perception by comparing active listening topseudowords with matched tasks that involved reading aloud or repetition, all compared to acousticallymatched control stimuli and matched baseline tasks. At a whole-brain level there was no evidence forrecruitment of regions in premotor or motor cortex during speech perception. A focused region of interestanalysis similarly failed to identify significant effects, although a subset of regions approached signifi-cance, with notable variability across participants. We then used performance on a battery of behaviouraltests that assessed meta-phonological and verbal short-term memory abilities to investigate the reasons
for this variability, and found that individual differences in particular in low phonotactic probabilitypseudoword repetition predicted participants’ neural activation within regions in premotor and motorcortices during speech perception. We conclude that normal listeners vary in the degree to which theyrecruit premotor and motor cortex as a function of short-term memory ability. This is consistent with aresource-allocation approach in which recruitment of the dorsal speech processing pathway depends onboth individual abilities and specific task demands.. Introduction
A prevailing question in cognitive science is the degree tohich the cognitive and neural systems engaged in a particular
ask are consistent across individuals. In most domains there isn assumption that these systems are relatively uniform, whichnables the construction of generalisable neuroanatomically con-trained models of cognitive processes in both health and disease.owever, there is an increasing awareness of the role that individ-al differences in cognitive ability play in this process: because thevailability of cognitive and neural resources varies across indi-iduals, the particular instantiation of neural support for a givenask will also vary (Seghier & Price, 2009). In the current study we
xamine how these individual differences manifest in speech pro-essing, with a particular focus on the role of the motor system inpeech perception. Although studies of speech perception generally∗ Corresponding author. Tel.: +44 1223 273 631; fax: +44 1223 359 062.E-mail address: [email protected] (G. Szenkovits).
1 Present address: Department of Neurology, University of Pennsylvania,hiladelphia, USA.
028-3932/$ – see front matter © 2012 Elsevier Ltd. All rights reserved.oi:10.1016/j.neuropsychologia.2012.02.023
© 2012 Elsevier Ltd. All rights reserved.
reveal some involvement of premotor and motor regions (Devlin &Aydelott, 2009) there remains disagreement about whether thisactivity is an obligatory part of speech processing (D’Ausilio et al.,2009; Meister, Wilson, Deblieck, & Wu, 2007; Wilson, Saygin, &Sereno, 2004), or might instead reflect other associated processes(Hickok, 2010; Hickok et al., 2008; Scott & Wise, 2004; Scott,Mcgettigan, & Eisner, 2009). We hypothesised that inter-individualvariability in cognitive ability may be one factor that contributes tothe seemingly inconsistent pattern of results present in the litera-ture. In the current study, we used a set of pseudoword processingtasks to investigate the role of motor areas in speech perception,and most importantly, whether the level of activity could be relatedto individual differences in behavioural measures.
Early models of spoken language processing suggested that sen-sory representations of speech interface with at least two systems:an articulatory motor system and a conceptual semantic system(e.g. Lichtheim, 1885/2006). This idea remains at the heart of con-temporary neurocognitive models of speech processing (Hickok
& Poeppel, 2007; Scott & Johnsrude, 2003). According to thesedual-stream accounts, acoustic processing (in Heschl’s gyrus andthe superior temporal gyrus) is followed by at least two diverg-ing processing streams. The ventral stream that projects towards
sychol
tstsjairs(ptt2
ipp2elsepiwnpt(2(mcmto–sr
woe(Hai(poeclmnuDL
aceaTC
G. Szenkovits et al. / Neurop
he left anterior and/or posterior inferior temporal regions, anderves as sound-to-meaning interface by mapping sound represen-ations of speech onto conceptual representations. And the dorsaltream that projects towards the left posterior temporo-parietalunction, left supramarginal gyrus, premotor and motor cortices,nd left inferior frontal gyrus, and serves as an auditory–motornterface by mapping speech sounds onto articulatory/motor rep-esentations. According to a traditional interpretation of this dualtream account, tasks selectively involving speech comprehensione.g., listening to meaningful speech) are proposed to be primarilyrocessed in the ventral stream, while tasks linking speech percep-ion and production (e.g., repeating back heard speech) are thoughto primarily engage the dorsal stream (Hickok & Poeppel, 2004,007; Saur et al., 2008; Scott and Johnsrude, 2003).
In recent years, however, a number of functional MRI stud-es have challenged this traditional view by reporting dorsalathway involvement in speech perception tasks, even when noroduction component was required (Osnes, Hugdahl, & Specht,011; Pulvermüller et al., 2006; Wilson & Iacoboni, 2006; Wilsont al., 2004). These studies focused in particular on regions ofeft premotor and motor cortex that are the output of the dor-al speech pathway. For example, an influential study by Wilsont al. (2004) reported neural activation in the vicinity of therecentral gyrus (and premotor cortex) during passive listen-
ng to repeated consonant-vowel pseudowords compared to rest,hereas listening to a non-speech sound (a bell) did not triggereural responses in the same regions. More direct evidence forremotor and motor cortex recruitment during speech percep-ion comes from studies using Transcranial Magnetic StimulationTMS) to either facilitate (D’Ausilio et al., 2009; Fadiga et al.,002; Watkins, Strafella, & Paus, 2003) or to temporarily disruptMeister et al., 2007; Möttönen & Watkins, 2009) processing in
otor regions. Furthermore, TMS has been also shown to affect per-eptual discrimination of speech sounds in an articulator-specificanner (D’Ausilio et al., 2009; Möttönen & Watkins, 2009). Taken
ogether, the above findings have led some to conclude that regionsf the dorsal pathway – namely, premotor and motor cortices
are critical for speech perception, and that when listening topeech both dorsal and ventral processing streams are necessarilyecruited.
Despite these provocative findings, however, the degree tohich premotor and motor processing is a necessary component
f speech perception is still unclear, and recent reviews of the lit-rature have called for caution when interpreting the above resultsHickok, 2008, 2009; Hickok and Poeppel, 2007; Lotto, Hickok, &olt, 2009; Scott et al., 2009). One reason for caution is that thebove findings are not always replicated; for example, in a repet-tive TMS study of premotor regions, Sato, Tremblay, and Gracco2009) reported slower phoneme discrimination only (requiringhonemic segmentation) but no effect on phoneme identificationr syllable discrimination (Sato et al., 2009). In addition, sev-ral methodological points are consistently highlighted. First, theritical contrasts generally fail to show activation at a correctedevel of significance. Second, functional imaging studies reporting
otor activation have not made comparisons with a well-matchedon-speech condition, and in studies using better controlled stim-li, there is little evidence for motor involvement (Obleser, Wise,resner, & Scott, 2007; Rodd, Davis, & Johnsrude, 2005; Rodd,onge, Randall, & Tyler, 2010; Scott, Blank, Rosen, & Wise, 2000).
Perhaps most importantly, many studies that have found motorctivation during speech perception have used phoneme identifi-ation or discrimination tasks (e.g. Möttönen & Watkins, 2009; Sato
t al., 2009; Yuen, Davis, Brysbaert, & Rastle, 2009) which requirettending to sublexical elements of speech (such as phonemes).hese complex meta-phonological tasks (see Morais, Bertelson,ary, & Alegria, 1986; Morais, Cary, Alegria, & Bertelson, 1979;ogia 50 (2012) 1380– 1392 1381
Morais & Kolinsky, 1994) involve multiple processes (e.g. segmen-tation of speech into its constituent elements, decision makingand/or categorisation), which may in turn depend on speech pro-duction or verbal short-term memory processes. For example,behavioural studies have found that articulatory suppression slowsrhyme judgements but not homophony judgements of writtenwords (Besner, 1987; Besner, Davies, & Daniels, 1981; Brown, 1987;Richardson, 1987), implying that subvocal articulatory processesmay be involved in tasks involving manipulation of sublexicalrepresentations. More generally, it is well established that verbalshort-term memory is supported by subvocal rehearsal processes(Baddeley & Hitch, 1974; Baddeley, Gathercole, Papagno, & Degli,1998) and that these are mediated by the dorsal auditory path-way (Buchsbaum, Olsen, Koch, & Berman, 2005). Based on thesefindings, Hickok and colleagues suggest that the recruitment of sub-vocal rehearsal processes could explain much of the evidence formotor involvement in speech perception (Buchsbaum, Hickok, &Humphries, 2001; Hickok & Buchsbaum, 2003; Hickok, Buchsbaum,Humphries, & Muftuler, 2003).
Finally, consistent with this task-based explanation for pre-motor and motor activity, other studies have shown motorinvolvement in challenging listening conditions such as listeningin noise, or using degraded or phonemically ambiguous stimuli(D’Ausilio et al., 2009; Davis & Johnsrude, 2003; Dufor, Serniclaes,Sprenger-Charolles, & Demonet, 2009; Osnes et al., 2011). Suchchallenging listening situations may similarly recruit short-termmemory processes, and perhaps rely on a form of analysis-by-synthesis which recruits motor regions (Davis & Johnsrude,2007; Skipper, van Wassenhove, Nusbaum, & Small, 2007; vanWassenhove, Grant, & Poeppel, 2005). In the same line, Callan,Callan, Gamez, Sato, and Kawato (2010) have reported thatincreased accuracy of phoneme identification in noise was asso-ciated with increased activation in the ventral part of the premotorcortex. Taken together, these findings might suggest that the func-tion of the motor system in speech perception may be contingentupon perceptual ambiguity (Callan et al., 2010; Sato et al., 2009).While these additional task related cognitive processes are likely torecruit dorsal networks, they go beyond those brain regions asso-ciated with natural speech perception (Hickok & Poeppel, 2000;Osnes et al., 2011; Scott et al., 2009).
In this paper, we return to the question of whether premotorand motor cortices are necessarily activated during speech percep-tion. To minimise ventral stream engagement and lexical/semanticeffects, we use phonotactically legal pseudowords; thus, we oper-ationally define speech perception as encompassing prelexicalphonological processing. We avoid complex meta-phonologicaltasks and use a simple, one-back identity judgement with norequirement for either overt speech production or phonologicalsegmentation, and minimal short-term memory load. We comparethe neural activation required for this task to that in a one-backidentity judgement involving complex non-speech stimuli, acous-tically well matched to the speech stimuli on both spectral andamplitude characteristics. We also included two additional pro-duction tasks known to rely on the dorsal pathway (and for whichwe are therefore confident will show activation in premotor andmotor cortices): reading aloud, and repeating heard pseudowords.These production tasks allow us to localise dorsal pathway regionsin our cohort of participants and verify the efficacy of our generalparadigm independently of our speech perception task.
Most important for the current study is our approach of explic-itly examining individual differences in the degree of premotor andmotor activation during speech perception. As discussed above,
speech perception is often tested by phoneme identification ordiscrimination tasks. These tasks arguably involve segmentation,short-term memory, and subvocal rehearsal – likely supported bythe dorsal stream. Moreover, all studies to date have conducted
1 sycho
gjseadstpwrania
2
2
paSNdfavP
2
2
tmuSut
pdtl–tr
epardbt(tiT
oswlbtattiattoM
382 G. Szenkovits et al. / Neurop
roup analyses in which mean activation differences across sub-ects are compared to the null hypothesis of zero activation forpeech compared to non-speech perception. We therefore aim toxamine, for the first time, whether participants show linked vari-bility between behaviour (as measured by tasks engaging theorsal stream) and neural measure of speech perception. To doo, we will first characterise participants’ behaviour separately onasks that are suggested to rely on the dorsal stream: namely,honological awareness and verbal short-term memory tasks. Weill then relate the observed variability in performance to neu-
al activation during the speech perception task that (as describedbove) is largely independent of segmental phonological aware-ess and short-term memory. Our prediction is that neural activity
n the dorsal stream will reflect individual differences in cognitivebility.
. Materials and methods
.1. Participants
Twenty-one healthy, right-handed native speakers of British English partici-ated in the study (9 men, average age 26.8 years, SD = 3.1, and 12 women, averagege 22.8 years, SD = 7.9). They were recruited through the MRC Cognition and Brainciences Unit volunteer panel, and received £10 per hour for their participation.one of the participants reported any history of neurological, speech, or hearingisorder. All showed normal MRI structural scans. One participant was excludedrom the analyses due to excessive head motion; the fMRI analyses reported herere on the remaining 20 participants. All participants were fully briefed and pro-ided written informed consent. Ethical approval was granted by the Cambridgesychology Research Ethics Committee.
.2. Stimuli and experimental design
.2.1. Behavioural tasks to predict neural activityWe used a series of behavioural tests conducted outside the scanner to charac-
erise participants’ behaviour on complex speech processing and verbal short-termemory tasks frequently used in the literature, with the goal of linking individ-
al abilities in these domains to neural activation in premotor and motor regions.pecifically, we assessed meta-phonological skills (the ability to consciously manip-late and evaluate speech segments) and verbal short-term memory capacity usinghe following tasks.
Spoonerisms task. We used the spoonerisms task to assess participants’ meta-honological ability. The spoonerisms task consisted of 40 pairs of spokenisyllabic English nouns with matching stress pattern. For half of the trials, par-icipants were instructed to swap the initial sound of each word (e.g. ‘chemist –eader’ → [ ]) and for the other half to swap the final sound (e.g. ‘fetish
scalpel’ → [ ]). In both conditions participants were asked to main-ain the original order of the words. Responses were recorded, and percent correctesponses were averaged over the initial- and final-swap trials.
Auditory and visual digit spans tasks. The auditory digit span task is a comput-rised version of the WAIS-III subtest (Wechsler, 1998) which we used to help assessarticipants’ verbal short term memory ability. Sequences of digits were presentedurally at a rate of 1 item per second. The task consisted of forward and backwardepetitions. The sequence length is increased from two digits per sequence to nineigits per sequence in the forward condition and from two to eight digits in theackward condition. Participants were presented with two trials per length; theest finished when participants failed on both trials. The sum of all correct responsessequences repeated correctly) provided participants’ scores. The visual digit spanask mirrored the auditory one, with the difference that the digits were presentedn the middle of the screen for 500 ms, one by one, at a rate of 1 item every 500 ms.he same scoring was used as for the auditory digit task.
Pseudoword repetition task. As an additional measure of verbal short-term mem-ry we used a pseudoword repetition task. In this task, participants had to repeatequences of between two and six monosyllabic pseudowords. Items in the sequenceere presented quickly, with an inter syllable interval of 100 ms. Since pseudowords
ack long-term memory representations, pseudoword span should predominantlye driven by the capacity of phonological store and the efficiency of the articula-ory rehearsal (Baddeley, 1998; Baddeley & Hitch, 1974) therefore providing a moreccurate measure of verbal short-term memory capacity than digit or word spanasks (Cowan, 2001; Gathercole & Baddeley, 1990). Note that although pseudowordshemselves have no long-term memory representations, memory for pseudowordss nevertheless sensitive to linguistic knowledge about the phonological structure of
given language (i.e., phonotactic probability). Previous studies have demonstratedhat pseudowords composed of commonly co-occurring segments (high phonotac-ic probability) are repeated faster and more accurately than pseudoword composedf less common segments (low phonotactic probability) (Edwards, Beckman, &unson, 2004; Vitevitch & Luce, 2005), and are also remembered better (Gathercole,
logia 50 (2012) 1380– 1392
Frankish, Pickering, & Peaker, 1999). In order to investigate the extent to whichvariability in short-term memory performance is influenced by language specificconstraints, we included both high and low phonotactic probability pseudowords.We selected 52 consonant–vowel–consonant (CVC) pseudowords from (Gathercoleet al., 1999). To assess the effects of information load on memory performance,and maximise variability on the task, sequence length was parametrically manip-ulated. Sequence length increased over successive presentation blocks beginningwith sequences of two pseudowords and ending with sequences of six pseudowords.Each test consisted of 5 blocks of 12 trials (a total of 60 trials). At the end of eachsequence participants heard an auditory cue to begin verbal recall. Participants wereinstructed to repeat each sequence in the correct order after the cue. In addition toonline coding, spoken responses were also recorded. Participants were allowed tohave a short break between the blocks. High and low phonotactic probability pseu-doword repetitions were administered separately. Each test lasted approximately15 min. The order of the tests as well as the order of the experimental session (beforeor after fMRI) was counterbalanced across participants.
All stimuli were recorded by a native female speaker of Southern British English,at 44,100 Hz sampling rate, and were edited offline using Adobe Audition (AdobeSystem Corporation, San Jose, CA). Experiments were programmed and run usingE-Prime® (Psychology Software Tools, Inc., Pittsburgh, PA) and DMDX (Forster &Forster, 2003) software.
2.2.2. Imaging tasksIn order to investigate the role of premotor and motor regions in speech percep-
tion, we used three tasks. Two of the tasks (reading and repetition) required speechproduction, which should involve obligatory premotor and motor cortex activation.The third task, a perception task using the same materials, was our critical testcondition.
In order to minimise lexical and semantic effects and to tap networks underlingphonological input and output systems, all stimuli in the imaging experiments wereCVC pseudowords. A total of 360 pseudowords were created and were recorded bytwo speakers (one male and one female, both native speakers of British English)at 44,100 Hz sampling rate. For the non-speech baseline control conditions, thepseudoword recordings were passed through a single-channel pulse-train vocoder(Deeks & Carlyon, 2004) implemented using Praat software (www.praat.org). Thisprocedure generated a buzzy sound (a pulse train) filtered to have the same long-term spectrum and amplitude envelope as the original pseudowords, and thus, wellmatched for relevant acoustic properties including the presence of pitch, harmonicspectral structure and a slowly fluctuating amplitude envelope. For each pseu-doword, three control stimuli were constructed with an F0 of 100, 150 or 200 Hz,introducing pitch variability in addition to the intrinsic variability between differentpseudowords in their amplitude envelope.
All tasks had the same timing characteristics and used the same blocked-designwhere test and control (or baseline) stimuli alternated in 12.6 s blocks as recom-mended for tasks involving overt speech production (Soltysik & Hyde, 2006, 2008).In addition, a silent inter-block interval of 2 s was included. Blocks consisted of 6stimuli that were presented with a 2.1 s stimulus onset asynchrony. Scanning runsconsisted of 40 blocks (20 test and 20 control blocks) and took approximately 10 minto complete. The specific tasks were as follows.
Pseudoword reading vs. visual–motor baseline. In the reading task participants hadto read aloud short monosyllabic pseudowords. These were printed on the screenin black Times New Roman font, with 36-point size. In the control condition partic-ipants were presented with unpronounceable consonant strings (e.g. xtqs), and hadto say ‘yes’ to acknowledge them. These consonant strings were matched in lengthto the average length of the pseudowords (4 letters). To make the consonant stringsmore salient, they were displayed on the screen in blue.
Pseudoword repetition vs. auditory–motor baseline. The repetition task wasdesigned to engage both speech perception and production. Participants listenedto a series of monosyllabic pseudowords and were instructed to repeat each backimmediately. In the control task, participants heard matched non-speech buzzes (asused as a baseline in the speech perception task) and had to say ‘yes’ after each buzz.
Speech perception vs. auditory baseline. In the speech perception task, partici-pants listened to short monosyllabic pseudowords and were instructed to press abutton with their left hand when they detected two successive presentations ofthe same syllable (one-back task). Only 10% of the stimuli were repeated. In orderto prevent participants relying on low-level acoustic information, the presentationof the auditory pseudowords alternated between a male and female voice. Hence,judgements of repetition depend on abstract phonological comparisons but do notrequire division of pseudowords into segments or other meta-phonological abilities.In the control condition, participants listened to the non-speech buzzes and againhad to detect immediate repetitions (i.e. two successive stimuli with the same pitchand amplitude envelope) with a left hand button press.
Pseudowords, consonant strings and buzzes were pseudo randomly distributedand counterbalanced across the three tasks and participants such that no two stimuliwere presented twice. All control tasks were well matched for stimulus and response
characteristics. Participants’ spoken responses were recorded with a FOMRI MRIsafe noise-cancelling microphone (Opto-Acoustics Ltd., Or-Yehuda, Israel) for offlineanalysis. Prior to scanning, participants took part in a short practice session outsideof the scanner, during which they were familiarised with the tasks. The practicesession included four blocks of each tasks.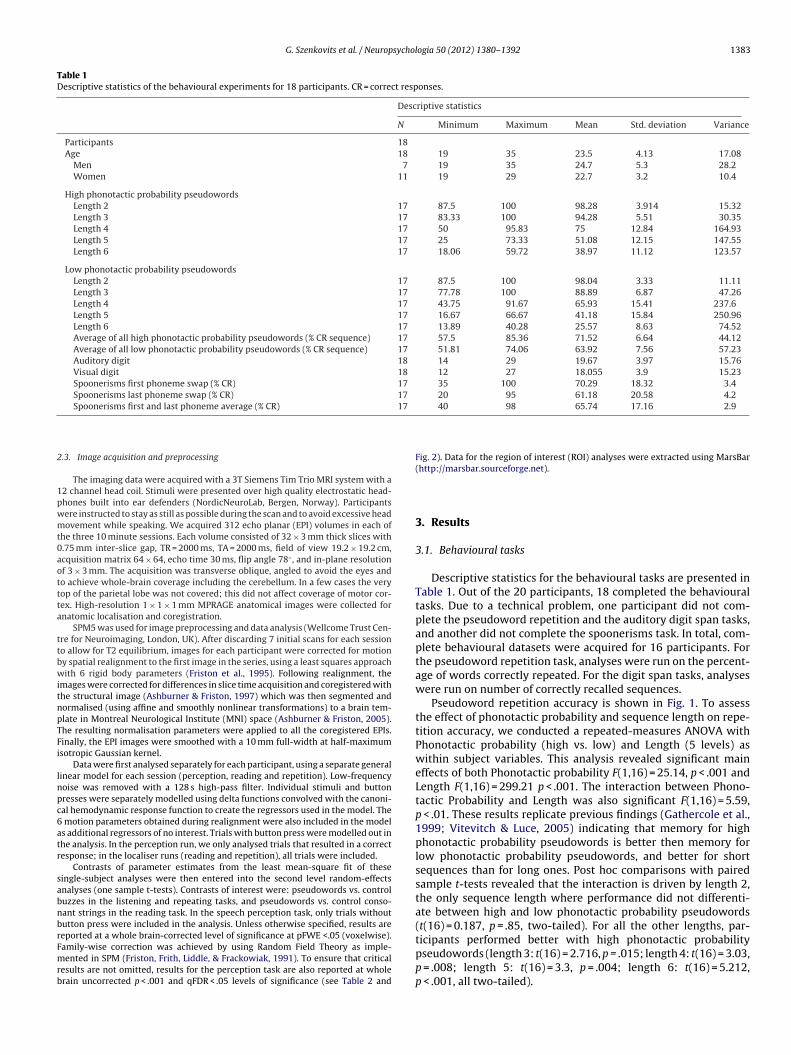
G. Szenkovits et al. / Neuropsychologia 50 (2012) 1380– 1392 1383
Table 1Descriptive statistics of the behavioural experiments for 18 participants. CR = correct responses.
Descriptive statistics
N Minimum Maximum Mean Std. deviation Variance
Participants 18Age 18 19 35 23.5 4.13 17.08
Men 7 19 35 24.7 5.3 28.2Women 11 19 29 22.7 3.2 10.4
High phonotactic probability pseudowordsLength 2 17 87.5 100 98.28 3.914 15.32Length 3 17 83.33 100 94.28 5.51 30.35Length 4 17 50 95.83 75 12.84 164.93Length 5 17 25 73.33 51.08 12.15 147.55Length 6 17 18.06 59.72 38.97 11.12 123.57
Low phonotactic probability pseudowordsLength 2 17 87.5 100 98.04 3.33 11.11Length 3 17 77.78 100 88.89 6.87 47.26Length 4 17 43.75 91.67 65.93 15.41 237.6Length 5 17 16.67 66.67 41.18 15.84 250.96Length 6 17 13.89 40.28 25.57 8.63 74.52Average of all high phonotactic probability pseudowords (% CR sequence) 17 57.5 85.36 71.52 6.64 44.12Average of all low phonotactic probability pseudowords (% CR sequence) 17 51.81 74.06 63.92 7.56 57.23Auditory digit 18 14 29 19.67 3.97 15.76Visual digit 18 12 27 18.055 3.9 15.23Spoonerisms first phoneme swap (% CR) 17 35 100 70.29 18.32 3.4Spoonerisms last phoneme swap (% CR) 17 20 95 61.18 20.58 4.2
17
2
1pwmt0aottta
ttbwitnpTFi
lnpc6atr
sabnbrFmrb
Spoonerisms first and last phoneme average (% CR)
.3. Image acquisition and preprocessing
The imaging data were acquired with a 3T Siemens Tim Trio MRI system with a2 channel head coil. Stimuli were presented over high quality electrostatic head-hones built into ear defenders (NordicNeuroLab, Bergen, Norway). Participantsere instructed to stay as still as possible during the scan and to avoid excessive headovement while speaking. We acquired 312 echo planar (EPI) volumes in each of
he three 10 minute sessions. Each volume consisted of 32 × 3 mm thick slices with.75 mm inter-slice gap, TR = 2000 ms, TA = 2000 ms, field of view 19.2 × 19.2 cm,cquisition matrix 64 × 64, echo time 30 ms, flip angle 78◦ , and in-plane resolutionf 3 × 3 mm. The acquisition was transverse oblique, angled to avoid the eyes ando achieve whole-brain coverage including the cerebellum. In a few cases the veryop of the parietal lobe was not covered; this did not affect coverage of motor cor-ex. High-resolution 1 × 1 × 1 mm MPRAGE anatomical images were collected fornatomic localisation and coregistration.
SPM5 was used for image preprocessing and data analysis (Wellcome Trust Cen-re for Neuroimaging, London, UK). After discarding 7 initial scans for each sessiono allow for T2 equilibrium, images for each participant were corrected for motiony spatial realignment to the first image in the series, using a least squares approachith 6 rigid body parameters (Friston et al., 1995). Following realignment, the
mages were corrected for differences in slice time acquisition and coregistered withhe structural image (Ashburner & Friston, 1997) which was then segmented andormalised (using affine and smoothly nonlinear transformations) to a brain tem-late in Montreal Neurological Institute (MNI) space (Ashburner & Friston, 2005).he resulting normalisation parameters were applied to all the coregistered EPIs.inally, the EPI images were smoothed with a 10 mm full-width at half-maximumsotropic Gaussian kernel.
Data were first analysed separately for each participant, using a separate generalinear model for each session (perception, reading and repetition). Low-frequencyoise was removed with a 128 s high-pass filter. Individual stimuli and buttonresses were separately modelled using delta functions convolved with the canoni-al hemodynamic response function to create the regressors used in the model. The
motion parameters obtained during realignment were also included in the models additional regressors of no interest. Trials with button press were modelled out inhe analysis. In the perception run, we only analysed trials that resulted in a correctesponse; in the localiser runs (reading and repetition), all trials were included.
Contrasts of parameter estimates from the least mean-square fit of theseingle-subject analyses were then entered into the second level random-effectsnalyses (one sample t-tests). Contrasts of interest were: pseudowords vs. controluzzes in the listening and repeating tasks, and pseudowords vs. control conso-ant strings in the reading task. In the speech perception task, only trials withoututton press were included in the analysis. Unless otherwise specified, results are
eported at a whole brain-corrected level of significance at pFWE <.05 (voxelwise).amily-wise correction was achieved by using Random Field Theory as imple-ented in SPM (Friston, Frith, Liddle, & Frackowiak, 1991). To ensure that criticalesults are not omitted, results for the perception task are also reported at wholerain uncorrected p < .001 and qFDR < .05 levels of significance (see Table 2 and
40 98 65.74 17.16 2.9
Fig. 2). Data for the region of interest (ROI) analyses were extracted using MarsBar(http://marsbar.sourceforge.net).
3. Results
3.1. Behavioural tasks
Descriptive statistics for the behavioural tasks are presented inTable 1. Out of the 20 participants, 18 completed the behaviouraltasks. Due to a technical problem, one participant did not com-plete the pseudoword repetition and the auditory digit span tasks,and another did not complete the spoonerisms task. In total, com-plete behavioural datasets were acquired for 16 participants. Forthe pseudoword repetition task, analyses were run on the percent-age of words correctly repeated. For the digit span tasks, analyseswere run on number of correctly recalled sequences.
Pseudoword repetition accuracy is shown in Fig. 1. To assessthe effect of phonotactic probability and sequence length on repe-tition accuracy, we conducted a repeated-measures ANOVA withPhonotactic probability (high vs. low) and Length (5 levels) aswithin subject variables. This analysis revealed significant maineffects of both Phonotactic probability F(1,16) = 25.14, p < .001 andLength F(1,16) = 299.21 p < .001. The interaction between Phono-tactic Probability and Length was also significant F(1,16) = 5.59,p < .01. These results replicate previous findings (Gathercole et al.,1999; Vitevitch & Luce, 2005) indicating that memory for highphonotactic probability pseudowords is better then memory forlow phonotactic probability pseudowords, and better for shortsequences than for long ones. Post hoc comparisons with pairedsample t-tests revealed that the interaction is driven by length 2,the only sequence length where performance did not differenti-ate between high and low phonotactic probability pseudowords(t(16) = 0.187, p = .85, two-tailed). For all the other lengths, par-
ticipants performed better with high phonotactic probabilitypseudowords (length 3: t(16) = 2.716, p = .015; length 4: t(16) = 3.03,p = .008; length 5: t(16) = 3.3, p = .004; length 6: t(16) = 5.212,p < .001, all two-tailed).
1384 G. Szenkovits et al. / Neuropsycho
Fig. 1. Performance on high (solid line) and low (dashed line) phonotactic proba-bsa
sOtw
3
pmipb
FMps
ility pseudoword repetitions as a function of sequence length. Error bars indicatetandard error of the mean after between-subject variability has been removed,ppropriate for repeated measures comparisons (Loftus & Masson, 1994).
In the spoonerisms tasks, the average accuracy (±SD) for initialound swap was 70% (±17), and 61% (±19), for the final sound swap.verall accuracy was 65.7% (±16). In the auditory digit span task
he average score was 19.1 (±3.21), in the visual digit span task itas 18.05 (±3.79).
.2. Imaging results
In order to make sure participants did not fall asleep anderformed the tasks appropriately, behavioural performance was
onitored online. This confirmed that participants followed tasknstruction in the localiser tasks (reading and repetition), androduced pseudowords and ‘yes’ answers as appropriate. Onlyehavioural data from the speech perception tasks (experiment of
ig. 2. Brain regions showing response differences between task (pseudowords) and baslNI canonical brain, thresholded at pFWE < .05 (A) and (B) and at p < .001 (uncorrected)
eak voxels in the left middle temporal gyrus and left infero-temporal gyrus that reachedhow standard error of the mean after between-subject variability has been removed, sui
logia 50 (2012) 1380– 1392
interest) was analysed further. The average detection accuracy forpseudowords was 91.2% (SD = 13.1%) and 90.4% (SD = 13.3%) for thebuzzes, indicating that participants performed the speech percep-tion and control task reliably.
3.2.1. Whole-brain analysisWe first examined brain areas that showed significant activa-
tion during reading, repetition, and perception tasks compared totheir corresponding control conditions, shown in Fig. 2 and Table 2.Results were generally consistent with the findings of previousstudies on speech perception and production (see Price, 2010;Price et al., 1996). For pseudoword reading, at pFWE <.05 statis-tical threshold, we observed extensive activation of bilateral motorand premotor cortices, left inferior frontal gyrus (LIFG), left inferiortemporal gyrus (LIT), the right cerebellum and the supplementarymotor area (SMA). In addition, a region in the superior temporalgyrus (STG) was activated, presumably reflecting a response to par-ticipants’ own speech (Hashimoto & Sakai, 2003; Zheng, Munhall,& Johnsrude, 2010). The pseudoword repetition task revealed acti-vation that overlapped with networks for both speech perceptionand production, namely bilateral premotor and motor cortices, leftmiddle temporal gyrus (MTG), as well as LIFG and SMA. In additionthe left putamen were also found to be active. Speech perception atpFWE <.05 statistical threshold showed a much more restricted pat-tern of activation encompassing portions of left inferior and middletemporal gyri. Because we wanted to ensure we were not miss-ing sub-threshold effects for this critical contrast, we repeated thiscontrast at a voxelwise uncorrected threshold of p < .001 (whichnonetheless exceeds qFDR <.05). At this threshold, we observedthe bilateral MTG, LIFG (pars orbitalis), left precuneus, right angulargyrus, LIT and left fusiform gyus. Frontal responses during speechperception were confined to the LIFG (pars orbitalis) and did notextend into premotor or motor cortex.
3.2.2. Region of interest analysisFollowing the failure to find whole-brain evidence for pre-
motor involvement during speech perception, we conducted afollow-up region of interest (ROI) analysis. To avoid issues ofnonindependence (Kriegeskorte, Simmons, Bellgowan, & Baker,2009), two sets of independent ROIs were determined to sample
ine (non-speech sounds/consonant strings). Activation maps are rendered onto the(C). (C) Lower panel shows bar chart of the mean BOLD parameter estimate of the
p < .05 FWE corrected level for pseudowords (grey) and buzzes (white). Error barstable for repeated measures comparisons (Loftus & Masson, 1994).

G. Szenkovits et al. / Neuropsychologia 50 (2012) 1380– 1392 1385
Table 2MNI Coordinates for peak voxels of increased activity for all speech versus non-speech contrasts. We report a maximum of 20 local maxima that are more than 8 mm apart.
Location Cluster size (Voxels) Z-scores Coordinates
x y z
(A) Reading pseudowords > ‘yes’ to consonant string
Right Postcentral G. 437 6.66 56 −8 40Left superior temporal G. 3656 6.56 −58 −8 0Left postcentral G. 6.54 −50 −10 38Left rolandic operculum 6.44 −56 −2 10Left precentral G. 6.23 −50 2 26Left rolandic operculum 5.88 −42 −14 24LIFG – pars opercularis 5.79 −54 10 12Left insula 5.59 −36 −8 18Left superior temporal G. 5.44 −56 −12 12Left superior temporal G. 5.39 −58 −24 8Left precentral G. 5.05 −44 −6 52Left insula 852 6.04 −26 18 6LIFG – pars triangularis 5.45 −38 32 −4Left pallidum 5.35 −18 8 0Left pallidum 5.26 −18 0 −6Right cerebellum (8) 108 5.9 24 −70 −50Left middle cingulum 214 5.71 −10 14 38SMA 5.28 −6 4 58Left middle cingulum 4.85 −6 6 44Right rolandic operculum 116 5.62 66 −6 12Right superior temporal G. 4.81 62 −6 −4Left inferior parietal lobule 22 5.24 −32 −48 48Left thalamus 46 5.14 −14 −14 6Right rolandic operculum 36 5.09 46 −6 18Right cerebellum (8) 43 4.92 22 −62 −24Left inferior temporal G. 15 4.85 −44 −52 −10Inferior colliculus 6 4.82 −8 −22 −6
(B) Repeating pseudowords > ‘yes’ to buzzes
Right postcentral G. 774 6.66 54 −8 38Right rolandic operculum 5.28 46 −10 20Left putamen 1004 6.33 −26 2 −4Left putamen 6.06 −24 10 6Left putamen 5.82 −22 −4 10Left caudate nucleus 5.57 −14 6 12Left thalamus 5.13 −10 −12 4Right superior temporal G. 156 6.3 62 −6 −4Left precentral G. 2085 6.26 −50 −2 38Left postcentral G. 6.21 −46 −12 36Left middle temporal G. 6.06 −64 −12 −4Left precentral G. 6.04 −52 2 26Left precentral G. 5.65 −42 −2 28Left rolandic operculum 5.51 −54 −6 12Left rolandic operculum 5.41 −42 −2 18Left rolandic operculum 5.14 −46 −10 18Left precentral G. 4.96 −46 −4 52Left middle temporal G. 4.92 −62 −32 4SMA 139 6.03 −6 2 62Right middle temporal G. 36 5.37 62 −28 0SMA 5.3 −8 16 44Right putamen 63 4.94 24 4 −4Right putamen 4.92 18 10 8LIFG – pars triangularis 10 4.89 −42 30 2Right pallidum 1 4.75 26 −2 −4
(C) Listening to pseudowords > buzzes
Left inferior temporal G. 643 5.34** −46 −50 −10Left inferior temporal G 4.37 −42 −46 −16Left middle temporal G. 934 5.08** −56 −16 −4Left middle temporal G. 5.06** −58 −30 4Right superior temporal G. 614 4.68 66 −14 −6Right middle temporal G. 3.78 60 0 −12Right middle temporal G. 107 4.33 52 −76 6Left precuneus 728 3.95 −4 −58 38Left precuneus 3.74 −14 −54 40LIFG – pars orbitalis 47 3.49 −40 30 −14Left superior temporal G. 47 3.42 −64 −54 20Left superior temporal G. 3.12 # −58 −46 8Right angular G. 33 3.35 60 −60 34Right cuneus 16 3.33 18 −96 24Right middle temporal pole 2 3.21 50 18 −28Left fusiform G. 8 3.2 −38 −24 −18

1386 G. Szenkovits et al. / Neuropsychologia 50 (2012) 1380– 1392
Table 2 (Continued)
Location Cluster size (Voxels) Z-scores Coordinates
x y z
Right fusiform G. 4 3.17 38 −40 −20Right cerebellum (6) 2 3.14 26 −60 −16Right rectus 3 3.14 # 2 48 −20Left pallidum 1 3.12 # −24 −12 −4Left cuneus 1 3.11 # −8 -84 30
For the localiser tasks, reading (A) and repetition (B) results are shown at whole brain Funcorrected p < .001. All peak voxels reach whole brain FDR correction at p < .05 except treach whole brain FWE correction at p < .05 level. LIFG = left inferior frontal gyrus; SMA =
Fig. 3. Location of ROIs displayed on a template brain. ROIs were obtained by usingindependent contrasts from the present set of experiments (white and green targets)and peak voxels from Wilson et al. (2004) (black targets). All ROIs were spheres witha(−(
ptpyr
rtlTlt(wlhgaat
stturd
sil
dRo
region, scores on high phonotactic probability pseudoword
7 mm radius around the peak coordinates. Peak coordinates are (1) [−48 −12 38],2) [−50 −4 38], (3) [−50 0 26] and (4) [56 −8 38]; (c1) [−64 −12 −4] and (c2) [−6030 6]; (w1) [−50 −6 47], (w2) [55 −3 45], (w3) [−51 −11 46] and (w4) [56 −8 44]
see text for more details).
remotor and motor regions, illustrated in Fig. 3. These ROIs werehen used to extract and assess the neural activation in the speecherception task. Like for the whole brain analysis, the ROI anal-ses were carried out on contrasts of each task compared to itsespective baseline.
First, we used contrasts from the localiser runs (reading andepetition), by combining activations in these runs and choosinghe first four peak activations. There were two maxima in theeft postcentral gyrus and two in the bilateral precentral gyri.he second set of ROI coordinates were chosen from the existingiterature on speech perception and have been previously reportedo show activation during passive listening to simple syllablesWilson et al., 2004). There were two pairs of bilateral peaks thatere reported to show significant neural activation during passive
istening to monosyllabic pseudowords, including two in the leftemisphere (one in the precentral and one in the postcentralyrus), and two in the right precentral gyrus. Finally, we chose twodditional regions from our independent scanning runs (readingnd repetition combined), both in the left middle temporal gyrus,o serve as control regions.
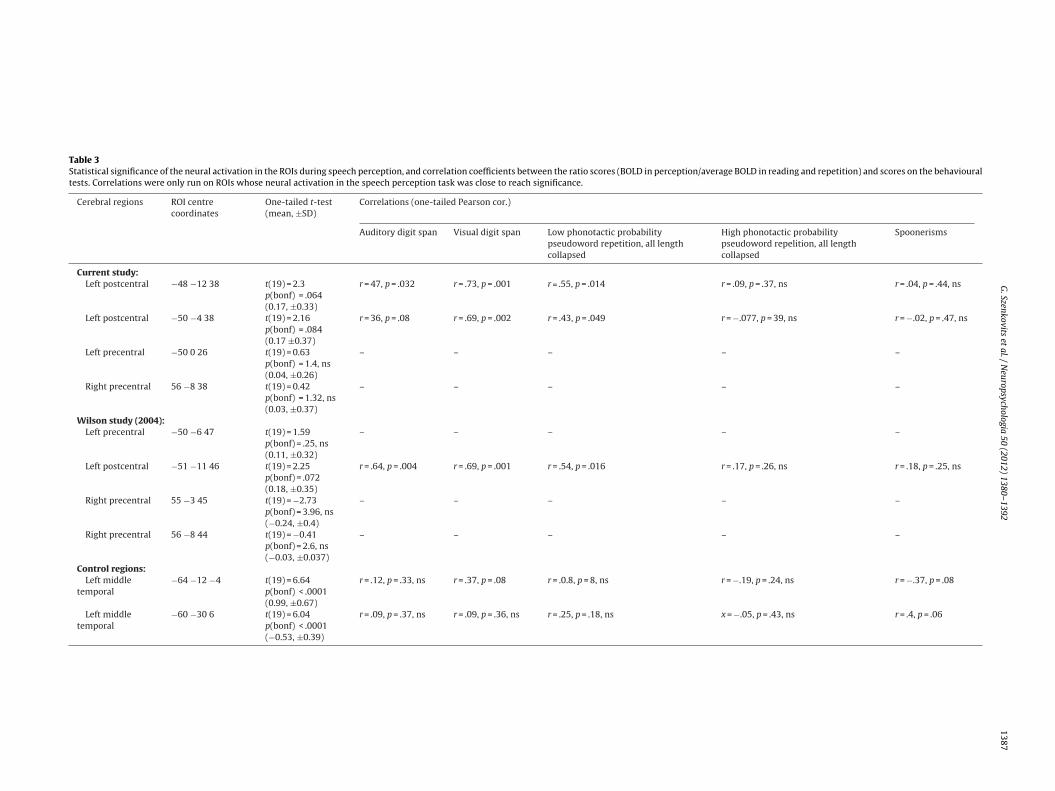
For each peak coordinate, we extracted data from a 7 mm radiusphere around the peak, averaging over all voxels, and assessedhe activation during speech perception using a one-sample, one-ailed t-test. We used the Bonferroni correction to control for these of multiple ROIs (corrected separately for each set). Table 3 listsegions of interest and statistical significance of neural activationuring speech perception.
Following correction for multiple comparisons, none of the ROIshowed evidence for significant premotor or motor activation dur-
ng speech perception.2 However, there were three regions in theeft postcentral gyrus that showed a trend in this direction.2 We also conducted the same ROI analysis on data extracted from the pseu-owords contrast only (as opposed to pseudowords > baseline). Here, none of theOIs showed significant activation, all ps > .4 (Bonferroni corrected for the numberf ROIs).
WE corrected at p < .05 level. For the perception task (C), results are shown at anhose in italic with a hash mark (#). Voxels marked in bold with two asterisks (**)
supplementary motor area.
3.2.3. Individual differences in neural activation within regions inthe premotor and motor cortices
The primary goal of the present study was to investigate theextent to which behavioural performance might be associated withdifferential neural recruitment within the premotor cortex dur-ing speech perception. To test this hypothesis, we selected thethree ROIs whose activity during speech perception approachedstatistical significance (Bonferroni-corrected p < .09), and plottedthe percent signal change (experimental task vs. control tasks) foreach participant in each task for visual inspection (an example isshown in panel A of Fig. 4). These results suggested considerablevariability across participants, particularly in the perception task.
To account for inter-individual variations in all three tasks, andto obtain a single measure representing the activation during lis-tening compared to reading and repetition, for each participantwe computed a BOLD ratio score corresponding to the observedneural activation during speech perception divided by the averageneural activation in reading and repetition. We used these ratioscores instead of absolute activation level in the speech perceptiontask to exclude differences in the overall magnitude of the BOLDresponse common to speech perception and production. Examina-tion of these ratio scores revealed that approximately half of theparticipants showed increased neural activation in these regionsduring speech perception, and about half did not (see Fig. 4B). Inorder to test whether this observed variability in BOLD ratio sig-nal was due to systematic variability based on individual cognitiveability (as opposed to noise), we carried out multiple regressionanalyses with BOLD ratios in each region as the dependent measureand behavioural scores on each test as predictors. These were scoreson auditory and visual digit task, scores on high and low phonotac-tic probability pseudoword repetitions averaged over length, andscores on the spoonerisms task. Predictor variables were enteredsimultaneously.3 The descriptive statistics (bivariate correlations)are shown in Table 3, and the multiple regressions in Table 4.
The results for the first ROI, located in the left precentral gyrus(centred at [−48 −12 38]), indicated that the model with all fivepredictors explained 72.7% of the variance (R2 = .727, F(5,10) = 5.34,p = .012). Furthermore, repetition scores for the low phonotacticprobability pseudowords significantly predicted neural activationin this ROI (B = 5.44, SE-B = 2.11, ̌ = .97, p = .028). None of the othervariables alone predicted neural responses in this region.
The results of the multiple regression for the secondROI within the left precentral gyrus (centred at [−50 −438]) showed that the five predictors all together explained68.3% of the variance (R2 = .683, F(5,10) = 4.3, p = .024). In this
repetition predicted neural responses significantly (B = −3.39, SE-B = 1.4, ̌ = −.71, p = .04), whereas scores on low phonotactic
3 We ran several additional exploratory analyses with different methods for enter-ing predictors (e.g., hierarchical). These exploratory analyses produced results thatwere qualitatively equivalent to those obtained with the method we report here (inwhich predictors were entered simultaneously).
G.
Szenkovits et
al. /
Neuropsychologia
50 (2012) 1380– 13921387
Table 3Statistical significance of the neural activation in the ROIs during speech perception, and correlation coefficients between the ratio scores (BOLD in perception/average BOLD in reading and repetition) and scores on the behaviouraltests. Correlations were only run on ROIs whose neural activation in the speech perception task was close to reach significance.
Cerebral regions ROI centrecoordinates
One-tailed t-test(mean, ±SD)
Correlations (one-tailed Pearson cor.)
Auditory digit span Visual digit span Low phonotactic probabilitypseudoword repetition, all lengthcollapsed
High phonotactic probabilitypseudoword repelition, all lengthcollapsed
Spoonerisms
Current study:Left postcentral −48 −12 38 t(19) = 2.3
p(bonf) = .064(0.17, ±0.33)
r = 47, p = .032 r = .73, p = .001 r = .55, p = .014 r = .09, p = .37, ns r = .04, p = .44, ns
Left postcentral −50 −4 38 t(19) = 2.16p(bonf) = .084(0.17 ±0.37)
r = 36, p = .08 r = .69, p = .002 r = .43, p = .049 r = −.077, p = 39, ns r = −.02, p = .47, ns
Left precentral −50 0 26 t(19) = 0.63p(bonf) = 1.4, ns(0.04, ±0.26)
– – – – –
Right precentral 56 −8 38 t(19) = 0.42p(bonf) = 1.32, ns(0.03, ±0.37)
– – – – –
Wilson study (2004):Left precentral −50 −6 47 t(19) = 1.59
p(bonf) = .25, ns(0.11, ±0.32)
– – – – –
Left postcentral −51 −11 46 t(19) = 2.25p(bonf) = .072(0.18, ±0.35)
r = .64, p = .004 r = .69, p = .001 r = .54, p = .016 r = .17, p = .26, ns r = .18, p = .25, ns
Right precentral 55 −3 45 t(19) = −2.73p(bonf) = 3.96, ns(−0.24, ±0.4)
– – – – –
Right precentral 56 −8 44 t(19) = −0.41p(bonf) = 2.6, ns(−0.03, ±0.037)
– – – – –
Control regions:Left middle
temporal−64 −12 −4 t(19) = 6.64
p(bonf) < .0001(0.99, ±0.67)
r = .12, p = .33, ns r = .37, p = .08 r = .0.8, p = 8, ns r = −.19, p = .24, ns r = −.37, p = .08
Left middletemporal
−60 −30 6 t(19) = 6.04p(bonf) < .0001(−0.53, ±0.39)
r = .09, p = .37, ns r = .09, p = .36, ns r = .25, p = .18, ns x = −.05, p = .43, ns r = .4, p = .06
1388 G. Szenkovits et al. / Neuropsychologia 50 (2012) 1380– 1392
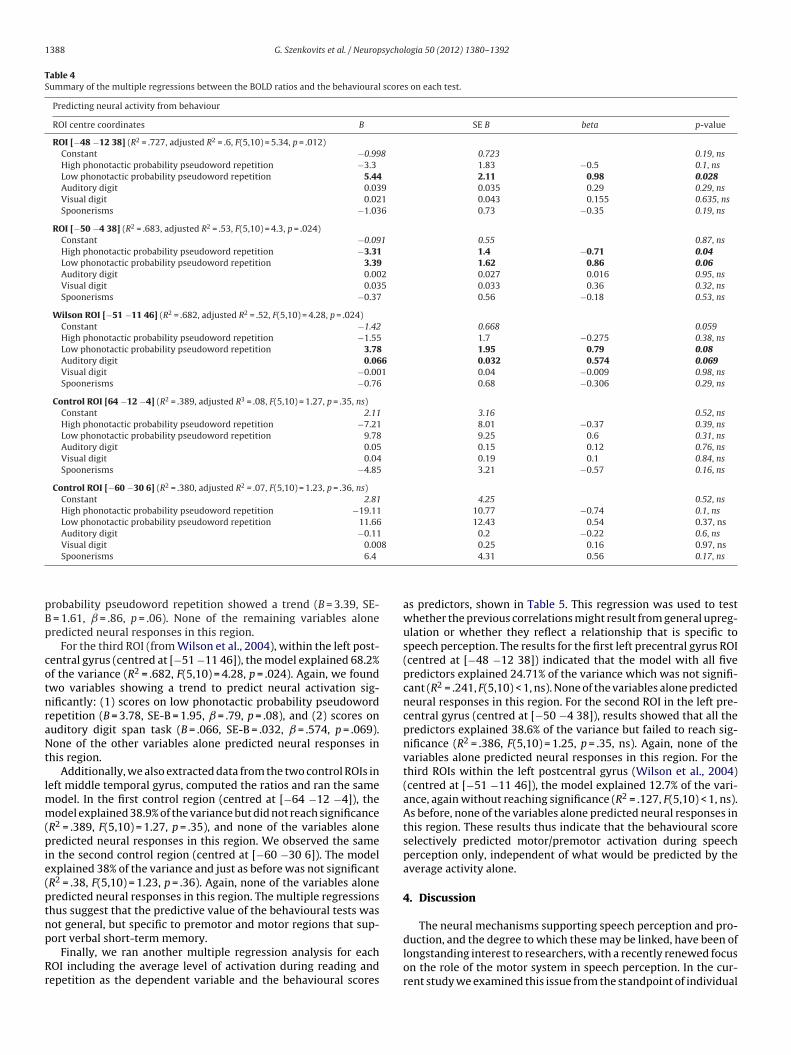
Table 4Summary of the multiple regressions between the BOLD ratios and the behavioural scores on each test.
Predicting neural activity from behaviour
ROI centre coordinates B SE B beta p-value
ROI [−48 −12 38] (R2 = .727, adjusted R2 = .6, F(5,10) = 5.34, p = .012)Constant −0.998 0.723 0.19, nsHigh phonotactic probability pseudoword repetition −3.3 1.83 −0.5 0.1, nsLow phonotactic probability pseudoword repetition 5.44 2.11 0.98 0.028Auditory digit 0.039 0.035 0.29 0.29, nsVisual digit 0.021 0.043 0.155 0.635, nsSpoonerisms −1.036 0.73 −0.35 0.19, ns
ROI [−50 −4 38] (R2 = .683, adjusted R2 = .53, F(5,10) = 4.3, p = .024)Constant −0.091 0.55 0.87, nsHigh phonotactic probability pseudoword repetition −3.31 1.4 −0.71 0.04Low phonotactic probability pseudoword repetition 3.39 1.62 0.86 0.06Auditory digit 0.002 0.027 0.016 0.95, nsVisual digit 0.035 0.033 0.36 0.32, nsSpoonerisms −0.37 0.56 −0.18 0.53, ns
Wilson ROI [−51 −11 46] (R2 = .682, adjusted R2 = .52, F(5,10) = 4.28, p = .024)Constant −1.42 0.668 0.059High phonotactic probability pseudoword repetition −1.55 1.7 −0.275 0.38, nsLow phonotactic probability pseudoword repetition 3.78 1.95 0.79 0.08Auditory digit 0.066 0.032 0.574 0.069Visual digit −0.001 0.04 −0.009 0.98, nsSpoonerisms −0.76 0.68 −0.306 0.29, ns
Control ROI [64 −12 −4] (R2 = .389, adjusted R3 = .08, F(5,10) = 1.27, p = .35, ns)Constant 2.11 3.16 0.52, nsHigh phonotactic probability pseudoword repetition −7.21 8.01 −0.37 0.39, nsLow phonotactic probability pseudoword repetition 9.78 9.25 0.6 0.31, nsAuditory digit 0.05 0.15 0.12 0.76, nsVisual digit 0.04 0.19 0.1 0.84, nsSpoonerisms −4.85 3.21 −0.57 0.16, ns
Control ROI [−60 −30 6] (R2 = .380, adjusted R2 = .07, F(5,10) = 1.23, p = .36, ns)Constant 2.81 4.25 0.52, nsHigh phonotactic probability pseudoword repetition −19.11 10.77 −0.74 0.1, nsLow phonotactic probability pseudoword repetition 11.66 12.43 0.54 0.37, nsAuditory digit −0.11 0.2 −0.22 0.6, nsVisual digit 0.008 0.25 0.16 0.97, ns
pBp
cotnraNt
lmm(pie(ptnp
Rr
Spoonerisms 6.4
robability pseudoword repetition showed a trend (B = 3.39, SE- = 1.61, ̌ = .86, p = .06). None of the remaining variables aloneredicted neural responses in this region.
For the third ROI (from Wilson et al., 2004), within the left post-entral gyrus (centred at [−51 −11 46]), the model explained 68.2%f the variance (R2 = .682, F(5,10) = 4.28, p = .024). Again, we foundwo variables showing a trend to predict neural activation sig-ificantly: (1) scores on low phonotactic probability pseudowordepetition (B = 3.78, SE-B = 1.95, ̌ = .79, p = .08), and (2) scores onuditory digit span task (B = .066, SE-B = .032, ̌ = .574, p = .069).one of the other variables alone predicted neural responses in
his region.Additionally, we also extracted data from the two control ROIs in
eft middle temporal gyrus, computed the ratios and ran the sameodel. In the first control region (centred at [−64 −12 −4]), theodel explained 38.9% of the variance but did not reach significance
R2 = .389, F(5,10) = 1.27, p = .35), and none of the variables aloneredicted neural responses in this region. We observed the same
n the second control region (centred at [−60 −30 6]). The modelxplained 38% of the variance and just as before was not significantR2 = .38, F(5,10) = 1.23, p = .36). Again, none of the variables aloneredicted neural responses in this region. The multiple regressionshus suggest that the predictive value of the behavioural tests wasot general, but specific to premotor and motor regions that sup-
ort verbal short-term memory.Finally, we ran another multiple regression analysis for eachOI including the average level of activation during reading andepetition as the dependent variable and the behavioural scores
4.31 0.56 0.17, ns
as predictors, shown in Table 5. This regression was used to testwhether the previous correlations might result from general upreg-ulation or whether they reflect a relationship that is specific tospeech perception. The results for the first left precentral gyrus ROI(centred at [−48 −12 38]) indicated that the model with all fivepredictors explained 24.71% of the variance which was not signifi-cant (R2 = .241, F(5,10) < 1, ns). None of the variables alone predictedneural responses in this region. For the second ROI in the left pre-central gyrus (centred at [−50 −4 38]), results showed that all thepredictors explained 38.6% of the variance but failed to reach sig-nificance (R2 = .386, F(5,10) = 1.25, p = .35, ns). Again, none of thevariables alone predicted neural responses in this region. For thethird ROIs within the left postcentral gyrus (Wilson et al., 2004)(centred at [−51 −11 46]), the model explained 12.7% of the vari-ance, again without reaching significance (R2 = .127, F(5,10) < 1, ns).As before, none of the variables alone predicted neural responses inthis region. These results thus indicate that the behavioural scoreselectively predicted motor/premotor activation during speechperception only, independent of what would be predicted by theaverage activity alone.
4. Discussion
The neural mechanisms supporting speech perception and pro-
duction, and the degree to which these may be linked, have been oflongstanding interest to researchers, with a recently renewed focuson the role of the motor system in speech perception. In the cur-rent study we examined this issue from the standpoint of individual
G. Szenkovits et al. / Neuropsychologia 50 (2012) 1380– 1392 1389
Table 5Summary of the multiple regressions between the average BOLD signal in the production runs (reading and repetition) and the behavioural scores on each test.
Predicting neural activity from behaviour
ROI centre coordinates B SE B beta p-Value
ROI [−48 −12 38] (R2 = .241, adjusted R2 = −.14, F(5,10) = 0.63, p = .7, ns)Constant −0.887 1 0.4, nsHigh phonotactic probability pseudoword repetition −1.9 2.5 −0.35 0.46, nsLow phonotactic probability pseudoword repetition 0.65 2.92 0.14 0.83, nsAuditory digit −0.014 0.048 −0.13 0.77, nsVisual digit 0.015 0.06 0.13 0.8, nsSpoonerisms 1.34 1.01 0.55 0.22, ns
ROI [−50 −4 38] (R2 = .386, adjusted R2 = .08, F(5,10) = 1.25, p = .35, ns)Constant 2.01 0.99 0.07High phonotactic probability pseudoword repetition −2.72 2.5 −0.45 0.3, nsLow phonotactic probability pseudoword repetition 3 2.9 0.6 0.32, nsAuditory digit −0.08 0.05 −0.63 0.14, nsVisual digit 0.15 0.06 0.12 0.8, nsSpoonerisms 0.71 1 0.27 0.5, ns
Wilson ROI [−51 −11 46] (R2 = .127, adjusted R2 = −.31, F(5,10) = 0,29, p = .9, ns)Constant 1.9 1.5 0.24, nsHigh phonotactic probability pseudoword repetition −4.12 3.9 −0.52 0.3, nsLow phonotactic probability pseudoword repetition 2.42 4.5 0.36 0.6, nsAuditory digit −0.005 0.075 −0.034 0.94, ns
1
dfpofncq
ttiamdommSepdf
opdercgravaMtebpt
Visual digit −0.01Spoonerisms 0.86
ifferences in cognitive ability. Our purpose was twofold: First, tourther investigate premotor and motor involvement during speecherception, using tasks that overcome methodological limitationsf previous studies. Second, to determine whether individual dif-erences in cognitive abilities are associated with differences ineural recruitment along the dorsal pathway during speech per-eption. Below we review our findings with respect to these twouestions.
The results of the whole-brain analysis showed activation inhe middle and superior temporal gyri during all three languageasks compared to matched non-language baseline tasks. However,t was only during tasks requiring overt speech production (readingnd repeating) that we saw significant activation of premotor andotor cortices. The only frontal region exhibiting elevated activity
uring speech perception was the left inferior frontal gyrus (parsrbitalis). The failure to observe significant neural activation in pre-otor and motor cortices during speech perception compared toatched non-speech perception is in line with suggestions from
cott et al. (2009) and Lotto, Holt, and Hickok (2009) that the pres-nce of premotor and motor activation in fMRI studies of speecherception might be a consequence of inappropriate baseline con-itions, and the failure to adopt an appropriate level of control foralse positives.
To ensure that we did not miss premotor or motor activation inur whole brain analysis, we performed a focused analysis, sam-ling the premotor and motor cortices with a set of independentlyefined regions of interest (ROIs). The results of this region of inter-st analysis confirmed that the majority of the sampled motoregion did not show significant neural activation in the speech per-eption task. Nevertheless, three regions within the left postcentralyrus exhibited responses that approached significance, after cor-ecting for the number of ROIs. The failure to find significant effectst the group level was due to the presence of substantial individualariability. Importantly, between 68% and 72% of the observed vari-nce could be explained by performance on the behavioural tasks.oreover, we can be confident that the activation observed within
he left premotor cortex is not due to motor processes involved in
xecuting the button press because we modelled trials involving autton presses separately and only included trials without buttonresses. However, although we only analysed trials without but-on press, all stimuli had to be subjected to a decision process, and0.09 −0.07 0.9, ns1.6 0.25 0.6, ns
to action planning or action inhibition. In the current experiment,we cannot exclude the possibility that the decision process and/oraction planning and inhibition could have influenced the pattern ofneural activity in our sample of motor cortex (Hasson, Nusbaum, &Small, 2006). Even if these executive processes may contribute tothe absolute magnitude of motor activity this does not explain theassociation that we see between individual differences and neuralactivitation during speech perception. The variability in neural acti-vation in our sample of the motor region is specific to this regionand is caused by task related upregulation within this region ratherthan by global changes in neural activity as it does not extend tothe control regions within the middle temporal gyrus.
The factor that predicted inter-individual variability in motoractivation alone during speech perception was repetition accuracyfor low phonotactic probability pseudowords. Interestingly, per-formance accuracy for high phonotactic probability pseudowordsdid not correlate with neural activation in the ROIs. This might bebecause the restricted range of performance on high phonotacticprobability pseudowords allows less room to detect correlationswith individual differences in neural activation. It may also bethat the greater difficulty of the low phonotactic probabilitypseudoword task draws more heavily on subvocal rehearsal. Fur-thermore, the speech production process itself is also influenced byphonotactic probability (Vitevitch, Armbrüster, & Chu, 2004) andtherefore production of low phonotactic probability pseudowordsmay be more effortful.
For one of the ROIs within the left postcentral gyrus (from thecurrent study, centred around [−50 −4 38]), scores on high phono-tactic probability pseudowords predicted a significant decrease inneural activation (standardised ̌ = −0.71). This type of inverse cor-relation can occur when there is a nonlinear relationship betweenthe factors in a multiple regression. Note that the correspondingbivariate correlation was small and nonsignificant.
In contrast to the verbal short-term memory measures, per-formance on the spoonerisms task did not predict variability inneural activation during speech perception. Although the spooner-ism task involves verbal short-term memory, it is a metalinguistic
task which relies on overt awareness of speech sounds, and onthe ability to separate and mentally manipulate these sounds.Functional imaging investigations of the neural systems support-ing speech segmentation and manipulation processes showed that
1390 G. Szenkovits et al. / Neuropsycho
Fig. 4. Percent signal change (experimental task vs. control task) for each partici-pant in perception (red), reading (blue), and repetition (green) tasks (A). (B) BOLDratios for speech perception task in the three ROIs. The BOLD ratio was calculatedas the parameter estimate for the perception task divided by the average parameterestimate for the reading and repetition tasks. Data are shown for ROIs centered at[−48 −12 38] (♦), [−50 −4 38] (©), and [−51 −11 46] (�). (For interpretation of thert
btItifTrWccttrr
mc
eferences to color in this figure legend, the reader is referred to the web version ofhe article.)
esides motor regions, more anterior regions of the prefrontal cor-ex were also recruited (e.g. LIFG; Burton, Small, & Blumstein, 2000).t may then be that individual differences in the ability to performhe spoonerism task are driven more by variability in processesnvolved in phonemic segmentation and manipulation, than by dif-erences in the rehearsal component of verbal short-term memory.hat is, while these tasks do have a motor component, the efficacy ofehearsal may have only a weak influence on overall performance.
hilst previous studies showing motor involvement in speech per-eption (Möttönen & Watkins, 2009; Yuen et al., 2009) have beenriticised for their use of tasks that required speech segmenta-ion, our results suggest that these tasks may be less closely linkedo motor activation than tasks such as digit span, or pseudowordepetition tasks which directly tap into the efficiency of subvocalehearsal.
Taken together, the results of the bivariate correlations and theultiple regressions indicate that neural activation in speech per-
eption is linked to performance in verbal short-term memory but
logia 50 (2012) 1380– 1392
not phonological awareness. That is, participants with a better ver-bal short-term memory produced more neural activation in motorcortex when listening to speech. This is consistent with the long-established role of subvocal rehearsal in these verbal short-termmemory tasks (Jarrold & Tam, 2010), and with the observation thatsubvocal rehearsal relies on intact pathways from visual or audi-tory speech processing to motor regions (Buchsbaum et al., 2005;Saur et al., 2008; Warrington & Shallice, 1969). In order to inter-pret this result, though, it is important to consider whether there isany possibility that the speech perception task used here (one-backidentity monitoring) might itself involve either subvocal rehearsalor segmentation, both of which might potentially recruit motorregions. For example, speech segmentation has been shown to acti-vate prefrontal regions (Burton et al., 2000) and has been arguedto depend on auditory-motor pathways (Lotto et al., 2009; Scottet al., 2009). However, in our one-back task decisions are made onthe identity of the entire syllable rather than on individual seg-ments, so there is no requirement for segmentation. Although weare unable to completely rule out the possibility that participantsin a one-back task might engage in subvocal rehearsal, this seemshighly unlikely given that they need only remember a single itemfor a brief period with no intervening stimuli. We know of no evi-dence that would suggest that people might rehearse under thesecircumstances. Nonetheless, participants with better verbal short-term memory produce greater activation during speech perceptionin brain regions associated with subvocal rehearsal of verbal mate-rials.
The most straightforward explanation of our data is thereforethat participants with better short-term memory are more likelyto engage the motor system in recoding speech input in order toperform the one-back task. This might be a purely strategic effect,in that participants with better short-term memory might sim-ply find it easier to recode, even though the task does not strictlydemand it. An alternative possibility is that there may be anatomi-cal differences between participants (in grey matter volume, whitematter connectivity, or both) which increase the likelihood ofmotor involvement in both speech and memory tasks. These expla-nations are not mutually exclusive. An initial anatomical differencecould well be the driving force behind the development of differentstrategies, and persistent application of a rehearsal strategy couldconceivably lead to longer-term changes in brain structure and con-nectivity. However, it might well be possible to separate these twoaccounts by further studies that explore the structure and connec-tivity of the auditory–motor pathway (Saur et al., 2008) and byexploring neural activity during verbal short-term memory tasks(Buchsbaum et al., 2005) in different populations. We note thatour overall findings linking individual cognitive ability to motorand premotor activity during speech perception stand regardless ofwhether this relationship is mediated by differences in brain mor-phology, although this is an interesting possibility to consider infuture studies.
In summary, we did not find evidence suggesting an obligatoryrole for premotor or motor regions in speech perception. Rather,our results support the idea that recruitment of these regionsvaries with individual differences in cognitive abilities that dependon auditory–motor pathways. These findings strengthen the evi-dence for a link between verbal short-term memory ability andspeech perception, and suggest that individuals with impairedshort-term memory may have particular difficulty recruiting audi-tory motor pathways in speech perception. More generally, ourfindings reinforce the view that speech perception relies on dis-tinct dorsal and ventral pathways (cf. Hickok & Poeppel, 2007; Scott& Johnsrude, 2003). In our work, differential recruitment of thesepathways depends on both the specific demands of the current lis-
tening situation and the underlying cognitive abilities of individuallisteners.
sychol
A
(tIEWsva
R
AA
B
B
BB
B
B
B
B
B
C
C
D
D
D
D
D
D
E
F
F
F
F
G
G
H
G. Szenkovits et al. / Neurop
cknowledgements
This work was supported by the Medical Research CouncilMC US A060 0038). G. Szenkovits was supported by a postdoc-oral fellowship from the Fyssen Foundation and by a Marie Curiendividual Fellowship (project number: 236662), funded by theuropean Commission as part of its Seventh Framework Program.e are grateful to our radiographers, Steve Eldridge, Diana Ever-
on, and Helen Lloyd for assistance with data collection and to ourolunteers for their participation. Finally we also thank the twononymous reviewers for their comments.
eferences
shburner, J., & Friston, K. J. (2005). Unified segmentation. NeuroImage, 26, 839–851.shburner, J., & Friston, K. J. (1997). Multimodal image coregistration and partition-
ing – A unified framework. NeuroImage, 6, 209–217.addeley, A. (1998). Recent developments in working memory. Current Opinion in
Neurobiology, 8, 234–238.addeley, A., Gathercole, S., Papagno, C., & Degli, U. (1998). The phonological loop
as a language learning device. Psychological Review, 105, 158–173.addeley, A. D., & Hitch, G. I. (1974). Working memory New York: Academic Press.esner, D. (1987). Phonology, lexical access in reading, and articulatory suppression:
A critical review. Quarterly Journal of Experimental Psychology: Human Experimen-tal Psychology, 39(3, Sect A), 467–478.
esner, D., Davies, J., & Daniels, S. (1981). Reading for meaning: The effects ofconcurrent articulation. Quarterly Journal of Experimental Psychology: HumanExperimental Psychology, 33a(4), 415–437.
rown, G. D. (1987). Phonological coding in rhyming and homophony judgement.Acta Psychologica, 65(3), 247–262.
uchsbaum, B. R., Hickok, G., & Humphries, C. (2001). Role of left posterior superiortemporal gyrus in phonological processing for speech perception and produc-tion. Cognitive Science, 25, 663–678.
uchsbaum, B. R., Olsen, R. K., Koch, P., & Berman, K. F. (2005). Human dorsal andventral auditory streams subserve rehearsal-based and echoic processes duringverbal working memory. Neuron, 48, 687–697.
urton, M. W., Small, S. L., & Blumstein, S. E. (2000). The role of segmentationin phonological processing: An fMRI investigation. Journal of Cognitive Neuro-science, 12(4), 679–690.
allan, D., Callan, A., Gamez, M., Sato, M.-a., & Kawato, M. (2010). Premotor cortexmediates perceptual performance. NeuroImage, 51, 844–858.
owan, N. (2001). The magical number 4 in short-term memory: A reconsiderationof mental storage capacity. Behavioral and Brain Sciences, 24(1), 87–114.
’Ausilio, A., Pulvermüller, F., Salmas, P., Bufalari, I., Begliomini, C., & Fadiga, L. (2009).The motor somatotopy of speech perception. Current Biology, 381–385.
avis, M., & Johnsrude, I. (2003). Hierarchical processing in spoken language com-prehension. Stimulus, 23, 3423–3431.
avis, M. H., & Johnsrude, I. S. (2007). Hearing speech sounds: Top-down influenceson the interface between audition and speech perception. Hearing Research, 229,132–147.
eeks, J. M., & Carlyon, R. P. (2004). Simulations of cochlear implant hearing usingfiltered harmonic complexes: Implications for concurrent sound segregation.Journal of the Acoustical Society of America, (115), 1736–1746.
evlin, J. T., & Aydelott, J. (2009). Speech perception: Motoric contributions versusthe motor theory. Current Biology, 19(5), 198–200.
ufor, O., Serniclaes, W., Sprenger-Charolles, L., & Demonet, J. F. (2009). Leftpremotor cortex and allophonic speech perception in dyslexia: A PET study.NeuroImage, 46(1), 241–248.
dwards, J., Beckman, M. E., & Munson, B. (2004). The interaction between vocab-ulary size and phonotactic production accuracy and fluency in nonwordrepetition. Hearing Research,
adiga, L., Ferrara, Á., Biomediche, S., Umana, F., Parma, Á., Umana, F., et al. (2002).Speech listening specifically modulates the excitability of tongue muscles: ATMS study. Neuroscience, 15, 399–402.
orster, K. I., & Forster, J. C. (2003). DMDX: A windows display program with mil-lisecond accuracy. Behavior Research Methods, Instruments & Computers, (35),116–124.
riston, K., Ashburner, J., Frith, C., Poline, J.-B., Heather, J., & Frackowiak, R. (1995).Spatial registration and normalization of images. Human Brain Mapping, 2,165–189.
riston, K. J., Frith, C. D., Liddle, P. F., & Frackowiak, R. S. (1991). Comparing functional,(PET) images: The assessment of significant change. Journal of Cerebral Blood Flow& Metabolism, 11(4), 690–699.
athercole, S., & Baddeley, A. (1990). The role of phonological memory in vocabularyacquisition: A study of young children learning new names. British Journal ofPsychology, 81, 439–454.
athercole, S. E., Frankish, C. R., Pickering, S. J., & Peaker, S. (1999). Phonotactic
influences on short-term memory. Journal of Experimental Psychology: Learning,Memory, and Cognition, 25(1), 84–95.ashimoto, Y., & Sakai, K. L. (2003). Brain activations during conscious self-monitoring of speech production with delayed auditory feedback: An fMRIstudy. Human Brain Mapping, 20, 22–28.
ogia 50 (2012) 1380– 1392 1391
Hasson, U., Nusbaum, H. C., & Small, S. L. (2006). Repetition suppression for spo-ken sentences and the effect of task demands. Journal of Cognitive Neuroscience,18(12), 2013–2029.
Hickok, G. (2008). Eight problems for the mirror neuron theory of action understand-ing in monkeys and humans. Journal of Cognitive Neuroscience, 1229–1243.
Hickok, G. (2009). Speech perception does not rely on motor cortex: Responseto D’Ausilio et al. Current Biology,. Available at: http://www.cell.com/current-biology/comments Dausilio
Hickok, G. (2010). The role of mirror neurons in speech perception and action wordsemantics. Language and Cognitive Processes, 25, 749–776.
Hickok, G., & Buchsbaum, B. (2003). Temporal lobe speech perception systems arepart of the verbal working memory circuit: Evidence from two recent fMRIstudies. Behavioral and Brain Sciences, 26, 740–741.
Hickok, G., Buchsbaum, B., Humphries, C., & Muftuler, T. (2003). Auditory–motorinteraction revealed by fMRI: Speech, music, and working memory in area Spt.Journal of Cognitive Neuroscience, 15(5), 673–682.
Hickok, G., Okada, K., Barr, W., Pa, J., Rogalsky, C., Donnelly, K., et al. (2008). Bilateralcapacity for speech sound processing in auditory comprehension: Evidence fromWada procedures. Brain and Language, 107, 179–184.
Hickok, G., & Poeppel, D. (2000). Towards a functional neuroanatomy of speechperception. Trends in Cognitive Sciences, 4, 131–138.
Hickok, G., & Poeppel, D. (2004). Dorsal and ventral streams: A framework for under-standing aspects of the functional anatomy of language. Cognition, 92, 67–99.
Hickok, G., & Poeppel, D. (2007). The cortical organization of speech processing.Nature, 8, 393–402.
Jarrold, C., & Tam, H. (2010). Rehearsal and the development of working memory. Incognitive development and working memory: A dialogue between neo-piagetianand cognitive approaches. Hove: Psychology Press.
Kriegeskorte, N., Simmons, W., Bellgowan, P., & Baker, C. (2009). Circular analysisin systems neuroscience: The dangers of double dipping. Nature Neuroscience,(12), 535–540.
Lichtheim, L. (1885/2006). On aphasia. Brain, 1347–1350.Loftus, G. R., & Masson, M. E. (1994). Using confidence intervals in within-subject
designs. Psychonomic Bulletin & Review, 1(4), 476–490.Lotto, A. J., Hickok, G. S., & Holt, L. L. (2009). Reflections on mirror neurons and speech
perception. Trends in Cognitive Sciences, 110–114.Meister, I. G., Wilson, S. M., Deblieck, C., & Wu, A. D. (2007). The essential role of
premotor cortex in speech perception. Current Biology, 17, 1692–1696.Morais, J., Bertelson, P., Cary, L., & Alegria, J. (1986). Literacy training and speech
segmentation. Cognition, 24, 45–64.Morais, J., Cary, L., Alegria, J., & Bertelson, P. (1979). Does awareness of speech as a
sequence of phones arise spontaneously? Cognition, 7, 323–331.Morais, J., & Kolinsky, R. (1994). Perception and awareness in phonological process-
ing: The case of the phoneme. Cognition, 50, 287–297.Möttönen, R., & Watkins, K. E. (2009). Motor representations of articulators con-
tribute to categorical perception of speech sounds. The Journal of neuroscience:The official journal of the Society for Neuroscience, 29, 9819–9825.
Obleser, J., Wise, R. J. S., Dresner, M. A., & Scott, S. K. (2007). Functional integra-tion across brain regions improves speech perception under adverse listeningconditions. The Journal of Neuroscience, 27(9), 2283–2289.
Osnes, B., Hugdahl, K., & Specht, K. (2011). Effective connectivity analysis demon-strates involvement of premotor cortex during speech perception. NeuroImage,54(3), 2437–2445.
Price, C. J. (2010). The anatomy of language: A review of 100 fMRI studies publishedin 2009. Annals of the New York Academy of Sciences, 1191, 62–88.
Price, C. J., Wise, R. J. S., Warburton, E. A., Moore, C. J., Howard, D., Patterson, K., et al.(1996). Hearing and saying. The functional neuro-anatomy of auditory wordprocessing. Brain, 119, 919–931.
Pulvermüller, F., Huss, M., Kherif, F., Moscoso, F., Hauk, O., & Shtyrov, Y. (2006). Motorcortex maps articulatory features of speech sounds. Proceedings of the NationalAcademy of Sciences, 103, 7865–7870.
Richardson, J. T. (1987). Phonology and reading: The effects of articulatory suppres-sion upon homophony and rhyme judgments. Language and Cognitive Processes,2(3–4), 229–244.
Rodd, J., Davis, M., & Johnsrude, I. (2005). The neural mechanisms of speechcomprehension: fMRI studies of semantic ambiguity. Cerebral Cortex, 15,1261–1269.
Rodd, J., Longe, O., Randall, B., & Tyler, L. (2010). The functional organisation ofthe fronto-temporal language system: Evidence from syntactic and semanticambiguity. Neuropsychologia, 48, 1324–1335.
Sato, M., Tremblay, P., & Gracco, V. (2009). A mediating role of the premotor cortexin phoneme segmentation. Brain and Language, 111(1), 1–7.
Saur, D., Kreher, W. B., Schnell, S., Ku, D., Vry, M.-S., Umarova, R., et al. (2008). Ven-tral and dorsal pathways for language. Proceedings of the National Academy ofSciences, 105.
Scott, S. K., Blank, S. C., Rosen, S., & Wise, R. J. S. (2000). Identification of a pathwayfor intelligible speech in the left temporal lobe. Brain, 123, 2400–2406.
Scott, S. K., & Johnsrude, I. S. (2003). The neuroanatomical and functional organiza-tion of speech perception. Trends in Neurosciences, 26, 100–107.
Scott, S. K., Mcgettigan, C., & Eisner, F. (2009). A little more conversation, a littleless action – Candidate roles for the motor cortex in speech perception. Nature
Reviews Neuroscience, 10.Scott, S. K., & Wise, R. J. S. (2004). The functional neuroanatomy of prelexical pro-cessing in speech perception. Cognition, 92, 13–45.
Seghier, M. L., & Price, C. J. (2009). Dissociating functional brain networks by decodingthe between-subject variability. NeuroImage, 45, 349–359.
1 sycho
S
S
S
v
V
V
information in speech perception. Proceedings of the National Academy of Sciences
392 G. Szenkovits et al. / Neurop
kipper, J. I., van Wassenhove, V., Nusbaum, H. C., & Small, S. L. (2007). Hearing lipsand seeing voices: How cortical areas supporting speech production mediateaudiovisual speech perception. Cerebral Cortex, 17, 2387–2399.
oltysik, D. A., & Hyde, J. S. (2006). Strategies for block-design fMRI experimentsduring task-related motion of structures of the oral cavity. NeuroImage, 29(4),1260–1271.
oltysik, D. A., & Hyde, J. S. (2008). High spatial resolution increases the specificityof block-design BOLD fMRI studies of overt vowel production. NeuroImage, (41),389–397.
an Wassenhove, V., Grant, K. W., & Poeppel, D. (2005). Visual speech speeds upthe neural processing of auditory speech. Proceedings of the National Academy ofSciences of the United States of America, 102(4), 1181–1186.
itevitch, M. S., Armbrüster, J., & Chu, S. (2004). Sublexical and lexical repre-
sentations in speech production: Effects of phonotactic probability and onsetdensity. Journal of Experimental Psychology: Learning, Memory, and Cognition,30(2), 514–529.itevitch, M. S., & Luce, P. A. (2005). Increases in phonotactic probability facilitatespoken nonword repetition. Journal of memory and language, 52, 193–204.
logia 50 (2012) 1380– 1392
Warrington, E. K., & Shallice, T. (1969). The selective impairment of auditory shortterm memory. Brain, 92, 885–896.
Watkins, K. E., Strafella, A. P., & Paus, T. (2003). Seeing and hearing speech excites themotor system involved in speech production. Electromyography, 41, 989–994.
Wechsler, D. (1998). The Wechsler Adult Intelligence Scale-third edition (WAIS-III). ThePsychological Corporation.
Wilson, S. M., & Iacoboni, M. (2006). Neural responses to non-native phonemes vary-ing in producibility: Evidence for the sensorimotor nature of speech perception.Scanning.
Wilson, S. M., Saygin, P., & Sereno, M. I. (2004). Listening to speech activates motorareas involved in speech production. Nature Neuroscience, 3–4.
Yuen, I., Davis, M. H., Brysbaert, M., & Rastle, K. (2009). Activation of articulatory
of the United States of America, 2–11.Zheng, Z., Munhall, K., & Johnsrude, I. (2010). Functional overlap between regions
involved in speech perception and in monitoring one’s own voice during speechproduction. Journal of Cognitive Neuroscience, 22(8), 1770–1781.


