Dorsal premotor cortex is involved in switching motor plans · PDF fileDorsal premotor cortex...
15
ORIGINAL RESEARCH ARTICLE published: 04 April 2012 doi: 10.3389/fneng.2012.00005 Dorsal premotor cortex is involved in switching motor plans Alexandre Pastor-Bernier , Elsa Tremblay and Paul Cisek * Département de Physiologie and Groupe de Recherche sur le Système Nerveux Central, Université de Montréal, Montréal, QC, Canada Edited by: Giovanni Mirabella, La Sapienza University, Italy Reviewed by: Hun-Kuk Park, Kyung Hee University, Korea (South) Vassiliy Tsytsarev, University of Maryland School of Medicine, USA Giovanni Mirabella, La Sapienza University, Italy *Correspondence: Paul Cisek, Département de Physiologie, Université de Montréal, C.P. 6218 Succursale Centre-ville, Montréal, QC H3C 3J7, Canada. e-mail: [email protected] Previous studies have shown that neural activity in primate dorsal premotor cortex (PMd) can simultaneously represent multiple potential movement plans, and that activity related to these movement options is modulated by their relative subjective desirability. These findings support the hypothesis that decisions about actions are made through a competition within the same circuits that guide the actions themselves. This hypothesis further predicts that the very same cells that guide initial decisions will continue to update their activities if an animal changes its mind. For example, if a previously selected movement option suddenly becomes unavailable, the correction will be performed by the same cells that selected the initial movement, as opposed to some different group of cells responsible for online guidance. We tested this prediction by recording neural activity in the PMd of a monkey performing an instructed-delay reach selection task. In the task, two targets were simultaneously presented and their border styles indicated whether each would be worth 1, 2, or 3 juice drops. In a random subset of trials (FREE), the monkey was allowed a choice while in the remaining trials (FORCED) one of the targets disappeared at the time of the GO signal. In FORCED-LOW trials the monkey was forced to move to the less valuable target and started moving either toward the new target (Direct) or toward the target that vanished and then curved to reach the remaining one (Curved). Prior to the GO signal, PMd activity clearly reflected the monkey’s subjective preference, predicting his choices in FREE trials even with equally valued options. In FORCED-LOW trials, PMd activity reflected the switch of the monkey’s plan as early as 100ms after the GO signal, well before movement onset (MO). This confirms that the activity is not related to feedback from the movement itself, and suggests that PMd continues to participate in action selection even when the animal changes its mind on-line. These findings were reproduced by a computational model suggesting that switches between action plans can be explained by the same competition process responsible for initial decisions. Keywords: decision-making, movement preparation, reach, motor planning, free choice, monkey, computational model, biased competition INTRODUCTION Natural behavior requires animals to make many kinds of deci- sions. For example, an animal is often faced with selecting between different movements that accomplish the same behav- ioral goal, such as different directions to run to escape a predator. At a higher level of selection, the same animal may decide between different types of activity, such as running away versus turning around to fight. Still other kinds of decisions may involve purely abstract choices, which are not (at least immediately) associated with any specific action. In human behavior, such decisions may be extremely abstract, such as choosing what kind of career to pursue in life. Because the brain was built through continuous evolutionary refinement, we expect that the neural mechanisms of decisions at different levels of abstraction share many aspects of their architecture, and that consideration of simple spatial decisions between movement options may yield insights into decision-making in general (Cisek and Kalaska, 2010). Recent work has suggested that, at least in the case of select- ing between actions, decision-making is intimately integrated with sensorimotor control (Basso and Wurtz, 1998; Platt and Glimcher, 1999; Romo et al., 2004; Cisek and Kalaska, 2005; Gold and Shadlen, 2007). This has led to the proposal that while an animal is deciding between actions, neural activity in the sen- sorimotor system represents several movements simultaneously and the decision is made by selecting between these parallel rep- resentations (Kim and Shadlen, 1999; Cisek, 2007; Cisek and Kalaska, 2010). For example, Cisek and Kalaska (2005) found that while a monkey is deciding between two different potential reach- ing movements, neural activity in dorsal premotor cortex (PMd) represents both options simultaneously and reflects the selec- tion of one over the other when the monkey makes his choice. This is consistent with earlier proposals suggesting parallel move- ment preparation (Fagg and Arbib, 1998; Tipper et al., 1998; Erlhagen and Schoner, 2002), and with the hypothesis that action selection is accomplished through a biased competition within a sensorimotor map of potential actions (Cisek, 2006). This “affordance competition” hypothesis (Cisek, 2007) stands in contrast to the classical serial model, in which decisions Frontiers in Neuroengineering www.frontiersin.org April 2012 | Volume 5 | Article 5 | 1 NEUROENGINEERING
Transcript of Dorsal premotor cortex is involved in switching motor plans · PDF fileDorsal premotor cortex...
ORIGINAL RESEARCH ARTICLEpublished: 04 April 2012
doi: 10.3389/fneng.2012.00005
Dorsal premotor cortex is involved in switchingmotor plansAlexandre Pastor-Bernier , Elsa Tremblay and Paul Cisek*
Département de Physiologie and Groupe de Recherche sur le Système Nerveux Central, Université de Montréal, Montréal, QC, Canada
Edited by:
Giovanni Mirabella, La SapienzaUniversity, Italy
Reviewed by:
Hun-Kuk Park, Kyung HeeUniversity, Korea (South)Vassiliy Tsytsarev, University ofMaryland School of Medicine, USAGiovanni Mirabella, La SapienzaUniversity, Italy
*Correspondence:
Paul Cisek, Département dePhysiologie, Université de Montréal,C.P. 6218 Succursale Centre-ville,Montréal, QC H3C 3J7, Canada.e-mail: [email protected]
Previous studies have shown that neural activity in primate dorsal premotor cortex(PMd) can simultaneously represent multiple potential movement plans, and that activityrelated to these movement options is modulated by their relative subjective desirability.These findings support the hypothesis that decisions about actions are made through acompetition within the same circuits that guide the actions themselves. This hypothesisfurther predicts that the very same cells that guide initial decisions will continue toupdate their activities if an animal changes its mind. For example, if a previously selectedmovement option suddenly becomes unavailable, the correction will be performed by thesame cells that selected the initial movement, as opposed to some different group of cellsresponsible for online guidance. We tested this prediction by recording neural activity inthe PMd of a monkey performing an instructed-delay reach selection task. In the task, twotargets were simultaneously presented and their border styles indicated whether eachwould be worth 1, 2, or 3 juice drops. In a random subset of trials (FREE), the monkey wasallowed a choice while in the remaining trials (FORCED) one of the targets disappearedat the time of the GO signal. In FORCED-LOW trials the monkey was forced to moveto the less valuable target and started moving either toward the new target (Direct) ortoward the target that vanished and then curved to reach the remaining one (Curved).Prior to the GO signal, PMd activity clearly reflected the monkey’s subjective preference,predicting his choices in FREE trials even with equally valued options. In FORCED-LOWtrials, PMd activity reflected the switch of the monkey’s plan as early as 100 ms after theGO signal, well before movement onset (MO). This confirms that the activity is not relatedto feedback from the movement itself, and suggests that PMd continues to participatein action selection even when the animal changes its mind on-line. These findings werereproduced by a computational model suggesting that switches between action plans canbe explained by the same competition process responsible for initial decisions.
Keywords: decision-making, movement preparation, reach, motor planning, free choice, monkey, computational
model, biased competition
INTRODUCTIONNatural behavior requires animals to make many kinds of deci-sions. For example, an animal is often faced with selectingbetween different movements that accomplish the same behav-ioral goal, such as different directions to run to escape a predator.At a higher level of selection, the same animal may decide betweendifferent types of activity, such as running away versus turningaround to fight. Still other kinds of decisions may involve purelyabstract choices, which are not (at least immediately) associatedwith any specific action. In human behavior, such decisions maybe extremely abstract, such as choosing what kind of career topursue in life. Because the brain was built through continuousevolutionary refinement, we expect that the neural mechanismsof decisions at different levels of abstraction share many aspectsof their architecture, and that consideration of simple spatialdecisions between movement options may yield insights intodecision-making in general (Cisek and Kalaska, 2010).
Recent work has suggested that, at least in the case of select-ing between actions, decision-making is intimately integrated
with sensorimotor control (Basso and Wurtz, 1998; Platt andGlimcher, 1999; Romo et al., 2004; Cisek and Kalaska, 2005; Goldand Shadlen, 2007). This has led to the proposal that while ananimal is deciding between actions, neural activity in the sen-sorimotor system represents several movements simultaneouslyand the decision is made by selecting between these parallel rep-resentations (Kim and Shadlen, 1999; Cisek, 2007; Cisek andKalaska, 2010). For example, Cisek and Kalaska (2005) found thatwhile a monkey is deciding between two different potential reach-ing movements, neural activity in dorsal premotor cortex (PMd)represents both options simultaneously and reflects the selec-tion of one over the other when the monkey makes his choice.This is consistent with earlier proposals suggesting parallel move-ment preparation (Fagg and Arbib, 1998; Tipper et al., 1998;Erlhagen and Schoner, 2002), and with the hypothesis that actionselection is accomplished through a biased competition within asensorimotor map of potential actions (Cisek, 2006).
This “affordance competition” hypothesis (Cisek, 2007) standsin contrast to the classical serial model, in which decisions
Frontiers in Neuroengineering www.frontiersin.org April 2012 | Volume 5 | Article 5 | 1
NEUROENGINEERING
Pastor-Bernier et al. Plan switching in premotor cortex
are made in higher cognitive centers and the resulting choicepassed down to the sensorimotor system for execution. Instead,it suggests that decisions are determined when a competitionbetween actions is resolved within the sensorimotor system—e.g., for reaching, within the fronto-parietal cortex and associatedcorticostriatal loops. This means that although the biases thatinfluence the decision may come from many sources, includingthe activity of higher cognitive regions, it is in the sensorimo-tor system that the final decision is taken. For selecting betweenactions, this makes good sense from an ecological perspective: thesystems most sensitive to the spatial and dynamic attributes ofthe candidate actions are best qualified to make the final selectionthat takes all of these factors into account. For example, whenchoosing between actions, the spatial layout of the immediateenvironment directly specifies the options and is of critical impor-tance for evaluating what is the best choice in terms of payoffs andcosts. Indeed, all else being equal, humans select the action thatis least demanding from a biomechanical perspective (Cos et al.,2011), suggesting that the same “forward models” (Shadmehret al., 2010) useful for predicting the consequences of motor com-mands may also play a role in selecting the actions themselves bybiasing activity in sensorimotor cortices.
Decision-making within a sensorimotor map is particularlyuseful for spatial choices, such as selecting among different waysto escape a predator through an environment filled with obsta-cles. If two escape routes are close together, then you should notwaste time deciding but instead run between them and choosein flight. In contrast, if you are up against a wall then a clear“winner-take-all” decision is critical, even if it takes a little moretime to resolve. Finally, even during ongoing escape, you mustcontinuously evaluate and update the options presented by theenvironment in case what appeared as an escape route turns outto be a dead end and/or if a new and better option presents itself.If that new option is already partially represented in sensorimotormaps of potential actions, then switching to it will be very fast.
In an analogy to the above scenario, here we consider selec-tion between reaching movements to different spatially specifiedtargets. The affordance competition hypothesis predicts that if wepresent a monkey with multiple reaching options associated withdifferent rewards, neural activity in PMd will be modulated bythe relative value of those rewards. However, if a single optionis present, then its value will not influence PMd activity becausethere is no competition. A recent study in our lab (Pastor-Bernierand Cisek, 2011) confirmed both of these predictions, showingrelative value modulation when two targets were presented butno value modulation with one target. Furthermore, it was foundthat the competition between options was strongest when theywere furthest apart—just as predicted in the prey escape exam-ple described above. All of these results are consistent with theidea that the competition unfolds within a sensorimotor map thatrespects the pragmatic issues of selecting actions in space, andall of them could be simulated with a simple model of biasedcompetition among populations of tuned cells (Cisek, 2006).
In summary, previous studies have shown that the process ofdeciding between actions involves the very same brain regionsthat are implicated in sensorimotor guidance of actions, consis-tent with the affordance competition hypothesis (Cisek, 2007).
However, the hypothesis also makes a complementary predic-tion: that the same cells involved in selecting the initial actionwill continue to be involved in adjusting and even switchingbetween actions during overt behavior. In other words, if theenvironment changes and old opportunities are lost or new onesbecome available, the same integrated selection and sensorimotorguidance system should reflect the switch of the plan. Here, weinvestigate this issue by examining neural activity in PMd after amonkey has chosen one of two actions, but the selected optionbecomes unavailable. We examined the same cells whose delayperiod activity showed relative value modulation in our previouswork (Pastor-Bernier and Cisek, 2011) but extended our analysisto the activity after the GO signal, with particular interest in tri-als in which the option with highest payoff becomes unavailable.Some of these results have been previously presented in abstractform (Pastor-Bernier et al., 2011).
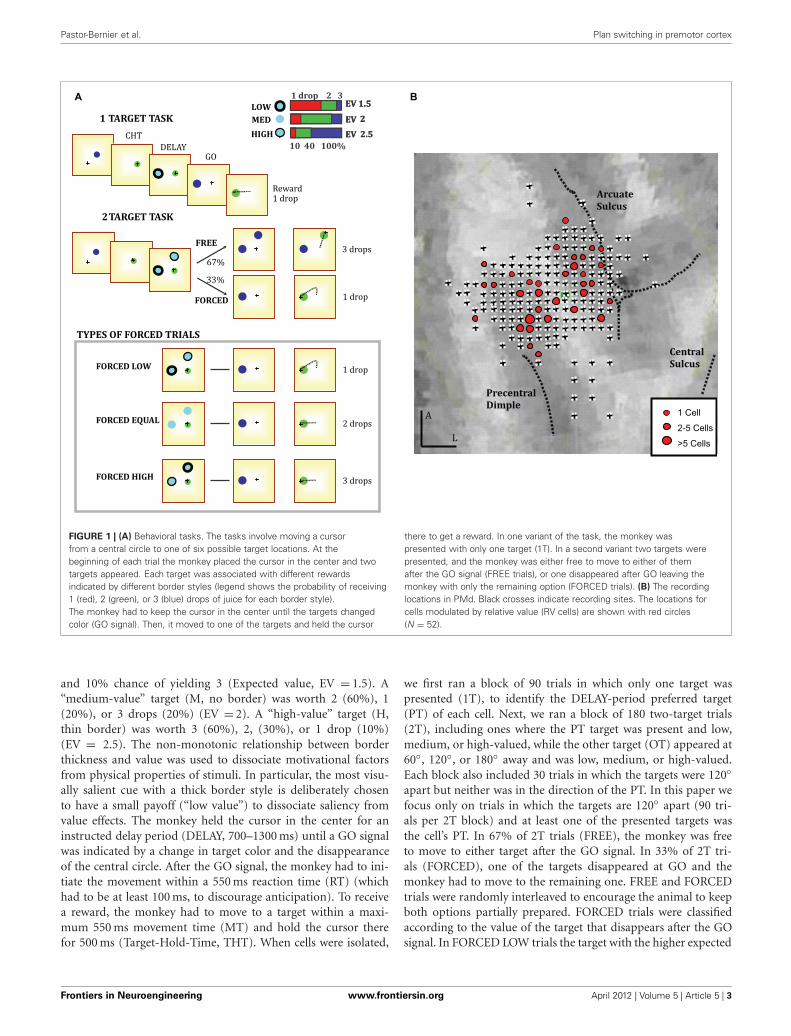
MATERIALS AND METHODSINSTRUMENTATION AND TECHNICAL PROCEDURESA male monkey (Macaca mulatta) performed a planar center-outreaching task illustrated in Figure 1A. The task involved mov-ing a cursor from a central circle (2 cm radius) to one of sixpossible targets (2.4 cm radius) spaced at 60◦ intervals around a12.6 cm radius circle. The monkey performed movements using acordless stylus whose position was recorded (125 Hz) by a dig-itizing tablet (CalComp). Target stimuli and continuous cursorfeedback were projected onto a mirror suspended between themonkey’s gaze and the tablet, creating the illusion that they are inthe plane of the tablet. Oculomotor behavior was unconstrained,as eye movements do not strongly influence arm-related PMdactivity (Cisek and Kalaska, 2002), but was monitored with aninfrared oculometer (ASL). Neural activity was recorded with 3–4independently moveable microelectrodes (NAN microdrive) anddata acquisition was performed with AlphaLab (Alpha-Omega).On-line spike discrimination was used to estimate cell preferreddirections for choosing target locations. All analog waveformswere stored on disk for offline sorting using principal compo-nents (Plexon). All task events, trajectory data and spike timeswere stored in a database (Microsoft SQL Server 2005) accessedthrough custom scripts for data analysis (Matlab). After complet-ing training, the animal was implanted under general anesthesiawith a titanium head post and a recording chamber placedusing MRI images (Brainsight primate). The chamber was cen-tered on the arm area of PMd, between the precentral dimpleand the junction of the arcuate sulcus and spur (Figure 1B).All procedures followed university and national guidelines foranimal care.
BEHAVIORAL TASKThe monkey began each trial by placing the cursor in the cen-tral circle for a 350–650 ms Center-Hold-Time (CHT). Next, oneor two cyan targets appeared, with border styles indicating theamount of juice that the monkey was likely to receive for reachingto that target (See Figure 1A, inset). The reward was determinedprobabilistically to encourage the monkey to explore availableoptions (Herrnstein, 1961). A “low-value” target (L, thick border)had a 60% chance of yielding 1 drop, 30% chance of yielding 2,
Frontiers in Neuroengineering www.frontiersin.org April 2012 | Volume 5 | Article 5 | 2
Pastor-Bernier et al. Plan switching in premotor cortex
Central Sulcus
Arcuate Sulcus
A
L
Precentral Dimple
1 Cell
2-5 Cells
>5 Cells
FREE
FORCED
3 drops
1 drop
67%
33%
DELAYGO
CHT
Reward1 drop
1 TARGET TASK
2TARGET TASK
EV 1.5
2
2.5
1 drop 2 3EV 1.5
2
2.5
LOWMEDHIGH
10 40 100%
1 drop
2 drops
3 drops
TYPES OF FORCED TRIALS
FORCED LOW
FORCED EQUAL
FORCED HIGH
EV EV EV EV
A B
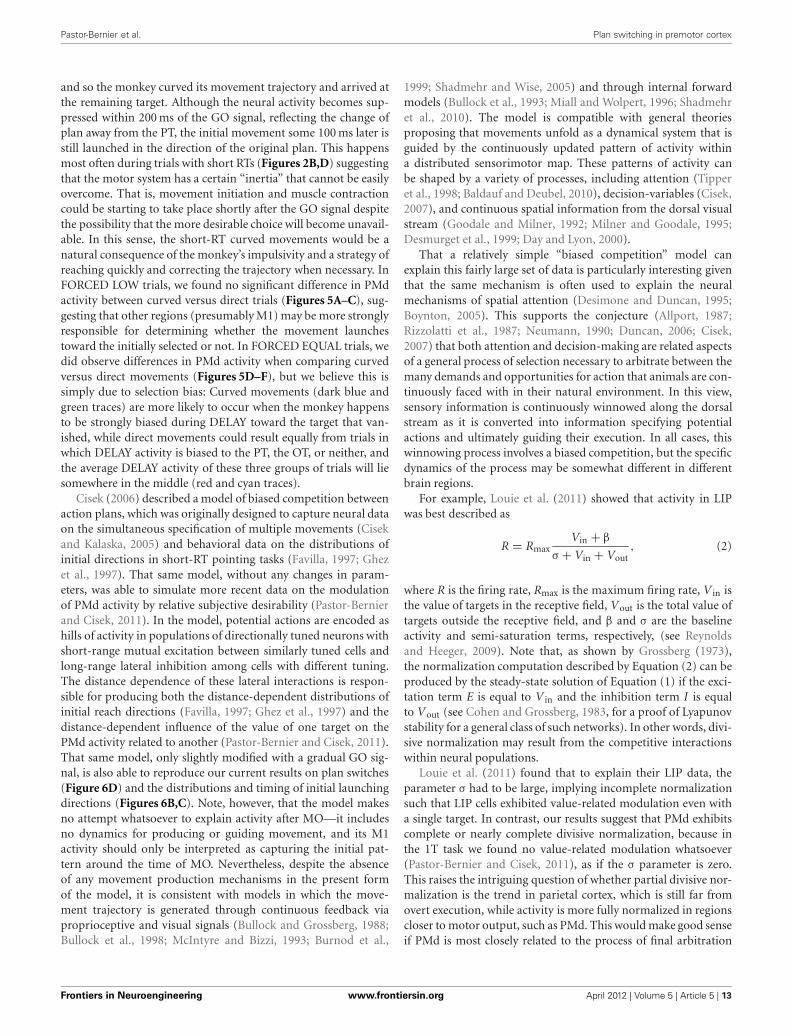
FIGURE 1 | (A) Behavioral tasks. The tasks involve moving a cursorfrom a central circle to one of six possible target locations. At thebeginning of each trial the monkey placed the cursor in the center and twotargets appeared. Each target was associated with different rewardsindicated by different border styles (legend shows the probability of receiving1 (red), 2 (green), or 3 (blue) drops of juice for each border style).The monkey had to keep the cursor in the center until the targets changedcolor (GO signal). Then, it moved to one of the targets and held the cursor
there to get a reward. In one variant of the task, the monkey waspresented with only one target (1T). In a second variant two targets werepresented, and the monkey was either free to move to either of themafter the GO signal (FREE trials), or one disappeared after GO leaving themonkey with only the remaining option (FORCED trials). (B) The recordinglocations in PMd. Black crosses indicate recording sites. The locations forcells modulated by relative value (RV cells) are shown with red circles(N = 52).
and 10% chance of yielding 3 (Expected value, EV = 1.5). A“medium-value” target (M, no border) was worth 2 (60%), 1(20%), or 3 drops (20%) (EV = 2). A “high-value” target (H,thin border) was worth 3 (60%), 2, (30%), or 1 drop (10%)(EV = 2.5). The non-monotonic relationship between borderthickness and value was used to dissociate motivational factorsfrom physical properties of stimuli. In particular, the most visu-ally salient cue with a thick border style is deliberately chosento have a small payoff (“low value”) to dissociate saliency fromvalue effects. The monkey held the cursor in the center for aninstructed delay period (DELAY, 700–1300 ms) until a GO signalwas indicated by a change in target color and the disappearanceof the central circle. After the GO signal, the monkey had to ini-tiate the movement within a 550 ms reaction time (RT) (whichhad to be at least 100 ms, to discourage anticipation). To receivea reward, the monkey had to move to a target within a maxi-mum 550 ms movement time (MT) and hold the cursor therefor 500 ms (Target-Hold-Time, THT). When cells were isolated,
we first ran a block of 90 trials in which only one target waspresented (1T), to identify the DELAY-period preferred target(PT) of each cell. Next, we ran a block of 180 two-target trials(2T), including ones where the PT target was present and low,medium, or high-valued, while the other target (OT) appeared at60◦, 120◦, or 180◦ away and was low, medium, or high-valued.Each block also included 30 trials in which the targets were 120◦apart but neither was in the direction of the PT. In this paper wefocus only on trials in which the targets are 120◦ apart (90 tri-als per 2T block) and at least one of the presented targets wasthe cell’s PT. In 67% of 2T trials (FREE), the monkey was freeto move to either target after the GO signal. In 33% of 2T tri-als (FORCED), one of the targets disappeared at GO and themonkey had to move to the remaining one. FREE and FORCEDtrials were randomly interleaved to encourage the animal to keepboth options partially prepared. FORCED trials were classifiedaccording to the value of the target that disappears after the GOsignal. In FORCED LOW trials the target with the higher expected
Frontiers in Neuroengineering www.frontiersin.org April 2012 | Volume 5 | Article 5 | 3
Pastor-Bernier et al. Plan switching in premotor cortex
value disappears (inset in Figure 1A bottom), while the oppositeis true in FORCED HIGH trials. In a FORCED EQUAL trial boththe target that disappears and the target that remains have thesame value.
KINEMATIC ANALYSISMovement trajectories were re-sampled at a constant rate(200 Hz) and filtered using a two-way butterworth filter [0 phaselag, 4th order, norm. cutoff 0.05 (∼20 Hz)] using Matlab func-tions butter and filtfilt (Mathworks). The initial direction vector(IDV) was calculated as the X and Y coordinate cartesian arct-angent (atan2) between the position at movement onset (MO)and the position 100 ms later. Trials were sorted by short RT(<180 ms), medium RT (between 180 ms and 240 ms) or long RT(>240 ms). The mean trajectory profiles and mean IDVs were cal-culated for each RT group independently. To determine whetherthe IDV was pointing to a given target in space, we calculatedthe mean IDV in the 1T condition for each target individually.Then, 2T trials were classified as “direct” to the selected target iftheir IDV fell within ±60 degrees of that target’s mean IDV in the1T condition. Trials whose IDV pointed away from the ultimatelyacquired target were classified as “curved.”
CELL TUNING AND RELATIVE VALUE DISCRIMINATIONWe investigated only cells that had both spatial tuning and rel-ative value discrimination (see Pastor-Bernier and Cisek, 2011)during DELAY. We calculated directional tuning preferences forthe cells during each behavioral epoch (DELAY, MT, and THT)and assessed significance with a non-parametric bootstrap test(1000 shuffles, p < 0.05; Cisek et al., 2003). To assess whethera cell discriminated relative value during DELAY, we exam-ined whether the cell showed statistically significant differencesin firing rate between a “HIGH” value condition (value inPT was larger than OT) and a “LOW” value condition (valuein OT larger than PT) for the last 300 ms prior to the GOsignal (One-Way ANOVA, p < 0.05). This was done to verifywhether the same cells that are involved in the initial deci-sion continue to reflect plan switches after the GO signal. Cellssatisfying both requirements were used for post-GO analyses.Discrimination latencies were obtained using a sliding ANOVAmethod adapted from Peng et al., 2008 (window: 50 ms, step:5 ms, p < 0.05) to perform a statistical temporal analysis betweenthe HIGH and LOW value conditions. We obtained latenciesfor relative value discrimination with respect to the GO sig-nal by aligning the neural activity on GO and parsing eachtrial backwards for 700 ms (shortest variable DELAY duration).This chosen interval ensured that all trials had a similar timerange for firing rate comparisons. The latency of relative-valuediscrimination was obtained as the last 80 ms sliding time-window for which a statistical difference could be observed.The cells that satisfied both the One-Way ANOVA and sliding-ANOVA requirements were called relative value discriminatingcells (RV cells, N: 52). This population is identical to the data-setdescribed previously (Pastor-Bernier and Cisek, 2011) in whichrelative-value effects were assessed for particular value combi-nations (PTvsOT: 3vs1, 2vs1, 3vs2) using paired ANOVA andTukey–Kramer tests.
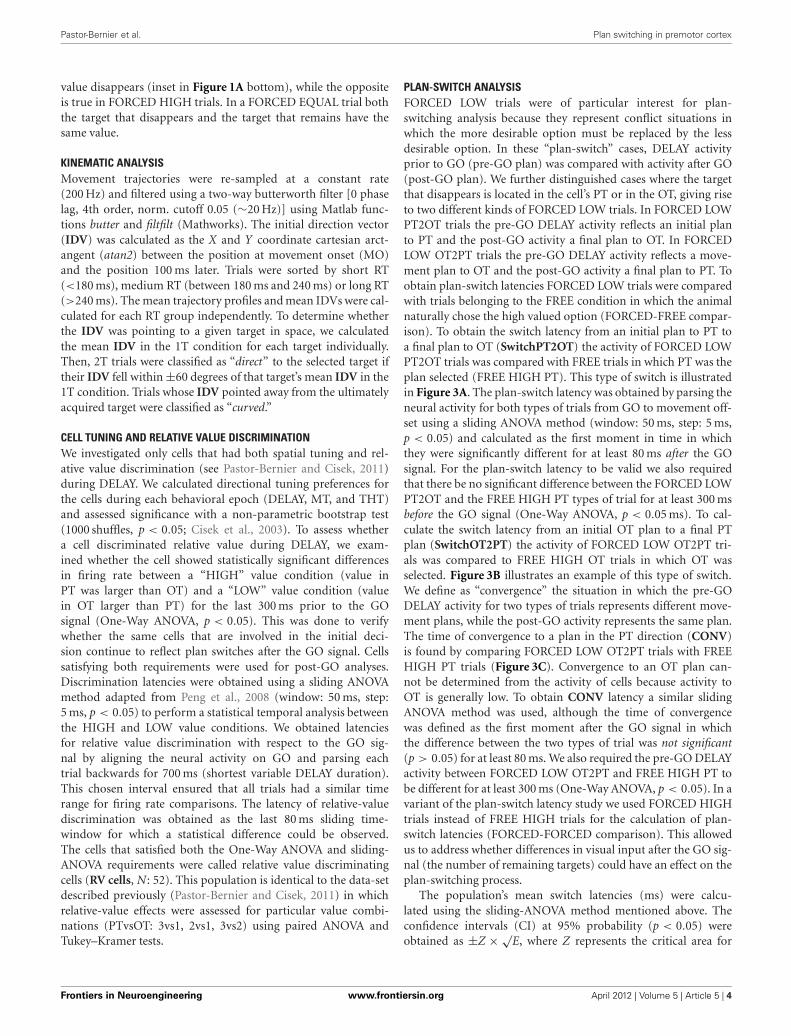
PLAN-SWITCH ANALYSISFORCED LOW trials were of particular interest for plan-switching analysis because they represent conflict situations inwhich the more desirable option must be replaced by the lessdesirable option. In these “plan-switch” cases, DELAY activityprior to GO (pre-GO plan) was compared with activity after GO(post-GO plan). We further distinguished cases where the targetthat disappears is located in the cell’s PT or in the OT, giving riseto two different kinds of FORCED LOW trials. In FORCED LOWPT2OT trials the pre-GO DELAY activity reflects an initial planto PT and the post-GO activity a final plan to OT. In FORCEDLOW OT2PT trials the pre-GO DELAY activity reflects a move-ment plan to OT and the post-GO activity a final plan to PT. Toobtain plan-switch latencies FORCED LOW trials were comparedwith trials belonging to the FREE condition in which the animalnaturally chose the high valued option (FORCED-FREE compar-ison). To obtain the switch latency from an initial plan to PT toa final plan to OT (SwitchPT2OT) the activity of FORCED LOWPT2OT trials was compared with FREE trials in which PT was theplan selected (FREE HIGH PT). This type of switch is illustratedin Figure 3A. The plan-switch latency was obtained by parsing theneural activity for both types of trials from GO to movement off-set using a sliding ANOVA method (window: 50 ms, step: 5 ms,p < 0.05) and calculated as the first moment in time in whichthey were significantly different for at least 80 ms after the GOsignal. For the plan-switch latency to be valid we also requiredthat there be no significant difference between the FORCED LOWPT2OT and the FREE HIGH PT types of trial for at least 300 msbefore the GO signal (One-Way ANOVA, p < 0.05 ms). To cal-culate the switch latency from an initial OT plan to a final PTplan (SwitchOT2PT) the activity of FORCED LOW OT2PT tri-als was compared to FREE HIGH OT trials in which OT wasselected. Figure 3B illustrates an example of this type of switch.We define as “convergence” the situation in which the pre-GODELAY activity for two types of trials represents different move-ment plans, while the post-GO activity represents the same plan.The time of convergence to a plan in the PT direction (CONV)is found by comparing FORCED LOW OT2PT trials with FREEHIGH PT trials (Figure 3C). Convergence to an OT plan can-not be determined from the activity of cells because activity toOT is generally low. To obtain CONV latency a similar slidingANOVA method was used, although the time of convergencewas defined as the first moment after the GO signal in whichthe difference between the two types of trial was not significant(p > 0.05) for at least 80 ms. We also required the pre-GO DELAYactivity between FORCED LOW OT2PT and FREE HIGH PT tobe different for at least 300 ms (One-Way ANOVA, p < 0.05). In avariant of the plan-switch latency study we used FORCED HIGHtrials instead of FREE HIGH trials for the calculation of plan-switch latencies (FORCED-FORCED comparison). This allowedus to address whether differences in visual input after the GO sig-nal (the number of remaining targets) could have an effect on theplan-switching process.
The population’s mean switch latencies (ms) were calcu-lated using the sliding-ANOVA method mentioned above. Theconfidence intervals (CI) at 95% probability (p < 0.05) wereobtained as ±Z × √
E, where Z represents the critical area for
Frontiers in Neuroengineering www.frontiersin.org April 2012 | Volume 5 | Article 5 | 4
Pastor-Bernier et al. Plan switching in premotor cortex
the distribution of mean switch latencies across trials. Z can beapproximated to ±1.96 assuming by the central limit theorem(Polya, 1920) that the mean distribution tends to normality withlarge sample sizes. The variable E represents the error variance ofthe mean and was calculated using the expression correcting foroverlapping intervals described in Müller (1993) (Equation 3.7)and cited elsewhere (Dacorogna et al., 2001; Hansen and Lunde,2006).
E = r/N2 × [rR − (r2 − 1)/3]
where r = min(m,N), R = max(m,N) and where m is the over-lap between intervals and N is the number of samples per timeinterval.
In our case we have a 50 ms window sliding by 5 ms bins.Therefore, m = 45 and N = 10. Because m > N, then r = N, andR = m, and the previous expression takes the form:
E = m − N/3 − 1/3N
Solving numerically with m = 45 and N = 10, we obtain E =41.7 and therefore,
CI = ±1.96√
41.7 = ±12.6 ≈ ±13 ms
With no overlap m = 0, r = 0, R = 1, N = 1, and the error ofoverlap E = 0.
COMPUTATIONAL MODELINGThe model (Cisek, 2006) is aimed at explaining and predictingsystems-level phenomena such as response patterns over largepopulation of neurons. It is implemented with a set of equa-tions describing the activity of several populations of neurons thatcorrespond to specific cortical regions. Each population is orga-nized as a layer of neurons that are tuned to spatial directionsof potential actions. Each neuron in a layer behaves according toan expression that defines how its activity changes over time asa function of four terms: passive decay, excitation toward satu-ration, inhibition, and noise. This expression can also be called“mean-rate leaky integrator” (Grossberg, 1973) and takes thefollowing form:
dX/dt = −αX + (β − X)γ · E − X · I + θ, (1)
where X is the mean firing rate of a given neuron, dX/dt isthe change in rate over time, E is the excitatory input, I is theinhibitory input, α is a decay rate, β is the maximum activity ofa neuron, γ is the excitatory gain, and θ is the Gaussian noise.The connections between each layer are hardwired and organizedto respect basic neuroanatomical connection patterns. Furtherdetails concerning connectivity patterns and model behavior havebeen described previously elsewhere (Cisek, 2006). For purposesof the present task the model’s “prefrontal” activity was scaledby a signal related to the absolute value of each target (low =0.3, medium = 0.7, high = 1.0). To simulate plan switches, weremoved one of the two presented targets (high valued targetin FORCED LOW trials) at the beginning of the GO epoch. All
parameter settings were identical to Cisek (2006), except thatwe used a gradual GO signal that allows the activity in PMdto gradually spill into the M1 layer. The gradual GO signal isdefined as a multiplicative factor that scales the input from PMdto M1 and is zero before the GO instruction. After the GOinstruction, it grows as 2.5·t where t is the time since the GOinstruction.
Note that the model in its present form is not intended to sim-ulate the movement itself. Activity in the model M1 populationsimply indicates the initial direction of movement, computed asthe preferred direction of the first M1 cell that crosses a thresholdof activity equal to 1.75.
BEHAVIORAL RESULTSIn 1T trials the monkey’s success rate was 98%, in 2T FREE it was99%, and in 2T FORCED it was 96% (in all cases N > 60,000).In 2T FREE trials the monkey selected the more valuable target90% of the time, indicating that he understood the meaning of thestimulus cues. We found that movement times (MT) were shorterto higher-valued targets in 1T trials (400 ms to high-value and416 ms to low-value targets). Although the difference was small,it was significant (Kolmogorov–Smirnov test (KS), p < 0.01). RTsin 1T trials did not depend on target value (KS-test p > 0.05 forall comparisons).
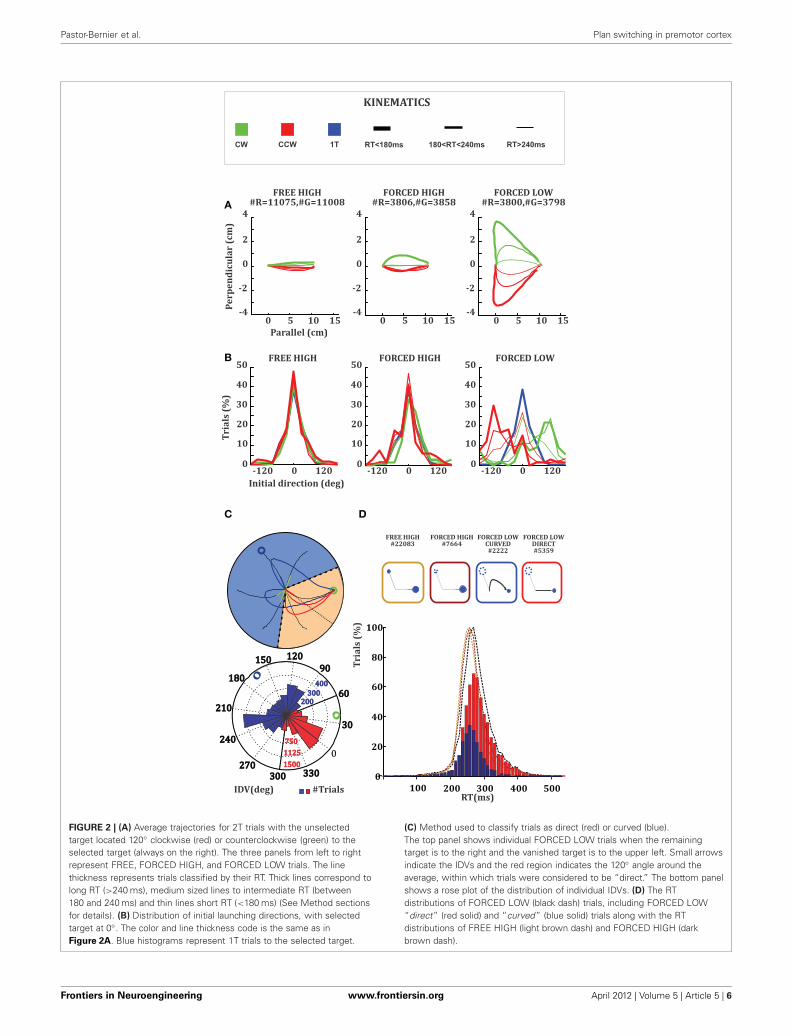
We observed an interaction effect between RT and trajectorykinematics in 2T trials. Trajectories belonging to short RT tri-als were generally more curved than trajectories belonging tomedium or long RT trials (Figure 2A). This effect was accentuatedby the value of the unselected target with respect to the value ofthe selected target in the FORCED condition. Trajectories in theFORCED LOW condition (Figure 2A, rightmost panel) were gen-erally more curved than the ones in the FORCED HIGH or FREEHIGH conditions (Figure 2A, left and middle panels). Thesecurved movements have an initial launching direction towardthe target that vanishes and are corrected later to the remain-ing target. To quantify this we obtained the mean trajectory IDVacross all conditions (Figure 2B). We observed that a great dealof the curvature in FORCED LOW trials was due to movementslaunching to the target that becomes unavailable after GO (Highvalue). This effect was particularly strong for short RT trials andmoderate for intermediate RT trials. Long RT trials were essen-tially straight toward the remaining target (Figure 2B, rightmostpanel). We didn’t see this effect when the monkey was forced tomove to the high value target or when the monkey was free tochoose among the two targets, because in either situation the pre-ferred and available target were the same. We further investigatedthe interaction between RT, relative value, and initial launch-ing direction by comparing raw RT distributions. The meanRTs in FREE HIGH (266 ms, light-brown dashed histogram),FORCED HIGH (271 ms, dark-brown dashed histogram), andFORCED LOW (279 ms, black dashed histogram), were very sim-ilar (Figure 2D) with only small differences between the meanRTs in FREE HIGH and FORCED LOW distributions (KS-test,p < 0.01). This could be due to the contribution of a higher pro-portion of correct trials in FREE HIGH than in FORCED LOWtrials (3% difference). Most importantly we observed that themean RT in FORCED LOW trials with “direct” trajectories (red
Frontiers in Neuroengineering www.frontiersin.org April 2012 | Volume 5 | Article 5 | 5
Pastor-Bernier et al. Plan switching in premotor cortex
FREE HIGH#22083
FORCED HIGH#7664
FORCED LOWCURVED#2222
FORCED LOWDIRECT#5359
100 200 400 5000
20
40
60
80
100
300
FREE HIGH#R=11075,#G=11008
FORCED HIGH#R=3806,#G=3858
FORCED LOW#R=3800,#G=3798
FREE HIGH FORCED HIGH FORCED LOW
Parallel (cm)
Perp
endi
cula
r (c
m)
4
2
0
-2
-4 0 5 10 15
50
40
30
20
10
0
Initial direction (deg)
Tria
ls (%
)
-120 1200
200 200 300 300
3030
210210
6060
240240
270270
120120
300300
150150
330330
0
750 750
1125 1125
1500 1500
180180 400 400
9090 Tria
ls (%
)
4
2
0
-2
-4
4
2
0
-2
-4 0 5 10 15 0 5 10 15
50
40
30
20
10
0
50
40
30
20
10
0-120 1200 -120 1200
RT<180msCW CCW 1T 180<RT<240ms RT>240ms
KINEMATICS
RT(ms)IDV(deg) #Trials
A
B
C D
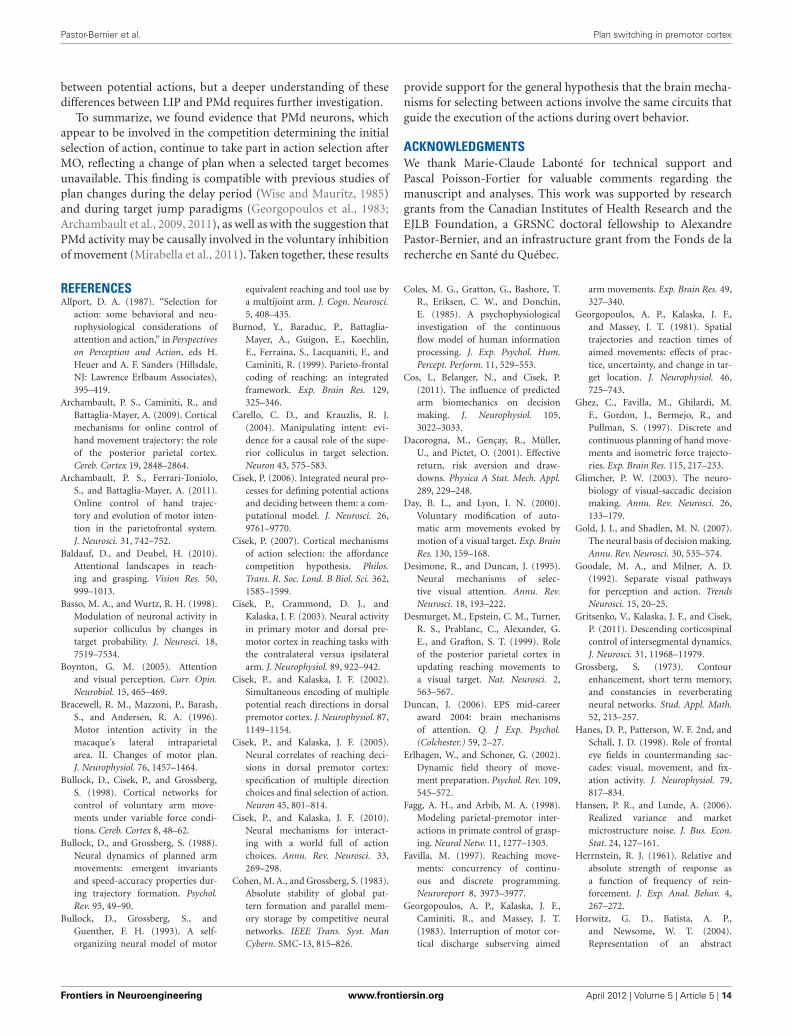
FIGURE 2 | (A) Average trajectories for 2T trials with the unselectedtarget located 120◦ clockwise (red) or counterclockwise (green) to theselected target (always on the right). The three panels from left to rightrepresent FREE, FORCED HIGH, and FORCED LOW trials. The linethickness represents trials classified by their RT. Thick lines correspond tolong RT (>240 ms), medium sized lines to intermediate RT (between180 and 240 ms) and thin lines short RT (<180 ms) (See Method sectionsfor details). (B) Distribution of initial launching directions, with selectedtarget at 0◦. The color and line thickness code is the same as inFigure 2A. Blue histograms represent 1T trials to the selected target.
(C) Method used to classify trials as direct (red) or curved (blue).The top panel shows individual FORCED LOW trials when the remainingtarget is to the right and the vanished target is to the upper left. Small arrowsindicate the IDVs and the red region indicates the 120◦ angle around theaverage, within which trials were considered to be “direct.” The bottom panelshows a rose plot of the distribution of individual IDVs. (D) The RTdistributions of FORCED LOW (black dash) trials, including FORCED LOW“direct” (red solid) and “curved” (blue solid) trials along with the RTdistributions of FREE HIGH (light brown dash) and FORCED HIGH (darkbrown dash).
Frontiers in Neuroengineering www.frontiersin.org April 2012 | Volume 5 | Article 5 | 6
Pastor-Bernier et al. Plan switching in premotor cortex
histogram, 291 ms) was significantly longer (21 ms difference, KS-test, p < 0.01) than the mean RT in FORCED LOW trials with“curved” trajectories (blue histogram, 270 ms). In comparison,FORCED LOW “curved” trials and FORCED HIGH trials did notshow RT differences (KS-test, p > 0.05) (Figure 2D).
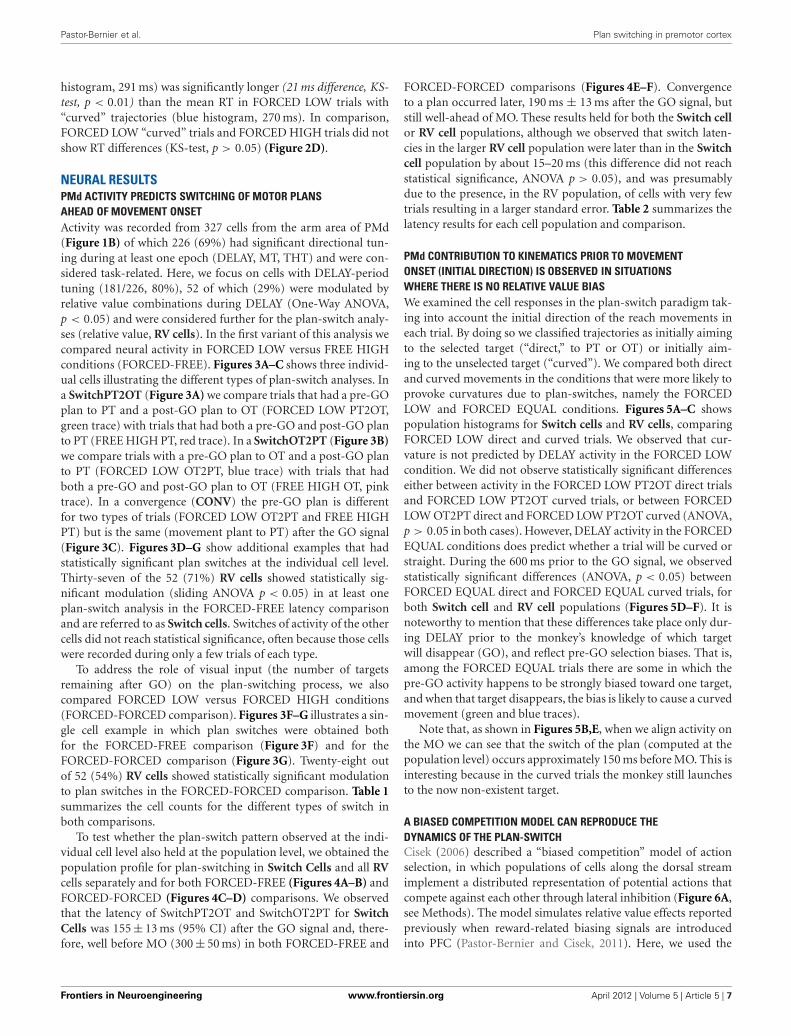
NEURAL RESULTSPMd ACTIVITY PREDICTS SWITCHING OF MOTOR PLANSAHEAD OF MOVEMENT ONSETActivity was recorded from 327 cells from the arm area of PMd(Figure 1B) of which 226 (69%) had significant directional tun-ing during at least one epoch (DELAY, MT, THT) and were con-sidered task-related. Here, we focus on cells with DELAY-periodtuning (181/226, 80%), 52 of which (29%) were modulated byrelative value combinations during DELAY (One-Way ANOVA,p < 0.05) and were considered further for the plan-switch analy-ses (relative value, RV cells). In the first variant of this analysis wecompared neural activity in FORCED LOW versus FREE HIGHconditions (FORCED-FREE). Figures 3A–C shows three individ-ual cells illustrating the different types of plan-switch analyses. Ina SwitchPT2OT (Figure 3A) we compare trials that had a pre-GOplan to PT and a post-GO plan to OT (FORCED LOW PT2OT,green trace) with trials that had both a pre-GO and post-GO planto PT (FREE HIGH PT, red trace). In a SwitchOT2PT (Figure 3B)we compare trials with a pre-GO plan to OT and a post-GO planto PT (FORCED LOW OT2PT, blue trace) with trials that hadboth a pre-GO and post-GO plan to OT (FREE HIGH OT, pinktrace). In a convergence (CONV) the pre-GO plan is differentfor two types of trials (FORCED LOW OT2PT and FREE HIGHPT) but is the same (movement plant to PT) after the GO signal(Figure 3C). Figures 3D–G show additional examples that hadstatistically significant plan switches at the individual cell level.Thirty-seven of the 52 (71%) RV cells showed statistically sig-nificant modulation (sliding ANOVA p < 0.05) in at least oneplan-switch analysis in the FORCED-FREE latency comparisonand are referred to as Switch cells. Switches of activity of the othercells did not reach statistical significance, often because those cellswere recorded during only a few trials of each type.
To address the role of visual input (the number of targetsremaining after GO) on the plan-switching process, we alsocompared FORCED LOW versus FORCED HIGH conditions(FORCED-FORCED comparison). Figures 3F–G illustrates a sin-gle cell example in which plan switches were obtained bothfor the FORCED-FREE comparison (Figure 3F) and for theFORCED-FORCED comparison (Figure 3G). Twenty-eight outof 52 (54%) RV cells showed statistically significant modulationto plan switches in the FORCED-FORCED comparison. Table 1summarizes the cell counts for the different types of switch inboth comparisons.
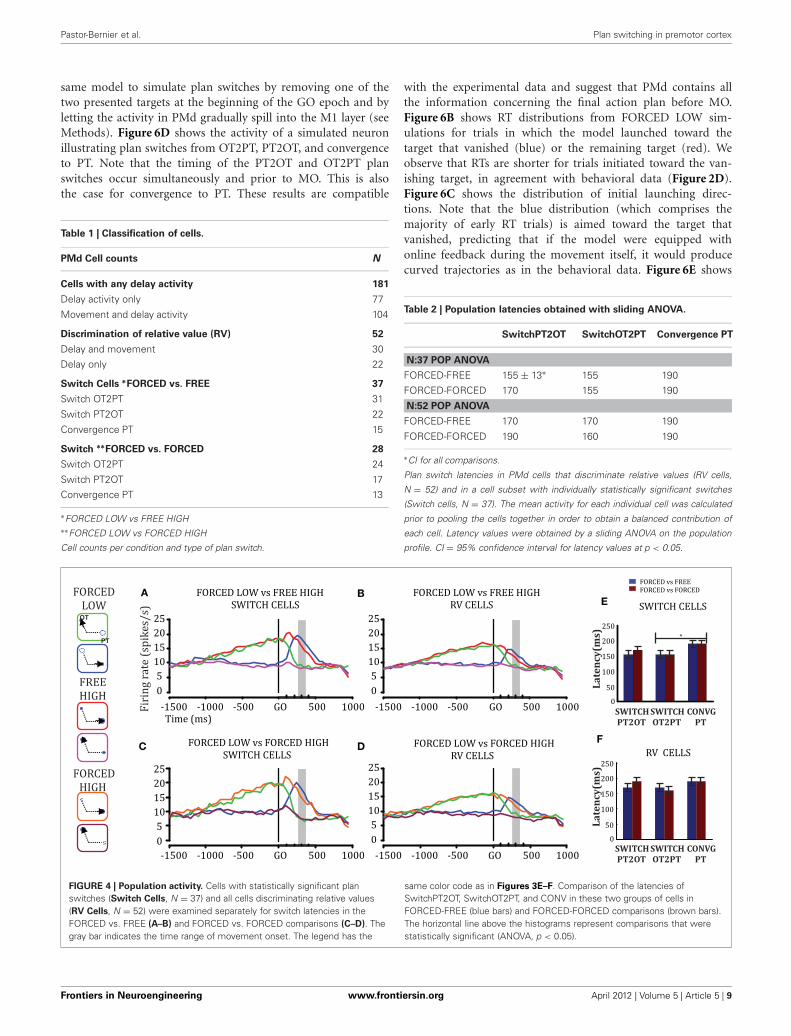
To test whether the plan-switch pattern observed at the indi-vidual cell level also held at the population level, we obtained thepopulation profile for plan-switching in Switch Cells and all RVcells separately and for both FORCED-FREE (Figures 4A–B) andFORCED-FORCED (Figures 4C–D) comparisons. We observedthat the latency of SwitchPT2OT and SwitchOT2PT for SwitchCells was 155 ± 13 ms (95% CI) after the GO signal and, there-fore, well before MO (300 ± 50 ms) in both FORCED-FREE and
FORCED-FORCED comparisons (Figures 4E–F). Convergenceto a plan occurred later, 190 ms ± 13 ms after the GO signal, butstill well-ahead of MO. These results held for both the Switch cellor RV cell populations, although we observed that switch laten-cies in the larger RV cell population were later than in the Switchcell population by about 15–20 ms (this difference did not reachstatistical significance, ANOVA p > 0.05), and was presumablydue to the presence, in the RV population, of cells with very fewtrials resulting in a larger standard error. Table 2 summarizes thelatency results for each cell population and comparison.
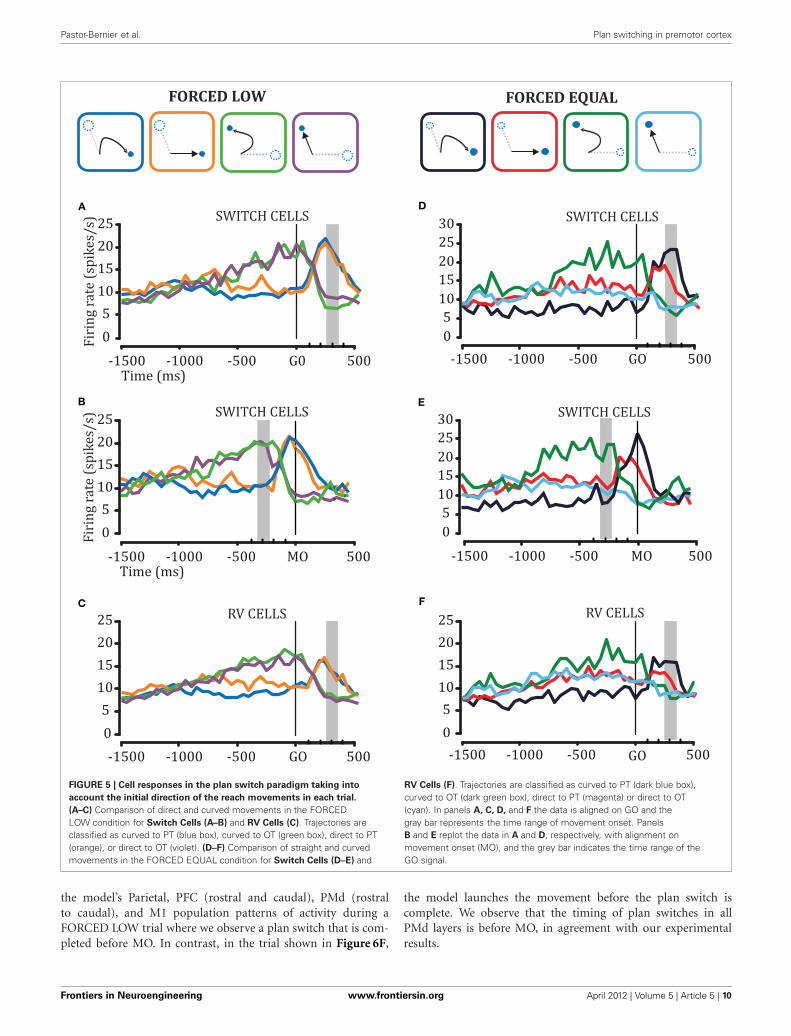
PMd CONTRIBUTION TO KINEMATICS PRIOR TO MOVEMENTONSET (INITIAL DIRECTION) IS OBSERVED IN SITUATIONSWHERE THERE IS NO RELATIVE VALUE BIASWe examined the cell responses in the plan-switch paradigm tak-ing into account the initial direction of the reach movements ineach trial. By doing so we classified trajectories as initially aimingto the selected target (“direct,” to PT or OT) or initially aim-ing to the unselected target (“curved”). We compared both directand curved movements in the conditions that were more likely toprovoke curvatures due to plan-switches, namely the FORCEDLOW and FORCED EQUAL conditions. Figures 5A–C showspopulation histograms for Switch cells and RV cells, comparingFORCED LOW direct and curved trials. We observed that cur-vature is not predicted by DELAY activity in the FORCED LOWcondition. We did not observe statistically significant differenceseither between activity in the FORCED LOW PT2OT direct trialsand FORCED LOW PT2OT curved trials, or between FORCEDLOW OT2PT direct and FORCED LOW PT2OT curved (ANOVA,p > 0.05 in both cases). However, DELAY activity in the FORCEDEQUAL conditions does predict whether a trial will be curved orstraight. During the 600 ms prior to the GO signal, we observedstatistically significant differences (ANOVA, p < 0.05) betweenFORCED EQUAL direct and FORCED EQUAL curved trials, forboth Switch cell and RV cell populations (Figures 5D–F). It isnoteworthy to mention that these differences take place only dur-ing DELAY prior to the monkey’s knowledge of which targetwill disappear (GO), and reflect pre-GO selection biases. That is,among the FORCED EQUAL trials there are some in which thepre-GO activity happens to be strongly biased toward one target,and when that target disappears, the bias is likely to cause a curvedmovement (green and blue traces).
Note that, as shown in Figures 5B,E, when we align activity onthe MO we can see that the switch of the plan (computed at thepopulation level) occurs approximately 150 ms before MO. This isinteresting because in the curved trials the monkey still launchesto the now non-existent target.
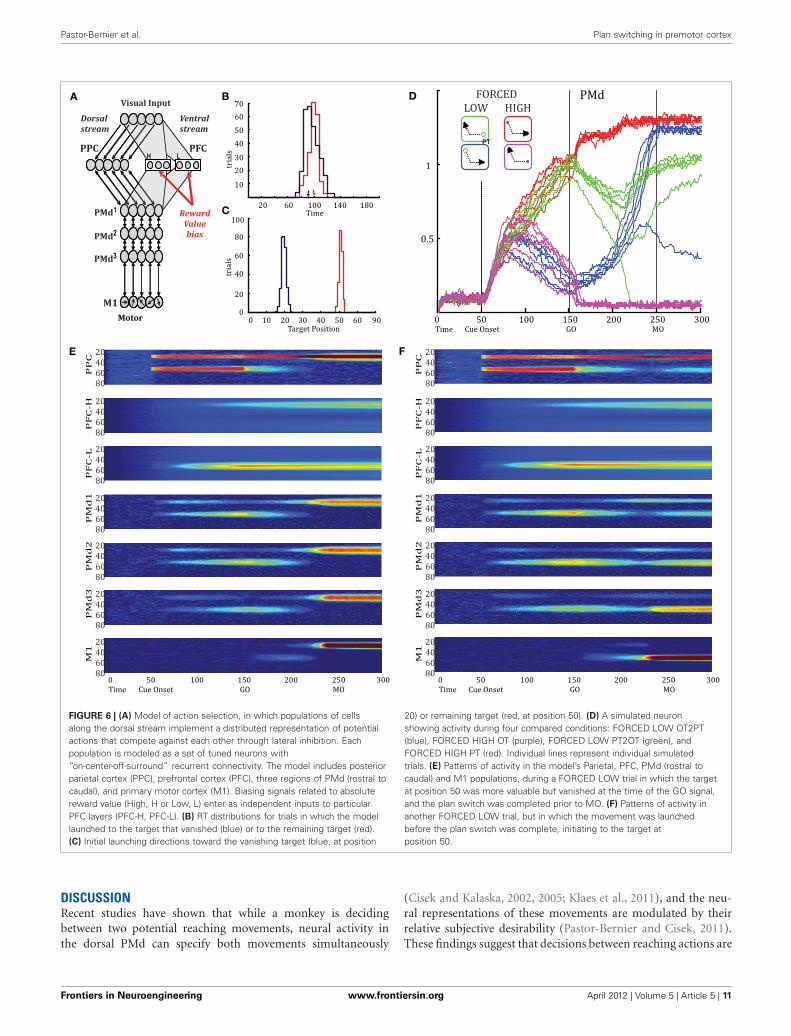
A BIASED COMPETITION MODEL CAN REPRODUCE THEDYNAMICS OF THE PLAN-SWITCHCisek (2006) described a “biased competition” model of actionselection, in which populations of cells along the dorsal streamimplement a distributed representation of potential actions thatcompete against each other through lateral inhibition (Figure 6A,see Methods). The model simulates relative value effects reportedpreviously when reward-related biasing signals are introducedinto PFC (Pastor-Bernier and Cisek, 2011). Here, we used the
Frontiers in Neuroengineering www.frontiersin.org April 2012 | Volume 5 | Article 5 | 7
Pastor-Bernier et al. Plan switching in premotor cortex
E
GF
D
A B C
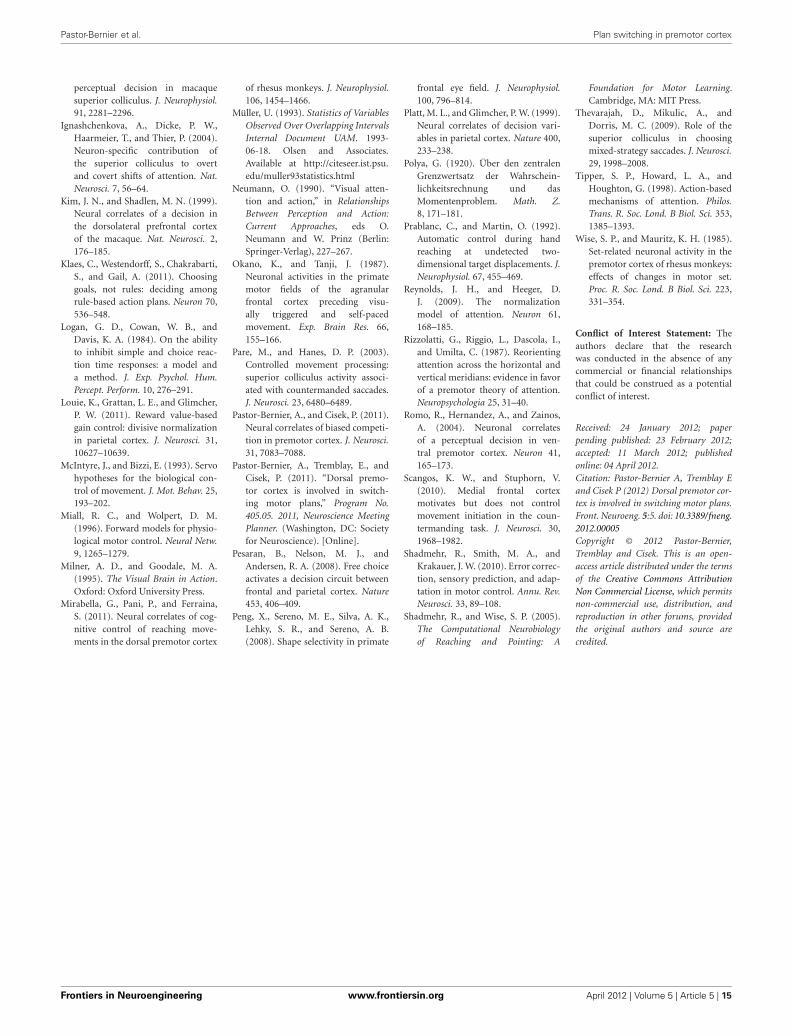
FIGURE 3 | Top-left: The different types of trials are represented in colorboxes. Target position is indicated by a blue circle in PT or in OT. The targetvalue is indicated by circle size. In a “FORCED LOW” condition the mostvaluable option disappears after the GO signal (dashed circles) giving rise totwo possibilities: whether the target with the larger value (big circle) was thecell’s PT (green box) or the other target (blue box). In both cases the monkeyis forced to move to the remaining option (small circle). We compare thesetrials with “FREE HIGH” trials, in which the monkey is free to choose thetarget located either in PT or OT (red or pink) and selects the option withhigher value (FORCED-FREE comparison). We also separately compareFORCED LOW trials with “FORCED HIGH” trials in which the target thatdisappeared after the GO signal was the less valuable one (orange and violet)(FORCED-FORCED comparison). In all panels bold black arrowheads indicatethe selected option. (A–G) Examples of the activity of individual cellsillustrating the switching of movement plans observed between the pre-GO
and the post-GO period. Cell activity is depicted as firing-rate histograms,with mean ± s.t.e., and rasters in which black marks indicate cue onset, gosignal, movement onset and offset, with trials sorted by RT. A switch from PTto OT (SwitchPT2OT) is seen by comparing trials that have a pre-GO plan toPT and a post-GO plan to OT (green) with trials that have both a pre-GO andpost-GO plan to PT (red). The time of the switch is indicated by a gray verticalbar (only in Figures 1A–C for simplicity). The alignment of activity on the GOsignal for rasters and firing rate histograms is indicated by a black vertical barin all panels. A switch from OT to PT (SwitchOT2PT) is seen by comparingtrials that have a pre-GO plan to OT and a post-GO plan to PT (blue) with trialsthat have both a pre-GO and post-GO plan to OT (pink). The time ofconvergence to a plan in the PT direction (CONV) is found by comparing trialswith a pre-GO and post-GO plan to PT (red) with trials with a pre-GO plan toOT but a post-GO plan to PT (blue). Convergence to an OT plan cannot bedetermined from the activity of cells because activity to OT is generally low.
Frontiers in Neuroengineering www.frontiersin.org April 2012 | Volume 5 | Article 5 | 8
Pastor-Bernier et al. Plan switching in premotor cortex
same model to simulate plan switches by removing one of thetwo presented targets at the beginning of the GO epoch and byletting the activity in PMd gradually spill into the M1 layer (seeMethods). Figure 6D shows the activity of a simulated neuronillustrating plan switches from OT2PT, PT2OT, and convergenceto PT. Note that the timing of the PT2OT and OT2PT planswitches occur simultaneously and prior to MO. This is alsothe case for convergence to PT. These results are compatible
Table 1 | Classification of cells.
PMd Cell counts N
Cells with any delay activity 181
Delay activity only 77
Movement and delay activity 104
Discrimination of relative value (RV) 52
Delay and movement 30
Delay only 22
Switch Cells ∗FORCED vs. FREE 37
Switch OT2PT 31
Switch PT2OT 22
Convergence PT 15
Switch ∗∗FORCED vs. FORCED 28
Switch OT2PT 24
Switch PT2OT 17
Convergence PT 13
∗FORCED LOW vs FREE HIGH∗∗FORCED LOW vs FORCED HIGH
Cell counts per condition and type of plan switch.
with the experimental data and suggest that PMd contains allthe information concerning the final action plan before MO.Figure 6B shows RT distributions from FORCED LOW sim-ulations for trials in which the model launched toward thetarget that vanished (blue) or the remaining target (red). Weobserve that RTs are shorter for trials initiated toward the van-ishing target, in agreement with behavioral data (Figure 2D).Figure 6C shows the distribution of initial launching direc-tions. Note that the blue distribution (which comprises themajority of early RT trials) is aimed toward the target thatvanished, predicting that if the model were equipped withonline feedback during the movement itself, it would producecurved trajectories as in the behavioral data. Figure 6E shows
Table 2 | Population latencies obtained with sliding ANOVA.
SwitchPT2OT SwitchOT2PT Convergence PT
N:37 POP ANOVA
FORCED-FREE 155 ± 13∗ 155 190
FORCED-FORCED 170 155 190
N:52 POP ANOVA
FORCED-FREE 170 170 190
FORCED-FORCED 190 160 190
∗CI for all comparisons.
Plan switch latencies in PMd cells that discriminate relative values (RV cells,
N = 52) and in a cell subset with individually statistically significant switches
(Switch cells, N = 37). The mean activity for each individual cell was calculated
prior to pooling the cells together in order to obtain a balanced contribution of
each cell. Latency values were obtained by a sliding ANOVA on the population
profile. CI = 95% confidence interval for latency values at p < 0.05.
A BE
C DF
FIGURE 4 | Population activity. Cells with statistically significant planswitches (Switch Cells, N = 37) and all cells discriminating relative values(RV Cells, N = 52) were examined separately for switch latencies in theFORCED vs. FREE (A–B) and FORCED vs. FORCED comparisons (C–D). Thegray bar indicates the time range of movement onset. The legend has the
same color code as in Figures 3E–F. Comparison of the latencies ofSwitchPT2OT, SwitchOT2PT, and CONV in these two groups of cells inFORCED-FREE (blue bars) and FORCED-FORCED comparisons (brown bars).The horizontal line above the histograms represent comparisons that werestatistically significant (ANOVA, p < 0.05).
Frontiers in Neuroengineering www.frontiersin.org April 2012 | Volume 5 | Article 5 | 9
Pastor-Bernier et al. Plan switching in premotor cortex
A
B
C F
E
D
FIGURE 5 | Cell responses in the plan switch paradigm taking into
account the initial direction of the reach movements in each trial.
(A–C) Comparison of direct and curved movements in the FORCEDLOW condition for Switch Cells (A–B) and RV Cells (C). Trajectories areclassified as curved to PT (blue box), curved to OT (green box), direct to PT(orange), or direct to OT (violet). (D–F) Comparison of straight and curvedmovements in the FORCED EQUAL condition for Switch Cells (D–E) and
RV Cells (F). Trajectories are classified as curved to PT (dark blue box),curved to OT (dark green box), direct to PT (magenta) or direct to OT(cyan). In panels A, C, D, and F the data is aligned on GO and thegray bar represents the time range of movement onset. PanelsB and E replot the data in A and D, respectively, with alignment onmovement onset (MO), and the grey bar indicates the time range of theGO signal.
the model’s Parietal, PFC (rostral and caudal), PMd (rostralto caudal), and M1 population patterns of activity during aFORCED LOW trial where we observe a plan switch that is com-pleted before MO. In contrast, in the trial shown in Figure 6F,
the model launches the movement before the plan switch iscomplete. We observe that the timing of plan switches in allPMd layers is before MO, in agreement with our experimentalresults.
Frontiers in Neuroengineering www.frontiersin.org April 2012 | Volume 5 | Article 5 | 10
Pastor-Bernier et al. Plan switching in premotor cortex
A B
C
D
E F
FIGURE 6 | (A) Model of action selection, in which populations of cellsalong the dorsal stream implement a distributed representation of potentialactions that compete against each other through lateral inhibition. Eachpopulation is modeled as a set of tuned neurons with“on-center-off-surround” recurrent connectivity. The model includes posteriorparietal cortex (PPC), prefrontal cortex (PFC), three regions of PMd (rostral tocaudal), and primary motor cortex (M1). Biasing signals related to absolutereward value (High, H or Low, L) enter as independent inputs to particularPFC layers (PFC-H, PFC-L). (B) RT distributions for trials in which the modellaunched to the target that vanished (blue) or to the remaining target (red).(C) Initial launching directions toward the vanishing target (blue, at position
20) or remaining target (red, at position 50). (D) A simulated neuronshowing activity during four compared conditions: FORCED LOW OT2PT(blue), FORCED HIGH OT (purple), FORCED LOW PT2OT (green), andFORCED HIGH PT (red). Individual lines represent individual simulatedtrials. (E) Patterns of activity in the model’s Parietal, PFC, PMd (rostral tocaudal) and M1 populations, during a FORCED LOW trial in which the targetat position 50 was more valuable but vanished at the time of the GO signal,and the plan switch was completed prior to MO. (F) Patterns of activity inanother FORCED LOW trial, but in which the movement was launchedbefore the plan switch was complete, initiating to the target atposition 50.
DISCUSSIONRecent studies have shown that while a monkey is decidingbetween two potential reaching movements, neural activity inthe dorsal PMd can specify both movements simultaneously
(Cisek and Kalaska, 2002, 2005; Klaes et al., 2011), and the neu-ral representations of these movements are modulated by theirrelative subjective desirability (Pastor-Bernier and Cisek, 2011).These findings suggest that decisions between reaching actions are
Frontiers in Neuroengineering www.frontiersin.org April 2012 | Volume 5 | Article 5 | 11
Pastor-Bernier et al. Plan switching in premotor cortex
made within the same brain regions involved in the execution ofthe actions themselves, in agreement with research on reaching(Cisek, 2007; Pesaran et al., 2008; Cisek and Kalaska, 2010) andoculomotor control (for reviews, see Glimcher, 2003; Gold andShadlen, 2007). In fact, decisions about eye movements appearto involve even the superior colliculus, a brainstem structure thatis just two synapses away from the motor neurons that move theeye (Basso and Wurtz, 1998; Carello and Krauzlis, 2004; Horwitzet al., 2004; Ignashchenkova et al., 2004; Thevarajah et al., 2009).
However, the finding that decision variables (such as relativevalue) influence neural activity in sensorimotor regions does notnecessarily imply that these same cells continue to be involvedin the on-line guidance of movement. It is plausible that once adecision is made and an action is launched toward a given tar-get, the decision-related cells fall silent while a separate circuitbecomes responsible for guiding movement toward the selectedtarget. The results presented here suggest that this is not the case.We found that the very same PMd cells previously shown to reflectrelative value during a delay period continue to update their activ-ity to reflect when the monkey changes its plan during situationsin which a previously selected action becomes unavailable. Thisargues against the distinction between regions responsible forchoosing an action and those responsible for its guidance throughon-line feedback, and in favor of the hypothesis that decisionsemerge through a competition within the same circuit that guidesmovement execution (Cisek, 2007).
A number of earlier studies provide converging evidence con-sistent with this integrated view. For example, it has been shownthat humans and monkeys can quickly and smoothly update theirmovement plans when the location of the reach target suddenlyand unpredictably changes (Georgopoulos et al., 1981, 1983;Prablanc and Martin, 1992; Desmurget et al., 1999; Day and Lyon,2000; Archambault et al., 2009, 2011; Gritsenko et al., 2011), evenwhen they are not consciously aware of the change. During these“target jump” experiments, neural activity in fronto-parietal cor-tex smoothly transitions between the original and final motorplan (Archambault et al., 2009, 2011), without any “refractoryperiod” for aborting the previous plan before preparing a newone. Among the regions tested, the earliest changes in neuralactivity were found in PMd, in which 50% of cells reflected thenew plan about 140 ms after a target jump, followed by M1 at180 ms and dorsal area 5 at 200 ms (Archambault et al., 2011).This is comparable to the latency of responses to target jumpsin earlier studies by Georgopoulos et al. (1983), who observedlatencies of about 130–150 ms in the rostral part of M1.
Interestingly, the neural latencies to target jumps are com-parable to the latencies of plan switches observed in PMd inour study—about 155 ms for both increases (SwitchOT2PT) anddecreases of activity (SwitchPT2OT). They are also comparableto the latencies reported by Wise and Mauritz (1985) in a studyin which the stimulus that instructed the plan switches was pre-sented during the delay period, well before the GO signal. In thatstudy, it was found that PMd cells reflected the switch with amedian latency of 140–150 ms. In other words, the latency withwhich neural activity in PMd reflects a plan change is approxi-mately 140–150 ms after the sensory stimulus which instructs thatplan change. This holds true regardless of whether that stimulus
is the change of a target from one location to another duringthe delay period (Wise and Mauritz, 1985), the displacement ofa target during RT or movement (Georgopoulos et al., 1983;Archambault et al., 2009, 2011), or the offset of a PT that leavesonly a less-desirable one available (present study). Furthermore,we found that the latency at which cells became suppressed whentheir PT disappeared (SwitchPT2OT) was not statistically differ-ent than the latency with which their discharge increased whentheir PT, which was initially less desirable, suddenly became theonly remaining option (SwitchOT2PT). The similarity of theseneural latencies across different experimental conditions demon-strates that in all cases, neural activity in PMd remains sensitive tonew information pertinent to available actions and their values.This suggests a view whereby sensory information continuouslyflows into the motor system (Coles et al., 1985; Cisek, 2007), asopposed to a view of separate computational stages involved incanceling one motor program and computing a new one.
The neural processes of canceling a planned movement havebeen studied in the frontal eye fields (Hanes et al., 1998), superiorcolliculus (Pare and Hanes, 2003) and for arm-reaching stud-ies in the supplementary motor area (SMA), pre-SMA (Scangosand Stuphorn, 2010) and PMd (Mirabella et al., 2011) using thecountermanding task (Logan et al., 1984). In this task, subjectsare asked to make a saccade or reach to a target, but to inhibitthe movement if an infrequent STOP-signal is presented after avariable delay following the GO signal. As the delay increases, itbecomes increasingly difficult to successfully inhibit the move-ment, making it possible to estimate a given subject’s “stop-signalreaction time” (SSRT). Although many cortical areas such asmotor cortex (M1) and supplemental cortical areas (pre-SMAand SMA) harbor neurons with DELAY activity related to move-ment planning (Okano and Tanji, 1987) it is unlikely that theseareas are involved in processes causally related to movement can-cellation because their responses to a stop signal take place afterthe SSRT (Scangos and Stuphorn, 2010). In contrast, Mirabellaet al. (2011) found that during successful STOP trials, neurons inPMd show activity changes prior to the SSRT, making it possiblethat this region is involved in inhibiting the movement. This isconsistent with the findings reported here that the suppression ofPMd activity tuned to the target which vanished (SwitchPT2OT)occurs well before MO.
Our behavioral results are compatible with the proposal thatat the end of the DELAY period, the movement to the higher-valued target is more strongly prepared than the movement tothe lower-valued target. When the higher target disappears in aFORCED LOW trial, then one of two things can happen. If theRT is short, then the movement initiates toward the location ofthe unavailable target and the monkey must later turn around(curved trials, Figure 2D blue). If the RT is long, then the monkeycompletes his plan switch and initiates directly to the remainingtarget (direct trials, Figure 2D red). Nevertheless, what is surpris-ing is that in both cases, neural activity in PMd already clearlyreflects the change of plan more than 150 ms before the MO. Thiscan be seen in Figures 5A,B. For example, the green traces illus-trate trials in which the monkey initiated the movement towardthe PT of recorded cells, which was the more valuable of the tar-gets present during the DELAY. However, that target vanished
Frontiers in Neuroengineering www.frontiersin.org April 2012 | Volume 5 | Article 5 | 12
Pastor-Bernier et al. Plan switching in premotor cortex
and so the monkey curved its movement trajectory and arrived atthe remaining target. Although the neural activity becomes sup-pressed within 200 ms of the GO signal, reflecting the change ofplan away from the PT, the initial movement some 100 ms later isstill launched in the direction of the original plan. This happensmost often during trials with short RTs (Figures 2B,D) suggestingthat the motor system has a certain “inertia” that cannot be easilyovercome. That is, movement initiation and muscle contractioncould be starting to take place shortly after the GO signal despitethe possibility that the more desirable choice will become unavail-able. In this sense, the short-RT curved movements would be anatural consequence of the monkey’s impulsivity and a strategy ofreaching quickly and correcting the trajectory when necessary. InFORCED LOW trials, we found no significant difference in PMdactivity between curved versus direct trials (Figures 5A–C), sug-gesting that other regions (presumably M1) may be more stronglyresponsible for determining whether the movement launchestoward the initially selected or not. In FORCED EQUAL trials, wedid observe differences in PMd activity when comparing curvedversus direct movements (Figures 5D–F), but we believe this issimply due to selection bias: Curved movements (dark blue andgreen traces) are more likely to occur when the monkey happensto be strongly biased during DELAY toward the target that van-ished, while direct movements could result equally from trials inwhich DELAY activity is biased to the PT, the OT, or neither, andthe average DELAY activity of these three groups of trials will liesomewhere in the middle (red and cyan traces).
Cisek (2006) described a model of biased competition betweenaction plans, which was originally designed to capture neural dataon the simultaneous specification of multiple movements (Cisekand Kalaska, 2005) and behavioral data on the distributions ofinitial directions in short-RT pointing tasks (Favilla, 1997; Ghezet al., 1997). That same model, without any changes in param-eters, was able to simulate more recent data on the modulationof PMd activity by relative subjective desirability (Pastor-Bernierand Cisek, 2011). In the model, potential actions are encoded ashills of activity in populations of directionally tuned neurons withshort-range mutual excitation between similarly tuned cells andlong-range lateral inhibition among cells with different tuning.The distance dependence of these lateral interactions is respon-sible for producing both the distance-dependent distributions ofinitial reach directions (Favilla, 1997; Ghez et al., 1997) and thedistance-dependent influence of the value of one target on thePMd activity related to another (Pastor-Bernier and Cisek, 2011).That same model, only slightly modified with a gradual GO sig-nal, is also able to reproduce our current results on plan switches(Figure 6D) and the distributions and timing of initial launchingdirections (Figures 6B,C). Note, however, that the model makesno attempt whatsoever to explain activity after MO—it includesno dynamics for producing or guiding movement, and its M1activity should only be interpreted as capturing the initial pat-tern around the time of MO. Nevertheless, despite the absenceof any movement production mechanisms in the present formof the model, it is consistent with models in which the move-ment trajectory is generated through continuous feedback viaproprioceptive and visual signals (Bullock and Grossberg, 1988;Bullock et al., 1998; McIntyre and Bizzi, 1993; Burnod et al.,
1999; Shadmehr and Wise, 2005) and through internal forwardmodels (Bullock et al., 1993; Miall and Wolpert, 1996; Shadmehret al., 2010). The model is compatible with general theoriesproposing that movements unfold as a dynamical system that isguided by the continuously updated pattern of activity withina distributed sensorimotor map. These patterns of activity canbe shaped by a variety of processes, including attention (Tipperet al., 1998; Baldauf and Deubel, 2010), decision-variables (Cisek,2007), and continuous spatial information from the dorsal visualstream (Goodale and Milner, 1992; Milner and Goodale, 1995;Desmurget et al., 1999; Day and Lyon, 2000).
That a relatively simple “biased competition” model canexplain this fairly large set of data is particularly interesting giventhat the same mechanism is often used to explain the neuralmechanisms of spatial attention (Desimone and Duncan, 1995;Boynton, 2005). This supports the conjecture (Allport, 1987;Rizzolatti et al., 1987; Neumann, 1990; Duncan, 2006; Cisek,2007) that both attention and decision-making are related aspectsof a general process of selection necessary to arbitrate between themany demands and opportunities for action that animals are con-tinuously faced with in their natural environment. In this view,sensory information is continuously winnowed along the dorsalstream as it is converted into information specifying potentialactions and ultimately guiding their execution. In all cases, thiswinnowing process involves a biased competition, but the specificdynamics of the process may be somewhat different in differentbrain regions.
For example, Louie et al. (2011) showed that activity in LIPwas best described as
R = RmaxVin + β
σ + Vin + Vout, (2)
where R is the firing rate, Rmax is the maximum firing rate, V in isthe value of targets in the receptive field, Vout is the total value oftargets outside the receptive field, and β and σ are the baselineactivity and semi-saturation terms, respectively, (see Reynoldsand Heeger, 2009). Note that, as shown by Grossberg (1973),the normalization computation described by Equation (2) can beproduced by the steady-state solution of Equation (1) if the exci-tation term E is equal to V in and the inhibition term I is equalto Vout (see Cohen and Grossberg, 1983, for a proof of Lyapunovstability for a general class of such networks). In other words, divi-sive normalization may result from the competitive interactionswithin neural populations.
Louie et al. (2011) found that to explain their LIP data, theparameter σ had to be large, implying incomplete normalizationsuch that LIP cells exhibited value-related modulation even witha single target. In contrast, our results suggest that PMd exhibitscomplete or nearly complete divisive normalization, because inthe 1T task we found no value-related modulation whatsoever(Pastor-Bernier and Cisek, 2011), as if the σ parameter is zero.This raises the intriguing question of whether partial divisive nor-malization is the trend in parietal cortex, which is still far fromovert execution, while activity is more fully normalized in regionscloser to motor output, such as PMd. This would make good senseif PMd is most closely related to the process of final arbitration
Frontiers in Neuroengineering www.frontiersin.org April 2012 | Volume 5 | Article 5 | 13
Pastor-Bernier et al. Plan switching in premotor cortex
between potential actions, but a deeper understanding of thesedifferences between LIP and PMd requires further investigation.
To summarize, we found evidence that PMd neurons, whichappear to be involved in the competition determining the initialselection of action, continue to take part in action selection afterMO, reflecting a change of plan when a selected target becomesunavailable. This finding is compatible with previous studies ofplan changes during the delay period (Wise and Mauritz, 1985)and during target jump paradigms (Georgopoulos et al., 1983;Archambault et al., 2009, 2011), as well as with the suggestion thatPMd activity may be causally involved in the voluntary inhibitionof movement (Mirabella et al., 2011). Taken together, these results
provide support for the general hypothesis that the brain mecha-nisms for selecting between actions involve the same circuits thatguide the execution of the actions during overt behavior.
ACKNOWLEDGMENTSWe thank Marie-Claude Labonté for technical support andPascal Poisson-Fortier for valuable comments regarding themanuscript and analyses. This work was supported by researchgrants from the Canadian Institutes of Health Research and theEJLB Foundation, a GRSNC doctoral fellowship to AlexandrePastor-Bernier, and an infrastructure grant from the Fonds de larecherche en Santé du Québec.
REFERENCESAllport, D. A. (1987). “Selection for
action: some behavioral and neu-rophysiological considerations ofattention and action,” in Perspectiveson Perception and Action, eds H.Heuer and A. F. Sanders (Hillsdale,NJ: Lawrence Erlbaum Associates),395–419.
Archambault, P. S., Caminiti, R., andBattaglia-Mayer, A. (2009). Corticalmechanisms for online control ofhand movement trajectory: the roleof the posterior parietal cortex.Cereb. Cortex 19, 2848–2864.
Archambault, P. S., Ferrari-Toniolo,S., and Battaglia-Mayer, A. (2011).Online control of hand trajec-tory and evolution of motor inten-tion in the parietofrontal system.J. Neurosci. 31, 742–752.
Baldauf, D., and Deubel, H. (2010).Attentional landscapes in reach-ing and grasping. Vision Res. 50,999–1013.
Basso, M. A., and Wurtz, R. H. (1998).Modulation of neuronal activity insuperior colliculus by changes intarget probability. J. Neurosci. 18,7519–7534.
Boynton, G. M. (2005). Attentionand visual perception. Curr. Opin.Neurobiol. 15, 465–469.
Bracewell, R. M., Mazzoni, P., Barash,S., and Andersen, R. A. (1996).Motor intention activity in themacaque’s lateral intraparietalarea. II. Changes of motor plan.J. Neurophysiol. 76, 1457–1464.
Bullock, D., Cisek, P., and Grossberg,S. (1998). Cortical networks forcontrol of voluntary arm move-ments under variable force condi-tions. Cereb. Cortex 8, 48–62.
Bullock, D., and Grossberg, S. (1988).Neural dynamics of planned armmovements: emergent invariantsand speed-accuracy properties dur-ing trajectory formation. Psychol.Rev. 95, 49–90.
Bullock, D., Grossberg, S., andGuenther, F. H. (1993). A self-organizing neural model of motor
equivalent reaching and tool use bya multijoint arm. J. Cogn. Neurosci.5, 408–435.
Burnod, Y., Baraduc, P., Battaglia-Mayer, A., Guigon, E., Koechlin,E., Ferraina, S., Lacquaniti, F., andCaminiti, R. (1999). Parieto-frontalcoding of reaching: an integratedframework. Exp. Brain Res. 129,325–346.
Carello, C. D., and Krauzlis, R. J.(2004). Manipulating intent: evi-dence for a causal role of the supe-rior colliculus in target selection.Neuron 43, 575–583.
Cisek, P. (2006). Integrated neural pro-cesses for defining potential actionsand deciding between them: a com-putational model. J. Neurosci. 26,9761–9770.
Cisek, P. (2007). Cortical mechanismsof action selection: the affordancecompetition hypothesis. Philos.Trans. R. Soc. Lond. B Biol. Sci. 362,1585–1599.
Cisek, P., Crammond, D. J., andKalaska, J. F. (2003). Neural activityin primary motor and dorsal pre-motor cortex in reaching tasks withthe contralateral versus ipsilateralarm. J. Neurophysiol. 89, 922–942.
Cisek, P., and Kalaska, J. F. (2002).Simultaneous encoding of multiplepotential reach directions in dorsalpremotor cortex. J. Neurophysiol. 87,1149–1154.
Cisek, P., and Kalaska, J. F. (2005).Neural correlates of reaching deci-sions in dorsal premotor cortex:specification of multiple directionchoices and final selection of action.Neuron 45, 801–814.
Cisek, P., and Kalaska, J. F. (2010).Neural mechanisms for interact-ing with a world full of actionchoices. Annu. Rev. Neurosci. 33,269–298.
Cohen, M. A., and Grossberg, S. (1983).Absolute stability of global pat-tern formation and parallel mem-ory storage by competitive neuralnetworks. IEEE Trans. Syst. ManCybern. SMC-13, 815–826.
Coles, M. G., Gratton, G., Bashore, T.R., Eriksen, C. W., and Donchin,E. (1985). A psychophysiologicalinvestigation of the continuousflow model of human informationprocessing. J. Exp. Psychol. Hum.Percept. Perform. 11, 529–553.
Cos, I., Belanger, N., and Cisek, P.(2011). The influence of predictedarm biomechanics on decisionmaking. J. Neurophysiol. 105,3022–3033.
Dacorogna, M., Gençay, R., Müller,U., and Pictet, O. (2001). Effectivereturn, risk aversion and draw-downs. Physica A Stat. Mech. Appl.289, 229–248.
Day, B. L., and Lyon, I. N. (2000).Voluntary modification of auto-matic arm movements evoked bymotion of a visual target. Exp. BrainRes. 130, 159–168.
Desimone, R., and Duncan, J. (1995).Neural mechanisms of selec-tive visual attention. Annu. Rev.Neurosci. 18, 193–222.
Desmurget, M., Epstein, C. M., Turner,R. S., Prablanc, C., Alexander, G.E., and Grafton, S. T. (1999). Roleof the posterior parietal cortex inupdating reaching movements toa visual target. Nat. Neurosci. 2,563–567.
Duncan, J. (2006). EPS mid-careeraward 2004: brain mechanismsof attention. Q. J Exp. Psychol.(Colchester.) 59, 2–27.
Erlhagen, W., and Schoner, G. (2002).Dynamic field theory of move-ment preparation. Psychol. Rev. 109,545–572.
Fagg, A. H., and Arbib, M. A. (1998).Modeling parietal-premotor inter-actions in primate control of grasp-ing. Neural Netw. 11, 1277–1303.
Favilla, M. (1997). Reaching move-ments: concurrency of continu-ous and discrete programming.Neuroreport 8, 3973–3977.
Georgopoulos, A. P., Kalaska, J. F.,Caminiti, R., and Massey, J. T.(1983). Interruption of motor cor-tical discharge subserving aimed
arm movements. Exp. Brain Res. 49,327–340.
Georgopoulos, A. P., Kalaska, J. F.,and Massey, J. T. (1981). Spatialtrajectories and reaction times ofaimed movements: effects of prac-tice, uncertainty, and change in tar-get location. J. Neurophysiol. 46,725–743.
Ghez, C., Favilla, M., Ghilardi, M.F., Gordon, J., Bermejo, R., andPullman, S. (1997). Discrete andcontinuous planning of hand move-ments and isometric force trajecto-ries. Exp. Brain Res. 115, 217–233.
Glimcher, P. W. (2003). The neuro-biology of visual-saccadic decisionmaking. Annu. Rev. Neurosci. 26,133–179.
Gold, J. I., and Shadlen, M. N. (2007).The neural basis of decision making.Annu. Rev. Neurosci. 30, 535–574.
Goodale, M. A., and Milner, A. D.(1992). Separate visual pathwaysfor perception and action. TrendsNeurosci. 15, 20–25.
Gritsenko, V., Kalaska, J. F., and Cisek,P. (2011). Descending corticospinalcontrol of intersegmental dynamics.J. Neurosci. 31, 11968–11979.
Grossberg, S. (1973). Contourenhancement, short term memory,and constancies in reverberatingneural networks. Stud. Appl. Math.52, 213–257.
Hanes, D. P., Patterson, W. F. 2nd, andSchall, J. D. (1998). Role of frontaleye fields in countermanding sac-cades: visual, movement, and fix-ation activity. J. Neurophysiol. 79,817–834.
Hansen, P. R., and Lunde, A. (2006).Realized variance and marketmicrostructure noise. J. Bus. Econ.Stat. 24, 127–161.
Herrnstein, R. J. (1961). Relative andabsolute strength of response asa function of frequency of rein-forcement. J. Exp. Anal. Behav. 4,267–272.
Horwitz, G. D., Batista, A. P.,and Newsome, W. T. (2004).Representation of an abstract
Frontiers in Neuroengineering www.frontiersin.org April 2012 | Volume 5 | Article 5 | 14
Pastor-Bernier et al. Plan switching in premotor cortex
perceptual decision in macaquesuperior colliculus. J. Neurophysiol.91, 2281–2296.
Ignashchenkova, A., Dicke, P. W.,Haarmeier, T., and Thier, P. (2004).Neuron-specific contribution ofthe superior colliculus to overtand covert shifts of attention. Nat.Neurosci. 7, 56–64.
Kim, J. N., and Shadlen, M. N. (1999).Neural correlates of a decision inthe dorsolateral prefrontal cortexof the macaque. Nat. Neurosci. 2,176–185.
Klaes, C., Westendorff, S., Chakrabarti,S., and Gail, A. (2011). Choosinggoals, not rules: deciding amongrule-based action plans. Neuron 70,536–548.
Logan, G. D., Cowan, W. B., andDavis, K. A. (1984). On the abilityto inhibit simple and choice reac-tion time responses: a model anda method. J. Exp. Psychol. Hum.Percept. Perform. 10, 276–291.
Louie, K., Grattan, L. E., and Glimcher,P. W. (2011). Reward value-basedgain control: divisive normalizationin parietal cortex. J. Neurosci. 31,10627–10639.
McIntyre, J., and Bizzi, E. (1993). Servohypotheses for the biological con-trol of movement. J. Mot. Behav. 25,193–202.
Miall, R. C., and Wolpert, D. M.(1996). Forward models for physio-logical motor control. Neural Netw.9, 1265–1279.
Milner, A. D., and Goodale, M. A.(1995). The Visual Brain in Action.Oxford: Oxford University Press.
Mirabella, G., Pani, P., and Ferraina,S. (2011). Neural correlates of cog-nitive control of reaching move-ments in the dorsal premotor cortex
of rhesus monkeys. J. Neurophysiol.106, 1454–1466.
Müller, U. (1993). Statistics of VariablesObserved Over Overlapping IntervalsInternal Document UAM. 1993-06-18. Olsen and Associates.Available at http://citeseer.ist.psu.edu/muller93statistics.html
Neumann, O. (1990). “Visual atten-tion and action,” in RelationshipsBetween Perception and Action:Current Approaches, eds O.Neumann and W. Prinz (Berlin:Springer-Verlag), 227–267.
Okano, K., and Tanji, J. (1987).Neuronal activities in the primatemotor fields of the agranularfrontal cortex preceding visu-ally triggered and self-pacedmovement. Exp. Brain Res. 66,155–166.
Pare, M., and Hanes, D. P. (2003).Controlled movement processing:superior colliculus activity associ-ated with countermanded saccades.J. Neurosci. 23, 6480–6489.
Pastor-Bernier, A., and Cisek, P. (2011).Neural correlates of biased competi-tion in premotor cortex. J. Neurosci.31, 7083–7088.
Pastor-Bernier, A., Tremblay, E., andCisek, P. (2011). “Dorsal premo-tor cortex is involved in switch-ing motor plans,” Program No.405.05. 2011, Neuroscience MeetingPlanner. (Washington, DC: Societyfor Neuroscience). [Online].
Pesaran, B., Nelson, M. J., andAndersen, R. A. (2008). Free choiceactivates a decision circuit betweenfrontal and parietal cortex. Nature453, 406–409.
Peng, X., Sereno, M. E., Silva, A. K.,Lehky, S. R., and Sereno, A. B.(2008). Shape selectivity in primate
frontal eye field. J. Neurophysiol.100, 796–814.
Platt, M. L., and Glimcher, P. W. (1999).Neural correlates of decision vari-ables in parietal cortex. Nature 400,233–238.
Polya, G. (1920). Über den zentralenGrenzwertsatz der Wahrschein-lichkeitsrechnung und dasMomentenproblem. Math. Z.8, 171–181.
Prablanc, C., and Martin, O. (1992).Automatic control during handreaching at undetected two-dimensional target displacements. J.Neurophysiol. 67, 455–469.
Reynolds, J. H., and Heeger, D.J. (2009). The normalizationmodel of attention. Neuron 61,168–185.
Rizzolatti, G., Riggio, L., Dascola, I.,and Umilta, C. (1987). Reorientingattention across the horizontal andvertical meridians: evidence in favorof a premotor theory of attention.Neuropsychologia 25, 31–40.
Romo, R., Hernandez, A., and Zainos,A. (2004). Neuronal correlatesof a perceptual decision in ven-tral premotor cortex. Neuron 41,165–173.
Scangos, K. W., and Stuphorn, V.(2010). Medial frontal cortexmotivates but does not controlmovement initiation in the coun-termanding task. J. Neurosci. 30,1968–1982.
Shadmehr, R., Smith, M. A., andKrakauer, J. W. (2010). Error correc-tion, sensory prediction, and adap-tation in motor control. Annu. Rev.Neurosci. 33, 89–108.
Shadmehr, R., and Wise, S. P. (2005).The Computational Neurobiologyof Reaching and Pointing: A
Foundation for Motor Learning.Cambridge, MA: MIT Press.
Thevarajah, D., Mikulic, A., andDorris, M. C. (2009). Role of thesuperior colliculus in choosingmixed-strategy saccades. J. Neurosci.29, 1998–2008.
Tipper, S. P., Howard, L. A., andHoughton, G. (1998). Action-basedmechanisms of attention. Philos.Trans. R. Soc. Lond. B Biol. Sci. 353,1385–1393.
Wise, S. P., and Mauritz, K. H. (1985).Set-related neuronal activity in thepremotor cortex of rhesus monkeys:effects of changes in motor set.Proc. R. Soc. Lond. B Biol. Sci. 223,331–354.
Conflict of Interest Statement: Theauthors declare that the researchwas conducted in the absence of anycommercial or financial relationshipsthat could be construed as a potentialconflict of interest.
Received: 24 January 2012; paperpending published: 23 February 2012;accepted: 11 March 2012; publishedonline: 04 April 2012.Citation: Pastor-Bernier A, Tremblay Eand Cisek P (2012) Dorsal premotor cor-tex is involved in switching motor plans.Front. Neuroeng. 5:5. doi: 10.3389/fneng.2012.00005Copyright © 2012 Pastor-Bernier,Tremblay and Cisek. This is an open-access article distributed under the termsof the Creative Commons AttributionNon Commercial License, which permitsnon-commercial use, distribution, andreproduction in other forums, providedthe original authors and source arecredited.
Frontiers in Neuroengineering www.frontiersin.org April 2012 | Volume 5 | Article 5 | 15

![Local Field Potentials in a Pre-motor Region Predict ... · 30/06/2020 · 107 patterns precisely aligned to vocal production [8,35]. It is considered analogous to premotor cortex](https://static.fdocuments.us/doc/165x107/5f99df4f4803db59d85a2f47/local-field-potentials-in-a-pre-motor-region-predict-30062020-107-patterns.jpg)


![University of Groningen Functional differentiation of the ......location [2,4-6], antero-inferior parietal and ventral premotor cortex (PMv) are stronger implicated in linking object](https://static.fdocuments.us/doc/165x107/60f494cc29524d79bc296db9/university-of-groningen-functional-differentiation-of-the-location-24-6.jpg)