INCAS - f-origin.hypotheses.org · ICAS DP Series Discussion Paper Series 2016 03 INCAS...
32
INCAS DP Series Discussion Paper Series 2016 #03 INCAS Understanding institutional change in Asia: a comparative perspective with Europe http://incas.hypotheses.org/ Does Ownership Really Matter?: The Role of Foreign Investors in Corporate Governance in Japan Hideaki Miyajima Waseda University / RIETI / WIAS Takaaki Hoda Showa Women’s University Ryo Ogawa Graduate School of Commerce, Waseda University The data on which this paper is based is taken from the database that Miyajima Hideaki had originally constructed with Nitta Keisuke (Nissay Life Insurance Co.). We would like to thank Nitta for allowing us to use this database. We wish to thank Yasuhiro Arikawa, Bok Baik, Leslie Hannah, Joel Malen, Colin Mayer, Hideo Owan, Sangin Park, Toshio Serita, and Steen Thomsen for valuable comments. We also wish to thank Kaori Ubukata for excellent research assistance on this project. This paper is one of results of the Corporate Governance Project at RIETI. Miyajima Hideaki is supported by a grant from the Japan Society for the Promotion of Science (Grant No. 19203017) and Global Initiatives Program. Earlier versions of this paper have been presented at symposia at the Tokyo Stock Exchange, RIETI, Annual Conference of Japan Finance Association, Japan Economic Association, the World Business History Conference in Frankfurt, the European Business History Conference, the Mitsubishi Conference, and workshops at Goethe University, University of British Columbia, Seoul National University, and Chulalongkorn University . The authors gratefully acknowledge the participants for their valuable suggestions to improve this paper.
-
Upload
duongtuyen -
Category
Documents
-
view
215 -
download
2
Transcript of INCAS - f-origin.hypotheses.org · ICAS DP Series Discussion Paper Series 2016 03 INCAS...

INCAS DP Series
Discussion Paper Series 2016 #03
I N C A S Understanding institutional change in Asia: a comparative perspective with Europe
http://incas.hypotheses.org/
Does Ownership Really Matter?:
The Role of Foreign Investors in Corporate Governance in Japan
Hideaki MiyajimaWaseda University / RIETI / WIAS
Takaaki Hoda Showa Women’s University
Ryo OgawaGraduate School of Commerce, Waseda University
The data on which this paper is based is taken from the database that Miyajima Hideaki had originally constructed with Nitta Keisuke (Nissay Life Insurance Co.). We would like to thank Nitta for allowing us to use this database. We wish to thank Yasuhiro Arikawa, Bok Baik, Leslie Hannah, Joel Malen, Colin Mayer, Hideo Owan, Sangin Park, Toshio Serita, and Steen Thomsen for valuable comments. We also wish to thank Kaori Ubukata for excellent research assistance on this project. This paper is one of results of the Corporate Governance Project at RIETI. Miyajima Hideaki is supported by a grant from the Japan Society for the Promotion of Science (Grant No. 19203017) and Global Initiatives Program. Earlier versions of this paper have been presented at symposia at the Tokyo Stock Exchange, RIETI, Annual Conference of Japan Finance Association, Japan Economic Association, the World Business History Conference in Frankfurt, the European Business History Conference, the Mitsubishi Conference, and workshops at Goethe University, University of British Columbia, Seoul National University, and Chulalongkorn University. The authors gratefully acknowledge the participants for their valuable suggestions to improve this paper.

ABOUT THE INCAS PROJECT
INCAS is a Marie Skłodowska-Curie Actions R.I.S.E funded project under the European Commission’s H2020 Programme.
The project INCAS aims at creating a top-level research and advanced training network on institutional change in Asia, in comparative perspective with Europe.The coordinator, Ecole des Hautes Etudes en Sciences Sociales (France), promotes this network together with Oxford University (UK), Freie Universität Berlin (Germany), and in collaboration with Waseda Uni-versity (Japan). The aim of the proposed mobility scheme is to give birth to a European consortium and network of faculties and advanced graduate students specialized in the comparative analysis of institutio-nal change in Asia and Europe. The partners have chosen Japan as a reference point because of its com-parability with Europe as shown by previous studies, its historical influence on development and further institutional changes in Asia, and the expertise accumulated within our research team.
Analyzing current economic dynamics in Japan and later expanding this analysis to other Asian countries promises to generate insights that might be help to better understand challenges for Europe and to prepare relevant policy proposals. Our purpose is to compare the results obtained in the case of Japan and few other Asian countries (South Korea, Taiwan, China, and possibly Thailand, after having checked the data availability), not only to previous results on Europe but also to original results we will get on European countries (primarily France – which will be our reference country in Europe – and then the UK, Germany, and Italy) in mobilizing new historical data and applying our theoretical framework.

INC
AS
DP S
ER
IES
/ 2016 #03
3
Abstract. After the banking crisis of 1997, corporate ownership in Japan shifted from an insider-dominated to an outsider-dominated structure. This paper analyzes the impact of dramatic changes in the ownership structure on corporate governance and firm value, focusing on the role of foreign institutional investors. There are two competing views on the role of increased foreign ownership. The positive view is that foreign investors have had high monitoring capability, and encourage improvements in the governance arrangement of firms, resulting in higher performance. Conversely, the negative view is that they have had strong bias in their investment strategies, and are less committed to a particular firm. Even though a correlation between foreign ownership and high performance has been observed, it may be a superficial one. Higher stock returns can be induced by the demand for a stock, while performance can simply reflect a foreign investor’s preference for a high quality firm. To determine which view is more compelling, we constructed a unique long-term data set, and examined determinants of foreign ownership and its impact on stock returns as well as performance. We found that the investment behavior of foreign investors has been characterized by a particular bias, and takes into account governance arrangements. Second, their investment substantially affected the stock return of firms. Third, even after controlling for reverse causality, however, their growing presence positively affected firm performance, suggesting that foreign institutional investors played a disciplinary role once after their shareholding increased.
Key words: Foreign institutional investors, Corporate governance, Home bias, Firm performance
JEL classification: G21; G32; K22; L25

INC
AS
DP S
ER
IES
/ 2016 #03
4
1. Introduction
The ownership structure of listed Japanese firms has long been characterized by stable shareholding by insiders such as banks, insurance companies, and business firms. The insider holding ratio surged from the mid-1960s, rising above 55% in the early 1970s, and continuing on a stable upward trend until 1990.1 These shareholdings were supported by an implicit agreement between respective managements that shareholders stay out of the affairs/management issues of firms that they invest in, were seen as a means of protecting against potential hostile third parties, and served as a foundation for long-term business practices in Japanese firms in the 1970s and 1980s. They were also institutionally complementary to other unique Japanese business arrangements such as the main-bank system, insider-dominated corporate boards, and the long-term employment system (Aoki, 1988; Jackson and Miyajima, 2007).
However, the insider-dominated ownership structure changed dramatically in the late 1990s in the aftermath of the banking crisis. As the ownership ratio of insiders, especially shareholding by banks and insurance companies, declined, outsider shareholding, in sharp contrast, surged. Outsider ownership refers to shareholding by domestic and foreign institutional investors, and shareholding by individuals, whose objectives are to maximize investment returns. Among these outsiders, foreigners increased their ownership dramatically. Their shareholding amounted to only 5% in the late 1980s bubble economy era, but grew consistently during the 1990s, and reached 28% in 2006, and subsequently stabilized. As a result, from the turn of the century, an outsider-dominated ownership structure has made a comeback, although in the current era institutional investors, especially foreigners, have become the main players instead of the individual shareholders of an earlier era. An insider-dominated structure and cross-shareholding are no longer defining characteristics of Japanese firms.
Internationally, the increase in ownership by outsiders, especially foreign institutional investors, has not been limited to Japan. It has also been observed among the insider-dominated countries in continental Europe, and in emerging economies, where family-controlled ownership structures have been dominant.2 For example, foreigners hold 34% of shares in South Korea, 20% in Germany, and 28% in Japan. It is true that these countries have retained insiders (from the founding families) as controlling shareholders or at least substantial blockholders, which is significantly different from the situation in the U.S. and U.K.
Does this increase in foreign ownership really matter? Has it had a significant impact on corporate governance in Japan?3 These issues will be addressed in this paper.
There are two competing views on the impact of increased foreign institutional shareholding on corporate performance. The first view is a positive one.4 It looks upon foreign institutional investors as independent and non-affiliated, unlike domestic institutional investors, who are so-called “gray” or affiliated investors.5 Foreign institutional investors have more incentive to monitor firms in which they invest through their daily fiduciary duties as well as controlling power (voting rights). They willingly put a premium on firms with corporate governance arrangements that conform to global standards including small boards, the appointment of outside directors, and the offering of high powered incentives to management, which could in turn drive board reforms in Japan and contribute to improved firm performance. This view also contends that there is a positive correlation between increased foreign ownership, and stock returns and firm performance.
On the other hand, the negative view is that foreign investors are less committed to monitoring each individual firm since they are mainly invested in the Japanese market as a part of a strategy of international diversification of their investment portfolio and also face asymmetric information problems.6 They normally prefer large firms with high liquidity, and renowned firms such as Toyota, Sony, and Honda. In general, their investment is mainly limited to firms
1 For a discussion of the formation of insider ownership, see Franks, Mayer and Miyajima (2014, hereafter FMM), and Miyajima, Haramura and Enami (2003).
2 For the French and German cases, see Goyer (2011). The share for Germany is the average for 2011-13, estimated from Deutsche Bundesbank, Special Statistic Publication 4., and the share for South Korea is for 2013, obtained from Korean Exchange, Annual Re port and Park. S. Korean Capitalism.
3 These questions are raised in Aoki (2010).4 Scholars have not limited their focus to Japan in addressing these issues. See Ferreira and Matos (2008), and Aggarwal et al. (2005). This
view is consistent with the convergence theory of corporate governance (Hansmann and Kraakman, 2000). 5 In some cases, domestic institutional investors (insurance companies and asset management firms) in Japan have long-term relationships
with the firms in which they invest. In other cases, the investees are subsidiaries of large financial institutions such as banks. See Flath (1993).
6 As for the home bias issue, see French and Poterba (1991), and Huberman (2001) for generalized treatments, and Kang and Stulz (1997) for the Japanese case.

INC
AS
DP S
ER
IES
/ 2016 #03
5
incorporated in the Morgan Stanley Corporate International (MSCI) index. Although they prefer firms with Anglo-American governance arrangements, such arrangements are not necessarily efficiency enhancing among Japanese firms whose other systems (affecting job promotion and transactions) are based on the long-term relationships. Even though the increase in the share held by institutional shareholders is associated with a rise in stock prices, this positive relationship is not a result of ex-ante monitoring capability, but rather simply a result of a demand shock to a specific firm’s stock price driven by demand for that stock (Gompers and Metrick, 2001). Furthermore, any positive relationship between increasing foreign ownership and corporate performance could be a reflection of reverse causality, i.e. foreign institutional investors are likely to invest in firms with high performance for fiduciary reasons.
The purpose of this paper is to identify which of these two competing views is more compelling. We must note here that both the positive and negative views are at least partly correct. We found that foreign institutional investors consistently have had a strong investment bias throughout the past two decades. We have also observed that they have had a preference for certain governance arrangements, which may be motivated primarily by fiduciary reasons. Although there is some evidence that foreign institutional investors are smart (able to pick growth firms), we cannot deny that the positive relation between increased foreign ownership and stock returns mainly arises from the demand shock ensuing from increased foreign ownership. However, most importantly, once the share held by foreign institutional investors increased for whatever reason, this certainly played a significant disciplinary role. We found that after carefully controlling for reverse causality, high foreign ownership is associated with high performance.
This paper is organized as follows. Section 2 traces the long-term trends of the ownership structure in postwar Japan. Section 3 analyzes determinants of the portfolio selections of foreign institutional investors. Section 4 examines the relation between foreign institutional ownership and stock returns. Section 5 analyzes whether foreign institutional shareholders contribute to corporate performance. Section 6 provides some discussion of implications and perspectives.
2. Evolution of ownership structure in Japan: Overview
2.1 Insider-dominated structure: From 1970 to 1990
We first look at the long-term trends in ownership structure from 1955 up to now. Figure 1 shows the long-term time series trend of insider and outsider holding ratios based on data from the Shareownership Survey, which covers all Japanese domestic stock exchanges. Here we define insiders as the aggregate of banks (excluding trust accounts of trust banks), insurance companies and corporations. In general, such shareholders maintain long-term business ties with the companies in which they invest, and their incentives are not to maximize investment returns but rather to maintain a relationship with these companies.7 On the other hand, outsiders are the aggregate of foreigners, individuals, mutual funds, pension trusts, whose holding objective is to maximize investment returns. Figure 1 shows the holding ratios of insiders and outsiders based on the aggregated market capitalization.
Figure 1. Long-term time series trend of ownership structure in Japan, page 22
Due to postwar reforms, the ownership structure of Japanese firms was initially highly dispersed and consisted primarily of individual shareholders. However, the ownership structure rapidly stabilized as insiders such as banks and corporations attained ownership stakes following the stock slump of 1965.8 By the early 1970s, the ownership structure had become completely dominated by insiders.9 In the mid-1980s, the insider holding ratio exceeded 60%, while the ratio held by outsider individual and institutional investors remained low at around 35-40% in Japan.
This insider-dominated ownership structure remained largely unchanged until the mid-1990s. In the bubble economy period of the late 1980s, when financing shifted from bank lending to equity-related financing, including convertible bonds and bonds with warrants, financial institutions still remained large net buyers, and slightly increased their holding ratio.
Figure 1 shows the overall trend in the evolution of ownership structure. However, it is aggregated from a weighted average based on market capitalization. Therefore, it does not shed light on the variance of ownership
7 While insider ownership overlaps with cross-shareholding and stable-shareholding, it is a broader concept. FMM (2014) analyzes the evolution and international characteristics of ownership structure in Japan from this perspective.
8 Unless otherwise noted, “banks” refer to banks other than trust banks, and “corporations” refers to firms (mainly listed firms) excluding banks, trust banks, insurance and security companies.
9 For more information, see Kawakita (1995), Miyajima, Haramura and Enami (2003), and FMM (2014).
INC
AS
DP S
ER
IES
/ 2016 #03
6
among Japanese firms and how this has changed over time. To examine these issues, we newly constructed firm-level data by compiling the non-financial business firms listed in the First Sections of the three major domestic stock exchanges -- Tokyo, Osaka and Nagoya (referred to below as First Section firms). We combined Major Shareholders Data (Toyo Keizai Inc.) with the annexed detailed statements and shareholding data by type of shareholder contained in securities filings (Nikkei NEEDS). We then reconstructed detailed shareholder registries for firms, identified cross-holding relationships, and determined the shareholder attributes of large shareholders with at least 3% ownership, and attempted to classify shareholders into insider and outsider categories to the extent allowed by the data. Table 1 provides the summary statistics of our data at the five respective reference years beginning with 1991. Note that the coverage ratio of this data is roughly 80% due to data constraints.
Table 1 shows that there were only minor changes in ownership structure from 1991 to 1996, and the variance in ownership structure among firms is also small. Although insider ownership exceeded 45%, the standard deviation is only 14%. On the other hand, outsider ownership is far smaller at 31%, with a small standard deviation of approximately 11%. Thus up to this point in time, insider dominance was characterized by homogeneity.
However, after the bubble’s collapse in the early 1990s, outsider ownership gradually increased, while insider ownership lost its foothold and began to rapidly deteriorate from 1997. In the next section, we discuss in more detail the changes in ownership structure since 1990, focusing on the role of foreign institutional investors as outsiders, and cross-shareholding relationships as insiders.
Table 1. Recent trends in ownership structure, page 26
2.2 Initial growth of foreign institutional investors: 1990 to 1996
Entering the 1990s, the foreign ownership ratio gradually rose in conjunction with the growth of assets under management, without regard to changes in the asset allocation ratio. In fact, U.S. and other foreign institutional investors began increasing their foreign investment from 1990 to achieve international diversification in step with economic globalization. For example, the amount of foreign equity investment outstanding by the U.S. surged from USD 197.6 billion in 1990, to USD 776.8 billion in 1995, and reached USD 1,830.4 trillion in 2000 (Ahmadjian, 2007, p.127). As part of the expansion of global portfolio investors, the foreign ownership ratio of major Japanese firms grew from 4.1% in 1991 to 7.1% in 1996 (Table 1).
Moreover, the rising presence of foreign institutional investors in Japanese markets was more pronounced than indicated by the ownership structure. First, foreign institutional investors were not only the sole net buyers during this period, but were characterized by high turnover, so the trading share of foreigners in the First Section of the Tokyo Stock Exchange surged from approximately 10% in 1988 to almost 40% in 1996.10 As the influence on stock price formation from transactions by foreign investors grew, their valuations came to wield a large influence over management. In addition, during this period, the market infrastructure improved due to the entry of foreign financial institutions and increase in the number of securities analysts.11 Second, it is important to note the stock selection bias exhibited by foreign investors in this period. In particular, they showed a preference for firms that were already held in high esteem by the market, i.e. large firms with a high ratio of overseas sales, strong profitability, and good credit ratings (Miyajima and Kuroki, 2007, pp. 86-88). For example, the foreign ownership ratio at Canon, a prominent exporter, rose from 21.5% in 1991 to 39.0% in 1996, and that of Sony likewise rose from 21.6% to 39.0%. Japanese firms, which used to be commonly characterized by strong ties with main banks in loan financing and equity holding, and low foreign ownership, began to diversify quietly in the mid-1990s in terms of bank ties and ownership structure. Such differences among firms would later have important implications for the future evolution of the ownership structure.
2.3 Unwinding of cross-shareholding: From 1997 to 2004
The insider-dominated ownership structure, which had shown remarkable stability until the mid-1990s,
10 Trading share = (value of trading consigned by foreigners / value of total trading). Since foreign corporations and individuals residing abroad do not often engage in large-scale or high-frequency trading, most of the transactions can be assumed to be those of institutional investors.
11 Market entry by foreign securities firms leveled off during the bubble period. The number of entrants surged from 14 firms in 1985 to 52 firms in 1990, and subsequently stabilized at 57 firms in 1997 (Year-end; Japan Securities Dealers Association Survey). Thus, the 1990s were characterized by the business expansion of foreign securities firms. Meanwhile, the number of certified members of the Security Analysts Association rose from 2,200 individuals in 1990 to 9,400 individuals in 1996.

INC
AS
DP S
ER
IES
/ 2016 #03
7
changed radically after the 1997 banking crisis.12 The ratio of cross-shareholdings, which formed the core of this structure, plummeted from 15.3% in 1996 down to 9.2% in 2006 (Table 1).13 The primary cause was the unwinding of cross-shareholding between banks and corporations.
Meanwhile, business firms began to sell off their bank shareholdings in 1997. The riskiness of bank shares became evident after the Jusen housing loan problem erupted in 1995, causing share prices of parent banks to correct downward, and the correction accelerated as banks began to fail in 1997. For the first time in the postwar period, corporations faced the difficult choice of whether to hold or sell their bank shares. In parallel with these changes in the market environment, foreign institutional investors increased their presence as explained below. Furthermore, investors began to strongly criticize cross-shareholdings and call for accountability and transparency. In addition, new accounting rules were introduced in the early 2000s for consolidated accounting reporting (March 2000) and mark-to-market valuation of cross-shareholdings (March 2002), making corporations keenly aware of cross-shareholding risks.
Meanwhile, at the same time that their non-performing loans were mounting, banks faced the growing risks from shareholding as unrealized gains shriveled in the post-bubble stock market, and began selling off shares in 1997. The selloff accelerated in 2001 when the size of banks’ shareholdings included in Tier 1 capital requirements was limited (effective January 2002).14 In 2001, net selling by the banking sector reached JPY 2.3 trillion, and remained between JPY 1 trillion to JPY 2 trillion until 2005. As a result, the holding ratio of banks fell by 6.4% from 1996 to 2001, and declined another 3.4% from 2001 to 2004.
2.4 Surge of foreign institutional investors: 1997 to 2006
In parallel with the unwinding of cross-shareholding, the ownership ratio surged in particular among foreign institutional investors. From 7.1% in 1996, the ratio of foreign investors surged starting in 2002, doubling to 14.2% in 2006 (Table 1). The IT sector became one of the first targets of investment in 1999. For example, the foreign ownership ratio of NEC surged from 16.9% in 1996 to 28.3% in 2001. Moreover, from 2003, large firms in the heavy industry sector were favored by investors due to the boost from the growth of the global economy and China in particular. For example, in 2006 the foreign ownership ratio of Japan Steel reached 21.9%, and the outsider ownership ratio reached 53.6%.
As a result, the ownership structure of Japanese firms changed drastically, and notably, in 2000 outsiders assumed the dominant position once held by insiders (Figure 1). The ownership structure of Japan’s listed firms returned to that of the early 1960s, a time when stable shareholders had yet to emerge. Moreover, the main entity in this resurgence of outsider-dominated ownership structure had shifted from individuals to domestic and foreign institutional investors.
Moreover, the presence of foreign institutional investors in market transactions has grown even more pronounced than before. The share of transactions by foreigners in the Tokyo Stock Exchange First Section surpassed 40% in 1997, reaching 50% in 2000 and 60% in 2006. The fact that foreigners became the dominant force in the market dramatically raised their influence in price formation in Japanese markets. On this point, the relationship between the value of net buying by foreigners and the Nikkei 225 index is shown in Figure 2.15 Moreover, a series of hostile takeover bids were seen from the mid-2000s including the Livedoor’s TOB of Nippon Broadcasting (2005), Oji Paper’s TOB of Hokuetsu Paper (2006), and Steel Partners’ TOB of Bulldog Sauce (2007). Thus, Japan’s market for corporate control had entered a formative stage.16
12 Many observers have expressed surprise at the stability of ownership structure from the 1970s to mid-1990s (Flath, 1993; Kawakita, 1995).13 The aggregate cross-shareholding ratio of the market is calculated for firms listed on the First Sections of the three major exchanges at
the end of each fiscal year. It is the firm-level mean calculated from individual firm-level data, and tends to underestimate the actual value because we only count cross-shareholdings between two firms. In addition, since the scope of disclosure of detailed financial statement filing changed from the March 2000 period, the current standard is applied retroactively for preceding years to maintain continuity of the time series data. As a result, the cross-shareholding ratio becomes approximately 3% smaller for 1999 and preceding years compared to the available data.
14 In Tier 1 capital, items such as unrealized gains from securities are deducted from equity capital.15 According to a simple regression of the stock price index against net buying pressure (=(Purchase amount - Sale amount) / Total capitalization
of TSE First Section x 100), the net buying pressure coefficient rose from 10.19 in the period from January 1980 to December 1989, to 24.67 in January 1990 to December 1999, and still remained high at 17.5 in January 2000 to October 2009. In 2003 and mid-2005, large net buying by foreigners pushed up the market.
16 While there is no clear definition of an activist fund, in general the term is used to refer to private investment institutions which are relatively unregulated, and who, as major shareholders, seek to exert influence on corporate activities in order to increase investment returns.

INC
AS
DP S
ER
IES
/ 2016 #03
8
The shift in shareholders’ awareness caused by the growing presence of foreign institutional investors gradually spread to domestic institutional investors. In the 2000s, the Federation of Employees’ Pension Funds (predecessor of the Pension Fund Association) and domestic investment advisory firms also began to actively exercise their voting rights, and even insurance firms, which were known for being silent shareholders, began to consider procedures to exercise their own voting rights.17 In the late 2000s, listed firms had no choice but to pursue management strategies that took outsider interests into consideration, i.e. usually by taking steps to maximize shareholder value.
Figure 2. Transactions by foreign investors and the Nikkei 225 index, page 23
2.5 Leveling-off of foreign institutional investors and the “resurgence” of cross-share-holding: From 2005 to 2008
The linear uptrend of the outsider ownership ratio after the banking crisis appears to have reversed after peaking in 2006 (Figure 1). In contrast, insider ownership moved in the opposite direction and began increasing. In 2004, as the selloff of bank shareholdings paused, some business firms formed “strategic alliances” by strengthening capital ties with other firms, which was noted as a “resurgence” of cross-shareholding.18 This occurred against the backdrop of an increase in outsider ownership and hostile takeover bids, and a lifting of the ban on forward triangular mergers (May 2007).
For example, Japan Steel, faced with the threat of acquisition by foreign competitors who were aggressive in M&A activity, pursued a “strategic alliance” with Sumitomo Metal Industry and Kobe Steel, and expanded cross-shareholdings among the three firms in stages from 2005. As a result, the firm’s cross-shareholding ratio with respect to the number of issued shares rose from 1.2% in 2001 to 8.4% in 2008.19 In addition, in March 2006, Hitachi Metals and Daido Steel agreed on a capital and business alliance. The two firms agreed to jointly purchase and develop specialty steel materials used in automobile parts, and to purchase approximately 1% of each other’s shares primarily in the market, and increase the cross-shareholding ratio in stages. The capital alliance was reputedly triggered partly by a crisis over the risk of acquisition. Meanwhile, firms that were confronted with the threat posed by activist funds also sought to create stable shareholdings.20 For example, since 2005, cross-shareholdings were strengthened among mature mid-sized firms such as Toei.
Meanwhile, against the backdrop of the emerging “subprime” problem, foreign institutional investors became net sellers from approximately 2007, and after the Lehman Brothers crisis struck in September 2008, the scale of selling expanded significantly (Figure 2). As a result, the foreign ownership ratio dropped suddenly from 13.9% in March 2008 to 11.7% one year later. During this period, the Nikkei average plummeted 38% from 13,072 yen (end of August 2008) to 8,109 yen (end of March 2009), which can be attributed largely to selling by foreign investors. Thus, due to the increased prominence of foreign investors, their trading strongly influenced Japanese stock prices.
As shown above, since 1997 changes in the ownership structure can be characterized by a rapid shift from insider dominance to outsider dominance, and leveling off of outsider dominance since 2005. The most important point is that these changes did not occur uniformly across all firms. For example, as the standard deviation trend in Table 1 shows, while the insider ownership ratio dropped 8.3 percentage points from 46.6% in 1991 to 38.3% in 2008, the standard deviation rose from 13.5% to 16.4%. In addition, the ownership ratio of institutional investors, who form the core of outsiders, surged from 9.2% in 1991 to 19.0% in 2008, while the standard deviation increased from 7.4% to 13.9% over the same period.
These results naturally raise a number of questions. First, regarding the increased presence of foreign institutional investors, how should we comprehend this trend since 1990? Was their investment policy really biased?
17 To facilitate the investment side, the Federation released “Fiduciary Responsibility Handbook: Investment Institution Edition” in 2000 and “Practical Guidelines for Exercising Voting Rights” in 2001.
18 For example, the May 17, 2005 issue of the Weekly Economist noted that “the self-defense instinct of firms produced a rush of dividend increases and resurgence of cross-shareholding,” the July 22, 2006 issue of the Weekly Toyo Keizai pointed out that “cross-shareholding advances beneath the surface,” and the December 29, 2006 issue of the Nikkei Financial Daily mentioned it in a review of keywords in corporate finance for 2006.
19 The Nikkei Newspaper observed that due to this strategic alliance, “the stable shareholding ratio, which was approximately 30%, is now almost 50%” (“Real Image of the Resurgence of Cross-shareholding,” September 28, 2007).
20 A good example is Satoh. When Steel Partners purchased a large stake in 2003, Satoh increased its cross-shareholdings with Daido Limited, its largest shareholder. Shareholder information from March 2004 shows that compared to the previous year, Satoh’s ownership ratio in Daido Limited rose from 2.0% to 3.5%, while that of Daido Limited in Satoh rose from 8.6% to 10.5%. Daido Limited, which was also under threat from the activist Murakami Fund, started a new cross-shareholding relationship with Onward Kashiyama in 2004.

INC
AS
DP S
ER
IES
/ 2016 #03
9
Was a significant premium granted to board reforms as has been frequently noted? Second, what impact did the changes in foreign ownership have on stock returns? Did the increase (or decrease) in foreign investment really influence the rise (fall) in stock returns? If so, to what extent? Last, once foreign ownership increased with high variance among firms, did foreign ownership really have a significant disciplinary effect? We address these issues in the following sections.
3. Preferences of foreign institutional investors
3.1 Stylization of facts and hypothesis
Along with the unwinding of cross-shareholding, one of the most remarkable developments in ownership structure in the post-banking crisis period has been the sharp increase in foreign ownership (Figure 1). Similar to the unwinding of cross-shareholding, an inflow of foreign funds did not occur uniformly across all listed firms. This point is evident from the standard deviation of the foreign ownership ratio shown in Table 1. Furthermore, we illustrate it from different angle with Table 2, which provides the distribution among non-financial listed firms according to the share of foreign ownership.
Looking at the distribution of foreign institutional investors in 1990, we find that the maximum frequency was firms with a foreign ownership ratio below 3%, but when the immediate post-bubble stock market gyrations abated from 1993 to 1996, one peak occurred in the 1%-3% range (referred to below as the left peak) and another peak in the 5%-10% range (right peak). In the period from 1999 to 2002 after the banking crisis, the right peak shifted further rightward to the 10%-20% range, while the left peak shifted to the left to the 0%-1% range, clearly showing a polarization. From 2003 to 2007, as the foreign ownership ratio rose one step further, the number of firms belonging to the left peak (1%-3%) decreased, while that of the right peak (10%-20%) increased. Looking more closely at 2006, when foreign investors broadly added Japanese equities to their portfolios against the backdrop of the global economic recovery, there were 454 firms in the 10-20% range, 339 firms in the 20%-33% range, and 128 firms at an even higher range.
Table 2. Distribution of foreign investor ownership, page 27
The above results suggest that stock selection by foreign institutional investors has been characterized by some sort of preference or bias. Their stock preferences are known to have been shaped by a strong home bias in their international portfolio allocation and a behavioral bias as institutional investors.21
Due to costs associated with geographic constraints and cultural and language barriers, the information available to foreign institutional investors is limited compared to domestic investors. Thus, foreign investors are supposed to prefer large firms because their information is relatively more accessible.22 Consistent with this view, Kang and Stulz (1997) show that foreign investors also tend to prefer large firms in Japan’s equity markets. In addition, the behavioral bias of institutional investors may also influence their stock selection.23 For example, the behavior of institutional investors may be affected by (soft and/or hard) regulations requiring fiduciary responsibility and imposing investment guidelines, as well as the explicit and implicit demands of beneficiaries (Del Guercio, 1996; Falkenstein, 1996). Moreover, institutional investors are also known to prefer stocks characterized by high liquidity and low transaction costs (Gompers and Metrick, 2001).
Moreover, in recent years, corporate governance has been noted as a determinant of home bias. The asymmetry of information between domestic and foreign investors can become particularly large with respect to issues such as the corporate governance structure and possibility of expropriation by insiders. Foreigners have difficulty understanding each country’s unique transaction practices and political ties, banking relationships with business firms, the social status of prestigious families, and networks in the business community (Leuz et al. 2009). In addition, a stock selection bias could arise if the interests of insiders (including large shareholders and managers) diverge from those of other shareholders, causing their respective expected returns to also diverge (Stulz, 1981; Giannetti and Simonov 2006). Many empirical studies also show that foreign investors are passive toward investing in countries or firms that exhibit 21 In general, a home bias in international investment allocation refers to the allocation of a high percentage of assets to one’s own country that
cannot be rationally explained. Previous studies have also noted a stock selection bias within one country by institutional investors, which is due to factors in common with the home bias.
22 For example, see Merton (1987), French and Poterba (1991), and Brennan and Cao (1997).23 The tendency of unsophisticated investors to prefer stocks with which they are familiar is attributed to an investor familiarity bias from
cognitive psychology (Huberman 2001). Hiraki et al. (2003) show that domestic and foreign institutional investors in Japan’s markets exhibit this type of stock preference.

INC
AS
DP S
ER
IES
/ 2016 #03
10
poor corporate governance.24
3.2 Analytical model
In consideration of the above points, we estimate the following model (1), according to Gompers and Metrick (2001). The sample includes all non-financial firms listed in the First Section of the Tokyo, Osaka, and Nagoya Stock Exchanges from 1990 to 2008. The firms’ financial and stock price data are drawn from Astra Manager (Quick). We estimate the 19 reference years with separate cross-sectional regressions, following Fama-MacBeth methodology.
FIOi,t = αt + β1t IBi,t + β2t QSi,t + β3t HBi,t + β4t GOVi,t + εi,t (1)
Where FIOi,t is the level of foreign institutional ownership adjusted by floating stock for firm i in year t.25 IBi,t is for variables which capture the bias of institutional investors, including market capitalization, SIZE, and turnover ratio, TURN. It should be noted that foreign institutional investors tend to prefer large and liquid stocks (Kang and Stulz, 1997; Gompers and Metrick, 2001). We also include the book-to-market ratio, BM, to capture the investment style.
QSi,t is the proxy for fiduciary concerns which are composed of six firm characteristics. Del Guercio (1996) insisted that institutional investors who pay strong attention to fiduciary duties prefer high quality stocks. The variables include investment opportunity, INVOP, dividend yield, DY, profitability, ROA, stock volatility, VOL, leverage, DEBT, and cash holdings, CASH. If foreign investors take their fiduciary duties seriously, and follow prudent rules, the share of foreign ownership will be sensitive to these variables, and the foreign investors will prefer the stock of firms that have high ROA, large cash holdings, high yields, lower stock volatility, and better financial health.
HBi,t is the proxy for home bias among foreign institutional investors. We apply three variables; the oversea sales ratio, OS, the MSCI dummy, which is 1 if a firm is incorporated into the Morgan Stanley Capital International index, MSCI, and ADR dummy, which takes 1 if a firm is ADR listed, ADR. The distribution of the MSCI and ADR dummy is 21.4% and 1.5% respectively for the whole sample (see Table 3). These variables make it possible to capture foreign investors’ home bias. Kang and Stulz (1997) and Hiraki et al. (2003) find that home bias also exists in Japan.
Lastly, GOVi,t are a series of variables intended to capture governance characteristics: number of total directors, DIR, the independent directors ratio, INDIR, business group dummy, BG, and subsidiary, SUB. We also include a momentum factor and industry dummy in the above regression model. Detailed definitions of these variables are provided in the Appendix. The descriptive statistics of these variables are summarized in Table 3.
Table 3. Descriptive statistics, page 28
As mentioned above, we summarize regression results by following Gompers and Metrick (2001), which applies the Fama and MacBeth (1973) cross-sectional regression approach. This approach consists of two steps. In the first step, we run cross-sectional regressions for each time period (year) to obtain estimates of the parameters. In the second step, we use the time series of these estimates to obtain final estimates for the parameters and standard errors. These procedures enable us to treat the problem of cross-sectional correlation in the residuals.
3.3 Regression results
The estimation results of the Fama-MacBeth regression are summarized in Table 4, which provides the average coefficient (first column) of the 19 yearly OLS regressions, the number of positive and negative coefficients of each variable (second and third column), and the number of cases where the coefficient is significant at the 5% level in lower brackets. The results are largely consistent with our prediction as well as results of previous studies. The coefficients
24 See Aggarwal et al. (2005), Giannetti and Simonov (2006), Ferreira and Matos (2008), and Leuz et al. (2009).25 Gompers and Metrick (2001), and Ferreira and Matos (2008) introduce the ratio of floating stock as an independent explanatory variable
in their models. However, since the non-floating (stabilized stock) is so large in Japan due to the prevalence of cross-shareholding, it would be appropriate to standardize foreign ownership with the floating stock ratio. We also ran a conventional model that uses the floating stock ratio as an explanatory variable. The result is basically unchanged. This point is suggested by Toshio Serita (Aoyama Gakuin University).

INC
AS
DP S
ER
IES
/ 2016 #03
11
of SIZE and TURN are positive and statistically significant, implying that foreign investors prefer large and high-liquidity stocks. The regressions also show that foreign investors prefer the “high quality” stocks of profitable and financially healthier firms. Moreover, the coefficients for OS and MSCI are positive and highly significant, suggesting that foreign investors have a strong home bias. The magnitude of the MSCI dummy is large. Firms incorporated into the MSCI are 3.5% higher than other firms, all other things being equal.
Table 4. Determinants of foreign investor ownership, page 29
Next, to consider historical change, we divide the sample into two periods -- the period before Japan’s banking crisis (1990-1997, hereafter Period I) and the period after the banking crisis (1998-2008, Period II). The results are almost unchanged. Foreign institutional investors prefer large, liquid, high quality stocks, and firms with high overseas sales and MSCI firms. They are consistently influenced by fiduciary motives and a strong home bias before and after the banking crisis. However, the coefficient for VOL (volatility), which is negative and statistically significant before the banking crisis, turned positive and insignificant after the crisis. In the same manner, the coefficient for MOM (momentum) changed from significantly positive to negative with less significance. These results imply that stock volatility and momentum were influential determinants of foreign investors’ portfolio allocation initially, but information asymmetry was gradually mitigated as foreign investors expanded their business in the 1990s, so they came to be considered extrinsic factors as they grew less important.
Estimation results further suggest that foreign institutional investors prefer firms with good corporate governance arrangements (e.g., small, efficient boards and a high independent director ratio), reflecting the strong fiduciary motives and prudence of foreign investors. In Table 4, the coefficient of DIR (board size), is negative, and is significant for 12 out of 19 reference years. Dividing the sample into two sub-periods, in Period I before the banking crisis, foreign investors tended to prefer firms with a small board, but this tendency weakened in Period II after the banking crisis, when small boards gradually became the standard. In the meantime, their preference turned toward firms with independent external directors who were not dispatched from banks or controlling entities, a tendency which became clear in Period II after the banking crisis. The coefficient of INDIR (independent directors ratio) is negative for nine observation years out of eleven, although none of them is significant. According to the pooled OLS regression (not reported), the coefficient of INDIR is negative and significant.
Until 1996, the boards of directors at Japanese firms were characterized by (1) the lack of organizational separation between management supervision and execution, (2) excessive number of board members, and (3) insider boards (composed of members promoted from within firms). Foreign institutional investors became increasingly critical of such insider-dominated organizations, whose arrangements differed from the Anglo-Saxon model, and put a priority on investing in firms that engaged in such board reform.26 Foreign investors were particularly interested in firms that launched organizational reform to reduce board size as well as to separate management supervision from execution. After management reforms made progress in the mid-2000s, their concerns shifted to the independence of outside directors. The results in Table 4 suggest that this imparted a premium to firms in which foreign investors spearheaded board reforms.27 These results are also related to the empirical finding that the higher the foreign ownership ratio of a firm, the more aggressively board reforms are pursued, and the higher the ratio of outside directors (Saito, 2011; Miyajima and Ogawa, 2012). This is because if investors exhibit their preferences, managers will listen to them and implement desired board reforms.
4. Foreign ownership and stock returns
4.1 Model and conjectures
Did the drastic change in the level of foreign ownership really affect corporate performance through improved corporate governance of Japanese firms? In this section, we approach this issue first by examining the relationship between changes in the level of foreign ownership and the rate of stock returns. To examine this issue, we estimate the
26 According to 2000 and 2002 McKinsey & Company surveys of institutional investors who invest in international equity markets, foreign institutional investors said they would pay a 20% premium for Japanese firms with superior corporate governance. Among advanced economies, this premium is exceptionally high compared to 14% in the U.S., 12% in the U.K., and 13% in Germany and France, and equivalent to smaller equity markets of developing economies such as in Southeast Asia. The high premium suggests that foreign institutional investors are strongly critical of corporate governance in Japan.
27 Another pillar of board reform is the compensation system. In this regard, the stock option system introduced in 1997 has attracted attention. In our analytical data, the presence of a stock option system can be identified from 1999. When a dummy variable for the presence of stock options is added to the equation, the coefficient is significantly positive in three out of the 11 years. While not necessarily compelling, these results indicate that foreign institutional investors showed a preference for stock options as well.

INC
AS
DP S
ER
IES
/ 2016 #03
12
following simple model (2) according to Gompers and Metrick (2001).
RETi,t = αt + β1tCONTi,t + β2tFIOi,t-1 + β3tΔFIOi,t + εi,t (2)
Where RETi,t is the excess rate of stock returns of firm i, which is estimated by taking the difference of the rate of stock returns (including dividends) between firm i and TOPIX. As explanatory variables, we use CONTi,t , a series of variables that could influence RETi,t. We take the same variables as equation (1) in the previous sections with a one-year lag. FIOi,t-1 is the percentage share held by foreign institutional investors at the end of the previous firm year (at the beginning of current firm year), and ΔFIOi,t is its change during the current firm year, Hereafter, we focus on FIOi,t-1 and ΔFIOi,t. If the stock return of a firm is positively sensitive to the level of foreign shareholding at the beginning of the firm year, it suggests that foreign institutional investors monitored firms in which they invest or top management of firms adopted an appropriate business strategy that could prevent foreign investors from intervening in a firm or/and selling their holding stock (ex-post monitoring). If the stock return is positively sensitive to the change of foreign ownership in the current year (ΔFIO), it suggests that foreign investors can distinguish firms with high growth opportunities from others, and invest in them (ex-ante monitoring or screening). Based on these conjectures, we test the relationship of the level and change of foreign ownership with the rate of stock returns in year t, then identify the economic magnitude. We estimate model (2) through a Fama-MacBeth regression where the yearly cross-sectional regression is as in Table 4.
Table 5 summarizes our estimation results on the regressions. The coefficient of the level of foreign ownership at the beginning of the firm year is negative, but insignificant, suggesting that the ex-ante monitoring or screening of foreign institutional investors is not clear. On the contrary, the coefficient of the change of foreign ownership (ΔFIO) is positive with a 1% significance level. The economic magnitude of the ΔFIO is substantially large with a coefficient of 2.165, implying that a 5% increase of foreign ownership is associated with a rise in the rate of return on stocks over 10%.
Table 5. Impacts of foreign investor ownership on stock return, page 30
Then, to what extent did the change of foreign ownership influence the rate of return on stocks during the 1990s and 2000s, when Japanese firms experienced drastic changes in their ownership structure? Figure 3 provides us with a clear picture of the extent of this influence. The economic magnitude of increasing foreign ownership is calculated by multiplying a one standard deviation change in foreign ownership by the estimated coefficient of change in the foreign ownership (ΔFIO) in the Fama-MacBeth estimation. Changes in foreign ownership affected stock returns for all of the estimation years. On average, one standard deviation (3.7% from 1990-2008) is associated with a 7.9% change in stock returns. The maximum of 15.8% was achieved in 1999, when there was a huge ownership shift from domestic financial institutions to foreign institutions. The period average for 1990-96 was 5.8%; the 1997-02 period saw a 9.7% change in stock returns, and the 2003-08 period 8.4%.
Figure 3. Impacts of change in foreign investor ownership on stock returns, page 24
4.2 Smart investors vs. demand shock
There is a robust relationship between increased foreign ownership and rising stock returns. This result is consistent with the understanding that investors are smart enough to distinguish growth firms from others (i.e. investors who are capable of picking winners). However, as Gompers and Metrick (2001) pointed out that the positive correlation could also be explained by the fact that their increased investment in itself raised the stock prices of firms in which they had invested (demand shock hypothesis). This is highly plausible because foreign investors have a strong investment bias for firms that are large and highly liquid, have high rates of overseas sales, and are included in the MSCI index.
To examine the possible effect of the demand shock, we divided the sample period (1990-2008) into two sub-periods according to the amount of money inflows from foreign institutional investors - high inflow and low inflow periods. If the positive effect of increased foreign ownership could be observed only when capital inflows from them were high, it is likely that their positive effect on stock returns is mainly based on the demand shock. If the positive effect could be observed even when their capital inflows were low, it is likely that foreign institutional investors were

INC
AS
DP S
ER
IES
/ 2016 #03
13
sufficiently smart and had a high screening capability. We use the following formula (3) to estimate inflows from foreign institutional investors based on Gompers and Metrick (2001).
Where Sizei,t-1 is the market capitalization at the end of previous firm years; ΔFIOi,t is the change in foreign institutional investors in current year t; capital inflow is the product of Sizei,t-1 and ΔFIOi,t, which is standardized by the whole market capitalization at the end of previous year.28 Using the estimated capital inflows, we divided the 19 reference years into a high inflow period (ten years) and a low inflow period (nine years). The estimation result of equation (2) for the high and low inflow periods is provided in Table 5.
There is no significant difference between the high and low inflow periods in terms of the effect of changes in foreign ownership on the rate of stock returns. Its coefficient is 2.29 for the high inflow period compared to 2.11 for the low inflow period. On the contrary, the effect of changes in domestic institutional investors on stock returns is significantly positive in the high inflow period, but not significant in the low inflow period (not reported here), suggesting that the effect of an increase in domestic investors is likely to have been a cause of the demand shock.
We also examine the same test using a different periodization based on trading information disclosed by the Tokyo Stock Exchange to identify the high and low inflow periods. The result is the same as that shown in Table 5. Thus, the positive effect of foreign institutional investors on stock returns was primarily caused by the demand shock, but also partially by their monitoring capability.
5. Management disciplinary effect of foreign institutional investors
5.1 Monitoring
In this section, we examine whether the growing presence of foreign institutional investors since 1990contributed to corporate performance by enhancing managerial effort. Unlike conventional shareholders such as banks and insurance companies, foreign institutional investors are independent and strive to maximize shareholder value, so they are supposed to actively exercise either voice or exit. Thus, even if foreign institutional investors have an investment bias, their presence (monitoring and exit) likely spurs management into action, and adoption of appropriate business and organizational strategies.
In the previous section, we used cross-sectional analysis to examine foreign institutional investors’ preferred portfolio allocations, and the effect of changes in foreign ownership on stock returns at one point in time. However, to examine how the changes in the foreign investor ratio over time affects corporate performance, we thought it would be more appropriate to apply a time-series model.
With regard to the disciplinary effect of foreign institutional investors in Japan, numerous empirical studies have noted a positive performance effect. More specifically, they consistently find that corporate performance as measured by Tobin’s Q, ROA, or total factor productivity (TFP) is positively correlated to the ownership ratio of foreign investors or foreign individuals including parent firms.29 However, since the stock preferences of foreign investors can be partly explained by a home bias and corporate governance factors, foreign ownership should not be considered to be an exogenous variable. In particular, when examining the effect on corporate performance, we must consider reverse causation whereby foreign investors prefer firms that perform well. The current literature does not adequately address this problem.
Therefore, to address the disciplinary effect of foreign institutional investors, we use a standard panel analysis method and simultaneous equation model, adding to the median regression. As a first approximation, we estimate the following base equation (4), which takes into account the chronological compatibility of the causal relationship.
Log(Q)i,t = α + β1FIOi,t + β2SIZEi,t + β3INVOPi,t + β4LEVi,t + β5IND-Qi,t + εi,t (4)
28 A negative sign means an outflow of money. 29 For example, see Lichtenberg and Pushner (1994), Horiuchi and Hanazaki (2000), Sasaki and Yonezawa (2000), Miyajima and Nitta (2003),
Miyajima and Kuroki (2007), and Miyajima and Nitta (2011).

INC
AS
DP S
ER
IES
/ 2016 #03
14
Where dependent variable, Log(Q)i,t, is logged simple Q, which is calculated by the sum of total assets plus market value of equity minus book value of equity divided by total assets. The dependent variables are firm size (logged total assets), SIZEi,t, investment opportunities (prior two years’ sales growth rate), INVOPi,t, leverage (debt to total assets ratio), LEVi,t, and the industry median Tobin’s Q, IND-Qi,t. Finally, FIOi,t is the level of foreign institutional ownership for firm i in year t. The FIOi,t is our focus, and we expect to obtain a positive sign. We introduce year dummies to eliminate the mean time-series trend of each variable. The sample we used was the same as that of the previous section, composed of all non-financial firms listed on the Tokyo, Osaka, and Nagoya Stock Exchange First Sections from 1990 to 2008.
We first run equation (4) by median regression. However, since the stock preferences of foreign institutional investors can be partly explained by the home bias factor and corporate governance factor, the ownership ratio cannot be considered to be an exogenous variable. In particular, when examining the effect on corporate performance, we must consider the reverse causality in which foreign institutional investors prefer firms that perform well. To alleviate this endogeneity problem, we perform a standard panel analysis method (fixed effect model). Even using the fixed effect model, however, the reverse causality issues cannot be completely resolved. As a third way of estimation, we use the simultaneous equation model (3SLS), considering that the ownership ratio is determined by the home bias and corporate governance factor at the start of the period. In the 3SLS, we run equation (4) and equation (1) in section 3, which includes the investment bias of institutional investors, IBi,t, the proxy of fiduciary concerns, QSi,t, home bias factors HBi,t and governance factor, GOVi,t. Notice that the book-to-market ratio, BM, is excluded, since Tobin’s Q and BM are highly correlated. In this model, we treat foreign institutional investor ownership (FIO) as an endogenous variable, and identification is achieved by the independent variables included in the equation (1) that are not associated with Tobin’s Q.
5.2 Regression results
The results of the three estimation methods are summarized in Table 6, panel A. The coefficient of FIO is positive, suggesting that foreign ownership improves firm performance. The result is unchanged when we use the fixed effect model. Furthermore, this result is also upheld when we use 3SLS, suggesting that even controlling for reverse causality, there is a robust positive relationship between high foreign ownership and corporate performance. For example, according to column 3 based on 3SLS estimation, a one standard deviation increase in foreign ownership (9.2%) is associated with a 0.056 increase in Tobin’s Q (log Q), which is equivalent to 37% of the average log Q (0.151). The economic magnitude is substantially large.
To further examine the robustness of these results, we test the following different specifications. Most results are unchanged and not reported here.
The dependent variable is replaced by the change of Qt (Qt - Qt-1) in the median regression and the fixed effect model.
The explanatory variables use a one-year lag instead of current year in the median regression and the fixed effect model.
The system GMM model is applied, adding a one-year lag to dependent variables.
The results are also robust when we divided the sample into two periods: before the banking crisis and after the banking crisis. The coefficients on FIO are all significantly positive. Meanwhile, according to column 7 and 10, which use the 3SLS model, a one standard deviation increase (0.057) is associated with a 0.046 increase in log Q, which is equivalent to 17% of the log Q average (0.264), while that obtained for the after banking crisis period (10.3%) is associated with a 0.030 increase in log Q, which is equivalent to 36% of the log Q average (0.084). These results are consistent with the view that foreign institutional investors became more influential as their ownership increased.
5.3 Disciplinary effect: MSCI vs. Non-MSCI firms
As shown in Section 3, foreign institutional investors had a strong bias, preferring stocks with high market capitalization and high liquidity. In particular, they mainly invested in firms that were incorporated into the MSCI index. Therefore, the result obtained in the previous section could possibly be based mainly on the results of non-MSCI firms, which comprise the majority of the entire sample (80%). To address this issue, we divided the whole

INC
AS
DP S
ER
IES
/ 2016 #03
15
sample into MSCI firms and non-MSCI firms, and ran the same model separately.
The results are summarized in Table 6, panel B. The coefficients of FIO are all significantly positive for both MSCI and non-MSCI firms, suggesting that even when limited to the MSCI firms, high foreign ownership contributes to improved firm performance. The effect of a one standard deviation increase (10%) in FIO on the MSCI firms is associated with a 0.063 increase in Tobin’s Q, which is equivalent to 25% of the average log Q (0.252). On the other hand, the effect on non-MSCI firms is impressively high such that a similar increase in FIO for non-MSCI firms is associated with a 0.104 increase in log Q, which is equivalent to over 80% of the average log Q (0.124). The results suggest that, first, high foreign ownership raised corporate performance even among firms with large market capitalizations. Second, high foreign ownership has a significant disciplinary effect in relatively small firms, once foreign investors obtain large stakes.
In sum, even when we take into account the reverse causality whereby foreign investors prefer firms that perform well, corporate performance is positively sensitive to foreign investor ownership. Thus, we surmise that the growing presence of foreign investors since the 1990s has had an inherent disciplinary effect that contributes to corporate performance.
Table 6. Disciplinary effect of foreign investors, page 31
5.4 Impact of accounting performance and capital expenditures
Lastly, we examine the effect of foreign ownership on accounting performance. With this test, we can identify whether or not the positive impact of foreign shareholding was caused by substantial value enhancement. Furthermore, following Ferreira and Matos (2008), we also examine the effect of foreign shareholdings on the capital expenditures (CAPEX) of firms in which they invested substantially. Ferreira and Matos (2008) report that the shareholding of institutional shareholders contributed to constrain CAPEX, and by doing so, enhanced capital efficiency. We sought to determine whether such a relationship also applies to increased foreign institutional shareholding in Japan.
In the estimation result, instead of Tobin’s Q, the ROA of firms is applied to equation (4) shown in Table 7, panel A. Similar to the Tobin’s Q estimation, we find that the coefficient of foreign shareholding is positive with a 1% significance level for all firm years, and Period I (1990-1997) and Period II (1998-2008), and for both MSCI index firms and non-MSCI index firms.30
Table 7, panel B shows that the coefficient of foreign ownership is significantly positive, suggesting that foreign ownership encourages corporate investment. This result is completely contrary to that of Ferreira and Matos (2008), which reports that foreign ownership is associated with a reduction in CAPEX. This suggests that foreign institutional investors do not improve performance by encouraging corporate restructuring. Rather, foreign institutional investors enhance the performance of firms in which they invest by encouraging investment.31
In sum, although the increased shareholding of foreign institutional investors stems from either an institutional investor bias or home bias, once their share increases beyond a certain threshold, they play a disciplinary role probably through exit or voice.
Table 7. Impact of foreign investor ownership on ROA and CAPEX, page 32
6. Discussion and perspectives
6.1 Reality
This paper examined whether the increase in foreign institutional investors played a disciplinary role that supplanted the main-bank system in Japan. There are competing views with regard to this issue.
The positive view is that foreign institutional investors have high monitoring capability, and encourage
30 When we introduce the aggregate share held by banks and insurance firms instead of foreign ownership, its coefficient is significantly negative which is similar to the Tobin’s Q estimation. This result suggests that bank ownership has not had any disciplinary effect, as shown in previous research by Weinstein and Yafeh (1998), and Morck et al. (2000).
31 Arikawa, Kawanishi and Miyajima (2011) documented that high foreign ownership is associated with high R&D, while Nguyen (2012) reported that foreign investors impacted the risk-taking of Japanese firms by focusing on the volatility of earnings, investment, and R&D.

INC
AS
DP S
ER
IES
/ 2016 #03
16
improved governance arrangements in the firms in which they invest, resulting in high performance. Conversely, the negative view contends that foreign investors have a strong bias in their investment. Even though a correlation between foreign ownership and high performance could be observed, it is a superficial one. Higher stock returns could simply be a result of their demand for the stock as such, while higher performance may simply reflect foreign investor preference for high quality firms.
Having tested the investment behavior of foreign institutional investors, and their effect on stock returns and performance, we can conclude that both the positive and negative views are correct in part. It is true that foreign institutional investors have a strong investment bias, and have a formal preference for certain corporate governance arrangements. Although there is some evidence that foreign institutional investors are smart investors (high screening capability), it is hard to dismiss the view that demand shock contributes to the positive relationship between stock returns and a high level of foreign ownership.
On the other hand, however, once the share held by foreign institutional investors increased, they certainly played a significant disciplinary role. After controlling for various factors that could affect corporate performance and reverse causality, we still found a positive and significant relationship between foreign shareholding and corporate performance (proxied by Tobin’s Q). These results are robust using various specifications.
6.2 Caveat
We can state that foreign shareholders began to play a significant role in corporate governance in Japan, but must attach an important caveat: this observation only applies to large firms. By the early 1980s, the governance arrangement of Japanese firms was homogenous in the sense that all firms were highly leveraged, dominated by insider ownership, and had corporate boards composed of people promoted from within firms. There was no significant difference between blue chip firms and others. As described in Section 2, however, the ownership of Japanese firms has clearly diversfied after the banking crisis. Disparities in firm characteristics such as size, reputation in foreign markets, and performance cause the ownership structure to differentiate by means of the stock preferences of institutional investors and self-selection of firms regarding capital policy and managment reform. As a result, foreign ownership increased significantly in firms with high market capitalization such as firms incorporated into the MSCI Japan index. But other relatively small firms remained attached to traditional corrporate governance arrangements32. Figure 4 clearly shows this point. At the begining of the 1990s, there were no significant differences between the 1st and 5th quintiles of the listed firms grouped in terms of market capitalization. However, in the mid-2000s, the average foreign ownership ratio rose to over 25% among firms in the 5th quintile, while it remained less than 5% among firms in the 1st quintile. Furthermore, the strong variance of foreign ownership even among MSCI firms is further evidence that the monitoring role of foreign investors is limited to firms with the largest market capitalizations.
Figure 4. Trend of foreign investor ownership by company size, page 25
6.3 Puzzle
Foreign ownership has had some disciplinary effect, though the impact has been limited to larger firms. The natural question to ask, then, is why and how have foreign owners played a disciplinary role in spite of their investment bias? In general, a disciplinary role is exercised through voice, which is usually manifested in the following three forms: 1) direct intervention supported by block holding; 2) affect on board of directors; and 3) takeover mechanism.
The first mechanism is not applicable, however, as foreign institutional investors are not holding large blocks or exercising their voting rights. Although the aggregated share held by foreign institutional investors increased, reaching around 30%, each individual institutional investor did not have sufficient stakes in a particular firm and their holdings are mostly fragmented. The average share held by foreign investors when among the top ten shareholders is as low as 4.0% according to FMM (2014) in 2009. Even though a foreign institution such as Fidelity may take a certain stake in a firm, there is no guarantee that the main office and Tokyo office of Fidelity will exercise their voting rights consistently. In fact, there have only been a few cases in which a block holder exerts its voting rights to oppose a firm’s decision.33 In short, the proxy fight scenario is not common in Japan.
32 They were under the monitoring of the main bank, and other corporations, but this arrangement was not necessarily effective. See Jackson and Miyajima (2007).
33 In one of these rare cases, Perry Capital (UK) intervened in a subsidiary of NEC.

INC
AS
DP S
ER
IES
/ 2016 #03
17
The second mechanism assumes that the foreign institutional investor encourages firms to appoint independent directors, who in turn improve corporate performance. It is true that since 2000 onwards, the number of independent directors in Japanese firms has increased, and ownership has clearly shaped board composition by favoring outside directors. However, the appointment of outside directors does not necessary imply enhanced corporate efficiency. Empirical evidence suggests that there is no positive relationship between an independent outside director and corporate performance in general.34 Our tentative result is that the independent director does not have any significant impact on presidential turnover. Thus, it is not realistic to expect that a performance effect will arise out of foreign ownership’s efforts to encourage the appointment of outside directors.
The third mechanism is exercised through the market for corporate control, which is prominent in the U.S. and U.K. Indeed, entering into 2000s, Japan experienced a number of hostile takeovers and corporate activist proposals for the first time in postwar history (Buchanan, Chai and Deakin, 2012). These actions affected the financial policies of not only the firms that were actually targeted but also firms that were potential targets because of large cash holdings. However, there have been very few takeover cases and firms that would be targeted by activist funds such as Steel Partners are not likely to be large firms with high levels of foreign ownership, but have been limited to sizable firms. Furthermore, it is documented that the outcome of activism is rather poor in Japan (Becht et al., 2015).
Thus, all three forms of voice have not served foreign ownership as effective means for enhancing corporate performance in the case of Japan.
A more realistic mechanism that the foreign institutional investors have wielded as monitors is exit. Once foreign ownership increases for whatever reason, the decision to exit tends to be associated with a substantial decline in the stock price. We noted in Section 4 that a change in foreign ownership was associated with a significant change in the price of the stock. A one standard deviation increase (decrease) in shareholding (5%) is associated with a 10% rise (decline) in stock returns. Top management’s greater concern with stock price is reflected in the increase in IR activities and information disclosure since 2000 (Miyajima, 2007). Our survey (Miyajima et al., 2013) shows that 90% of the top management of firms has recently shown concern for shareholder value, which is quite a contrast with survey results obtained in the 1990s.
In Japan, however, the main concern of top management in regard to the exit of foreign investors is neither the threat of a hostile takeover nor the decreasing value of their stock holdings (stock options). Both of these mechanisms do not seem to have a direct impact on management behavior. Granted, a stock price decline may have a substantive effect mainly because it could increase capital costs and make it harder to raise capital, and negatively affect the reputation of top management, which in turn could convince corporate insiders to withhold support. Thus, the exit of a foreign institutional investor might play a significant disciplinary role - albeit not via external mechanisms, but rather via internal mechanisms. This understanding is consistent with other institutional characteristics of Japanese firms, but still needs to be verified. Needless to say, these issues will have to be addressed later in our future research.
34 Rather, foreign ownership can sometimes serve as a substitute for the independent director in terms of the performance effect.

INC
AS
DP S
ER
IES
/ 2016 #03
18
7. ReferencesAggarwal, R., L. Klapper, and P. D. Wysocki, 2005, Portfolio Preferences of Foreign Institutional Investors, Journal of Banking & Finance, Vol. 29, Issue 12, pp. 2919-2946.
Ahmadjian, C., 2007, Foreign Investors and Corporate Governance in Japan, in Aoki, M., G. Jackson and H. Miyajima (eds.) Corporate Governance in Japan: Institutional Change and Organizational Diversity, Oxford: Oxford University Press, pp. 125-150.
Aoki, M., 1988, Information, Incentives, and Bargaining in the Japanese Economy, Cambridge: Cambridge University Press.
Aoki, M., 2010, Corporations in Evolving Diversity: Cognition, Governance, and Institutions, Oxford: Oxford University Press.
Arikawa, Y., T. Kawanishi, and H. Miyajima, 2011, Debt, Ownership Structure, and R&D Investment: Evidence from Japan, RIETI Discussion Paper Series, 11-E-013.
Becht, M., J. Franks, J. Grant, and H. Wagner, 2015, The Returns to Hedge Fund Activism: An International Study, European Corporate Governance Institute (ECGI), Finance Working Paper Series, No. 402/2014.
Brennan, M. J. and H. H. Cao, 1997, International Portfolio Investment Flows, Journal of Finance, Vol. 52, Issue 5, pp. 1851-1880.
Buchanan, J., D. H. Chai, and S. Deakin, 2012, Hedge Fund Activism in Japan: The Limits of Shareholder Primacy, Cambridge: Cambridge University Press.
Del Guercio, D., 1996, The Distorting Effect of the Prudent-man Laws on Institutional Equity Investments, Journal of Financial Economics, Vol. 40, Issue 1, pp. 31-62.
Falkenstein, E. G., 1996, Preferences for Stock Characteristics as Revealed by Mutual Fund Portfolio Holdings, Journal of Finance, Vol. 51, Issue 1, pp. 111-135.
Fama, E. F. and J. D. MacBeth, 1973, Risk, Return, and Equilibrium: Empirical Tests, Journal of Political Economy, Vol. 81, No. 3, pp. 607-636.
Ferreira, M. A. and P. Matos, 2008, The Colors of Investors’ Money: The Role of Institutional Investors around the World, Journal of Financial Economics, Vol. 88, Issue 3, pp. 499-533.
Flath, D., 1993, Shareholding in the Keiretsu: Japan’s Financial Groups, Review of Economics and Statistics, Vol. 75, No. 2, pp. 249-257.
Franks, J., C. Mayer, and H. Miyajima, 2014, The Ownership of Japanese Corporations in the 20th Century, Review of Financial Studies, Vol. 27, No.9, pp. 2580-2625.
French, K. R. and J. M. Poterba, 1991, Investor Diversification and International Equity Markets, American Economic Review, Vol. 81, No. 2, pp. 222-226.
Giannetti, M. and A. Simonov, 2006, Which Investors Fear Expropriation?: Evidence from Investors’ Portfolio Choices, Journal of Finance, Vol. 61, Issue 3, pp. 1507-1547.
Gompers, P. A. and A. Metrick, 2001, Institutional Investors and Equity Prices, Quarterly Journal of Economics, Vol. 116, Issue 1, pp. 229-259.
Goyer, M., 2011, Contingent Capital: Short-Term Investors and the Evolution of Corporate Governance in France and Germany, Oxford: Oxford University Press.
Hansmann, H. and R. Kraakman, 2000, The Essential Role of Organizational Law, Yale Law Journal, Vol. 110, Issue 3, pp. 394-395.
Hiraki, T., A. Ito, and F. Kuroki, 2003, Investor Familiarity and Home Bias: Japanese Evidence, Asia-Pacific Financial Markets, Vol. 10, Issue 4, pp. 281-300.

INC
AS
DP S
ER
IES
/ 2016 #03
19
Horiuchi, A. and M. Hanazaki, 2000, Mein-Banku-Kankei wa Kigyō-Keiei no Kōritsuka ni Kōken shitaka: Seizōgyō ni kansuru Jisshō-Kenkyū [Did Main Bank System Really Contribute to Enhance Corporate Performance?: An Empirical Research on Manufacturing Industries], Research Institute of Capital Formation of DBJ, Keizai-Keiei-Kenkyū, Vol. 21, Issue 1, pp. 1-89 (in Japanese).
Huberman, G., 2001, Familiarity Breeds Investment, Review of Financial Studies, Vol. 14, No. 3, pp. 659-680.
Jackson, G. and H. Miyajima, 2007, Introduction: The Diversity and Change of Corporate Governance in Japan, in Aoki, M., G. Jackson and H. Miyajima (eds.) Corporate Governance in Japan: Institutional Change and Organizational Diversity, Oxford: Oxford University Press, pp. 1-47.
Kang, J. K. and R. M. Stulz, 1997, Why is There a Home Bias? An Analysis of Foreign Portfolio Equity Ownership in Japan, Journal of Financial Economics, Vol. 46, Issue 1, pp. 3-28.
Kawakita, H., 1995, Nihongata Kabushiki Shijō no Kōzō Henka: Kinyū Shisutemu no Saihensei to Gabanansu [The Structural Change of Capital Market in Japan: Reorganization of Financial System and Shareholder], Tokyo: Tōyō-Keizai-Shinpō-sha (in Japanese).
Leuz, C., K. V. Lins, and F. E. Warnock, 2009, Do Foreigners Invest Less in Poorly Governed Firms?, Review of Financial Studies, Vol. 22, No. 8, pp. 3245-3285.
Lichtenberg, F. R. and G. M. Pushner, 1994, Ownership Structure and Corporate Performance in Japan, Japan and the World Economy, Vol. 6, Issue 3, pp. 239-261.
Merton, R. C., 1987, A Simple Model of Capital Market Equilibrium with Incomplete Information, Journal of Finance, Vol. 42, No. 3, pp. 483-510.
Miyajima, H., 2007, The Performance Effects and Determinants of Corporate Governance Reform in Aoki, M., G. Jackson and H. Miyajima (eds.) Corporate Governance in Japan: Institutional Change and Organizational Diversity, Oxford: Oxford University Press, pp. 330-369.
Miyajima, H., K. Haramura, and Y. Enami, 2003, Sengo-Nihon-Kigyō no Kabushiki-Shoyū-Kōzō Antei-Kabunushi no Keisei to Kaishō [Composition of Shareholders in Postwar Japanese Companies: Creation and Dissolution of Stable Shareholders], Ministry of Finance Japan Policy Research Institute, Financial Review, No. 68, pp. 203-236 (in Japanese).
Miyajima, H. and F. Kuroki, 2007, The Unwinding of Cross-Shareholding in Japan: Causes, Effects, and Implications, in Aoki, M., G. Jackson and H. Miyajima (eds.) Corporate Governance in Japan: Institutional Change and Organizational Diversity, Oxford: Oxford University Press, pp. 79-124.
Miyajima, H. and K. Nitta, 2003, Seisansei to Gaibu karano Kiritsu: Fushin-Sangyō ni-okeru Gabanansu no Mondai wa nanika [Profitability and External Discipline: What is the crucial Problems in Declining Industries?], Security Analysts Journal, Vol. 41 No. 12, pp. 29-47 (in Japanese).
Miyajima, H. and K. Nitta, 2011, Kabushiki-Shoyū-Kōzō no Tayōka to sono Kiketsu [The Diversification of Ownership Structure and its Consequence], In Miyajima, H. (eds.) Nihon no Kigyō-Tōchi: Sono Saisekkei to Kyōsōryoku no Kaifuku ni mukete [Corporate Governance in Japan: Toward a Redesign and Restoration of Competitiveness], Tokyo: Tōyō-Keizai-Shinpō-sha, pp. 105-149 (in Japanese).
Miyajima, H. and R. Ogawa, 2012, Nihon-Kigyō no Torishimariyakukai-Kōsei no Henka wo ikani Rikai suruka: Torishimariyakukai-Kōsei no Kettei-yōin to Shagai-Torishimariyaku no Dōnyū-Kōka [Understanding Change in Board Composition: Determinants of Board Composition and Effects of Outside Directors], Junkan Shōji-Hōmu, No. 1973, pp. 81-95 (in Japanese).
Miyajima, H., T. Saito, P. Xu, W. Tanaka, and R. Ogawa, 2013, Nihongata Kōporēto-Gabanansu wa doko e mukau noka [Where is Corporate Governance in Japan Heading? Evidence from a Survey of Japanese Listed Companies], Junkan Shōji-Hōmu, No. 2008, pp. 4-14, No. 2009, pp. 12-21 (in Japanese).
Morck, R., M. Nakamura, and A. Shivdasani, 2000, Banks, Ownership Structure, and Firm Value in Japan Banks, Ownership Structure, and Firm Value in Japan, Journal of Business, Vol. 73, No. 4, pp. 539-567.
Nguyen, P., 2012, The Impact of Foreign Investors on the Risk-taking of Japanese Firms, Journal of Japanese and International Economies, Vol. 26, Issue 2, pp. 233-248.

INC
AS
DP S
ER
IES
/ 2016 #03
20
Saito, T., 2011, Nihon-Kigyō ni yoru Shagai-Torishimariyaku no Dōnyū no Kettei-Yōin to sono Kōka [The Determinants and Effects of Introduction of Outside Directors in Japanese Firms], In Miyajima, H. (eds.) Nihon no Kigyō-Tōchi: Sono Saisekkei to Kyōsōryoku no Kaifuku ni mukete [Corporate Governance in Japan: Toward a Redesign and Restoration of Competitiveness], Tokyo: Tōyō-Keizai-Shinpō-sha, pp. 181-213 (in Japanese).
Sasaki, T. and Y. Yonezawa, 2000, Kōporēto-Gabanansu to Kabunushi-Kachi [Corporate Governance and Shareholder Value], Security Analysts Journal, Vol. 38, No. 9, pp. 28-46 (in Japanese).
Stulz, R. M., 1981, On the Effects of Barriers to International Investment, Journal of Finance, Vol. 36, Issue 4, pp. 923-934.
Weinstein, D. E. and Y. Yafeh, 1998, On the Costs of a Bank-Centered Financial System: Evidence from the Changing Main Bank Relations in Japan, Journal of Finance, Vol. 53, No. 2, pp. 635-672.

INC
AS
DP S
ER
IES
/ 2016 #03
21
8. Appendix. Variable definitionsOwnership Variables Insider
Cross-shareholding by financial institutions
by business firms
Other stable shareholding
ESOP
Directors Family-controlled firms
Outsider Institutional investors Foreign (FIO) Domestic
Small individuals
Foreign corporatesOther VariablesStock return RET Annual stock return (includes dividends)Tobin's Q Q Sum of total assets plus maket value of equity minus book value of equity
divided by total assetsFirm size SIZE Log of market capitatlization in millions of JPYBook to market BM Book value of equity divided by market value of quityTurnover TURN Share volume divided by adjusted shares outstandingInvestment opportunities INVOP Two-year average of annual growth rate of total sales Dividend yield DY Dividends per share divided by stock priceReturn on assets ROA Operating profit divided by total assetsStock return volatility VOL Standard deviation of sock retun for prior three yearsLeverage LEV Ratio of debt to total assetsCash holdings CASH Ratio of cash equivalent to total assetsMomentum MOM Average stock return for prior three yearsOversea sales ratio OS Ratio of oversea sales to total salesMSCI dummy MSCI MSCI dummy, which takes one if a firm is member of the MSCI Japan Index
and zero otherwiseCross-listing dummy ADR ADR dummy, which equals one if a firm is cross-listed on a U.S. stock
exchange and zero otherwiseNumber of directors DIR Number of total directorsIndependent directors ratio INDIR Number of independent directors divided by total number of directorsBusiness group dummy BG Business group dummy, which takes one if a firm is member of the largest
six business group (Sumitomo, Mitsui, Mitsubishi, Fuyo, Sanwa and DKB)
Subsidiary dummy SUB Subsidiary dummy, which equals one if a firm is held by parents (parenthas over 30% of share outstandings) and zero otherwise
Total ratio of shreholdings by employee stock ownership plans, including those bybusiness partners
Cross-shareholdings + other stable shareholders (excluding cross-shareholding) +holding companies + family and family-controlled firmsRatio of shares held as cross-shareholdingCross-shareholdings of banks (excluding trust account), life insurance (excludingspecial account), non-life insurance, and domestic securities firmsCross-shareholdings of listed firms excluding banks, life insurance companies, non-lifeinsurers, domestic securities firmsTotal ratio of shreholdings by banks (trust account), life insurers (special account),non-life insurers, domestic securities firms, and other buisness firms, excluding cross-shareholdings (includes unlisted affiliates of listed holding companies)
Total ratio of shareholdings of individuals excluding directors and large individualinvestors with 3% or more ownership ratioTotal ownership ratio of foreign corporates with more than 3% ownership
Ownership ratio of directors and auditors, including director stock ownership plansTotal ownership ratio of foreign-national asset managers, individuals, family-controlleddomestic unlisted corporationsInstitutional investers + small individuals + foreign firmsForeign institutional investors + domestic institutional investorsForeign ownership ratio excluding foreign firms, foreign large individual shareholdersTotal ownership ratio of pension trusts, investment trusts, and life insurance specialaccounts

INC
AS
DP S
ER
IES
/ 2016 #03
22
Figure 1. Long-term time series trend of ownership structure in Japan
The figure shows insider and outsider ownership ratios based on the Shareownership Survey reported by the Tokyo Stock Exchange. The insider ratio is the aggregated ratio of banks (excluding trust accounts of trust banks), insurance companies, other financial institutions, and corporations. The outsider ratio is the aggregated ratio of foreign investors, individuals, mutual funds, and pension trusts. The ownership ratio is aggregated on a market capitalization basis since 1969, but on a number of shares basis prior to that due to data availability. See section 2.1 of this paper for details.

INC
AS
DP S
ER
IES
/ 2016 #03
23
Figure 2. Transactions by foreign investors and the Nikkei 225 index
Left axis: Nikkei 225 index (JPY)
Right axis: Net foreign buying - TSE 1st Section (JPY billion)
Source: Tokyo Stock Exchange, Investment Trends by Investor Category.
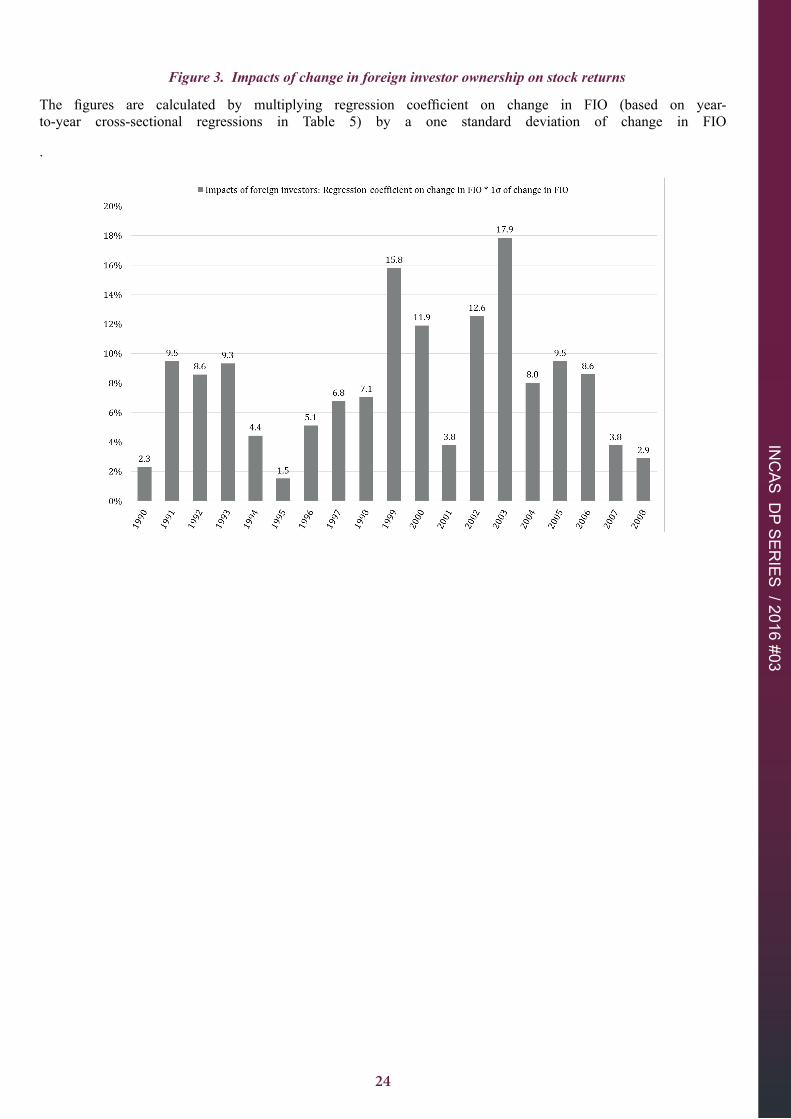
INC
AS
DP S
ER
IES
/ 2016 #03
24
Figure 3. Impacts of change in foreign investor ownership on stock returns
The figures are calculated by multiplying regression coefficient on change in FIO (based on year-to-year cross-sectional regressions in Table 5) by a one standard deviation of change in FIO
.

INC
AS
DP S
ER
IES
/ 2016 #03
25
Figure 4. Trend of foreign investor ownership by company sizeThe figure shows time series mean of foreign investor ownership ratio by company size brackets.
The sample consists of all non-financial firms listed on the First Section of the Tokyo Stock Exchange. Company size brackets (quintile) is based on market capitalization of each year (5th quintile the largest).

INC
AS
DP S
ER
IES
/ 2016 #03
26
Table 1. Recent trends in ownership structure
The table shows mean and standard deviation of ownership ratio (%) by investor category in reference years. The sample consists of non-financial firms listed on the First Section of the three major stock exchanges in Japan. Mean ownership ratio is calculated at firm level at the end of each fiscal year. See Appendix for definitions of variables. Treasury stocks are subtracted from denominator in calculating ownership ratio. * indicates that only those with more than 3% of ownership ratio are counted.
Mean Std. dev. Mean Std. dev. Mean Std. dev. Mean Std. dev. Mean Std. dev. Insider 46.6 13.5 44.9 13.2 41.8 15.0 37.4 16.2 38.3 16.4 Cross-shareholding 15.4 9.2 15.3 9.1 11.9 9.7 9.2 9.2 9.0 9.3 by financial institutions 10.8 6.3 10.7 6.2 7.2 5.9 4.6 4.9 4.1 4.7 by corporates 4.6 6.2 4.6 6.2 4.7 6.8 4.6 6.4 4.9 6.8 Other stable shareholding 22.5 16.7 22.0 16.6 18.5 17.7 14.9 17.7 15.5 18.0 ESOP 1.1 1.4 1.5 1.6 2.3 2.5 2.0 2.3 2.3 2.6 Directors 2.8 5.0 2.1 4.7 3.6 7.8 4.8 9.2 4.7 9.1 Family-controlled firms * 4.6 9.3 3.9 7.9 5.3 9.7 6.3 10.9 6.7 11.3 Outsider 31.0 10.5 35.8 10.8 43.3 13.0 48.5 14.1 47.8 14.8 Institutional investors 9.2 7.4 12.0 8.8 13.4 11.9 21.8 14.5 19.0 13.9 Foreign (FIO) 4.1 4.4 7.1 6.8 6.6 7.9 14.2 11.6 11.7 10.7 Domestic 5.1 4.1 4.9 3.3 6.8 5.6 7.6 5.6 7.3 5.8 Small individuals 21.2 8.9 23.1 10.6 29.0 14.0 26.0 13.8 28.2 14.7 Foreign corporates * 0.6 5.1 0.7 5.4 0.9 6.4 0.7 5.7 0.6 5.1
N=1223 N=1198 N=1404 N=1616 N=15991991 1996 2001 2006 2008

INC
AS
DP S
ER
IES
/ 2016 #03
27
Table 2. Distribution of foreign investor ownership
The table shows the descriptive statistics and distribution of the foreign investor ownership ratio. The sample consists of non-financial firms listed on the First Sections of the three major stock exchanges in Japan. For definition of foreign investor, see Appendix. The notation a-b% in the first row means at least a% but less than b%.
Mean Std. dev. 0-1% 1-3% 3-5% 5-10% 10-20% 20-33% 33-50% 50% <1990 1202 3.32 3.54 28.6% 34.0% 16.5% 14.7% 6.1% 0.1% 0.0% 0.0%1991 1238 4.11 4.40 27.7% 27.6% 14.5% 20.4% 8.8% 1.1% 0.0% 0.0%1992 1243 4.12 4.66 29.7% 26.6% 14.7% 18.5% 8.9% 1.5% 0.0% 0.0%1993 1158 5.30 5.44 21.4% 23.0% 16.2% 23.7% 12.8% 2.8% 0.1% 0.0%1994 1158 5.87 5.41 16.9% 23.0% 14.1% 27.3% 16.1% 2.7% 0.0% 0.0%1995 1181 6.84 6.44 17.1% 20.2% 11.5% 25.3% 21.6% 3.7% 0.5% 0.0%1996 1215 7.14 6.82 16.5% 21.4% 11.6% 24.1% 21.4% 4.3% 0.7% 0.0%1997 1255 6.64 7.07 20.2% 23.4% 11.2% 21.0% 18.5% 4.8% 0.8% 0.0%1998 1268 6.10 6.99 26.3% 20.6% 12.1% 18.8% 16.5% 4.9% 0.9% 0.0%1999 1332 7.09 8.07 23.8% 23.1% 8.9% 17.4% 18.2% 7.2% 1.4% 0.0%2000 1408 7.09 8.00 16.9% 30.1% 9.3% 17.0% 19.0% 6.2% 1.5% 0.0%2001 1432 6.67 8.01 26.0% 23.0% 9.9% 16.2% 17.0% 6.2% 1.6% 0.0%2002 1455 6.46 8.09 28.7% 21.1% 10.6% 15.8% 15.7% 6.9% 1.2% 0.0%2003 1482 9.25 9.63 14.9% 21.8% 9.6% 18.8% 21.0% 10.2% 3.4% 0.2%2004 1573 11.24 10.43 7.6% 16.7% 11.9% 21.3% 24.3% 13.5% 4.1% 0.6%2005 1614 13.74 11.14 4.0% 12.6% 8.7% 21.4% 27.9% 18.6% 5.8% 0.9%2006 1651 14.33 11.69 5.0% 11.3% 9.3% 18.5% 27.5% 20.5% 6.9% 0.8%2007 1643 14.06 11.99 6.1% 12.5% 9.3% 18.4% 27.3% 18.8% 6.3% 1.2%2008 1625 11.75 10.68 9.1% 17.4% 10.3% 20.7% 25.4% 15.4% 4.1% 0.7%
Year No offirms
Descriptive statistatistics Distribution of ownership ratio (firms)

INC
AS
DP S
ER
IES
/ 2016 #03
28
Table 3. Descriptive statistics
The table reports mean, median, and standard deviation of variables for the regression sample. All variables are as defined in Appendix.
Mean Median Std. dev. Mean Median Std. dev. Mean Median Std. dev.
RET 0.005 -0.077 0.459 -0.084 -0.124 0.297 0.058 -0.040 0.526
Q 1.234 1.112 0.757 1.325 1.234 0.417 1.179 1.029 0.897
SIZE (JPY mil.) 227,160 51,451 824,145 218,923 70,408 631,889 232,089 39,753 920,155
BM 0.916 0.744 0.750 0.611 0.555 0.353 1.098 0.948 0.858
TURN 0.644 0.406 0.825 0.493 0.370 0.418 0.735 0.438 0.982
INVOP 0.029 0.020 0.104 0.033 0.028 0.086 0.026 0.014 0.113
DY 0.036 0.005 0.245 0.023 0.005 0.083 0.044 0.005 0.303
ROA 4.222 3.633 4.633 3.556 3.256 3.523 4.620 3.928 5.144
VOL 0.112 0.105 0.046 0.111 0.107 0.035 0.112 0.103 0.052
LEV 0.263 0.241 0.194 0.304 0.288 0.186 0.239 0.210 0.194
CASH 0.149 0.124 0.104 0.168 0.142 0.104 0.137 0.113 0.103
MOM 0.006 0.004 0.019 0.004 0.002 0.015 0.008 0.006 0.021
OS 0.156 0.049 0.211 0.131 0.043 0.189 0.171 0.057 0.222
MSCI 0.214 0.000 0.410 0.218 0.000 0.413 0.212 0.000 0.409
ADR 0.015 0.000 0.121 0.014 0.000 0.118 0.015 0.000 0.123
DIR 14.197 13.000 7.389 18.143 16.000 7.862 11.829 10.000 5.942
INDIR 0.133 0.080 0.169 0.109 0.067 0.137 0.147 0.091 0.185
BG 0.292 0.000 0.455 0.321 0.000 0.467 0.275 0.000 0.446
SUB 0.071 0.000 0.257 0.039 0.000 0.193 0.090 0.000 0.287
FIO 0.083 0.050 0.092 0.054 0.033 0.057 0.101 0.066 0.103
CFIO 0.003 0.001 0.041 0.003 0.001 0.029 0.004 0.001 0.046
Variables1990-2008 1990-1997 1998-2008

INC
AS
DP S
ER
IES
/ 2016 #03
29
Table 4. Determinants of foreign investor ownership
The table summarizes the results from 19 yearly (cross-sectional) regressions for the sample period. The dependent variable is the foreign institutional ownership ratio. The definitions of the independent variables, SIZE (Firm size), BM (Book to market), TURN (Stock turnover), INVOP (Investment opportunities), DY (Dividend yield), ROA (Return on assets), VOL (Stock return volatility), LEV (Leverage), CASH (Cash holdings), MOM (Momentum), OS (Oversea sales ratio), MSCI (MSCI dummy), ADR (Cross-listing dummy), DIR (Number of directors), INDIR (Independent directors ratio), BG (Business group dummy), SUB (Subsidiary dummy), can be found in the Appendix. The table reports time series average of coefficients, the number of positive coefficients, number of negative coefficients, and the number of significantly positive/negative coefficients (at the 5% level) in brackets. Significance of the yearly coefficients is computed using White-corrected standard errors (1980). Each cross-sectional regression includes industry dummy.
Averagecoefficient
Number ofpositive coef.
Number ofnegative coef.
Averagecoefficient
Number ofpositive coef.
Number ofnegative coef.
Averagecoefficient
Number ofpositive coef.
Number ofnegative coef.
19 0 8 0 11 0[19] [0] [8] [0] [11] [0]13 6 6 2 7 4
[10] [0] [4] [0] [6] [0]19 0 8 0 11 0
[14] [0] [8] [0] [6] [0]7 12 5 3 2 9
[0] [1] [0] [0] [0] [1]0 19 0 8 0 11
[0] [11] [0] [5] [0] [6]19 0 8 0 11 0
[13] [0] [6] [0] [7] [0]5 14 0 8 5 6
[0] [6] [0] [6] [0] [0]0 19 0 8 0 11
[0] [19] [0] [8] [0] [11]19 0 8 0 11 0
[14] [0] [3] [0] [11] [0]12 7 7 1 5 6[5] [2] [5] [0] [0] [2]19 0 8 0 11 0
[16] [0] [6] [0] [10] [0]18 1 8 0 10 1
[17] [0] [8] [0] [9] [0]11 8 8 0 3 8[1] [4] [1] [0] [0] [4]0 19 0 8 0 11
[0] [12] [0] [8] [0] [4]13 6 4 4 9 2[0] [0] [0] [0] [0] [0]6 13 4 4 2 9
[2] [2] [2] [0] [0] [2]11 8 7 1 4 7[6] [1] [3] [0] [3] [1]
Mean ofdependentvariableStd. dev. ofdependentvariable
0.026
0.049
0.036
-0.006
-0.003
-0.035
0.002
0.000
0.011
0.003
-0.041
0.021
MOM
DY
0.0832
0.0917 0.0572
0.0541 0.1005
0.1033
LEV
CASH
BG
DIR
INDIR
SUB
0.130
0.010
-0.002
1990-1997
0.030
0.029
1990-2008
0.041
0.033
0.005
0.012
0.015
-0.084
0.094
1998-2008
0.019
0.021
0.032
-0.067
0.040
0.080
-0.023
-0.056
0.044
0.003
-0.033
0.004
0.004
0.015
-0.016
-0.007
-0.105
0.027
0.060
-0.003
-0.023
0.010
-0.048
0.002
-0.017
0.035
0.071
ROA
VOL
TURN
MSCI
OS
ADR
SIZE
BM
INVOP

INC
AS
DP S
ER
IES
/ 2016 #03
30
Table 5. Impacts of foreign investor ownership on stock return
This table summarizes the results of cross-sectional regressions of yearly stock returns on foreign institutional ownership and other firm characteristics. The table gives average coefficients, with t-statistics for these averages based on their time-series standard deviations. The definitions of the independent variables, except FLOAT, SIZE (Firm size), BM (Book to market), TURN (Stock turnover), INVOP (Investment opportunities), DY ( Dividend yield), ROA (Return on assets), VOL (Stock return volatility), LEV (Leverage), CASH (Cash holdings), MOM (Momentum), OS (Oversea sales ratio), MSCI (MSCI dummy), ADR ( Cross-listing dummy), DIR (Number of directors), INDIR (Independent directors ratio), BG (Business group dummy), SUB (Subsidiary dummy), FIO (Foreign investors ownership), CFIO (change in FIO) can be found in the Appendix. FLOAT is ratio of floating stocks, which is calculated as number of floating shares divided by total outstanding shares. Significance of the yearly coefficients is computed using White-corrected standard errors (1980). Each cross-sectional regression includes industry dummy.
Averagecoefficient
Time series oft-statistics
Averagecoefficient
Time series oft-statistics
Averagecoefficient
Time series oft-statistics
SIZE 0.057 5.172 0.055 2.610 0.060 5.000
BM -0.286 -5.878 -0.364 -4.016 -0.225 -5.967
INVOP 0.302 9.107 0.379 7.563 0.233 6.531
TURN -0.038 -4.477 -0.040 -2.342 -0.035 -4.774
DY -0.106 -3.560 -0.137 -2.595 -0.077 -2.222
ROA 0.007 5.188 0.004 2.423 0.008 5.081
VOL 0.090 2.235 0.139 1.751 0.056 2.009
LEV -0.157 -3.056 -0.141 -1.302 -0.175 -6.699
CASH -0.102 -2.370 -0.109 -1.273 -0.110 -3.084
OS -0.013 -0.601 -0.038 -1.200 -0.002 -0.060
MSCI -0.092 -5.567 -0.116 -3.928 -0.075 -4.686
ADR -0.037 -2.357 -0.036 -1.567 -0.052 -2.682
MOM -5.150 -5.859 -4.957 -2.956 -6.619 -6.877
DIR -0.052 -4.080 -0.059 -2.704 -0.041 -2.608
INDIR -0.062 -2.545 -0.091 -2.432 -0.040 -1.129
BG 0.011 1.747 0.020 1.608 0.005 0.763
SUB -0.039 -2.302 -0.040 -1.290 -0.036 -1.869
Last Period's of FIO(FIO t-1) -0.151 -1.371 -0.080 -0.392 -0.258 -2.238
Change in FIO(ΔFIOt) 2.165 8.432 2.294 5.535 2.111 5.793
Last Period's of FLOAT(FLOAT t-1) 0.055 1.601 0.102 1.497 0.020 0.914
Mean of dependentvariableStd. dev. of dependentvariable
Full Period (1990-2008) High Inflow Period Low Inflow Period
0.005
0.459
-0.084
0.297
0.058
0.526

INC
AS
DP S
ER
IES
/ 2016 #03
31
Table 6. Disciplinary effect of foreign investors
This table reports estimates of coefficients of the annual time-series cross-sectional firm-level regression of Tobin’s Q (Sum of total assets plus market value of equity minus book value of equity divided by total assets) for Japanese firms. Panel A reports the results by period (all sample period, first half before financial crisis, and second half after financial crisis) and Panel B by group of MSCI index companies. For each period and group sample, we estimate in median regression, fixed effect panel regression and three stage least square. Firm-level control variables include SIZE (logged total assets), INVOP (two-year average of annual growth rate in total sales), LEV (ratio of debt to total assets), and IND_Q (industry median Tobin’s Q). All regressions include year dummies. t-statistics are in parentheses.
Panel A
Median Fixed 3SLS Median Fixed 3SLS Median Fixed 3SLS(1) (2) (3) (4) (5) (6) (7) (8) (9)
0.84 1.46 0.61 0.82 1.97 0.80 0.77 0.71 0.29(22.97) (6.87) (10.92) (10.21) (6.09) (7.16) (18.76) (5.60) (4.65)
-0.02 -0.21 0.04 -0.04 -0.20 0.00 0.00 -0.27 0.06(-10.21) (-12.24) (15.28) (-13.32) (-2.11) (1.37) (-1.27) (-5.44) (20.40)
0.38 0.52 0.36 0.42 0.56 0.32 0.38 0.53 0.38(16.58) (12.43) (21.32) (10.93) (7.89) (10.89) (11.88) (12.30) (18.49)
0.18 -0.01 0.15 0.05 0.14 -0.03 0.27 -0.11 0.30(19.59) (-0.06) (16.02) (3.34) (1.32) (-2.06) (22.73) (-0.82) (23.05)
0.80 0.90 0.75 0.82 0.73 0.90 0.72 0.97 0.64(36.93) (7.57) (43.05) (25.92) (9.95) (30.47) (28.06) (5.38) (30.04)
Adj. R-square 0.24 0.64 0.43 0.21 0.73 0.35 0.18 0.67 0.425Observations 19,664 19,664 19,605 7,523 7,523 7516 12,141 12,141 12,089
Panel B
Median Fixed 3SLS Median Fixed 3SLS(10) (11) (12) (13) (14) (15)0.60 1.42 0.62 0.46 1.18 1.04
(10.11) (5.25) (7.73) (10.02) (7.34) (11.23)-0.01 -0.17 0.05 -0.02 -0.23 0.03
(-6.91) (-3.31) (12.84) (-10.64) (-14.70) (11.81)0.62 0.58 0.45 0.36 0.48 0.31
(8.70) (5.02) (11.69) (12.37) (11.31) (16.06)-0.05 -0.42 -0.10 0.23 0.14 0.25
(-1.85) (-3.32) (-4.43) (22.01) (1.63) (22.70)0.83 1.08 0.74 0.34 0.81 0.71
(18.02) (4.27) (21.24) (11.54) (11.82) (35.35)Adj. R-square 0.18 0.66 0.398 0.27 0.67 0.42Observations 4,410 4,410 4,395 15,254 15,254 15,210
FIO
SIZE
INVOP
LEV
All firms1990-1997
All firms All firms
FIO
1998-2008
SIZE
INVOP
IND_Q
LEV
1990-2008
IND_Q
1990-2008 1990-2008MSCI firms Non-MSCI firms

INC
AS
DP S
ER
IES
/ 2016 #03
32
Table 7. Impact of foreign investor ownership on ROA and CAPEX
This table summarizes the results of regressions of ROA and capital expenditures (CAPEX) on foreign institutional ownership and other firm characteristics. Panel A reports the results for ROA and Panel B reports the results for CAPEX. For each period and group sample, we use median regression. Firm-level control variables include SIZE (logged total assets), INVOP (two-year average of annual growth rate in total sales), LEV (ratio of debt to total assets), IND_ROA (industry median ROA), and IND_CAPEX (industry median CAPEX). All regressions include year dummies. t-statistics are in parentheses.
Panel A: ROA1990-2008 1990-1997 1998-2008 1990-2008 1990-2008
All firms All firms All firms MSCI firms Non-MSCI firms(1) (2) (3) (4) (5)
9.68 10.44 9.46 7.15 10.60(23.14) (14.21) (17.14) (9.71) (16.53)
-0.10 -0.11 -0.09 -0.26 -0.02(-5.02) (-4.34) (-2.90) (-6.13) (-0.84)
9.27 9.34 9.18 9.28 9.01(20.22) (14.97) (15.32) (9.28) (18.62)
-2.66 -2.91 -2.49 -2.97 -2.54(-20.49) (-14.92) (-14.15) (-10.20) (-17.63)
0.67 0.68 0.66 0.81 0.62(34.48) (20.99) (28.16) (22.00) (27.70)
Adj. R-square 0.20 0.20 0.20 0.28 0.17Observations 19,678 7,525 12,153 4,417 15,261
Panel B: CAPEX1990-2008 1990-1997 1998-2008 1990-2008 1990-2008
All firms All firms All firms MSCI firms Non-MSCI firms(1) (2) (3) (4) (5)
2.81 1.86 2.68 2.57 1.42(10.74) (3.67) (8.31) (5.15) (3.89)
0.08 0.01 0.15 -0.08 0.12(6.02) (0.79) (7.64) (-2.51) (6.80)2.84 2.64 3.04 2.85 2.87
(12.88) (7.73) (10.97) (5.29) (11.38)-0.64 -0.77 -0.53 -0.30 -0.76
(-7.48) (-5.99) (-4.48) (-1.60) (-7.88)0.96 0.99 0.94 0.94 0.97
(89.88) (62.26) (64.50) (40.24) (80.28)Adj. R-square 0.20 0.21 0.19 0.23 0.18Observations 19,038 7,186 11,852 4,319 14,719
LEV
IND_CAPEX
FIO
SIZE
INVOP
FIO
SIZE
INVOP
LEV
IND_ROA