Improving the Efficiency of Pelton Wheel and Cross-Flow ... · It reviews the commonly used Pelton...
15
Abstract—The research investigates hydro power plant efficiency with a view to improving the power output while keeping the overall project cost per kilowatt produced within an acceptable range. It reviews the commonly used Pelton and Cross-flow turbines which are employed in the region for micro-hydro power plants. Turbine parameters such as surface texture, material used and fabrication processes are dealt with the intention of increasing the efficiency by 20 to 25 percent for the micro hydro-power plants. Keywords—Hydro, power plant, efficiency, manufacture. I. INTRODUCTION ICRO-HYDRO power plants are an attractive option for providing electricity in off grid areas of the country. The Pelton and Cross-flow turbines are predominantly used for these projects as they are cheaper to construct for this form of renewable energy. Current level of efficiency is estimated to be 60%, thus allowing for improvements on the overall efficiency of whole micro-hydro system. At 60% turbine efficiency micro-hydro schemes seem to be underutilising resources. Communities are benefitting by having their business centres, clinics and schools powered. However more electrical power can be attained without increasing the resources but by only increasing the turbine efficiencies [4]. This can ensure that more households in the catchment area get more than just lighting, but are able to use other devices such as refrigerators, stoves etc in their houses. L K Gudukeya is with the Mechanical Engineering Department, University of Zimbabwe, Box MP 167, Mt Pleasant, Harare (phone: 00263 773 286 349; email: [email protected]). C Mbohwa is with the Quality and Operations Management Department, University of Johannesburg, Auckland Park Kingsway, South Africa (phone: 0027 78 207 1516; email: [email protected]). II. RESEARCH OBJECTIVE To investigate options for increasing the turbine efficiencies of Pelton wheel and Cross-flow turbines targeting the improvement of the overall micro hydro system efficiency while keeping the project financially feasible. III. OVERVIEW OF MICRO-HYDRO POWER PLANT Hydro power is the harnessing of energy from falling water, such as water falling through steep mountain rivers. The energy in flowing water is converted into useful mechanical power by means of a water wheel or a turbine [3]. The mechanical power from the turbine can be converted into electricity using an alternator or a generator. Hydro power systems that are classified as “micro” have the power generation capacity of less than 100kW. They are relatively small power sources that may be used to supply power to a small group of users or communities, who are independent of the general electricity supply grid [5]. A micro-hydropower system (MHS) has the following components [6]: • A water turbine that converts the energy of flowing or falling water into mechanical energy. This drives an alternator, which then generates electrical power • A control mechanism in the form of electronic load controller to provide stable electrical power. • Electrical distribution lines To develop an MHS the following features are needed as given in Figures 1 and 2 [7]: • an intake or weir to divert stream flow from the water course; • a headrace, the canal or pipeline to carry the water to the forebay from the intake; • a forebay tank and trash rack (gravel trap) to filter debris and prevent it from being drawn into the turbine at the penstock pipe intake; • a penstock (pipe) to transport the water to the powerhouse. This may be set up above the ground surface or underground depending on the topography of the site. At rocky sites, penstocks are supported above ground on concrete blocks called Anchors or Saddle (Pier) supports. The saddle supports are provided along the straight length at regular intervals and anchors are provided at horizontal and vertical bends along the alignment of the penstock. These are designed to carry the thickness and the diameter of the penstock Loice K Gudukeya, Charles Mbohwa Improving the Efficiency of Pelton Wheel and Cross-Flow Micro Hydro Power Plants M World Academy of Science, Engineering and Technology 83 2013 1047
Transcript of Improving the Efficiency of Pelton Wheel and Cross-Flow ... · It reviews the commonly used Pelton...
Abstract—The research investigates hydro power plant
efficiency with a view to improving the power output while keeping the overall project cost per kilowatt produced within an acceptable range. It reviews the commonly used Pelton and Cross-flow turbines which are employed in the region for micro-hydro power plants. Turbine parameters such as surface texture, material used and fabrication processes are dealt with the intention of increasing the efficiency by 20 to 25 percent for the micro hydro-power plants.
Keywords—Hydro, power plant, efficiency, manufacture.
I. INTRODUCTION ICRO-HYDRO power plants are an attractive option for providing electricity in off grid areas of the country.
The Pelton and Cross-flow turbines are predominantly used for these projects as they are cheaper to construct for this form of renewable energy. Current level of efficiency is estimated to be 60%, thus allowing for improvements on the overall efficiency of whole micro-hydro system. At 60% turbine efficiency micro-hydro schemes seem to be underutilising resources. Communities are benefitting by having their business centres, clinics and schools powered. However more electrical power can be attained without increasing the resources but by only increasing the turbine efficiencies [4]. This can ensure that more households in the catchment area get more than just lighting, but are able to use other devices such as refrigerators, stoves etc in their houses.
L K Gudukeya is with the Mechanical Engineering Department, University
of Zimbabwe, Box MP 167, Mt Pleasant, Harare (phone: 00263 773 286 349; email: [email protected]).
C Mbohwa is with the Quality and Operations Management Department, University of Johannesburg, Auckland Park Kingsway, South Africa (phone: 0027 78 207 1516; email: [email protected]).
II. RESEARCH OBJECTIVE To investigate options for increasing the turbine efficiencies
of Pelton wheel and Cross-flow turbines targeting the improvement of the overall micro hydro system efficiency while keeping the project financially feasible.
III. OVERVIEW OF MICRO-HYDRO POWER PLANT Hydro power is the harnessing of energy from falling water,
such as water falling through steep mountain rivers. The energy in flowing water is converted into useful mechanical power by means of a water wheel or a turbine [3]. The mechanical power from the turbine can be converted into electricity using an alternator or a generator.
Hydro power systems that are classified as “micro” have the power generation capacity of less than 100kW. They are relatively small power sources that may be used to supply power to a small group of users or communities, who are independent of the general electricity supply grid [5].
A micro-hydropower system (MHS) has the following components [6]: • A water turbine that converts the energy of flowing or
falling water into mechanical energy. This drives an alternator, which then generates electrical power
• A control mechanism in the form of electronic load controller to provide stable electrical power.
• Electrical distribution lines To develop an MHS the following features are needed as
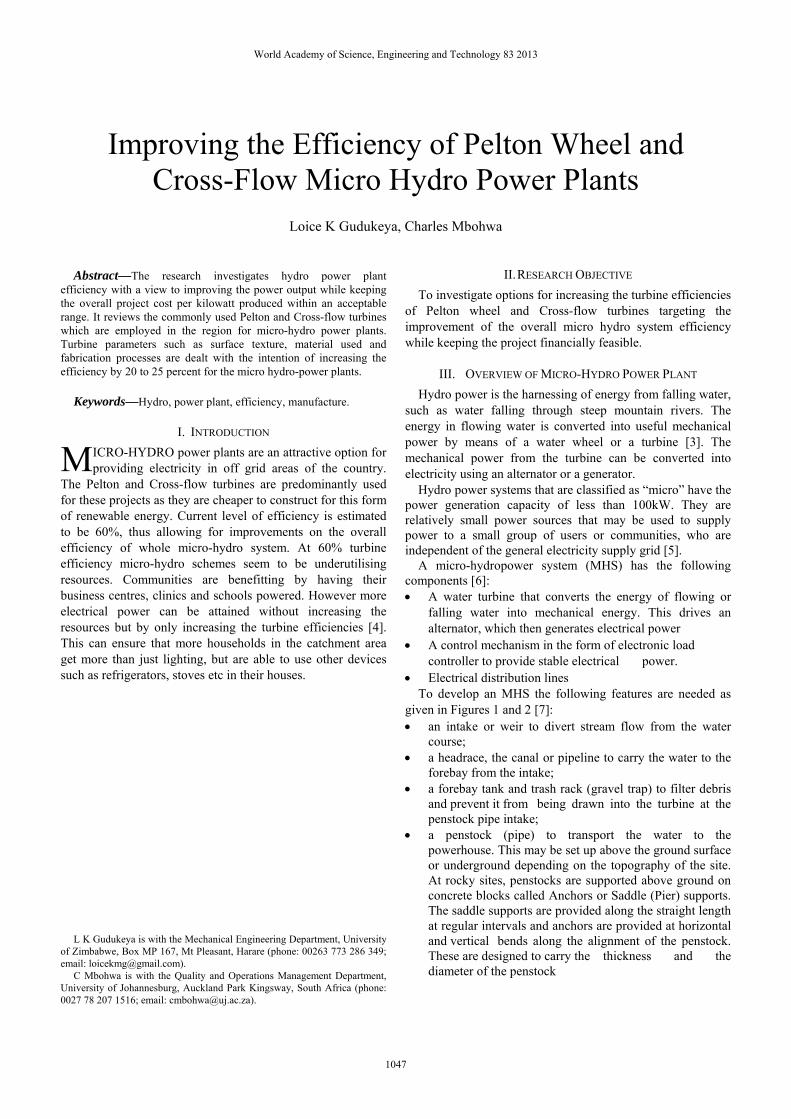
given in Figures 1 and 2 [7]: • an intake or weir to divert stream flow from the water
course; • a headrace, the canal or pipeline to carry the water to the
forebay from the intake; • a forebay tank and trash rack (gravel trap) to filter debris
and prevent it from being drawn into the turbine at the penstock pipe intake;
• a penstock (pipe) to transport the water to the powerhouse. This may be set up above the ground surface or underground depending on the topography of the site. At rocky sites, penstocks are supported above ground on concrete blocks called Anchors or Saddle (Pier) supports. The saddle supports are provided along the straight length at regular intervals and anchors are provided at horizontal and vertical bends along the alignment of the penstock. These are designed to carry the thickness and the diameter of the penstock
Loice K Gudukeya, Charles Mbohwa
Improving the Efficiency of Pelton Wheel and Cross-Flow Micro Hydro Power Plants
M
World Academy of Science, Engineering and Technology 83 2013
1047
• a powerhouse, being the building that accommodates and protects the electro-mechanical equipment, (turbine and generator), that convert the power of the water into electricity;
• a tailrace through which the water is released back to the river or stream without causing erosion;
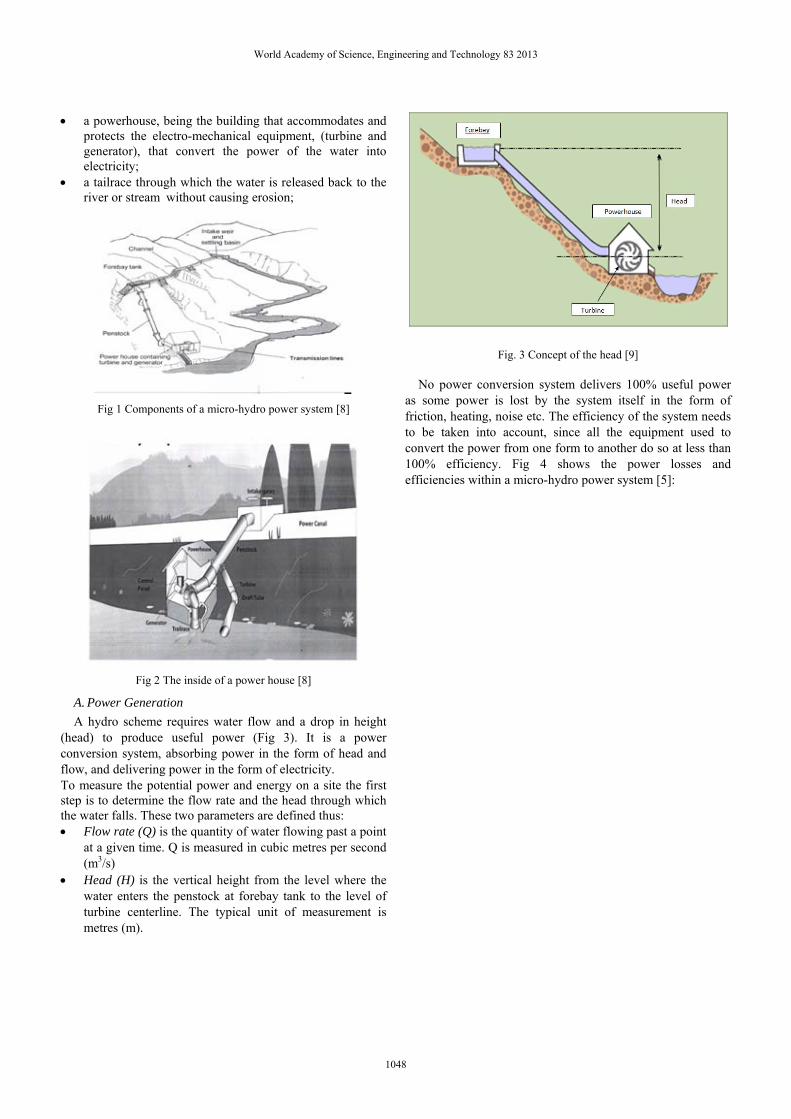
Fig 1 Components of a micro-hydro power system [8]
Fig 2 The inside of a power house [8]
A. Power Generation A hydro scheme requires water flow and a drop in height
(head) to produce useful power (Fig 3). It is a power conversion system, absorbing power in the form of head and flow, and delivering power in the form of electricity. To measure the potential power and energy on a site the first step is to determine the flow rate and the head through which the water falls. These two parameters are defined thus: • Flow rate (Q) is the quantity of water flowing past a point
at a given time. Q is measured in cubic metres per second (m3/s)
• Head (H) is the vertical height from the level where the water enters the penstock at forebay tank to the level of turbine centerline. The typical unit of measurement is metres (m).
Fig. 3 Concept of the head [9]
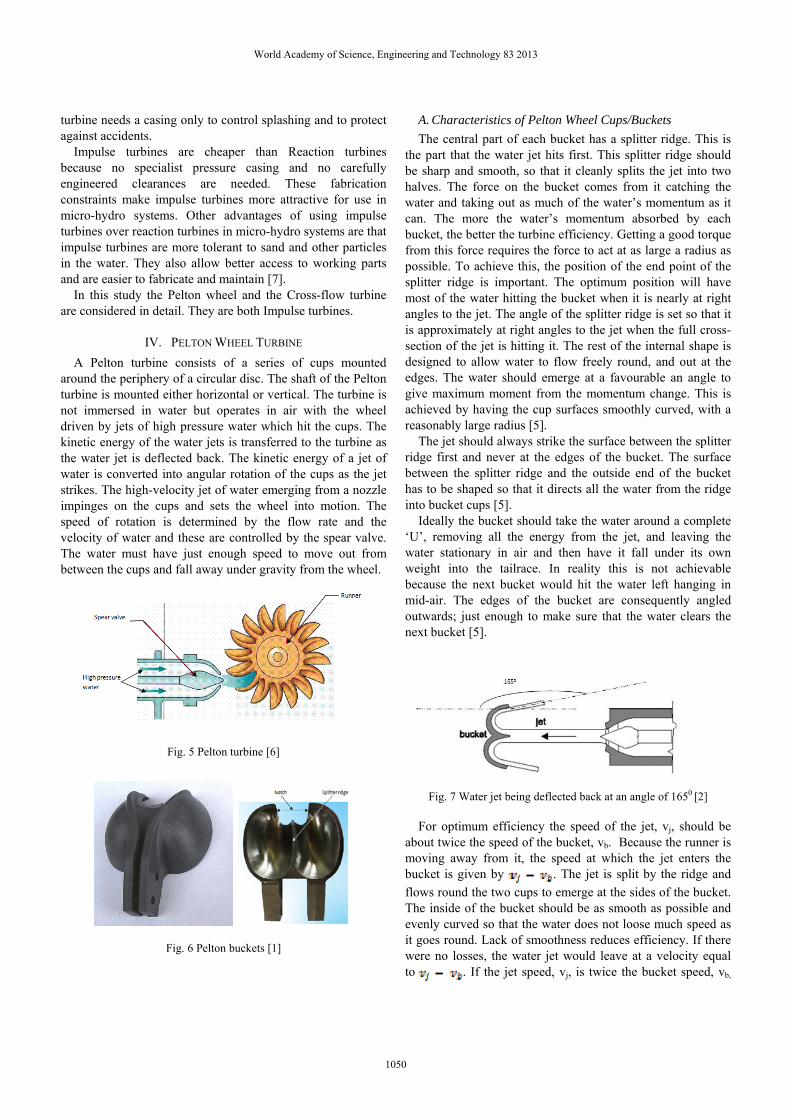
No power conversion system delivers 100% useful power as some power is lost by the system itself in the form of friction, heating, noise etc. The efficiency of the system needs to be taken into account, since all the equipment used to convert the power from one form to another do so at less than 100% efficiency. Fig 4 shows the power losses and efficiencies within a micro-hydro power system [5]:
World Academy of Science, Engineering and Technology 83 2013
1048
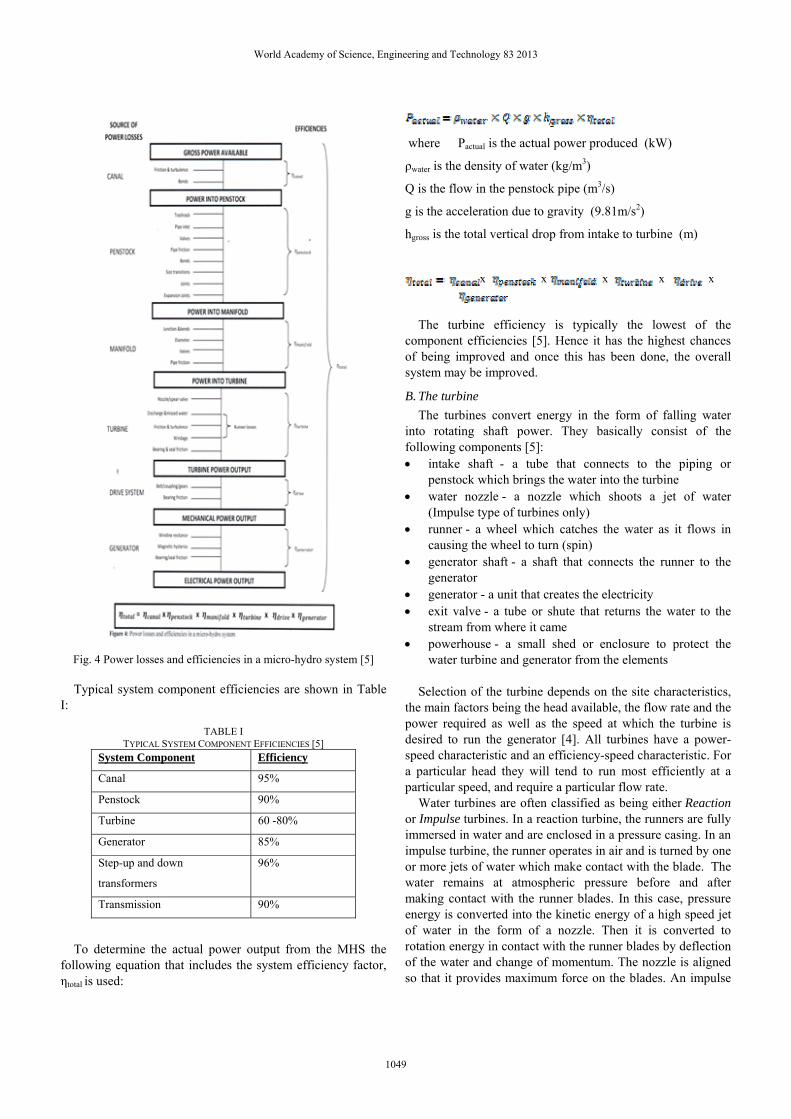
Fig. 4 Power losses and efficiencies in a micro-hydro system [5]
Typical system component efficiencies are shown in Table
I:
TABLE I TYPICAL SYSTEM COMPONENT EFFICIENCIES [5]
System Component Efficiency
Canal 95%
Penstock 90%
Turbine 60 -80%
Generator 85%
Step-up and down
transformers
96%
Transmission 90%
To determine the actual power output from the MHS the following equation that includes the system efficiency factor, ηtotal is used:
where Pactual is the actual power produced (kW)
ρwater is the density of water (kg/m3)
Q is the flow in the penstock pipe (m3/s)
g is the acceleration due to gravity (9.81m/s2)
hgross is the total vertical drop from intake to turbine (m)
x x x x x
The turbine efficiency is typically the lowest of the component efficiencies [5]. Hence it has the highest chances of being improved and once this has been done, the overall system may be improved.
B. The turbine The turbines convert energy in the form of falling water
into rotating shaft power. They basically consist of the following components [5]: • intake shaft - a tube that connects to the piping or
penstock which brings the water into the turbine • water nozzle - a nozzle which shoots a jet of water
(Impulse type of turbines only) • runner - a wheel which catches the water as it flows in
causing the wheel to turn (spin) • generator shaft - a shaft that connects the runner to the
generator • generator - a unit that creates the electricity • exit valve - a tube or shute that returns the water to the
stream from where it came • powerhouse - a small shed or enclosure to protect the
water turbine and generator from the elements
Selection of the turbine depends on the site characteristics, the main factors being the head available, the flow rate and the power required as well as the speed at which the turbine is desired to run the generator [4]. All turbines have a power-speed characteristic and an efficiency-speed characteristic. For a particular head they will tend to run most efficiently at a particular speed, and require a particular flow rate.
Water turbines are often classified as being either Reaction or Impulse turbines. In a reaction turbine, the runners are fully immersed in water and are enclosed in a pressure casing. In an impulse turbine, the runner operates in air and is turned by one or more jets of water which make contact with the blade. The water remains at atmospheric pressure before and after making contact with the runner blades. In this case, pressure energy is converted into the kinetic energy of a high speed jet of water in the form of a nozzle. Then it is converted to rotation energy in contact with the runner blades by deflection of the water and change of momentum. The nozzle is aligned so that it provides maximum force on the blades. An impulse
World Academy of Science, Engineering and Technology 83 2013
1049
turbine needs a casing only to control splashing and to protect against accidents.
Impulse turbines are cheaper than Reaction turbines because no specialist pressure casing and no carefully engineered clearances are needed. These fabrication constraints make impulse turbines more attractive for use in micro-hydro systems. Other advantages of using impulse turbines over reaction turbines in micro-hydro systems are that impulse turbines are more tolerant to sand and other particles in the water. They also allow better access to working parts and are easier to fabricate and maintain [7].
In this study the Pelton wheel and the Cross-flow turbine are considered in detail. They are both Impulse turbines.
IV. PELTON WHEEL TURBINE A Pelton turbine consists of a series of cups mounted
around the periphery of a circular disc. The shaft of the Pelton turbine is mounted either horizontal or vertical. The turbine is not immersed in water but operates in air with the wheel driven by jets of high pressure water which hit the cups. The kinetic energy of the water jets is transferred to the turbine as the water jet is deflected back. The kinetic energy of a jet of water is converted into angular rotation of the cups as the jet strikes. The high-velocity jet of water emerging from a nozzle impinges on the cups and sets the wheel into motion. The speed of rotation is determined by the flow rate and the velocity of water and these are controlled by the spear valve. The water must have just enough speed to move out from between the cups and fall away under gravity from the wheel.
Fig. 5 Pelton turbine [6]
Fig. 6 Pelton buckets [1]
A. Characteristics of Pelton Wheel Cups/Buckets The central part of each bucket has a splitter ridge. This is
the part that the water jet hits first. This splitter ridge should be sharp and smooth, so that it cleanly splits the jet into two halves. The force on the bucket comes from it catching the water and taking out as much of the water’s momentum as it can. The more the water’s momentum absorbed by each bucket, the better the turbine efficiency. Getting a good torque from this force requires the force to act at as large a radius as possible. To achieve this, the position of the end point of the splitter ridge is important. The optimum position will have most of the water hitting the bucket when it is nearly at right angles to the jet. The angle of the splitter ridge is set so that it is approximately at right angles to the jet when the full cross-section of the jet is hitting it. The rest of the internal shape is designed to allow water to flow freely round, and out at the edges. The water should emerge at a favourable an angle to give maximum moment from the momentum change. This is achieved by having the cup surfaces smoothly curved, with a reasonably large radius [5].
The jet should always strike the surface between the splitter ridge first and never at the edges of the bucket. The surface between the splitter ridge and the outside end of the bucket has to be shaped so that it directs all the water from the ridge into bucket cups [5].
Ideally the bucket should take the water around a complete ‘U’, removing all the energy from the jet, and leaving the water stationary in air and then have it fall under its own weight into the tailrace. In reality this is not achievable because the next bucket would hit the water left hanging in mid-air. The edges of the bucket are consequently angled outwards; just enough to make sure that the water clears the next bucket [5].
Fig. 7 Water jet being deflected back at an angle of 1650 [2]
For optimum efficiency the speed of the jet, vj, should be
about twice the speed of the bucket, vb. Because the runner is moving away from it, the speed at which the jet enters the bucket is given by . The jet is split by the ridge and flows round the two cups to emerge at the sides of the bucket. The inside of the bucket should be as smooth as possible and evenly curved so that the water does not loose much speed as it goes round. Lack of smoothness reduces efficiency. If there were no losses, the water jet would leave at a velocity equal to . If the jet speed, vj, is twice the bucket speed, vb,
World Academy of Science, Engineering and Technology 83 2013
1050
then the water, relative to the bucket, leaves at a speed of
So if the bucket is moving at a velocity of vb and the water is coming out of the bucket at a speed of vb, in almost the opposite direction, this would mean that the speed of the water coming out relative to the housing is nearly zero; its energy having been completely removed by the bucket [5].
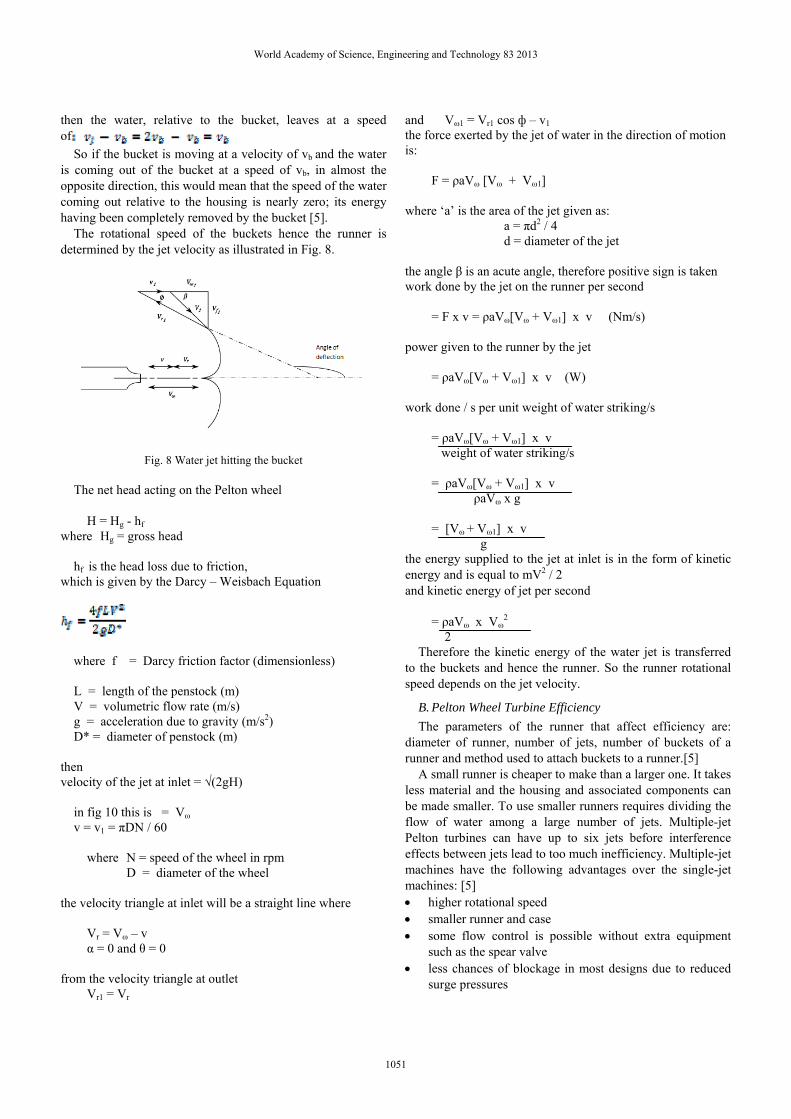
The rotational speed of the buckets hence the runner is determined by the jet velocity as illustrated in Fig. 8.
Fig. 8 Water jet hitting the bucket
The net head acting on the Pelton wheel H = Hg - hf where Hg = gross head hf is the head loss due to friction, which is given by the Darcy – Weisbach Equation
where f = Darcy friction factor (dimensionless) L = length of the penstock (m) V = volumetric flow rate (m/s) g = acceleration due to gravity (m/s2) D* = diameter of penstock (m) then velocity of the jet at inlet = √(2gH) in fig 10 this is = Vω v = v1 = πDN / 60 where N = speed of the wheel in rpm D = diameter of the wheel the velocity triangle at inlet will be a straight line where Vr = Vω – v α = 0 and θ = 0 from the velocity triangle at outlet Vr1 = Vr
and Vω1 = Vr1 cos ф – v1 the force exerted by the jet of water in the direction of motion is: F = ρaVω [Vω + Vω1] where ‘a’ is the area of the jet given as:
a = πd2 / 4 d = diameter of the jet the angle β is an acute angle, therefore positive sign is taken work done by the jet on the runner per second = F x v = ρaVω[Vω + Vω1] x v (Nm/s) power given to the runner by the jet = ρaVω[Vω + Vω1] x v (W) work done / s per unit weight of water striking/s = ρaVω[Vω + Vω1] x v weight of water striking/s = ρaVω[Vω + Vω1] x v ρaVω x g = [Vω + Vω1] x v g the energy supplied to the jet at inlet is in the form of kinetic energy and is equal to mV2 / 2 and kinetic energy of jet per second = ρaVω x Vω
2 2
Therefore the kinetic energy of the water jet is transferred to the buckets and hence the runner. So the runner rotational speed depends on the jet velocity.
B. Pelton Wheel Turbine Efficiency The parameters of the runner that affect efficiency are:
diameter of runner, number of jets, number of buckets of a runner and method used to attach buckets to a runner.[5]
A small runner is cheaper to make than a larger one. It takes less material and the housing and associated components can be made smaller. To use smaller runners requires dividing the flow of water among a large number of jets. Multiple-jet Pelton turbines can have up to six jets before interference effects between jets lead to too much inefficiency. Multiple-jet machines have the following advantages over the single-jet machines: [5] • higher rotational speed • smaller runner and case • some flow control is possible without extra equipment
such as the spear valve • less chances of blockage in most designs due to reduced
surge pressures
World Academy of Science, Engineering and Technology 83 2013
1051
In order to optimize efficiency, the number of buckets on the turbine runner is generally between 18 and 22. For the Pelton wheel turbine to function as expected, the buckets must be attached securely onto the runner. This is to avoid buckets flying off the runner during operation or buckets moving from their original positions, hence compromising efficiency. There are a number of ways of mounting buckets onto the runner hub. The whole runner and buckets may be cast as one piece or buckets may be cast separately and are then bolted, clamped or welded onto the runner [2]. Casting of buckets and mounting them to the runner is the process widely used in the manufacturing of turbines. It is cheap, reliable and can produce complex shapes easily.
C. Materials for Pelton wheel turbine buckets The chief material requirements are high strength, abrasion
resistance, casting suitability and ability to withstand extended use in water. Materials in common use are Aluminium, Copper Alloys, Grey Cast Iron, Stainless Steel and Plastic.
D. Flow control for Pelton wheel turbine efficiency In order to maximise the efficiency of the turbine, it is
important to be able to control the flow rate. The need to control this flow arises due to site conditions that include change in water flow rate with changing seasons. There are various options that are used to control the flow of the water jet, and these include the varying of number of jets, the spear valve and the replacement of nozzles [3].
E. Friction Turbine efficiency can be considered separately as
hydraulic efficiency, mechanical efficiency, volumetric efficiency and overall efficiency [5].
a) Hydraulic efficiency Hydraulic efficiency is defined at the ratio of power given
by water to the runner of a turbine to the power supplied by the water at the inlet of the turbine. The power at the inlet of the turbine is the highest and this power goes on decreasing as the water flows over the buckets of the turbine due to hydraulic losses as the buckets are not as smooth. Hence the power delivered to the runner of the turbine will be less than the power available at the inlet of the turbine. From Fig 10, mathematically the hydraulic efficiency of a turbine is:
ηh = power delivered to runner power supplied at inlet = work done per second K.E. of jet per second =ρaVω[Vω + Vω1] x v (ρaVω) x (Vω)2 / 2 = 2 [Vω + Vω1] x v (Vω)2
i. Mechanical efficiency
The power delivered by water to the runner of a turbine is transmitted to the shaft of the turbine. Due to mechanical losses, the power available at the shaft of the turbine is less than the power delivered to the runner of a turbine. The ratio of the power available at the shaft of the turbine to the power delivered to the runner is defined as mechanical efficiency. Hence, it is written as:
ηm = power at the shaft of the turbine power delivered by water to the runner
ii. Volumetric efficiency The volume of the water striking the runner of a
turbine is slightly less than the volume of water supplied to the turbine. Some of the volume of the water is discharged to the tail race without striking the runner of the turbine. Thus the ratio of the volume of the water actually striking the runner to the volume of water supplied to the turbine is defined as volumetric efficiency. It is written as:
ηv = volume of water actually striking the runner volume of water supplied to the turbine
iii. Overall efficiency Overall efficiency is the ratio of power available at
the shaft of the turbine to the power supplied by the water at the inlet of the turbine. It is written as:
ηo = volume available at the shaft of the turbine power supplied at the inlet of the turbine = ηm x ηh
World Academy of Science, Engineering and Technology 83 2013
1052
Friction has the greatest impact on hydraulic efficiency and in turn hydraulic efficiency is one of the factors affecting the overall efficiency. This makes friction an important factor in overall turbine efficiency. For example in the analysis of flow friction of Pelton turbine hydraulics it is indicated that the flow friction in the Pelton buckets has a substantial impact on the system efficiency.
The direct influence is determined by the friction, which directly retards the bucket motion and thus determines the power output. The indirect way is determined by the changes of relative flow and the pressure distribution in the bucket. The flow friction theorem points out that the total reduction of the system efficiency is equal to the total efficiency reductions by two different ways. In the total efficiency reduction, the effect from the indirect way dominates. In addition, frictions in the bucket, whether at the bucket entrance or at the exit, always cause a reduction in system efficiency. The efficiency drop resulting from the flow frictions represents the greatest part in the total loss in the system efficiency of a Pelton turbine.
F. Water Jet and Pelton Wheel Buckets Of great importance is the interaction of the water jet with
the Pelton buckets. The jet discharged from the nozzle of a Pelton turbine is a key item of hydropower systems and its precise shape and position are highly relevant to the optimum design of the turbine buckets to match the incoming flow. In the first configuration, the interaction between the runner and an axial-symmetric jet characterized by a given velocity jet profile were investigated, whereas in the second configuration the runner was coupled with the needle nozzle and the final part of the penstock and the interaction between the jet and the bucket were analyzed. The results confirmed that the turbine efficiency is affected by the water jet interaction with the turbine was shown.
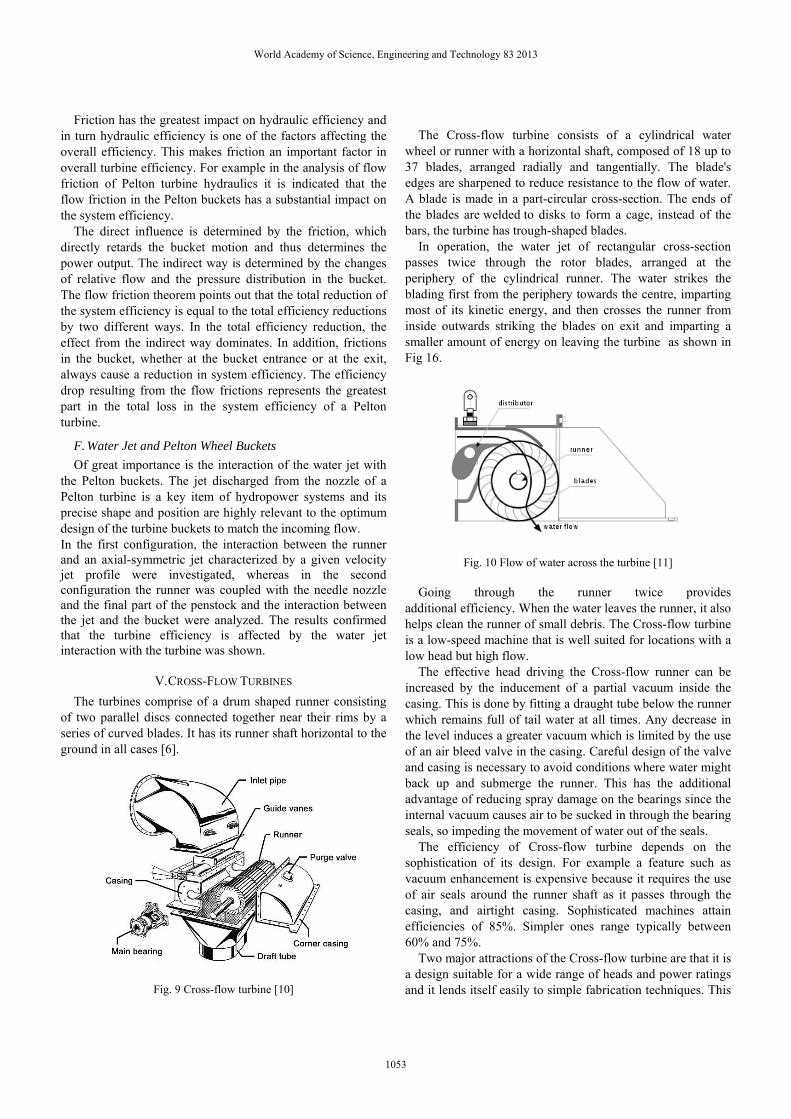
V. CROSS-FLOW TURBINES The turbines comprise of a drum shaped runner consisting
of two parallel discs connected together near their rims by a series of curved blades. It has its runner shaft horizontal to the ground in all cases [6].
Fig. 9 Cross-flow turbine [10]
The Cross-flow turbine consists of a cylindrical water
wheel or runner with a horizontal shaft, composed of 18 up to 37 blades, arranged radially and tangentially. The blade's edges are sharpened to reduce resistance to the flow of water. A blade is made in a part-circular cross-section. The ends of the blades are welded to disks to form a cage, instead of the bars, the turbine has trough-shaped blades.
In operation, the water jet of rectangular cross-section passes twice through the rotor blades, arranged at the periphery of the cylindrical runner. The water strikes the blading first from the periphery towards the centre, imparting most of its kinetic energy, and then crosses the runner from inside outwards striking the blades on exit and imparting a smaller amount of energy on leaving the turbine as shown in Fig 16.
Fig. 10 Flow of water across the turbine [11]
Going through the runner twice provides
additional efficiency. When the water leaves the runner, it also helps clean the runner of small debris. The Cross-flow turbine is a low-speed machine that is well suited for locations with a low head but high flow.
The effective head driving the Cross-flow runner can be increased by the inducement of a partial vacuum inside the casing. This is done by fitting a draught tube below the runner which remains full of tail water at all times. Any decrease in the level induces a greater vacuum which is limited by the use of an air bleed valve in the casing. Careful design of the valve and casing is necessary to avoid conditions where water might back up and submerge the runner. This has the additional advantage of reducing spray damage on the bearings since the internal vacuum causes air to be sucked in through the bearing seals, so impeding the movement of water out of the seals.
The efficiency of Cross-flow turbine depends on the sophistication of its design. For example a feature such as vacuum enhancement is expensive because it requires the use of air seals around the runner shaft as it passes through the casing, and airtight casing. Sophisticated machines attain efficiencies of 85%. Simpler ones range typically between 60% and 75%.
Two major attractions of the Cross-flow turbine are that it is a design suitable for a wide range of heads and power ratings and it lends itself easily to simple fabrication techniques. This
World Academy of Science, Engineering and Technology 83 2013
1053
is a feature that is of interest in developing countries, e.g. the runner blades can be fabricated by cutting a pipe lengthwise in strips.
A. Flow control in Cross-flow turbine Flow control is done by a guide vane. The shaft of the
guide vane is parallel to the rotor shaft, it fits neatly inside the nozzle to keep leaks at the side in the closed condition within limits. It guides water to the runner and controls the amount of water entering the runner. The device is operated by a screw and nut which is connected to a hand wheel. It can also be coupled to automatic operation, to the hydraulic cylinder of a speed governor. In addition, rubber gaskets are used to seal up the turbine housing.
The correct design speed of a turbine depends on the power rating of turbine, the site head and the type of turbine [7]. Small turbines designed for micro-hydro applications may at times have techniques for altering the flow rate of water. On larger machines a method of altering flow is different. Cross-flow has guide vanes which alter the water flow rate.
VI. OVERVIEW OF MICRO-HYDRO PLANTS CONSIDERED IN THIS STUDY
The turbines considered in this study are for micro-hydro power plants at sites located in Malawi, Mozambique and Zimbabwe as shown in Table II.
TABLE II MICRO-HYDRO POWER PLANT BY SITE
SITE NAME GROSS
HEAD
(m)
DESIGNED
FLOW
RATE
(m3/s)
TURB
INE
TYPE
DESIGNED
EFFICIEN
CY (%)
A BONDO,
MALAWI
51 0.325 Pelton 60%
B DAZI, NYANGA 138 0.035 Pelton 60%
C NYAMWANGA,
HONDE
VALLEY
26 0.277 Cross-
flow
60%
D CHITUNGA,
MOZAMBIQUE
35 0.180 Cross-
flow
60%
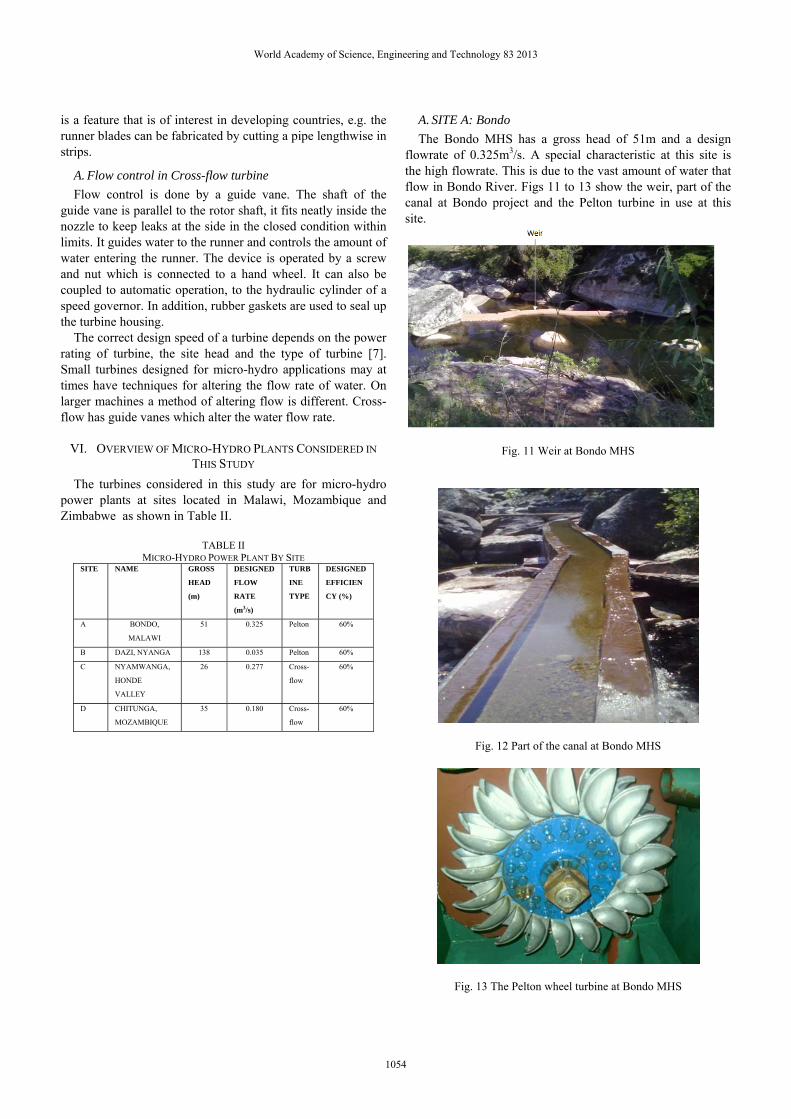
A. SITE A: Bondo The Bondo MHS has a gross head of 51m and a design
flowrate of 0.325m3/s. A special characteristic at this site is the high flowrate. This is due to the vast amount of water that flow in Bondo River. Figs 11 to 13 show the weir, part of the canal at Bondo project and the Pelton turbine in use at this site.
Fig. 11 Weir at Bondo MHS
Fig. 12 Part of the canal at Bondo MHS
Fig. 13 The Pelton wheel turbine at Bondo MHS
World Academy of Science, Engineering and Technology 83 2013
1054
The Bondo project benefits two schools in the area; a
primary and a secondary schools and teachers’ houses, one clinic including the waiting mothers’ home and staff houses and one business centre. The business centre has some grocery shops, a battery charging centre, hair salon and an electric grinding mill. There are seven villages in the Bondo catchment area with a total of 3084 households. However, evidence shows that if more power could be produced further developments would be possible.
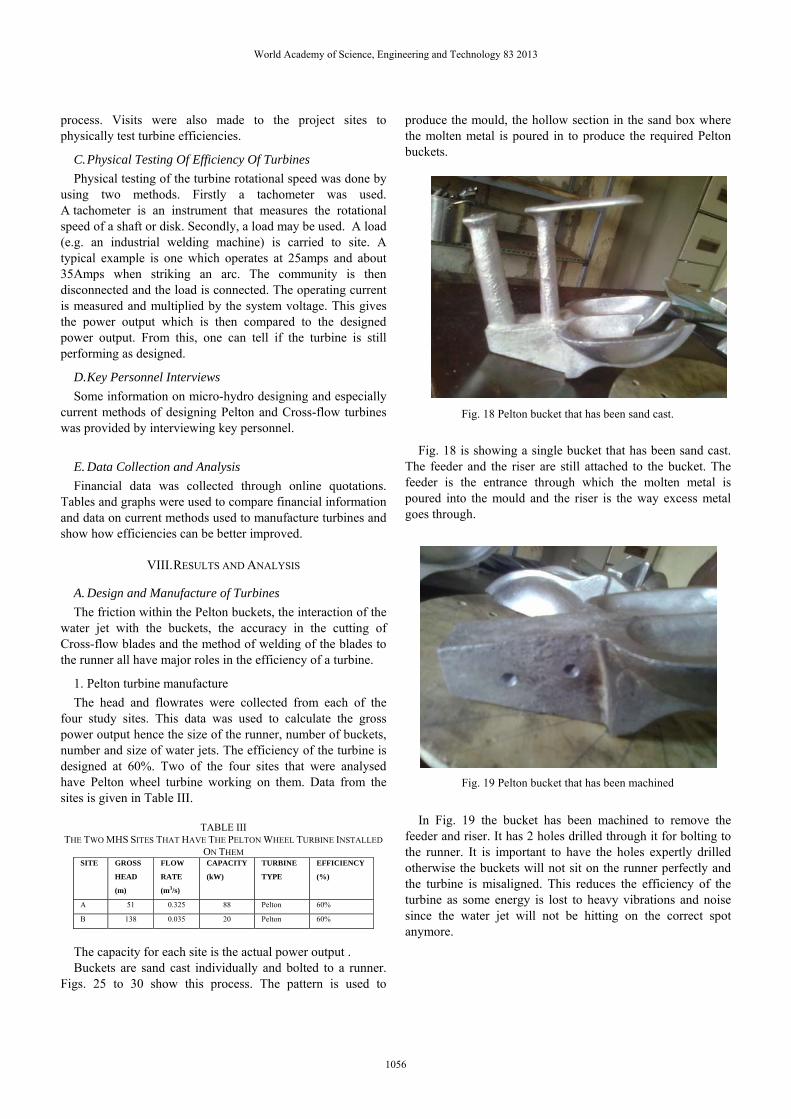
B. SITE B: Dazi micro-hydro project At the site the head is 138m, the design flowrate is
0.035m3/s. A pelton turbine is in used. A special characteristic of this site is the very high head that compensates for the low flows. The project benefits a school in Fig 21, a clinic and lighting for about 1000 people in nine villages. More power would allow the 1000 people to use electrical gadgets such as refrigerators and stoves.
Fig. 14 A classroom lit by power from the Dazi MHS
C. SITE C: Nyamwanga project The Nyamwanga MHS is located 27km North East of
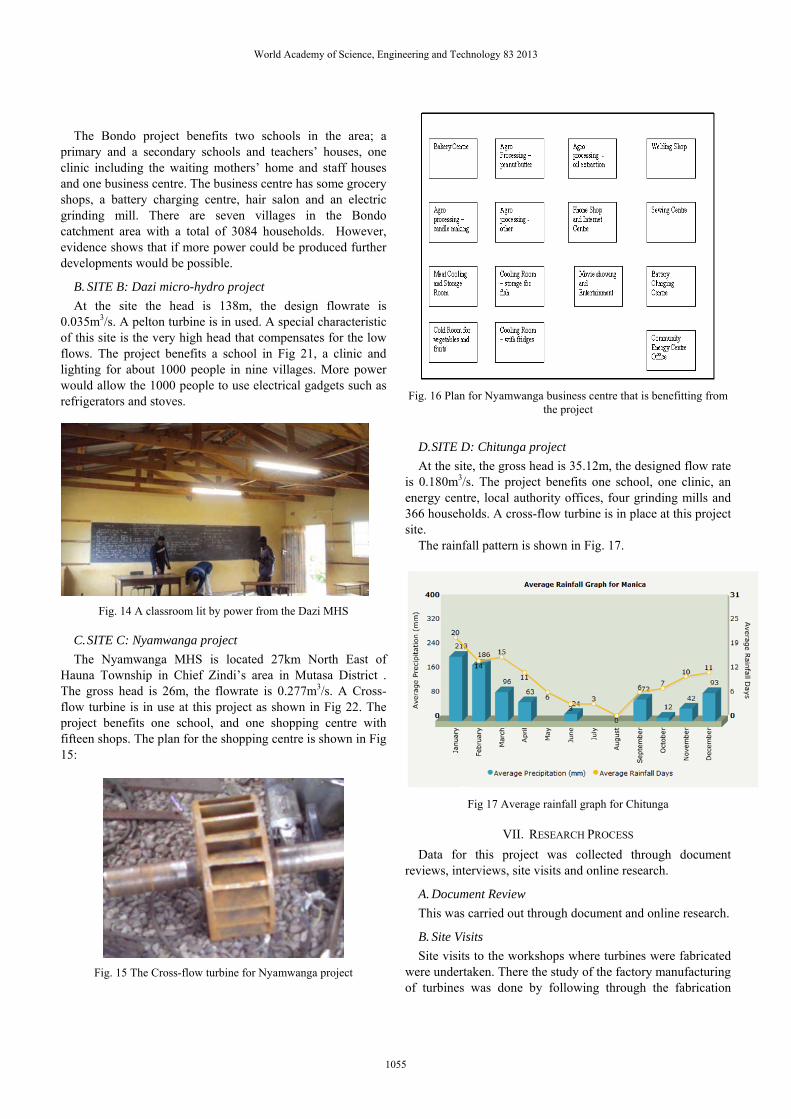
Hauna Township in Chief Zindi’s area in Mutasa District . The gross head is 26m, the flowrate is 0.277m3/s. A Cross-flow turbine is in use at this project as shown in Fig 22. The project benefits one school, and one shopping centre with fifteen shops. The plan for the shopping centre is shown in Fig 15:
Fig. 15 The Cross-flow turbine for Nyamwanga project
Fig. 16 Plan for Nyamwanga business centre that is benefitting from
the project
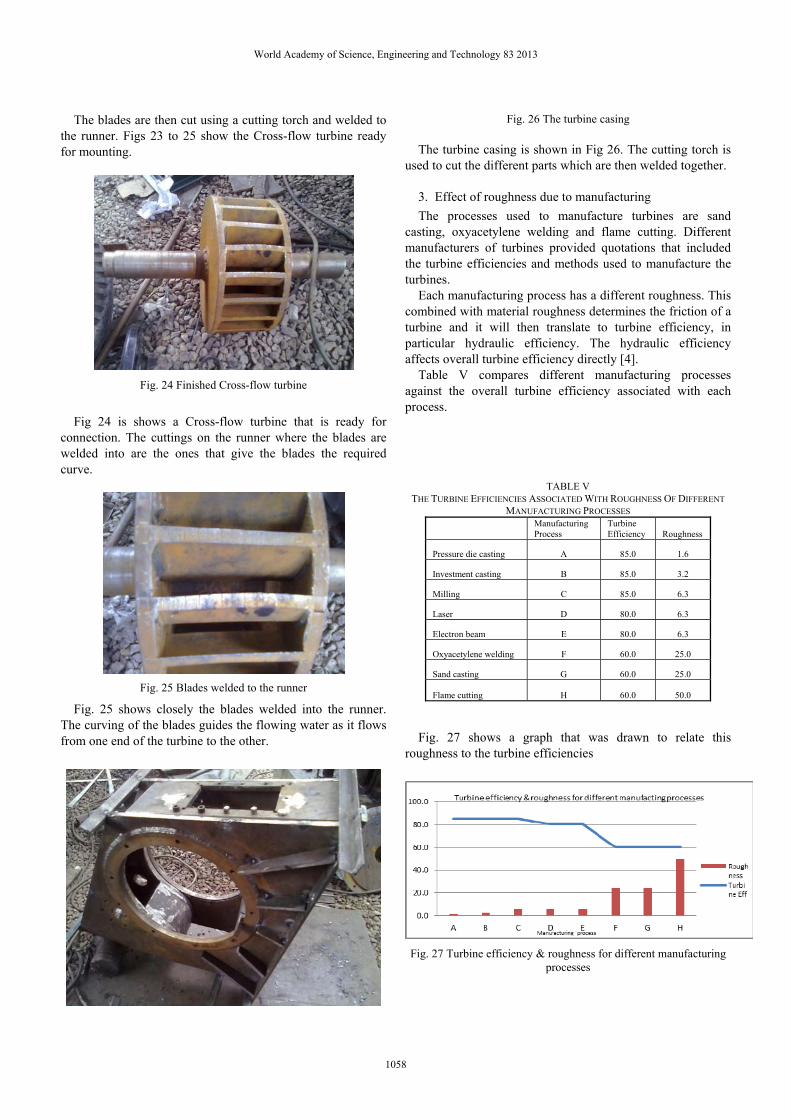
D. SITE D: Chitunga project At the site, the gross head is 35.12m, the designed flow rate
is 0.180m3/s. The project benefits one school, one clinic, an energy centre, local authority offices, four grinding mills and 366 households. A cross-flow turbine is in place at this project site.
The rainfall pattern is shown in Fig. 17.
Fig 17 Average rainfall graph for Chitunga
VII. RESEARCH PROCESS Data for this project was collected through document
reviews, interviews, site visits and online research.
A. Document Review This was carried out through document and online research.
B. Site Visits Site visits to the workshops where turbines were fabricated
were undertaken. There the study of the factory manufacturing of turbines was done by following through the fabrication
World Academy of Science, Engineering and Technology 83 2013
1055
process. Visits were also made to the project sites to physically test turbine efficiencies.
C. Physical Testing Of Efficiency Of Turbines Physical testing of the turbine rotational speed was done by
using two methods. Firstly a tachometer was used. A tachometer is an instrument that measures the rotational speed of a shaft or disk. Secondly, a load may be used. A load (e.g. an industrial welding machine) is carried to site. A typical example is one which operates at 25amps and about 35Amps when striking an arc. The community is then disconnected and the load is connected. The operating current is measured and multiplied by the system voltage. This gives the power output which is then compared to the designed power output. From this, one can tell if the turbine is still performing as designed.
D. Key Personnel Interviews Some information on micro-hydro designing and especially
current methods of designing Pelton and Cross-flow turbines was provided by interviewing key personnel.
E. Data Collection and Analysis Financial data was collected through online quotations.
Tables and graphs were used to compare financial information and data on current methods used to manufacture turbines and show how efficiencies can be better improved.
VIII. RESULTS AND ANALYSIS
A. Design and Manufacture of Turbines The friction within the Pelton buckets, the interaction of the
water jet with the buckets, the accuracy in the cutting of Cross-flow blades and the method of welding of the blades to the runner all have major roles in the efficiency of a turbine.
1. Pelton turbine manufacture The head and flowrates were collected from each of the
four study sites. This data was used to calculate the gross power output hence the size of the runner, number of buckets, number and size of water jets. The efficiency of the turbine is designed at 60%. Two of the four sites that were analysed have Pelton wheel turbine working on them. Data from the sites is given in Table III.
TABLE III THE TWO MHS SITES THAT HAVE THE PELTON WHEEL TURBINE INSTALLED
ON THEM SITE GROSS
HEAD
(m)
FLOW
RATE
(m3/s)
CAPACITY
(kW)
TURBINE
TYPE
EFFICIENCY
(%)
A 51 0.325 88 Pelton 60%
B 138 0.035 20 Pelton 60%
The capacity for each site is the actual power output . Buckets are sand cast individually and bolted to a runner.
Figs. 25 to 30 show this process. The pattern is used to
produce the mould, the hollow section in the sand box where the molten metal is poured in to produce the required Pelton buckets.
Fig. 18 Pelton bucket that has been sand cast.
Fig. 18 is showing a single bucket that has been sand cast.
The feeder and the riser are still attached to the bucket. The feeder is the entrance through which the molten metal is poured into the mould and the riser is the way excess metal goes through.
Fig. 19 Pelton bucket that has been machined
In Fig. 19 the bucket has been machined to remove the
feeder and riser. It has 2 holes drilled through it for bolting to the runner. It is important to have the holes expertly drilled otherwise the buckets will not sit on the runner perfectly and the turbine is misaligned. This reduces the efficiency of the turbine as some energy is lost to heavy vibrations and noise since the water jet will not be hitting on the correct spot anymore.
World Academy of Science, Engineering and Technology 83 2013
1056
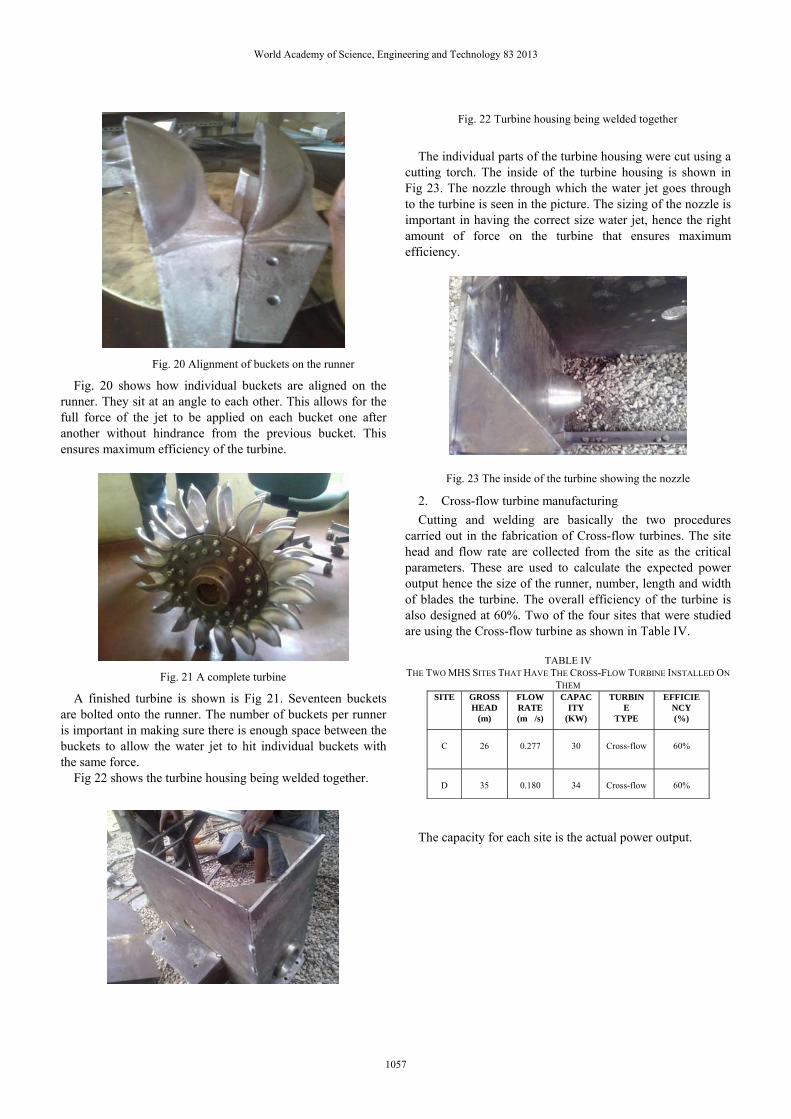
Fig. 20 Alignment of buckets on the runner
Fig. 20 shows how individual buckets are aligned on the runner. They sit at an angle to each other. This allows for the full force of the jet to be applied on each bucket one after another without hindrance from the previous bucket. This ensures maximum efficiency of the turbine.
Fig. 21 A complete turbine
A finished turbine is shown is Fig 21. Seventeen buckets are bolted onto the runner. The number of buckets per runner is important in making sure there is enough space between the buckets to allow the water jet to hit individual buckets with the same force.
Fig 22 shows the turbine housing being welded together.
Fig. 22 Turbine housing being welded together
The individual parts of the turbine housing were cut using a
cutting torch. The inside of the turbine housing is shown in Fig 23. The nozzle through which the water jet goes through to the turbine is seen in the picture. The sizing of the nozzle is important in having the correct size water jet, hence the right amount of force on the turbine that ensures maximum efficiency.
Fig. 23 The inside of the turbine showing the nozzle
2. Cross-flow turbine manufacturing Cutting and welding are basically the two procedures
carried out in the fabrication of Cross-flow turbines. The site head and flow rate are collected from the site as the critical parameters. These are used to calculate the expected power output hence the size of the runner, number, length and width of blades the turbine. The overall efficiency of the turbine is also designed at 60%. Two of the four sites that were studied are using the Cross-flow turbine as shown in Table IV.
TABLE IV THE TWO MHS SITES THAT HAVE THE CROSS-FLOW TURBINE INSTALLED ON
THEM SITE GROSS
HEAD (m)
FLOW RATE (m�/s)
CAPACITY
(KW)
TURBINE
TYPE
EFFICIENCY (%)
C
26
0.277
30
Cross-flow
60%
D
35
0.180
34
Cross-flow
60%
The capacity for each site is the actual power output.
World Academy of Science, Engineering and Technology 83 2013
1057
The blades are then cut using a cutting torch and welded to the runner. Figs 23 to 25 show the Cross-flow turbine ready for mounting.
Fig. 24 Finished Cross-flow turbine
Fig 24 is shows a Cross-flow turbine that is ready for
connection. The cuttings on the runner where the blades are welded into are the ones that give the blades the required curve.
Fig. 25 Blades welded to the runner
Fig. 25 shows closely the blades welded into the runner. The curving of the blades guides the flowing water as it flows from one end of the turbine to the other.
Fig. 26 The turbine casing The turbine casing is shown in Fig 26. The cutting torch is
used to cut the different parts which are then welded together.
3. Effect of roughness due to manufacturing The processes used to manufacture turbines are sand
casting, oxyacetylene welding and flame cutting. Different manufacturers of turbines provided quotations that included the turbine efficiencies and methods used to manufacture the turbines.
Each manufacturing process has a different roughness. This combined with material roughness determines the friction of a turbine and it will then translate to turbine efficiency, in particular hydraulic efficiency. The hydraulic efficiency affects overall turbine efficiency directly [4].
Table V compares different manufacturing processes against the overall turbine efficiency associated with each process.
TABLE V THE TURBINE EFFICIENCIES ASSOCIATED WITH ROUGHNESS OF DIFFERENT
MANUFACTURING PROCESSES Manufacturing Process
Turbine Efficiency Roughness
Pressure die casting A 85.0 1.6
Investment casting B 85.0 3.2
Milling C 85.0 6.3
Laser D 80.0 6.3
Electron beam E 80.0 6.3
Oxyacetylene welding F 60.0 25.0
Sand casting G 60.0 25.0
Flame cutting H 60.0 50.0
Fig. 27 shows a graph that was drawn to relate this roughness to the turbine efficiencies
Fig. 27 Turbine efficiency & roughness for different manufacturing
processes
World Academy of Science, Engineering and Technology 83 2013
1058
The graph indicates that as the manufacturing process roughness increases the overall efficiency of the turbine produced decreases. This emphasizes the need to use manufacturing processes with minimal roughness.
This diagnosis of roughness affecting the overall efficiency of turbines tallies with the findings that the flow friction in the Pelton buckets has a substantial impact on the system efficiency of the turbine. The efficiency drop resulting from the flow frictions represents the greatest part in the total loss in the system efficiency of a Pelton turbine.
Mechanical efficiency is the other determining factor of the overall efficiency. One way to improve this efficiency in casting procedures is to cast segments comprising of a number of buckets or whole runners, comprising the runner and all the buckets.
4. Effect of the water jet movement Of great importance in the mounting of the Pelton turbine is
its interaction with the water jet. To maximize efficiency the jet must hit precisely the centre of each Pelton bucket. That way the jet gives the maximum drive to each bucket as noted earlier in the design of the buckets that the rotation of the turbine depends on the water jet velocity. This fact matches with the experimental studies of the jet of a Pelton turbine. It was concluded that the jet discharged from the nozzle of a Pelton turbine is a key item of hydropower systems and its precise shape and position are highly relevant to the optimum design of the turbine buckets to match the incoming flow.
5. Turbine material The type of material used to fabricate a turbine affects its
efficiency. Good materials are hard and must be able to resist erosion and corrosion. This ensures that the turbines will function at their best efficiency for the expected life span on the micro hydro power plant. Stainless steel is mainly used for Pelton and Cross-flow turbines and mild steel is used for casings.
This study revealed that other materials that maybe used for turbines are Aluminium, Cast Iron, Copper based alloys such as Brass and Bronze, and Sheet steel. The properties of these materials and their prices per kg are given in Table VI.
TABLE VI PROPERTIES OF DIFFERENT MATERIALS AND THEIR PRICES PER KG
MATERIAL MATERIAL ROUGHNESS (x100-2)
BRINELL HARDNESS
(x100)
PRICE/KG
(US$/kg)
A Aluminium 0.2 1.2 1.32
B Grey cast iron
25 3.02 0.83
C Brass 1 3.6 5.54
D Bronze 1 3.6 5.54
E Stainless steel
3 4.15 1.47
F Sheet Steel 15 4.5 0.29
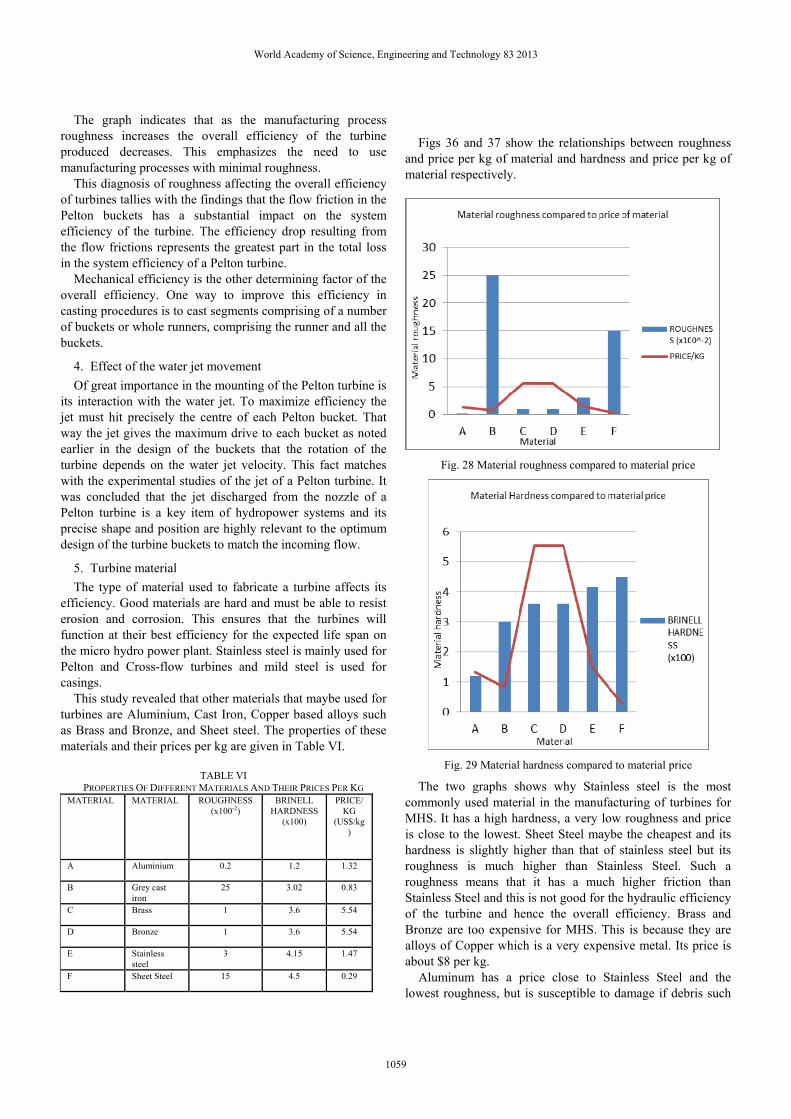
Figs 36 and 37 show the relationships between roughness and price per kg of material and hardness and price per kg of material respectively.
Fig. 28 Material roughness compared to material price
Fig. 29 Material hardness compared to material price
The two graphs shows why Stainless steel is the most commonly used material in the manufacturing of turbines for MHS. It has a high hardness, a very low roughness and price is close to the lowest. Sheet Steel maybe the cheapest and its hardness is slightly higher than that of stainless steel but its roughness is much higher than Stainless Steel. Such a roughness means that it has a much higher friction than Stainless Steel and this is not good for the hydraulic efficiency of the turbine and hence the overall efficiency. Brass and Bronze are too expensive for MHS. This is because they are alloys of Copper which is a very expensive metal. Its price is about $8 per kg.
Aluminum has a price close to Stainless Steel and the lowest roughness, but is susceptible to damage if debris such
World Academy of Science, Engineering and Technology 83 2013
1059
as stones and sand find their way to the turbine. This is because it has the lowest hardness. The roughness of Grey Cast Iron is too high. This compromises the turbine efficiency despite having a low price and a fairly high hardness.
6. Effect of increasing turbine efficiency on MHS power out put
The resultant change in actual power output due to increase in turbine efficiency of the four MHS that were studied is shown in the Table VII.
TABLE VII DIFFERENCES IN POWER OUTPUT DUE TO INCREASE IN TURBINE EFFICIENCY
SITE TURBINE TYPE
CURRENT TUBINE
EFICIENCY
CURRENT POWER OUTPUT
(kW)
NEW TURBINE
EFFICIENCY
POSSIBLE POWER OUTPUT
(kW)
Bondo (A) PELTON 0.60 88.00 0.85 124.67
Dazi (B) PELTON 0.60 20.00 0.85 28.33
Nyamwanga (C)
CROSSFLOW
0.60 34.00 0.80 45.33
Chitunga (D) CROSSFLOW
0.60 30.00 0.80 40.00
Fig. 30 Difference in MHS power output for the four sites analysed
In all the four cases there is a remarkable increase in power
output coming from the same resources. Therefore using the materials and manufacturing processes that give the highest possible yield from each site and resources is most ideal.
7. Performance measurements After the turbine has been set up and the micro hydro is just
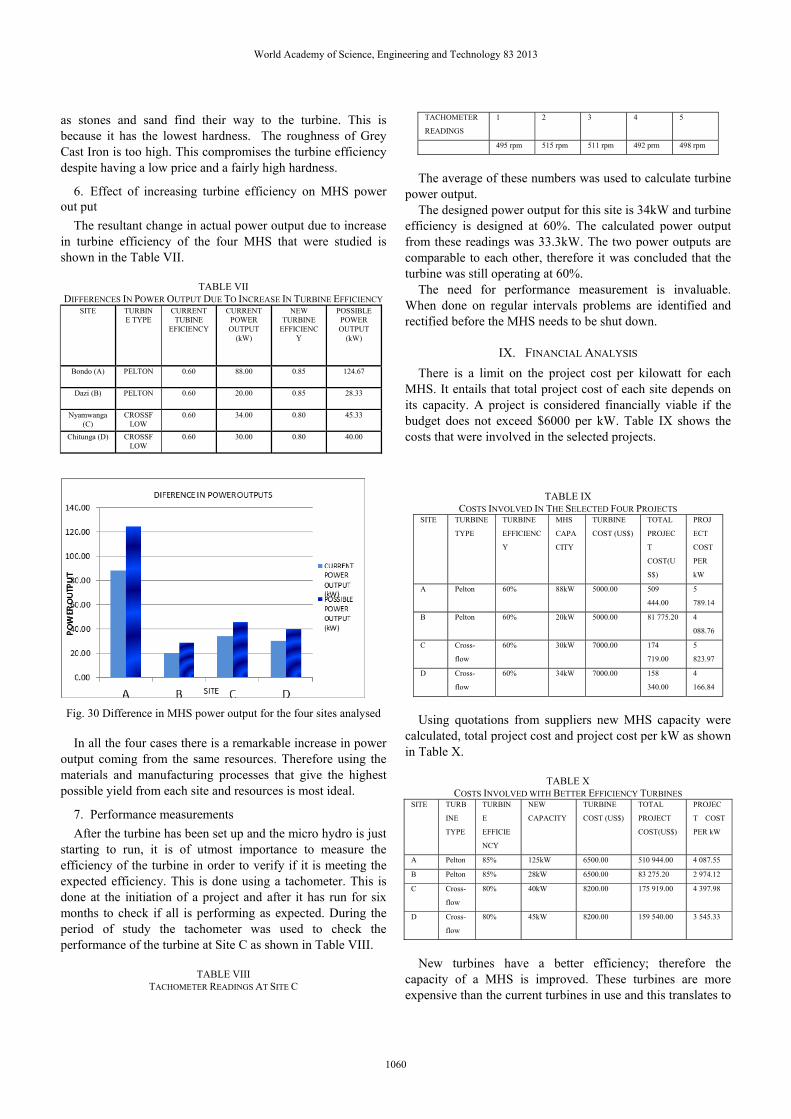
starting to run, it is of utmost importance to measure the efficiency of the turbine in order to verify if it is meeting the expected efficiency. This is done using a tachometer. This is done at the initiation of a project and after it has run for six months to check if all is performing as expected. During the period of study the tachometer was used to check the performance of the turbine at Site C as shown in Table VIII.
TABLE VIII TACHOMETER READINGS AT SITE C
TACHOMETER
READINGS
1 2 3 4 5
495 rpm 515 rpm 511 rpm 492 prm 498 rpm
The average of these numbers was used to calculate turbine
power output. The designed power output for this site is 34kW and turbine
efficiency is designed at 60%. The calculated power output from these readings was 33.3kW. The two power outputs are comparable to each other, therefore it was concluded that the turbine was still operating at 60%.
The need for performance measurement is invaluable. When done on regular intervals problems are identified and rectified before the MHS needs to be shut down.
IX. FINANCIAL ANALYSIS There is a limit on the project cost per kilowatt for each
MHS. It entails that total project cost of each site depends on its capacity. A project is considered financially viable if the budget does not exceed $6000 per kW. Table IX shows the costs that were involved in the selected projects.
TABLE IX COSTS INVOLVED IN THE SELECTED FOUR PROJECTS
SITE TURBINE
TYPE
TURBINE
EFFICIENC
Y
MHS
CAPA
CITY
TURBINE
COST (US$)
TOTAL
PROJEC
T
COST(U
S$)
PROJ
ECT
COST
PER
kW
A Pelton 60% 88kW 5000.00 509
444.00
5
789.14
B Pelton 60% 20kW 5000.00 81 775.20 4
088.76
C Cross-
flow
60% 30kW 7000.00 174
719.00
5
823.97
D Cross-
flow
60% 34kW 7000.00 158
340.00
4
166.84
Using quotations from suppliers new MHS capacity were
calculated, total project cost and project cost per kW as shown in Table X.
TABLE X COSTS INVOLVED WITH BETTER EFFICIENCY TURBINES
SITE TURB
INE
TYPE
TURBIN
E
EFFICIE
NCY
NEW
CAPACITY
TURBINE
COST (US$)
TOTAL
PROJECT
COST(US$)
PROJEC
T COST
PER kW
A Pelton 85% 125kW 6500.00 510 944.00 4 087.55
B Pelton 85% 28kW 6500.00 83 275.20 2 974.12
C Cross-
flow
80% 40kW 8200.00 175 919.00 4 397.98
D Cross-
flow
80% 45kW 8200.00 159 540.00 3 545.33
New turbines have a better efficiency; therefore the
capacity of a MHS is improved. These turbines are more expensive than the current turbines in use and this translates to
World Academy of Science, Engineering and Technology 83 2013
1060
higher total project costs. However, because a turbine with better efficiency also improves the MHS capacity the projects are made even more viable because in the end the project cost per kW is reduced. The change in project cost per kW for each site is shown in Table XI.
TABLE XI THE DIFFERENCE IN PROJECT COSTS PER KW
SITE CURRENT PROJECT
COST PER kW
EXPECTED PROJECT
COST PER kW
A 5 789.14 4 087.55
B 4 088.76 2 974.12
C 5 823.97 4 397.98
D 4 166.84 3 545.33
This reduction is shown graphically in Fig. 39.
Fig. 31 The reduction in project cost per kW on each site
The graph is showing that even though turbines of higher efficiencies are more expensive the overall project cost per kW actually decreases.
X. RESEARCH RECOMMENDATIONS It is highly recommended to consider investing in processes
that produce turbines with higher efficiencies such as: • Pressure die casting of turbines. They may be cast as
whole turbines or as segments made up of a number of buckets.
• Investment casting of whole turbines. • CNC milling of Pelton buckets. • Cutting of Pelton runner and Cross-flow runner and
blades using CNC laser, CNC plasma. • Electron beam and laser welding of blades to runners.
These processes offer far less roughness compared to current methods that include sand casting, flame cutting and oxyacetylene welding. That reduction in roughness lessens friction and the overall efficiency of a turbine is increased.
XI. CONCLUSION This study has revealed that turbines of better efficiencies
can be manufactured, made available for MHS and the projects remain financially viable. This was achieved through the comparison of current fabrication methods used locally to methods used by different suppliers of turbines. Even though the better efficiency turbines are more expensive than the ones being used currently the overall benefit is clear. More electricity is generated hence the cost per unit kW actually decreases making the projects even more viable. The financial viability of a project was determined by the project cost per kilowatt produced. Use of better efficiency turbines will make it possible to harness more electrical power from the same resources.
XII. FURTHER RESEARCH Further studies may be carried out on need for experimental
investigations with respect to the flow friction effects on the hydraulic efficiency of a Pelton turbine as well as considering materials which can be locally sourced for fabrication of the MHS in the country. As the MHS has potential for renewable energy resource, meaning less pollution to the environment which is encouraged by the dictates of Cleaner Production for sustainable development.
REFERENCES [1] Balino, Design Pelton Bucket Runner.
<http://www.balino.com/ingles/turbinas/pelton.htm> viewed on 6 October 2012
[2] Development book shop, Micro-hydro Pelton Turbine Manual<http://developmentbookshop.com/product_info.php?products_id=441> viewed on 13 sept 2012
[3] Greenstone, Community Development Library, Pelton Turbine <http://www.greenstone.org/greenstone3/nzdl%3Bjsessionid=0f.9.pp&sib=1&p.s=ClassifierBrowse&p.sa=&p.a=b> viewed on 6 October 2012
[4] HARC, Turbines <http://files.harc.edu/Documents/EBS/CEDP/HydropowerPart2.pdf>viewed on 1 November 2012
[5] Hydropower ( 2012), Axco Generators for hydropower applications<http://www.axcomotors.com/hydropower_generator.html> viewed on 16 September 2012
[6] John F Douglas, Janus M Gasiorek, John A Swaffied, Lynn B Jack ( 2005). Fifth edition. Fluid Mechanics
[7] R.K. Bansal ( 2005). A textbook of fluid mechanics and hydraulic machines: (in S.I. units)
[8] Akvopedia. <http://akvopedia.org/wiki/Micro_hydropower > viewed on 17 July 2013
[9] Sustainable Green Homes <http://eco.allpurposeguru.com/2013/09/micro-hydropower-another-renewable-energy-source/> viewed on 17 July 2013
[10] Free flow Hydro www.freeflowhydro.co.uk/13/ 24/CINK/CINK.htmlViewed on 16 July 2013
[11] Fundamental form http://www.fundamentalform.com/html/francis_turbine.html Viewed on 16 July 2013
World Academy of Science, Engineering and Technology 83 2013
1061