Impacts of Climate Change on Settlements in the … Imapats of...Impacts of Climate Change in the...
195
Impacts of Climate Change on Settlements in the Western Port Region Impacts of Climate Change on Settlements in the Western Port Region People, Property and Places Final Report: June 2008 People, Property and Places Final Report: June 2008 Printed on recycled stock.
Transcript of Impacts of Climate Change on Settlements in the … Imapats of...Impacts of Climate Change in the...

Impacts of Climate Change on Settlements in the Western Port Region
Impacts of Climate Change on Settlements in the Western Port Region
People, Property and Places Final Report: June 2008
People, Property and Places Final Report: June 2008
Printed on recycled stock.

AUTHORS : Peter Kinrade* and Benjamin Preston** With assistance from:
Ian Macadam**, Tim Fisher*, Kym Whiteoak*, Nadja Wiedemann* and Sarah Mirams
* Marsden Jacob Associates ** CSIRO Climate Adaptation Flagship Acknowledgements Project funding provided by: Australian Government, Department of Climate Change Department of Sustainability and Environment, Victoria The authors wish to acknowledge valuable information and feedback provided by the following project steering committee and reference panel members: Western Port Greenhouse Alliance / Net Balance Foundation Michelle Justus Western Port Greenhouse Alliance Greg Hunt Australian Government, Department of Climate Change Tharman Saverimuttu, Crystal
Baker Department of Sustainability and Environment Jennifer Cane, Cathy Ronalds,
Jack Krohn Bass Coast Shire Council Paul Smith, Shaun Young
Cardinia Shire Council Ian Stevenson City of Casey Sonia Rappell, David Westlake,
Michael Jansen Frankston City Council Libby Anthony, Sian Jones,
Ossie Martinz Mornington Peninsula Shire Council Rolf Freeman, Barry Pankhurst Building Commission Dennis Hogan, Rob Enker Central Coastal Board Jacquie Mc Leod Department of Justice, Office of the Emergency Services Commissioner
Brian Hine, Loriana Bethune
Department of Human Services Brian Kirkby, Noel Cleaves Department of Infrastructure Marianne Richards Department of Planning and Community Development Fiona McKenzie DLA Phillips Fox Kim Piskuric Melbourne Water Mark Warren, Gerard Thurbon Port of Hastings Corporation Ralph Kenyon South East Water Gordon Logan CONTACT : Peter Kinrade [email protected] Benjamin Preston [email protected]

TABLE OF CONTENTS EXECUTIVE SUMMARY ..................................................................................................................I
1. INTRODUCTION....................................................................................................................1
2. PROFILE OF THE WESTERN PORT REGION..................................................................11
3. IMPACTS ASSOCIATED WITH COASTAL INUNDATION................................................29
4. IMPACTS ASSOCIATED WITH INTENSE RAINFALL AND INLAND FLOODING...........67
5. IMPACTS ASSOCIATED WITH CHANGES TO FIRE WEATHER CONDITIONS...........101
6. IMPACTS ASSOCIATED WITH CHANGES TO AVERAGE AND EXTREME TEMPERATURES .............................................................................................................125
7. IMPACTS ASSOCIATED WITH CHANGES TO AVERAGE RAINFALL.........................137
8. REVIEW OF IMPACTS AND EXAMINATION OF CROSS SECTORAL ISSUES ...........147
REFERENCES.............................................................................................................................166
ABBREVIATIONS........................................................................................................................175
APPENDICES: OVERVIEW OF CLIMATE CHANGE IMPACTS IN THE WESTERN PORT REGION BY LOCAL GOVERNMENT AREA..............................................................................177

Impacts of Climate Change in the Western Port Region
Final Report i
EXECUTIVE SUMMARY
Introduction
1. Since the mid-19th century, the average temperature at the Earth’s surface has increased by approximately 0.7°C (IPCC, 2007a). This warming is “very likely due to the combined influences of greenhouse gas increases and stratospheric ozone depletion (IPCC, 2007a).”
2. While much focus has traditionally been placed on building scientific understanding of such global changes in climate and their attribution, increasing attention is now focused on how communities, enterprises and governments should respond. This necessitates building understanding about the local-scale implications of climate change that can be used to guide adaptive decision-making.
3. This report examines the nature and extent of potential impacts of climate change to the Western Port region of Victoria. The report’s focus is on the impacts of climate change on the built environment, the social and economic implications of the impacts and the vulnerability of different localities and groups. It is one part of a wider ‘integrated assessment’ of climate change in the region that covers:
− regional climate changes and biophysical impacts; − socio-economic and infrastructure impacts (this report); − risk assessment; and − adaptation response.
4. The Western Port region is well suited to a study of the impacts of climate change on human settlements - it has a large, diverse and growing population and a number of key implications of climate change are pertinent to the region including coastal and inland flooding, wildfires and drought.
5. In using this report it is important to be mindful of a range of uncertainties and limitations associated with the various analyses of exposure and impacts.
Profile of the Western Port region 6. The Western Port region, which encompasses the local government areas of
Bass Coast, Cardinia, Casey, Frankston and Mornington Peninsula Shire, has a coastal climate with relatively mild temperatures and high rainfall compared to other parts of Victoria.
7. The region is comprised of a diverse economy and demography consisting of key residential hubs for metropolitan Melbourne, as well as thriving business and industrial sectors. The region’s population is projected to grow by approximately 45% by 2031, presenting many opportunities for economic expansion and diversification, but also increasing the exposure of people, buildings and infrastructure to climate variability and change.
8. Temperatures in the Western Port region have risen by approximately 0.05°C to 0.15°C per decade since 1970, while annual rainfall has declined by approximately 50 mm per decade.
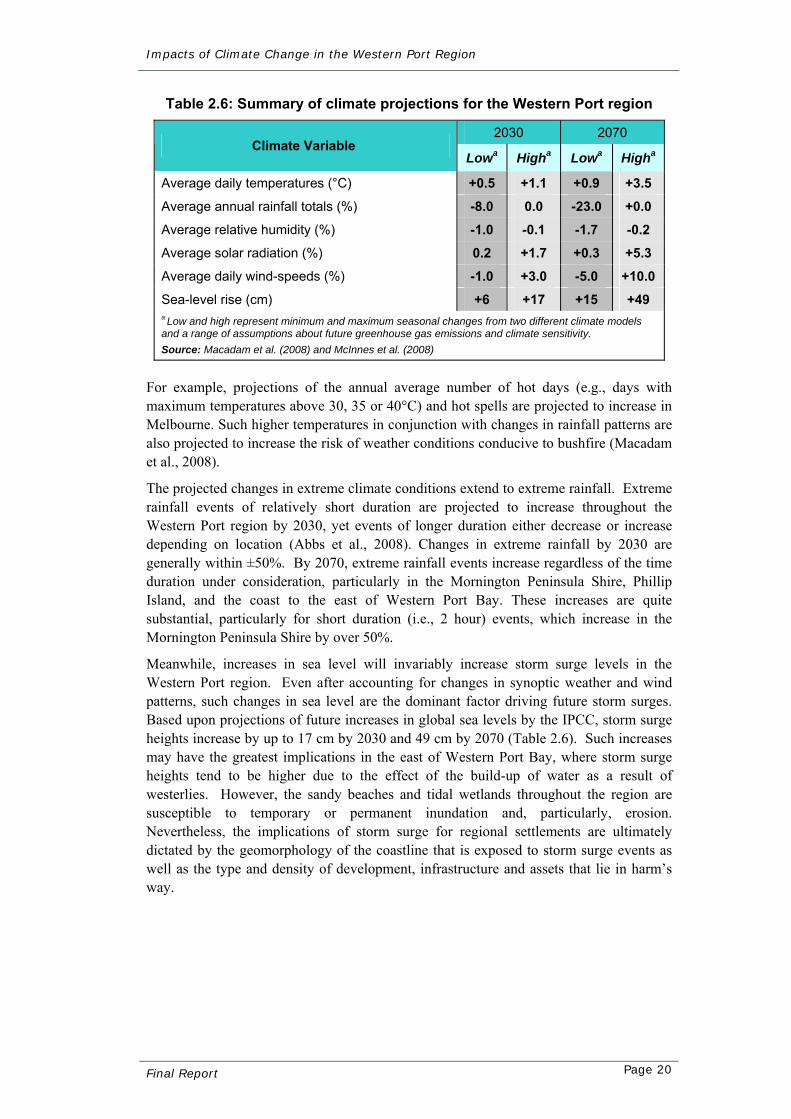
9. Climate models suggest temperatures in the region will increase by 0.5 to 1.1°C by 2030 and 0.9 to 3.5°C by 2070, while average annual rainfall will

Impacts of Climate Change in the Western Port Region
Final Report ii
change by -4 to 0% by 2030 and -23 to 0% by 2070. Meanwhile, sea-level rise projections are uncertain, but the IPCC has estimated a range of 6 to 17 cm by 2030 and 15 to 49 cm by 2070, with the potential for additional sea level contributions from acceleration of glacial ice melt.
10. While these represent some of the projected changes in average climate conditions, climate extremes are projected to change as well, and it should be recognised that it is the changes in such extremes that are likely to pose the most significant threat to the region’s environments, infrastructure and communities in the years ahead.
11. The Western Port region is significantly exposed to climate extremes and natural hazards such as storm surge and coastal inundation, floods, bushfires and extreme temperatures. These hazards are projected to increase in frequency and/or severity.
12. Increased frequency or severity of climate hazards are projected to have a broad range of direct impacts on urban settlements (both market and non market). These include impacts on land use and management, damages and maintenance costs to public and private property and infrastructure, human health and water availability. Increases in natural hazards will also have indirect and intangible consequences including disruptions to economic activity, the costs of emergency service provision, public amenity and quality of life.
13. Some of these impacts will be pervasive throughout the region; for others the extent of impact will be situation specific depending upon the spatial distribution of hazards and human assets, populations and infrastructure across the region and in local government areas.
14. Specific climate consequences for the region’s settlements are outlined in Table A and discussed in more detail below.
Impacts associated with coastal inundation
15. Sea-level rise in future decades will undoubtedly affect the coastlines of the Western Port region and drive progressive erosion in many locations. The effects of sea-level rise will however be most pronounced during storm events. For example, storm surge inundation simulations for the region, undertaken by CSIRO for this assessment, suggest that a current 1 in 100 year storm surge could become a 1 in 1 to 1 in 4 year storm surge by 2070.
16. Furthermore, the land area subject to inundation during a 1 in a 100 year storm surge event may increase by 4 to 15% by 2030 and 16 to 63% by 2070.
17. The fact that only a narrow strip of land is exposed to coastal processes such as storm surge means that the exposure of associated property, populations and infrastructure is inherently constrained. Nevertheless, such inundation would impinge upon over 2,000 individuals, over 1,000 dwellings, and approximately $780 million in improved property value.
18. Public infrastructure is also at risk, including major thoroughfares such as the Nepean and South Gippsland Highways, and boating facilities. Beaches, foreshore reserves and coastal wetland areas throughout the region, as well as the amenities they provide, are likely to be affected as well.

Impacts of Climate Change in the Western Port Region
Final Report iii
Table A: Overview of Climate Change Impacts in the Western Port Region
Climate variable Indicative change* Exposed people and land**
Exposed property and infrastructure** Most sensitive locations
Economic and social impacts
Vulnerable sectors
Vulnerable groups
Sea level rise / storm surge (Chapter 3) 2030 2070
Sea level rise ↑ up to 0.17 m
↑ up to 0.49 m
Storm tide – max. height, 1:100 year ARI (current 2.10 m, Cowes) 2.29 m 2.74 m
Storm tide – max. height, 1:100 year ARI (current 1.16 m, Frankston)
1.37 m 1.80 m
Storm surge – change to 1:100 year ARI
↓ to 1:40 - 1:6
↓ to 1:20 - 1:1
Inundation area Western Port Bay (1:100 year storm surge)
up to 12.6 sq km
up to 17.7 sq km
Inundation area Port Phillip Bay*** (1:100 year storm surge)
up to 1.1 sq km
up to 1.6 sq km
up to 2,270 people directly exposed
due to coarse resolution of topographic data, people and properties exposed to inundation may be understated, especially along Port Phillip Bay coastline
~1,030 residential properties
~60 commercial and other properties
most beaches, coastal wetlands and foreshore reserves
most boating facilities ~ 87km of roads some drainage
infrastructure water and sewer mains in
Bass Coast, Casey and MPS
Bass Coast: Cowes, Rhyll, Cape Woolamai Bass River Grantville, Coronet Bay possibly in vicinity of Inverloch
Cardinia: no major settlements
Casey: Tooradin, Warneet
Frankston City: most of central and northern foreshore Kananook Creek and surrounds, including
possibly Frankston CAD and Seaford wetlands and surrounds
Mornington Peninsula Shire: Crib Point, Hastings, Shoreham and Stony
Point (Western Port Bay) possibly Balcombe Creek, Dromana Bay,
Safety Beach, Dunns Creek, West Rosebud (Port Phillip Bay)
partial or (in worst case) complete loss of land values in affected areas
major amenity impacts associated with damage to beaches and foreshore reserves
impacts on businesses dependent on beach related tourism
increased insurance costs or lack of access to insurance
costs associated with beach and foreshore maintenance (e.g. beach renourishment)
tourism recreation and
boating local government
low income households
elderly households
Extreme rainfall (Chapter 4)
2030 2070
2 hour ↑ 15-25 % ↑ 20-70 %
12 hour ↑ 3-22 % ↑ 17-61 %
24 hour ↓2 - ↑17 % ↑ 16-50 %
72 hour ↓ 2-16 % ↑ 19-48 %
Maximum flood heights ↑ ↑
Flood return intervals (ARI) ↓ flash
↔ riverine
↓ flash
↓ riverine
up to 39,480 people up to 580 km2 of land
~13,390 residential properties( incl. rural), (~3,200 dwellings)
~2,050 commercial, industrial and other properties
public infrastructure including schools, health care facilities, halls
reserves and parks ~1,412 km of roads, 26
bridges extensive drainage
infrastructure water and sewer mains
and sewer pump stations railway lines
Bass Coast: Bass River flood plain
Cardinia: all of southern section of Shire / Koo Wee
Rup Swamp Casey: much of eastern and southern sections of city significant pockets around Hallam, Narre
Warren, Berwick (e.g. Hallam Main drain) and Cranbourne
Frankston: most of central and northern coastal
hinterland Frankston CAD Seaford wetlands and surrounds
Mornington Peninsula Shire: Crib Point, Hastings, Shoreham and Stony
Point
increased flood damage to public infrastructure, especially roads and bridges
increased flood damage costs to residential and commercial buildings (minimal)
disruption to transport increased emergency services
demand and costs lost agricultural production health impacts related to
disruption of water and sewerage services
stress and social disruption
local government transport rural / agriculture residential and
commercial utilities (drainage) emergency
services
low income households
businesses and properties without adequate insurance
residences with limited freeboard above 1:100 year flood (e.g. <300 mm clearance)
properties not adequately prepared or maintained
Windiness and storms (Chapter 4, Box 3)
2030 2070
Extreme winds ↓1 - ↑5 % ↓3 - ↑14 %
entire population
older buildings electricity &
telecommunications infrastructure
parks and gardens
exposed coastal and elevated areas
increased damage costs to residential, commercial and public buildings
increased emergency service costs
disruptions to electricity supply
emergency services
electricity and telecommunications
residents in low quality housing
properties with large trees
* Key to climate changes: ↑ increase; ↓ decrease; ↔ no significant change. Absence of number next to arrow indicates magnitude of change has not been quantified. ** Based on current (2006) population and projected changes to 2070. *** Subject to considerable uncertainty.

Impacts of Climate Change in the Western Port Region
Final Report iv
Climate variable Indicative change* Exposed people and land**
Exposed property and infrastructure** Most sensitive locations
Economic and social impacts
Vulnerable sectors
Vulnerable groups
Fire weather (Chapter 5)
2030 2050
No. of very high and extreme forest fire risk days (~ 9-12 days current)
↑ 1 - 2 ↑ 2 - 7
No. of very high and extreme grass fire risk days (~ 95 days current)
↑ 7 - 15 ↑ 9 - 30
up to 73,620 people, mostly adjacent to bushland
up to 468 km2 of land
28,443 residential properties (incl. rural)
459 commercial and industrial
5,301 public use and unspecified including schools, medical facilities, reserves and parks
1,621 km of roads and 49 km of rails
Bass Coast: Phillip Island around Cowes and Rhyll a large area in the north of the shire to the
east and south of Grantville north and south of Wonthaggi
Cardinia: bushland settlements in urban rural fringe
including Emerald, Cockatoo, Gembrook, Upper Pakenham, Upper Beaconsfield
Casey: limited areas, principally bushland
settlements in urban rural fringe around Narre Warren North & East
Frankston: central areas around Langwarrin southern boundary around Frankston South,
Langwarrin South Mornington Peninsula Shire: urban fringe, semi-rural and rural areas
scattered throughout Shire, especially bushland and adjacent areas
increased damage costs to residential properties
health impacts including loss of life and air quality
increased emergency service costs
stress, social disruption
residential emergency
services local government transport
people living in older housing (in exposed areas)
properties that have not been adequately prepared
low income households
Average and extreme temperatures (Chapter 6)
2030 2070
Average annual temperature ↑ 0.5-1.3°C ↑ 1-3.5°C
Days per yr > 30 °C (30 current) ↑ 2 - 5 ↑ 14 - 17
Days per yr > 35 °C (7 current) ↑ 1 - 3 ↑ 3 - 7
Days per yr > 40 °C (1 current) ↑ 1 - 2 ↑ 2 - 5
Runs of 3-5 days > 30 °C (3 current)
↑ 1 - 2 ↑ 2 - 4
entire population, especially 70,600 elderly and 38,700 infants
most roads most railways lines some building materials buildings or services that
require cooling
inland areas (particularly urban) areas with high concentrations of elderly and
increased mortality and morbidity in vulnerable groups
increased infrastructure maintenance costs
disruptions to transport networks increased risk of food and water
born disease outbreaks increased summer peak demand increased cooling costs
transport construction local government
services such as child care, environmental health
elderly infants residents in
low quality housing (e.g. rental) or low income households
Average rainfall (Chapter 7)
2030 2070
Average annual ↓ 0-8 % ↓ 0-23 %
Catchment stream flows (worst case) ↓ 25 % ↓ >50 %
Droughts ↑ frequency & severity
entire population
municipal parks and gardens
playing fields water & wastewater
infrastructure other infrastructure on
clay soils
areas not connected to mains supply high water requirement sites wetlands, heritage gardens and other
reserves
increased water prices increased reliance on non-
traditional supply sources access to water for some
activities (possibly) viability of some water dependent
businesses and activities increased maintenance costs,
some infrastructure
nurseries, garden services, etc
local government services such as parks, recreation
water suppliers and retailers
households
not connected to mains supply
low income households (possibly)
* Key to climate changes: ↑ increase; ↓ decrease; ↔ no significant change. Absence of number next to arrow indicates magnitude of change has not been quantified. ** Based on current (2006) population and projected changes to 2070. *** Subject to considerable uncertainty.

Impacts of Climate Change in the Western Port Region
Final Report v
19. In the absence of adaptation measures, the economic and social consequences to of impacts to the region’s beaches and foreshore areas could be substantial. These include disruptions to the region’s tourism industry and a major loss of social, cultural and environmental amenity values.
20. Areas most at risk include townships on Phillip Island in Bass Coast Shire, coastal townships in the City of Casey including Tooradin and Warneet, and the township of Hastings in Mornington Peninsula Shire.
Impacts associated with intense rainfall and inland flooding
21. Flood events typically represent the most costly type of disaster in Australia, contributing to property damage and disruption of services and businesses as well as injury and death. At least 619 km2 (18%) of the Western Port region lie in land areas subject to inundation or overland flow paths. This highlights the present risk the region faces in regard to flood hazard, typified by the Koo-Wee-Rup ‘Super Flood’ of 1934.
22. While significant advancements in flood protection have been made over the past century, future climate change poses an additional challenge. Simulations of extreme rainfall in 2030 suggest increases of up to 25% in extreme rainfall from events of 1 to 24 hours in duration in at-risk areas of Western Port region. By 2070, extreme rainfall is projected to increase by up to 70%, depending on location. Such increases in extreme rainfall could drive increases in the frequency or magnitude of flood events or flood heights.
23. Flood mapping in the region is an ongoing process, with some flood prone areas still to be mapped. Based on current information though, an estimated 18,000 properties with a total capital improved value of almost $2 billion are vulnerable to flood events. Approximately 13,000 of the properties are residential, about 40% of which contain dwellings that are vulnerable to above-floor flooding.
24. Despite the total value of assets in harm’s way, the potential implications of climate change for above-floor flooding suggests that increases in the magnitude of damages to residential and commercial properties from changing rainfall extremes may be relatively modest. However, there could well be a significant increase in the frequency of any given flood event and associated damage costs.
25. A range of Melbourne’s and the State’s major transport corridors also occur in at-risk areas including over 1,500 km of roads and 125 km of rail, and dozens of bridges. A range of businesses, industries, public services and utilities are also vulnerable to disruptions from flooding. Indirect economic costs associated with flooding of this infrastructure could be significant relative to direct damages.
26. Areas most at risk include much of southern Cardinia Shire (the Koo-Wee-Rup Swamp), southeast and central Casey, northwest Frankston and the Frankston Central Activity District (CAD).

Impacts of Climate Change in the Western Port Region
Final Report vi
Impacts associated with changes to fire weather conditions
27. Bushfires are a major economic, social and environmental hazard in Southeast Australia. The 1983 Ash Wednesday bushfires represents one of the worst bushfire events in the Victoria’s history, with communities in the present Cardinia Shire being amongst the worst affected.
28. Recent studies have confirmed a trend toward worsening fire weather conditions in southeast Australia in recent decades, and projections of a warmer and drier future climate translate into even greater risk in the future. Modelling of forest fire risk at locations in proximity to the Western Port region indicate the number of days of ‘very high’ or ‘extreme’ forest fire risk will increase by 1 to 2 days by 2030 and by 2 to 7 days by 2050, a potential increase of 60% or more.
29. At present, an estimated 710 km2 (21%) of the Western Port region are in bushfire prone areas. Given the current distribution of property, people and infrastructure, over 73,000 individuals, approximately 35,000 properties (including 28,000 dwellings), with a capital improved value of $7.6 billion lie in at-risk areas.
30. A range of major transport corridors also occur in at-risk areas including over 1,600 km of roads and 75 km of rail, including the Nepean, South Gippsland, and Bass Highways as well as heavily travelled rail lines. Electricity transmission lines from the Latrobe Valley that traverse the Western Port region and provide electricity to Melbourne and Gippsland are also exposed to bushfire in multiple locations.
31. Overall, those areas most at risk include the Gurdies in Bass Coast Sire, much of northern Cardinia including the townships of Emerald, Cockatoo and Gembrook, central and southeast Frankston and bushland areas in Mornington Peninsula Shire, particularly around the townships of Dromana and Mornington as well as around HMAS Cerberus.
Impacts associated with changes to average and extreme temperatures
32. Extreme heat events represent one of the leading causes of climate-related mortality in the developed world, even in coastal locations that often benefit from milder climates than inland areas. With temperatures projected to rise from climate change, the increased incidence of extreme heat days and heat waves, in conjunction with a growing and aging population, is projected to contribute to significant mortality in future decades. These are likely to outweigh reductions in winter mortality in response to increases in temperatures.
33. At least one study suggests the heat-related annual death rate among people 65 and older in the Melbourne region would increase from 289 at present to 484 to 636 by 2100. On a proportional basis (but not allowing for local differences in climate and/or physiological differences between the population groups), the number of additional deaths in the region, among this group due to heat stress, could be approximately 30 to 53 annually by 2100.
34. While the occurrence of extreme temperature events may be similar throughout the Western Port region, different areas and populations may be

Impacts of Climate Change in the Western Port Region
Final Report vii
more or less vulnerable based upon the age distribution of the population, type of housing and access to climate control.
35. Elderly people (>65 years of age) are likely to be the most vulnerable group in the community to extreme temperatures. Significant concentrations of elderly occur in Bass Coast and on the Port Phillip Bay coastline of Mornington Peninsula Shire.
36. Higher temperatures in both summer and winter will also affect energy use. Greater demands for air conditioning to maintain building thermal comfort, for example, is likely to drive increased electricity consumption during summer months. Meanwhile, energy demand during the winter may decline.
37. The economic implications of changes to energy use patterns may vary depending upon how electricity is priced – a characteristic that is likely to change in the future based upon the balance of supply and demand. While new buildings built to ‘5 Star’ energy efficiency ratings may be able to manage temperature increases with little increased cost, these represent a small fraction of the region’s housing stock at present.
Impacts associated with changes to average rainfall
38. Average rainfall in the Western Port region is projected to decline by up to 8% in 2030 and 23% by 2070, with reductions potentially coming in all seasons but especially in winter and spring. Drought frequency and intensity are projected to increase.
39. Streamflows in the Bunyip River and South Gippsland basins and in Melbourne Water’s catchments, from where most of the region’s water is sourced, are projected to decline, perhaps substantially. This has major implications for the region’s water supply / demand balance.
40. The nature and level of regional economic and social impacts to changes in the water supply / demand balance are expected to depend on government policy response. It is likely though, that all water users in the region will face significantly higher water prices in the future.
41. Reduced average rainfall and reduced streamflow will also adversely impact on ecological, amenity and recreational values in the region. Values impacted are likely to include: waterway, wetland and coastal estuarine health; the viability and/or cost of maintaining domestic gardens and municipal gardens, parks and sporting fields; and streetscapes.
42. Some of the region’s infrastructure exposed to drying soils will be vulnerable to increased degradation or structural failure.
Cross sectoral issues
Groups vulnerable to the impacts of climate change
43. Low income earners and the elderly are especially vulnerable to the impacts of climate change in the region.
44. Assessment of exposure of these groups to coastal inundation, flooding and bushfires suggests that low income earners are over represented in many of

Impacts of Climate Change in the Western Port Region
Final Report viii
the localities exposed to coastal inundation but not so much in the localities exposed to floods and bushfires.
45. Elderly residents, on the other hand, are over represented in most localities exposed to coastal inundation and also in many of the localities exposed to floods and bushfires.
46. As previously noted, elderly residents throughout the region are particularly vulnerable to an increase in extreme temperatures.
Land use planning
47. Climate change in the Western Port region presents particular challenges for future land use planning and decision-making. In particular, climate change adds to the imperative for efficient use of this land and careful monitoring of growth in Casey-Cardinia corridor, since much of the land designated for growth is exposed to either flooding or bushfires.
48. Climate change also adds to the complexity of land use planning decisions associated with population growth and development along the region’s coastline and in rural and semi-rural (Green Wedge) areas, since much of it will occur in areas exposed to coastal inundation, flooding or bushfires.
49. These challenges need to be considered in the context of the current planning and policy environment in Victoria including the proposed review of the Planning and Environment Act 1987.
Emergency management and volunteer support
50. Climate change poses significant challenges for emergency service planners and providers in the Western Port region including the SES, CFA and the Victorian Ambulance Service. Although those bodies already have comprehensive emergency management planning arrangements in place at the regional and sub-regional levels, plans may need to be reviewed in anticipation of more frequent or extreme weather events.
51. Local councils in the Western Port region also have an important role in emergency management and to that end have in place comprehensive municipal emergency management plans. However, the increased frequency and/or intensity of natural disasters due to climate change could add additional cost burdens on councils’ emergency management role.
52. The cumulative effects of more frequent and/or more severe extreme weather events also poses significant challenges for resourcing of volunteer and community groups in the region, highlighting the importance of strengthening the capacity of community groups and volunteer organizations to respond to climate change.
Local government financial impacts
53. Generally speaking, climate change could have substantial implications for council finances and, particularly, the allocation of financial resources to various operational activities and services.
54. A preliminary review of capital and operating expenditure by local councils in the Western Port region indicates that approximately 19% of council’s annual expenditure can be classified as being directly ‘climate exposed’, with this
Impacts of Climate Change in the Western Port Region
Final Report ix
expenditure consisting of capital and maintenance expenditure on roads, drains, open space and buildings. In addition, there are a range of council expenditures that are indirectly exposed to climate events and climate change, including emergency management, health and aged care.
Opportunities from climate change
55. Climate change in the Western Port region is likely to create many opportunities, some region wide and some specific to particular industries or groups. Some of these opportunities will stem from responses to the impacts of climate change discussed in earlier chapters (e.g. improved housing design), while others will flow from favourable climate changes (e.g. tourism and recreation opportunities due to higher average temperatures and/or reduced rainfall).
Research needs
56. This report represents one preliminary step in a long-term process of adaptation among the communities of the Western Port region. Building upon this assessment to enhance specificity and clarify uncertainties in regional impacts will require the acquisition of more robust data sets, more detailed assessments of smaller subregions or a more constrained suite of climate changes and hazards.
57. In particular, research could be profitably targeted at specific at-risk locations in the region, for example, to conduct more rigorous hydrological modelling of extreme rainfall and flood risk as well as the effects of sea-level rise, storm surges and waves on both coastal erosion and inundation. Similarly, more robust spatial modelling of fire risk or vulnerability to extreme heat events could also be conducted.
58. To maximise the utility of such work for adaptive decision-making regarding climate change, such modelling should also seek to incorporate plausible scenarios of changes in population, land use, building stocks, economic activity and environmental management.
Impacts of Climate Change in the Western Port Region
Final Report Page 1
1. INTRODUCTION
1.1. The Western Port Integrated Assessment Project Climate change is emerging as a vital issue for Australian communities. Even with international action to reduce greenhouse gas emissions, the global climate is projected to undergo significant change in the 21st century, with the potential to create many risks as well as opportunities.
It is important that the impacts of climate change are addressed at regional and local levels, since local attributes including socio-economic characteristics and the physical environment will significantly determine the extent of the risks and opportunities, as well as the nature of community responses.
Impacts of Climate Change on Human Settlements in the Western Port Region: An Integrated Assessment (referred to hereafter as the Western Port Climate Change Integrated Assessment) is a two year project examining climate change impacts on the region’s built environment and communities as well as local adaptation responses to those impacts. The project was funded by the Commonwealth Department of Climate Change through its Human Settlements sub-programme and the Department of Sustainability and Environment (Victoria) and co-managed by Marsden Jacob Associates and the Western Port Greenhouse Alliance.
The project builds on and extends The Climate Change Impacts and Adaptation in Western Port scoping study, initiated in 2005 by the WPGA and funded by the Victorian Department of Sustainability and Environment. The scoping study established that climate change is an emerging issue for the Western Port community. It pinpointed eight priority issues for responding to climate change in the region, five of which are directly relevant to the impacts of climate change on the region’s settlements. It also identified the need for more detailed regional information on the potential impacts of climate change, as well as an understanding of processes that could assist local decision-making on the issue.1
The Western Port Climate Change Integrated Assessment is one of a small number of climate change ‘integrated assessment’ projects recently undertaken in Australia. Notwithstanding a growing body of international climate change adaptation and integrated assessment literature, there is currently no widely accepted definition of an integrated assessment.
For the purpose of this project, we have defined integrated assessment of climate change as:
a study that integrates biophysical, social and economic understanding of the climate change issue with effective community decision-making.
Given this definition, the primary objective of the Western Port Climate Change Integrated Assessment was to improve understanding of the scientific, economic and social impacts of climate change in the Western Region in order to:
1 Outputs of the scoping study can be sourced at: http://www.wpga.org.au/

Impacts of Climate Change in the Western Port Region
Final Report Page 2
enhance the capacity and knowledge of local governments and other decision-makers in the region to prepare for and adapt to climate change; and
develop an approach to climate change assessment and adaptation that has transferability to other regions in Australia.
The Western Port Climate Change Integrated Assessment project consists of four major phases (Figure 1.1).
Figure 1.1: Major phases of the Western Port climate change integrated assessment
1. The first phase entailed projecting changes to key climate drivers and associated biophysical impacts in the region. Changes examined include extreme sea level, extreme winds and average and extreme rainfall, as well as average temperature, humidity, solar radiation and fire weather. Outputs of this phase are provided in three biophysical impacts reports.2
2. The second phase, which is the subject of this report, involved an examination of the nature and extent of potential impacts to the region’s built environment (land, housing and public and private infrastructure) as well as an assessment of the social and economic implications of the impacts and the vulnerability of different localities and groups.
3. The third phase entailed identifying and prioritising risks to local governments associated with the impacts. A series of risk assessments were undertaken with each of the region’s local councils.
2 The biophysical impacts reports are: Abbs and Rafter (2008); Macadam and Ricketts (2008); and McInnes et al. (2008).
Risks to Local Communities(Phase 3)
Changes in Regional Climate(Phase 1)
Biophysical Impacts
Infrastructure & Socioeconomic Impacts(Phase 2)
Adaptation Response(Phase 4)
Stakeholder Engagement
Evaluation

Impacts of Climate Change in the Western Port Region
Final Report Page 3
4. In the final phase, adaptation options and barriers to effective response to the high priority risks were explored with local councils, state government and other key regional decision makers.
Stakeholder engagement and project evaluation were important aspects of all project phases.
1.2. Project Framework
1.2.1. Scope of Report
The Western Port Climate Change Integrated Assessment project, and by implication this report, focuses on the impacts of climate change on human settlements in the Western Port region of Victoria.
A description of the region and a rationale for selecting it for this study are provided in the following chapter.
Because the focus of the study is on human settlements, some issues and localities within the region are examined only in passing or not at all. They include:
national parks, reserves and other natural areas (except where they fall within the boundaries of the region’s settlements or are otherwise strongly pertinent to the local communities);
biodiversity; and
farmland and primary industries.
A major focus of this project is on building the capacity of local governments to respond to the impacts of climate change. For that reason, particular emphasis in the report is given to assessing the impacts of climate change on people, infrastructure and resources for which local councils have some planning, management or service responsibility, although other infrastructure and resources important to the well-being and effective functioning of local communities are also examined.
Climate change impacts considered in this report are based on climate change projections for 2030 and 2070. These timeframes have been selected because:
they are consistent with the long term strategic planning horizons of most organisations (2030) or the life expectancy of major infrastructure and assets (2070);
they are the most commonly used periods for Australian climate change projections (e.g. CSIRO 2007).

Impacts of Climate Change in the Western Port Region
Final Report Page 4
Box 1.1. Guidance for Using This Report
A. Structure of This Report
This report presents the findings of Phase 2 of the Western Port Climate Change Integrated Assessment project. Infrastructure, social and economic impacts of climate change are assessed and presented in two different formats. The main body of the report examines and presents the impacts of climate change in terms of key biophysical variables - storm surge, flooding, wildfires, etc. It is structured as follows:
• Chapter 2 provides a profile of the Western Port region - its people, economy, infrastructure and local governance - and discusses, in broad terms, how the region is exposed to projected climate changes.
• Chapter 3 examines the impacts of coastal inundation associated with sea level rise and storm surge. It identifies the localities, people and infrastructure exposed to future temporary or permanent inundation and discusses the potential economic, financial and social implications of those exposures.
• Chapter 4 examines the impacts associated with intense rainfall and inland flooding. As in Chapter 3, it identifies the localities, people and infrastructure exposed to future flooding and flash flooding and discusses the potential economic, financial and social implications of those exposures.
• Chapter 5 examines the impacts associated with wildfires. Again, the localities, people and infrastructure exposed to wildfires are identified and the potential economic, financial and social implications of the exposures are discussed.
• Chapter 6 examines the impacts associated with projected changes to extreme temperatures. Because exposure to these variables cannot be differentiated by location, examination of associated impacts principally takes the form of qualitative discussions of economic and social issues.
• Chapter 7 examines the impacts associated with projected changes to average rainfall, focussing in particular on water supply and demand.
• Finally, in Chapter 8 the findings detailed in the earlier chapters are pulled together to present a summary of municipalities, people and infrastructure in the Western Port Region most vulnerable to the impacts of climate change. Policy and planning issues relevant to the impacts are then discussed.
In addition to the main report, a series of appendices are used to present regional impacts of climate change in an alternative format – in terms of the infrastructure, social and economic impacts of climate change for each of the five local government areas (LGAs) in the region. Most of the information in the appendices is taken from the main body of the report but in some cases discussion has been enhanced with data specific to each LGA.
B. Approaches to Spatial Analysis of Climate Exposure
In the assessment of the potential impacts of climate change, this report relies upon the analysis of the spatial distribution of climate hazards (both present and future) and their overlap with assets and infrastructure of regional value. At present, there is already a risk associated with climate variability such as storm surges, flooding and drought, bushfire or extreme heat. While climate change is anticipated to exacerbate or enhance such events and their downstream consequences, this enhanced risk may occur in a range of different ways:

Impacts of Climate Change in the Western Port Region
Final Report Page 5
• Increase in the frequency/duration of an event or impact – climate hazards and impacts occur more frequently or persist for a longer period of time than would normally be expected based upon historical climate conditions.
• Increase in the intensity or magnitude of an event or impact – climate hazards and impacts are more severe than would normally be expected based upon historical climate conditions.
• Change in the spatial distribution of an event or impact – climate hazards and impacts arise in or expand into areas that would normally not be exposed based upon historical climate conditions.
Quite often, projected consequences of climate change demonstrate a combination of the above characteristics. For example, sea-level rise is likely to cause storm surges to be higher (i.e., more intense), leading to shorter return intervals for a given surge height (i.e., more frequent), and are likely to penetrate further inland (i.e., changing spatial distribution). In assessing potential impacts of climate change to the Western Port region, different characteristics were examined based upon the impact under consideration (Table 1.1), and the information available. This has important implications for this report. In particular, for those impacts where the spatial distribution of exposure was assumed to remain the same into the future, it is difficult to quantitatively estimate how impacts may change over time. Instead, the assessment is restricted to estimates of infrastructure and assets currently exposed with the assumption that damages will rise in the future due to greater frequency or intensity of events and/or greater number of assets in harm’s way.
Table 1.1: Descriptions of various ways in which climate change impacts were quantified in this report.
Biophysical Impact Criteria for Socio-economic Impact Assessment
Sea-level Rise/Storm Surge (Chapter 3)
Increase in the spatial distribution of storm-surge inundation in response to future sea-level rise. Increase in frequency of storm-surge inundation within existing areas subject to inundation.
Flooding (Chapter 4) Increase in the intensity of extreme rainfall within existing land areas subject to inundation.
Bushfire (Chapter 5) Increase in the frequency and intensity of bushfire events within existing bushfire prone areas.
Extreme Temperatures (Chapter 6) Increase in the frequency and intensity of extreme heat events.
Average Rainfall (Chapter 7) Reduction in the magnitude of annual rainfall and water availability.
C. Methods for Estimating Socio-Economic Costs
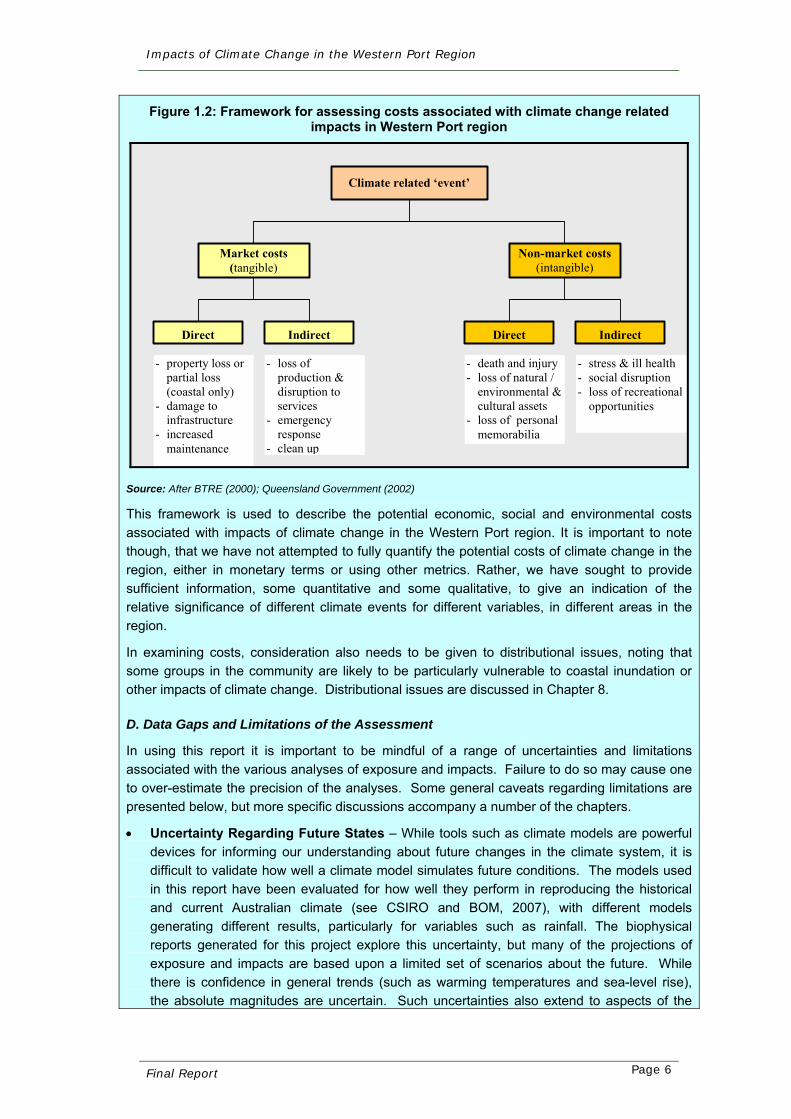
An economic framework is often employed to calculate costs arising from natural disasters (Handmer, 2003; Middlemann, 2007). The framework, outlined in Figure 1.2, categorises the costs of natural hazards into market (tangible) and non-market (intangible) costs. These costs are described in turn in terms of direct and indirect costs. Direct costs are the consequence of the initial disaster event and will be felt immediately, for example, through the damage or destruction of infrastructure (market costs) or the loss of life (non-market costs). Examples of indirect losses are disruption to regional economic activity as a result of the disaster (market) or the inconvenience and stress imposed on people (non-market).
Impacts of Climate Change in the Western Port Region
Final Report Page 6
Figure 1.2: Framework for assessing costs associated with climate change related impacts in Western Port region
Climate related ‘event’
Market costs (tangible)
Non-market costs (intangible)
Direct Indirect
- property loss or partial loss (coastal only)
- damage to infrastructure
- increased maintenance
- loss of production & disruption to services
- emergency response
- clean up
Direct Indirect
- stress & ill health - social disruption - loss of recreational
opportunities
- death and injury - loss of natural /
environmental & cultural assets
- loss of personal memorabilia
Source: After BTRE (2000); Queensland Government (2002)
This framework is used to describe the potential economic, social and environmental costs associated with impacts of climate change in the Western Port region. It is important to note though, that we have not attempted to fully quantify the potential costs of climate change in the region, either in monetary terms or using other metrics. Rather, we have sought to provide sufficient information, some quantitative and some qualitative, to give an indication of the relative significance of different climate events for different variables, in different areas in the region.
In examining costs, consideration also needs to be given to distributional issues, noting that some groups in the community are likely to be particularly vulnerable to coastal inundation or other impacts of climate change. Distributional issues are discussed in Chapter 8.
D. Data Gaps and Limitations of the Assessment
In using this report it is important to be mindful of a range of uncertainties and limitations associated with the various analyses of exposure and impacts. Failure to do so may cause one to over-estimate the precision of the analyses. Some general caveats regarding limitations are presented below, but more specific discussions accompany a number of the chapters.
• Uncertainty Regarding Future States – While tools such as climate models are powerful devices for informing our understanding about future changes in the climate system, it is difficult to validate how well a climate model simulates future conditions. The models used in this report have been evaluated for how well they perform in reproducing the historical and current Australian climate (see CSIRO and BOM, 2007), with different models generating different results, particularly for variables such as rainfall. The biophysical reports generated for this project explore this uncertainty, but many of the projections of exposure and impacts are based upon a limited set of scenarios about the future. While there is confidence in general trends (such as warming temperatures and sea-level rise), the absolute magnitudes are uncertain. Such uncertainties also extend to aspects of the

Impacts of Climate Change in the Western Port Region
Final Report Page 7
region’s demographics and economic conditions. There is confidence regarding future increases in regional population, wealth and development, but the locations of specific structures and assets or their market value at a future time cannot be known with certainty.
• Challenges in Linking Climate to Impacts – While this report reviews some of the literature regarding the relationship among climate change and various key impacts, in generating estimates, the report largely relies upon an assessment of exposed assets. Yet exposure to natural hazards is only part of the story. Where possible, this report provides some indicative estimates that illustrate possible flood damages to buildings or mortality from extreme heat events based upon some simple assumptions regarding how exposure relates to outcomes. However, more detailed and robust modelling tools developed for application to specific locations and/or sectors are necessary for generating more comprehensive and rigorous estimates of current and future climate consequences. Nevertheless, the estimates provided in this report provide some valuable insight into the potential scope of climate change challenges.
• Data Quality and Availability – Limitations in the availability of data, the scale at which it was collected and its quality can pose significant challenges for environmental assessments. Data gaps may arise from a range of sources including,
– constraints on data ownership and sharing;
– lack of a systematic monitoring and collection system;
– technological limits on the quality and accuracy of data collection tools and methods (see also Box 3 in Chapter 3);
– challenges in estimating future conditions (see above); and
– complete lack of data or knowledge about a particular system or its behaviour.
Addressing such challenges often requires changing the scope or nature of the assessment, additional investments of financial resources and time, or iterative assessment methods that enable analyses and results to be updated as new information becomes available.

Impacts of Climate Change in the Western Port Region
Final Report Page 8
1.2.2. Overview of Integrated Assessment Approach
The ‘urban metabolism model’ used in national State of the Environment (SoE) reporting provides a useful conceptual framework for the four project phases outlined above.
The urban metabolism model (Figure 1.3) is a systems-based model that examines human settlements in terms of three major elements (Newton, 2001):
assets (including people, infrastructure and resources);
systems and processes (such as governance, planning, technology and information flows); and
community objectives and outcomes (which are often viewed in terms of liveability, economic performance and sustainability – the so-called ‘triple bottom line’).
These components are dynamically linked; that is, they are constantly evolving and are based on an understanding that changes to one element will have implications for the other elements.
Figure 1.3: Phases of the project using the urban metabolism model as a conceptual framework
Infrastructure
People Materials
Assets Systems & processesLiveability
Economic performance
Ecological sustainability
Objectives
Risks
Climate change Biophysical
Impacts - What? - Where? - Who? - How?
Phase 1
Phase 2 Phase 3 Phase 4
Adaptation measures
GovernancePlanning
TechnologyInformation
When an external ‘pressure’ (such as climate change) poses threats to a settlement, it is anticipated that decision makers will seek to mitigate those threats that they perceive could significantly impact on community economic, social and environmental objectives. They will do this through measures directed at the settlement’s systems and processes. They will also wish to capture any opportunities created by the external pressure.
With respect to climate change, before the community can implement response (adaptation) measures, it first needs to understand:

Impacts of Climate Change in the Western Port Region
Final Report Page 9
the nature of the pressures posed by climate change (Project Phase 1);
how the pressures might translate into impacts on a settlement’s people, infrastructure and resources (Project Phase 2);
how those impacts, in turn, pose risks to community objectives (Project Phase 3); and
how different management alternatives can mitigate risks and the associated costs and benefits of their implementation (Project Phase 4).
1.2.3. Overview of the impacts assessment framework
Vulnerability assessment of natural and human systems to the impacts of climate change is now a major aspect of climate change research.
As noted by Füssel (2007), the term ‘vulnerability’ can be used in many different ways. In the context of climate change though, a widely accepted definition is provided by the Intergovernmental Panel on Climate Change (IPCC, 2007, p.22). Vulnerability is:
“…the degree to which a system is susceptible to, or unable to cope with, adverse effects of climate change, including climate variability and extremes. Vulnerability is a function of the character, magnitude, and rate of climate change and variation to which a system is exposed, its sensitivity, and its adaptive capacity.”
Work of the IPCC over the past 15 to 20 years, including its most recent assessment (IPCC, 2007), has been directed at the international sphere, focussing on climate change impacts and vulnerable systems at the global level. In recent years there have also been studies directed at the national sphere, examining vulnerable sectors, systems and regions in Australia (e.g., Allen Consulting, 2005). The Western Port Climate Change Integrated Assessment is directed at the local sphere. Thus, it aims to drill down deeper than internationally and nationally focussed studies, by examining the potential impacts of climate change to local people, infrastructure and resources and addressing such questions as:
Which people, infrastructure and resources are exposed to different climate change impacts?
Where are they located?
How and to what extent are they sensitive to the impacts?
To answer these questions, we need to consider biophysical factors affecting exposure of local communities to climate change, both external and internal, as well as socio-economic factors affecting the sensitivity of local communities to the impacts to which they may be exposed. By considering all of these factors together, the study is aiming to provide an ‘integrated’ approach to vulnerability assessment (see Table 1.2).

Impacts of Climate Change in the Western Port Region
Final Report Page 10
Table 1.2: Vulnerability of local communities to climate change impacts: examples of factors considered in an integrated assessment
Domain Sphere Socio-economic Biophysical Local Household income
Age Access to information
Topography Land use and cover Environmental conditions
Regional/national/global Institutional capacity (e.g. financial) Population distribution/growth Economic conditions
Average temperature & rainfall Extreme temperature & rainfall Sea level rise Storms Wildfire
Source: After Füssel (2007)

Impacts of Climate Change in the Western Port Region
Final Report Page 11
2. PROFILE OF THE WESTERN PORT REGION
Chapter Summary
• The Western Port region has a coastal climate with relatively mild temperatures and high rainfall compared to other parts of Victoria.
• Nevertheless, temperatures in the Western Port region are projected to increase by up to 1°C by 2030 and 3.5°C by 2070, while average rainfall is projected to decline by up to 8% in 2030 and 23% in 2070.
• Sea levels in the region have been rising at approximately 1 mm/year since the early 1990s, and various studies suggest global sea-level rise by the end of the 21st century of 17 to 140 cm.
• The Western Port region is comprised of a diverse economy and demography, consisting of key residential hubs for metropolitan Melbourne as well as thriving business and industrial sectors.
• The region’s population is projected to grow by approximately 45% by 2031, presenting many opportunities for economic expansion and diversification, but also increasing the exposure of people, buildings and infrastructure to climate variability and change.
2.1. The Western Port Region The geographic focus of this report, and of the project more generally, is the Western Port region of Victoria.
The region covers the local government areas of Bass Coast, Casey, Cardinia, Frankston and Mornington Peninsula Shire. It includes Western Port Bay, as well as the south eastern section of Port Phillip Bay from Seaford and Frankston through to Point Nepean (see Figure 2.4).
There are a number of features of the Western Port region that make it well suited to a study of the impacts of climate change on human settlements:
it has a large and growing population, containing one of Melbourne’s major urban growth corridors as well as coastal settlements and rural settlements;
it is a demographically diverse region with considerable differences in population age and structure from locality to locality;
a number of key implications of climate change are pertinent to the region including coastal and inland flooding, bushfires and drought; and
preliminary work on climate change impacts and community responses has already has been undertaken in the region through a scoping study completed in 2005-06 for the WPGA.3
3 For details see http://www.wpga.org.au/

Impacts of Climate Change in the Western Port Region
Final Report Page 12
Figure 2.4: The Western Port region
Source: Map courtesy of Melbourne Water, Landsat 2001 - Copyright: Commonwealth of Australia 2001
2.2. The Regional Climate The Western Port region has a mild coastal temperature climate, characterised by moderate temperatures in both summer and winter, with relatively few instances of frost or extreme heat. For example, average January maximum temperatures at Mornington and Wonthaggi average 25°C and 24°C, respectively. Meanwhile, average July maximum temperatures are 13°C and 14°C, respectively.
Rainfall in the region has historically been relatively high by Australian standards, ranging from 736 to 936 mm/year between Mornington and Wonthaggi. The majority of rainfall occurs in the winter, with rainfall totals in July, for example, averaging twice those for January. The difference in rainfall between wet and dry years can be substantial. For instance, Mornington experienced its highest annual total rainfall of 1,164 mm in 1870 compared with its lowest of just 434 mm in 2002. On a daily basis, Mornington’s record wet day occurred on 28 March 1902 with 166 mm, while Wonthaggi recorded 117.5 mm on 3 February, 2005 (Table 2.3).

Impacts of Climate Change in the Western Port Region
Final Report Page 13
2.2.1. Drivers of variability and extreme events
Despite its relatively mild climate, the Western Port region does experience a variety of climate extremes including heat waves, extreme rainfall and storm surge events (Table 2.3).
Table 2.3: Extreme temperature statistics for Western Port
Variable Cranbourne Mornington Wonthaggi
Cold Weather Extremes Average # Days<0°C 0.5 0.4 1.5 Coldest Day on Record
-2.5°C (13 September, 1996)
-1.2°C (4 July, 1963)
-2.2°C (1 July, 1971)
Warm Weather Extremes Average # Days>30°C 23.2 19.8 17.9 Average # Days>35°C 5.9 3.5 4.1 Average #Days>40°C 0.4 0.2 0.3 Warmest Day on Record
43.6°C (25 January, 2003)
41.6°C (21 January, 1973)
43°C (24 January, 1982)
Source: Bureau of Meteorology (http://www.bom.gov.au/climate/averages)
The underlying causes of extreme temperature and rainfall events in the Western Port region are varied and depend upon the variable and time-scale under consideration. Temperature extremes are often associated with advection of warm and/or cold air from the continental interior. For example, extreme heat events during summer in southern Victoria are often caused by the advection of warm air masses from the north, hence the common association of extreme heat days and high fire risk with northerly winds. This input of warm dry air into the region exacerbates the direct radiative warming from the sun.
During winter, the movement of cold air masses from the interior can also contribute to cold events and frosts. Due to their large heat capacity, oceans tend to make winter temperatures milder, but changing wind directions that bring air out of the north rather than off Bass Strait can reduce regional temperatures. In addition, an important factor contributing to cold temperatures and frost is cloud cover. Under clear skies, land surfaces radiate significant heat to space, and thus clear winter nights, when temperatures are at a minimum, are particularly susceptible to frost events.
Extremes of rainfall are commonly associated with a different array of drivers. Over hourly to daily time-scales, high rainfall extremes are typically associated with synoptic weather patterns in southeast Australia. For example, Abbs et al. (2006) identified eight synoptic weather types that collectively accounted for 80% of extreme summer rainfall events in southeast Australia. These were characterised by a strong trough or cut off low at the surface that acts to transport warm moist air from the tropics into the region or a surface low accompanied by a mid-latitude trough and strong upper level jet. Such a low-pressure system was responsible for the February, 2005 extreme rainfall event over

Impacts of Climate Change in the Western Port Region
Final Report Page 14
southern Victoria (Box 2.2). Those synoptic weather patterns can also contribute to temperature variability (Box 2.2) and storm surges in the Western Port region (McInnes et al., 2008).
Over longer time-scales, inter-annual patterns of rainfall variability are driven by oceanic/atmospheric phenomena such as the oscillating El Niño/La Niña modes of the El Niño Southern Oscillation (ENSO). Seasonal rainfall in eastern Australia is highly influenced by ENSO, with below-average rainfall during El Niño phases and above average rainfall during La Niña phases. Drought conditions, in particular, are highly correlated with El Niño events. However, rainfall patterns along the southern coast of Victoria are less strongly influenced by ENSO than the continent’s east coast.
Box 2.2: Extreme Rainfall in Southern Victoria, 2–3 February 2005
An intense low-pressure system brought extreme rainfall to southern Victoria in February of 2005. The event made February 2005 Victoria’s wettest February since 1973 and the 7th wettest in the last 106 years. The cold air associated with this system also assisted in the month of February in Victoria being its coolest since 1954. Many rainfall and temperature records were broken, including the daily rainfall record for Wonthaggi in Western Port. In Melbourne, there was a combined total rainfall of 138mm for the event, the majority of which fell on the 2nd with the remainder occurring the following day. To put this rainfall event in perspective, the 138 mm of rain recorded in Melbourne represents 21% of the average yearly rainfall of 653 mm.
Source: http://www.bom.gov.au/announcements/sevwx/vic/2005feb/index.shtml
Rainfall also varies over decadal time-scales. Such decadal variability often manifests as a prolonged shift in the seasonal rainfall patterns. The most significant decadal mode of variability is linked to ocean-atmospheric phenomena such as the Interdecadal Pacific Oscillation (IPO; Power et al., 1999). The IPO influences ENSO behaviour and, subsequently seasonal rainfall. In addition, drought and flood-dominated periods lasting several decades or more have been observed in Australia (Warner, 1987, Vivès and Jones, 2005). Statistically significant shifts from drought to flood-dominated periods have been detected in Australian rainfall records in Eastern Australia in 1946–8 and 1972 and from flood to drought-dominated periods in eastern Australia in 1895 (Vivès and Jones 2005; Li et al. 2005). Such patterns of climate variability should be taken into consideration when attempting to understand baseline climate conditions in Western Port as well as future implications of climate change.
2.3. Climate Change and the Western Port Region
2.3.1. Global climate change
Over the past few centuries, the rate at which human beings have altered the Earth system and the various ecosystems and landscapes of which it is comprised has grown exponentially.
Species extinctions, deforestation, urbanisation and other changes to the landscape, along with the release of toxic substances to sea, land and air have all been associated with rapid increases in the global population and economic activity (Steffen et al., 2004).

Impacts of Climate Change in the Western Port Region
Final Report Page 15
Within the past several decades, it has become clear that the progressive growth of the human influence on the planet is now affecting the climate system itself.
The source of this climatic change lies in the historical dependence of human beings upon fossil fuels as the primary source of the energy driving global commerce and mobility. To date, human consumption of fossil fuels has grown in step with the global population and economy, and the unintentional side-effect of their combustion has been a significant change in the composition of the Earth’s atmosphere. The atmosphere has multiple components, several of which are naturally-occurring gases referred to as ‘greenhouse gases,’ due to their ability to trap heat. The primary greenhouse gas is water vapour, but others such as carbon dioxide (CO2), methane (CH4), and nitrous oxide (N2O), are also important. Energy from the sun passes through the atmosphere and warms the surface of the planet (Figure 2.5). While most of this heat is simply radiated back into space, some is trapped by greenhouse gases. This has a warming effect on the atmosphere and ultimately keeps the planet at an average annual temperature of approximately 15°C. Without this process, the global average surface temperature would be closer to -18°C.
Figure 2.5: The Greenhouse Effect
Source: State of Victoria (2004)
Centuries of human combustion of fossil fuels, along with land-clearing, have increased the flow of greenhouse gases to the atmosphere, increasing their concentration and subsequently magnifying the natural greenhouse effect. Carbon dioxide levels have increased by approximately 36% relative to their concentrations prior to the industrial revolution. At the end of 2007, the average atmospheric CO2 concentration was 383 parts per million (ppm; NOAA, 2007) – higher than at any point over at least the past 650,000 years (Siegenthaler et al., 2005). Meanwhile, other greenhouse gases such as N2O and CH4 have increased by 17% and 151%, respectively (Spahni et al., 2005).

Impacts of Climate Change in the Western Port Region
Final Report Page 16
The net effect of these changes to the atmosphere has been a warming of the planet. Since the mid-19th century, the average temperature at the Earth’s surface has increased by approximately 0.7°C (IPCC, 2007a - Figure 2.6), and according to the Intergovernmental Panel on Climate Change, this warming is “very likely due to the combined influences of greenhouse gas increases and stratospheric ozone depletion (IPCC, 2007a).” Such warming has also contributed to an acceleration of global sea-level rise, which currently stands at approximately 0.3 mm/year (IPCC, 2007a).
Figure 2.6: Observed global trends in average surface air temperatures (a) and sea level (b) since 1850
Source: IPCC (2007a)
The long-term trend of increasing average temperatures has been accompanied by changes in extreme temperature events, including a reduction in cold days and frosts and an increase in hot days, nights and heatwaves (IPCC, 2007). However, changes in the global climate extend beyond simple increases in temperatures. Global warming has been accompanied by changes in precipitation and evaporation, strengthening of mid-latitude winds, more intense droughts as well as increased heavy rainfall events. Most recently, there has been some evidence for an increase in tropical cyclone activity in the North Atlantic since 1970.
Additional warming is projected over the 21st century and beyond in response to continued emissions of greenhouse gases. The IPCC (2007a) has estimated a “likely” range of 21st century increase in average global temperature of 1.1°C to 6.4°C. Over the next twenty years, such warming is expected to proceed at a rate of approximately 0.2°C per decade. Similarly, sea levels are also projected to increase in the future due to a combination of thermal expansion and melting of ice sheets (Table 2.4).

Impacts of Climate Change in the Western Port Region
Final Report Page 17
Table 2.4: Recent estimates of global sea-level rise (SLR) by the end of the 21st century
Although there is significant uncertainty regarding the rate and magnitude of future sea-level rise, due in large part to uncertainties regarding the dynamics of ice sheets in a warming climate, a rise of one metre by the end of the century is well within the uncertainty range.
Study SLR Notes Modelling Studies
IPCC (2001) 9–88 cm Accounts for thermal expansion, glacier and ice sheet mass balance and dynamical processes.
IPCC (2007a,b) 18–59 cm Accounts for thermal expansion only – no accounting for dynamical ice sheet discharge.
IPCC (2007b; with dynamical ice sheet discharge)
18–76 cm Same as above but with 0 to 17cm added to account for dynamical ice sheet discharge (from IPCC, 2007).
Empirical/Observational Approaches
Rahmstorf (2006) 50–140 cm
Assumes rates of sea-level rise are proportional to changes in global mean temperature. Extrapolates future SLR from IPCC scenarios for future temperature changes.
Church and White (2006) 28–34 cm Extrapolated from recent trends in sea-level rise acceleration. Range is consistent with median estimates from IPCC (2001) and (2007).
Hybrid Approaches
IPCC (2007b); Meier et al (2007) 23–140 cm
Combines IPCC (2007) estimates of thermal expansion for 2090 to 2099 with projections of ice sheet and glacier contributions by 2100 from Meier et al. (2007) that include acceleration from dynamical instability based upon observed trends.
Paleoclimatic Analogy
Hansen et al. (2006)
Up to 60 cm per decade (600 cm per
century) post-2100
Paleoclimatic evidence indicates that sea-levels were 25 metres higher when global temperatures were 2 to 3°C warmer. Further, dynamical ice sheet processes can lead to rapid disintegration of ice sheets and rapid rates of sea-level rise. The timing of these processes is speculative, but such rapid rates are probably not relevant over this century.

Impacts of Climate Change in the Western Port Region
Final Report Page 18
2.3.2. Regional trends in temperature, rainfall and sea-level rise
The changes in the climate system that have been observed at the global level have manifested in Australia and are readily observed at the scale of the Western Port region (CSIRO and BOM, 2007).
An examination of long-term temperature anomalies for Victoria (Figure 2.7) shows a trend toward increasing temperatures similar to that observed at the global scale. The spatial distribution of this trend varies throughout the State, with temperatures in Western Port rising on average by approximately 0.05°C to 0.15°C per decade since 1970. Warming has been greater in the LGAs forming the eastern border of Port Phillip Bay and the Mornington Peninsula.
Figure 2.7: Trends in average annual temperature and rainfall in Victoria
A) Average annual Victorian temperature anomalies over the 20th century relative to average temperatures for a baseline period (1961-1990). Blue columns represent years of below average temperatures while red columns represent above average temperatures. B) Spatial pattern of Victorian warming trends since 1970. C) Average annual Victorian rainfall anomalies over the 20th century relative to average rainfall for a baseline period (1961-1990).Blue columns represent above average rainfall while red columns indicate below average rainfall. D) Spatial pattern of rainfall trends since 1970.
Source: Bureau of Meteorology
Whereas temperatures in Victoria have been trending upward throughout most of the past century, rainfall has been more dynamic (Figure 2.7). The first half of the 20th century was relatively dry, with annual rainfall often below the 1961−1990 baseline. This was followed by decades of wetter conditions, with generally above average rainfall from approximately 1950 to 1990. Since the early 1990s, however, the trend in rainfall has
A B
C D
Impacts of Climate Change in the Western Port Region
Final Report Page 19
been steeply downward. Spatially the Western Port region of Victoria has experienced a larger decline in rainfall since 1970 than other areas, on the order of 50 mm per decade, with slightly lower rate of decrease at the southern end of the Mornington Peninsula.
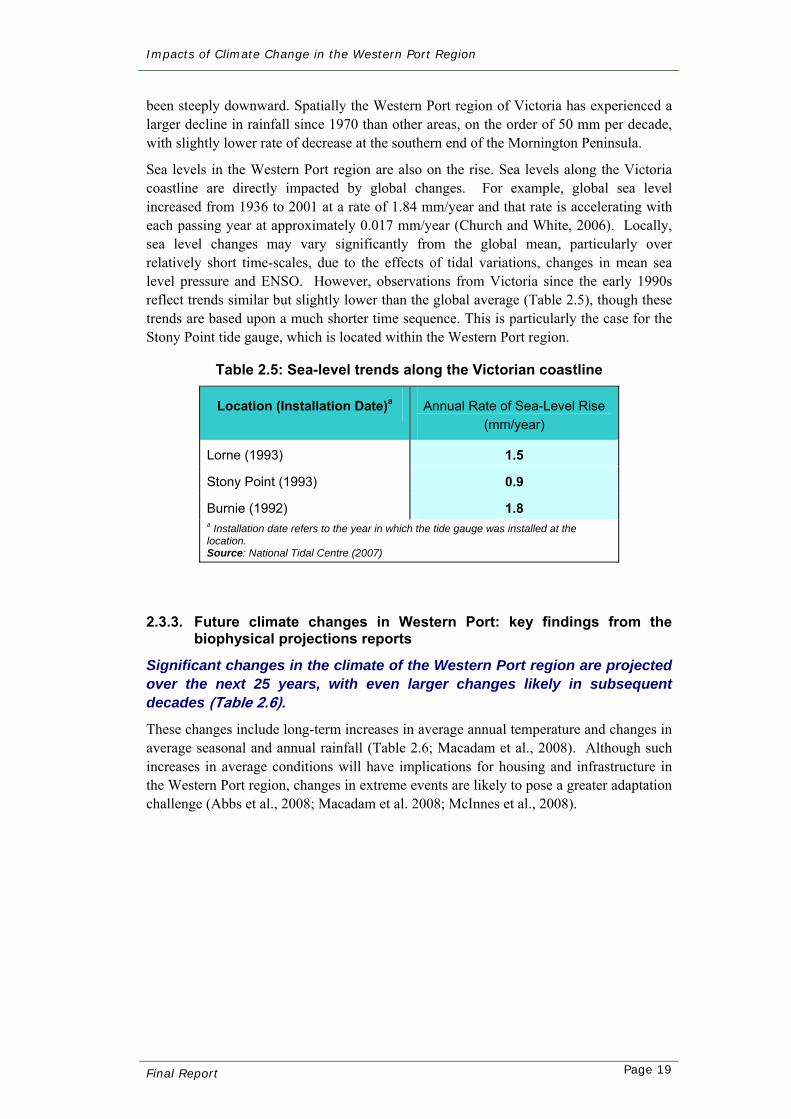
Sea levels in the Western Port region are also on the rise. Sea levels along the Victoria coastline are directly impacted by global changes. For example, global sea level increased from 1936 to 2001 at a rate of 1.84 mm/year and that rate is accelerating with each passing year at approximately 0.017 mm/year (Church and White, 2006). Locally, sea level changes may vary significantly from the global mean, particularly over relatively short time-scales, due to the effects of tidal variations, changes in mean sea level pressure and ENSO. However, observations from Victoria since the early 1990s reflect trends similar but slightly lower than the global average (Table 2.5), though these trends are based upon a much shorter time sequence. This is particularly the case for the Stony Point tide gauge, which is located within the Western Port region.
Table 2.5: Sea-level trends along the Victorian coastline
Location (Installation Date)a Annual Rate of Sea-Level Rise (mm/year)
Lorne (1993) 1.5
Stony Point (1993) 0.9
Burnie (1992) 1.8 a Installation date refers to the year in which the tide gauge was installed at the location. Source: National Tidal Centre (2007)
2.3.3. Future climate changes in Western Port: key findings from the biophysical projections reports
Significant changes in the climate of the Western Port region are projected over the next 25 years, with even larger changes likely in subsequent decades (Table 2.6). These changes include long-term increases in average annual temperature and changes in average seasonal and annual rainfall (Table 2.6; Macadam et al., 2008). Although such increases in average conditions will have implications for housing and infrastructure in the Western Port region, changes in extreme events are likely to pose a greater adaptation challenge (Abbs et al., 2008; Macadam et al. 2008; McInnes et al., 2008).
Impacts of Climate Change in the Western Port Region
Final Report Page 20
Table 2.6: Summary of climate projections for the Western Port region
For example, projections of the annual average number of hot days (e.g., days with maximum temperatures above 30, 35 or 40°C) and hot spells are projected to increase in Melbourne. Such higher temperatures in conjunction with changes in rainfall patterns are also projected to increase the risk of weather conditions conducive to bushfire (Macadam et al., 2008).
The projected changes in extreme climate conditions extend to extreme rainfall. Extreme rainfall events of relatively short duration are projected to increase throughout the Western Port region by 2030, yet events of longer duration either decrease or increase depending on location (Abbs et al., 2008). Changes in extreme rainfall by 2030 are generally within ±50%. By 2070, extreme rainfall events increase regardless of the time duration under consideration, particularly in the Mornington Peninsula Shire, Phillip Island, and the coast to the east of Western Port Bay. These increases are quite substantial, particularly for short duration (i.e., 2 hour) events, which increase in the Mornington Peninsula Shire by over 50%.
Meanwhile, increases in sea level will invariably increase storm surge levels in the Western Port region. Even after accounting for changes in synoptic weather and wind patterns, such changes in sea level are the dominant factor driving future storm surges. Based upon projections of future increases in global sea levels by the IPCC, storm surge heights increase by up to 17 cm by 2030 and 49 cm by 2070 (Table 2.6). Such increases may have the greatest implications in the east of Western Port Bay, where storm surge heights tend to be higher due to the effect of the build-up of water as a result of westerlies. However, the sandy beaches and tidal wetlands throughout the region are susceptible to temporary or permanent inundation and, particularly, erosion. Nevertheless, the implications of storm surge for regional settlements are ultimately dictated by the geomorphology of the coastline that is exposed to storm surge events as well as the type and density of development, infrastructure and assets that lie in harm’s way.
2030 2070 Climate Variable
Lowa Higha Lowa Higha
Average daily temperatures (°C) +0.5 +1.1 +0.9 +3.5
Average annual rainfall totals (%) -8.0 0.0 -23.0 +0.0
Average relative humidity (%) -1.0 -0.1 -1.7 -0.2
Average solar radiation (%) 0.2 +1.7 +0.3 +5.3
Average daily wind-speeds (%) -1.0 +3.0 -5.0 +10.0
Sea-level rise (cm) +6 +17 +15 +49 a Low and high represent minimum and maximum seasonal changes from two different climate models and a range of assumptions about future greenhouse gas emissions and climate sensitivity. Source: Macadam et al. (2008) and McInnes et al. (2008)

Impacts of Climate Change in the Western Port Region
Final Report Page 21
2.4. The Region’s People
2.4.1. Population distribution, age and growth
The Western Port region contains a large and vibrant community, comprising over over 550,000 residents in 2006.
The region’s population is growing rapidly, the number of permanent residents having increased by more than 180,000 between 1991 and 2006. Over that period, regional population growth was three times the annual growth rate of the Melbourne metropolitan region and four times that of Victoria. All municipalities in Western Port experienced population growth greater than the Victorian average. In the coastal communities of Bass Coast, Frankston and Mornington Peninsula Shire, the ‘sea change’ effect has helped fuel population growth, especially of retirees. But growth has been particularly rapid in the southeast metropolitan growth corridor through Casey and around Pakenham in Cardinia. In Casey, the population grew by more than 90% between 1991 and 2006. Casey’s annual population growth rate over the period, at 4.4%, made it one of the fastest growing municipalities in Australia (Figure 2.8, Table 2.7). Population growth is expected to continue apace, with the region’s population projected to grow by a further 240,000 in the 25 years from 2006, reaching almost 800,000 people by 2031. This represents growth of 45%, nearly double the projected growth rate for Victoria. The majority of population growth is expected to occur in the corridor through Cardinia (81,000 - 142% growth) and Casey (86,000 - 40% growth), although significant growth is also projected for coastal localities in Bass Coast (19,000 – 71% growth) and Mornington Peninsula Shire (43,000 – 31% growth) (Figure 2.8).
Figure 2.8: Population growth in the Western Port region by LGA, 1991-2031
0
50,000
100,000
150,000
200,000
250,000
300,000
350,000
Bass Coast Cardinia Casey Frankston MorningtonPeninsula
Popu
latio
n
1991 2006 2021 2031
Sources: ABS (2007); Department of Planning and Community Development (2007)
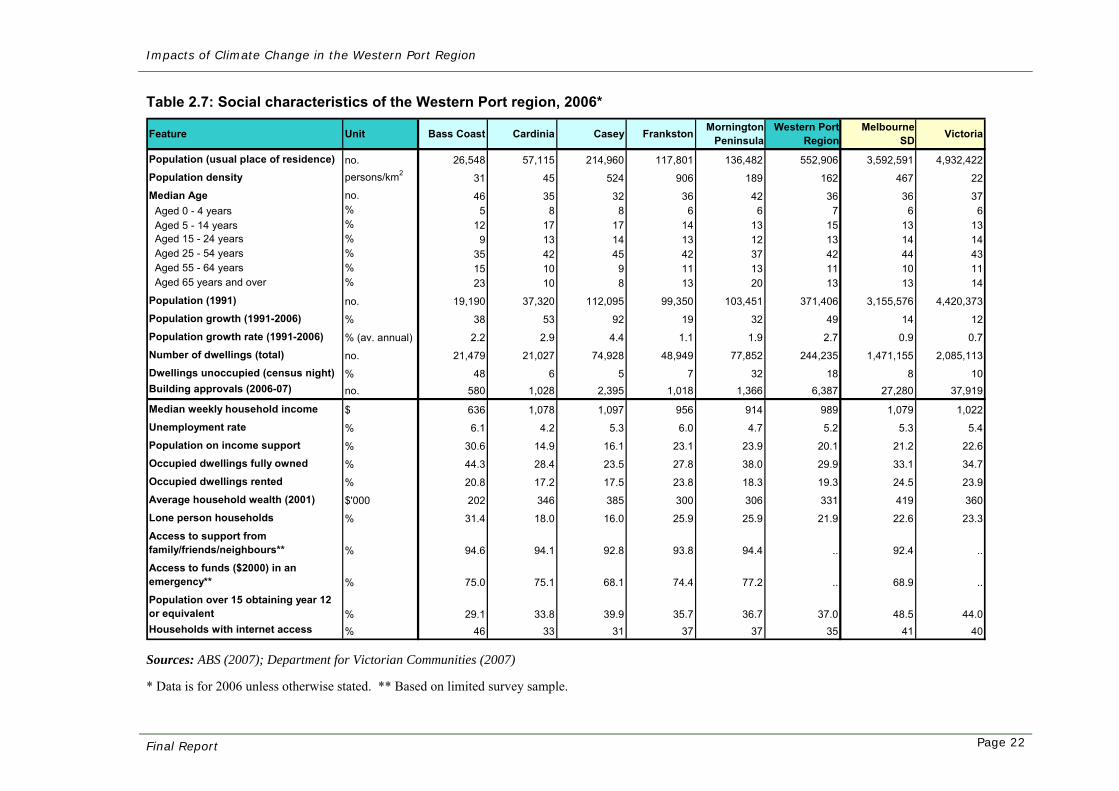
Impacts of Climate Change in the Western Port Region
Final Report Page 22
Table 2.7: Social characteristics of the Western Port region, 2006*
Feature Unit Bass Coast Cardinia Casey Frankston Mornington Peninsula
Western Port Region
Melbourne SD Victoria
Population (usual place of residence) no. 26,548 57,115 214,960 117,801 136,482 552,906 3,592,591 4,932,422Population density persons/km2 31 45 524 906 189 162 467 22Median Age no. 46 35 32 36 42 36 36 37 Aged 0 - 4 years % 5 8 8 6 6 7 6 6 Aged 5 - 14 years % 12 17 17 14 13 15 13 13 Aged 15 - 24 years % 9 13 14 13 12 13 14 14 Aged 25 - 54 years % 35 42 45 42 37 42 44 43 Aged 55 - 64 years % 15 10 9 11 13 11 10 11 Aged 65 years and over % 23 10 8 13 20 13 13 14Population (1991) no. 19,190 37,320 112,095 99,350 103,451 371,406 3,155,576 4,420,373Population growth (1991-2006) % 38 53 92 19 32 49 14 12Population growth rate (1991-2006) % (av. annual) 2.2 2.9 4.4 1.1 1.9 2.7 0.9 0.7Number of dwellings (total) no. 21,479 21,027 74,928 48,949 77,852 244,235 1,471,155 2,085,113Dwellings unoccupied (census night) % 48 6 5 7 32 18 8 10Building approvals (2006-07) no. 580 1,028 2,395 1,018 1,366 6,387 27,280 37,919
Median weekly household income $ 636 1,078 1,097 956 914 989 1,079 1,022Unemployment rate % 6.1 4.2 5.3 6.0 4.7 5.2 5.3 5.4Population on income support % 30.6 14.9 16.1 23.1 23.9 20.1 21.2 22.6Occupied dwellings fully owned % 44.3 28.4 23.5 27.8 38.0 29.9 33.1 34.7Occupied dwellings rented % 20.8 17.2 17.5 23.8 18.3 19.3 24.5 23.9Average household wealth (2001) $'000 202 346 385 300 306 331 419 360Lone person households % 31.4 18.0 16.0 25.9 25.9 21.9 22.6 23.3
Access to support from family/friends/neighbours** % 94.6 94.1 92.8 93.8 94.4 .. 92.4 ..Access to funds ($2000) in an emergency** % 75.0 75.1 68.1 74.4 77.2 .. 68.9 ..Population over 15 obtaining year 12 or equivalent % 29.1 33.8 39.9 35.7 36.7 37.0 48.5 44.0Households with internet access % 46 33 31 37 37 35 41 40 Sources: ABS (2007); Department for Victorian Communities (2007)
* Data is for 2006 unless otherwise stated. ** Based on limited survey sample.

Impacts of Climate Change in the Western Port Region
Final Report Page 23
A breakdown of the Western Port region’s current population by age grouping reveals a similar age profile to Victoria’s population as a whole. However, the regional profile hides significant intraregional differences, with the rapidly growing urban fringe areas of Cardinia and Casey having proportionally high numbers of children (0–4 and 5–14 years of age). Conversely, coastal communities in Bass Coast and Mornington Peninsula have a relatively high proportion of elderly citizens (65 years and over) compared to other parts of the region and to Melbourne and Victoria as a whole (Table 2.7).
A rapidly growing population presents significant challenges for the provision of infrastructure and services. For example, in 2006–2007 the number of housing approvals in the region totalled more than 6,400, 17% of all new housing approvals in Victoria (Table 2.7). The new housing comes with a commensurate level of demand for utility services – electricity, gas, water and telecommunications – as well as transport infrastructure and services. In the urban fringe areas of Casey and Cardinia, where young families comprise a significant proportion of the growing population, there are also increasing demands being placed on children’s services – child care, education and maternal health. In the coastal communities of Frankston, Mornington Peninsula Shire and Bass Coast, the strong growth in the number of retirees creates demand for an additional range of services.
Population growth also contributes to significant environmental stresses. These include development pressures on sensitive ecosystems (especially wetlands and coastal ecosystems), resource consumption and the management of solid and water-borne wastes. These stresses present major planning challenges, especially in coastal areas.
Another feature of the region’s population, not evident in official population figures, is its large part-time population (e.g. holiday home owners). This is evident in Bass Coast and Mornington Peninsula, with 48% and 32% of dwellings in the two shires respectively being unoccupied when official population data was collected in 2006 (Table 2.7). As well, the region experiences a substantial influx of visitors on an ongoing basis but especially in the summer months. Visitors include day trippers, overnight visitors and holiday-makers on extended stays. Phillip Island alone receives some 700,000 overnight visitors each year, each staying for an average of three nights and approximately one million day trippers (Tourism Victoria, 2006a). The Mornington Peninsula receives one million overnight visitors and more than three million day trippers each year (Tourism Victoria, 2006b). Tourists and part-time residents provide a substantial contribution to the region’s economy, especially in Bass Coast and Mornington Peninsula Shire (see section 2.5), but also add to the infrastructure and environmental pressures discussed previously. They also impose particular challenges in the context of climate change impacts in coastal areas, a point discussed further in Chapter 3.
2.4.2. Income, income distribution and other social characteristics
Incomes and wealth also vary considerably across Western Port – a characteristic that contributes to significant variability in the economic vulnerability of different areas to the effects of climate change.
In 2006, median household weekly income levels in the growth areas of Casey and Cardinia ($1,078 and $1,097, respectively) were similar to the Melbourne and Victorian medians ($1,079 and $1,022) but very low in Bass Coast ($636) and moderately low in Frankston and Mornington Peninsula Shire ($956 and $914, respectively). The low median income in Bass Coast reflects in part the high proportion of people there on

Impacts of Climate Change in the Western Port Region
Final Report Page 24
income support, including those on pensions and unemployment benefits. Frankston also has a high proportion of people on income support. Similarly, average household wealth in Bass Coast was only $202,000 in 2001, substantially below the Victorian average of $360,000. Wealth levels in Frankston and Mornington Peninsula Shire were also well below the state average. Only in Casey ($385,000) was the level of wealth above the Victorian average.
Unemployment in the Western Port region was lower than the Victorian average in 2006 – being particularly low in Cardinia – but higher than the State average in Bass Coast and Frankston. Another social characteristic worthy of note is level of educational attainment. The proportion of people who have obtained year 12 or equivalent or who have post school qualifications is lower than the state average in all municipalities in the region. Internet access and usage is also lower than the state average in all municipalities.
Overall therefore, the profile of the Bass Coast community is one of an older community who have relatively low incomes and wealth but also low levels of debt and good access to support groups and information. Mornington Peninsula Shire presents a similar, albeit less marked picture. On the other hand, Casey and to a lesser extent Cardinia, have younger populations with relatively high incomes (albeit with significant non-discretionary expenditure requirements, e.g. for house purchase) but with only moderate access to information and support. Frankston has an average aged community, who have lower than average incomes and wealth and a higher than average proportion of people on income support.
It is important to note that the general characteristics described above are not uniform throughout each municipality. Localised data (e.g. census collection district level) indicates that all municipalities have areas of high income and wealth and other areas of social disadvantage.
2.5. The Regional Economy
2.5.1. Overview
There were more than 55,000 private businesses registered in the Western Port region in 2004 (ABS 2004).
The overwhelming majority of these were small businesses. Approximately one third of businesses had a turnover of less than $50,000 per annum in 20044 and two thirds had a turnover of less than $100,000 per annum5. Property and business services and construction comprised more than 40% of all businesses in Western Port. The prominence of these types of businesses reflects the housing and construction boom in many parts of the region.
Recent economic data is not available for the Western Port region. However, earlier data estimates the total value of gross regional product (GRP) to have been about $7.5 billion in 2001, equivalent to approximately $9 billion in 2007 dollars. It is not possible to provide a detailed breakdown of GRP, but a breakdown of regional output shows that in 2001, the major regional industries (in terms of output value) were manufacturing,
4 Approximately $55,000 in 2007 values. 5 Approximately $110,000 in 2007 values.

Impacts of Climate Change in the Western Port Region
Final Report Page 25
wholesale and retail trading, construction and finance and business services (Table 2.8).6 Education, health and community services was also a significant sector, notably in Frankston and Mornington Peninsula Shire, while tourism and hospitality was a significant sector in Bass Coast and Mornington Peninsula.
Table 2.8: Value of output and GRP, Western Port region 2001 ($m)
Industry Output Bass Coast Cardinia Casey Frankston Mornington Peninsula Western Port
Agriculture, Forestry and Fishing 86.0 181.0 121.0 23.0 165.0 576.0
Construction 152.0 162.0 558.0 408.0 718.0 1,998.0
Education, Health & Community Services 69.0 109.0 316.0 443.0 410.0 1,347.0
Energy, Water & Telecommunications 36.0 55.0 90.0 70.0 93.0 344.0
Finance, Business & Professional Services 90.0 136.0 448.0 537.0 560.0 1,771.0
Public Administration & Safety 18.0 16.0 63.0 72.0 317.0 486.0
Manufacturing 251.0 358.0 842.0 887.0 1,131.0 3,469.0
Mining 7.0 8.0 3.0 4.0 8.0 30.0
Tourism, Hospitality & Recreation 91.0 67.0 196.0 175.0 330.0 859.0
Transport and Storage 29.0 75.0 208.0 109.0 137.0 558.0
Wholesale & Retail Trade 138.0 265.0 978.0 707.0 747.0 2,835.0
Total Output 967.0 1,432.0 3,823.0 3,435.0 4,616.0 14,273.0
Gross Regional Product (GRP) 452.1 714.9 1,960.6 1,787.7 2,554.4 7,469.7
Avg. GRP growth rate 1991 - 2001 (%) 4.2 4.7 2.4 2.3 3.1 2.9 Source: National Economics (2005)
2.5.2. Employment
Employment in the Western Port region varies significantly from that observed for Victoria as a whole.
For example, a breakdown of employment by industry (Table 2.9) reveals that in 2006, 49% of Western Port residents were employed in either the manufacturing (17%), wholesale and retail trade (21%), or construction sectors (11%), significantly higher percentages than in the same sectors across Victoria (39% in total). By contrast, proportionally fewer Western Port residents were employed in service sectors such as tourism and hospitality, education, health and community services, than in the same sectors across Victoria.
The Western Port data hides significant intra-regional differences. For example, the percentage of Casey residents employed in manufacturing is high relative to the State as a whole, but low in Bass Coast and Mornington Peninsula Shire. By contrast, the proportion of residents employed in tourism and hospitality is high in Bass Coast and quite high in Mornington Peninsula Shire.
6 Gross regional product measures total regional value added, which is the total value of outputs less input values.

Impacts of Climate Change in the Western Port Region
Final Report Page 26
Table 2.9: Employment of Western Port residents by industry, 2006 (%)
Industry Bass Coast Cardinia Casey Frankston Mornington Peninsula Western Port Victoria
Agriculture, Forestry and Fishing 7.5 4.7 0.9 0.5 1.6 1.6 2.9
Construction 13.4 12.6 9.8 10.6 12.2 11.0 7.7
Education, Health & Community Services 19.2 15.5 13.4 17.2 19.8 16.2 18.6
Energy, Water & Telecommunications 2.2 2.5 2.6 2.6 2.0 2.4 3.2
Finance, Business & Professional Services 11.5 13.8 15.0 15.3 14.9 14.8 18.5
Public Administration & Safety 4.2 3.3 3.7 4.5 6.0 4.4 5.3
Manufacturing 7.1 16.0 21.0 16.9 11.9 16.9 13.0
Mining 0.4 0.4 0.2 0.2 0.3 0.2 0.3
Tourism, Hospitality & Recreation 12.3 5.9 5.7 6.5 8.4 6.8 7.6
Transport and Storage 3.1 5.6 6.0 4.7 3.4 4.9 4.7
Wholesale & Retail Trade 19.1 19.6 21.7 21.0 19.6 20.7 18.4
Total 100.0 100.0 100.0 100.0 100.0 100.0 100.0
Source: ABS (2007)
Employment data of the type presented in Table 2.9 is not necessarily a good indicator of the nature and strength of the local economy and employment base, since many Western Port residents work outside of the region. In other words, households in the region have a high dependency on other regions for income and employment (especially the adjoining LGAs of Dandenong, Kingston and Monash).7 Nevertheless, regional output data outlined in Table 2.8 confirms the importance of manufacturing, construction, wholesale and retail trade and finance and business services to the regional economy.
The relatively high dependence of the region on construction for employment and output is also worth noting given the tendency of the industry historically to be subject to ‘boom and bust’ cycles. That said, population growth projections (see Figure 2.8) suggest continued strong construction demand for the foreseeable future.
2.5.3. Regional infrastructure
In general terms, the urban areas of the Western Port region can be characterised as being residential hubs, rather than industrial or commercial hubs.
Thus, it is not surprising to find that most of the value of the regions’ infrastructure is tied up in housing. It is estimated that approximately 67% of the improved value of properties in the region are residential properties. Much of the remaining regional infrastructure has been built to service, either directly or indirectly, the region’s 244,000 dwellings and the people who live in them.
These include:
7 In 2001 for example, locally-based employment was an estimated 128,000 people (National Economics, 2005), equivalent to less than 50% of the workforce who were residing in the region. Local employment was particularly low in Casey, with only 34% of the municipality’s workforce actually working there. This indicates that a substantial majority of Casey’s workforce commutes to workplaces located outside of the municipality. In Bass Coast and Mornington Peninsula Shire, local employment was considerably greater, being about 70% and 63%, respectively, of the workforces of the two municipalities.

Impacts of Climate Change in the Western Port Region
Final Report Page 27
local transport infrastructure (principally roads);
electricity and gas distribution networks,
water, wastewater and stormwater distribution networks;
telecommunication distribution networks;
schools;
medical centres;
retail centres; and
recreation reserves, parks and gardens.
Nevertheless, some infrastructure in the region can be regarded as having state or even national significance, its economic and social influence extending beyond the Western Port region. Infrastructure falling into this category includes:
Cardinia Reservoir, which is located in Shire of Cardinia. Operated by Melbourne Water, the reservoir has a capacity of 287,000 mega litres (ML), approximately 16% of the water storage capacity of Melbourne;
Eastern Treatment Plant, part of which is located in Frankston City. Also operated by Melbourne Water, the plant treats sewage from approximately 1.5 million people in Melbourne’s southeast and eastern suburbs;
Highways of national and state significance including:
Princes Freeway/Highway (M1/A1) the country’s pre-eminent coastal highway, which dissects the City of Casey and Cardinia Shire;
South Gippsland/Bass Highway (M420/A420), which goes through the City of Casey; and Bass Coast Shire; and
Nepean Highway (B110), which goes through Frankston City Council and Mornington Peninsula Shire.
Port of Hastings, located in Mornington Peninsula Shire. The Port of Hastings is a commercial port that serves international and domestic shipping movements including import and export of petroleum and steel. Currently about 200 vessels use the port each year, carrying approximately five million tonnes of cargo. Piers and wharves that make up the port include:
BlueScope Steel Ltd ;
Long Island Point Jetty;
Crib Point Jetty; and
Stony Point Jetty.
Industrial facilities located in the Port of Hastings vicinity including:
Blue Scope Steel sheet and coil products; and
Esso/BHP Billiton crude storage and fractionalisation plant.

Impacts of Climate Change in the Western Port Region
Final Report Page 28
2.6. Regional Profile in the Context of Projected Climate Changes In summary, a picture emerges of Western Port as a dynamic region, with a rapidly growing population presenting many opportunities for the local community, but also significant economic, social and environmental challenges.
This regional profile provides the major platform on which to consider the impacts of climate change.
Discussion in the following chapters is focussed on:
examining the nature of potential biophysical impacts associated with climate change, such as coastal inundation, inland flooding and wildfires;
determining the populations and infrastructure that are exposed to each impact;
understanding, either quantitatively or qualitatively, the sensitivity of communities and infrastructure to the biophysical impacts in terms of potential social and economic impacts; and
in the final chapter, broadly considering the planning and policy implications of exposures and impacts.
Physical conditions such as topography and land use will fundamentally determine exposure of communities and infrastructure to the impacts of climate change. Social and economic conditions, on the other hand, will often affect the sensitivity of exposed communities to particular impacts. Planning and policy responses will need to take account of the interaction between physical, social and economic conditions.

Impacts of Climate Change in the Western Port Region
Final Report Page 29
3. IMPACTS ASSOCIATED WITH COASTAL INUNDATION
Chapter Summary
• A number of coastal areas within the Western Port region are vulnerable to the combined effects of sea-level rise, storm surge and erosion including low-lying sandy beaches, tidal wetlands and erodible cliffs.
• With sea-level rise, a current 1 in a 100 year storm surge event is projected to become a 1 in 40 to a 1 in 6 year event by 2030 and a 1 in 20 to an annual event by 2070.
• The number and value of properties exposed to a 1 in 100 year storm surge event are project to increase by 4 to 5% by 2030 (relative to present) and 18 to 20% by 2070. Increased exposure of other public and private infrastructure is also anticipated.
• In addition to infrastructure impacts, coastal inundation could have significant indirect consequences for business activity, especially to the region’s tourism industry.
• The potential degradation of the regions beaches and foreshore areas could also have significant amenity impacts on local communities, through adverse impacts on lifestyle and recreation and degradation of sites with cultural significance.
3.1. Coastal Inundation in Western Port: The Issues The coastal zone is a dominant feature of the Western Port region, and one that poses opportunities as well as risks.
The region’s bays and beaches attract development, residents and tourists and, as a consequence, contribute significantly to its economy. The coastal zone also contributes substantially to the environmental, cultural and amenity values of the region. However, the coast also represents a source of hazards to the communities of Western Port in the form of sea-level rise, coastal storms, extreme tides and storm surges. Such processes contribute to coastal erosion that threatens property, buildings and infrastructure and coastal amenity. Climate change is anticipated to exacerbate these challenges in the decades ahead. This is largely a function of the ongoing acceleration of sea-level rise that will increase rates of erosion along susceptible stretches of coastline, inundate low-lying areas, and interact with climate variability such as synoptic weather fronts to enhance storm surges above current levels.
3.1.1. Storm surge, sea level rise and coastal erosion in Western Port
Inundation from sea-level rise, particularly in conjunction with extreme tide and storm events, is a risk for a significant fraction of coastal land areas in the Western Port region.
Church et al. (2006) have observed that the annual return interval (ARI) for extreme sea-level events has already declined by a factor of three over the past century, and this increasing frequency of extremes is projected to rise further in the future. McInnes et al (2008), for example, estimate that at Frankston, a 1 in 100 year event under late 20th century conditions would become a 1 in 10 to 20 year event under a mid-range scenario

Impacts of Climate Change in the Western Port Region
Final Report Page 30
for 2030 and would become a 1 in 6 year event under a high scenario. By 2070, under a mid-range scenario, such an event would occur every 2 to 3 years and under a worst case scenario, every 1 to 2 years. At Stony Point, a 1 in 100 year event would become a 1 in 20 to 30 year event under a mid-range scenario by 2030 and a 1 in 20 year event under a worst case scenario. By 2070, such an event would occur every 10 years under a mid-range scenario and every 4 years under a worst case scenario. (Figure 3.9)
Figure 3.9: Storm tide return period curves for Frankston and Stony Point under the various climate change scenarios considered
Frankston
0
0.2
0.4
0.6
0.8
1
1.2
1.4
1.6
1.8
2
1 10 100 1000
Return Period (yrs)
Sea
Leve
l (m
)
control2030 L2030 M2030 H2070 L2070 M2070 H
Stony Point
0
0.5
1
1.5
2
2.5
3
3.5
1 10 100 1000
Return Period (yrs)
Sea
Leve
l (m
)
control2030 L2030 M2030 H2070 L2070 M2070 H
Frankston
0
0.2
0.4
0.6
0.8
1
1.2
1.4
1.6
1.8
2
1 10 100 1000
Return Period (yrs)
Sea
Leve
l (m
)
control2030 L2030 M2030 H2070 L2070 M2070 H
Frankston
0
0.2
0.4
0.6
0.8
1
1.2
1.4
1.6
1.8
2
1 10 100 1000
Return Period (yrs)
Sea
Leve
l (m
)
control2030 L2030 M2030 H2070 L2070 M2070 H
Stony Point
0
0.5
1
1.5
2
2.5
3
3.5
1 10 100 1000
Return Period (yrs)
Sea
Leve
l (m
)
control2030 L2030 M2030 H2070 L2070 M2070 H
Stony Point
0
0.5
1
1.5
2
2.5
3
3.5
1 10 100 1000
Return Period (yrs)
Sea
Leve
l (m
)
control2030 L2030 M2030 H2070 L2070 M2070 H
Note, that a low scenario(L) comprises a low wind speed scenario combined with a low sea level rise scenario, a mid scenario(M) comprises a mid wind speed scenario with a mid sea level rise scenario and so on.
Source: McInnes et al. (2008)
Such reductions in ARIs for storm surge heights will ultimately increase the frequency and extent of coastal inundation from storm surge events. McInnes et al. (2008) estimate that, at present a 1 in 100 year storm event in the Western Port region (including both Port Phillip Bay and Western Port Bay) could inundate approximately 11.8 km2 of land. By 2030 and 2070, this is projected to increase to 13.6 km2 and 19.2 km2, respectively. Therefore, over the near-term (i.e. the next few decades) the critical issue in the estimation of inundation appears to be the magnitude of the storm event, with sea-level rise simply increasing the risk of inundation at the margins. By 2070 however, the effects of sea-level rise become more pronounced, ultimately almost doubling the area at risk of inundation during a 1 in 100 year event.
Inundation areas must also be considered in the context of coastal erosion (Stive, 2004; Zhang et al., 2004; Cowell et al., 2006). First-order estimates of beach erosion in response to sea-level rise have traditionally been based upon Brunn Rule-type estimates (Port of Melbourne Authority, 1992; Jones and Hayne, 2002; Cooper and Pilkey, 2004; Zhang et al., 2004). Though often viewed critically and subject to cautious interpretation (Slott, 2003; Cooper and Pilkey, 2004; Cowell et al., 2006), as a general rule, such calculations suggest that 10 metres of beach recession occurs for every 10 centimetres of sea-level-rise. This means that seemingly small increases in sea level can have rather dramatic consequences for coastal erosion. In addition, long-term chronic erosion of beaches in response to sea-level rise is often punctuated by short-term acute erosion during storm events. Erosion may progress in a step-like fashion, with gradual recession punctuated by large recession during storms. Therefore, those land areas that currently appear to be at risk from storm surge inundation over the 21st century may be lost due to erosion independent of storm surge inundation. This would, in turn, drive inundation risk

Impacts of Climate Change in the Western Port Region
Final Report Page 31
further inland – an issue that should be noted when considering the estimated impacts of this study.
3.1.2. Physical vulnerability of the coastline
While processes such as sea-level rise and storms may drive erosion and inundation of the coasts, the vulnerability of different coastal areas to such climate processes is also influenced by topography and geology.
The topography of the Western Port region is quite diverse. Much of the Mornington Peninsula and central Bass Coast shires, for example, are characterised by relatively high elevations (Figure 3.10). In contrast, the eastern rim of Port Phillip Bay north of Frankston as well as the northern edge of Western Port Bay and the mouth of the Bass River are low-lying, placing them at greater risk of inundation from sea-level rise.
Figure 3.10: Spatial distribution of elevation in the Western Port region
Source: SRTM 90 metre digital elevation model (Jarvis et al., 2004).
In addition, different types of coastal frontage may be more or less vulnerable to inundation and erosion than others. This is illustrated generally in Table 3.10, which addresses the range of potential impacts of sea-level rise associated with different beach types (see also Port of Melbourne Authority, 1992; Sharples, 2004). It should be noted, however, that vulnerability is not limited to sandy beaches. Even rocky cliffs are subjected to erosion that can undercut cliff faces, increasing the risk of collapse and jeopardising associated infrastructure (Walkden and Dixon, 2006; see also Box 3.3). The relative susceptibility of different coastal typologies is a function of a diverse array of factors and interactions including geomorphology, vegetation cover, sediment transport and tidal ranges, not to mention disturbances or degradation caused by human activities or development.

Impacts of Climate Change in the Western Port Region
Final Report Page 32
Table 3.10: Vulnerability matrix for different beach typologies
Type of Coast Climate Change Effect Potential Impact
Sea level rise and increased waves
Loss of beach width and beach amenity. Potential erosion of backing dunes or land if beach totally inundated - Loss of erosion buffer for storms - Intrusion of saline water into freshwater sandy aquifers Open Beach
Increased tropical cyclone intensity
More intense erosion events in generally low energy environments, wave effects elevated by storm surge
Beach Backed by Hard Protection
Sea level rise and increased waves
Loss of beach width and beach amenity. Potential undermining and collapse of hard protection
Sand Barrier Sea level rise and increased waves
Potential erosion and inland migration of barrier or barrier breaching - Loss of erosion buffer for storms
Sand Dunes Sea level rise and increased waves
Potential erosion of foredune leading to blowouts and inland migration of transgressive dunes - Loss of erosion buffer for storms
Coastal Lake Beaches Sea-level rise Loss of beach width - Intrusion of saline
water into freshwater sandy aquifers
Sand Islands Sea level rise and increased waves
Reduction in size and change in shape of island - Intrusion of saline water into freshwater aquifer
Source: Voice et al. (2006)
More quantitative estimates of the vulnerability of different coastlines come from coastal erosion studies. For example, a 1992 report by the Port of Melbourne Authority applied a Brunn Rule-like algorithm to various locations along the Victoria coastline. Results indicated the potential for significant coastal erosion in the Western Port region in response to sea-level rise (Table 3.11). In particular, Somer’s Beach in Western Port Bay was identified as one of the state’s most susceptible beaches, losing an estimated 130 metres of beach for just 50 cm of sea-level rise (the estimated upper range for sea-level rise by 2070 that is assumed in this study). The report indicated that even at the time (1992), Somer’s Beach was facing the need for significant infrastructure repair and maintenance to address coastal damages. The report also found that some of the tidal marshland around French Island also experiences high levels of recession, suggesting these systems also may be particularly vulnerable to the effects of sea-level rise.
It should also be noted that the storm systems that contribute to storm surges are often associated with other climate-related impacts including extreme rainfall and winds that have the potential to cause damages independent of storm surge events. These issues are addressed in more detail in Chapter 4 (Box 4.3).

Impacts of Climate Change in the Western Port Region
Final Report Page 33
Table 3.11: Projections of coastal recession in the Western Port region
Total Recession (m) Location
Coastal Morphology 0.3 m sea-level rise 0.5 m sea-level rise
Port Phillip Bay
Fisherman’s Beach Sandy Beach 13 21
Rye Beach Sandy Beach 3.5 5.5
Shelly Beach Sandy Beach 4.5 9.5
Western Port Bay
Waraneet Tidal Marshland 40 60
Tooradin Tidal Marshland 15 25
French Island (West Coast)
Tidal Marshland 150 250
French Island (Tortoise Head)
Tidal Marshland 80 130
French Island (North Coast)
Tidal Marshland 80 130
Somer’s Beach Sandy Beach 78 130
Source: Port of Melbourne Authority (1992)
8 The Frankston and Somerville Standard, Friday 22 November 1935.
Box 3.3: Coastal erosion at Oliver’s Hill
Since the 1930s, residents have held fears for homes built on coastal cliffs and hills to the south of Frankston, in particular Oliver’s Hill. Three houses on Oliver’s Hill subsided in 1935, and the Nepean Highway had to be closed. An article in The Frankston and Somerville Standard entitled ‘Foreshore Erosion’ reported on the visit of a panel of experts who viewed the brushwood fences installed by the Foreshore Committee as a means of hindering erosion. While these were regarded as effective, the panel also inspected Long Island, “where thousands of tons of sand had been built up, the whole of the works had been wiped out in a phenomenal storm which had lashed the beaches last year.”8
While a proposed sea wall around the entire bay was discussed with neighbouring councils it never eventuated. In 1949, a sea wall was constructed at the foot of Oliver’s Hill. The State government set aside 2 million pounds for erosion work in the 1950s Graeme Butler & Associates, 1997). However, erosion of Oliver’s Hill has continued to be a problem to this day, both for housing and the Nepean Highway

Impacts of Climate Change in the Western Port Region
Final Report Page 34
3.1.3. Economic and social vulnerability
The other aspect of coastal vulnerability to climate change is the social and economic assets that may be in harms way, including both infrastructure such as houses, life-saving clubs, roads, water and sewer pipes, and the communities who live in the affected area and utilise its infrastructure. The economic and social vulnerability of coastal areas is thus dependent upon the number and density of coastal developments, their proximity to hazards, their value and the effectiveness of existing and future policies and measures for managing the risks posed by sea-level rise and storm surge. From an anthropocentric perspective, areas with a greater accumulation of buildings and infrastructure in close proximity to the coastline are more sensitive to future sea-level rise, storm events, coastal inundation and erosion while more sparsely developed coastlines or those where development is set back from the coastline have fewer people and assets in ‘harm’s way’.
3.2. Exposure
3.2.1. Methods for exposure assessment
The storm surge projections and associated estimates of land areas susceptible to inundation presented within the biophysical report were utilised to determine the land areas, infrastructure and assets that will potentially be exposed to these hazards in future decades.
Inundation areas identified through storm surge simulations were imported into a geographic information system (ARCGIS 9.2) as 100 m gridded data layers.9 Data were subsequently converted to a vector polygon format. These polygon layers were then used to interrogate a range of geographic data sets including data from the ABS 2006 census, as well as multiple data sets provided by local governments regarding property, land use and the location of transport, water and sewer and recreational infrastructure. Land areas, census collection districts and assets intersecting storm surge inundation areas were treated as potentially exposed, and associated populations, infrastructure and assets were subsequently quantified. While quantification of some consequences are provided for 1in 100 year storm events for the current climate as well as 2030 and 2070, in some instances, the relatively small magnitude of sea-level rise projected for 2030 results in few appreciable differences between the present and 2030. As such, for some analyses, only the 2070 1 in 100 year scenario is utilised.10
A number of uncertainties associated with this methodology merit mention. First and foremost, the analysis was based upon the integration of multiple data sets which were developed in different ways. For example, storm surge inundation areas were based upon model simulations incorporating different gridded land elevation and coastal bathymetry data of varying resolutions (see also Box 3.5). Meanwhile, census collection districts (CCDs) as well as Council data were obtained as vector polygon data derived from local census surveys. Errors in the alignment of different data sources necessitates that results be interpreted with some caution. Furthermore, if any overlap between an inundation
9Geographic Coordinate System: GCS_GDA_1994, Datum: D_GDA_1994. Projected Coordinate System: GDA_1994_MGA_Zone_55, Projection: Transverse Mercator. 10For information on storm surge heights and potential inundation at the LGA scale for a range of storm surge annual return intervals, refer to McInnes et al. (2008).

Impacts of Climate Change in the Western Port Region
Final Report Page 35
area and a census district, property or road segment existed, the entire CCD, property or segment was counted as exposed. This invariably results in an overestimate of the exposure of the population and assets. Hence, quantitative results should be treated as estimates designed to communicate the approximate scale of consequences and how the trajectory of consequences changes over time.
Box 3.4: Key uncertainties associated with sea-level rise/storm surge impact assessment
1) Uncertainty in the digital elevation model utilised in the assessment of storm surge inundation areas is a major limiting factor influencing the quality of inundation estimates. While a 90 metre spatial resolution is relatively high compared to a range of other digital elevation models (DEMs) in use within Australia and elsewhere, it is still problematic for rigorously representing small-scale elevation gradients such as those associated with foreshore topography (see Box 3.3 for a more extensive discussion).
2) As indicated in the Intergovernmental Panel on Climate Change’s Assessment Report Four (AR4 - IPCC, 2007b), projections of sea-level rise in coming decades remain highly uncertain. This report relies upon relatively high sea-level rise estimates for 2030 and 2070 based upon estimates provided by the IPCC. However, the IPCC also cautions that sea-level rise significantly higher than indicated within the AR4 is possible, as reflected in other studies (see Table 2.4).
3) In its assessment of inundation exposure, this report also assumes that the shorelines of Port Phillip Bay and Western Port Bay will remain static in future decades. However, it is noted that coastal erosion and other dynamic processes will affect the geomorphology of the coastline over time. Therefore, it is possible that by 2030 or 2070, significant coastal erosion will have caused inland recession of beaches and wetlands, allowing storm surge inundation to reach even further inland than suggested by the current analysis. On the other hand, depending on local processes such as sediment transport, other areas of the coast may actually accrete.
4) Climate change will manifest over future decades in conjunction with socio-economic changes, such as development, that will also influence vulnerability and risk. Patterns of development can be controlled, at least to some extent. For example, current Victorian planning policy (such as Melbourne 2030), provides a framework around which development is managed in the future. However, uncertainties arise from the interpretation and implementation of the framework at small scales, or from the potential for changes to that framework.
3.2.2. Exposed coastal areas
Storm surge and inundation projections provide an estimate of the magnitude of land at risk from inundation in the Western Port Region.
Storm surge simulations for the region indicate that there is already a significant risk of inundation at present for some locations (Table 3.12). Although at-risk areas are not evenly distributed throughout the region, at the LGA level the total area of potential inundation is relatively similar among different LGAs, in the order of 2–3 km2. The one

Impacts of Climate Change in the Western Port Region
Final Report Page 36
exception is Frankston, which is associated with quite low levels of inundation, despite the identification of relatively low-lying coastal areas in the Council’s northwest (see Box 3.5).
Table 3.12: Inundation estimates for the Western Port region in 2030 and 2070 for a 1 in a 100 ARI storm surge event
2030 (km2) 2070 (km2) LGA (Subregion) Present
Low High Low High
Bass Coast (ML) 2.0 2.2 2.5 2.5 4.5
Bass Coast (PI) 1.9 2.0 2.2 2.2 2.8
Cardinia 2.1 2.1 2.4 2.4 3.4
Casey 2.7 2.7 2.9 2.9 3.7
Frankston 0.1 0.1 0.1 0.1 0.1
Mornington Peninsula (WP) 2.3 2.3 2.6 2.6 3.3
Mornington Peninsula (PP) 0.8 0.9 1.0 1.0 1.5
Total (% change relative to present)
11.8
12.3 (+4%)
13.6 (+15%)
13.7 (+16%)
19.2 (+63%)
ML=Mainland; PI = Phillip Island; WP = Western Port Bay shoreline; PP = Port Phillip Bay shoreline “Low” and “High” estimates based upon a range of scenarios about wind speed and sea-level changes. Source: McInnes et al. (2007)
As consistent with prior studies (e.g., Port of Melbourne Authority, 1992), inundation is most pronounced along the Western Port Bay coastline, partly because of the much larger storm surges and the considerable low-lying wetland areas along the northern and eastern edges of the bay (Table 3.11). The greatest point of inland penetration of storm surge water is projected around the low-lying areas in the Bass Coast Shire, including the mouth of the Bass River. Other key points of inundation occur at Hastings in Mornington Peninsula Shire and along the southern extent of Casey City and Cardinia Shire councils. Additional detail regarding inundation areas for individual Councils is provided below in the discussion of policy and planning considerations.

Impacts of Climate Change in the Western Port Region
Final Report Page 37
Box 3.5. Data Uncertainty and Estimates of Storm Surge Inundation Inundation of land areas in response to sea-level rise and/or storm surge events is dependent upon the topography of the landscape in the coastal zone. For example, low-lying sandy beaches with shallow slopes may experience relatively rapid inundation as sea-level rises. In contrast, steep coastal slopes (such as cliffs) may be gradually eroded and undercut over long time-scales, but are unlikely to experience inundation over shorter time-scales. The acquisition of accurate spatial information on topography and elevation historically has been a significant challenge in coastal assessments. Uncertainties in coastal elevation data can have a significant influence on estimates of risk that are based on simple comparison of sea-level and storm surge heights and elevations of adjacent land areas or more complex modelling.
To illustrate the importance of elevation data inaccuracies on estimates of risk, it is useful to compare land elevations in the Western Port region as represented by two different digital elevation models (DEMs) with different spatial resolutions (90 m and 1 km) (Figure 3.11).
Figure 3.11. Comparison of elevations in coastal areas of the Western Port region based upon digital elevation models (DEMs) of different resolutions
Areas that are particularly low-lying along the Frankston and Mornington Peninsula Shire coasts of Port Phillip Bay are identified by red circles in Figure 1a).
Source: Globe Task Team et al. (1999); Jarvis et al., (2004)
The coarser DEM (1b) suggests that a large fraction of the region is very low-lying (less than 5 m in elevation), including the majority of the Mornington Peninsula, Phillip Island, and much of western Bass Coast Shire Council. In contrast, southeast Casey City and southwest Cardinia Shire Councils appear to be at relatively high elevations. Much of this representation of regional elevations can be readily dismissed as erroneous. When one examines the 90 metre DEM (1a - the source of elevation data in storm surge inundation simulations), the relative elevation of different areas is in much better agreement with expectations and natural drainage features also start to become apparent. However, the limited storm surge inundation observed in simulations, particularly along the Port Phillip Bay coast, suggests that the absolute elevations within the 90 m DEM are still suspect and/or the resolution is still too coarse to capture smaller drainage features (e.g., creeks and channels) that may serve as conduits for storm surges to affect land areas.
Four areas in particular in Frankston and Mornington Peninsula Shire stand-out as low-lying areas potentially vulnerable to sea-level rise from the 90 metre DEM (Figure 3.11). They include:
A) Northwest Frankston including Seaford Swamp and Kananook Creek; B) Balcombe Creek near Mount Martha; C) Dromana Bay, Safety Beach and Dunns Creek; and D) Rosebud
a) b)

Impacts of Climate Change in the Western Port Region
Final Report Page 38
Figure 3.12: Low-lying coastal areas indicated by the 90 m DEM
Source: Globe Task Team et al. (1999); Jarvis et al., (2004)
These are also areas where past problems with storm surge events have been observed, particularly in conjunction with extreme rainfall events. Given such real-world observations of coastal inundation and flooding in response to extreme events, the 90 metre DEM for these regions generally appears to underestimate the potential for inundation. For example, using the 90 metre DEM, effectively none of the coastal land areas around Balcombe Creek or the Rosebud township appear to be at less than 5 m in elevation, even where natural drainage features meet Port Phillip Bay. Meanwhile, although low-lying areas were identified in the vicinity of the Frankston foreshore and Seaford swamp, pathways there for inland penetration of storm surges are not apparent from the DEM. Similarly, at-risk areas around Dromana Bay appear to be confined to the mouth of Martha’s Cove, although the apparent misalignment between the DEM and aerial photography suggests an additional source of potential errors in estimating coastal inundation and impacts.
Such irregularities in the elevation data used for storm surge modelling largely accounts for the limited coastal inundation in simulations for Port Phillip Bay. Higher-quality elevation data, such as that derived from LIDAR, will eventually enable some of these data problems to be addressed. Nevertheless, it will always be prudent to exercise caution in interpreting potential climate change impacts and to rely upon multiple lines of evidence to inform estimates of risk.
A
C
B
D

Impacts of Climate Change in the Western Port Region
Final Report Page 39
Future sea-level rise in response to global climate change is projected to increase the area inundated in the region during storm events, particularly large (i.e., 1 in a 100 year) events. Generally, the increase in inundation is in the order of only 4 to 15% by 2030, reflecting the fact that increases in sea level are likely to be relatively modest over the next two to three decades. However, later in the century, the potential for much higher magnitudes of sea-level rise significantly increases the area at risk of inundation to 16 to 63% by 2070. The location of hot spots for inundation remains largely the same, regardless of the time period under consideration. For example, by 2070, inundation simulations project significant increases of storm surge water penetration into the Bass River flood plain and the coastline of Casey and Cardinia (Figures 3.13 to 3.16).
While total inundation for each LGA was estimated for a range of assumptions about sea-level rise, the mapping of the spatial extent of such inundation in Figures 3.13 to 3.16 and Table 3.12 captures only the high scenarios of sea-level rise in 2030 and 2070. Furthermore, both represent relatively low-frequency events (e.g., 1 in a 100 year storm events). Given lower levels of sea-level rise or less extreme storm events, the associated inundation for any given time period would obviously be lower (see McInnes et al., 2008 for a complete discussion of storm surge heights and inundation levels for a range of scenarios).

Impacts of Climate Change in the Western Port Region
Final Report Page 40
Figure 3.13: Spatial distribution of 1 in a 100 year storm surge inundation areas for Bass Coast Shire Council (top) with close-up views of Cape
Woolamai (bottom right) and Rhyll (bottom left)
Rhyll Cape Woolamai

Impacts of Climate Change in the Western Port Region
Final Report Page 41
Figure 3.14: Spatial distribution of 1 in a 100 year storm surge inundation areas for Casey City Council (top) with close-up view of Warneet (bottom)
Warneet

Impacts of Climate Change in the Western Port Region
Final Report Page 42
Figure 3.15: Spatial distribution of 1 in a 100 year storm surge inundation areas for Cardinia Shire Council (left) and Frankston City Council (right)
Cardinia Shire Council Coast Frankston City Council Coast

Impacts of Climate Change in the Western Port Region
Final Report Page 43
Figure 3.16: Spatial distribution of 1 in a 100 year storm surge inundation areas for Mornington Peninsula Shire Council (top) with close-up view of
Hastings (bottom)
Hastings

Impacts of Climate Change in the Western Port Region
Final Report Page 44
3.2.3. Exposed populations11
Examination of regional property and household data indicates that a relatively small fraction of the region’s population and properties are directly exposed to storm surge events.
Looking at the most extreme scenario of a 1 in 100 year storm event in 2070, an estimated 2,266 people in the region are exposed (based upon the 2006 population) and an estimated 1,066 dwellings (Table 3.13 and Figure 3.17). This represents just 0.2% of current (2006) population and dwellings in the region. By and large, the affected areas are associated with relatively low population densities, particularly in Bass Coast, Casey and Cardinia Shire Councils (Figure 3.18). However, projected inundation along the Mornington Peninsula Shire was associated with more dense residential development. Similarly, affected CCDs in Frankston City have relatively high population densities, but account for only a very small number of exposed people and dwellings.
Table 3.13: Existing (2006) populations and dwellings in the Western Port exposed in 2070 given a 1 in 100 year storm surge scenario
LGA Exposed Dwellings (#)a
Average Household
Sizeb
Exposed Population (#)c
Population Density (#/km2)d
Bass Coast Shire 261 2.14 559 19.6
Cardinia Shire 24 2.9 70 2.8
Casey City 144 1.64 236 20.6
Frankston City 0 1.6 0 669.9
Mornington Peninsula Shire 637 2.2 1,401 60.6
Total 1,066 2,266 a Number of exposed dwellings estimated from the number of residential and rural properties exposed to storm surge inundation in 2070, assuming 1 dwelling per property. b Average household size estimated from average household sizes for CCDs in each LGA intersecting with storm surge inundation areas. c Exposed population estimated by multiplying exposed dwellings and average household size d Population density estimated from population densities from CCDs in each LGA intersecting with storm surge inundation areas. Source: ABS 2006 Census
Examination of the spatial distribution of population densities associated with inundation areas in the region also leads to the observation that the majority of exposed CCDs around Western Port Bay are largely associated with relatively low-density, rural communities and smaller hamlets - the exceptions being the larger townships of Hastings (Mornington Peninsula Shire), Warneet and Tooradin (Casey) and isolated areas of northern and eastern Phillip Island such as around Ventnor, Cowes/Silverleaves, Rhyll and Cape Woolamai (Bass Coast). These are areas where the consequences of sea-level rise and storm surge events would be anticipated to be more significant, at least from the perspective of risks to the built environment.
11 Discussion of exposed populations and infrastructure in this and subsequent sections should be considered in the context inundation estimate uncertainties discussed in Box 3.3.

Impacts of Climate Change in the Western Port Region
Final Report Page 45
Figure 3.17: Spatial distribution of existing properties in the Western Port region associated with coastal inundation
(assuming a 2070, 1 in a 100 year scenario)

Impacts of Climate Change in the Western Port Region
Final Report Page 46
Figure 3.18: Current (2006) population density of census districts exposed to a 1 in 100 year storm surge (2070 scenario)
3.2.4. Exposed public infrastructure
Transport infrastructure
A number of road and rail transport corridors in the Western Port region are already exposed to the potential impacts of storm surge events, given a large 1 in 100 year storm. While the increased exposure of roads to storm surge events out to 2030 is relatively small (e.g. 9% increase in affected road length - Table 3.14), exposure increases significantly (73%) in the latter half of the 21st century with higher sea-level rise. LGAs containing the most extensive lengths of exposed transport infrastructure are Bass Coast Shire and, particularly Mornington Peninsula Shire. For Bass Coast, exposed roads were identified for the coastline of eastern Western Port Bay as well as coastal townships on Phillip Island such as the Esplanades of Cowes and Cape Woolamai as well as roads in Rhyll (Figure 3.13). For Mornington Peninsula Shire, the extensive residential development along the coast, particularly that of Port Phillip Bay, places segments of a number of relatively small secondary and tertiary roads in harm’s way. However, segments of the Nepean Highway in Dromana and Safety Beach are projected to be exposed to inundation by 2070. Due to the relatively low density of development along the coasts of Casey City and Cardinia Shire Councils, the exposure of road transport to coastal inundation is somewhat limited. However, storm surge projections for 2070 do come within 50 metres of the South Gippsland Highway near the Harwood Aerodrome east of Tooradin.

Impacts of Climate Change in the Western Port Region
Final Report Page 47
Rail infrastructure throughout the region appears largely immune to storm surge exposure. Mornington Peninsula Shire was the only LGA in the region where current or projected storm surges overlapped with rail lines. In addition, the exposure of Mornington Peninsula Shire’s rail network appears insensitive to increasing storm surge heights over the 21st century. Exposed rail segments in Mornington Peninsula Shire are confined to those in the northeast of the Council, in close proximity to the coastline (Figure 3.19), such as rail infrastructure associated with the Bluescope Steel site and the Bittern-Morradoo rail line.
Table 3.14: Existing transport infrastructure in the Western Port region exposed to a 1 in 100 year storm surge
LGA Present (km) 2030 (km) 2070 (km)
Roads
Bass Coast 11.4 12.1 15.3
Cardinia 1.8 1.8 17.2
Casey 7.7 7.9 9.7
Frankston City 0.0 0.0 0.7
Mornington Peninsula 29.9 33.4 45.0
Total 50.8 55.2 (+9%) 87.9 (+73%)
Rail
Bass Coast 0.0 0.0 0.0
Cardinia 0.0 0.0 0.0
Casey 0.0 0.0 0.0
Frankston City 0.0 0.0 0.0
Mornington Peninsula 9.5 9.5 9.5
Total 9.5 9.5 (+0%) 9.5 (+0%)
Bridges
Bass Coast 0 0 0
Cardinia N/A N/A N/A
Casey N/A N/A N/A
Frankston City 0 0 0
Mornington Peninsula N/A N/A N/A
Total 0 0 0

Impacts of Climate Change in the Western Port Region
Final Report Page 48
Figure 3.19: Spatial distribution of existing transport infrastructure in the Western Port region exposed to inundation associated with a 1 in 100 year
storm surge (2070 scenario)
Another category of transport related infrastructure that is likely to be affected by sea-level rise and storm surge events are public boating facilities. Sea-level rise will affect access to facilities such as boat ramps, while wave action and storm events can damage built infrastructure associated with such facilities (see Port of Melbourne Authority, 1992). A total of 47 public boating facilities are located in the Western Port region (Figure 3.19), although management of the facilities varies.12 Approximate locations of boating facilities were identified from maps generated by the Victorian Central Coastal Board and subsequently rectified against aerial photography of LGA areas. Of these, only three facilities were identified definitively as being affected by future inundation based upon storm surge simulations (Figure 3.19), but this small number is largely due to the fact that boating facilities tend to be located at sea level (and therefore are constantly exposed to some degree of inundation or exposure).
One of the identified exposed facilities is Merrick’s Yacht Club, in Mornington Peninsula Shire while the other two are facilities located on French Island. In reality, it seems likely that virtually all of the boating facilities in the region are vulnerable to the combined effects of sea-level rise, storm surge events and, particularly, the action of waves during storm events.
12 See http://www.ccb.vic.gov.au/boatingcap.htm

Impacts of Climate Change in the Western Port Region
Final Report Page 49
Water, stormwater and wastewater infrastructure13
The potential implications of rising sea levels and storm surges on water, sewerage and drainage infrastructure are also an important consideration for the Western Port region. Although some exposure has been identified for infrastructure in most of the Western Port LGAs under present day conditions (Table 3.15), the effects of rising sea-levels with respect to additional future exposure are relatively modest.
Bass Coast, Casey and Mornington Peninsula Shire were the only councils where water mains and sewer infrastructure were identified as exposed to storm surge events, with exposure increasing over time. Yet, none of the region’s treatment plans or sewer pump stations were identified as exposed, even given sea-level rise and storm surge scenarios in 2070. Some types of stormwater drainage infrastructure, such as ponds and basins, were not identified as exposed, regardless of the storm surge scenario considered, and none of the drainage pipes or pits in Frankston overlapped with any of the storm surge inundation scenarios. Infrastructure most at risk appeared to be the water infrastructure of Bass Coast and the channel drains of Casey where even at present, a 1 in 100 year storm surge is projected to affect some significant infrastructure. In addition, the terminal ends of several of the drainage channels in Cardinia that form part of the drainage infrastructure for Koo-Wee-Rup Swamp are potentially exposed to inundation and backwater effects given a 1 in 100 year event, even under current sea levels. A stormwater outfall in Warneet in Casey is projected to be exposed to storm surge inundation under current sea levels. Similarly, the outfall at Hastings in the Mornington Peninsula Shire is projected to be inundated by 2070. The inundation of outfalls and drainage channels may be particularly problematic when storm surge events coincide with extreme rainfall events, increasing the risk of localised flooding due to inadequate drainage capacity.
Other infrastructure
A range of other types of public and private facilities and infrastructure were also assessed for exposure to 1 in 100 year storm surge events (Figure 3.20). Infrastructure assessed for exposure included critical infrastructure or public services (e.g. utilities, education and medical centres), major economic enterprises (e.g. industrial facilities) and other private facilities with economic or social value (e.g. marinas and yacht clubs).
Some of the key facilities identified as being exposed include:
the Blue Scope Steel industrial facility in Hastings;
the Esso/BHP Billiton crude storage and fractionalisation plant, also in Hastings;
Harwood aerodrome, east of Tooradin in Casey;
utility infrastructure in southern Cardinia;
numerous caravan parks located in or adjacent to foreshore areas throughout the region.
In addition, a number of the yacht clubs along the southern extent of Mornington Peninsula Shire in Western Port Bay are exposed including those at Balnarring, Merricks Beach and Flinders.14
13 It should be noted that there are variations among LGAs with respect to how water, stormwater and wastewater infrastructure is assessed and the responsible party for their management.

Impacts of Climate Change in the Western Port Region
Final Report Page 50
Table 3.15: Water, sewer and drainage infrastructure in the Western Port region exposed to a 1 in 100 year storm surge
Present 2030 2070 Bass Coast
Water (km) 10.1 11.0 12.9 Sewer (km) 3.9 4.3 5.2
Cardinia Water (km) 0.0 0.0 0.0 Sewer (km) 0.0 0.0 0.0
Sewer Pump Stations (#) 0 0 0 Drainage Pipes (km) 0.0 0.0 0.0
Outfalls (#) 0 0 0 Channel Drains (km) 15.8 15.8 15.8
Pits (#) 0 0 0 Casey
Water (km) 3.8 4.1 3.5 Sewer (km) 6.2 15.0 16.1
Sewer Pump Stations (#) 0 0 0 Drainage Pipes (km) 1.1 1.2 1.7
Outfalls (#) 1 1 1 Channel Drainage Structures (#) 0 0 0
Aux Channels (km) 0.0 0 0 Pits (#) 26 27 32
Aux Pits (#) 0 1 1 Aux Drains (km) 0.0 0.05 0.05 Aux Outfalls (#) 0 0 0 Aux Ponds (#) 0 0 0
Retarding Basins (#) 0 0 0 Aux Pipes (km) 1.1 1.2 1.7
Channel Drainage Structures (#) 0 0 0 Aux Channels (km) 0.0 0 0
Pits (#) 26 27 32
14 These were also highlighted by Port of Melbourne Authority, 1992. Note: there may be some overlap between yacht clubs and boating facilities (e.g. Merricks Yacht Club).

Impacts of Climate Change in the Western Port Region
Final Report Page 51
Present 2030 2070
Frankston Water (km) 0.0 0.0 0.0 Sewer (km) 0.0 0.0 0.0
Sewer Pump Stations (#) 0 0 0 Drainage Pipes (km) 0.0 0.0 0.0
Outfalls (#) 0 0 0 Pits (#) 0 0 0 Mornington Peninsula Shire
Water (km) 11.4 12.7 17.5 Sewer (km) 4.8 6.8 13.9
Sewer Pump Stations (#) 0 0 0 Drainage Pipes (km) 4.4 4.6 5.2
Pipes not Linked (km) 0.6 1.0 1.0 Outfalls (#) 0 0 1
Pits (#) 97 114 170 Pits not Linked (#) 11 18 24
a Data on the locations of water and sewer infrastructure provided by Southeast Water, with the exception of Bass Coast Shire Council, where data were obtained from the Council. Data for sewer pump stations in Bass Coast were not available. b Data on the locations of drainage infrastructure provided by the five LGAs in the region.

Impacts of Climate Change in the Western Port Region
Final Report Page 52
Figure 3.20: Spatial distribution of existing facilities/infrastructure exposed to inundation in the Western Port region, assuming a 1 in 100 year storm
surge event (2070 scenario)
Facilities were identified from property descriptions or zone descriptions, depending upon the availability of information.
3.2.5. Exposed coastal crown lands
Many of the effects of sea-level rise and storm surge events in the Western Port region are likely to be borne by foreshore areas, which are frequently crown reserves.
Ownership of these lands, including beaches down to high tide, lies with the State of Victoria, but management responsibilities may be split across a range of institutions including councils, local management committees and trustees and various State agencies (Parks Victoria or Department of Sustainability and the Environment) (Figure 3.21).
These reserves are likely to bear the brunt of long-term sea-level rise, extreme tides and storm surges and as a general rule, beaches and foreshore reserves throughout the region will be exposed to sea-level rise and storm events, both at present and in future decades.

Impacts of Climate Change in the Western Port Region
Final Report Page 53
Figure 3.21: Spatial distribution of coastal crown land reserves in the Western Port region
Numerous foreshore reserves have been identified as experiencing inundation in response to the 2070 1 in a 100 year storm surge simulations. Those for which management responsibility lies with local governments include:
Bass Coast: the Cowes Foreshore Reserve (from Silverleaves to Ventnor), Rhyll Foreshore Reserve, Newhaven to Cape Woolamai Foreshore Reserves, Grantville Foreshore Reserve, Tenby Point Foreshore Reserve, Coronet Bay Foreshore Reserve, Kilcunda Foreshore Reserve and Inverloch Foreshore Reserve;
Cardinia: two of the public reserves;
Casey: the Blind Bight Foreshore Reserve;
Frankston: the Frankston and Seaford Foreshore Reserves;
Mornington Peninsula Shire (Port Phillip Bay): the Mt. Eliza Foreshore Reserve and Rosebud Foreshore Reserve; and
Mornington Peninsula Shire (Western Port Bay): the Hastings Foreshore Reserve, Shoreham Foreshore Reserve, Flinders Foreshore Reserve, Tyabb Foreshore Reserve and Bittern Coastal Wetlands Reserve.
Additional beaches and foreshore reserves, managed by state government or committees/trustees, are also likely to be affected by storm surge inundation, including a number along the Mornington Peninsula coastline.

Impacts of Climate Change in the Western Port Region
Final Report Page 54
3.3. Economic and Social Impacts As discussed in Chapter 1 (Box 1.1), the socio-economic impacts of climate change span multiple dimensions including direct and indirect market costs as well as non-market social and cultural consequences.
As many impacts of climate change will have cascading effects throughout communities, it is difficult to develop an exhaustive list. However, it is possible to identify some of the key, first-order consequences. These are discussed below, beginning with the market implications of climate change followed by some of the more intangible, but no less important, non-market consequences.
3.3.1. Direct market costs
Private property
Much if not most of the market impacts of future coastal inundation in the Western Port region will stem from the direct impacts of inundation on private property, either partial or complete loss of sites15 or costs associated with destruction or damage to infrastructure and/or increased maintenance costs.
Tables 3.16 to 3.20 reveal the number and type of properties exposed to inundation in the region at present and in 2030 and 2070, showing the site only (SV) and capital improved (CIV) value of exposed properties. Under the worst case scenario, property with a total SV of approximately $487 million and CIV of $780 million (2007 dollars) will be exposed to inundation in 2070, an increase of $ 144 million on the SV and $359 million on CIV of property currently exposed ($343 and $421 million respectively). By far the largest share of exposed properties in the region (in terms of CIV) is in Mornington Peninsula Shire (72%), followed by Bass Coast (21%), Casey (6%), Cardinia (1%) and Frankston City (<1%). Residential properties represent approximately 64% of the CIV value of exposed properties, industrial 24%, rural 9% and unspecified and other 3%.
15 The potential loss of coastal land makes the issue of coastal inundation qualitatively different from, say bushfires or inland flooding, which do not involve loss of land.

Impacts of Climate Change in the Western Port Region
Final Report Page 55
Table 3.16: Value of existing property in potential 1 in 100 year storm surge inundation areas of Bass Coast Shire (in thousands of $)a
Present 2030 2070 Property Type # SVc CIVd # SVc CIVd # SVc CIVd
Commercial 8 $ 1,433 $ 2,676 8 $ 1,433 $ 2,676 8 $ 1,433 $ 2,676
Industrial 2 $ 285 $ 631 2 $ 285 $ 631 2 $ 285 $ 631
Private Infrastructureb 3 $ - $ - 3 $ - $ - 4 $ - $ -
Recreational 1 $ 3,250 $ 7,010 1 $ 3,250 $ 7,010 3 $ 3,250 $ 7,010
Residential 174 $ 57,549 $ 75,054 182 $ 61,115 $ 79,366 205 $ 70,714 $ 91,160
Rural 45 $ 44,894 $ 51,166 48 $ 47,076 $ 53,550 56 $ 52,812 $ 59,506
Services 0 $ - $ - 0 $ - $ - 0 $ - $ -
Unspecified 20 $ - $ - 20 $ - $ - 20 $ - $ -
Total (% change relative to present)
253 $ 107,411 $ 136,537 264 (+4%)
$ 113,159 (+5%)
$ 143,233(+5%)
298 (+18%)
$ 128,494 (+20%)
$ 160,983(+18%)
a Data on property values provided by the five LGAs in the region. b Includes transport, communication, utilities, and storage infrastructure
c Market value of land only d Total market value of the property including land, buildings and all other improvements

Impacts of Climate Change in the Western Port Region
Final Report Page 56
Table 3.17: Value of existing property in potential 1 in 100 year storm surge inundation areas of City of Casey (in thousands of $)a
Present 2030 2070 Property Type # SVb CIVc # SVb CIVc # SVb CIVc
Commercial 1 $ 800 $ 1,667 2 $ 1,024 $ 1,907 2 $ 1,024 $ 1,907
Industrial 0 $ - $ - 0 $ - $ - 1 $ 538 $ 608
Residential 109 $ 20,802 $ 28,874 112 $ 21,548 $ 29,884 140 $ 25,956 $ 36,761
Rural 2 $ 1,969 $ 2,089 3 $ 3,797 $ 4,163 4 $ 4,299 $ 4,835
Unspecified 31 $ - $ - 32 $ - $ - 42 $ - $ -
Total (% change
relative to present)
143 $ 23,571 $32,630 149 (+4%)
$ 26,369 (+12%)
$35,954 (+10%)
189 (+32%)
$ 31,817 (+35%)
$44,111 (+35%)
a Data on property values provided by the five LGAs in the region. b Market value of land only c Total market value of the property including land, buildings and all other improvements

Impacts of Climate Change in the Western Port Region
Final Report Page 57
Table 3.18: Value of existing property in potential 1 in 100 year storm surge inundation areas of Mornington Peninsula Shire (in thousands of $)a
Present 2030 2070 Property Type # SVc CIVd # SVc CIVd # SVc CIVd
Commercial 5 $ 1,697 $ 2,281 5 $ 1,697 $ 2,281 6 $ 1,863 $ 2,500
Industrial 5 $ 21,331 $ 21,711 5 $ 21,331 $ 21,711 15 $ 49,370 $ 235,503
Private Infrastructureb 4 $ 3,045 $ 3,545 4 $ 3,045 $ 3,545 4 $ 3,045 $ 3,545
Recreational 0 $ - $ - 0 $ - $ - 0 $ - $ -
Residential 272 $ 160,612 $ 195,992 310 $ 187,234 $ 226,801 494 $ 247,810 $ 304,725
Rural 3 $ 19,223 $ 19,243 3 $ 19,223 $ 19,243 3 $ 19,223 $ 19,243
Unspecified 285 $ - $ - 422 $ - $ - 587 $ - $ -
Total (% change
relative to present)
574 $ 205,908 $ 242,772 749 (+30%)
$ 232,530 (+13%)
$ 273,581 (+13%)
1,109 (+93%)
$ 321,311 (+56%)
$ 565,516 (+133%)
a Data on property values provided by the five LGAs in the region. b Includes transport, communication, utilities, and storage infrastructure
c Market value of land only d Total market value of the property including land, buildings and all other improvements

Impacts of Climate Change in the Western Port Region
Final Report Page 58
Table 3.19: Value of existing property in potential 1 in 100 year storm surge inundation areas of Shire of Cardinia (in thousands of $)a
Present 2030 2070 Property Typeb
# SVc CIVd # SVc CIVd # SVc CIVd
Green Wedge 0 $ - $ - 0 $ - $ - 3 $ 254 $ 508
Public Use 2 $ 662 $ 969 2 $ 662 $ 969 2 $ 662 $ 969
Public Conservation and Resource
3 $ 813 $ 1,345 3 $ 813 $ 1,345 3 $ 813 $ 1,345
Road 0 $ - $ - 0 $ - $ - 1 $ 106 $ 191
Rural 21 $ 4,338 $ 6,665 21 $ 4,338 $ 6,665 21 $ 4,338 $ 6,665
Total (% change relative to present)
26 $ 5,813 $ 8,979 26 (+0%)
$ 5,813 (+0%)
$ 8,979 (+0%)
30 (+15%)
$ 6,173 (+6%)
$ 9,678 (+8%)
a Data on property values provided by the five LGAs in the region. b Property types determined by the associated planning zone in which they were located
c Market value of land only d Total market value of the property including land, buildings and all other improvements

Impacts of Climate Change in the Western Port Region
Final Report Page 59
Table 3.20: Value of existing property in potential 1 in a 100 year storm surge inundation areas of Frankston City (in thousands of $)a
Time Period # SVc CIVd
Present 0 $ - $ -
2030 0 $ - $ -
2070b 1 $ 30 $ 195 a Data on property values provided by the five LGAs in the region. b The one property identified in 2070 was zoned for “Public Conservation and Resource”
c Market value of land only d Total market value of the property including land, buildings and all other improvements
It is important to recognise that property values, quoted above, do not represent the likely economic impact of future inundation of properties in the region. Instead, a total of $300-400 million could represent a worst case scenario for loss of site value, if the following outcomes eventuated:
there is repeated inundation of all currently exposed sites;
the sites become unusable as a result of inundation; and
additional properties (i.e. properties exposed by 2030 or 2070) are also lost.
In reality, it is likely that the impact of storm surge scenarios on site value will be less than this total, since at least some of the site value of affected properties will be maintained into the future, either for current or alternative uses.
In addition to site impacts, loss or damage to infrastructure on the exposed properties also needs to be considered. As detailed in Tables 3.16 to 3.20, the total value of private infrastructure exposed to inundation under a worst case 2070 scenario, for a 1 in 100 year storm surge, is approximately $293 million16. This is about $215 million more than the value of infrastructure currently exposed to a 1 in 100 year storm surge ($78 million). Of the $293 million exposed in 2070, approximately $187 million (64%) are industrial assets, virtually all of which are located in Hastings in the Mornington Peninsula Shire. Of the additional exposed assets, $88 million (30%) are residential, again mainly located in Mornington Peninsula Shire.
A sum of approximately $150-230 million represents a worst case scenario for damage to this infrastructure involving:
complete loss of all exposed infrastructure; and
depreciation of 20-50% of the market value of that infrastructure17.
Again, it is unlikely that all exposed infrastructure value will be destroyed, even with repeated inundation. A more realistic indication of the costs of future coastal inundation on private infrastructure could potentially be gained through the use of a model, such as
16 Calculated as CIV, less SV. 17 There are major uncertainties in estimating depreciation rates for property loss through natural disasters (BTE, 2001).

Impacts of Climate Change in the Western Port Region
Final Report Page 60
ANUFLOOD18, which is now used extensively in relation to inland flooding to derive damage cost curves for housing and commercial buildings. Costs are correlated in the model to the projected flood height above floor level. In principle, a similar approach could also be used to derive a damage cost curve for given coastal inundation scenarios.
Unfortunately, there is insufficient high-resolution, coastal elevation and other data to derive damage cost curves by these means. Instead, a rough estimate of potential damage costs to residential properties in the region has been made by applying the rapid appraisal method of floodplain management to a coastal inundation scenario. Under the rapid appraisal method (Read Sturgess & Associates, 2000), the average cost of flood damage per residential property has been estimated at $25,60019. Applying this sum to the 555 residential properties in the region that are currently exposed to 1 in 100 year storm surge, gives an estimated $14.2 million in damage costs to residential properties in the region associated with each inundation, noting that a current 1 in 100 year storm surge could become a 1 in 1 to 1 in 4 year storm surge by 2070 (McInnes et al., 2007). This estimate is obviously subject to a great deal of uncertainty, not least because the estimates of flood damage and associated costs derived through the rapid appraisal method were intended to apply to inland flooding scenarios, not coastal flooding.
Public infrastructure
As discussed in section 3.2.4, a range of public coastal infrastructure including roads, port facilities and water and waste infrastructure are exposed to the effects of increased storm surge severity over the next 60 years. This infrastructure will be susceptible to damage as a result of storm surges, both the initial damage caused by erosion and flooding and in some cases, accelerated deterioration due to the effect of water intrusion. The cost of repairing flood damaged roads, for example, is estimated on average to be about $42,000 / km (see Table 4.18). However, there are insufficient data on the specific type and number of public coastal infrastructure in the region exposed to inundation or of the nature of the impacts of inundation to estimate damage costs associated with potential future inundation. Costs associated with exposure of local government infrastructure to a range of climate variables are examined further in Chapter 8.
3.3.2. Indirect market costs
Other indirect costs will be associated with storm surges and coastal inundation that are not due directly to the inundation.
These include the costs of disruption to business and costs of emergency services and volunteers in responding to the impacts of a major storm surge.
When examining costs such as disruption to business, consideration must be given to whether a local or national perspective is taken. In this study a local perspective is taken, meaning that loss of business to firms located in other parts of Australia is regarded as an economic cost to the Western Port region.
Disruption to business
Coastal inundation is likely to disrupt business activity, both in the short-term and longer-term. The regional sector most likely to be affected in this way is tourism, especially 18 The model is discussed further in Chapter 4. 19 $20,500 in 1999 (Read Sturgess & Associates, 2000)

Impacts of Climate Change in the Western Port Region
Final Report Page 61
tourism associated with beaches and coastal activities - which is probably most of the tourism in the region. As discussed in 3.2.5, beaches and foreshore reserves throughout the region are likely to bear the brunt of long-term sea-level rise, extreme tides and storm surges. As well as having social, cultural and environmental impacts (see following section) increased erosion, degradation and even loss of many of the region’s beaches would have serious implications for the region’s tourism sector.
For example, in 2005 beach related tourism expenditure in the region is estimated to have been approximately $482 million20. This is approximately 55% of output of the region’s tourism and hospitality sector. The value of beach related tourism to the regional economy will be less than this, perhaps in the order of $75 to $150 million or one to two percent of GRP21. Even so, a large loss of the region’s beaches and coastal precinct as a consequence of storm surges and inundation, even on a temporary basis, would have a significant impact on the region’s economy and could be catastrophic for the region’s tourism sector, especially in Mornington Peninsula Shire and Bass Coast Shire where tourism provides 9.4 % and 7.1 % respectively of the value of local output (see Table 2.8). However, the extent of impacts to the region’s tourism industry will clearly be affected by a number of factors, including the location, scale, timing and permanency of impacts to the region’s beaches. For example, affected beaches that are located in areas with high visitation rates will have greater consequences for the tourism industry than beaches with low visitation rates, especially if impacts occur at the start of the peak tourism season. Output of other sectors with links to tourism, notably wholesale and retail trade, will also be affected.
Other business activities most likely to be disrupted by future inundation are those associated with the industrial facilities located in Hastings and businesses dependent on port facilities, particularly in Western Port Bay. The activities of these businesses could be directly curtailed by coastal inundation events.
Business activities dependent on the use of exposed transport corridors could also be affected. For example, the Bureau of Transport Economics (2001) estimates road transport delay costs to be in the order of $39 / vehicle hour for business cars, $34 / vehicle hour for laden trucks and $16 / vehicle hour for commuting and other private vehicle trips (converted to 2007 dollars). Businesses dependent on the use of major exposed transport corridors, such as the Nepean Highway in Mornington Peninsula Shire and South Gippsland Highway in Casey, could be particularly vulnerable.
Other activities worthy of note are the utility networks: electricity and gas supply, water supply, waste water and telecommunications. Economic costs resulting from the impacts of inundation on this infrastructure will result not so much from damages to the infrastructure itself (although significant damage resulting from inundation and/or erosion is possible), but indirectly from disruption to the network services. Of the network services, water and waste water services appear to be most threatened by coastal inundation. As discussed in 3.2.4, water services in Bass Coast and drainage services in Casey and Cardinia appear to be vulnerable due to more frequent exposure of some of the relevant infrastructure in the future.
20 Estimate based on data in Tourism Victoria 2006a, 2006b. 21 Based on producer surplus to expenditure ratio for the Australian tourism industry of approximately 15 to 30%.

Impacts of Climate Change in the Western Port Region
Final Report Page 62
It is not possible to estimate the extent of financial impact on the business activities discussed above, since the level of disruption to activities will depend on the infrastructure and services impacted and the duration and severity of disruption. Also, it is important to note that net regional economic costs resulting from any disruptions will tend to be lower than the sum of financial costs on affected businesses, since other local businesses unaffected by the inundation will likely benefit from increased business activity. Exceptions to this outcome are the industrial facilities located in Hastings. These industries are important to the regional economy (see Table 2.8). Importantly, they are not replicated elsewhere in the region or indeed the state. Thus, any loses incurred by them will equate to regional economic losses.
Other indirect market costs
Other indirect market costs that could result from coastal inundation include:
disruption of public services associated with infrastructure such as schools and hospitals;
cleanup costs; and
emergency service costs.
Infrastructure exposure information discussed in 3.2.4 indicates that no hospitals or schools are directly exposed to inundation, even under the worst case scenario in 2070. As discussed in section 3.2.4 though, a range of other public coastal infrastructure including roads, port facilities and water and waste infrastructure are exposed to the effects of increased storm surge severity over the next 60 years. As well as having direct infrastructure damage costs, services are likely also to be disrupted as a result of infrastructure inundation - both directly (e.g. water and waste water services) and indirectly (e.g. emergency service provision as a result of the inundation of roads22). It is not possible to be precise about the costs of service disruption other than to note earlier studies which indicate that the costs associated with service provision can be as great or greater than the direct costs of damage to infrastructure (BTE, 2001; Read, Sturgess & Associates, 2000).
Cleanup costs resulting from an inundation event could be quite significant. The BTE (2001) estimates average cleanup costs for public buildings affected by floods to be in the order of $10,000 (in 1999 dollars) for public buildings and 20 person days (at average weekly earnings) and $330 in materials per household. Considering just residential properties currently exposed to a 1 in 100 year storm surge23, potential cleanup costs for each inundation event could be in the order of $1.1 to $1.5 million24.
3.3.3. Intangible (non-market) costs
Intangible costs refer to direct and indirect impacts that do not normally have a market value and therefore do not have a commonly agreed method or unit of valuation. They include loss of life and other health impacts, loss of memorabilia, ecological and cultural 22 Issues associated with emergency response are examined in Chapter 9 in the context of various climate impacts. 23 Noting that in a worst case scenario in 2070 the frequency of inundation of these properties could be 1 in 2 to 1 in 4 years. 24 Assumes approximately 750 affected residences and average household weekly income of $989.

Impacts of Climate Change in the Western Port Region
Final Report Page 63
damages, destruction of community life and loss of leisure. Research reported in BTE (2001) and Handmer (2003) suggests that communities generally value the intangible costs of natural disasters at least as great as the tangible dollar losses.
Below we discuss the two categories of intangible costs that are most likely to be significant in the context of coastal inundation in the Western Port region:
health and safety impacts; and
amenity impacts associated with potential damage to or loss of beaches.
Health costs
The potential health impacts of coastal inundation associated with sea-level rise and storm surge include mortality, injury, stress and stress-related illnesses. The extent of these health impacts in the future will depend on a range of factors including:
the number and type of people affected;
the characteristics of the storm surge event;
the frequency of events; and
the warning time given to local residents.
Given uncertainties in relation to these variables, it is difficult to make even generalised statements about the potential health impacts of future coastal inundation events in the region. However, (in the context of flood management) Reed Sturgess & Associates (2000) suggest that in the absence of data on all of relevant variables, the most significant determinant of the size of the likely impact of flooding on human health and mortality is the size of the resident population ‘at risk’. Given this, and available data on the number of residents exposed to future coastal inundation relative to the number of residents exposed to other climate events, it can reasonably be argued that the health costs associated with coastal inundation in the region are likely to be substantially less than the health impacts of other hazards associated with climate change such as bushfires (Chapter 5) and (especially) extreme temperatures (Chapter 6).
Amenity losses associated with inundation and erosion of beaches and coastal reserves
Beaches and coastal reserves in the Western Port region provide substantial direct and indirect benefits to local communities. Visitors from outside the region also derive benefits from the region’s beaches, with an estimated 9.8 million person day visits to the region in 2005, a large majority of the visits being linked to its beaches and coastal reserves (Tourism Victoria, 2006a, 2006b).
Values associated with beaches and coastal reserves include:
ecological / natural (not discussed in detail in this report);
leisure, recreation and wellbeing;
educational; and
cultural heritage.

Impacts of Climate Change in the Western Port Region
Final Report Page 64
Leisure and recreation
A preliminary estimate of the economic value of the leisure and recreational benefits threatened by coastal inundation has been made, based on a previous analysis of the economic value of public land in Victoria (MJA, 2004b). In the previous analysis, recreation and visitation values of coastal public lands in Victoria are estimated to be more than $1 billion dollars annually (in 2004 dollars). Using visitation numbers to the beaches, reserves and piers located in the Western Port region, similar estimates have been derived for the region. These estimates indicate that the annual value of visitations to the region’s coasts in 2004 was $397 million (Table 3.21). As discussed in section 3.2.5, the non-market values that this estimate quantifies could be substantially threatened in the longer term by sea-level rise, storm surge and coastal erosion.
Table 3.21: Recreation and visitation values of coasts and beaches in the Western Port region, 2004 ($ million)
Consumer surplus ($ million)
Victoria Western Port region
Beaches 734 291
National/state parks (coastal) 223 68
Piers 53 21
Crown Land Reserves (coastal) 31 10
Phillip Island Nature Park 7 7
Total 1,048 397 Source: Analysis based on MJA, 2004
The estimates provided in Table 3.21 are preliminary (in that they are not based on detailed regional data) and limited (in that the range of non-market values assessed is quite narrow). Nevertheless, they are sufficient to suggest that non-market values are potentially the most significant of all values threatened by sea-level rise and storm surge in the Western Port region.
Cultural heritage
There are numerous cultural heritage values associated with the region’s coastline, linked to both Aboriginal history and post-settlement history. These values and associated sites of significance are discussed in the region’s foreshore management plans (e.g. Dromana Foreshore Committee of Management, 2003; URS, 2004) and in some cases are identified and protected through local planning schemes and state and national legislation (e.g. Commonwealth Aboriginal and Torres Strait Islander Heritage Protection Act 1984).
It is likely that many sites of significance, located on either beaches or foreshore reserves, will be threatened by coastal inundation. However, detailed archaeological surveys, in conjunction with site-specific coastal inundation mapping, are required to identify threatened sites.

Impacts of Climate Change in the Western Port Region
Final Report Page 65
3.4. Summary of Potential Implications of Exposure to Storm Surge Inundation in the Western Port Region
Sector/LGA Summary of Potential Storm Surge Exposure and Impacts Locations
Bass Coast • Additional 0.8–3.4 km2 inundated by 1 in a 100 year storm surge in 2070, particularly the Bass River flood plain and foreshore reserves Cardinia • Additional 0.3–1.3 km2 inundated by 1 in a 100 year storm surge in 2070, particularly the foreshore reserves and tidal wetlands
Casey • Additional 0–0.3 km2 inundated by 1 in a 100 year storm surge in 2070, particularly low-lying areas and wetlands around Warneet and east of Tooradin
Frankston • Little change in storm surge inundation by 2070, but potential for sea-level rise impacts to Frankston foreshore and Oliver’s Hill MPS* • Additional 0.3–1.3 km2 inundated by 1 in a 100 year storm surge in 2070, particularly foreshore areas and low-lying areas around Hastings
Populations Bass Coast • An estimated 559 current residents in 261 dwellings would be exposed given storm surges corresponding to a 1 in a 100 year event in 2070.
Particular at-risk populations include low-income and/or elderly residents associated with Phillip Island townships. Cardinia • Limited direct public exposure
Casey • An estimated 236 current residents in 24 dwellings would be exposed given storm surges corresponding to a 1 in a 100 year event in 2070. At-risk populations include low-income and/or elderly residents in Warneet and Tooradin as well as exposed business owners.
Frankston • Limited direct public exposure
MPS • An estimated 1,401 current residents in 637 dwellings would be exposed given storm surges corresponding to a 1 in a 100 year event in 2070, Retiree communities in the south around Portsea and Sorrento and low-income households around Hastings may be particularly vulnerable.
Property
Bass Coast • $160 million of property exposed to 1 in a 100 year storm surge by 2070, particularly rural properties adjacent to Bass River flood plain and
exposed areas of Philip Island townships. Damage costs from storm events and loss of property value due to erosion and inundation likely to rise.
Cardinia • $9 million of property exposed to 1 in a 100 year storm surge by 2070, such as rural properties in the south and within Koo-Wee-Rup Swamp. Damage costs from storm events and loss of property value due to erosion and inundation likely to rise.
Casey • $44 million of property exposed to 1 in a 100 year storm surge by 2070, particularly low-lying coastal areas around townships of Warneet and Tooradin. Damage costs from storm events and loss of property value due to erosion and inundation likely to rise.
Frankston • Limited property exposure.
MPS • $565 million of property exposed to 1 in a 100 year storm surge by 2070 including residential property adjacent to foreshore beaches,
commercial/industrial properties around Hastings. Damage costs from storm events and loss of property value due to erosion and inundation likely to rise.
Infrastructure
Bass Coast • Potential for inundation of some secondary and tertiary roads in Phillip Island townships and those adjacent to Bass River flood plain.
Increased road maintenance costs associated with flood damage. • Isolated exposure of water and sewerage infrastructure. • Boating facilities.

Impacts of Climate Change in the Western Port Region
Final Report Page 66
Cardinia • Drainage infrastructure associated with Koo-Wee-Rup Swamp. • South Gippsland Highway just east of Casey inundated by 1 in a 100 year storm surge by 2070. Increased road maintenance costs associated
with flood damage. • Boating facilities.
Casey
• Harwood Aerodrome inundated by 1 in a 100 year storm surge by 2070 • South Gippsland Highway east of Tooradin may be at risk of inundation during storm events later in the century. Increased road maintenance
costs associated with flood damage. • Increased exposure of water infrastructure. Storm water outfall near Warneet inundated by 1 in a 100 year storm surge by 2070. • Boating facilities around Warneet and Tooradin and Warneet.
Frankston • Boating facilities
MPS
• Nepean Highway in the northwest inundated by 1 in a 100 year storm surge by 2070, as well as a number of secondary and tertiary roads. Increased road maintenance costs associated with flood damage.
• Rail infrastructure in northwest and around Hastings. • Port of Hastings and associated infrastructure and industries as well as other public boating facilities. • Increased exposure of water and sewerage infrastructure. Storm water outfall near Hastings inundated by 1 in a 100 year storm surge by
2070. Business Activity
Bass Coast • Some potential for storm events to interrupt business activity in the townships of Phillip Island.
Cardinia • Potential for storm surge inundation of South Gippsland Highway could disrupt transport and commerce in the region. However, few business areas appear to be directly exposed to storm surge events.
Casey • Potential for storm surge inundation of South Gippsland Highway could disrupt transport and commerce in the region. Businesses in coastal
townships of Warneet and Tooradin also at risk from transport disruptions, increased risk of flood damages, loss of revenue during storm events or loss of revenue associated with loss of regional amenity value.
Frankston • Direct implications for business activity appear limited. However, indirect effects associated with loss of amenity to Frankston Foreshore could affect services and tourism.
MPS • Operations at industrial facilities at Hastings could be disrupted by storm events. Tourism and service industry could be affected by long-term impacts of sea-level rise and storm events on region’s housing, property, and coastal amenity.
Public Health Bass Coast
Cardinia Casey
Frankston MPS
• Limited direct risk to public health from sea-level rise and coastal hazards due to small size of exposed populations. However, elderly individuals as well as those with limited mobility or financial means may be at greater risk.
Amenity Bass Coast
Cardinia Casey
Frankston MPS
• Potential for significant impacts to amenity values of beaches and coastal reserves resulting from increased inundation risk and coastal erosion. Amenity values include ecological assets, recreational opportunities, and cultural values attached to locales and site-specific activities. Impairment of amenity also has implications for business activity (see above).
*MPS - Mornington Peninsula Shire

Impacts of Climate Change in the Western Port Region
Final Report Page 67
4. IMPACTS ASSOCIATED WITH INTENSE RAINFALL
AND INLAND FLOODING
Chapter Summary
• Flood events represent the costliest natural disaster in Victoria and Australia as a whole, and with at least 620 km2 of flood prone areas in the Western Port region, flooding poses a substantial and wide-spread risk.
• Future changes in climate, particularly significant increases in short-to-moderate duration extreme rainfall events is anticipated to increase the frequency of floods and magnitude of flood levels in at-risk areas and may potentially expose new areas to harm.
• Flood mapping in the region is an ongoing process, with some flood prone areas still to be mapped. Based on current information, an estimated 18,000 properties with a total capital improved value of almost $2 billion are vulnerable to flood events. Approximately 13,000 of the properties are residential, about 40% of which contain dwellings that are vulnerable to above-floor flooding.
• Despite the total value of assets in harm’s way, the potential implications of climate change for above-floor flooding suggests that increases in the magnitude of damages to residential and commercial properties from changing rainfall extremes may be relatively modest. However, there could well be a significant increase in the frequency of any given flood event and associated damage costs.
• Further, flooding also has the potential to disrupt much of the region’s transport infrastructure including major surface roads and highways as well as rail services, while a range of businesses, industries and public services and utilities are also vulnerable to disruptions from flooding. These indirect economic costs could be significant relative to direct damages.
4.1. Inland Flooding in Western Port: The Issues Extreme rainfall events and the management of the subsequent runoff is a fundamental challenge for many urban and rural regions.
High magnitudes of rainfall over short-time windows can contribute to high levels of runoff that increase flood risk in drainage areas (Fowler and Kilsby, 2003). The challenge is particularly acute for urban environments due to the large proportion of impervious land cover (e.g., buildings, roads, parking lots) that causes a much higher proportion of runoff per unit of rainfall than in natural landscapes.
Furthermore, urban development often disrupts the natural drainage of the landscape, and development may occur in what otherwise would be wetland or floodplain areas. Nevertheless, even in rural areas, there is still significant flood risk, particularly in areas adjacent to creeks, streams and rivers where flow levels may rise in response to significant rainfall in upstream catchments. Rural areas also may have lower levels of drainage infrastructure and flood protection to manage large magnitudes of runoff and conduct it safely away from property and infrastructure.
A major flood in 1934 reportedly left the main street of Koo-Wee-Rup under 1.8 metres of water after an estimated 140 mm (perhaps more) of rain fell in two days (see Box 3).

Impacts of Climate Change in the Western Port Region
Final Report Page 68
Quite often, flood events result in economic damages arising from both insured and uninsured losses. The Bureau of Transport and Regional Economics reviewed natural disasters in Australia between 1967 and 1999 (BTE, 2001). That review concluded that floods were the most costly of disasters, accounting for 29% or $10.9 billion in damages. The proportion was even higher in Victoria, with floods representing 41.1% or $1.2 billion in damages. For example, an estimated 1 in 100 year flood affected Traralgon, Gippsland in 1978 causing $627,000 in damages25. Flood events in West Gippsland in 2001 resulted in approximately $138,548 in damages26. A flood study of the Macalister River in West Gippsland estimated the costs associated with a 1 in 100 year flood at $1,350,000. These represent the direct costs of flooding. However, additional indirect costs arise due to lost productivity associated with clean up times and temporary displacement (BTE, 2001).
Hence, communities make significant investments in storm water management networks, designed to safely store, retard or conduct storm water runoff to suitable discharge points. Such measures are particularly common in urban areas due to the large proportion of impervious surface combined with dense populations and development that would otherwise lie in harm’s way. When the capacity of such drainage networks is exceeded and/or further development alters the flow of runoff, localised flooding can occur. For example, the severity of the 1934 flood to Koo-Wee-Rup was partly attributed to inadequate drainage infrastructure, leading to significant expansion of that infrastructure in the wake of a Royal Commission held to investigate the floods (Box 4.6; Roberts, 1985).
The sensitivity of different areas of the Western Port region to extreme rainfall events is a complex interaction of topography, land use and cover, and soil conditions. Topography influences the drainage pathway of runoff across the landscape, which is influenced by relative elevation between points and the slope of the landscape (Liu and Todini, 2002). Generally, higher elevation areas with steep slopes are less vulnerable to flooding, as rainfall is more likely to runoff to lower elevation plains and depressions, provided flow paths are available. Land cover dictates the extent to which rainfall can penetrate into the soil, attenuating runoff (Liu and Todini, 2002).
In more urban environments, areas that are densely developed are assumed to have a higher proportion of impervious surface, resulting in a high rate of runoff (Carlson and Arthur, 2000). More natural landscapes and particularly those with significant vegetation are assumed to retard runoff locally resulting in a lower fraction of immediate runoff, although catchments may continue to discharge into surface water networks over time.
Finally, the ratio of rainfall to runoff is also influenced by the existing saturation state of the soils (i.e. the amount of water those soils can hold; Bronstert et al., 2002). This is a parameter that varies considerably over time depending upon the timing of rainfall, temperature and evaporation, and the structure of the soil. Nevertheless, across a landscape, some areas will tend to have higher capacities to hold water than others, which again may increase the potential for those soils to absorb rainfall and retard runoff.
25 Source: http://www.ga.gov.au/oracle/flood/flood_studies.jsp 26 Source: http://www.ses.vc.gov.au

Impacts of Climate Change in the Western Port Region
Final Report Page 69
Box 4.6: The Koo-Wee-Rup ‘Super Flood’
Victoria experienced her worst flooding of the twentieth century early in the summer of 1934. There were thirty-five fatalities and over 6,000 people were made homeless across the state (BoM, 2007).
One of the most severely affected areas was Koo-Wee-Rup, an agricultural centre developed on 40,000 hectares of reclaimed swampland in the present day Cardinia Shire. The area had a history of serious floods from the time the ambitious drainage scheme commenced in 1889. The ‘Super Flood’ of 1934 was a result of a heavy rain burst on November 30 and December 1. It is estimated that rainfall peaked at 97,840 megalitres per day. The Bunyip River broke its banks and almost the entire Koo-Wee-Rup Swamp was flooded. The high ground at the railway station became a safe haven for one thousand people made homeless. The police used fifteen rowboats to rescue people trapped in their ceilings and on their roofs. Forty thousand hectares were covered with water and most buildings in the town were flooded up to their veranda tops. Luckily there was no loss of life due, it is believed, to flood waters hitting the town at 8.30am in the morning before most shops and businesses had opened.
There were whole herds of cattle washed away down the drains and drowned. Cows, horses, pigs, everything went down with the flood… A lot of those were washed out into the bay and then when the tide came in they were washed back. They went out with the flood and went in with the tide. A lot of people were in the old hall in the street. They were camped on the stage. A cow floated in the hall while they were there, a dead cow… Mr Frank Egan (BoM, 2007).
After another flood the following year, further work was carried out on the drainage system. A Royal Commission was established to investigate all Waterworks in Victoria in 1935 as a result of the flooding (Roberts, 1985).
The direct impact of climate change on flood risk in the Westernport region depends on the geophysical specifics of each settlement and catchment. As noted by Melbourne Water (2005), “flood impacts are likely to be site specific and will need to be reviewed for local conditions and in the context of local flood management controls and investment”.27
Critical duration storm events will differ between settlements, and climate change is expected to have varying impacts on different duration rainfall events (Abbs et al., 2006; 2008). The impacts of climate change may also influence flood risk indirectly. For example, in the wake of a bushfire event, substantial increases in runoff are often observed in fire-affected catchments (Gallucci et al., 2007).
27 In the Hawkesbury-Nepean corridor of NSW, an increase in flood event from one in twenty years to one in one hundred years corresponds to 10 metres of inundation. In contrast, many inland locations in both New South Wales and Queensland experience flood height ranges of only a metre or so and climate change would have insignificant effects on failure potential.

Impacts of Climate Change in the Western Port Region
Final Report Page 70
Figure 4.22: Projected fractional change in extreme rainfall events in the Port Phillip Bay and Western Port Bay region of Victoria in 2030 and 2070
Changes greater than 1.0 indicate an increase in extreme rainfall, while changes less than 1.0 indicate a decrease (Abbs et al., 2006, 2008).
Box 4.7: Implications of Extreme Rainfall Changes for Urban Impacts – Simulations from New South Wales
While there have been few studies of the direct implications of changes in extreme rainfall on flooding and damage costs, some assessments conducted for New South Wales provide some perspective. A modelling study by Schreider et al. (2000) concluded that for a doubling of the preindustrial concentration of atmospheric carbon dioxide, the 1 in 100-year flood under current conditions would become a 1 in 44-year event for the Upper Parramatta River, a 1 in 35-year flood for the Hawkesbury–Nepean and a 1 in 10-year flood for Queanbeyan and Canberra. Meanwhile, a study by Minnery and Smith (1996) found that climate change may double flood-related damages in urban areas of NSW (see also Smith, 1998; Schreider et al., 2000). These studies provide some sense of the scale of changes in both natural hazards and their socio-economic impacts. Despite being generated for a region far removed from Western Port, the general finding of significant increases in extreme rainfall events and a reduction in storm return periods in the Western Port region in future decades suggests that flooding and damages are likely to rise. This is particularly true for those areas that are experiencing rapid population growth and development that is increasing the financial exposure to natural hazards.
2-hr 24-hr 72-hr
2030
2070

Impacts of Climate Change in the Western Port Region
Final Report Page 71
4.1.1. Extreme rainfall projections for the Western Port region
Climate change is projected to alter the frequency and/or intensity of extreme rainfall events in Victoria, including the Western Port region (Figure 4.22). The projections generated as part of this project, indicate return intervals for extreme rainfall events or varying durations (1 to 96 hours) will change significantly in the decades ahead. However, the spatial distribution of extreme rainfall change varies considerably over the Western Port region. Furthermore, these changes vary significantly over time and with the event in question. Where increases in extreme rainfall events occur, flood risk and damages are also anticipated to rise unless stormwater management infrastructure and flood mitigation measures are updated. In fact, Minnery and Smith (1994) argue that “for urban areas the most significant climatic impacts are likely to result from an increased frequency of extreme events, including flooding”. It should also be noted that the storm systems associated with extreme rainfall may cause damages in their own right, independent of rainfall (Box 4.8).

Impacts of Climate Change in the Western Port Region
Final Report Page 72
Box 4.8: Windiness and Storms - A Cross-Cutting Issue
While this report examines the impacts of different climate changes in a rather discrete manner, in reality many of these biophysical changes interact and multiple extremes may occur simultaneously. A good example of this phenomenon is that of storms and their associated high winds. While wind has significant potential for causing damages within Australian settlements, it is often associated with some of the other impacts addressed in this report, such as storm surge and/or extreme rainfall.
The consequences of high winds are perhaps best appreciated in northern Australia where tropical cyclones periodically make landfall along the Australian coastline. While heavy rainfall and high storm surges are a routine consequence of cyclones, the high winds associated with these storm systems are often a major cause of coastal damages in their own right. However, even in other regions of Australia that are not exposed to tropical cyclones, severe storms and the associated winds represent a major fraction of disaster damages. In Victoria, the BTRE (2001) estimated that approximately 24% of disaster coasts in between 1967 and 1999 were associated with severe storms. Undoubtedly, a significant fraction of such damages can be attributed to wind. For example, wind was identified as a major contributor to insured losses in six of the top 20 storm events in New South Wales (Figure 4.23). Some of the most destructive winds in southern Australia are associated with tornadoes, such as those that occurred in eastern Melbourne in 2004, west of Geelong and in the vicinity of Bendigo in 2003.28
Figure 4.23. Causes of top 20 storm events for buildings in NSW insured through Insurance Australia Group
Source: Coleman (2002)
In contrast with temperature and rainfall, the projected implications for extreme winds are projected to be relatively modest. For example, Macadam et al. (2007) projected changes within ±5% out to 2030, although such changes increase by a factor of 2 to 3 by the latter half of the 21st century. Nevertheless, such relatively minor increases in extreme winds may yet have important
28 Source: Bureau of Meteorology - http://www.bom.gov.au/weather/vic/sevwx/Tornadofacts1.shtml

Impacts of Climate Change in the Western Port Region
Final Report Page 73
consequences due to the manner in which damages during wind events increase exponentially with rising wind speeds (Coleman, 2002). Observations of wind damages also suggest a critical threshold for wind speed of approximately 50 km/hour, above which damages increase significantly (Figure 4.24). Observations of wind speeds from the Western Port region indicate that speeds in excess of 40 km/hour are relatively common. Given that damages increase significantly above these levels, increases in average daily winds of a few percentage points could translate into rising damage costs. Nevertheless, the most damaging winds will continue to be associated with extreme storm events associated with synoptic frontal weather systems.
Figure 4.24: Response of housing damages to increasing wind speeds
Source: Coleman (2002)
In considering the exposure of different areas, settlements and infrastructure within Western Port region to extreme winds, the topography of the landscape is a critical consideration. Rough landscapes with significant vegetation or buildings tend to retard the flow of wind and, subsequently, wind speeds. In addition, the tops of hills are particularly susceptible to high winds, due to the fact that wind speeds generally increase with altitude and when winds encounter a hill or elevation of the landscape, they are forced upwards, increasing air flow over the top of the hill. In light of the effects of topography, the areas of greatest exposure to extreme winds in the Western Port region are likely associated with areas of relatively high elevation, such as Mornington Peninsula and Bass Coast, east of Phillip Island.
Housing and infrastructure that lies in at-risk areas for extreme winds are at greater risk of experiencing damages. Such damages may be direct, such as the toppling of towers, signs, buildings or utilities by wind gusts. Transportation may also be affected, as Rosetti (2002) found that extreme winds were the leading cause of environmentally-related rail accidents / incidents in the United States. However, indirect damages are also a common occurrence, such as tree falls that land on buildings, infrastructure or utilities.
Other relevant consequences of storm front include lightening and hail. Lightening strikes are one of the most common causes of bushfire ignition. Therefore, potential changes in storm events and lightening production have direct implications for bushfire damages. Meanwhile, damages from hail storms can be substantial, with the 1999 Sydney hail storm being one of the largest economic disasters in Australian history (Figure 4.23). Modelling studies suggest climate conditions conducive to hail generation as well as the formation of east coast lows will become more common in a warmer world (CSIRO and BOM, 2007).

Impacts of Climate Change in the Western Port Region
Final Report Page 74
4.2. Exposure
4.2.1. Methods for exposure assessment
The current study focuses on those areas of the Western Port region that are likely to be the most vulnerable to inundation and/or flooding during, or in the wake of, extreme rainfall events.
At-risk areas were identified from geographic data provided by the regional LGAs. For each LGA, an inundation/hazard layer was constructed based upon land subject to inundation overlays (LSIO) and/or overland flood areas of varying return periods, which were imported into a GIS. The current study treated locations associated with both types of hazards as ‘at-risk areas’, without distinguishing between the two. At-risk areas were converted to a vector polygon format. As with coastal inundation, these polygon layers were then used to interrogate a range of geographic data sets. Land areas, census collection districts, and assets intersecting inundation/flood hazard areas were treated as potentially exposed and associated populations, infrastructure and assets were subsequently quantified.
Additional information was sought regarding the potential for changes in extreme rainfall in each of the Western Port LGAs. Scenarios for changes in extreme rainfall events (1, 2, 4, 12, 24, 48, 72 and 96 hours) in the region were imported into a GIS as 5 km gridded data layers. Data were subsequently interpolated to approximately 2.5 km grids and converted to a vector polygon format, with polygons classified into different categories of extreme rainfall changes: -50 to -25%; -24 to 0%; 0 to +24%; +25 to +49%; and ≥+50%. These polygon layers were then used to estimate the percentage of land area in each LGA that experiences different magnitudes of change in extreme rainfall. Furthermore, the 2.5 km gridded data for extreme rainfall changes were averaged over the aforementioned inundation/flood hazard areas in each LGA to estimate extreme rainfall changes associated with those areas most at risk of inundation or flooding.
As with the storm surge exposure assessment, a number of uncertainties arise from this analysis. First and foremost, the analysis was based upon the integration of multiple data sets which were developed in different ways. Errors in the alignment of different data sources necessitates that results be interpreted with some caution. Furthermore, if any overlap between an inundation area and a census district, property or road segment existed, the entire CCD, property or segment was counted as exposed. This invariably results in an overestimate of the exposure of the population and assets. Hence, quantitative results should be treated as estimates designed to communicate the approximate scale of consequences.

Impacts of Climate Change in the Western Port Region
Final Report Page 75
Box 4.9. Key Uncertainties Associated with Inland Flooding Impact Assessment
1) The modelling methods utilised to generate high resolution simulations of extreme rainfall limit the exploration of the full range of uncertainty in future climate conditions reflected by the broad range of global climate models currently in use. Therefore, the estimated changes in extreme rainfall simulated as part of this project, while plausible scenarios, should be interpreted with some caution.
2) While the simulations of changes in extreme rainfall events and return periods provide information regarding the magnitude and duration of rainfall in future decades, translating this information into estimates of flooding requires the use of a hydrological model. Such modelling was not undertaken as part of this study. Nevertheless, while the magnitude of flooding, its spatial distribution and its economic implications remain uncertain, it is possible to conclude with some confidence that the risk of flooding and damages will increase.
3) The storm systems associated with extreme rainfall events are often associated with storm surge events as well. Therefore, inland and coastal flooding is often driven by both of these processes acting in unison. Effects of such coincident events are not captured in the study, but such interactions should be kept in mind, particularly where natural drainage features or infrastructure drain to the coast.
4) The quality of current information regarding at-risk areas, properties, infrastructure and their value within the Western Port region was an important constraint on the analysis. Accurate knowledge regarding inundation/flood risk throughout the region remains incomplete and long-term investments in flood studies and hydrological modelling will be necessary to develop a comprehensive understanding. To the extent that future work reveals more information about the risk at various locations, estimates of future implications of climate change and flood damages will have to be updated.
5) As with sea-level rise and storm surge impacts, it is difficult to foresee how future patterns of development will influence the vulnerability of future regional settlements to flooding. Similarly, it is difficult to foresee how future risk management decisions may influence the nature of flood hazard.
4.2.2. Exposed areas
Examination of the distribution of inundation/flood hazard in the Western Port region reveals an extensive area of potential hazard along the north to northeast extent of Western Port Bay.
This risk is largely driven by the topography of the area, which is low-lying – generally only a few metres above sea-level (Figure 4.25). The inundation/flood hazard in the area is perhaps best evidenced by the presence of Koo-Wee-Rup Swamp, a dominant geographic feature of the area. Though extensively drained over the 20th century, the low-lying nature of the land makes it susceptible to inundation and flooding. Furthermore, the fact that much of the land area exposed to inundation/flood hazard is

Impacts of Climate Change in the Western Port Region
Final Report Page 76
continuous with the coastline of Western Port Bay means the area is susceptible to inundation from both future sea-level rise and extreme rainfall events.
Additional areas of inundation/flood hazard occur throughout the Western Port region in association with natural drainage features. These may also be susceptible to flooding during extreme rainfall events as they represent principle conduits for conducting runoff. For example, a number of hazard locations exist in northern Casey and Cardinia Shire associated with such natural drainage. Similar hazard areas can be observed along the Western Port Bay side of Mornington Peninsula and around the Bass River in Bass Coast Shire. Additional flood hazard is associated with urban development due to the presence of significant impervious surface that contributes to considerable stormwater runoff. For example, significant land areas in Frankston are associated with either 20, 50, or 100 year flood levels. Similarly, much of the northern extent of Phillip Island has been identified as an urban stormwater management area.
Figure 4.25: Spatial distribution of existing inundation/flood prone areas within the Western Port region
Considering the spatial distribution of flood hazard in the context of each Council, it appears that much of south-eastern Casey and the southern half of Cardinia are associated with significant inundation/flood hazard. Cardinia in particular is associated with almost 80% of the identified inundation/flood hazard areas in the Western Port region (Table 4.22).
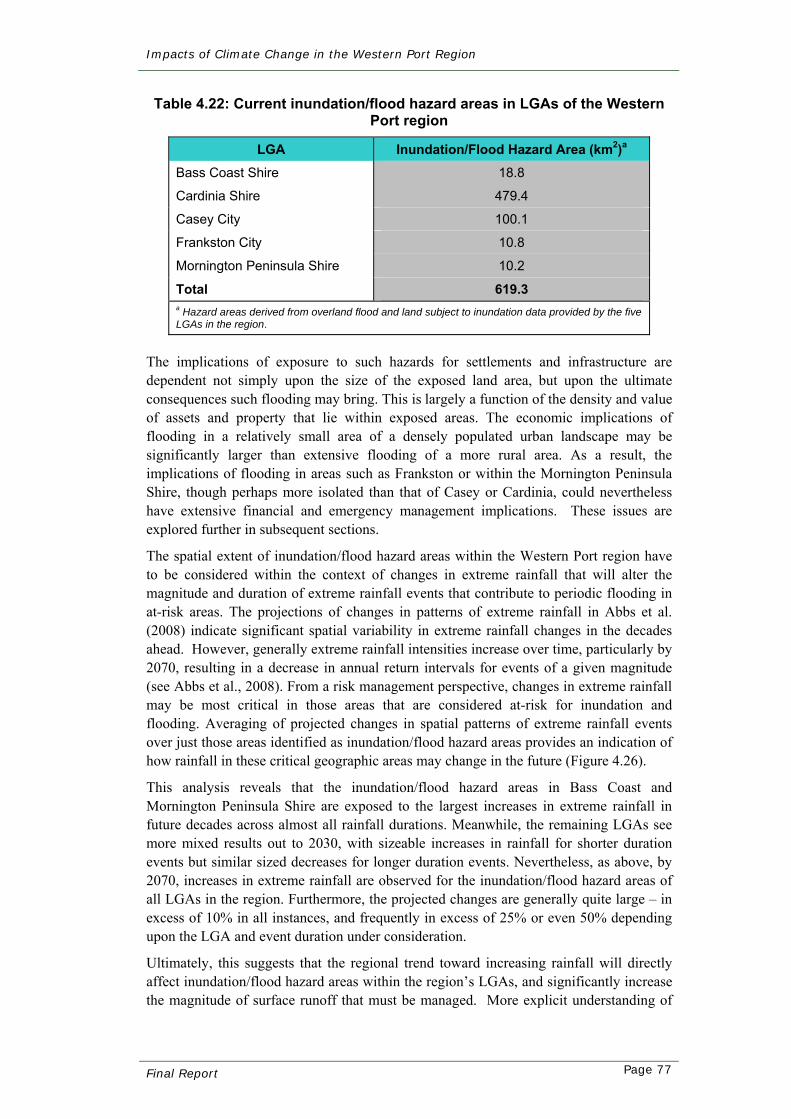
Impacts of Climate Change in the Western Port Region
Final Report Page 77
Table 4.22: Current inundation/flood hazard areas in LGAs of the Western Port region
LGA Inundation/Flood Hazard Area (km2)a
Bass Coast Shire 18.8
Cardinia Shire 479.4
Casey City 100.1
Frankston City 10.8
Mornington Peninsula Shire 10.2
Total 619.3 a Hazard areas derived from overland flood and land subject to inundation data provided by the five LGAs in the region.
The implications of exposure to such hazards for settlements and infrastructure are dependent not simply upon the size of the exposed land area, but upon the ultimate consequences such flooding may bring. This is largely a function of the density and value of assets and property that lie within exposed areas. The economic implications of flooding in a relatively small area of a densely populated urban landscape may be significantly larger than extensive flooding of a more rural area. As a result, the implications of flooding in areas such as Frankston or within the Mornington Peninsula Shire, though perhaps more isolated than that of Casey or Cardinia, could nevertheless have extensive financial and emergency management implications. These issues are explored further in subsequent sections.
The spatial extent of inundation/flood hazard areas within the Western Port region have to be considered within the context of changes in extreme rainfall that will alter the magnitude and duration of extreme rainfall events that contribute to periodic flooding in at-risk areas. The projections of changes in patterns of extreme rainfall in Abbs et al. (2008) indicate significant spatial variability in extreme rainfall changes in the decades ahead. However, generally extreme rainfall intensities increase over time, particularly by 2070, resulting in a decrease in annual return intervals for events of a given magnitude (see Abbs et al., 2008). From a risk management perspective, changes in extreme rainfall may be most critical in those areas that are considered at-risk for inundation and flooding. Averaging of projected changes in spatial patterns of extreme rainfall events over just those areas identified as inundation/flood hazard areas provides an indication of how rainfall in these critical geographic areas may change in the future (Figure 4.26).
This analysis reveals that the inundation/flood hazard areas in Bass Coast and Mornington Peninsula Shire are exposed to the largest increases in extreme rainfall in future decades across almost all rainfall durations. Meanwhile, the remaining LGAs see more mixed results out to 2030, with sizeable increases in rainfall for shorter duration events but similar sized decreases for longer duration events. Nevertheless, as above, by 2070, increases in extreme rainfall are observed for the inundation/flood hazard areas of all LGAs in the region. Furthermore, the projected changes are generally quite large – in excess of 10% in all instances, and frequently in excess of 25% or even 50% depending upon the LGA and event duration under consideration.
Ultimately, this suggests that the regional trend toward increasing rainfall will directly affect inundation/flood hazard areas within the region’s LGAs, and significantly increase the magnitude of surface runoff that must be managed. More explicit understanding of

Impacts of Climate Change in the Western Port Region
Final Report Page 78
the implications of such changes in rainfall for at-risk areas requires the completion of localised hydrological and flood modelling. Such work was not undertaken as part of this study. Nevertheless, even the first order comparison of spatial coincidence between changes in extreme rainfall and at-risk areas suggests an increase in the risk of adverse consequences to assets and infrastructure within those areas, and the potential for the expansion of risk beyond historical boundaries.
Figure 4.26: Average percentage change in extreme rainfall events associated with inundation/flood hazard areas in LGAs of the Western Port
region for 2030 (top) and 2070 (bottom)
Colour-coded columns for each LGA represent extreme rainfall events of different hourly duration (e.g., 1 hour through 96 hours). Positive values indicate an increase in the intensity of a particular event while negative values indicate a decrease.
2030
2070
0%
10%
20%
30%
40%
50%
60%
70%
80%
Bass Coast Cardinia Casey Frankston Mornington
Cha
nge
in E
xtre
me
Rai
nfal
l (%
)
12361224487296
-20%
-15%
-10%
-5%
0%
5%
10%
15%
20%
25%
30%
Cha
nge
in E
xtre
me
Rai
nfal
l (%
)
12361224487296
Bass Coast Cardinia Casey Frankston Mornington Peninsula Shire

Impacts of Climate Change in the Western Port Region
Final Report Page 79
4.2.3. Exposed populations
Based on existing data, the population estimated in 2006 to be exposed to inundation/flood hazards in the Western Port region totalled 39,101 or, roughly, 7% of the entire Western Port population (Table 4.23 and Figure 4.22).
There are some significant uncertainties about this estimate though. In particular, flood mapping in region is an ongoing process, with significant areas in Bass Coast Shire and most of the southern and western sections of Mornington Peninsula Shire yet to be mapped. Thus estimates of exposed properties in those two shires are likely to substantially understate the true number of properties exposed to flood hazards. In the other local government areas, on the other hand, there may be a small overestimate of the true population that occurs within land areas subject to inundation or flood areas due to differences in scale of property boundaries and inundation/flood hazard areas.
Notwithstanding these uncertainties, the information in Table 4.23 and Figure 4.27 provides some indication of the scale of the exposure of properties and people in the region to flood hazards.
Table 4.23. Sizes and densities of populations associated with current inundation/flood hazard areas in LGAs of the Western Port region
LGA Exposed Properties (#)a
Average Household
Sizeb
Exposed Population
(#)c
Population Density (#/km2)d
Bass Coast Shire 55 2.6 143 6.0
Cardinia Shire 3,134 2.8 8,775 24.1
Casey City 3,789 2.9 10,988 243.4
Frankston City 5,725 2.2 19,195 1,003.7
Mornington Peninsula Shire 204 2.6 530 69.1
Total 12,907 39,101 a Number of exposed properties estimated from the number of green wedge, residential and rural properties exposed to inundation/flood. b Average household size estimated from average household sizes for CCDs in each LGA intersecting with inundation/flood hazard areas. c Exposed population estimated by multiplying exposed properties and average household size d Population density estimated from population densities from CCDs in each LGA intersecting with inundation/flood hazard areas. Source: ABS 2006 Census
Another point to note regarding exposure estimates is that not all properties exposed to flood hazard have an equivalent level of exposure. For example, of the residential properties exposed to flood hazards, perhaps only 40% contain dwellings that are vulnerable to above-floor flooding. This point is discussed further in section 4.3.

Impacts of Climate Change in the Western Port Region
Final Report Page 80
Figure 4.27: Spatial distribution of existing properties associated with inundation/flood prone areas within the Western Port region
These statistics also highlight the importance of the density of population and development in exposed areas in determining the implications of inundation/flood risk on settlements. For example, those areas with the largest number of exposed individuals and dwellings occurred in those areas with the greatest population density (i.e. within Casey and Frankston City Councils; Figure 4.28). Although Casey was associated with significant land areas exposed to inundation/flood hazard, the area of exposure within Frankston was, in comparison, quite small. Nevertheless, Frankston is associated with the second highest exposure among LGAs in the region, largely due to the high density of housing and population within exposed areas.
The population exposed to inundation/flood events will undoubtedly change in the future in response to population growth and migration. For example, population in the five LGAs of the Western Port region increased by between 12% and 49% between 1996 and 2006. As such, there are more people, dwellings and infrastructure potentially in harm’s way at present than at any previous time. This trend of increasing exposure will continue in the future, with further population growth in the region of 45% projected over the next 25 years. As discussed in section 2.4, much of this growth is expected to occur in the growth corridor through Casey and Cardinia, including some on the fringes of the Koo-Wee-Rup Swamp. Guidelines are in place for developments within the flood protection area covering approvals, siting and flood level clearance (Melbourne Water, 2003), but these may need to be reviewed in light of new climate projections.

Impacts of Climate Change in the Western Port Region
Final Report Page 81
Figure 4.28: Population densities of census districts associated with existing inundation/flood hazard areas of the Western Port region
4.2.4. Exposed public infrastructure
In addition to land areas, housing and populations, a range of infrastructure is also exposed to inundation/flood hazard in the Western Port region.
Perhaps the most substantial infrastructure distributed throughout the region is that of transportation, drainage and water networks (Table 4.24, Figure 4.29). Again, such infrastructure is concentrated where it services more densely populated communities, but for transportation networks in particular, disruptions even in more sparsely populated areas can have downstream consequences. For example, disruption of key transport corridors by flooding can interrupt not only transport and commerce, but also emergency management.

Impacts of Climate Change in the Western Port Region
Final Report Page 82
Table 4.24: Existing road and rail Infrastructure associated with current inundation/flood hazard areas in LGAs of the Western Port region
LGA Road (linear km) a
Rail (linear km) a
Bridges (#)b
Bass Coast Shire 16 - 9
Cardinia Shire 942 62 N/A
Casey 309 47 N/A
Frankston City 148 8 26
Mornington Peninsula Shire 128 8 N/A
Total 1,543 125 35 a Data on the locations of road and rail infrastructure provided by the five LGAs in the region b N/A indicates data not available
Comparison of the geographic distribution of road and rail infrastructure in the Western Port region with inundation/flood hazard areas identifies those transport corridors that are potentially at risk. Naturally, the siting of transport infrastructure is often executed with consideration of hazards such as flooding. Furthermore, flood management plans and mitigation measures may be implemented to reduce the risk of flooding, such as the construction of levies or additional drainage channels. Urban areas, in particular, are associated with complex storm water drainage networks to safely conduct urban stormwater away from housing and infrastructure. Nevertheless, a total of approximately 1,543 km of road network and 125 km of rail network lie in potential inundation/flood hazard areas (Table 4.24).
The LGAs most heavily affected are those of Casey City and Cardinia Shire Councils, a function of the extensive low-lying land areas north of Western Port Bay. This places most of the road and rail network in the south of these LGAs at potential risk, although the true nature of the consequence would of course be closely tied to the magnitude of the flood event. Frankston City and Mornington Peninsula Shire Councils have a more isolated or concentrated exposure. Transport infrastructure at risk in Frankston includes the rail network running along the coast in the LGA’s northwest as well as the rail network in downtown Frankston. A number of bridges in Frankston, including four associated with the Frankston Freeway were also identified as infrastructure with potential exposure. In Mornington Peninsula Shire, exposed infrastructure was largely associated with land areas subject to inundation in the LGA’s northeast along Western Port Bay and included segments of the rail network leading to Hastings as well as surrounding roads. In contrast, the largely rural nature of Bass Coast Shire Council suggests marginal exposure, confined to road infrastructure that transects the Bass River flood plain including several bridges for the Bass Highway, Korumburra-Wonthaggi Road and Wonthaggi-Loch Road.
With the exception of Bass Coast, the water, sewer and drainage infrastructure of LGAs in the Western Port region are generally exposed to significant inundation/flood hazard arising from rainfall, particularly extreme rainfall events (For Bass Coast, the low population density combined with the relatively small area associated with inundation/flood hazard results in only half a kilometre of water infrastructure in harm’s way. In contrast, the remaining LGAs possess either extensive inundation/flood hazard areas (e.g., Cardinia and Casey) or have significant population and development densities in such hazard areas. For example, although a relatively small area within Frankston City

Impacts of Climate Change in the Western Port Region
Final Report Page 83
Council was identified as either land subject to inundation or overland flood areas, a total of 98.5 linear km of drainage pipes and 2,221 pits were located in these areas, largely due to the high density of development. Both Casey and Cardinia have over 100 km2 of inundation/flood hazard areas. Hence, dozens of kilometres of drainage lines in Casey City Council occur within at-risk areas, along with a large number of primary or auxiliary pits. While Cardinia has four times the hazard area as Casey, because much of this area lies in rural, undeveloped land, the exposed infrastructure is less than in Casey.
Figure 4.29: Spatial distribution of transportation infrastructure associated with current inundation/flood prone areas within the Western Port region
As with the exposure of regional infrastructure to storm surge, a range of other public and private facilities and infrastructure within inundation/flood hazard areas were evaluated. The extensive land area that is potentially at-risk of inundation or flooding translates into a diversity of properties and facilities being vulnerable to flood damage (Figure 4.30, Table 4.25). For example, sewer and water mains maintained by the region’s water wholesale and resale suppliers may be compromised during excessive rainfall and flood events. The Koo Wee Rup and Pakenham treatment plants in Cardinia lie in areas subject to inundation and flood, as does the treatment plant in Cranbourne. While the direct exposure of stormwater drainage infrastructure is not particularly problematic, changes in the dynamics of storm events may increase or decrease the demands on

Impacts of Climate Change in the Western Port Region
Final Report Page 84
drainage infrastructure. This may be particularly problematic if design standards for infrastructure are exceeded more frequently in a future climate, increasing the likelihood that drainage capacity is exceeded resulting in flooding. Therefore, climate change may threaten drainage infrastructure, but it will have implications for the management of existing infrastructure and, potentially, the design of new infrastructure.
The quantity of facilities at risk is proportional to population and development density, with downtown Frankston, northwest Casey and the community of Hastings most at risk. In Hastings, some of the types of facilities exposed include utilities, petrochemical and other industrial facilities, local government assets and land zoned for education. Similarly, in Frankston, industrial land, utilities (including part of the Eastern Treatment plant), educational facilities as well as medical facilities lie in harm’s way. In northwest (and to a lesser extent southeast) Casey, various industrial lands, electricity and other utilities, educational facilities, and local government assets are exposed. Cardinia Shire and Bass Coast Shire Councils had relatively less critical facilities exposed to flooding, with Cardinia’s exposure largely associated with drainage infrastructure around Koo-Wee-Rup Swamp. A small area of industrial properties adjacent to the Bass River northeast of Wonthaggi was identified as being potentially exposed in Bass Coast.
Figure 4.30: Spatial distribution of facilities/infrastructure in the Western Port region associated with current inundation/flood hazard areas
Facilities were identified from property descriptions or zone descriptions, depending upon the availability of information.

Impacts of Climate Change in the Western Port Region
Final Report Page 85
Table 4.25: Existing water, sewerage and drainage infrastructure associated with inundation/flood hazard areas in the Western Port regiona
LGA Exposure
Bass CoastWater (km) 0.5Sewer (km) 0.0
Cardinia Water (km) 87.3Sewer (km) 58.7
Sewer Pump Stations (#) 12Drainage Pipes (km) 29.1Channel Drains (km) 579.6
Pits (#) 891Casey
Water (km) 137.2Sewer (km) 129.0
Sewer Pump Stations (#) 11Drainage Pipes (km) 78.1
Channel Drainage Structures (#) 149Aux Channels (km) 10.1
Pits (#) 1,997Aux Pits (#) 27
Aux Drains (km) 1.7Aux Ponds (#) 1
Retarding Basins (#) 9Aux Pipes (km) 1.1
Pits (#) 26Frankston
Water (km) 99.3Sewer (km) 98.8
Sewer Pump Stations (#) 10Drainage Pipes (km) 98.5
Pits (#) 2,221Mornington Peninsula Shire
Water (km) 23.2Sewer (km) 30.0
Sewer Pump Stations (#) 4Drainage Pipes (km) 11.3
Pipes not Linked (km) 2.7Pits (#) 149
Pits not Linked (#) 23a Data on the locations of water and sewer infrastructure provided by Southeast Water, with the exception of Bass Coast Shire Council, where data were obtained from the Council. Data for sewer pump stations in Bass Coast were not available. b Data on the locations of drainage infrastructure provided by the five LGAs in the region.

Impacts of Climate Change in the Western Port Region
Final Report Page 86
Exposure of infrastructure to potential inundation or flood does not translate directly into consequence in the form of increased requirements for infrastructure or increased damage or maintenance costs to infrastructure or other buildings and assets. Acquiring such data about consequence requires detailed knowledge about the extent, magnitude, frequency and duration of flood events (gained through local hydrological modelling) combined with knowledge of the economic costs associated with infrastructure assets and flood damages (gained through insurance assessments and historical flood damage events). The projections for general increases in the intensity of extreme rainfall events in the Western Port region in the future, particularly in association with existing inundation/flood hazard areas within LGAs (Figure 4.26), give reasonable cause for concern about increasing risk of inundation/flood in the region in the future, and, subsequently, increases in costs or damages associated with infrastructure.
A possibly useful indicator of the potential consequences of changes in extreme rainfall is the current status of the drainage infrastructure within different locales of Western Port LGAs. For example, what is the age of the existing infrastructure and does it have excess capacity to cope with increasing intensities of extreme rainfall events, and how might future population growth and/or development increase or decrease the vulnerability of infrastructure? In addition, while detailed assessments of damage consequences in the Western Port region arising from increased flood risk associated with climate were beyond the scope of this study, some indicative estimates are provided in the following section.
4.3. Economic and Social Impacts The impact of flood events on communities includes damage to residential, commercial and public properties; infrastructure; the local economy; and personal and community hardship.
Typically, damage caused by flood events is separated into tangible costs (measurable) and intangible costs that are real but are difficult to accurately measure (such as stress). Tangible costs can be further separated between direct and indirect tangible costs. This is the framework adopted for coastal inundation in the previous section (see section 3.3.1 for a full description of costs).
It is possible to estimate the potential financial impact on communities of tangible damage caused by flood events. An understanding of the likely change in the intensity and frequency of flood events associated with climate change could assist our understanding of changes to these tangible costs associated with climate change.
4.3.1. Direct market costs
Flood damage estimates are often calculated for residential and commercial buildings and public infrastructure (predominantly buildings, roads and bridges).
Details of property exposed to flood inundation are set out in the following tables.

Impacts of Climate Change in the Western Port Region
Final Report Page 87
Table 4.26: Value of Bass Coast Shire property exposed to current inundation/flood hazard (in thousands of $)a
Property Type Number Site Valueb Capital Improved Valuec
Industrial 2 $ 320 $ 889
Residential 3 $ 966 $ 1,302
Rural 52 $ 35,610 $ 43,408
Unspecified 9 $ – $ –
Total 66 $ 36,896 $ 45,599 a Data on property values provided by the five LGAs in the region. b Market value of land only cTotal market value of the property including land, buildings and all other improvements
Table 4.27: Value of City of Casey property exposed to current
inundation/flood hazard (in thousands of $) a
Property Type Number Site Valueb Capital Improved Valuec
Commercial 72 $ 47,978 $ 71,956
Industrial 142 $ 67,466 $ 116,327
Residential 3,533 $ 880,944 $ 1,306,886
Rural 256 $ 187,852 $ 225,401
Unspecified 947 $ – $ –
Total 4,950 $ 1,184,239 $ 1,720,569 a Data on property values provided by the five LGAs in the region. c Market value of land only b Total market value of the property including land, buildings and all other improvements
Table 4.28: Value of Mornington Peninsula Shire property exposed to
current inundation/flood hazard (in thousands of $) a
Property Type Number Site Valuec Capital Improved Valued
Commercial 20 $ 27,700 $ 32,554
Industrial 27 $ 110,294 $ 205,610
Private Infrastructure b 6 $ 3,772 $ 4,686
Residential 182 $ 114,668 $ 137,752
Rural 22 $ 59,434 $ 59,869
Unspecified 699 $ – $ –
Total 956 $ 315,868 $ 440,471 a Data on property values provided by the five LGAs in the region. b Includes transport, communication, utilities, and storage infrastructure
c Market value of land only d Total market value of the property including land, buildings and all other improvements

Impacts of Climate Change in the Western Port Region
Final Report Page 88
Table 4.29: Value of Frankston City property exposed to current inundation/flood hazard (in thousands of $)a
Property Type b Number Site Valuec Capital Improved Valued
Business 551 $ 92,461 $ 159,003
Conservation and Resource 21 $ 2,673 $ 5,218
Floodway 3 $ 348 $ 665
Green Wedge 5 $ 665 $ 1,050
Industrial 603 $ 78,193 $ 143,761
Public Use 130 $ 18,972 $ 32,685
Residential 5720 $ 810,864 $ 1,449,155
Road 3 $ 688 $ 1,045
Special Use 2 $ 235 $ 455
Total 7,038 $ 1,005,098 $ 1,793,035 a Data on property values provided by the five LGAs in the region. b Property types determined by the associated planning zone in which they were located
c Market value of land only d Total market value of the property including land, buildings and all other improvements
Table 4.30: Value of Cardinia Shire property exposed to current
inundation/flood hazard (in thousands of $)a
Property Type b Number Site Valuec Capital Improved Valued
Business 366 $ 58,746 $ 96,819
Conservation and Resource 44 $ 8,195 $ 15,750
Development 3 $ 335 $ 569
Floodway 1 $ 339 $ 354
Green Wedge 1746 $ 340,286 $ 540,842
Industrial 264 $ 40,258 $ 60,756
Mixed Use 18 $ 4,010 $ 5,919
Public Use 281 $ 60,993 $ 89,882
Residential 1115 $ 284,025 $ 392,541
Road 9 $ 1,409 $ 2,701
Rural 273 $ 70,804 $ 102,265
Special Use 696 $ 134,882 $ 213,270
Total 4,816 $ 1,004,282 $ 1,521,667 a Data on property values provided by the five LGAs in the region. b Property types determined by the associated planning zone in which they were located
c Market value of land only d Total market value of the property including land, buildings and all other improvements

Impacts of Climate Change in the Western Port Region
Final Report Page 89
Private property – residential
The generally accepted approach to costing the impacts of natural disasters to private property is to include costs of damage to buildings and other infrastructure but not loss of land value. The assumption underlying this approach is that the risk of building on vulnerable land (e.g. flood prone land) is reflected in the price paid for that land and if the price of land declines subsequent to a disaster such as a flood, the change merely reflects more accurate knowledge of the risks of building on that site (BTE, 2001; Handmer, 2003). As discussed in Chapter 3 (section 3.3.1), this rule may not hold for coastal inundation, which feasibly could result in actual loss of land. It is more likely to hold for flood and bushfire prone land though29. Thus damage cost estimate discussed below focus on the impacts of flooding on buildings and other infrastructure.
For residential and commercial buildings, direct flood damage cost estimates are typically based on the level of flood inundation above ground and floor level. Usually, damage costs are estimated using ‘stage-damage curves’, which represent the relationship between expected loss and varying depths of flood water. The use of these curves has been subject to significant critique, since the curves can disguise enormous variation in individual cases and do not account for intangible losses (Handmer, 2003). Nevertheless, they are the most commonly used approach to flood loss assessment at present. Ideally, stage-damage curves will reflect local conditions and building types or, failing that, be based on previous local flood damage studies. Where this data is lacking, the Australian National University’s computer model ‘ANUFLOOD’ is generally accepted as best practice for stage damage curves. For a full assessment, the following data would be required:
Individual building size of all affected buildings (to categorise into small, medium, large);
Ground and floor heights for affected buildings;
Current flood heights associated with different flood events (1:10yr, 1:50yr, 1:100yr, 1:200yr, 1:500yr, Probable Maximum Flood height);
the same data again for years 2030 and 2070;
This information is not available for this study. However, based on the number of properties identified as being exposed to flooding, it is possible to demonstrate potential flood damage costs and potential changes to these associated with climate change.
Figure 4.31 demonstrates the relationship between flood height above floor level and damage cost in a medium-sized residence. As the water reaches floor level and above, damage costs first rise steeply, and then as flood height exceeds one metre, damages begin to level out. Maximum damage is estimated at around 1.7 m, after which damage costs are fairly static. As can be imagined, a flood exceeding floor height by 1.7 m is catastrophic and further flooding typically does not advance the damage.
29 Arguably, climate change creates uncertainty about the applicability of this rule to flood and bushfire prone land. The issue is discussed further in section 8.1.

Impacts of Climate Change in the Western Port Region
Final Report Page 90
Figure 4.31: Flood Damage Curve for Medium-sized Residential House
0
5
10
15
20
25
0 0.2 0.4 0.6 0.8 1 1.2 1.4 1.6 1.8 2
Flood height above floor (m)
Dam
age
cost
($'0
00)
Source: Authors’ analysis based on ANUFLOOD data.
The number of affected dwellings is based on property data in Tables 4.26 to 4.30 above. A recent Melbourne Water study30 found that a 1:100 ARI flood31 event caused above-floor flooding on 15 per cent of properties identified as being affected by the flood in ‘riverine’ (rural) areas. The same study found a proportion of 45 per cent for overland flow (urban) areas. To establish the number of dwellings potentially affected by above floor flooding in the Western Port region, we have applied the same proportions to the number of residential and rural properties identified in Tables 4.26 to 4.30, using an average of the two (30 per cent) for ‘green wedge’ properties.
30 Melbourne Water, 2007. Port Phillip and Westernport Region Flood Management and Drainage Strategy. 31 1:100 ARI flood refers to a flood event which is expected to have an average return interval (ARI) of one hundred years. That is, a flood of this size would occur on average every one hundred years.

Impacts of Climate Change in the Western Port Region
Final Report Page 91
Estimated damage costs are based on previous MJA work and using the ANUFLOOD methodology. In the absence of data, to do this illustrative example we made a number of simplifying assumptions, including:
all affected buildings are of medium size;
all buildings are affected at a uniform level of inundation per flood event (i.e. they all have the same floor heights and the flood reaches the same height at each building);
we assume no further buildings will be affected by flood under climate change scenarios (but provide sensitivity analysis at 10 percent more and 50 per cent more);
costs are based on ANUFLOOD flood events with above-floor flood heights of:
R1 = 0m (at floor level) R2 = 0.1 m (above floor level) R3 = 0.6 m (above floor level) R4 = 1.5 m (above floor level) R5 = 1.8 m (above floor level)
The effects of climate change on flood heights will depend on individual circumstances, as an increase in rainfall intensity will have site-specific impacts. The Melbourne Water climate change study used a case study from the outer eastern suburbs of Melbourne (CSIRO and Melbourne Water, 2005), which found that a 20% increase in intensity of a 2-hour 1 in 100 year rainfall event will result in an increase in flood heights of only a few centimetres. This analysis finds that rainfall intensity will increase by 75 to 100% in some Western Port region catchments to 2070.
As such, for the 2030 flood damage estimates, we make the simple assumption that flood heights rise uniformly by 5 cm across each flood event (1–5). For the 2070 flood damage estimates, we increase the flood heights by a further 5 cm, resulting in a total increase of 10 cm relative to present day. This is an indicative analysis only, and a site-specific study would need to be undertaken to establish the actual estimates for each council area.
Frankston and Casey City Councils are identified as having the largest number of residential properties currently exposed to flooding in the Westernport region. For this reason, the indicative costs of damages to dwellings of flood events in these areas are notably higher than in other councils (Table 4.31). In Frankston, for example, damage costs for a flood reaching the floor height of all affected properties is $7.6m, or $16.1m if climate change increases flood heights by 10 cm by 2070. A severe flood, averaging flood heights of 1.8 m above floor heights would cause indicative damage of $55.8m in current terms, and marginally more if climate change increases flood heights by a further 10 cm.32.
32 At a flood depth of 1.8 m, damage would be catastrophic. An increase of 10 cm would be unable to cause substantially more damage.

Impacts of Climate Change in the Western Port Region
Final Report Page 92
Table 4.31: Indicative residential flood damage estimates (in thousands of $)
Bass Coast Shire Cardinia Shire City of Casey Flood type
2007 2030 2070 2007 2030 2070 2007 2030 2070
R1 27 41 54 3,130 4,739 6,261 4,780 7,238 9,562
R2 54 66 77 6,261 7,697 9,049 9,562 11,755 13,820
R3 147 153 158 17,111 17,809 18,447 26,133 27,200 28,174
R4 195 195 196 22,748 22,806 22,858 34,743 34,831 34,911
R5 198 198 199 23,094 23,178 23,280 35,272 35,400 35,556
Frankston City Mornington Peninsula Shire Flood type
2007 2030 2070 2007 2030 2070
R1 7,563 11,452 15,129 250 379 500
R2 15,129 18,598 21,866 500 615 723
R3 41,346 43,034 44,576 1,367 1,423 1,474
R4 54,968 55,107 55,234 1,818 1,822 1,827
R5 55,804 56,008 56,254 1,846 1,852 1,860
Source: Authors’ analysis based on ANUFLOOD. Assumes average building size, uniform flood levels and no increase in the number of affected houses in 2030 and 2070. ‘Flood type’ relates to ANUFLOOD at increasing above floor flood heights
A more detailed assessment may be warranted to accurately assess flood damage estimates in these areas, especially if further developments in flood prone areas are planned or considered likely. The above table assumes no growth in the number of dwellings affected by flood to 2030 and 2070. However, the number of dwellings may increase for two main reasons:
the increase in flood heights expands the flood affected area to include houses previously unaffected by flood; and
population growth results in new developments within the existing flood plain, increasing the number of affected dwellings.
Increases in the number of affected dwellings are dependent on the size and location of future housing developments, and would therefore be unlikely to grow in line with Melbourne 2030 projections of housing growth. This is because only housing growth in flood-affected areas would be affected by flood events. Information relating to the particular circumstances of each Council area can inform which scenario best fits Council expectations for growth in affected residential dwellings.
The following sensitivity analysis is provided based on increases in affected residential properties of 10 and 50% to 2030, and again to 2070 (Tables 4.32 and 4.33).

Impacts of Climate Change in the Western Port Region
Final Report Page 93
Table 4.32: Sensitivity analysis of residential flood damage estimates – housing growth of 10% to 2030 and 2070 (in thousands of $)
Bass Coast Shire Cardinia Shire City of Casey Flood type
2007 2030 2070 2007 2030 2070 2007 2030 2070 R1 27 45 65 3,130 5,213 7,576 4,780 7,962 11,570
R2 54 73 94 6,261 8,467 10,949 9,562 12,931 16,723
R3 147 168 191 17,111 19,590 22,321 26,133 29,920 34,091
R4 195 215 237 22,748 25,086 27,658 34,743 38,314 42,242
R5 198 218 241 23,094 25,496 28,169 35,272 38,940 43,022
Frankston City Mornington Peninsula Shire Flood type
2007 2030 2070 2007 2030 2070 R1 7,563 12,597 18,306 250 417 605
R2 15,129 20,458 26,457 500 677 875
R3 41,346 47,337 53,936 1,367 1,566 1,784
R4 54,968 60,618 66,833 1,818 2,005 2,210
R5 55,804 61,608 68,067 1,846 2,037 2,251
Source: Authors’ analysis based on ANUFLOOD. Assumes 10 per cent growth in affected properties to 2030, and a further 10 per cent growth to 2070.
Table 4.33: Sensitivity analysis of residential flood damage estimates –
housing growth of 50% to 2030 and 2070 (in thousands of $)
Bass Coast Shire Cardinia Shire City of Casey Flood type
2007 2030 2070 2007 2030 2070 2007 2030 2070 R1 27 61 214 3,130 7,109 25,044 4,780 10,858 38,250 R2 54 99 310 6,261 11,545 36,195 9,562 17,633 55,281 R3 147 229 632 17,111 26,714 73,789 26,133 40,800 112,697 R4 195 293 783 22,748 34,208 91,433 34,743 52,246 139,644 R5 198 298 797 23,094 34,768 93,121 35,272 53,100 142,222
Frankston City Mornington Peninsula Shire Flood type
2007 2030 2070 2007 2030 2070 R1 7,563 17,178 60,516 250 568 2,001 R2 15,129 27,898 87,462 500 923 2,893 R3 41,346 64,551 178,302 1,367 2,135 5,897 R4 54,968 82,660 220,936 1,818 2,734 7,307 R5 55,804 84,012 225,015 1,846 2,778 7,442
Source: Authors’ analysis based on ANUFLOOD. Assumes 50 per cent growth in affected properties to 2030, and a further 50 per cent growth to 2070.

Impacts of Climate Change in the Western Port Region
Final Report Page 94
Private property – commercial
A similar illustrative estimation process can be undertaken for commercial (or business) property. One difference between residential and commercial estimation methodologies is that commercial damage costs are based on the type of business. Again, without detailed data we must make several simplified assumptions:
100% of commercial properties are affected by flooding;
commercial buildings are medium-sized;
we assume an average of ‘low’ and ‘medium’ class properties33 as a basis for damage costs;
flood types are based on ANUFLOOD flood heights at:
C1 = 0.25m (above floor level) C2 = 0.75m (above floor level) C3 = 1.25m (above floor level) C4 = 1.75m (above floor level)
As with residential estimates, for the 2030 estimates we assume an increase of 5 cm for each type of flood event (1-4). We assume a further 5 cm increase in flood heights per affected property to 2070. The results are provided in Table 4.34.
Table 4.34: Indicative commercial flood damage estimates (in thousands of $) in response to potential increases in future flood heights
Bass Coast Shire Cardinia Shire City of Casey Flood type
2007 2030 2070 2007 2030 2070 2007 2030 2070 C1 0 0 0 8,769 9,493 10,412 1,725 1,867 2,048 C2 0 0 0 21,229 22,656 24,038 4,176 4,457 4,729 C3 0 0 0 32,305 32,927 33,460 6,355 6,477 6,582 C4 0 0 0 35,767 36,041 36,382 7,036 7,090 7,157
Frankston City Mornington Peninsula Shire Flood type
2007 2030 2070 2007 2030 2070 C1 13,201 14,291 15,674 479 519 569 C2 31,960 34,108 36,188 1,160 1,238 1,314 C3 48,635 49,570 50,373 1,765 1,799 1,828 C4 53,846 54,259 54,772 1,954 1,969 1,988
Assumes average building size, uniform flood levels, average damage cost between ‘low’ and ‘medium’ class properties, no increase in affected buildings to 2030 and 2070.
As with residential properties, it is possible that higher floods arising from increased rainfall intensities will increase the number of commercial properties affected by flood. Given this, we provide a sensitivity analysis of increases to affected properties by 10 and 50% to both 2030 and 2070 (Table 4.35, Table 4.36). 33 Commercial properties are categorised by class, ranging from ‘very low’ (such as florists and newsagents) through to ‘very high’ (such as electronics and pharmaceuticals). Most commercial properties are between ‘very low’ and ‘high’, so for this simplified illustration we assume an average of between ‘low’ and ‘medium’.

Impacts of Climate Change in the Western Port Region
Final Report Page 95
Table 4.35: Sensitivity analysis of commercial flood damage estimates – 10% increase in affected buildings in 2030 and 2070 (in thousands of $)
Bass Coast Shire Cardinia Shire City of Casey Flood type
2007 2030 2070 2007 2030 2070 2007 2030 2070 C1 0 0 0 8,769 10,442 12,598 1,725 2,054 2,478 C2 0 0 0 21,229 24,922 29,086 4,176 4,903 5,722 C3 0 0 0 32,305 36,219 40,487 6,355 7,125 7,965 C4 0 0 0 35,767 39,646 44,022 7,036 7,799 8,660
Frankston City Mornington Peninsula Shire Flood type
2007 2030 2070 2007 2030 2070 C1 13,201 15,721 18,966 479 571 688 C2 31,960 37,519 43,788 1,160 1,362 1,589 C3 48,635 54,527 60,951 1,765 1,979 2,212 C4 53,846 59,685 66,274 1,954 2,166 2,406
Assumes average building size, uniform flood levels, average damage cost between ‘low’ and ‘medium’ class properties, 10 per cent increase in affected buildings in 2030 and 2070.
Table 4.36: Sensitivity analysis of commercial flood damage estimates – 50% increase in affected buildings in 2030 and 2070 (in thousands of $)
Bass Coast Shire Cardinia Shire City of Casey Flood type
2007 2030 2070 2007 2030 2070 2007 2030 2070 C1 0 0 0 8,769 14,240 23,426 1,725 2,801 4,608 C2 0 0 0 21,229 33,984 54,085 4,176 6,685 10,640 C3 0 0 0 32,305 49,390 75,285 6,355 9,716 14,810 C4 0 0 0 35,767 54,062 81,860 7,036 10,635 16,104
Frankston City Mornington Peninsula Shire Flood type
2007 2030 2070 2007 2030 2070 C1 13,201 21,437 35,267 479 778 1,280 C2 31,960 51,162 81,424 1,160 1,857 2,955 C3 48,635 74,355 113,339 1,765 2,699 4,114 C4 53,846 81,389 123,237 1,954 2,954 4,473
Assumes average building size, uniform flood levels, average damage cost between ‘low’ and ‘medium’ class properties, 50 per cent increase in affected buildings in 2030 and 2070

Impacts of Climate Change in the Western Port Region
Final Report Page 96
Public infrastructure
As previously discussed, public infrastructure is also affected by flooding. Infrastructure affected includes:
roads and transport infrastructure (including bridges);
parks and recreational facilities;
government buildings including schools, hospitals, police and fire stations;
water, sewerage and drainage infrastructure; and
communications networks.
Earlier studies, including CSIRO, Maunsell, and Phillips Fox (2007), suggest that the public infrastructure most at risk from flooding include drainage and sewerage infrastructure and transport infrastructure (in particular roads and bridges), with risks arising from degradation of materials and structural fatigue. Without information on changes to the frequency and intensity of future flood events in the region, it is not feasible to estimate future damage costs to this infrastructure for 2030 and 2070. Also, the composition of impacts will depend significantly on local factors. However, Table 4.37 below provides an indicative estimate of the extent of damage costs to transport infrastructure, based on current exposure, that could result from a severe future flood affecting exposed roads and bridges. Damage costs include initial repairs and also reduction in the lifetime of the infrastructure.
Table 4.37: Indicative current flood damage costs to transport infrastructure (in thousands of $)
Bass Coast Cardinia Casey Frankston Mornington Peninsula
Shire Roads 665 39,168 12,848 1,081 5,322
Bridges 91 0 0 263 0
Assumptions: road damage cost estimates are based on initial repair (the average between major and minor sealed road and subsequent deterioration ($42,000/km); bridge repair based on average between major and minor bridge ($10,100/bridge). Values taken from Read Sturgess & Associates (2000) and adjusted to 2000 dollars.
4.3.2. Indirect market impacts
As noted in previous sections, indirect market impacts include loss of production and disruption to services, emergency response and clean up costs.
Indirect damages associated with flood inundation are commonly estimated as a proportion of direct damage. The ANUFLOOD model recommends the following proportions:
Indirect residential damages: 15% of direct residential damages
Indirect commercial damages: 55% of direct commercial damages.

Impacts of Climate Change in the Western Port Region
Final Report Page 97
The estimate of indirect damages to residential and commercial properties is found in Table 4.38 and
Table 4.39.
Table 4.38: Indirect damage costs to residential property in response to potential increases in future flood heights (in thousands of $)
Bass Coast Shire Cardinia Shire City of Casey Flood type
2007 2030 2070 2007 2030 2070 2007 2030 2070
R1 4 6 8 469 711 939 717 1,086 1,434
R2 8 10 12 939 1,155 1,357 1,434 1,763 2,073
R3 22 23 24 2,567 2,671 2,767 3,920 4,080 4,226
R4 29 29 29 3,412 3,421 3,429 5,211 5,225 5,237
R5 30 30 30 3,464 3,477 3,492 5,291 5,310 5,333
Frankston City Mornington Peninsula Shire Flood type
2007 2030 2070 2007 2030 2070 R1 1,134 1,718 2,269 38 57 75
R2 2,269 2,790 3,280 75 92 108
R3 6,202 6,455 6,686 205 213 221
R4 8,245 8,266 8,285 273 273 274
R5 8,371 8,401 8,438 277 278 279
Source: Authors’ analysis
Table 4.39: Indirect damage costs to commercial property in response to potential increases in future flood heights (in thousands of $)
Bass Coast Shire Cardinia Shire City of Casey Flood type
2007 2030 2070 2007 2030 2070 2007 2030 2070 C1 0 0 0 4,823 5,221 5,726 949 1,027 1,126
C2 0 0 0 11,676 12,461 13,221 2,297 2,451 2,601
C3 0 0 0 17,768 18,110 18,403 3,495 3,563 3,620
C4 0 0 0 19,672 19,823 20,010 3,870 3,900 3,936
Frankston City Council Mornington Peninsula Shire Flood type
2007 2030 2070 2007 2030 2070 C1 7,261 7,860 8,621 264 285 313
C2 17,578 18,759 19,904 638 681 722
C3 26,749 27,263 27,705 971 990 1,006
C4 29,615 29,843 30,125 1,075 1,083 1,093
Source: Authors’ analysis

Impacts of Climate Change in the Western Port Region
Final Report Page 98
4.3.3. Non-market costs (intangible costs)
Non-market (or ‘intangible’) costs can be divided into direct and indirect costs.
Direct costs relate to:
health costs (including death, injury and water-borne diseases associated with disruption to sewerage and water services);
loss of natural and cultural assets; and
loss of personal memorabilia.
Indirect costs include:
emotional stress;
social disruption and isolation; and
the loss of recreational opportunities.
Not only are these elements difficult to measure as a result of an actual flood, they differ between similar events based on particular circumstances, such as forewarning, time of year and duration. Flash flooding, for example, which may occur with little warning to those in affected areas, is likely to pose a greater threat to life than floods that have some forewarning.
In relation to health impacts, Reed Sturgess & Associates (2000) suggest that in the absence of data on all of relevant variables, the most significant determinant of the size of the likely impact of flooding on human health is the size and density of the resident population ‘at risk’. Based simply on these variables therefore, the exposed areas that may be at greatest risk in terms of human health are likely to be in Frankston City. In general terms though, the long term risk to human health and mortality from flooding in the region may well be less than from bushfires (see Chapter 5) and substantially less than from extreme temperatures (see Chapter 6).
Nevertheless, the health impacts and other intangible costs of future flooding in the region should not be dismissed. A number of Australian and overseas studies into the severity of different impacts of flooding suggest that, qualitatively, affected households generally rate the intangible costs of flooding including: health effects, stress and worry, disruption to services and day-to-day life as well as loss of memorabilia; as greater than the tangible impacts such as damage to their house and contents (reported in BTE, 2001).

Impacts of Climate Change in the Western Port Region
Final Report Page 99
4.4. Summary of Potential Implications of Exposure to Inundation/Flood Hazard in the Western Port Region
Sector/LGA Summary of Potential Inland Flooding Exposure and Impacts Locations
Bass Coast • Approximately 18.8 km2 lie in inundation/flood prone areas, particularly land areas associated with the Bass River flood plain Cardinia • Approximately 479.4 km2 lie in inundation/flood prone areas, particularly southern Cardinia and Koo Wee Rup swamp
Casey • Approximately 100.1 km2 lie in inundation/flood prone areas that are distributed widely throughout the LGA, but concentrated in the southeast Frankston • Approximately 10.8 km2 lie in inundation/flood prone areas, particularly the LGA’s northwest and the city centre
MPS* • Approximately 10.2 km2 lie in inundation/flood prone areas, particularly the Western Port Bay coastline Populations
Bass Coast • An estimated 143 current residents in 55 dwellings live in inundation/flood hazard areas. Particular at-risk populations include rural households at risk of being isolated by flood-waters, especially if they are comprised of low-income and/or elderly individuals.
Cardinia • An estimated 8,775 current residents in 3,134 dwellings live in inundation/flood hazard areas. Particular at-risk populations include rural households at risk of being isolated by flood-waters, especially if they are comprised of low-income and/or elderly individuals.
Casey • An estimated 10,988 current residents in 3,789 dwellings live in inundation/flood hazard areas. Particular at-risk populations include rural households at risk of being isolated by flood-waters and dense populations in low-lying areas.
Frankston • An estimated 19,195 current residents in 5,725 dwellings live in inundation/flood hazard areas. Those at greatest risk include low-income and/or elderly individuals.
Mornington • An estimated 530 current residents in 204 dwellings live in inundation/flood hazard areas. Retiree communities in the south around Portsea and Sorrento and low-income households around Hastings may be particularly vulnerable.
Property Bass Coast • $9 million of property improvements exposed to inundation/flood hazard, particularly rural properties adjacent to Bass River flood plain.
Damage costs from extreme rainfall events and flooding likely to rise.
Cardinia • $536 million of property improvements exposed to inundation/flood hazard, such as rural properties in the LGA’s south and within Koo Wee Rup Swamp. Damage costs from extreme rainfall events and flooding likely to rise.
Casey • $44 million of property improvements exposed to inundation/flood hazard, particularly in the LGA’s southeast and more densely developed residential communities in the north. Damage costs from extreme rainfall events and flooding likely to rise.
Frankston • $788 million of property improvements exposed to inundation/flood hazard, particularly the LGA’s northwest and the city centre
MPS • $125 million of property improvements exposed to inundation/flood hazard. At-risk areas include the Western Port Bay communities such as Hastings, Crib Point and Shoreham. Damage costs from storm events and loss of property value due to erosion and inundation likely to rise.
Infrastructure Bass Coast • 16 km of road network (including 9 bridges) exposed to inundation/flood hazard, and maintenance costs likely to rise
• 0.5 km of the water network is also exposed to flood hazard.
Cardinia • 942 km of road network and 62 km of rail network exposed to inundation/flood hazard, and maintenance costs likely to rise • 57 km of water mains, 59 km of sewer mains and 579.6 km of channel drains are exposed to flood hazard.
Casey • 309 km of road network and 47 km of rail network exposed to inundation/flood hazard, and maintenance costs likely to rise • 137 km of water mains and 129 km of sewer mains are exposed to flood hazard. 11 sewer pump stations are exposed. • Electricity utilities and educational facilities in the northwest are exposed • In the southeast, Harwood Aerodrome east of Tooradin is exposed
Frankston • 148 km of road network (including 26 bridges) and 8 km or rail network exposed to inundation/flood hazard, and maintenance costs likely to

Impacts of Climate Change in the Western Port Region
Final Report Page 100
rise • 99 km of water mains and 99 km of sewer mains exposed are exposed to flood hazard. 10 sewer pump stations are exposed. • Various educational facilities and medical centres are exposed
MPS • 128 km of road network and 8 km of rail network exposed to inundation/flood hazard, and maintenance costs likely to rise • 23 km of water mains and 30 km of sewer mains are exposed to flood hazard. 4 sewer pump stations. • Industrial infrastructure around Hastings
Business Activity Bass Coast • Flood risk largely a threat to rural productivity and commerce but may also affect access to regional service centres and therefore markets for
goods and services
Cardinia • Extensive inundation/flood hazard areas pose significant challenges to regional commerce, including road and rail transport within and through the LGA. Rural production enterprises also likely to be directly affected by flood events.
Casey • Exposure of townships throughout the LGA pose risks to a broad array of business activities, from service and tourism to industry and
manufacturing. Disruption of transport, interruption of business activities, and direct flood damages are possible adverse effects facing businesses.
Frankston • Businesses in the Frankston CAD may experience direct flood damages and business interruptions associated with urban flooding. Disruption of road and rail network may also affect business indirectly by disrupting commutes of staff and consumers.
MPS • Operations at industrial facilities at Hastings could be disrupted by flood events, with not only local but also regional to national implications. Public Health
Bass Coast Cardinia
Casey Frankston
MPS Bass Coast
• Flood events represent a potential threat to human health, particularly flash flooding which may occur with little warning to those in affected
areas. Threats to human health are likely to be maximised where the size and density of exposed populations are greatest. The disruption of water and sewerage services by flood events also poses risks for water-borne disease.
Amenity and other intangibles Bass Coast
Cardinia Casey
Frankston MPS
Bass Coast
• Stress, disruption and loss of memorabilia are difficult to quantify. To people who have been impacted by floods these often constitute a greater ‘cost’ than damages to property.
• Temporary disruption of recreational facilities and their access is likely during flood events. However, there is a relatively low risk associated with the permanent loss of amenity arising from flood events, provided flood events are sufficiently infrequent to enable a particularly use or activity to be sustained.
*MPS - Mornington Peninsula Shire

Impacts of Climate Change in the Western Port Region
Final Report Page 101
5. IMPACTS ASSOCIATED WITH CHANGES TO FIRE WEATHER CONDITIONS
Chapter Summary
• Bushfires represent a critical natural hazard within Southeast Australia, threatening humans, buildings and infrastructure as well as the natural environment.
• Over 700 km2 of the Western Port region are designated bushfire prone areas, although the magnitude and distribution of such areas vary significantly among the region’s five LGAs.
• Warmer and drier average conditions in the Western Port region are projected to increase the frequency with which the region experiences ‘very high’ and ‘extreme’ fire weather conditions in coming decades.
• Approximately 35,000 predominately residential properties with a capital improved value of almost $8 billion are vulnerable to bushfire events, as are a number of critical transport routes, electrical utilities, industries and public services.
• Bushfire events are also associated with significant indirect costs including disruption of transport, business and commerce, utilities and communications not to mention the potential for injury and death or the devastation of natural areas.
5.1. Bushfire34 in Western Port: The Issues
5.1.1. Bushfire risk in Victoria and the Western Port region
Bushfires are a major economic, social and environmental hazard in Australia. Between 1967 and 1999 they cost the Australian economy around $2.5 billion (Allen Consulting, 2005).
From 1960 to 2001, there were 224 fire-related deaths and 4,505 injuries in Australia (McMichael et al., 2003). In Victoria, bushfire is second only to floods as the largest driver of natural disaster-related economic damages (BTE, 2001). The 1983 Ash Wednesday bushfires represent one of the worst bushfire events in the State’s history, with communities in the present Shire of Cardinia being amongst the worst affected. However, numerous other parts of the Western Port region have been affected by bushfire in recent history (see Box 5.1).
As with other types of climate hazards, the risk of bushfire to human settlements and infrastructure in the Western Port region is not so much the fire itself, but the extent to which people, housing and infrastructure are exposed to such fire. Historically, urban development was often surrounded by a cleared rural buffer, largely comprised of agricultural lands. Today, development is increasingly moving outward into native
34 The term ‘bushfire’ is the designated term in this report for all wildfires, including forest and grass fires.

Impacts of Climate Change in the Western Port Region
Final Report Page 102
vegetation and bushland areas (Australian Standards, 1999). This has increased the number of people and housing within bushfire prone areas, resulting in a greater risk of exposure and harm. Continuation of this trend of encroaching development on bushland could further increase exposure in some areas of the Western Port region in the future. However, the land clearance associated with urbanisation also means that bushfire risk in some areas will decline as a rural to peri-urban landscape is transformed into an urban one35.
Box 5.10. Major Bushfires in the Western Port Region
Red Tuesday 1898
A wildfire spread through the Mornington Peninsula in early February 1898 destroying thousands of acres of grassland and killing thousands of sheep and cattle. Main Ridge, Red Hill, Balnarring and Sandy Point were all alight, and the fire reached the northern border of Hastings. Eleven people lost their lives in the fire. An appeal raised 1,600 pounds to support the fire victims who lost homes, fencing and stock. (Cole, 1974).
The smoke from the bushfires was so dense between Cape Shank and Cape Otway on the Monday that the movement of ships was seriously interfered with. Fog signals and blowing of whistles was kept up almost continuously.
Bushfires have been raging in this district since Saturday last and roughly speaking the whole of the peninsular from Sandy Point to Cape Shank seems to be ablaze. …The fires have now such a hold that nothing but a break in the weather can stop them. Seldom, if ever has the vegetation been as so dry as present, and the changeable winds cause the flames to spread with great rapidity.36
A month later another grass fire threatened the settlement at Mount Martha. The butter industry was almost forced to close down due to both the fire and the drought, which gripped most of south eastern Australia during this period.
Black Tuesday 1944
Victoria experienced the worst grass fires in its history in 1944 following a season of good winter rains and a dry spring (Luke & McArthur, 1978). Over a million hectares of land were burnt out. On the Mornington Peninsular the lucrative orchard industry was under threat, and at Somerville the fire destroyed the Horticultural Hall (Graeme Butler and Associates, 2001). Part of William Murdoch’s Cruden Farm garden in Langwarrin was burnt out (Graeme Butler and Associates, 1997).
Ash Wednesday 1983
One hundred and eight bushfires broke out across Victoria on 16 February, 1983. They were fanned by winds of over 100 km an hour, low humidity and a maximum temperature in Melbourne of 42°C. Victoria was also suffering severe drought conditions at the time. In the town of Cockatoo (Cardinia Shire), 1,800 hectares were burnt out, 307 homes lost
35 This is borne out by research indicating a strong correlation between bushfire risk and proximity of properties to bushland (Chen & McAneney, 2005). 36 The Mornington Standard, February 3, 1898.

Impacts of Climate Change in the Western Port Region
Final Report Page 103
and much of the town’s infrastructure destroyed including the school, fire station and shopping strip. Eighty percent of Upper Beaconsfield (Cardinia Shire), including the shops and school, was also destroyed. Property losses there included 238 homes, and 9,200 hectares of bush and farmland (CFA, 2007b, Emergency Management Australia, 2007). Avonsleigh and Gembrook were also threatened. Residents were evacuated to schools and shopping centres, many left with only the possessions they were carrying. The human cost of this fire was high. Twenty people died in the Upper Beaconsfield fire, including twelve CFA volunteers, and six in Cockatoo.
‘I’ve never been so scared. There was fire on all sides and I didn’t know where to go.’ Michael Richardson, Upper Beaconsfield.37
‘The most frightening thing was the sound of the exploding gas bottles as the fires hit homes. It sounded like a battle’. Mr Halliway, Cockatoo.38
Mornington Peninsula 1997
Heatwave conditions, with temperatures above 40°C and winds of 70 kilometres per hour, created wildfire conditions between 19 and 21 January 1997. A total of 250 wildfires burnt in Victoria on 21 January. That Monday saw the evacuation of hundreds of people on the Mornington Peninsular where Mount Martha, Safety Beach, Langwarrin and Arthurs Seat were threatened by grass fires. Fire trucks were transported on the Queenscliff Ferry to protect Arthurs Seat. Two homes were destroyed in Mount Eliza.39
A broad range of factors contribute to the risk of ignition and spread of bushfire across a landscape, its rate of movement, and the intensity with which it burns. Fuel loads are obviously a key driver. For example, bushfire prone areas in Victoria are largely designated based upon the identification of significant vegetation areas by remote sensing (SAI Global, 2005), in consultation with local government and fire management officials. Hence, the most hazardous bushfires tend to occur around the fringes of development, where significant human communities and infrastructure are present, but where there is also significant native and modified vegetation to fuel bushfires. Fire ignition has also been correlated with access of people to bushfire prone areas (Brooks and Esque, 2002), as humans are one of the core factors contributing to fire ignition.
Other factors, however, also contribute to bushfire severity and risk. For example, research regarding fire dynamics indicates that bushfires spread more quickly and burn more intensely on upward slops than on flat landscapes (Bradstock et al., 1998; Brooks et al., 2004; Erten et al., 2004), and, conversely, spread more slowly on downward slopes. More specifically, the slope direction or aspect differentially exposes slopes to different sun and wind regimes that may enhance risk (Erten et al., 2004). For example, the hot, dry northerly winds associated with Australian summers in the southeast increase the risk of bushfires on northern facing slopes (see also Chapter 4, Box 4.8 on storms and winds). Elevation can also influence bushfire risk indirectly, as temperatures drop and moisture may increase with elevation. 37 The Age, 18 February, 1983. 38 The Age, 18 February, 1983. 39 The Age, 20, 21, 22 January 1997.

Impacts of Climate Change in the Western Port Region
Final Report Page 104
5.1.2. Climate change and bushfire risk in the Western Port region
All other factors being equal, warmer and drier conditions in the Western Port region will increase the risk of bushfires and their severity.
As such, global warming is likely to increase the frequency and severity of bushfires in Australia (Hennessy et al., 2005; Lucas et al., 2007), consistent with projections from other nations (Stocks et al., 1998; Goldammer and Price, 1998; Wotton et al., 2003; Brown et al., 2004; Pearce et al., 2005). In fact, estimation of fire risk over the past 30 years suggests that a trend toward greater fire risk is already observable. For example, the forest fire danger index at Melbourne and Sale was 23% and 32% higher, respectively, from 2001 to 2007 compared to 1980 to 2000 (Lucas et al., 2007). However, relative to inland areas, coastal areas in southeast Australia experience lower levels of fire risk (Hennessy et al., 2005; Lucas et al., 2007).
Climate and fire weather projections indicate that fire risk in bushfire prone areas of the Western Port region is likely to increase in the future. This increased risk is a product of projected warming and drying in future decades in response to climate change (Macadam et al., 2007). For example, results from biophysical assessments of the implications of climate change on fire weather in southeast Australia indicate that the number of days that Sale experiences a fire danger index of ’very high’ or ‘extreme’ may increase from approximately 12 at present to 12 to 14 by 2020 and 12 to 19 by 2050 (see Table 5.40; Hennessy et al., 2005; Lucas et al., 2007). Similar proportional increases are also projected for grass fire risk, although the total number of days is much higher.
Given the damages associated with past events, any increase in risk is likely to pose a challenge to emergency management services and elevate the importance of preparedness. In some respects this could prove challenging, since increased fire-weather risk could also reduce the opportunity for hazard reduction activities (Middlemann, 2007), further exacerbating the likelihood and potential impact of bushfires.
Table 5.40: Projected changes in annual average numbers of days with very high or extreme forest fire risk for Laverton and Sale
Location Presenta 2020 2050
Changes in average annual numbers of days with very high or extreme forest fire risk
Laverton 12 12–14 12–19
Sale 5 5–7 6–11
Changes in average annual numbers of days with extreme forest fire risk
Laverton 2 2–3 2–5
Sale 1 1 1–2 a Present values based upon climatological averages for the 1973-2007 period. Source: Macadam et al. (2008)

Impacts of Climate Change in the Western Port Region
Final Report Page 105
5.2. Exposure
5.2.1. Methods for exposure assessment
Geographic information systems (GIS) were used to examine the spatial relationships between bushfire prone areas and assets and infrastructure in harm’s way.
GIS overlays of bushfire hazard areas were obtained from Western Port LGAs. Overlays represent areas where there are significant fuel sources over an extensive area sufficient to create a bushfire hazard combined with other factors such as associated topography, buildings and infrastructure and bushfire management efforts. Factors such as climate that might modify bushfire risk are generally not directly represented within bushfire overlays. Although climate change is projected to change the spatial distribution of storm surge and extreme rainfall exposure in the decades ahead, for bushfire the spatial extent of exposure is assumed to remain largely the same. This assumption arises from the need to have sufficient fuel loads to generate bushfire risk. To the extent that future climate change and, particularly, land use and management practices increase or reduce vegetation associated with existing bushfire prone areas, this would have implications for risk at a very localised level. However, the current analysis generally assumes exposure remains static.
Existing bushfire prone areas within the Western Port region were utilised to determine the land areas, infrastructure and assets that will potentially be exposed to fire hazard in future decades. Bushfire prone areas for LGAs in the region were imported into a GIS (ArcGIS 9.2) as vector polygon data layers. These polygon layers were then used to interrogate a range of geographic data sets including data from the ABS 2006 census as well as multiple data sets provided by local governments regarding property, land use, and the location of transport, water and sewer, and recreational infrastructure. Land areas, census collection districts, and assets intersecting bushfire prone areas were treated as potentially exposed and associated populations, infrastructure, and assets were subsequently quantified.
As with the other exposure assessments reported in this study, a number of uncertainties arise from this analysis. First and foremost, the analysis was based upon the integration of multiple data sets which were developed in different ways. Errors in the alignment of different data sources necessitates that results be interpreted with some caution. Furthermore, if any overlap between a bushfire prone area and a property or road segment existed, the entire property or segment was counted as exposed. This invariably results in an overestimate of the exposure of the population and assets. Hence, quantitative results should be treated as estimates designed to communicate the approximate scale of consequences.

Impacts of Climate Change in the Western Port Region
Final Report Page 106
Box 5.11. Key Uncertainties Associated with Bushfire Impact Assessment
1) A critical uncertainty for estimating future changes in bushfire risk arising from climate change is simply the uncertainty regarding the magnitude of future temperature and, particularly, rainfall changes in the Western Port region. To the extent that temperature increases and rainfall reductions are more consistent with more pessimistic scenarios, conditions for bushfire weather will become more severe. As with the extreme rainfall projections in Chapter 4, the projections of changes in fire weather reported in this chapter are based on a limited suite of climate models, and thus actual uncertainty in the magnitude and range of future fire weather conditions is greater than indicated here.
2) The effects of climate change on fuel loads, specifically vegetation growth and regrowth, is another factor that is important for bushfire risk. More arid conditions may suppress vegetation growth, reducing fuel loads over the long-term. However, increased atmospheric carbon dioxide concentrations may enable some plant species to become more drought-tolerant and productive despite increasing aridity.
3) Future development and land use change will also affect the nature of bushfire risk in future decades. However, such trends can be difficult to predict as they rely upon decisions that have yet to be made. Encroachment of development, particularly residential, into bushland areas may increase the risk of human exposure to bushfire events. On the other hand large-scale land clearing may reduce fuel loads. Future changes in buildings codes, building materials, and bushfire management will also influence the nature of the risk.
5.2.2. Exposed areas
Inspection of bushfire prone areas within the region’s LGAs indicates significant fire hazard, although the spatial distribution is quite heterogeneous (Figure 5.32). The largest contiguous area of risk occurs in Cardinia Shire, where almost the entire northern third of the Shire is prone to bushfire. Elsewhere, land clearance for agriculture and development yield more isolated pockets of bushfire prone areas. For example, Mornington Peninsula is second only to Cardinia in the total magnitude of bushfire prone land, but those areas are distributed in clusters throughout the Shire. Similarly, Bass Coast Shire has pockets of bushfire prone areas, particularly the ‘Gurdies’ area in the north of the Shire and various pockets on northern and eastern Phillip Island. Casey and Frankston Cities have the smallest area of bushfire prone lands, but in the instance of Frankston City, the relative small size of the LGA means that on a relative basis, a significant fraction of the City is potentially at risk (Table 5.41).

Impacts of Climate Change in the Western Port Region
Final Report Page 107
Figure 5.32: Spatial distribution of current bushfire prone areas within the Western Port region
Table 5.41: Current bushfire prone areas in LGAs of the Western Port region
LGA Bushfire Prone Area (km2)a
Bass Coast Shire 75.7
Cardinia Shire 444.8
Casey 22.6
Frankston City 35.5
Mornington Peninsula Shire 131.7
Total 710.3 a Hazard areas derived from overland flood and land subject to inundation data provided by the five LGAs in the region.

Impacts of Climate Change in the Western Port Region
Final Report Page 108
5.2.3. Exposed populations and dwellings
A significant fraction (~13%) of the 2006 population of the Western Port region lived on properties that are associated, at least partially, with bushfire prone areas.
The number of people exposed was strongly associated with the density of the population within bushfire prone areas, as indicated by Mornington Peninsula – the LGA with the highest exposed population as well as a relatively high population density (Figure 5.33, Figure 5.34, Table 5.43) Similarly, Frankston City Council, which has a relatively small amount of land within bushfire prone areas, nevertheless has a relatively high level of population exposure. In contrast, Bass Coast and Cardinia Shires have relatively low population densities in bushfire prone areas, although the extent of the bushfire prone area in Cardinia Shire is so expansive that an estimated 22,000 individuals are still exposed.
Figure 5.33: Spatial distribution of existing properties associated with bushfire prone areas within the Western Port region

Impacts of Climate Change in the Western Port Region
Final Report Page 109
Figure 5.34: Current (2006) population densities of census districts associated with current bushfire prone areas in the Western Port region

Impacts of Climate Change in the Western Port Region
Final Report Page 110
Table 5.42: Existing bushfire prone dwellings and populations in the Western Port region
LGA Exposed Dwellings (Number)a
Average Household
Sizeb Exposed
Population (#)c Population
Density (#/km2)d
Bass Coast Shire 1,284 2.2 2,825 8.9
Cardinia Shire 7,429 3.0 22,287 32.9
Casey City 261 2.0 522 70.3
Frankston City 5,978 2.3 13,749 832.0
Mornington Peninsula Shire
13,491 2.5 33.728 107.2
Total 28,443 73,111 a Number of exposed dwellings estimated from the number of green wedge, farming, residential and rural properties exposed to bushfire, assuming 1 dwelling per property. b Average household size estimated from average household sizes for CCDs in each LGA intersecting with bushfire hazard areas. c Exposed population estimated by multiplying exposed dwellings and average household size d Population density estimated from population densities from CCDs in each LGA intersecting with bushfire hazard areas. Source: ABS 2006 Census
The housing associated with the exposed population included an estimated 28,443 dwellings of various types including detached housing, flats and units, as well as rural residential structures. Such dwellings often bear the brunt of bushfire events as they are fixed on the landscape and unable to be relocated like the population that lives within. However, individual dwellings may vary in the vulnerability to bushfire damages. Past experience with fire damage to buildings and housing has led to the long-term review of building codes for structures in bushfire prone areas (Table 5.43). Dwellings constructed in at-risk areas in the wake of the 1983 Ash Wednesday bushfires are more likely to be built to a greater standard of bushfire protection. For example, in Cardinia Shire, over 62% of properties were developed post-1983, after the first edition of the Australian Standard AS 3959 (Figure 5.35). However, only 26% were developed after the second edition of the standard in 1999. Thus a sizeable fraction may be at heightened vulnerability due to its construction prior to the implementation of current national guidelines. In Mornington Peninsula Shire and Frankston City, even larger proportions of the housing stock were constructed prior to the implementation of current guidelines.

Impacts of Climate Change in the Western Port Region
Final Report Page 111
Table 5.43: Percentage of buildings constructed in Western Port LGAs under different bushfire management building codes
LGA Pre-1983 1983-1998 Post-1998
Bass Coast N/A N/A N/A
Cardinia 39% 36% 26%
Casey 23% 45% 32%
Frankston 52% 32% 16%
Mornington Peninsula
54% 37% 9%
Percentages based upon properties for which construction dates were available.
Source: Date obtained from the LGAs of the Western Port region. N/A indicates no data were available at the
time of writing.
Figure 5.35: Frequency distribution of property ages within Cardinia Shire
0
50
100
150
200
250
300
350
400
1847 1857 1867 1877 1887 1897 1907 1917 1927 1937 1947 1957 1967 1977 1987 1997 2007
Year
Num
ber o
f Pro
pert
ies
Vertical dashed lines represent the years of development and updating of the Australian Standard AS 3959 – Building in Bushfire-Prone Areas
Source: Cardinia Shire Council

Impacts of Climate Change in the Western Port Region
Final Report Page 112
5.2.4. Exposed private and public infrastructure
In addition to residential properties, there are other types of infrastructure and land uses within the Western Port region that are potentially vulnerable to future bushfire events.
Perhaps one of the most important exposed infrastructure types is transportation corridors. Comparison of road and rail networks in the Western Port region with bushfire prone areas identified over 1,600 linear km of roads and 75 km of rail lines that could be affected by bushfire (Table 5.44). Due to their high population densities, extensive transport networks and extensive bushfire prone areas, Cardinia and Mornington Peninsula were associated with the largest degree of potential transport exposure to bushfire. In contrast, exposure in Bass Coast Shire and Casey City was significantly lower.
The exposed road network in the region includes some key transport corridors (Figure 5.36). For example, in Frankston and Mornington Peninsula, both the Nepean and Moorooduc highways run through bushfire prone areas. Frankston could also be affected by disruptions to the Frankston-Dandenong and Cranbourne-Frankston Roads, and a number of bridges (including four in Seaford associated with the Nepean Highway) are in harm’s way. In Cardinia, bushfire prone areas overlap the Belgrave-Gembrook Road and the Beaconsfield-Emerald Road. In Bass Coast, the Bass and South Gippsland Highways are both susceptible to interruption by bushfire, and three bridges for the Inverloch-Venus Bay Road are also exposed. Meanwhile, rail lines traverse bushfire prone areas in northwest Frankston, northwest and northeast Mornington, and services through Cardinia could be disrupted due to bushfire prone areas in southeast Cardinia adjacent to the border with Bass Coast Shire.
Table 5.44: Existing road and rail infrastructure in LGAs of the Western Port region currently exposed to bushfire hazard
LGA Road (km)a Rail (km)a Bridges (#)b
Bass Coast Shire 87.6 0.0 3
Cardinia Shire 673.6 42.0 N/A
Casey 47.2 0.0 N/A
Frankston City 245.3 7.1 11
Mornington Peninsula Shire 568.0 25.5 N/A
Total 1,621.7 74.6 14 a Data on the locations of road and rail infrastructure provided by the five LGAs in the region. b N/A/ indicates data were not available

Impacts of Climate Change in the Western Port Region
Final Report Page 113
Figure 5.36: Spatial distribution of transport infrastructure associated with current bushfire prone areas within the Western Port region
In addition to transport infrastructure, a wide variety of other types of infrastructure in the region may also be susceptible to bushfire events (Figure 5.37). Risk is greatest where bushfire prone areas overlap with significant human development and population, such as Frankston City Council, the west coast of Mornington Peninsula (Mornington and Dromana), as well as the communities around Portsea and Sorrento, and northern Cardinia Shire Council. In Frankston City Council exposed facilities included areas zoned for schools and education, utilities, and local government. Mornington Peninsula contains the greatest diversity of assets at risk including industry, schools and medical centres, nursing homes, and even a yacht club. Exposed facilities in northern Cardinia were of a similar composition. However, the major electricity transmission lines that run from Latrobe Valley through northern Cardinia and northeast Casey to the northeast of Melbourne also traverse bushfire prone land. Another key piece of exposed infrastructure in Cardinia is the Cardinia Reservoir. In other areas, exposed critical infrastructure was more isolated, such as an industrial facility north of Wonthaggi and local government assets on Phillip Island.

Impacts of Climate Change in the Western Port Region
Final Report Page 114
Figure 5.37: Spatial distribution of facilities/infrastructure in the Western Port region associated with current bushfire prone areas
Facilities were identified from property descriptions or zone descriptions, depending upon the availability of information
5.3. Economic and Social Impacts Human factors can play a significant role in whether fires occur (e.g. arson, accidental ignition), but once ignited, fires generally have some scope to be detected and, if extinguished early, their impacts can be greatly reduced.
As such, wildfires are qualitatively different from other natural hazards such as storm surge and inland flooding. As noted in Middelmann (2007), for example, bushfire is the only hazard for which the potential of the hazard itself can be reduced, by reducing human ignitions and through early suppression. Further, there is a significant body of literature and other evidence pointing to the crucial role of preparation and behaviour in influencing the extent to which a bushfire, once underway, results in destruction of property and loss of life (e.g. Webster, 2000). Although there are regional projections on the increased frequency of fire weather conditions under a changed climate, it is

Impacts of Climate Change in the Western Port Region
Final Report Page 115
extremely difficult to determine how this increase might translate into future changes to fire frequency, intensity and extent and consequences for people and property40.
5.3.1. Direct market costs
Given the sizeable presence of properties and buildings in bushfire hazard areas, the potential economic implications of changes in bushfire events are quite large.
Close to 35,000 properties are currently exposed to bushfires, of which 46% are in Mornington Peninsula Shire, 26 % Cardinia, 21% Frankston, 5% Bass Coast and 1% Casey (Tables 5.45 to 5.49). Approximately 24,000 of the exposed properties are zoned residential, although taking into account green wedge and rural zonings the total number of exposed dwellings in the region is estimated to be about 28,200.
Table 5.45: Value of existing Bass Coast Shire property exposed to bushfire (thousands of $)a
Property Type Number Site Valuec Capital Improved Valued
Commercial 31 $ 8,501 $ 14,571
Industrial 16 $ 8,486 $ 9,514
Private Infrastructureb 4 $ 75 $ 80
Recreational 18 $ 2,172 $ 5,173
Residential 1,164 $ 218,375 $ 303,171
Rural 120 $ 99,038 $ 111,158
Services 2 $ – $ –
Unspecified 221 $ – $ –
Total 1,576 $ 336,646 $ 443,666 a Data on property values provided by the five LGAs in the region. b Includes transport, communication, utilities, and storage infrastructure as well as private marinas and yacht clubs. c Market value of land only d Total market value of the property including land, buildings and all other improvements
40 Even allowing for the use of fire behaviour modelling and probability analysis.

Impacts of Climate Change in the Western Port Region
Final Report Page 116
Table 5.46: Value of Casey City property exposed to bushfire (thousands of $)a
Property Type Number Site Valueb Capital Improved Valuec
Commercial 5 $ 19,966 $ 37,350
Industrial 3 $ 1,152 $ 1,152
Residential 238 $ 135,877 $ 184,953
Rural 23 $ 19,697 $ 23,795
Unspecified 71 $ – $ –
Total 340 $ 176,692 $ 247,250 a Data on property values provided by the five LGAs in the region. b Market value of land only c Total market value of the property including land, buildings and all other improvements
Table 5.47: Value of Mornington Peninsula Shire property exposed to bushfire (thousands of $)a
Property Type Number Site Valuec Capital Improved Valued
Commercial 95 $ 100,553 $ 115,545
Industrial 90 $ 336,242 $ 4,280,798
Private Infrastructureb 365 $ 23,276 $ 38,615
Recreational 34 $ 463,539 $ 470,731
Residential 13,333 $ 3,905,105 $ 5,830,027
Rural 158 $ 259,273 $ 262,046
Services 8 $ 12,044 $ 13,376
Unspecified 4,542 $ – $ –
Total 18,625 $ 5,100,031 $ 11,011,138 a Data on property values provided by the five LGAs in the region. bIncludes transport, communication, utilities, and storage infrastructure as well as private marinas and yacht clubs. c Market value of land only d Total market value of the property including land, buildings and all other improvements

Impacts of Climate Change in the Western Port Region
Final Report Page 117
Table 5.48: Value of Frankston City property exposed to bushfire (thousands of $)a
Property Typeb Number Site Valuec Capital Improved Valued
Business 66 $ 10,843 $ 17,850
Conservation and Resource 53 $ 5,965 $ 11,848
Farming 3 $ 303 $ 550
Floodway 1 $ 165 $ 255
Industrial 11 $ 1,454 $ 2,788
Public Use 105 $ 16,847 $ 26,447
Residential 5,829 $ 837,158 $ 1,530,549
Road 4 $ 363 $ 860
Rural 146 $ 18,583 $ 35,162
Special Use 23 $ 3,158 $ 5,010
Total 6,241 $ 894,837 $ 1,631,318 a Data on property values provided by the five LGAs in the region. b Property types determined by the associated planning zone in which they were located
c Market value of land only d Total market value of the property including land, buildings and all other improvements
Table 5.49: Value of Cardinia Shire property exposed to bushfire (thousands of $)a
Property Typeb Number Site Valuec Capital Improved Valued
Business 148 $ 22,184 $ 37,280
Conservation and Resource 222 $ 45,607 $ 66,433
Green Wedge 1,671 $ 317,638 $ 507,082
Industrial 5 $ 93 $ 412
Public Use 110 $ 12,448 $ 23,341
Residential 3826 $ 740,027 $ 1,149,193
Road 9 $ 1,087 $ 2,142
Rural 1,932 $ 372,416 $ 599,186
Total 7,923 $ 1,511,499 $ 2,385,068 a Data on property values provided by the five LGAs in the region. b Property types determined by the associated planning zone in which they were located
c Market value of land only d Total market value of the property including land, buildings and all other improvements

Impacts of Climate Change in the Western Port Region
Final Report Page 118
Tables 5.45 to 5.49 also show the site values (SV) and capital improved values (CIV) of exposed property. Consistent with earlier discussion (section 3.3.1), land values are assumed not to be relevant to the potential costs of bushfires. Thus only infrastructure values are considered here.
The total value of infrastructure exposed to bushfires in the region is currently about $7.7 billion, of which approximately $3.4 billion (44%) are dwellings and associated infrastructure, $3.9 billion (51%) are industrial facilities (virtually all in Mornington Peninsula) and $400 million (5%) are commercial, recreational and other facilities. However, these values do not provide an accurate indication of the potential impact of bushfires in the region, either now or under future climate change.
Considering residential property, McAneney (2006) has undertaken an analysis of the direct cost of bushfires to residential properties in Australia over the last century, drawing on the PerilAUS database. Based on probability analysis, he concludes that average annual home loss in Australia over the period has been 83 homes, with annual average damage valued at $33.5 million, based on average replacement value for home and contents of $440,000. Losses occurred in about 60% of years examined. However, he stresses that losses are not uniform over the period, with most occurring as a consequence of a few catastrophic fires that ‘got away’ (see Figure 5.38).
Figure 5.38: Annual number of domestic dwellings lost to bushfires in Australia
Source: modified from McAneney 2006
McAneney (2006) found no trend in losses over the past century despite increases in exposed population on the one hand and improvements to technology and firefighting resources on the other. He concludes that historical data are a valid representation of potential future losses. Based on estimated 340,000 houses exposed to significant
Western Port region

Impacts of Climate Change in the Western Port Region
Final Report Page 119
bushfire risk around major cities in Australia, it would take 4100 years for bushfires to destroy all of these. Significantly though, McAneney (2006) appears not to have factored climate change into his analysis.
Lacking a complete record of bushfires in the Western Port region, the modelling used by McAneney (2006) has not been applied in this study. Nevertheless, initial analysis of available information for the region produces results that are consistent with his national analysis:
Approximately 650 to 750 houses have been destroyed in the Western Port region by bushfires since 1898.
This equates to an average annual loss of six to seven houses in the region over the period.
Bushfires in the region resulting in destruction of private property have occurred on average approximately every 15 years.
A large majority of total houses lost in the region occurred in the Ash Wednesday bushfires, which destroyed up to 545 houses or about 65 to 85% of the total41. The economic cost of residential properties lost in the Western Port region in the Ash Wednesday fires was up to $190 million (in 2007 dollars).
Other destructive fires in the region, in terms of property losses, include the Red Tuesday fires of 1898 and the Black Tuesday fires of 1944.
The 28,200 residential properties currently exposed to bushfires in the region are approximately 8.3% of exposed properties nationally (340,000).
Applying the same percentage to the average annual loss of 83 homes nationally projected by McAneney (2006), also gives an expected average annual loss of six to seven houses for the region.
Thus based on historic evidence, it could be concluded that the region might expect to lose an average of around six to seven houses to bushfires annually over the coming century, with most of the losses occurring in one or a small number of catastrophic fires. The damage cost of losses would be equivalent to about $2.1 to 2.5 million annually42. However, this conclusion does not factor in climate change. Given projections which indicate that there will be a substantial increase in the number of days of very high and extreme fire weather by 2050, it can reasonably be argued that the threat to residential property from wildfires will, in the absence of further improvement in fire preparation and management practices, increase in the future relative to last century. It is not possible to quantify the increase in this threat however.
41 Officially some 238 houses were destroyed in the Upper Beaconsfield fire but a proportion of these houses were located outside of the region in Belgrave South. 42 Based on an average economic value of $350,000 per house, including contents. This is less than the $440,000 per house applied by McAneney (2006), who used replacement value and in doing so did not take depreciation into account.

Impacts of Climate Change in the Western Port Region
Final Report Page 120
5.3.2. Indirect market costs
As discussed earlier in this chapter, significant public and private infrastructure in the region are exposed to bushfires. As noted in the previous section, projections of a substantial increase in the number of very high and extreme fire days in the region indicate an increase in the threat to this infrastructure. Indirect costs stemming from the increased threat also have the potential to be significant and in some instances could be as great as direct costs (BTE, 2001).
Table 5.50 provides an overview of the potential indirect costs of bushfires and other natural hazards. Three categories are discussed here in the context of an increased threat of bushfires to the region.
Table 5.50: Classification of indirect tangible costs
Indirect cost category Examples
Disruption of business manufacturing production retail other business services
Disruption of transport road traffic rail traffic
Disruption of networks water and wastewater electricity and gas telecommunications
Disruption of public services health education aged care
Emergency service costs
local government fire (CFA) ambulance police SES
Source: After Thompson & Handmer 1996
First is the potential disruption of transport. As noted, over 1,600 linear km of roads and 75 km of rail lines are identified in the region as being exposed to bushfires. Major roads identified include the Nepean, Moorooduc, Bass and South Gippsland highways, the Frankston-Dandenong and Cranbourne-Frankston Roads and the Belgrave-Gembrook Road and the Beaconsfield-Emerald Road. The major risks arising from bushfire threats to these roads are not so much direct physical damage but disruptions to transport. These disruptions can interfere not only with local and regional commerce, but also affect emergency management responses, as the movement of vehicles and personnel is heavily dependent upon road access.
A second category of indirect cost relevant to the region is disruption of networks, notably of energy supply. This issue is highlighted because of the significant electricity transmission and distribution infrastructure located in the region, some of which is exposed to bushfires. Noteworthy infrastructure includes the 500kV transmission line connecting Latrobe Valley generators and Melbourne. This line dissects Casey and Cardinia, including bushfire exposed areas. The significance of potential threats to this line was borne out in January 2007 when bushfires knocked out a major transmission line

Impacts of Climate Change in the Western Port Region
Final Report Page 121
near Benalla causing major blackouts across Melbourne. Other major electricity infrastructure in the region exposed to bushfires includes the 200kV transmission line through Bass Coast Shire that connects South Gippsland to the grid.
A third significant category of indirect costs in the region is emergency service costs. Of particular interest is the volunteer fire (and other emergency) services provided in the region by the Country Fire Authority. The CFA’s annual budget for Victoria was approximately $289 million in 2005–06. However, this sum needs to be considered in context of the substantial volunteer input to the service, valued at around $500 million annually (CFA, 2007). In the Western Port region there are currently 74 CFA brigades, with an active membership of approximately 2500 (principally) volunteer personnel. Assuming that each volunteer provides an average of 300 hours/year of voluntary work (including attendance at ‘incidents’, training and meetings)43, this equates to approximately 750,000 hours of voluntary work for fire protection and associated emergency services in the region each year. This work has an annual value of at least $14 million44. To this amount can be added CFA expenditure in the region as well as bushfire-related costs of other emergency and volunteer services, such as those associated with local councils, ambulance, police and the SES. Thus emergency service costs in the region relating to bushfires are already substantial and may need to increase significantly in the future to meet the increased bushfire threat.
5.3.3. Intangible costs
As noted in previous chapters, communities tend to value the intangible costs of natural disasters, such as health impacts, loss of memorabilia and ecological and cultural damages, as great or greater than the tangible dollar losses (BTRE, 2001; Handmer, 2003).
Loss of life has undoubtedly been a key intangible cost of bushfires in Western Port, bushfires being associated with more deaths than any other natural disaster in the region. Causing 26 deaths, the Ash Wednesday bushfires of 1983 were responsible for the greatest loss of life of any natural disaster in the region’s history. Other bushfires have also probably been responsible for multiple deaths in the region including in 1898, 1942 and 1944.
Two alternative methods are used to quantify in monetary terms the cost of death and injuries from natural disasters and other premature deaths. These methods are the ‘human capital approach’ and the ‘willingness to pay approach’ (see Box 5.3). The most widely applied method in Australia in relation to loss of life due to natural disasters is the human capital approach. If applied to the Ash Wednesday fires, the cost of lives lost as a result of the Ash Wednesday fires in the region would be valued at approximately $44 million (in 2007 dollars). However, the human capital approach is controversial, not least because it fails to account for a range of intangible losses associated with premature loss of life including grief, pain and suffering.
One indirect health effect of bushfires, sometimes overlooked, is their impact on air quality. This can become a particular problem if the fires occur over an extended period 43 Based on discussions with volunteer CFA personnel. 44 Assuming the volunteer labour is valued at approximately $19-20 per hour - the ABS (1997) valued voluntary work at $13.30 in 1997.

Impacts of Climate Change in the Western Port Region
Final Report Page 122
and climate conditions do not allow for rapid smoke dispersal. Exposure to fine particulates (PM10) in bushfire smoke can have significant adverse health affects, at least in the short term, especially for people with existing respiratory or heart conditions (Coghlan, 2004). Children and the elderly are particularly sensitive.
It is not possible to quantify the future cost of bushfires in the region in terms of loss of life and other health impacts (with or without climate change), there being so many biophysical and human factors that can influence the number of people who are killed or injured by bushfires. All that can be said is that the intangible, but very real, costs of bushfires are an important issue that need to be factored into any examination of the impacts of climate change in the region in the future.
Box 5.12. Alternative Approaches to Valuing Premature Loss of Life
Most people would consider that their own lives and those of loved ones are priceless. However, when a ‘value of life’ is being developed for use in public policy decision-making it is not any particular person’s life that is valued but that of an unknown or ‘statistical’ individual. A statistical life is based on the probability of death in a given population. It is the value of a statistical life that is used in making decisions about disaster mitigation expenditure. As a result, the funds allocated to saving statistical lives are typically much less than are often spent saving individual lives. There are two main approaches available for estimating the value of a statistical life: ‘human capital’ and ‘willingness to pay’. The two approaches are discussed briefly below.
The human capital approach
The human capital approach characterises people, and therefore life, as a labour source and input to the production process. This approach argues that the value to society of preventing a death or injury is the saving in potential output or productive capacity. It is an ex post accounting approach that uses the discounted present value of a victim’s potential future earnings as a proxy for the cost of premature death or permanent injury. It also takes into account of lost quality of life, medical costs, coronial costs, premature funeral costs, legal costs, correctional service costs and workplace disruption and staff replacement costs. The BTE (2001) has valued life lost through natural disasters in Australia at $1.3 million ($1.75 million in 2007 dollars).
The willingness to pay approach
The willingness to pay approach estimates the value of life in terms of the amounts that individuals are prepared to pay to reduce risks to their lives (or amounts accepted as compensation for bearing increased risk). The approach uses people’s preferences (either stated or revealed) to ascertain the value they place on reducing risk to life and reflects the value of intangible elements such as quality of life and joy of living. As the willingness to pay approach includes elements that the human capital approach has difficulty in costing it will generally give higher values. Various overseas willingness to pay studies have estimated the value of a statistical human life to be from $2.4 million to $5.7 million (in 2007 Australian dollars). The wide variation in these estimates reflects in part, the fact that the value depends on circumstances and individual preferences in avoiding or accepting physical risk.
Source: BTE, 2001

Impacts of Climate Change in the Western Port Region
Final Report Page 123
5.4. Summary of the Potential Implications of Exposure to Bushfire Hazard in the Western Port Region
Sector/LGA Summary of Potential Bushfire Exposure and Impacts Locations
Bass Coast • Approximately 75.7 km2 are designated bushfire prone areas, particularly land areas in the LGA’s north and southeast
Cardinia • Approximately 444.8 km2 are designated bushfire prone areas, largely concentrated in the bushland and neighbouring townships in the LGA’s north
Casey • Approximately 22.6 km2 are designated bushfire prone areas, with exposed areas occurring in the far northwest and northeast and south of Cranbourne
Frankston • Approximately 35.5 km2 are designated bushfire prone areas, with at-risk areas principally in the southern and eastern parts of the LGA
MPS* • Approximately 131.7 km2 are designated bushfire prone areas, particularly coastal reserves. At-risk areas include the areas surrounding Dromana, Crib Point, Shoreham, and HMAS Cerberus.
Populations Bass Coast • An estimated 2,825 current residents in 1,284 dwellings live in bushfire hazard areas. Particular at-risk populations include rural, isolated
households that are less accessible to emergency services and elderly households that may have difficulty defending their own homes.
Cardinia • An estimated 22,287 current residents in 7,429 dwellings live in bushfire hazard areas. Particular at-risk populations are those living in bushland areas on the urban fringe, especially elderly households that may have difficulty defending their own homes.
Casey • An estimated 522 current residents in 261 dwellings live in bushfire hazard areas. Exposed households comprise a small proportion of the LGA total. Households residing in bushland areas on the urban fringe are the most vulnerable.
Frankston • An estimated 13,749 current residents in 5,978 dwellings live in bushfire hazard areas. At-risk populations are principally residential areas close to bushland. Exposed elderly and low income households are particularly vulnerable.
MPS • An estimated 33,728 current residents in 13,491 dwellings live in bushfire hazard areas. Particular at-risk populations include residential development in or close to bushland and rural and elderly households that may have difficulty defending their own homes.
Property Bass Coast • $107 million of property improvements exposed to bushfire hazard, principally residential
Cardinia • $873 million of property improvements exposed to bushfire hazard, residential and rural Casey • $71 million of property improvements exposed to bushfire hazard, nearly all residential
Frankston • $736 million of property improvements exposed to bushfire hazard, nearly all residential MPS • $5,876 million of property improvements exposed to bushfire hazard, industrial (~$1.9 b)and residential (~$3.9 b)
Infrastructure Bass Coast • 87.6 km of road network (including 3 bridges) exposed to bushfire hazard, including the Bass Highway
• Local government facilities on Phillip Island, industrial facilities north of Wonthaggi
Cardinia • 673.6 km of road network and 42 km of rail network exposed to bushfire hazard, including the South Gippsland Highway • Various industrial facilities, Cardinia Reservoir, electricity transmission lines, medical facilities and nursing homes, educational facilities
Casey • 47.2 km of road network exposed to bushfire hazard, including the Beaconsfield-Emerald Road • Electricity utilities, medical centres, educational facilities in the northwest are exposed • In the southeast, Harwood Aerodrome east of Tooradin is exposed
Frankston • 245.3 km of road network (including 11 bridges) and 7.1 km or rail network exposed to bushfire hazard, including the Nepean, Frankston,
and Moorooduc Highways and Cranbourne-Frankston and Frankston-Dandenong Roads. • Educational facilities and utilities
MPS • 568.0 km of road network and 25.6 km of rail network exposed to bushfire hazard, including the Nepean and Moorooduc Highways
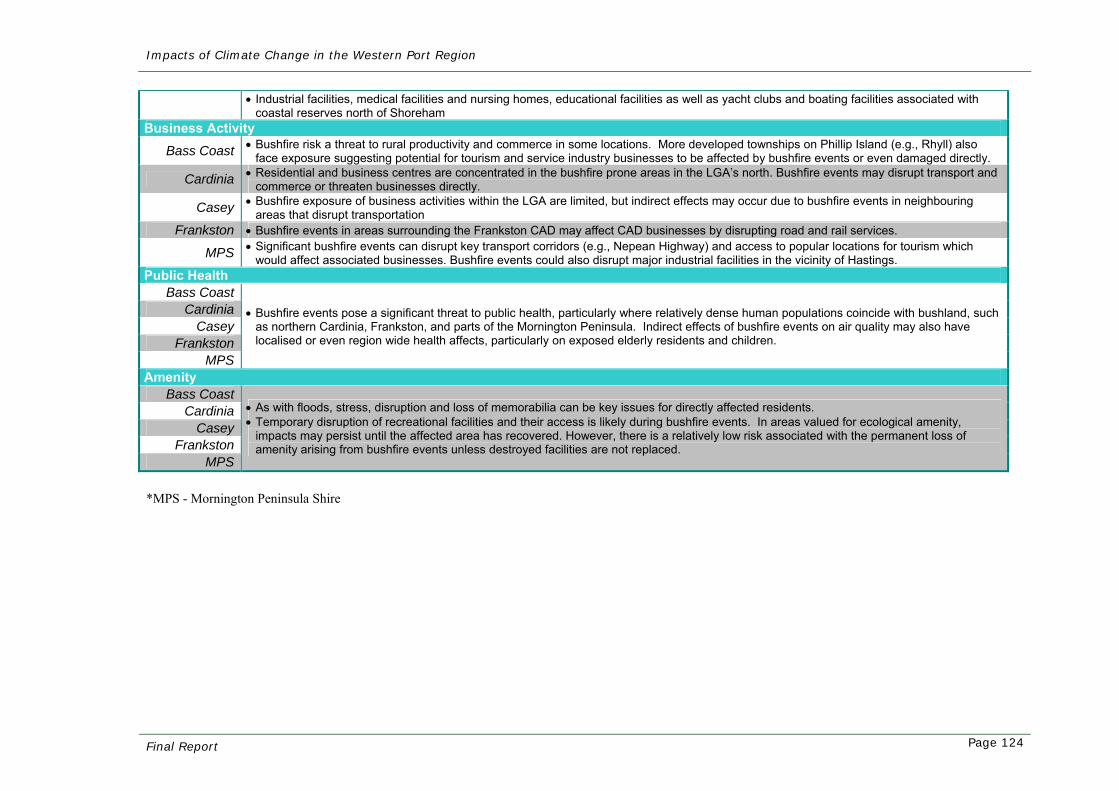
Impacts of Climate Change in the Western Port Region
Final Report Page 124
• Industrial facilities, medical facilities and nursing homes, educational facilities as well as yacht clubs and boating facilities associated with coastal reserves north of Shoreham
Business Activity Bass Coast • Bushfire risk a threat to rural productivity and commerce in some locations. More developed townships on Phillip Island (e.g., Rhyll) also
face exposure suggesting potential for tourism and service industry businesses to be affected by bushfire events or even damaged directly.
Cardinia • Residential and business centres are concentrated in the bushfire prone areas in the LGA’s north. Bushfire events may disrupt transport and commerce or threaten businesses directly.
Casey • Bushfire exposure of business activities within the LGA are limited, but indirect effects may occur due to bushfire events in neighbouring areas that disrupt transportation
Frankston • Bushfire events in areas surrounding the Frankston CAD may affect CAD businesses by disrupting road and rail services.
MPS • Significant bushfire events can disrupt key transport corridors (e.g., Nepean Highway) and access to popular locations for tourism which would affect associated businesses. Bushfire events could also disrupt major industrial facilities in the vicinity of Hastings.
Public Health Bass Coast
Cardinia Casey
Frankston MPS
• Bushfire events pose a significant threat to public health, particularly where relatively dense human populations coincide with bushland, such as northern Cardinia, Frankston, and parts of the Mornington Peninsula. Indirect effects of bushfire events on air quality may also have localised or even region wide health affects, particularly on exposed elderly residents and children.
Amenity Bass Coast
Cardinia Casey
Frankston MPS
• As with floods, stress, disruption and loss of memorabilia can be key issues for directly affected residents. • Temporary disruption of recreational facilities and their access is likely during bushfire events. In areas valued for ecological amenity,
impacts may persist until the affected area has recovered. However, there is a relatively low risk associated with the permanent loss of amenity arising from bushfire events unless destroyed facilities are not replaced.
*MPS - Mornington Peninsula Shire

Impacts of Climate Change in the Western Port Region
Final Report Page 125
6. IMPACTS ASSOCIATED WITH CHANGES TO AVERAGE AND EXTREME TEMPERATURES
Chapter Summary
• Average temperatures in the Western Port region are virtually certain to increase in future decades. This trend will increase the frequency and severity of extreme temperature events, including hot days and heatwaves. The frequency of cold nights will decline.
• Increases will be fairly uniform throughout the region, although inland areas are likely to be more affected than coastal areas.
• Heat-related illness and mortality is a major potential cost of the rise in extreme temperatures, with the most vulnerable group in the community being elderly people. There are significant concentrations of elderly in Bass Coast and on the Port Phillip Bay coastline of Mornington Peninsula.
• Poor thermal comfort and/or high summer energy use are other potential impacts of the increase in extreme temperatures. However, energy demand during the winter may decline. Much of the housing stock in the region, both older and newer, is likely to have poor or questionable thermal performance.
• Extreme temperatures also pose risks to infrastructure in the region, in particular to transport infrastructure.
6.1. Temperature Increases in Western Port: The Issues Average temperatures in the Western Port region are virtually certain to increase in future decades – a trend that also will increase the frequency and severity of extreme temperature events.
Temperatures are likely to increase in all seasons of the year but warming is likely to be greatest in summer and least in winter Macadam et al. (2008). Rising average will also be associated with an increase in extreme temperatures (Table 6.51).
Table 6.51. Projected changes in the annual number of days with daily maximum temperatures in excess of 35°C for locations in the Western Port
region
Location Present (1971–2000) 2030 2070
Cape Schank 2 3–4 3–10
Scoresby 7 8–10 10–24
Wonthaggi 4 5–6 5–13
Source: Macadam et al. (2008)
Rising average temperatures and more frequent extreme temperature days have the potential to contribute to a variety of impacts in the Western Port region. The existing literature on climate change and rising temperatures indicates that impacts that are most relevant to the region’s settlements are:

Impacts of Climate Change in the Western Port Region
Final Report Page 126
heat-related illness and mortality;
building thermal comfort and associated energy demand; and
degradation of building materials and infrastructure
6.2. Exposed Areas, Infrastructure and Populations
6.2.1. Heat-related illness and mortality
As temperatures throughout the Western Port region are relatively similar on a day-to-day basis, a key consideration affecting the health consequences of extreme heat is the demographic composition of the exposed population.
Given the particular sensitivity of the elderly to extreme heat events, those areas that have a disproportionately high concentration of individuals over the age of 65 may be a useful indicator of locations most at-risk (Figure 6.39).
Figure 6.39: Distribution of individuals 65 years of age or older in the Western Port region in 2006
Source: ABS 2006 Census.
Mapping of this information (by census collection district) reveals a general pattern of risk throughout the region, with the most vulnerable areas falling into two categories:

Impacts of Climate Change in the Western Port Region
Final Report Page 127
First and foremost, areas around townships and cities tend to have a higher proportion of individuals over the age of 65 in the population.
Second, a number of coastlines also have a disproportionately high percentage of elderly individuals, such as the Port Phillip Bay coastline of Mornington Peninsula, the southeast Western Port coastline of Mornington Peninsula, and northern Phillip Island.
6.2.2. Building thermal comfort
Older residential buildings arguably pose the greatest challenge to the management of thermal conditions and energy demand, since they are more likely to be poorly insulated, making the management of indoor temperatures challenging.
Since 1992 by contrast, new houses in Victoria have been required to be insulated, a standard that, at least in principle, should increase their thermal comfort and promote energy efficiency. Standards were strengthened in 2004 with the introduction of a minimum 5 Star energy rating for new houses, as defined by the Nationwide House Energy Rating Scheme (NatHERS). In the Western Port region though, available data suggests that, with the exception of Casey, a majority of houses were constructed before 1992 and therefore potentially do not even meet the lower standard, let alone the 5 Star rating (see Table 6.52).
However, more detailed local surveys are required to determine the actual thermal performance of the region’s housing stock noting that:
some of the older buildings in the region were likely to have been constructed with attention to thermal comfort, through the use of natural ventilation and shading; and
new or newer buildings in the region are more likely to have climate controls such as air conditioning.
Table 6.52: Percentage of buildings constructed in Western Port LGAs under different energy efficiency building codes
LGA Pre-1992
(no standards)
1992-2004 (insulation standards)
Post-2004 (5 Star rating)
Bass Coast N/A N/A N/A
Cardinia 62% 32% 5%
Casey 47% 46% 7%
Frankston 73% 23% 4%
Mornington Peninsula
80% 18% 2%
Percentages based upon properties for which construction dates were available. N/A indicates data were not available at the time of writing. Source: Date obtained from the LGAs of the Western Port region.

Impacts of Climate Change in the Western Port Region
Final Report Page 128
6.2.3. Degradation of building materials and infrastructure
As the region’s building materials and infrastructure are largely exposed to similar thermal conditions, the implications of increases in temperature extremes may be greatest for those areas exposed to multiple climate stresses.
For example, buildings and infrastructure in flood zones or the coastal margins are also exposed to extreme temperatures in addition to these other stresses. Those areas where there is overlapping exposure to climate hazards may therefore experience the greatest challenges with respect to the design and maintenance of robust infrastructure.
6.3. Economic and Social Impacts Rising average temperatures and more frequent extreme temperature days have the potential to contribute to a variety of impacts in the Western Port.
However, as noted, the impacts that are most relevant to the region’s settlements are likely to be:
heat-related illness and mortality (a direct intangible cost);
building thermal comfort and energy demand (relevant to both direct intangible costs and indirect market costs); and
degradation of building materials and infrastructure (a direct market cost).
Each of the potential impacts is discussed further below.
6.3.1. Heat-related illness and mortality
Human exposure to temperatures that are excessively high or low can have direct adverse health consequences.
Public health practitioners have identified a ‘j-shaped’ response of human health to temperature (Figure 6.40), with excess mortality associated with extremes of both cold and hot, but rising more rapidly as temperatures exceed approximately 30°C (Davis et al., 2003). This is typical of physiological responses to a broad range of environmental conditions. Research on the implications of climate change on heat-related illness and mortality has largely focused on the potential increases in heat-related mortality, although it should be noted that the potential for reductions in cold-related winter mortality is also a real possibility (Guest et al., 1999; Dixon et al., 2005). There is ongoing debate regarding which of these two factors may be more important, but in reality it is likely to vary from location to location depending on local climate and socio-economic conditions.
Heat-related mortality is currently a public health issue in Victoria. For example, Woodruff et al. (2005) estimated that approximately 289 individuals aged 65 or older currently die each year in the Melbourne region due to heat-related causes, which is roughly 77 per 100,000. These deaths predominantly occur during summer months when temperatures are at their peak, and despite the widespread finding that elderly individuals are more sensitive to heat events, analysis indicates that mortality does not simply occur in individuals where death was otherwise imminent, but in generally healthy individuals that would have been expected to continue living for years in the absence of the heat event (UK NHS, 2005). It should also be noted that the temperature threshold beyond
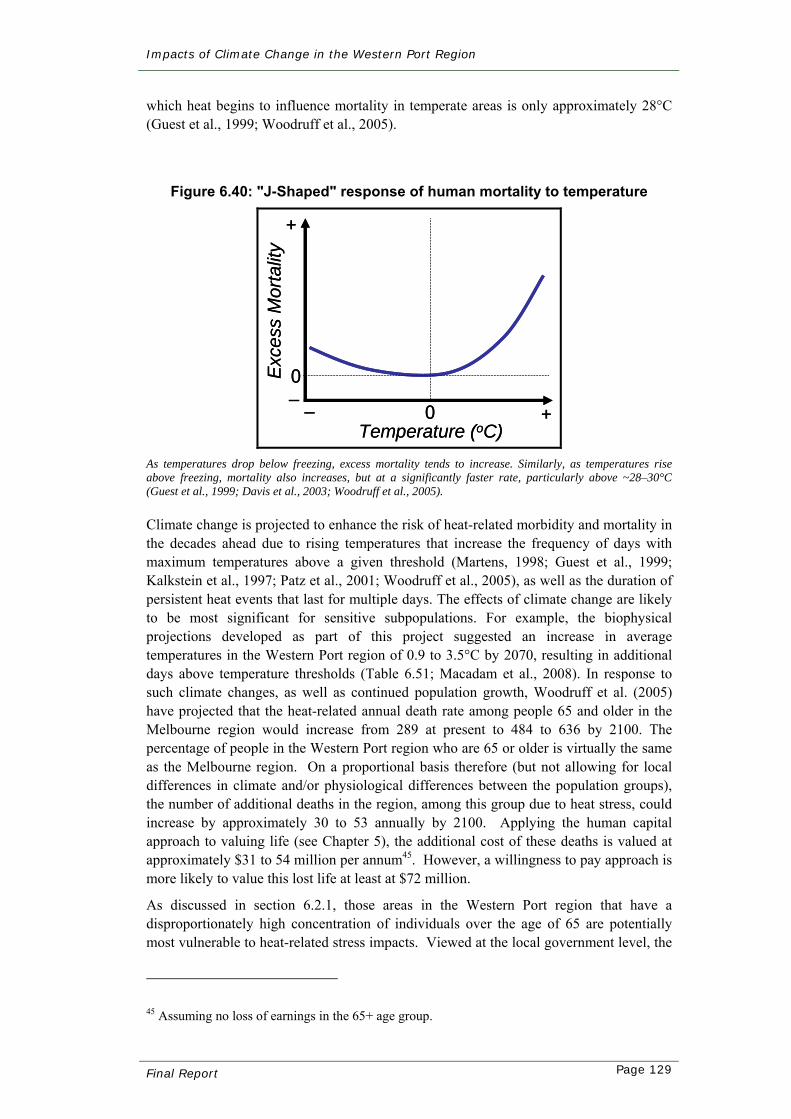
Impacts of Climate Change in the Western Port Region
Final Report Page 129
which heat begins to influence mortality in temperate areas is only approximately 28°C (Guest et al., 1999; Woodruff et al., 2005).
Figure 6.40: "J-Shaped" response of human mortality to temperature
Exc
ess
Mor
talit
y
Temperature (oC)0
0
+
– – +
Exc
ess
Mor
talit
y
Temperature (oC)0
0
+
– – +
As temperatures drop below freezing, excess mortality tends to increase. Similarly, as temperatures rise above freezing, mortality also increases, but at a significantly faster rate, particularly above ~28–30°C (Guest et al., 1999; Davis et al., 2003; Woodruff et al., 2005).
Climate change is projected to enhance the risk of heat-related morbidity and mortality in the decades ahead due to rising temperatures that increase the frequency of days with maximum temperatures above a given threshold (Martens, 1998; Guest et al., 1999; Kalkstein et al., 1997; Patz et al., 2001; Woodruff et al., 2005), as well as the duration of persistent heat events that last for multiple days. The effects of climate change are likely to be most significant for sensitive subpopulations. For example, the biophysical projections developed as part of this project suggested an increase in average temperatures in the Western Port region of 0.9 to 3.5°C by 2070, resulting in additional days above temperature thresholds (Table 6.51; Macadam et al., 2008). In response to such climate changes, as well as continued population growth, Woodruff et al. (2005) have projected that the heat-related annual death rate among people 65 and older in the Melbourne region would increase from 289 at present to 484 to 636 by 2100. The percentage of people in the Western Port region who are 65 or older is virtually the same as the Melbourne region. On a proportional basis therefore (but not allowing for local differences in climate and/or physiological differences between the population groups), the number of additional deaths in the region, among this group due to heat stress, could increase by approximately 30 to 53 annually by 2100. Applying the human capital approach to valuing life (see Chapter 5), the additional cost of these deaths is valued at approximately $31 to 54 million per annum45. However, a willingness to pay approach is more likely to value this lost life at least at $72 million.
As discussed in section 6.2.1, those areas in the Western Port region that have a disproportionately high concentration of individuals over the age of 65 are potentially most vulnerable to heat-related stress impacts. Viewed at the local government level, the
45 Assuming no loss of earnings in the 65+ age group.

Impacts of Climate Change in the Western Port Region
Final Report Page 130
council with the greatest number of over 65 people at present is Mornington Peninsula Shire (see Table 6.53). As a percentage of the total population however, Bass Coast Shire would also appear to be vulnerable to these impacts.
Table 6.53: Numbers and percentages of populations in Western Port region over 65 years of age and under 5 years of age
LGA Number of people >65
years
Percentage of total
population
Number of infants <5
years
Percentage of total
population
Bass Coast 6,105 23% 1,394 5%
Cardinia 5,591 10% 4,284 8%
Casey 16,921 8% 16,775 8%
Frankston 15,323 13% 7,561 6%
Mornington Peninsula
27,063 20% 7,799 7%
Source: ABS Census 2006
Though less-well-documented in the context of climate change, epidemiological research also indicates that young children and infants are also sensitive to temperature extremes due to poor thermo-regulation (Guest et al., 1999; Scheers-Masters et al., 2004).
The implications of extreme heat events for public health may be exacerbated by population density, growth and development. Research has found that mortality during extreme heat events is higher in urban areas due to the thermal effects of heat islands (Buechley et al., 1972; Clarke, 1972; Bridgman et al., 1995; Smoyer, 1998). The urban heat island effect, for example, is a well-documented phenomenon where urban areas tend to have higher average temperatures than surrounding areas, particularly at night (Chen and Zhou, 2004; Chen et al., 2006). Analysis of thermal environments around different locations in Melbourne with different development densities revealed a tendency for higher temperatures (particularly nighttime temperatures) in the more densely developed areas (Coutis et al., 2007). As such, future development decisions and densities are likely to have an influence on the thermal environment of the Western Port region, although this is likely to be significant only for the region’s most densely populated areas.
The risk of adverse health effects in response to high temperature events is also heavily dependent upon socio-economic and demographic characteristics. First and foremost, the sensitivity of different areas across the Western Port region to extreme heat events is dependent upon the size of the exposed population. The greater the number of individuals exposed, the greater the likely number of deaths, as evidenced by observed heat-related mortality across Australian cities (Woodruff et al., 2005). With the population of the Western Port region rising, more individuals are likely to be exposed in a future warmer climate. Perhaps more importantly, the aging of the region’s population is likely to increase the size of the sensitive over-65 subpopulation. Experience with the 2003 heat wave in Europe illustrated the fact that vulnerable sub-populations such as the elderly

Impacts of Climate Change in the Western Port Region
Final Report Page 131
were more at risk if confined or with reduced mobility (Vandentorren et al., 2006), which may be exacerbated when individuals live alone (Semenza et al., 1999).
Changing demographics must be considered in the context of other changes that are likely to accompany demographic change in the decades ahead. Specifically, changes in housing stock and materials may reduce future health risk associated with extreme events (see below). For example, older, less thermally-efficient housing may be replaced over time, and new development may be built to a higher standard and/or incorporate newer materials, and individuals may make greater use of air conditioning or other technological measures for addressing heat. Predicting the net effects of such changes is quite difficult, but there is evidence for a relationship. For example, a UK study of housing health and safety estimated that heat-related mortality was largely restricted to housing in multiple-occupancy structures, with those living just under the roof particularly at risk (Office of the Prime Minister, 2003). This is supported by a range of earlier studies (Centers for Disease Control, 1981; Kilbourne et al., 1982; Semenza et al., 1996; Smoyer, 1998). As such, there is a reasonable possibility that improvements in building design and upgrading of housing in Western Port in the future may reduce vulnerability to extreme heat episodes. On the other hand, scenarios where temperatures rise, population densities increase, and housing construction proceeds with little consideration for climate change can also be envisioned. Were such a future to occur, increases in vulnerability would not be out of the question.
6.3.2. Building thermal comfort and energy demand
Increases in ambient temperature will have direct consequences on the comfort of buildings, which will necessitate either changes in the manner in which buildings are constructed and/or the management of heating and cooling of indoor spaces.
Prior assessments have indicated that Australia’s building stocks have historically developed and persist under extreme temperature conditions (BRANZ, 2007). As noted previously, prior to the advent of air conditioning and other mechanical cooling technologies, buildings were constructed with more attention to thermal comfort, such as greater natural ventilation to the outside and the use of natural shading. In some ways, improvements in technology have increased vulnerability of buildings to extreme temperature events, as the availability and assumed reliance upon mechanical cooling has led to the allowance of greater exposure to solar heating as well as reduced external ventilation.
The practical consequences of higher temperatures are reduced indoor comfort, which, if not appropriately managed, may have consequences on health under the worst-case scenario, but chronic exposure may affect productivity of workers. However, it is almost certain that buildings will be managed to maintain existing preferences for thermal comfort as temperatures rise. With existing building stock, this will necessitate changes in energy use, largely increasing energy consumption as usage of mechanical cooling rises. For example, estimates of energy consumption for metropolitan Melbourne in 2070 indicate that consumption increases approximately three-fold compared to current (i.e. 2005) levels (Figure 6.41). However, despite a significant expansion of cooling energy consumption, net annual consumption declines moderately due to a sharp reduction in winter heating consumption that offsets increasing summer cooling. This response is typical of buildings in southern temperate Australia.

Impacts of Climate Change in the Western Port Region
Final Report Page 132
Nevertheless, an increase in summer peak energy demand could still be an issue for households and other energy users in the Western Port region as seasonal peak demand for electricity shifts from winter to summer. Peak loads are already nearing capacity on many parts of the grid at present, and in the absence of effective demand management strategies the growing demand during summer is likely to necessitate further augmentation of capacity of both generation and local distribution networks. This augmentation will require substantial investment and, depending on the relative pricing of energy during different seasons and the likely increase in consumption during daily times of peak demand, annual increased energy costs across the board could still occur for energy users in the Western Port region, even with reductions in annual energy consumption.
This outcome is a real possibility for some residential energy users if real time electricity pricing is introduced as means of curbing summer peak demand – a policy response that current climate projections is sure to encourage. Current pricing arrangements, which allow for the ‘smearing’ of costs across different user groups, mean that air-conditioned households are receiving an energy subsidy at the expense of non air-conditioned households. There is insufficient data at the local council level to know whether households in the Western Port region will in the main benefit or lose from changed pricing arrangements.
Figure 6.41: Comparison of average annual energy consumption in buildings
Source: Branz, 2007
Temperature increases associated with climate change will manifest against a backdrop of ongoing development, including the construction of new buildings as well as changes in building preferences and standards, design and materials. For example, population in the LGAs of the Western Port region increased by 15% between 2001 and 2006. Meanwhile, energy efficiency requirements were introduced in July 2004 in Victoria requiring new houses to be built to a 5 Star standard, with Star rankings defined by the Nationwide House Energy Rating Scheme (NatHERS; Branz, 2007). This followed the

Impacts of Climate Change in the Western Port Region
Final Report Page 133
introduction of insulation requirements for new houses in Victoria in 1992. In contrast, in a sample of 240 Victorian houses examined in 1999, more than 80% were rated as less than 3 stars (AGO, 2000). Similarly, data for the Western Port region indicates that only 2 to 7 % of houses in the region (depending on the local government area) were constructed post-2004 and therefore definitely meet the 5 Star rating (see Table 6.52), although it is likely that at least some houses constructed prior to 2004 also meet the 5 Star rating. Nevertheless, further tightening of energy efficiency standards in new construction and upgrades, scheduled for 2008, may contribute to reductions in per unit energy consumption in the future, even though the total number of building units may increase.
6.3.3. Degradation of building materials and infrastructure
Just as high temperatures can stress human beings, they also pose a potential source of stress to building materials and other infrastructure.
For example, a report on climate change and infrastructure in Victoria (CSIRO et al., 2007), rated temperature increases as posing a ‘moderate’ to ‘high risk’ on buildings and infrastructure, with risk increasing with the magnitude of future temperature changes (Table 6.54).
Table 6.54: Risk ratings of impacts on buildings and infrastructure due to temperature increases
The predominant risk of extreme temperatures on infrastructure is associated with transport. For example, CSIRO et al. (2007) identified the degradation of asphalt and jointed concrete roads as well as degradation of road foundations as potential consequences of increasing temperature extremes for Victorian transport (Table 6.54; see also Mills and Andrey, 2002). Given the extensive length of roads within the Western Port region (Table 6.55) and the significant proportion of council budgets currently devoted to road construction and maintenance (5 to 13%)46, marginal increases in road degradation and maintenance costs could have significant implications for local governments.
46 See Chapter 8 for further discussion.
2030 2070 Impact
Low High Low High
Degradation of road asphalt Moderate Moderate Moderate Moderate
Degradation of road foundation Moderate Moderate Moderate High
Rail track movement Low Moderate Moderate High
Structural degradation of bridges Moderate High High High
Degradation and failure of building materials Moderate Moderate Moderate Moderate
Low and high ratings are associated with low and high scenarios of temperature increases for each time period. Source: CSIRO et al. (2007)

Impacts of Climate Change in the Western Port Region
Final Report Page 134
Table 6.55: Total length of road infrastructure LGAs of the Western Port region
Road Type Length (km)
Bass Coast 1,157.0
Cardinia Shire 1,765.4
Casey City 1,157.0
Frankston City 1,089.7
Mornington Peninsula Shire 2,267.1
Total 7,436.2
Extreme temperatures have also been associated with adverse effects on rail infrastructure, such as shifting and/or buckling of tracks (Table 6.54). For example, an analysis of rail incidents from the United States found that irregularities in track alignments were a common cause of rail accidents (Rossetti, 2002). This problem can also cause extensive service disruptions, as happened on 11 January 2008 when extensive delays and cancellations were experienced on the Melbourne metropolitan rail network (including many on the Frankston and Pakenham lines) as result of buckling of tracks and failure of air-conditioning systems. Another indirect effect of rising temperatures on transport and other infrastructure may be their effects on the timing of maintenance and construction activities. Extreme heat days may constrain the timing of outdoor maintenance activities due to concerns over occupational health and safety (Mills and Andrey, 2002).

Impacts of Climate Change in the Western Port Region
Final Report Page 135
6.4. Summary of Potential Implications of Exposure to Extreme Temperatures in the Western Port Region
Sector/LGA Summary of Potential Extreme Temperature Exposure and Impacts Locations
Bass Coast Cardinia
Casey Frankston
MPS*
• All LGAs within the Western Port region are exposed to temperature extremes. However, those areas further inland where the moderating effects of the ocean and sea breezes are diminished may be more vulnerable.
Populations Bass Coast • Most sensitive populations occur on the north coast of Phillip Island, which has one of the highest density of individuals over the age of 65 in
the LGA.
Cardinia • Townships in the LGA’s north, such as Emerald, Cockatoo and Gembrook may be at greater risk due to a relatively higher density of elderly individuals and these areas are somewhat removed from the coast.
Casey • Townships such as Cranbourne and other residential centres further north tend to have a relatively larger proportion of elderly individuals than other parts of the LGA.
Frankston • The coastal frontage in the LGA’s southwest along Port Phillip Bay has a relatively dense population of elderly individuals.
MPS • The entirety of the Port Phillip Bay coastline, particularly Sorrento and Portsea, has some of the greatest density of elderly communities in the Western Port region, although proximity to the bay will help moderate extreme temperatures.
Property Bass Coast
Cardinia Casey
Frankston MPS
• Direct effects of temperature extremes are likely to be negligible, although some indirect effects to property may occur through impacts on infrastructure, public health, and amenity (see below).
Infrastructure Bass Coast
Cardinia Casey
Frankston MPS
• Evidence suggests more frequent extreme temperatures will accelerate the degradation of certain building materials and roads, and may increase the risk of accidents and failures in rail networks. Increased temperatures are also likely to increase cooling demand and reduce heating demand, which would affect energy costs, depending upon pricing schemes. Such impacts may be less severe in newer construction, assuming greater thermal efficiency in such structures, but such new construction comprises a small proportion of the region’s building stocks.

Impacts of Climate Change in the Western Port Region
Final Report Page 136
Business Activity
Bass Coast Cardinia
Casey Frankston
MPS
• Temperatures may affect business by reducing operational time windows or increasing work interruptions. Certain businesses, particularly those based outdoors or on recreation, may experience a reduction in visitors during particularly hot days. On the other hand, warmer winter temperatures may increase recreation utilisation creating more business opportunity.
Amenity Bass Coast
Cardinia Casey
Frankston MPS
• As with business activity, higher summer time temperatures may reduce utilisation of outdoor recreational opportunities for the public and elevate concerns about health and enjoyment. Yet warmer temperatures may also extent warm-weather seasons, enabling individuals to take advantage of outdoor amenities for a greater fraction of the year. The long-term ecological implications of rising temperatures may also have consequences, influencing the public’s perceptions of the environment, or even adversely affecting species valued for fishing or popular among bushwalkers.
*MPS - Mornington Peninsula Shire

Impacts of Climate Change in the Western Port Region
Final Report Page 137
7. IMPACTS ASSOCIATED WITH CHANGES TO AVERAGE RAINFALL
Chapter Summary
• Average rainfall in the Western Port region is projected to decline by up to 8% in 2030 and 23% by 2070, with reductions potentially coming in all seasons but especially in winter and spring.
• Drought frequency and intensity are projected to increase.
• Streamflows in the Bunyip River and South Gippsland basins and in Melbourne Water’s catchments, from where most of the region’s water is sourced, are projected to decline significantly.
• This has significant potential implications for the water supply / demand balance in the region, although the nature and level of economic and social impacts to the region’s water security are likely to depend greatly on government policy response. It is likely though that water users in the region will face significantly higher water prices in the future.
• Reduced average rainfall and reduced streamflow will also adversely impact on amenity, recreational and ecological values in the region.
7.1. Rainfall in Western Port: The Issues
7.1.1. Regional average rainfall and drought projections
The Western Port region is one of moderate rainfall, with average annual rainfall across regional monitoring stations of 759 mm, with median rainfall at an almost identical 758 mm per annum.
Historic annual rainfall is relatively reliable from year-to-year with the data record showing comparatively little variation (Table 7.56). Rainfall is highest in winter and spring.
In a recent assessment of the general biophysical impacts of climate change in the Western Port region undertaken as part of this study (Macadam et al., 2008), temperature and rainfall projections were detailed for 2030 and 2070 for the region based on different emission scenarios and global climate models. Although there is a range of uncertainty around the rainfall projections (Table 7.57) the general trend is toward a reduction in average annual rainfall. The trend is particularly evident for winter and spring rainfall.
These trends are based on averages and do not take account of variability and therefore do not reflect changes to the frequency and severity of extreme wet or extreme dry years. However, as reported in Macadam et al. (2008), taking into account both temperature and rainfall, current research indicates the potential for an increase in the frequency of droughts by 2030 and an increase in the frequency and severity of droughts by 2070 in the region.

Impacts of Climate Change in the Western Port Region
Final Report Page 138
Table 7.56: Mean annual rainfall in the Western Port region
BoM Site: Data from: Mean rainfall
Tooradin 1947-74 854.8
Cranbourne 1990- 811.7
Cowes 1882-78 764.0
Rhyll 1990- 676.8
Stony Point 1972-83 760.6
Cerberus 1986- 731.0
Cape Schanck 1879-1997 751.5
Philip I. Penguin Reserve 1981- 749.3
Mornington 1868- 734.8
Average for all sites: 759.4 Source: Bureau of Meteorology
Table 7.57: Projections of climate change impacts on temperature and rainfall in the Western Port region
2030 2070 Season
Low High Low High
CHANGES IN AVERAGE DAILY TEMPERATURES (°C)
Annual 0.5 1.1 0.9 3.5
Summer 0.5 1.3 0.9 4.2
Autumn 0.5 1.1 0.8 3.6
Winter 0.4 0.9 0.7 3.0
Spring 0.5 1.1 0.8 3.7
CHANGES IN AVERAGE RAINFALL TOTALS (%)
Annual -8 0 -23 0
Summer -11 +6 -30 +18
Autumn -7 +4 -22 +14
Winter -8 +1 -24 +4
Spring -14 0 -38 0 Source: Macadam et al. (2008)

Impacts of Climate Change in the Western Port Region
Final Report Page 139
7.1.2. Relationships between rainfall and runoff
The relationship between rainfall and surface runoff is not linear, and may be influenced by a complex set of drivers and interactions.
Variables such as soil moisture, plant evapo-transpiration rates, temperature and relative humidity play a significant role, as does catchment land use such as vegetation composition and the numbers of farm dams. As has been most apparent in recent years, the seasonal distribution of rainfall is particularly important to runoff, as rainfall in drier periods and/or warmer months is likely to result in disproportionately less surface runoff than rainfall in wetter periods and/or colder months (Preston and Jones, 2008).
A preliminary investigation into the possible consequences of climate change for Victorian water resources was undertaken by Jones and Durack in 2005. The Western Port region lies within the Bunyip River and South Gippsland Basins (Figure 7.42). Based on the modelling by Jones and Durack (2005), both basins show a tendency for significantly decreased streamflow. For the Bunyip River basin the projections are -5 to -30% by 2030 and -5 to >-50% by 2070. However, this basin imports 140,000 ml per year from the Thomson and Yarra river basins, where streamflow is also likely to decrease (0 to -25% by 2030 and -5 to >-50% in the Thomson, and 0 to -20% and -5 to >-50% respectively in the Yarra). In the South Gippsland Basin, the projected streamflow ranges are -5 to -25% by 2030 and -5 to >-50% by 2050.
Figure 7.42: The Bunyip River and South Gippsland basins
Bunyip River Basin
South Gippsland Basin
Source: NLRWA unpublished
It is useful to consider these projections in context of the recent extended drought in Victoria. A sample of seven river systems across Victoria, undertaken by DSE (2007), showed that average annual flows over the ten year period from 1997 to 2006 were between 37 % and 83 % below the long-term average flows for these rivers (DSE, 2007). Collectively, these short-term flow reductions are more than CSIRO’s worst projected long-term flow reductions for 2030 under climate change (Jones and Durack, 2005), but are generally less than projections for 2070 (Table 7.58).
Given the historic significance of winter and spring rainfall to water resource availability in the wider potable water supply catchments for the Western Port region, it may be

Impacts of Climate Change in the Western Port Region
Final Report Page 140
reasonable to assume that the rainfall projections in Table 7.57 will be associated with a decline in the availability of surface water resources, probably of a much greater magnitude. Similar presumptions may also be made in terms of reduced groundwater recharge (and hence declining aquifer yields).
Table 7.58: Actual and projected flow reductions in selected Victorian catchments
River System
Actual Flow Observed Flow
Reduction (1997–2006)
Max. Projected Flow Reduction
(2030)
Max. Projected Flow Reduction
(2070)
Goulburn 38% 35% >50%
Loddon 67% 35% >50%
Wimmera-Avon 83% 40% >50%
Mitchell 40% 25% >50%
Melbourne’s storages 37% 20% (Yarra) 25% (Thom-McA)
>50% (Yarra) >50% (Thom-
McA)
Werribee 63% 30% >50%
Moorabool 83% 35% >50% Sources: Jones and Durack (2005); DSE (2007).
7.1.3. Trends in potable water supply and demand
Most of the Western Port region sources its potable water from the Melbourne metropolitan system, via South East Water Limited. Westernport Water Corporation also supplies potable water to part of Bass Coast Shire.
Estimated 2006 water consumption, comprising all metered use plus unaccounted for (unmetered) water, in the Western Port region is outlined in Table 7.59. Significantly, Western Port regional per capita consumption (98.2 Kl per annum) appears to be lower than the 2006 average for greater Melbourne (120.9 Kl per annum).
Table 7.59: Western Port region estimated 2006 potable water consumption
Western Port Regional
Population (2006)
2006/07 Estimated Potable Water
Consumption (GL)47
Estimated Per Capita Consumption
(Kl /per annum)
552,906 54.31 98.2
*includes commercial and industrial use and (estimates of unaccounted for water/losses.
47 Derived from (i) SEWL data supplied for municipalities of Casey, Cardinia, Frankston & Mornington shire, plus a 12.7% unmetered factor, (ii) data supplied by Westernport Water, and (iii) Water Services Association of Australia

Impacts of Climate Change in the Western Port Region
Final Report Page 141
Demographic and built environment considerations are likely to be major factors influencing this situation. Per capita water consumption tends to be lower in large households than in small households and, on average, households are slightly larger in the Western Port region than in greater Melbourne. Water consumption is also linked to income, garden size and type and to local character (Troy, Holloway & Randolph, 2005). In other words, higher-income households with large gardens, in more established ‘leafy’ suburbs, tend to use more water. Arguably, these households are less well represented in the Western Port region.
Population in the Western Port region is projected to grow substantially (44%) between now and 2031 (see Figure 2.8), comprising increases in permanent residents in greenfield and infill urban development. Also associated with this growth will be an increase in the number of commercial, industrial and other non-residential water users. This growth can be expected to be broadly consistent with future per capita water consumption patterns that apply across the rest of metropolitan Melbourne.
An additional consideration is that, after construction of the proposed 150 Gl desalination plant at Wonthaggi, Westernport Water is likely to be able to connect to the greater Melbourne water supply network. South Gippsland Water may also have cause to make use of this option.
A number of supply and demand scenarios for Greater Melbourne are possible:
On the one hand, planning for a 235 gigalitre augmentation of potable water supplies is well underway, brought forward in response to a 37 % reduction to Melbourne’s catchment water yield48.
On the other hand, possible continuation of a drying trend caused by climate change, combined with other factors such as population growth and environmental watering obligations, may erode these water supply gains.
Given this, greater Melbourne including the Western Port region, is likely to continue to face challenges in the future in relation to its potable water supply and demand balance.
7.2. Exposure of Human Settlements to Rainfall- Related Impacts Existing literature on climate change and reductions in average rainfall and increased frequency and/or severity of drought suggest that the impacts most relevant to the region’s settlements are:
reduced water supply to the region; and
reduced runoff and soil moisture which in turn will impact on amenity and recreational values49.
To the extent that changes in average rainfall affect water supply and demand, exposure to these changes is likely to be fairly uniform across the region.
48 Wonthaggi desalination plant, Tarago reconnection, and Sugarloaf pipeline. 49 Reduced runoff and soil moisture also have the potential to significantly impact on the region’s agriculture. Impacts of climate change on agriculture were not assessed as part of this study but are discussed in an earlier scoping study of climate change impacts in the Western Port region (Brooke and Kinrade, 2006).

Impacts of Climate Change in the Western Port Region
Final Report Page 142
One exception is households and businesses in the region, principally in rural areas, that are not connected to reticulated water supplies. In the face of reduced average rainfall in the region, these water users may be confronted with additional challenges in terms of potable water availability and quality. Regional data on the numbers and locations of households and businesses not connected to reticulated systems is not currently available though.
7.3. Social and Economic Impacts
7.3.1. Potable water supply
The potential for reduced potable water supply stemming from climate change, combined with increased water demand due to population growth and other trends, has significant social and economic implications for the Western Port region.
The nature and extent of any impacts on the region though will largely depend on the policies and measures implemented by the state government and the water industry. In that respect, the water supply and demand issue is qualitatively different to many of the other issues discussed in this report. There are a number of potential approaches to dealing with the potential water reliability problem. They include:
additional water supply augmentations (traditional or non-traditional) paid for by water users;
continuing reliance on water restrictions;
water efficiency regulations and associated measures; and
a market-based approach to water scarcity, such as an intra-urban water market.
A detailed discussion of these approaches is beyond the scope of the study. It is important to note however, that the different approaches are not mutually exclusive and it is probable that future responses will comprise a combination of approaches. What this means for water users in the Western Port region is uncertain, since different approaches will have different impacts. Regardless of approaches adopted however, it is likely that Western Port communities will face water price increases in the future, possibly substantial50. The main difference in outcomes of different approaches relates to who bears the burden of the price increases and by how much.
Specific characteristics of the Western Port region will also influence the impacts of state government and water industry responses to changes in the water supply-demand balance. These characteristics include:
Population growth. As previously discussed, the region’s population is projected to grow by 44% by 2031 compared to 17.8% for the remainder of greater Melbourne. This population growth and associated new housing developments presents both
50 The Victorian Government has forecast for example that, given the combination of water shortages and the cost of planned water augmentation, water prices in the Melbourne region will double by 2012 (Office of the Premier, 2007). These could be expected to rise substantially more, if further augmentations are required due to continued growth in demand and/or climate change.

Impacts of Climate Change in the Western Port Region
Final Report Page 143
challenges and significant opportunities in relation to the implementation of water efficiency measures and non-traditional water supply augmentations, such as water recycling and grey water re-use. Challenges include the cost implications for new homes of regulatory and other water savings measures. Opportunities include the potential for new housing developments to showcase water efficient design and to reduce dependence on mains water.
Potential for local supply augmentations. In addition to measures associated with new housing developments, local water supply augmentations can reduce dependence on mains water and the impacts of water restrictions. This is already evident in the Western Port region where most local councils are planning for, or are in the process of implementing, local supply augmentations including water reuse schemes and rainwater tanks. These schemes will significantly increase councils’ ability to water sporting fields, public parks and gardens in times of restrictions (see following section).
7.3.2. Environmental and amenity impacts associated with changes to average rainfall
A drying trend across the Western Port catchment is likely to have a number of biophysical manifestations.
These include:
Reduced surface runoff and groundwater-derived base flows, and an increased likelihood of low flows, affecting
waterway flows and the ecological health of waterways and estuaries; and
wetland health.
Reduced average soil moisture levels, either in some seasons (e.g. summer) or throughout the year. This will impact on some infrastructure.
Reduced groundwater recharge and aquifer levels, potentially impacting on groundwater-dependent ecosystems such as waterways, terrestrial vegetation communities, and coastal ecosystems such as saltmarshes, mangroves and seagrass beds (Kammermans et al. 2002).
Some of these impacts may further compound the effects of other degrading processes (such as habitat fragmentation), and be both severe and irreversible. Whilst the impact of reduced groundwater flows on mangroves and seagrass beds has not been studied for the Western Port region, it is known to be a factor in seagrass decline internationally.
For human settlements in the Western Port region, these impacts have implications for environmental, social and economic values in the region. In terms of the issues and values that are impacted, these are discussed briefly as follows:
Waterway and wetland health: Waterways and wetlands provide a range of values and services to urban and township communities, including amenity values (such as property values) and recreational values (e.g. linear waterway parks and reserves; birdwatching). As such, waterways and wetlands also support a range of use and non-use economic values. These values have not been quantified as part of this study.

Impacts of Climate Change in the Western Port Region
Final Report Page 144
Coastal and estuarine health: The relationship between the volume of surface water and groundwater flows to the coastal and marine environment is not well understood in the study region. To the extent that there may be a relationship, values that may be impacted include:
- recreational (and commercial) fishing stocks and fish recruitment capacity;
- non-use values associated with the health, diversity and robustness of coastal ecosystems in the region.
Domestic gardens, municipal gardens and sporting fields: Domestic and municipal gardens and parks can be expected to support considerable (albeit variable) social and amenity values in settlements across the Western Port region. All other things being equal, reduced rainfall will increase the need for supplementary irrigation. The extent to which catchment drying impacts on domestic gardens will, by and large, be related to the future likelihood of water restrictions applying to their irrigation, as discussed in section 7.3.1.
Streetscapes: Streetscapes, including nature strips, street trees and other features, are likely to be more vulnerable to the effects of catchment drying than domestic and municipal gardens and parks. This is because streetscapes are generally dependent on rainfall rather than irrigation.
Infrastructure exposed to drying soils: The foundations of residential and commercial buildings, roads and transmission lines and subterranean infrastructure such as water, sewerage and gas pipes may be vulnerable to increased degradation or even structural failure due to a long term decrease in soil moisture or increased variations in wet / dry spells. Further infrastructure and soil mapping and analysis are required however, to identify the region’s infrastructure most exposed.
Bushfire risk: Elevated bushfire risks are discussed in Chapter 5.

Impacts of Climate Change in the Western Port Region
Final Report Page 145
7.4. Summary of Potential Impacts of Exposure to Average Rainfall Changes in the Western Port Region
Sector/LGA Summary of Potential Average Rainfall Exposure and Impacts Locations
Bass Coast Cardinia
Casey Frankston
MPS*
• As much of the region’s water supply is centrally managed, both supply excesses and deficiencies are likely to have similar implications throughout the Western Port region. Users who are not connected to reticulated supplies may be more vulnerable to water supply security. However, users who utilise groundwater may be buffered against impacts on the metropolitan supply network, provided aquifer resources are managed sustainably.
Populations Bass Coast
Cardinia Casey
Frankston MPS
• As above, although residents in areas not connected to reticulated supplies have the potential to be most affected by security of supply issues. Impacts in terms of water prices could vary between different water user groups, e.g. residents living in new residential areas compared with residents living in established areas.
Property Bass Coast
Cardinia Casey
Frankston MPS
• Increased water prices and/or restrictions may curtail water use at the property level or create incentives for investments in water conservation and reuse (e.g., on-site retention or greywater use).
Infrastructure Bass Coast
Cardinia Casey
Frankston MPS
• Maintenance of public parks, gardens and recreational facilities may be adversely affected by increased water prices or restrictions. • Some infrastructure may be adversely affected by exposure to more frequent or severe dry conditions reducing soil moisture.
Business Activity Bass Coast
Cardinia Casey
Frankston MPS
• Water dependent businesses in the region including nurseries, turf farms, swimming pool suppliers and landscape gardeners will be adversely affected by an increase in the price of water and/or restrictions.

Impacts of Climate Change in the Western Port Region
Final Report Page 146
Amenity
Bass Coast Cardinia
Casey Frankston
MPS
• Access to public parks and recreational facilities may be adversely affected by increased water prices and/or restrictions. • General drying could adversely affect streetscapes.
*MPS - Mornington Peninsula Shire

Impacts of Climate Change in the Western Port Region
Final Report Page 147
8. REVIEW OF IMPACTS AND EXAMINATION OF CROSS SECTORAL ISSUES
8.1. Review of potential impacts As indicated by the preceding chapters, settlements in the Western Port region face significant exposure to natural hazards associated with current climate variability and future climate change.
Furthermore, such exposures may have cascading impacts that extend well beyond simply the inundation or burning of land, having the potential to affect human life and health, public infrastructure and services, economic activity and commerce, and public amenity.
Some impacts of climate change, such as impacts of changes to average rainfall on potable water availability and impacts associated with extreme temperatures, are likely to be felt more or less throughout the Western Port region. Other impacts though, will vary significantly depending upon the spatial distribution of hazards and human assets, populations and infrastructure. In other words, some types of natural hazard are geographically specific and location therefore is a key determinant of the potential for climate change to impact on people and infrastructure. Coastal inundation, extreme rainfall and bushfires are three such hazards.
8.1.1. Exposure to coastal inundation, flooding and bushfires
There are numerous potential methods for comparing exposure to climate change. Figure 8.43 is one such method. It provides a summary of land areas, property, people, dwellings and roads exposed to the three spatially related hazards: storm surge inundation (1 in a 100 year ARI in 2070); flooding associated with extreme rainfall; or bushfires. The area within each colour-coded region represents a relative indication of the aggregate exposure across different asset categories.
The information in Figure 8.43 indicates that:
land areas, numbers of people and extent and value of assets exposed to inland flooding and bushfires are greater than to coastal inundation;
land areas, numbers of people and extent and value of assets exposed to coastal inundation are greatest in Mornington Peninsula Shire, Bass Coast Shire and the City of Casey, in that order;
land areas, numbers of people and extent and value of assets exposed to inland flooding are greatest in Cardinia Shire, City of Casey and Frankston City; and
land areas, numbers of people and extent and value of assets exposed to bushfires are greatest in Cardinia Shire and Mornington Peninsula Shire.
While the above generalisations hold at the LGA level, even within a single LGA, there is a significant degree of variability with respect to exposure to the three hazards. Some of the key locations identified in the Western Port region that represent exposure hotpots include the following:

Impacts of Climate Change in the Western Port Region
Final Report Page 148
Figure 8.43: Summary of populations and infrastructure in Western Port LGAs exposed to coastal inundation, flooding and bushfires
Each plot represents the estimated exposure of land areas, property, people, dwellings, roads and drainage pipes to either storm surge inundation (1 in a100 year ARI in 2070), inundation/flood hazard or bushfire hazard. The area within each colour-coded region represents a relative indication of the aggregate exposure across different asset categories. The same quantitative scale is used for each figure, allowing comparisons across different impacts or LGAs. Note the logarithmic scale – as one moves from the centre of the figure, each successive ring represents a 10-fold increase in exposure.

Impacts of Climate Change in the Western Port Region
Final Report Page 149
Storm Surge Inundation – Phillip Island townships in Bass Coast, coastal townships in Casey, and Hastings in Mornington Peninsula Shire. However, beaches, foreshore areas and reserves and coastal wetland areas throughout the region are likely to be affected by sea-level rise and storm surge events.
Extreme Rainfall Inundation/Flooding – Bass River flood plain, northeast and southern Cardinia (Koo-Wee-Rup swamp), southeast Casey, northwest Frankston and the Frankston Central Activity District (CAD), and the Western Port Bay coastline of Mornington Peninsula (e.g., Hastings and Shoreham).
Bushfire – North and southeast Bass Coast, northern Cardinia including the townships of Emerald, Cockatoo and Gembrook; central and southeast Frankston; bushland areas in Mornington Peninsula, particularly around the townships of Dromana and Mornington as well as around HMAS Cerberus.
8.1.2. Climate change exposure, impacts and risk
Although Figure 8..43 provides useful overview of the extent of land, people and assets exposed to the impacts of climate-related hazards, great caution needs to be exercised in interpreting and using this information.
Exposure estimates are a good starting point, but they do not provide a complete picture of the potential for impacts associated with future climate change – impacts associated with changes to average rainfall and to temperature, for example, are not accounted for in the exposure estimates. Nor do exposure estimates provide a complete understanding of the relative importance of different types of impacts – physical exposure is only one of a number of variables that can be used to assess the significance of climate change impacts. Changes to the frequency and severity of hazards must be taken into account, as must changes to associated physical processes. Then there is the question of how these changes will flow through to impacts on economy and society.
In the case of coastal inundation, for example, although the extent of land exposed to inundation in the region is substantially less than the extent of land exposed to flooding or bushfire, consideration of the potential future impacts from coastal inundation must also take into account:
projected changes in the frequency of storm surge events51;
coastal erosive processes that may greatly exacerbate future damage to, or potentially, complete loss of beaches and foreshore areas; and
the full range of potential consequences of impacts – not just loss of value of property and assets directly exposed to inundation, but also the indirect and intangible consequences of inundation, such as impacts on amenity values and on local tourism.
Similarly, consideration needs to be given to the significance of infrastructure that is exposed to the impacts. For example, certain infrastructure within the Western Port region is critical on both a local and regional basis. Examples include:
51 As noted previously, areas currently exposed to a 1 in 100 year storm surge will, under a worst case scenario, be subject to a 1 in 1 to 1 in 4 year storm surge by 2070.

Impacts of Climate Change in the Western Port Region
Final Report Page 150
key transport corridors such as the Nepean, South Gippsland, and Bass Highways, as well as heavily travelled rail lines;
electricity transmission lines from the Latrobe Valley that traverse the Western Port region and provide electricity to Melbourne and Gippsland;
industrial facilities in the vicinity of Hastings; and
emergency management facilities, medical centres and communications infrastructure as well as local government buildings, schools and nursing homes.
In some cases this infrastructure is exposed to more than one climate-related hazard, a factor that should be considered when assessing potential impacts.
In conclusion, meaningful determination of the relative importance of potential impacts of climate change in the Western Port region are best made in the context of an assessment by decision makers of all of the factors that can bear on the likelihood of climate change impacts occurring and the consequences of those impacts should they occur. Exposure is just one of those factors, albeit an important one. Other factors however, such as community attitudes towards the impacts, the degree to which the impacts result in permanent damage or loss and capacity to manage the impacts, all need to be considered. Risk assessment, established through the Australian Standard AS 4360, provides a framework for assessing all such factors (Broadleaf and MJA, 2006)52.
8.2. Vulnerable groups Climate change literature points to a range of social characteristics that can make people vulnerable to natural hazards such as those associated with climate change.
Based on those characteristics, a number of groups emerge as being especially vulnerable to the impacts of climate change (see for example Dwyer et al., 2004). These are:
low income earners;
the elderly;
infants; and
people with existing health conditions (including physical and mental health conditions).
The vulnerability of these groups to climate change could stem from three factors:
their high level of exposure to particular climate impacts relative to the rest of the community;
their sensitivity to those impacts; and/or
their limited capacity to prepare for and respond to the impacts if and when they do occur (generally referred to in the climate change literature as ‘adaptive capacity’).
52 A climate change risk assessment has been undertaken by each of the local councils in the Western Port region as a part of the Western Port Integrated Assessment project. An overview of the process undertaken and a summary of risks identified are contained in the project report on ‘Climate Change Risks and Adaptation’.
Impacts of Climate Change in the Western Port Region
Final Report Page 151
The vulnerability of low income earners and the elderly to climate change in the Western Port region is examined in this section considering these three factors.
8.2.1. Exposure of vulnerable groups
A potentially important question in the consideration of populations that are vulnerable to climate change is whether low income earners or the elderly are over-represented amongst the households exposed to coastal inundation, flooding or bushfires.
Physical exposure of households and infrastructure to particular climate impacts has already been closely examined in preceding chapters, notably in chapters 3 to 5, covering coastal inundation, inland flooding and bushfires. Studies have examined this question, particularly with respect to low income household exposure to flooding (Chen et al., 2005; BTRE, 2001). The results of those studies have been inconclusive, with some flood-prone urban areas examined around Australia supporting the hypothesis that people living in flood prone areas tend to have low income, and other areas not supporting the hypothesis.
This suggests the need for close examination of exposed localities in the Western Port region to determine the social characteristics of those who are exposed. To that end, some preliminary assessment of the income and age characteristics of populations exposed to coastal inundation in the Western Port region has been undertaken drawing on ABS 2006 census data at the census collection district level.
Exposure of low income people
With respect to income, results are variable. In areas exposed to coastal inundation median household incomes are relatively low. Indeed, in all municipalities with the exception of Bass Coast (where median incomes are low anyway), the median household income of areas exposed to coastal inundation is lower than median income of households in the municipality as a whole. Median household incomes of areas exposed to coastal inundation (for a 2070 1 in 100 year ARI scenario) are as follows:
Bass Coast – $680/week ($636 across municipality)
Cardinia – $959/week ($1078 across municipality)
Casey – $961/week ($1097 across municipality)
Frankston – $625/week ($956 across municipality)
Mornington Peninsula – $827/week ($914 across municipality).
Exposed households with median household incomes <$60053 per week are located in a number of localities in Mornington Peninsula Shire, including around Dromana, Rosebud, Rye and Hastings and in the Bass Coast Shire in the Wonthaggi district, Grantville, and around Cowes on Phillip Island (Figure 8.44).
53 Note, the poverty line is conventionally set at 50% of median household disposable income but more rigorous analyses take account of differences in household size and composition. ABS income data used in this report is based on pre-tax rather than disposable income and therefore direct comparisons are not possible. However, it is likely that most households with a pre-tax income of $400 or less are below the poverty line and that many of those with incomes of $400–600 are below the poverty line also.

Impacts of Climate Change in the Western Port Region
Final Report Page 152
Figure 8.44: Median income of households in census districts that are exposed to storm surge in the Western Port region
On the other hand, low income households do not appear to be over represented in areas exposed to flooding. In all municipalities, with the exception of Frankston, median household incomes in areas exposed to flooding are comparable to or higher than median incomes for the municipality as a whole:
Bass Coast – $879/week ($636 across municipality)
Cardinia – $1,121/week ($1078 across municipality)
Casey – $1,117/week ($1097 across municipality)
Frankston – $797/week ($956 across municipality)
Mornington Peninsula – $1,049/week ($914 across municipality).
However, there are exceptions, including Hastings in Mornington Peninsula Shire, the area around Wonthaggi in Bass Coast Shire, and parts of Seaford in Frankston City (Figure 8.45).
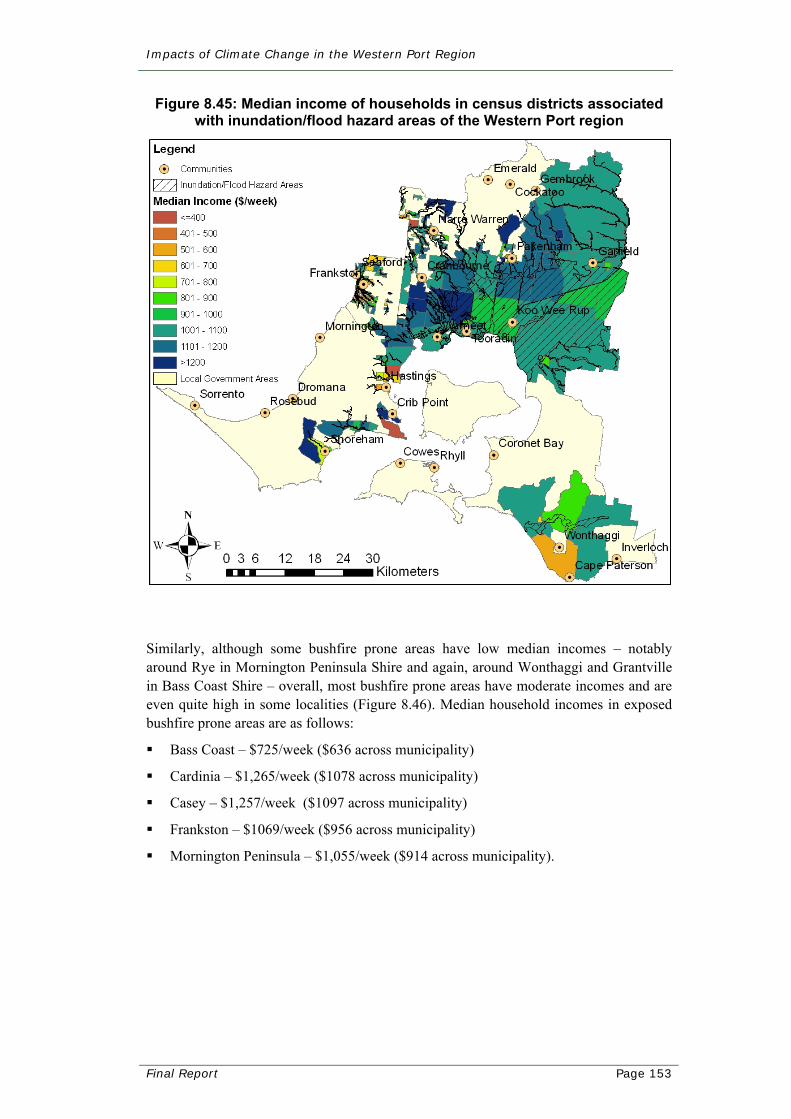
Impacts of Climate Change in the Western Port Region
Final Report Page 153
Figure 8.45: Median income of households in census districts associated with inundation/flood hazard areas of the Western Port region
Similarly, although some bushfire prone areas have low median incomes – notably around Rye in Mornington Peninsula Shire and again, around Wonthaggi and Grantville in Bass Coast Shire – overall, most bushfire prone areas have moderate incomes and are even quite high in some localities (Figure 8.46). Median household incomes in exposed bushfire prone areas are as follows:
Bass Coast – $725/week ($636 across municipality)
Cardinia – $1,265/week ($1078 across municipality)
Casey – $1,257/week ($1097 across municipality)
Frankston – $1069/week ($956 across municipality)
Mornington Peninsula – $1,055/week ($914 across municipality).

Impacts of Climate Change in the Western Port Region
Final Report Page 154
Figure 8.46: Median income of households within census collections districts that overlap bushfire prone areas in the Western Port region
Exposure of elderly people
With respect to representation of elderly people in coastal inundation, flood and bushfire exposed populations, results are somewhat clearer. In Bass Coast, Frankston and Mornington Peninsula, elderly people (≥ 65 years of age) are generally over represented in the populations exposed to the various climate related hazards, as compared with the percentage of elderly in Victoria’s population as whole (Table 6.52). The representation of elderly people in populations exposed to natural hazards is particularly high in storm surge exposed areas (notably in Frankston, Bass Coast and Mornington Peninsula) and is also quite high in a number of the areas exposed to the other hazards (Table 8.60).
Although the future age structure of exposed populations cannot be known for certain, the current trend of population ageing - in Victoria and the region – indicates that, in the future, elderly people will continue to constitute a significant proportion of the region’s population exposed to climate related natural hazards.

Impacts of Climate Change in the Western Port Region
Final Report Page 155
Table 8.60: Average percentage of population ≥ 65 years of age in Western Port CCDs exposed to various natural hazards
LGA Storm Surge
Inundation (%)
Extreme Rainfall Inundation/
Flooding (%)
Bushfire (%)
Proportion of people ≥ 65 across area
(%)
Bass Coast 24 16 20 23
Cardinia 12 11 9 10
Casey 10 7 13 8
Frankston 43 15 13 13
Mornington Peninsula
22 11 17 20
Victoria N/A N/A N/A 14
N/A indicates state-level data were not available
Source: ABS 2006 Census
8.2.2. Sensitivity of vulnerable groups
It has already been noted that the elderly are especially sensitive to temperature extremes.
This factor alone means that particular attention may need to be paid to those groups in formulating responses to temperature extremes in the region, especially in those parts of the region that have high proportions of elderly residents, such as in Bass Coast and Mornington Peninsula Shires.
8.2.3. Factors influencing adaptive capacity
Considerable attention is paid in the literature to vulnerability of low income earners and the elderly.
Primarily, the focus on these groups stems from the potential for them to have limited adaptive capacity (Dwyer et al., 2004; IPCC 2007c), which can cut across virtually all impacts associated with climate change. Limited adaptive capacity can stem from:
lack of resources;
physical or mental incapacity;
lack of mobility;
social or physical isolation;
poor housing relative to the rest of the population (weather proofing, thermal comfort);
lack of access to timely and relevant information; and/or
inadequate insurance coverage (home and contents, health, personal).

Impacts of Climate Change in the Western Port Region
Final Report Page 156
One example, relating to lack of resources and poor housing, is the impact on the elderly and low income earners of an increase in the number of very hot days and spells. As discussed in Chapter 6, substandard housing tends to have poor thermal performance. Furthermore, low income people are less likely to be able to afford to install and use cooling systems to improve their thermal comfort. Clearly, these adverse impacts are compounded if exposed groups are elderly and on low incomes.
Another example, relating to information access, physical capacity and mobility, is preparedness and response to natural hazards. Existing literature points to a clear link between the extent of economic and social impacts of natural hazards, such as floods and bushfires, and the level of preparation that people have undertaken and the amount of prior warning they receive – the more warning, the better the preparation and the more community experience with disasters, the lower the ratio of actual to potential damage to property and (BTRE, 2001; Reed, Sturgess & Associates, 2000). Conversely, lack of access or utilisation of information (e.g. the internet, information sessions) or physical incapacity and poor mobility, can reduce people’s awareness of and ability to prepare for hazards.
Given that there are significant groups of low income people and elderly exposed to the impacts of climate change (especially in Bass Coast, Frankston and Mornington Peninsula) the particular vulnerability of these groups, in terms of adaptive capacity, will have to be carefully considered when assessing the risks of climate change in the region and developing adaptation responses.
8.3. Planning and policy considerations All levels of government have important roles in the community’s response to climate change in the Western Port region. These roles are outlined in Box 8.13. Key planning and policy issues relevant to government response are discussed in the following sections.
8.3.1. Land use planning
Extensive areas of the Western Port region exposed to the impacts of climate change have low population densities and are largely undeveloped in the sense that they do not contain a great deal of infrastructure (public or private). In Bass Coast Shire for example, approximately 85% of land exposed to storm surges, 90% of land exposed to floods and 95% of land exposed to bushfires is currently zoned rural or conservation (see Figures 8.5 to 8.7). Comparative figures in the Shire of Cardinia are approximately 70%, 35% (85% including Green Wedge) and 90% respectively.

Impacts of Climate Change in the Western Port Region
Final Report Page 157
Box 8.13: Role of governments and agencies
Climate change in the Western Port region will present significant challenges to a wide range of agencies involved in the provision of urban infrastructure and services and in planning for population growth and future development in the region. As discussed in the Victorian Climate Change Summit Discussion Paper A Climate of Opportunity (Victorian Government, 2008), if climate change is to be effectively addressed, all levels of government will need to establish shared goals and a clear division of responsibility. This truism applies as much to the issue in the Western Port region, as it is does to elsewhere in Australia. All three levels of government have responsibilities relevant to addressing the impacts of climate change in the Western Port region. The Summit Discussion Paper proposes a range of roles and responsibilities, some of which are relevant in relation to the Western port region:
Commonwealth
Ensuring consistency (but not uniformity) between responses implemented in the Western Port region and elsewhere in Australia.
Funding and other support for state and regional adaptation responses.
State
Ensuring land-use and coastal planning and management, infrastructure and service planning and emergency response and recovery arrangements factor in regional climate change projections and potential impacts.
Supporting regional and local adaptation responses and community groups.
Virtually all state government departments and agencies will have some role in these respects.
Local
Understanding the local implications of climate changes.
Implementing statutory planning decisions.
Informing and engaging local communities on the impacts of climate change.
Ensuring local infrastructure and service provision factors in climate change.
In addition to the three levels of government, energy and water utilities and other agencies, such as port authorities, have important roles in planning for and responding to the impacts of climate change in the region.
Because many of the functions of these agencies are linked and because climate change will affect a wide range of areas, a coordinated approach to adaptive planning will be crucial to ensure adaptation measures in one area do not have negative impacts upon another and to ensure an efficient response in the context of agency resource constraints.

Impacts of Climate Change in the Western Port Region
Final Report Page 158
Figure 8.47: Percentage of zoned land types (by area) associated with storm surge inundation in Western Port LGAs in 2070
0%
10%
20%
30%
40%
50%
60%
70%
80%
90%
100%
Bass Coast Cardinia Casey Frankston Mornington
Perc
enta
ge o
f Pla
nnin
g Zo
nes
(by
area
) BUSINESS COMMONWEALTHCONSERVATION AND RESOURCE USE DEVELOPMENT ZONEFARMING GREEN WEDGEINDUSTRIAL PUBLIC USERESIDENTIAL ROADRURAL SPECIAL USETOWNSHIP
Figure 8.48: Percentage of zoned land types (by area) associated with inundation/flood hazard areas in Western Port LGAs
0%
10%
20%
30%
40%
50%
60%
70%
80%
Bass Coast Cardinia Casey Frankston Mornington
Perc
enta
ge o
f Pla
nnin
g Zo
nes
(by
area
) BUSINESS COMMONWEALTHCONSERVATION AND RESOURCE USE DEVELOPMENT ZONEFARMING FLOODWAYGREEN WEDGE INDUSTRIALMIXED USE PUBLIC USERESIDENTIAL ROADRURAL SPECIAL USETOWNSHIP

Impacts of Climate Change in the Western Port Region
Final Report Page 159
Figure 8.49: Percentage of zoned land types (by area) associated with bushfire prone areas in Western Port LGAs
0%
10%
20%
30%
40%
50%
60%
70%
80%
90%
Bass Coast Cardinia Casey Frankston Mornington
Perc
enta
ge o
f Pla
nnin
g Zo
nes
(by
area
) BUSINESS COMMONWEALTHCONSERVATION AND RESOURCE USE FARMINGFLOODWAY GREEN WEDGEINDUSTRIAL MIXED USEPUBLIC USE RESIDENTIALROAD RURALSPECIAL USE
.
Although this information could be construed as providing comfort to land use planners, for a number of reasons climate change in the Western Port region presents particular challenges for future land use planning decision-making:
First, in some local government areas there are already extensive ‘development’ areas that are exposed to one or more impacts of climate change. In Frankston City for example, approximately 60% of land subject to flooding is zoned residential, with a further 20% being other ‘development’ zones including roads, industrial and special use; comparable areas are also exposed to bushfires there. In Mornington Peninsula Shire almost 45% of the area subject to storm surges are zoned either residential, industrial or roads.
Second, as previously discussed, the population of the Western Port region is projected to grow by about 245,000 (44%) by 2031. Much of this growth (approximately 167,000) is projected to occur in the City of Casey and Shire of Cardinia, designated under Melbourne 2030 (DoI, 2002) as the major urban growth corridor for south east Melbourne. The strategy document which accompanies Melbourne 2030, A Plan for Melbourne’s Growth Areas (DSE, 2005) notes that there are severe limits to additional growth in Casey-Cardinia arising from environmental sensitivity of surrounding wetlands and coastal areas and the region’s high value agricultural areas. These limits mean that “...land identified for development must be used as efficiently as possible (and) growth in the region will require careful monitoring and assessment” (p.23). Climate change adds to the imperative for efficient use of this land and careful monitoring of growth in Casey-Cardinia, since much of the land designated for growth is exposed to either flooding or bushfires.
Third, climate change could create or add to other environmental, social and economic pressures associated with development of land on Melbourne’s south east fringe including:

Impacts of Climate Change in the Western Port Region
Final Report Page 160
− increased pressures on the already environmentally sensitive wetlands and coastal areas; and
− increased demand for the region’s high value, productive agricultural land.
Finally, climate change adds to the complexity of land use planning decisions associated with population growth and development along the region’s coastline and in rural and semi-rural (Green Wedge) areas, driven in part by the ‘sea change’ and ‘tree change’ phenomena. This population growth, although less substantial than in the growth corridor, is still likely to be significant. Furthermore, much of it will occur in areas exposed to coastal inundation, flooding or bushfires, and in some cases all three hazards.
These challenges need to be considered in the context of the current planning and policy environment in Victoria. At the strategic level, for example, the Victorian Government recently flagged a review Planning and Environment Act 1987, placing particular emphasis on:
streamlining the growth area planning process to ensure that zoned land is available in a timely manner for future urban development, and
strengthening certainty and timeliness in the planning process (Brumby, 2008).
In undertaking the review, careful attention will need to be paid to the climate change and land use planning issues outlined above.
At the implementation level, local planning schemes may also need to be reviewed. For example, local planning schemes at present do not explicitly take account of the potential for coastal inundation and erosion when dealing with development in the coastal zone. Similarly, although local planning schemes currently include codes and guidelines to deal with development in flood and bushfire exposed areas, these codes may need to be reviewed in light of the potential for an increase in the frequency and/or severity of floods and bushfires in the region.
8.3.2. Emergency management and volunteer support
Many if not most of the significant risks of climate change to local communities in the Western Port region will arise from changes to the frequency or severity of extreme weather events – storm surges and coastal inundation, intense rainfall and associated flooding, heatwaves, and bushfires.
As noted in a recent report on climate change, risk and vulnerability (Allen Consulting 2005), settlements and infrastructure are generally built to accepted risk limits based on the expected return frequency of extreme weather events. Above these limits however, damage, injury and death can accelerate in a non-linear way.
This possibility poses significant challenges for emergency service planners and providers in the Western Port region including the SES, CFA and the Victorian Ambulance Service. Although those bodies already have comprehensive emergency management planning arrangements in place at the regional and sub-regional levels, plans may need to be reviewed in anticipation of more frequent or extreme weather events. In so doing, intra-regional differences in terms of populations exposed to different

Impacts of Climate Change in the Western Port Region
Final Report Page 161
climate impacts will need to be taken into account, as will differences in the vulnerability of exposed populations due to social characteristics such as income and age.
Emergency Management Australia (EMA, 2004) stresses the importance of local councils in the emergency management process since they serve as a key point of contact for local emergency issues and are usually the first level of support for local communities. Similarly, in its review of natural disasters in Australia (COAG, 2004), the Council of Australian Governments places substantial responsibilities and roles on local government for natural disaster management, these being:
ensuring all requisite local disaster planning and preparedness measures are undertaken;
ensuring an adequate local disaster response capability is in place, including local volunteer resources;
undertaking cost-effective measures to mitigate the effects of natural disasters on local communities, including routinely conducting disaster risk assessments;
systematically taking proper account of risk assessments in land use planning to reduce hazard risk;
undertaking public education and awareness, and ensuring appropriate local disaster warnings are provided;
ensuring appropriate local resources and arrangements are in place to provide disaster relief and recovery services to communities;
representing community interests in disaster management to other levels of government and contributing to decision-making processes; and
participating in post-disaster assessment and analysis.
Local councils in the Western Port region appear to be taking these responsibilities seriously. All councils have in place comprehensive municipal emergency management plans that address the points above. However, effective implementation of the plans requires adequate resourcing and although the COAG review establishes cost sharing arrangements (COAG, 2004), it does not appear to have taken into account potential additional cost burdens on local councils arising from the increased frequency and/or intensity of natural disasters due to climate change.
Climate change also poses significant challenges for volunteer and community groups in the region, with challenges arising from the cumulative effects of more frequent and/or more severe extreme weather events on resources (people as well as finances). This challenge has already been discussed in relation to volunteer based emergency management organizations in the region, such as the CFA and SES. However, other types of voluntary support could also be affected. For example, about 25% of all voluntary work in Victoria is currently performed by people who are 65 years of age or over (ABS, 2007b). As noted in 8.2.1, this group is particularly vulnerable to the impacts of climate change and it is not inconceivable that their capacity to perform voluntary work will be impaired by climate change in a number of circumstances (e.g. delivery of meals-on-wheels during heat waves). This is just one example, but it highlights the importance of strengthening the capacity of community groups and volunteer organizations to respond to climate change in the region.

Impacts of Climate Change in the Western Port Region
Final Report Page 162
8.3.3. Local government financial impacts
Increased natural hazards and other potential impacts of climate change have a potentially significant bearing on the direct and indirect costs of service providers.
For local councils in the Western Port region, these costs relate not just to the provision of emergency services (discussed above) but also to their day-to-day operations and service provision.
A preliminary review of capital and operating expenditure by local councils in the Western Port region was undertaken for this study. Based on the review, it is estimated that approximately 19% of council’s annual expenditure can be classified as being directly ‘climate exposed’ (Table 8.61), consisting of capital and maintenance expenditure on roads, drains, open space and buildings.
Table 8.61: Climate exposed expenditure of Western Port region councils
Category of expenditure Annual average
expenditure (2006 - 2011)
($’000)
Percent of total budget
Annual budget 588,243 100%
Capital works & maintenance 129,563 22%
Roads 48,333 8%
Drains 1,975 0%
Open Space 33,022 6%
Buildings 26,164 4%
Climate exposed 109,494 19%
Other 20,069 3%
Sources: Council financial statements
Although it is not possible to be precise about the extent to which this expenditure will be affected by climate change in the future, discussion in the preceding chapters on the potential impacts of climate change suggests that the cumulative effects of future changes in the frequency and intensity of these impacts could have significant budgetary ramifications for councils. In addition, there are a range of council expenditures that are indirectly exposed to climate events and climate change, including emergency management (already discussed), health and aged care.
Overall therefore, climate change has the potential to have substantial implications for council resource allocation, future decisions about which will require careful assessment of risks, costs and benefits.
Impacts of Climate Change in the Western Port Region
Final Report Page 163
8.3.4. Legal issues
Climate change has potential legal implications for local councils and state government agencies. Legal issues relate in particular to:
development approval processes including developments that have the potential to be impacted by the effects of climate change and major developments that have the potential to impact on climate change; and
council and state government responses relating to the impacts of climate change on existing properties.
There are many uncertainties regarding these issues at present, highlighting the importance of further research in this area.
8.4. Opportunities from climate change The focus of this report is principally on the (adverse) impacts of climate change and on localities and groups exposed to those impacts. Climate change in the Western Port region is likely to create many opportunities however, some region wide and some specific to particular industries or groups.
A detailed analysis of opportunities has not been undertaken for this report, but drawing on stakeholder consultation provided as part of the Western Port region climate change scoping study (MJA, CSIRO and RDC, 2006), a preliminary list of opportunities relevant to settlements in the Western Port is presented in Table 8.62.
Some of these opportunities will stem from responses to the impacts of climate change discussed in earlier chapters (e.g. improved housing design) while others will flow from favourable climate changes (e.g. tourism and recreation opportunities due to higher average temperatures and/or reduced rainfall). Regardless of their nature, a proactive, co-ordinated response from governments and agencies will improve the potential for opportunities to be realised.
As a first step in that process, a more detailed assessment is required to ascertain the following:
What are the opportunities in the Western Port region arising from climate change and climate change responses?
Are any barriers impeding the region’s ability to exploit the opportunities?
How can those barriers be addressed (e.g. government policy settings)?

Impacts of Climate Change in the Western Port Region
Final Report Page 164
Table 8.62: Potential opportunities in the Western Port region arising from climate change and climate change response
Issue Opportunities
Community engagement and capacity building
Improved community understanding of sustainability through information, education and demonstration programs.
Strengthened local communities.
Emergency management
Better training for volunteers in fields of emergency response and pre planning.
Housing and accommodation
More efficient, comfortable and storm resistant house design. No regrets water efficiency audits and implementation. Markets for water saving devices.
Infrastructure siting and planning
Improve community understanding of the costs associated with providing coastal infrastructure.
Redesign of coastal housing areas. Enhanced land use planning in coastal areas.
Potable water Investment in alternative water supply options. Sewage into potable water.
Regional integration and coordination
Utilise existing community infrastructure, resources and networks. Natural and built asset registers. Improved local government and/or regional agency strategic planning and risk management.
Stormwater / drainage Reduced effluent and pollutants to bays and ocean. Improved stormwater design. Increased local/stormwater storage = mitigation of flash flooding. Stormwater reuse for recreational areas.
Tourism and recreation Increased beach based tourism. Increased potential for outdoor activities.
8.5. Future research The assessment of climate change impacts in the Western Port region that is represented by this report highlights a number of avenues for future research that are relevant not only for the Western Port region and the local governments and enterprises therein, but also for other stakeholders and researchers contemplating assessments in other geographic areas or sectors.
Such research reflects key uncertainties or limitations of the current study that could be addressed in the future with the acquisition of more robust data sets, more detailed assessments of smaller subregions or a more constrained suite of climate changes and hazards. Worthwhile data products or research activities include the following:
1) Development of high-resolution integrated elevation/bathymetry data sets for use in hydrological and coastal modelling.
2) Modelling of the risks to coastal areas associated with concurrent storm surge and extreme rainfall events, as the joint effects of such events are likely greater than suggested by assessments that treat each in isolation.

Impacts of Climate Change in the Western Port Region
Final Report Page 165
3) Site-specific modelling of coastal erosion based upon coastal geomorphology, sea-level rise and storm events.
4) Site-specific hydrological/flood modelling of selected inland areas (i.e., areas where there is limited knowledge or the perceived risk is high) using the latest simulations of changes in extreme rainfall frequencies and durations.
5) Spatially-explicit studies of the effects of projected climate changes on bushfire hazard that account for fuel loads, topography, weather and management efforts.
6) Investigation of the linkages between climate change, future increases in atmospheric CO2 and changes in vegetation growth in the context of future bushfire risk.
7) Investigation of the local consequences of past extreme events in the region to better understand direct and indirect costs associated with events of different magnitudes which can be used to improve projections of damage costs from future events.
8) Further investigation of the direct and indirect effects of future changes in regional climate on water supply, distribution, allocation and pricing across the Metropolitan Melbourne network as well as the implications of different water management strategies.
9) Spatially-explicit risk assessment of the vulnerability of human health to climate change that accounts for spatial variability in climate conditions at the local scale, regional projections of future climate, the distribution of sensitive subpopulations and housing/building stock and its thermal efficiency.
10) Development of consistent regional socio-economic scenarios that reflect different potential futures with regard to changes in population, land use, building stocks, economic activity and environmental management. These can subsequently be used in future integrated assessments.
A number of these activities are already being pursued by different organisations at different scales within the region including localised hydrological and flood mapping and the improvement of both elevation and bathymetry data. However, generally the aforementioned activities represent a long-term research agenda that would require significant investments and the development of new analytical methods and tools. Furthermore, while the aforementioned research areas highlight acquisition of scientific and technical information, it is important to acknowledge that the adaptation process is also a function of complex interactions and relationships among public and private institutions and the general public. Many critical barriers to adaptation may lie within this domain, which means improvements in technical information are an important, but not necessarily sufficient, component of effective adaptation. As this report represents just one of a series of outputs from the Western Port Climate Change Integrated Assessment Project, additional conclusions and recommendations will be provided in subsequent reports and communications.

Impacts of Climate Change in the Western Port Region
Final Report Page 166
REFERENCES
Abbs, D., Aryal, S., Campbell, E., McGregor, J., Nguyen, K., et al. (2006), Projections of Extreme Rainfall and Cyclones. Report to the Australian Greenhouse Office, Canberra, Australia, 97 pp.
Abbs, D. and Rafter, T. (2008), The Effect of Climate Change on Extreme Rainfall Events in the Western Port Region, A Report Prepared for the study “Impacts of Climate Change on Human Settlements in the Western Port Region”, CSIRO Marine and Atmospheric Research, Aspendale, 22pp
ABS (Australian Bureau of Statistics) (2004), ‘Australian Business Register Counts of Single Business Locations, ANZSIC Industry Division by Postcode’, ABS Catalogue 8136.0.55.001
ABS (Australian Bureau of Statistics) (2007), Census of Population and Housing 2006, ABS, Canberra.
ABS (Australian Bureau of Statistics) (2007b), National Volunteer Survey 2006, Australian Bureau of Statistics, Canberra
AGO (Australian Greenhouse Office) (2000), Impacts of Minimum Performance Requirements for Class 1 Buildings in Victoria. Department of the Environment and Heritage, Canberra, ACT.
Allen Consulting (2005), Climate Change Risk and Vulnerability. Australian Greenhouse Office, Department of the Environment and Heritage, Canberra, Australia, 159 pp.
Australian Standards (1999), Construction of Buildings in Bushfire Prone Areas, AS 3959-1999, Standards Australia International, Sydney, Australia, 30 pp.
Blamey, R., Gordon, J. & Chapman, R. (1999). ‘Choice Modelling: Assessing the Environmental Values of Water Supply Options’, The Australian Journal of Agricultural and Resources Economics, 43-3, pp. 337-357.
BoM (Bureau of Meteorology), (2007), Climate Education:, ‘The December 1934 Floods in Melbourne’, www.bom.gov.au, accessed 21 October 2007.
Bradstock, R.A., Gill, A.M., Kenny, B.J., and Scott, J. (1998), ‘Bushfire risk at the urban interface estimated from historical weather records: consequences for the use of prescribed fire in the Sydney region of south-eastern Australia.’ Journal of Environmental Management 52, 259-271.
Branz (2007), An Assessment of the Need to Adapt Buildings for the Unavoidable Consequences of Climate Change. Report to the Australian Greenhouse Office, Branz Limited, Porirua, New Zealand.
Bridgman, H., Warner, R., and Dodson, J. (1995), Urban Biophysical Environments. Oxford University Press, Oxford, UK, 152 pp.
Broadleaf Capital International and Marsden Jacob Associates (2006), Climate Change Impacts and Risk Management: A Guide for Business and Government, Australian Greenhouse Office, Canberra.
Bronstert, A., Niehoff, D., and Bürger, G. (2002), ‘Effects of climate and land-use change on storm runoff generation: present knowledge and modelling capabilities.’ Hydrological Processes 16, 509-529.
Brooke, C. and Kinrade. P. (2006), Climate Change Impacts in Western Port, Report prepared for the Western Port Greenhouse Alliance, Climate Impacts and Risk Group CSIRO Marine and Atmospheric Research, Marsden Jacob Associates.

Impacts of Climate Change in the Western Port Region
Final Report Page 167
Brooks, M.L. and Esque, T.C.. (2002), ‘Alien annual plants and wildfire in desert tortoise habitat: Status, ecological effects, and management.’ Chelonian Conservation and Biology 4, 330-340.
Brooks, M., Matchett, J., Wallace, C., and Esque, T. (2004), ‘Fuels mapping and fire hazard assessment in a desert ecosystem.’ Arid Lands, May/June.
Brown, T.J., Hall, B.L. and Westerling, A.L. (2004). ‘The impacts of 21st century climate change on wildland fire danger in the western United States: an application perspective.’ Climatic Change 62, 365-388.
Brumby, J., (2008), The current planning and policy environment - delivering for Victoria: Annual Statement of Government Intentions, the Honourable John Brumby MP, Premier of Victoria, February, 2008.
BTE (Bureau of Transport Economics) (2001), Economic Costs of Natural Disasters in Australia. Report 103, Bureau of Transport Economics, Commonwealth of Australia, Canberra.
Buechley, R.W., Van Bruggen, J., and Truppi, L.E. (1972), ‘Heat island equals death island?’ Environmental Research. 5, 85–92.
Centers for Disease Control (1981), Heatstroke – United States: 1980. MMWR 30, 277-279.
Carlson, T.N. and Arthur, S.T. (2000), ‘The impact of land use — land cover changes due to urbanization on surface microclimate and hydrology: a satellite perspective’. Global and Planetary Change 26: 49-65.
CFA (2007), CFA Annual Report 2007, CFA, Mt Waverley, Victoria.
CFA (2007b): ‘About Ash Wednesday’, www.cfa.vic.gov.au/about/history/about, accessed 21 October 2007.
Chen, K., Hunter, L., Leigh, R., and Blong, R. and Yeo, S. (2004), ‘Are the Poor more at Risk in Flood-prone Communities?’, Risk Frontiers, Macquarie University, Sydney.
Chen, K. and McAneney, J. (2005), ‘The bushfire threat in urban areas’, Australasian Science 26(1):14-16.
Chen, X.-L., Zhao, H.-M., Li, P.-X., and Yin, Z.-Y (2006), ‘Remote sensing image-based analysis of the relationship between urban heat island and land use/cover changes’. Remote Sensing of Environment 104: 133–146
Chen, W. and Zhou, G. (2004), ‘Comparison of the effects of selected variables on urban surface temperature’. IEEE International Geoscience and Remote Sensing Symposium, Anchorage, Alaska, USA.
Church, J.A., Hunter, J.R., McInnes, K.L., and White, N.J. (2006), Sea-level rise around the Australian coastline and the changing frequency of extreme sea-level events. Australian Meteorological Magazine 55: 253-260.
Church, J.A. and White, N.J. (2006), ‘A 20th century acceleration of sea-level rise’. Geophysical Research Letters 33: L01602, doi:10.1029/2005GL024826
Clarke., J. & Brown, R. (2006), ‘Understanding the factors that influence domestic water consumption within Melbourne’, (conference paper), Monash University, Melbourne.
Clarke, J.F. (1972), ‘Some effects of the urban structure on heat mortality’. Environmental Research 5, 93–104.
COAG (2004), Natural Disasters in Australia: Reforming mitigation, relief and recovery arrangements, A report to the Council of Australian Governments by a high level officials’ group, Department of Transport and Regional Services, Canberra.

Impacts of Climate Change in the Western Port Region
Final Report Page 168
Cole, V. (1974), Western Port Pioneers and Preachers, Hawthorn Press, Melbourne.
Coleman, T. (2002), The Impacts of Climate Change on Insurance against Disasters. Insurance Australia Group, Sydney, NSW.
Cooper, J.A.G. and Pilkey, O.H. (2004), ‘Sea-level rise and shoreline retreat: time to abandon the Bruun Rule’. Global and Planetary Change 43, 157-171.
Coutis, A.M., Beringer, J., and Tapper, N.J. (2007), ‘Impact of increasing urban density on local climate: spatial and temporal variations in the surface energy balance in Melbourne’, Australia. Journal of Applied Meteorology and Climatology 46, 477-493.
Cowell, P.J., Thom, B.G., Jones, R.A., Everts, C.H., and Simanovic, D. (2006), ‘Management of uncertainty in predicting climate-change impacts on beaches.’ Journal of Coastal Research 22, 232-245.
CSIRO and Bureau of Meteorology (2007), Climate Change in Australia - Technical Report 2007, CSIRO, Melbourne.
CSIRO, Maunsell, and Phillips Fox (2007), Infrastructure Climate Change Risk Assessment for Victoria. Report to the Victorian Government, CSIRO Marine and Atmospheric Research, Aspendale, VIC.
Davis, R.E., Knappenberger, P.C., Michaels, P.J., and Novicoff, W. (2003), ‘Changing heat-related mortality in the United States’. Environmental Health Perspectives, 111, 1712-1718.
Department of Sustainability and Environment, Victoria (2006), OWOF Central Region Sustainable Water Strategy, Victorian Government, Melbourne.
Department of Sustainability and Environment, Victoria (2007), State Water Report 2007. Victorian Government, Melbourne.
Department of Sustainability and Environment, Victoria (2007b), Our Water Our Future – The Next Stage of the Government’s Water Plan. Victorian Government, Melbourne.
Department for Victorian Communities (2007), Indicators of community strength at the Local Government Area level in Victoria, Victorian Government, Melbourne.
Dixon, P.G., Brommer, D.M., Hedquist, B.C., Kalkstein, A.J., and Goodrich, G.B., et al (2005), ‘Heat mortality vs. cold mortality: a study of conflicting databases in the United States.’ Bulletin of the American Meteorological Society 7: 937-943.
Dromana Foreshore Committee of Management (2003), Dromana Foreshore Reserve Management and Business Plan, December 2003.
Dwyer, A., Zoppou, C., Nielsen, O., Day, S. & Roberts, S. (2004), Quantifying Social Vulnerability: A methodology for identifying those at risk to natural hazards. Geoscience Australia, Canberra.
Emergency Management Australia (2004), Emergency Risk Management Applications Guide, Manual 5, EMA, Attorney General’s Department, Canberra.
Emergency Management Australia (2007), Bushfires: database, www.ema.gov.au/ema/emadistaers.nsf/ , accessed 21 October 2007.
Erten, E., Kurgun, V., and Musaoglu, N. (2004), ‘Forest fire risk zone mapping from satellite imagery and GIS. A case study. International Society for Photogrammetry and Remote Sensing,’ XXth ISPRS Congress, Istanbul, Turkey, 12-23 July 2004.

Impacts of Climate Change in the Western Port Region
Final Report Page 169
Fowler, H.J. and Kilsby, C.G. (2003), Implications of changes in seasonal and annual extreme rainfall. Geophysical Research Letters 30, NO. 13, 1720, doi:10.1029/2003GL017327
Gallucci, J., Tryhorn, L., Lynch, A., and Parkyn, K. (2007), ‘On the meteorological and hydrological mechanisms resulting in the 2003 post-fire flood event in Alpine Shire, Victoria.’ Australian Meteorological Magazine, in review.
Goldammer, J.G. and Price, C. (1998), ‘Potential impacts of climate change on fire regimes in the tropics based on MAGICC and a GISS GCM-derived lightning model.’ Climatic Change 39: 273-296.
Graeme Butler and Associates (1997b), ‘The Southern Cliffs and Hills’, City of Frankston Heritage Study: Volume Two, City of Frankston.
Graeme Butler and Associates (1997b), City of Frankston Heritage Study: Volume Three, City of Frankston.
Graeme Butler and Associates (2001), Hastings District Heritage: Study Stage Two Environmental History.
Guest, C.S., Wilson, K., Woodward, A.J., Hennessy, K., Kalkstein, L.S., et al. (1999),Climate and mortality in Australia: retrospective study, 1979-1990, and predicted impacts in five major cities in 2030. Climate Research 13: 1-5.
Handmer, J., (2003), ‘The chimera of precision: Inherent uncertainties in disaster loss assessment’, The Australian Journal of Emergency Management, Vol. 18 No. 2: 88-97.
Hansen, J., Sato, M., Ruedy, R., Lo, K., Lea, D.W., and Medina-Elizade, M. (2006),Global temperature change. Proceedings of the National Academies of Science, USA 103: 14288-14293.
Hennecke, W.G. (2004),GIS modelling of sea-level rise induced shoreline changes inside coastal re-entrants - two examples from southeastern Australia. Natural Hazards 31: 253-276.
Hennessy, K.J. Lucas, C., Nicholls, N., Bathols, J., Suppiah, R., and Ricketts, J. (2005),Climate Change Impacts on Fire-Weather in Southeast Australia. CSIRO Atmospheric Research. Consultancy report jointly funded by the Commonwealth of Australia and the governments of New South Wales, Victoria, Tasmania, and the Australian Capital Territory, 91 pp.
Hensher, D., Shore, N. & Train, K. (2006), ‘Water Supply Security and Willingness to Pay to Avoid Drought Restrictions’, The Economic Record, 82: 56-66.
IPCC (Intergovernmental Panel on Climate Change) (2001), Climate Change 2001: The Scientific Basis. Contribution of working group I to the Third Assessment Report of the Intergovernmental Panel on Climate Change. Cambridge University Press, Cambridge, UK and New York, NY, USA, 881 pp.
IPCC (Intergovernmental Panel on Climate Change) (2007a), Climate Change 2007: The Physical Science Basis. Summary for Policymakers. Contribution of Working Group I to the Third Assessment Report of the Intergovernmental Panel on Climate Change. IPCC Secretariat, Geneva, Switzerland, 21 pp.
IPCC (Intergovernmental Panel on Climate Change) (2007b), Climate Change 2007: The Physical Science Basis. Contribution of Working Group I to the Fourth Assessment Report of the Intergovernmental Panel on Climate Change. S. Solomon, D. Qin, M. Manning, Z. Chen, M. Marquis, K.B. Averyt, M. Tignor and H.L. Miller (eds.), Cambridge University Press, Cambridge, United Kingdom and New York, NY, USA, 996 pp.

Impacts of Climate Change in the Western Port Region
Final Report Page 170
Intergovernmental Panel on Climate Change (IPCC) (2007c), Working Group II Contribution to the Intergovernmental Panel on Climate Change Fourth Assessment Report Climate Change 2007: Climate Change Impacts, Adaptation and Vulnerability, Summary for Policy Makers, IPCC, Geneva.
Jarvis, A., Rubiano, J., Nelson, A., Farrow, A., and Mulligan, M. (2004), Practical Use
of SRTM Data in the Tropics: Comparisons with Digital Elevation Models Generated from Cartographic Data. Centro Internacional de Agricultura Tropical, Cali, Colombia, 32 p.
Jones, R. N., and Durack, P. J. (2005). Estimating the impacts of climate change on Victoria's runoff using a hydrological sensitivity model, CSIRO Atmospheric Research, Aspendale.
Jones, A.T. and Hayne, M. (2002), Modelling coastal erosion at Perth due to long-term
sea level rise. Proceedings of Australia’s National Coastal Conference (Coast to Coast) – Source to Sea, Tweed Heads, pp. 225–28.
Kalkstein, L.S. and Greene, J.S. (1997), An evaluation of climate/mortality relationships in large U.S. cities and the possible impacts of a climate change. Environmental Health Perspectives 105: 84-93.
Kamermans, P., Hemminga, M., Tack, J., Mateo, M., Marbà, N., Mtolera, M., Stapel J. and A. Verheyden, A. (2002), ‘Groundwater effects on diversity and abundance of lagoonal seagrasses in Kenya and on Zanzibar Island (East Africa). Marine Ecology Progress Series, 231:75-83.
Li, Y., Cai, W. and Campbell, E.P. (2005), Statistical modeling of extreme rainfall in southwest Western Australia. Journal of Climate 18: 852-863.
Liu, Z. and Todini, E. (2002), Towards a comprehensive physically-based rainfall-runoff model. Hydrology and Earth System Sciences 6: 859-881.
Lucas, C., Hennessy, K., Mills, G., and Bathols, J. (2007), Bushfire Weather in Southeast Australia: Recent Trends and Projected Climate Change Impacts. Consultancy report prepared for the Climate Institute by the Bushfire CRC, Australian Bureau of Meteorology, and CSIRO Marine and Atmospheric Research, Melbourne, VIC, Australia.
Luke, R.H. and McArthur, A.G., (1978), Bushfires in Australia, Australian Government Publishing Services, Canberra.
Macadam, I., O’Grady, J., Ricketts, J. (2008), General climate change projections for the Western Port Region, A Report Prepared for the study “Impacts of Climate Change on Human Settlements in the Western Port Region”, CSIRO CSIRO Marine and Atmospheric Research, Aspendale, VIC, 32 pp.
McAneney, J. (2006), ‘Australian Bushfire: Quantifying and Pricing the Risk to Residential Properties’, Risk Frontiers, Macquarie University.
Marsden Jacob Associates (2004), Committees of Management for Crown Land Reserves, A report prepared for the Department of Sustainability and Environment, Victoria, March 2004.
Marsden Jacob Associates (2004b), Economic Analysis of the Value of Public Land in Victoria, A report prepared for the Department of Sustainability and Environment, Victoria, June 2004.

Impacts of Climate Change in the Western Port Region
Final Report Page 171
Martens, W.J.M. (1998), Climate change, thermal stress and mortality changes. Social Science and Medicine 46: 331-344.
McInnes, K.L., Macadam, I. and O’Grady, J. (2008), The Effect of Climate Change on Extreme Sea Levels in Western Port Region, A Report Prepared for the study “Impacts of Climate Change on Human Settlements in the Western Port Region”, CSIRO Marine and Atmospheric Research, Aspendale, VIC, 26 pp.
McMichael, A., Woodruff, R., Whetton, P.H., Hennessy, K., Nicholls, N., Hales, S., Woodward, A., and Kjellstrom, T. (2003),Human Health and Climate Change in Oceania: A Risk Assessment. Commonwealth Department of Health and Ageing, Canberra, Australia.
Meier, M.F., Dyurgerov, M.B., Rick, U.K., O’Neel, S., Pfeffer, W.T., Anderson, R.S., Anderson, S.P., Glazovsky, A.F. (2007), Glaciers Dominate Eustatic Sea-Level Rise in the 21st Century. Science 307: 1064-1067.
Melbourne Water (2003), Guidelines for Development within the Koo Wee Rup Flood Protection District, Melbourne Water Corporation, Melbourne.
Middelmann, M.H. (ed.), (2007), Natural Hazards in Australia: Identifying Risk Analysis Requirements, Geoscience Australia, Canberra.
Mills, B. and Andrey, J. (2002), Climate change and transportation: potential interactions and impacts. In The Potential Impacts of Climate Change on Transportation, Federal Research Partnership Workshop, October 1-2, 2002, Summary and Discussion Papers. DOT Centre for Climate Change and Environmental Forecasting, Washington DC, USA, pp. 77-87.
Minnery, J.R. and Smith, D.I. (1994), Climate change, flooding and urban infrastructure. Australian-New Zealand Conference on Climate Change, Wellington, New Zealand.
Minnery, J.R. and Smith, D.I. (1996),Climate change, flooding and urban infrastructure. In W.J. Bouma, G.I. Pearman, and M.R. Manning (eds), Greenhouse: Coping with Climate Change. CSIRO Publishing, Collingwood, Victoria, Australia, pp. 235-247.
National Economics (2005), YourPlace, accessed on 2 August, 2007.
National Tidal Centre (2007), The Australian Baseline Sea Level Monitoring Project: Annual Sea Level Data Summary Report, July 2006 – June 2007. Bureau of Meteorology, Kent Town, SA, 40 pp.
Nicholls, R.J., P.P. Wong, V.R. Burkett, J.O. Codignotto, J.E. Hay, R.F. McLean, S. Ragoonaden and C.D. Woodroffe (2007), ‘Coastal systems and low-lying areas’. Climate Change 2007: Impacts, Adaptation and Vulnerability. Contribution of Working Group II to the Fourth Assessment Report of the Intergovernmental Panel on Climate Change, M.L. Parry, O.F. Canziani, J.P. Palutikof, P.J. van der Linden and C.E. Hanson, Eds., Cambridge University Press, Cambridge, UK, 315-356.
NOAA (2007), For monthly updates of atmospheric carbon dioxide concentrations, visit the website of the U.S. National Oceanographic and Atmospheric Administration’s Global Monitoring Division, at http://www.cmdl.noaa.gov/ccgg/trends/index.php#global
Office of the Premier (2007), ‘Reform of Melbourne’s Water Industry’ Media Release, 14 August 2007.
Office of the Prime Minister (2003), Statistical Evidence to Support the Housing Health and Safety Rating System. Volume II – Summary of Results. University of Warwick, London School of Hygiene & Tropical Medicine, London, UK, 75 pp.

Impacts of Climate Change in the Western Port Region
Final Report Page 172
Patz, J.A., McGeehin, M.A., Bernard, S.M., Ebi, K.L., Epstein, P.R. (2001), Potential consequences of climate variability and change for human health in the United States. Chapter 15 in US National Assessment of the Potential Consequences of Climate Variability and Change. U.S. Global Change Research Program, Washington, DC.
Pearce, G., Mullan, A.B., Salinger, M.J., Opperman, T.W., Woods, D. and Moore, J.R. (2005), Impact of Climate Variability and Change on Long-Term Fire Danger. Report to the New Zealand Fire Service Commission, 75 pp.
Pickering, C.M., Good, R., and Green, K. (2004), Potential Effects of Global Warming on the Biota of the Australian Alps. A report for the Australia Greenhouse Office.
Port of Melbourne Authority (1992), Victorian Coastal Vulnerability Study. Coastal Investigations Unit, Port of Melbourne Authority, Port Melbourne, VIC.
Preston, B.L. and Jones, R.N. (2008), Evaluating sources of uncertainty in Australian runoff projections. Advances in Water Resources 31(5), 758-775.
Queensland Government (2002), Guidance on the Assessment of Tangible Flood Damages, Queensland Government, Brisbane.
Rahmstorf, S. (2006), A semi-empirical approach to projecting future sea-level rise. Science 315: 368-370.
Read Sturgess & Associates (2000), Rapid Appraisal Method (RAM) for Floodplain Management, Department of Natural Resources & Environment, Melbourne.
Roberts, D. (1985), From Swampland To Farmland - A History of the Koo-Wee-Rup Flood Protection District. Rural Water Commission of Victoria.
Rossetti, M.A. (2002), Potential impacts of climate change on railroads. In The Potential Impacts of Climate Change on Transportation, Federal Research Partnership Workshop, October 1-2, 2002, Summary and Discussion Papers. DOT Centre for Climate Change and Environmental Forecasting, Washington DC, USA, pp. 209-221.
SAI Global (2005), New Guidelines for Building in Bushfire-Prone Areas, Second Public Comment Draft. SAI International, Sydney, Australia.
Scheers-Masters, J.R., Schootman, M., Thach, B.T. (2004), Heat stress and sudden infant death syndrome incidence: A United States population epidemiologic study. Paediatrics 113: e586-e592.
Schreider, S.Y., Smith, D.I., and Jakeman, A.J. (2000), Climate change impacts on urban flooding. Climatic Change 47: 91-115.
Semenza, J.C., McCullough, J.E., Flanders, W.D., McGeehin, M.A., Lumpkin, J.R. (1999), Excess hospital admissions during July 1995 heat wave in Chicago. American Journal of Preventive Medicine 16, 269-277.
Semenza, J.C., Rubin, C.H., Falter, K.H., Selanikio, J.D., Flanders, W.D., Howe, H.L., and Wilhelm, J.L. (1996), Heat-related deaths during the July 1996 heat wave in Chicago. New England Journal of Medicine 335(2): 84-90.
Sharples, C. (2004), Indicative Mapping of Tasmania Coastal Vulnerability to Climate Change and Sea Level Rise: Explanatory Report. Department of Primary Industries, Water & Environment (Tasmania), 126 pp.
Siegenthaler, U., Stocker, T.F., Monnin, E., Luthi, D., Schwander, J., Stauffer, B., Raynaud, D., Barnola, J.-M., Fisher, H., Masson-Delmotte, V., and Jouzel, J. (2005), Stable carbon cycle–climate relationship during the late Pleistocene. Science 310: 1313-1317.

Impacts of Climate Change in the Western Port Region
Final Report Page 173
Slott, J. (2003), Shoreline Response to Sea-Level Rise: Examining the Bruun Rule. Nicholas School of the Environment and Earth Science, Department of Earth and Ocean Sciences, Duke University, November 25.
Smith, D.I. (1998), Urban flood damage under greenhouse conditions: what does it mean for policy? Australian Journal of Emergency Management 13(2): 56-61.
Smoyer, K.E. (1998), Putting risk in its place: methodological consideration for investigating extreme event health risk. Social Science and Medicine 47(11): 1809-1824.
Spahni, R., Chappellaz, J., Stocker, T.F., Loulergue, L., Hausammann, G., Kawamura, K., Fluckiger, J., Schwander, J., Raynaud, D., Masson-Delmotte, V., and Jouzel, J. (2005), Atmospheric methane and nitrous oxide of the late Pleistocene from Antarctic ice cores. Science 310: 1317-1321.
State of Victoria (2004), Figure obtained from: Adapting to Climate Change: Enhancing Victoria’s Capacity. Victoria Department of Sustainability and Environment, East Melbourne, Victoria, Australia. Available at: http://www.greenhouse.vic.gov.au/impacts/Consultation_Paper_14_07.pdf
Steffen, W., Sanderson, A., Tyson, P., Jäger, J., Matson, P., Moore, B., III, Oldfield, F., Richardson, K., Schellnhuber, H-J., Turner, BL., II, and Wasson, R. (2004), Global Change and the Earth System: A Planet Under Pressure. IGBP Global Change Series. Springer-Verlag, Berlin, Heidelburg, New York.
Stern, N. (2006), Stern Review on the Economics of Climate Change, HM Treasury, London.
Stive, M.J.F. (2004), How important is global warming for coastal erosion? Climatic Change 64: 27-39.
Stocks, B.J., Fosberg, M.A., Lynham, T.J., Mearns, L., Wooton, B.M. et al (1998), Climate change and forest fire potential in Russian and Canadian boreal forests. Climatic Change, 38: 1-13.
Toll Group (2001), Draft Environmental Management Plan for the Port of Hastings. Toll Group, Western Port, September.
Thompson, P. & Handmer, J. (1996), Economic Assessment of Disaster Mitigation: An Australian Guide, Centre for Resource Environmental Studies, ANU and Flood Hazard Research Centre, Middlesex University for the Australian IDNDR Committee.
Tourism Victoria (2006a), ‘Phillip Island Market Pro f i l e Year Ending June 2006’. Tourism Victoria (2006b), ‘Mornington Peninsula Market Pro f i l e Year Ending June
2006’.
Troy, P., Holloway, D., & Randolph, W. (2005), Water use in the Built Environment: Patterns of Water Consumption in Sydney, UNSW, Sydney.
UK NHS (United Kingdom National Health Service) (2005), Heatwave Plan for England: Protecting Health and Reducing Harm from Extreme Heat and Heatwaves. National Health Service, London, UK.
URS (2004), Portsea Foreshore Reserve Coastal Management Plan, Mornington Peninsula Shire, Rosebud.

Impacts of Climate Change in the Western Port Region
Final Report Page 174
Vandentorren, S., Bretin, P., Zeghnoun, A. Mandereau-Bruno, L. Croisier, A. et al (2006), August 2003 heat wave in France: risk factors for death of elderly people living at home. European Journal of Public Health 16: 583-591.
Vivès, B. and Jones, R. (2005), Detection of Abrupt Changes in Australian Decadal Rainfall Variability (1890–1989). CSIRO Atmospheric Research Technical Paper No. 73, 54 pp.
Victorian Government (2008), A Climate of Opportunity: Victorian Climate Change Summit Paper, Victorian Government, Melbourne.
Voice, M., Harvey, N. and Walsh, K. (Editors) (2006), Vulnerability to Climate Change of Australia’s Coastal Zone: Analysis of Gaps in Methods, Data and System Thresholds. Report to the Australian Greenhouse Office, Canberra, Australia.
Walkden, M. and Dickson, M. (2006), The Response of Soft Rock Shore Profiles to Increased Sea-Level Rise. Working Paper #105, Tyndall Centre for Climate Change Research, Norwich, UK.
Webster, J. (2000), The Complete Bushfire Safety Book, Random House Australia, Sydney.
Woodruff, R., Hales, S., Butler, C., and McMichael, A. (2005), Climate Change Health Effects in Australia: Effects of Dramatic CO2 Emission Reductions. Report for the Australian Conservation Foundation and the Australian Medical Association, Canberra, Australia, 44 pp.
Wotton, B.M., Martell, D.L. and Logan, K.A. (2003), Climate change and people-caused fire occurrence in Ontario. Climatic Change 60: 275-295.
Young, M., McColl, J. & Fisher, T. (2007), Urban water pricing: How might an urban water trading scheme work? University of Adelaide, Adelaide.
Zhang, K., Douglas, B., and Leatherman, S. (2004), Global warming and coastal erosion. Climatic Change 64: 41-58.

Impacts of Climate Change in the Western Port Region
Final Report Page 175
ABBREVIATIONS
ABARE – Australian Bureau of Agricultural and Resource Economics ABS – Australian Bureau of Statistics AGO – Australian Greenhouse Office AR4 – Fourth Assessment Report (IPCC) ARI – Annual return interval BoM – Bureau of Meteorology BRS – Bureau of Rural Sciences BTRE – Bureau of Transport and Regional Economics °C – degrees Celsius CAD – Central activity district CBD – Central business district CCD – Census collection district CFA – Country fire authority CH4 – methane CIV – Capital improved value cm – centimetre CMA – Catchment management authority CO2 – Carbon dioxide COAG – Council of Australian Governments CSIRO – Commonwealth Scientific and Industrial Research Organisation DCC – Department of Climate Change DEM – Digital Elevation Model DEWR – Department of Environment and Water Resources DJF – December, January, February DSE – Department of Sustainability and Environment ENSO – El Niño Southern Oscillation GCM – Global Climate Model GIS – Geographic information system GL – Gigalitre (1 billion litres) GDP – Gross domestic product GRP – Gross regional product HMAS – Her Majesty's Australian Ship IOCI – Indian Ocean Climate Initiative IPCC – Intergovernmental Panel on Climate Change IPO – Interdecadal Pacific Oscillation ISO – International Organisation for Standardization JJA – June, July, August km – kilometres kL – kilolitres (1 thousand litres) kv – kilovolt LGA – Local government area LSIO – Land subject to inundation m - metre MAM – March, April, May MJA – Marsden Jacob Associates ML – Megalitre (1 million litres) mm – Millimetres MPS – Mornington Peninsula Shire

Impacts of Climate Change in the Western Port Region
Final Report Page 176
N2O – nitrous oxide NHT – National Heritage Trust NatHERS – Nationwide House Energy Rating Scheme NLWRA – National Land and Water Resource Australia NSW – New South Wales NWI – National Water Initiative OzClim – Australian Climate Scenario Generator SD – statistical division SES – State emergency services SIV – Site improved value SoE – State of the Environment SON – September, October, November SRTM – Shuttle radar tomography mission SWMA – Surface water management area TAR – Third Assessment Report WPGA – Western Port Greenhouse Alliance WSAA – Water Services Association of Australia

Impacts of Climate Change in the Western Port Region
Final Report Page 177 .
APPENDICES: OVERVIEW OF CLIMATE CHANGE IMPACTS IN THE WESTERN PORT REGION BY LOCAL GOVERNMENT AREA

Impacts of Climate Change in the Western Port Region
Final Report Page 178.
Bass Coast Shire
Climate variable* Indicative change** Exposed people*** Exposed property and
infrastructure*** Most sensitive locations Economic
and social impacts Vulnerable sectors Vulnerable groups
Temperature 2030 2070
Average annual temperature ↑ 0.5-1.3°C ↑ 1-3.5°C
Days per yr > 30 °C (16 current) ↑ 1 - 5 ↑ 4 - 16
Days per yr > 40 °C (0 current) ↑ 1 ↑ 2
entire population, especially 6,000 elderly
most roads most railways lines some building materials buildings or services that
require cooling
inland areas (particularly urban)
areas with high concentrations of elderly and infants (esp. Wonthaggi, Inverloch)
increased mortality and morbidity in vulnerable groups
increased infrastructure maintenance costs disruptions to transport networks increased risk of food and water born disease
outbreaks increased summer peak demand increased cooling costs
transport construction local government
services such as child care, environmental health
elderly (6,000) infants (1,300) residents in low quality
housing (e.g. rental) or low income households
Average rainfall 2030 2070
Average annual ↓ 0-8 % ↓ 0-23 %
Catchment stream flows ↓ 25 % ↓ >50 %
Droughts ↑ frequency & severity
entire population
municipal parks and gardens
playing fields water & wastewater
infrastructure other infrastructure on
clay soils
areas not connected to mains supply
high water requirement sites
wetlands, heritage gardens and other reserves
increased water prices increased reliance on non-traditional supply
sources access to water for some activities viability of some water dependent businesses
and activities increased maintenance costs, some
infrastructure
nurseries, garden services, etc
local government services such as parks, recreation
water suppliers and retailers
households not
connected to mains supply
low income households (possibly)
Extreme rainfall 2030 2070
2 hour ↑ 22 % ↑ 59 %
12 hour ↑ 17 % ↑ 41 %
24 hour ↑ 14 % ↑ 39 %
72 hour ↓ 2 % ↑ 39 %
Maximum flood heights ↑ ↑
Flood return intervals (ARI) ↓ flash
↔ riverine
↓ flash
↓ riverine
150 people
55 residences, principally rural
11 commercial and other properties
16 km of roads including Bass Highway and Korumburra-Wonthaggi Rd, 9 bridges
Bass River flood plain
increased flood damage to public infrastructure, especially roads and bridges
increased flood damage costs to residential and commercial buildings (minimal)
disruption to transport increased emergency services demand and
costs
local government transport rural
low income households businesses and
properties without adequate insurance
residences with limited freeboard above 1:100 year flood (e.g. <300 mm clearance)
Sea level rise / storm surge 2030 2070
Sea level rise ↑ 0.17 m ↑ 0.49 m
Storm tide – max. height, 1:100 year ARI (current 2.10m, Cowes) 2.29 m 2.74 m
Storm surge – change to 1:100 year ARI
↓ to 1:50 - 1:20
↓ to 1:20 - 1:4
Inundation area Phillip Island (1:100 year storm surge) 2.2 sq km 2.8 sq km
Inundation area mainland**** (1:100 year storm surge) 2.5 sq km 4.5 sq km
560 people possibly additional
people and properties in the vicinity of Inverloch
261 residences approx. 30 commercial
and other properties most beaches and
foreshore reserves including at Cowes and Inverloch
most boating facilities 15km of roads including
Bass Highway
Cowes, Rhyll, Cape Woolamai
Bass River Grantville, Coronet Bay Possibly in vicinity of
Inverloch
partial or (in worst case) complete loss of land values in affected areas
major amenity impacts associated with damage to beaches and foreshore reserves
impacts on businesses dependent on beach related tourism, especially Phillip Island and Inverloch
increased insurance costs or lack of access to insurance
costs associated with beach and foreshore maintenance (e.g. beach renourishment)
tourism recreation and boating local government
low income households elderly households
Fire weather 2030 2050
No. of very high and extreme forest fire risk days (~ 9 days current)
↑ 1 - 2 ↑ 2 - 5
No. of very high and extreme grass fire risk days (~ 95 days current)
↑ 7 - 15 ↑ 9 - 30
up to 2,800 people, mostly adjacent to bushland
1,280 residences 50 commercial and
industrial 240 public use and
unspecified including schools, medical facilities and numerous reserves
87 km of roads
Phillip Island around Cowes and Rhyll
a large area in the north of the shire to the east and south of Grantville
north and south of Wonthaggi
increased damage costs to residential properties
health impacts including loss of life and air quality
increased emergency service costs stress, social disruption
residential emergency services local government transport
people living in older housing (in exposed areas)
properties that have not been adequately prepared
low income households
* Note, information on windiness and storms is the same for all LGA. It is summarised in Table A, Executive summary. ** Key to climate changes: ↑ increase; ↓ decrease; ↔ no significant change. Absence of number next to arrow indicates magnitude of change has not been quantified. *** Based on current (2006) population and projected changes to 2070. **** Does not include area around Inverloch, where further analysis is required.

Impacts of Climate Change in the Western Port Region
Final Report Page 179.
Cardinia Shire
Climate variable Indicative change* Exposed land and people**
Exposed property and infrastructure**
Most sensitive locations
Economic and social impacts
Vulnerable sectors Vulnerable groups
Temperature 2030 2070
Average annual temperature ↑ 0.5-1.3°C ↑ 1-3.5°C
Days per yr > 30 °C (30 current) ↑ 3-6 ↑ 6-25
Days per yr > 40 °C (1 current) ↑ 1 ↑ 5
entire population, especially 5,600 elderly
most roads most railways lines some building materials buildings or services that require
cooling
inland areas (particularly urban e.g. Pakenham)
areas with high concentrations of elderly and infants (e.g. Pakenham)
increased mortality and morbidity in vulnerable groups
increased infrastructure maintenance costs
disruptions to transport networks increased risk of food and water born
disease outbreaks increased summer peak demand increased cooling costs
transport construction local government
services such as child care, environmental health
elderly (5,600) infants (4,300) low income households
and / or residents in low quality housing (e.g. rental)
Average rainfall 2030 2070
Average annual ↓ 0-8 % ↓ 0-23 %
Catchment stream flows ↓ 25 % ↓ >50 %
Droughts ↑ frequency & severity
entire population
municipal parks and gardens playing fields water & wastewater infrastructure other infrastructure on clay soils
areas not connected to mains supply
high water requirement sites
wetlands, heritage gardens and other reserves
increased water prices increased reliance on non-traditional
supply sources access to water for some activities
(possibly) viability of some water dependent
businesses and activities increased maintenance costs, some
infrastructure
nurseries, garden services, etc
local government services such as parks, recreation
water suppliers and retailers
households not
connected to mains supply
low income households (possibly)
Extreme rainfall 2030 2070
2 hour ↑ 16 % ↑ 35 %
12 hour ↑ 8 % ↑ 25 %
24 hour ↑ 1 % ↑ 25 %
72 hour ↓ 6 % ↑ 28 %
Maximum flood heights ↑ ↑
Flood return intervals (ARI) ↓ flash
↔ riverine
↓ flash
↓ riverine
up to 8,800 people up to 480 km2 of
land
3,100 residential properties (~1,400 dwellings)
650 industrial and commercial properties
public infrastructure including schools, health care facilities, halls
numerous reserves and parks at least 270 rural properties up to 942 km of roads including
Princes and South Gippsland Highways
extensive drainage infrastructure – channels, pipes and pits
all of southern section
of Shire / Koo Wee Rup Swamp
increased flood damage to public infrastructure, especially roads
increased flood damage costs to residential and commercial buildings
disruption to transport increased emergency services
demand and costs lost agricultural production
local government transport agriculture residential utilities (drainage)
low income households businesses and
properties without adequate insurance
residences with limited freeboard above 1:100 year flood (e.g. <300 mm clearance)
Sea level rise / storm surge 2030 2070
Sea level rise ↑ 0.17 m ↑ 0.49 m
Storm tide – max. height, 1:100 year ARI (current 1.98m) 2.17 m 2.61 m
Storm surge – change to 1:100 year ARI
↓ to 1:50 - 1:20
↓ to 1:20 - 1:3
Inundation area (1:100 year storm surge – current 2.1 sq. km) 2.4 sq km 3.4 sq km
up to 70 people
24 rural and semi rural properties 5 reserves or other public use
properties most foreshore reserves and
coastal wetlands most boating facilities 17km of roads including possibly
South Gippsland Highway some drainage infrastructure
no major settlements
partial or (in worst case) complete loss of land values in affected areas
amenity impacts associated with damage to foreshore reserves
increased insurance costs or lack of access to insurance
recreation and
boating local government
low income households
Fire weather 2030 2050
No. of very high and extreme forest fire risk days (~ 12 days current)
↑ 1 - 2 ↑ 5 - 7
No. of very high and extreme grass fire risk days (~ 95 days current)
↑ 7-15 ↑ 9 - 30
up to 22,300 people, mostly adjacent to bushland
up to 445 km2 of land
5,500 residential and semi-rural properties
1,900 rural properties 150 commercial and industrial
properties 110 public use facilities including
schools, medical facilities 220 reserves and parks 674 km of roads 42 km of rail electricity transmission lines Cardinia Reservoir
bushland settlements in urban rural fringe including Emerald, Cockatoo, Gembrook, Upper Pakenham, Upper Beaconsfield
increased damage costs to residential properties
health impacts including loss of life and air quality
increased emergency service costs stress, social disruption
residential emergency services local government transport
people living in older housing (in exposed areas)
properties that have not been adequately prepared
low income households

Impacts of Climate Change in the Western Port Region
Final Report Page 180.
* Key to climate changes: ↑ increase; ↓ decrease; ↔ no significant change. Absence of number next to arrow indicates magnitude of change has not been quantified. ** Based on current (2006) population and projected changes to 2070.
City of Casey
Climate variable Indicative change* Exposed land and people**
Exposed property and infrastructure**
Most sensitive locations
Economic and social impacts
Vulnerable sectors Vulnerable groups
Temperature 2030 2070
Average annual temperature ↑ 0.5-1.3°C ↑ 1-3.5°C
Days per yr > 30 °C (30 current) ↑ 3-6 ↑ 6-25
Days per yr > 40 °C (1 current) ↑ 1 ↑ 5
entire population, especially 17,000 elderly
most roads most railways lines some building materials buildings or services that require
cooling
inland areas (particularly urban e.g. Narre Warren)
areas with high concentrations of elderly and infants (e.g. Cranbourne, Narre Warren)
increased mortality and morbidity in vulnerable groups
increased infrastructure maintenance costs
disruptions to transport networks increased risk of food and water born
disease outbreaks increased summer peak demand increased cooling costs
transport construction local government
services such as child care, environmental health
elderly (17,000) infants (17,000) low income households
and / or residents in low quality housing (e.g. rental)
Average rainfall 2030 2070
Average annual ↓ 0-8 % ↓ 0-23 %
Catchment stream flows (worst case) ↓ 25 % ↓ >50 %
Droughts ↑ frequency & severity
entire population
municipal parks and gardens playing fields water & wastewater infrastructure other infrastructure on clay soils
high water requirement sites
wetlands, heritage gardens and other reserves
increased water prices increased reliance on non-traditional
supply sources access to water for some activities
(possibly) viability of some water dependent
businesses and activities increased maintenance costs, some
infrastructure
nurseries, garden services, etc
local government services such as parks, recreation
water suppliers and retailers
low income households
(possibly) new urban
developments (possibly)
Extreme rainfall 2030 2070
2 hour ↑ 15 % ↑ 20 %
12 hour ↑ 3 % ↑ 17 %
24 hour ↓ 2 % ↑ 16 %
72 hour ↓ 8 % ↑ 19 %
Maximum flood heights ↑ ↑
Flood return intervals (ARI) ↓ flash
↔ riverine
↓ flash
↓ riverine
up to 11,000 people
up to 100 km2 of land
3,800 residential properties (~1,700 dwellings)
210 industrial and commercial properties
950 unspecified but including public infrastructure - schools, health care facilities, halls
numerous reserves and parks 260 rural properties up to 310 km of roads including
Princes and South Gippsland Highways
railway lines extensive drainage infrastructure –
channels, pipes and pits
much of eastern
and southern sections of City
significant pockets around Hallam, Narre Warren, Berwick (e.g. Hallam Main drain) and Cranbourne
increased flood damage to public infrastructure, especially roads
increased flood damage costs to residential and commercial buildings
disruption to transport increased emergency services demand
and costs lost agricultural production
local government residential transport agriculture utilities (drainage)
low income households businesses and
properties without adequate insurance
residences with limited freeboard above 1:100 year flood (e.g. <300 mm clearance)
Sea level rise / storm surge 2030 2070
Sea level rise ↑ 0.17 m ↑ 0.49 m
Storm tide – max. height, 1:100 year ARI (current 1.98 m, Tooradin) 2.17 m 2.61 m
Storm surge – change to 1:100 year ARI
↓ to 1:50 - 1:20
↓ to 1:20 - 1:3
Inundation area (1:100 year storm surge – current 2.7 sq. km) 2.9 sq km 3.7 sq km
up to 240 people directly exposed
110 residential properties 31 unspecified including reserves
and other public use most foreshore reserves and
coastal wetlands most boating facilities 10km of roads including possibly
South Gippsland Highway east of Tooradin
some drainage infrastructure
Warneet, Tooradin
partial or (in worst case) complete loss of land values in affected areas
amenity impacts associated with damage to foreshore reserves
increased insurance costs or lack of access to insurance
recreation and
boating local government
low income households
Fire weather 2020 2050
No. of very high and extreme forest fire risk days (~ 12 days current) ↑ 1 - 2 ↑ 5 - 7
No. of very high and extreme grass fire risk days (~ 95 days current) ↑ 7-15 ↑ 9 – 30
up to 520 people, mostly adjacent to bushland
up to 23 km2 of land
240 residential and semi-rural properties
23 rural properties 8 commercial and industrial
properties 71 unspecified including reserves up to 47 km of roads
limited areas, principally bushland settlements in urban rural fringe around Narre Warren North & East
increased damage costs to residential properties
health impacts including loss of life and air quality
increased emergency service costs stress, social disruption
residential emergency services local government transport
people living in older housing (in exposed areas)
properties that have not been adequately prepared
low income households
* Key to climate changes: ↑ increase; ↓ decrease; ↔ no significant change. Absence of number next to arrow indicates magnitude of change has not been quantified. ** Based on current (2006) population and projected changes to 2070.

Impacts of Climate Change in the Western Port Region
Final Report Page 181.
Frankston City
Climate variable Indicative change* Exposed people** Exposed property and
infrastructure** Most sensitive
locations Economic
and social impacts Vulnerable sectors Vulnerable groups
Temperature 2030 2070
Average annual temperature ↑ 0.5-1.3°C ↑ 1-3.5°C
Days per yr > 30 °C (20 current) ↑ 3-6 ↑ 6-25
Days per yr > 40 °C (0 current) ↑ 1 - 2 ↑ 2 - 5
entire population, especially 15,000 elderly
most roads most railways lines some building materials buildings or services that require
cooling
inland areas (particularly urban)
areas with high concentrations of elderly and infants (esp. NW and SW corners)
increased mortality and morbidity in vulnerable groups
increased infrastructure maintenance costs
disruptions to transport networks increased risk of food and water born
disease outbreaks increased summer peak demand increased cooling costs
transport construction local government
services such as child care, environmental health
elderly (15,000) Infants (7,000) residents in low quality
housing (e.g. rental) or low income households
Average rainfall 2030 2070
Average annual ↓ 0-8 % ↓ 0-23 %
Catchment stream flows ↓ 25 % ↓ >50 %
Droughts ↑ frequency & severity
entire population
municipal parks and gardens playing fields water & wastewater infrastructure other infrastructure on clay soils
greenfield development sites (possibly)
high water requirement sites
wetlands, heritage gardens and other reserves
increased water prices increased reliance on non-traditional
supply sources access to water for some activities
(possibly) viability of some water dependent
businesses and activities increased maintenance costs, some
infrastructure
nurseries, garden services, etc
local government services such as parks, recreation
water suppliers and retailers
householders in new
developments (possibly)
low income households (possibly)
Extreme rainfall 2030 2070
2 hour ↑ 15 % ↑ 37 %
12 hour ↑ 4 % ↑ 26 %
24 hour ↓ 2 % ↑ 24 %
72 hour ↓ 16 % ↑ 20 %
Maximum flood heights ↑ ↑
Flood return intervals (ARI) ↓ flash
↔ riverine
↓ flash
↓ riverine
up to 19,000 people
5,700 residential properties 1,150 commercial properties 130 public properties - schools,
emergency services, reserves water and drainage infrastructure 16 km of roads including Nepean
Highway, 9 bridges
most of central and
northern coastal hinterland
Frankston CAD Seaford wetlands
and surrounds
increased flood damage costs to residential and commercial buildings
increased flood damage to public infrastructure, especially roads and bridges
health impacts related to disruption to water and sewerage services
stress, social disruption disruption to transport increased emergency services
demand and costs
residential commercial (Frankston
CAD) water and wastewater local government emergency services
low income households businesses and
properties without adequate insurance
properties not adequately prepared or maintained
Sea level rise / storm surge 2030 2070
Sea level rise ↑ 0.17 m ↑ 0.49 m
Storm tide – max. height, 1:100 year ARI (current 1.16m) 1.37 m 1.80 m
Storm surge – change to 1:100 year ARI
↓ to 1:40 - 1:6
↓ to 1:20 - 1:1
Inundation area (1:100 year storm surge)
under review
under review
minimal number based on current modelling, however data may be too coarse to adequately capture Kananook Creek mouth
historical evidence suggests potentially a significant number of people
most beaches and foreshore reserves including Frankston and Seaford
most boating facilities historical evidence suggests
potentially many residences and commercial properties, as well as the Nepean Highway
most of central and northern coastline
Kananook Creek and surrounds, including potentially Frankston CAD and Seaford wetlands and surrounds
Oliver’s Hill (erosion, possibly)
partial or (in worst case) complete loss of land values in affected areas
major amenity impacts associated with damage to beaches and foreshore reserves
impacts on businesses dependent on beach related tourism
increased insurance costs or lack of access to insurance
costs associated with beach and foreshore maintenance (e.g. beach renourishment)
tourism recreation and boating local government
no specific groups identified
Fire weather 2030 2050
No. of very high and extreme forest fire risk days (~ 12 days current)
↑ 1 - 2 ↑ 5 - 7
No. of very high and extreme grass fire risk days (~ 95 days current)
↑ 7 - 15 ↑ 9 - 30
up to 14,000 people
6,000 residential properties 66 businesses 160 public use areas including
schools, medical facilities and numerous reserves
245 km of roads and 7 kms of rail
central areas around Langwarrin
southern boundary around Frankston South, Langwarrin South
increased damage costs to residential properties
health impacts including loss of life and air quality
increased emergency services demand and costs
stress, social disruption
residential emergency services local government transport
people living in older housing (in exposed areas)
properties that have not been adequately prepared
low income households
* Key to climate changes: ↑ increase; ↓ decrease; ↔ no significant change. Absence of number next to arrow indicates magnitude of change has not been quantified. ** Based on current (2006) population and projected changes to 2070.

Impacts of Climate Change in the Western Port Region
Final Report Page 182.
Mornington Peninsula Shire
Climate variable Indicative change* Exposed people**
Exposed property and infrastructure**
Most sensitive locations
Economic and social impacts
Vulnerable sectors Vulnerable groups
Temperature 2030 2070
Average annual temperature ↑ 0.5-1.3°C ↑ 1-3.5°C
Days per yr > 30 °C (16 current) ↑ 1 - 5 ↑ 4 - 16
Days per yr > 40 °C (0 current) ↑ 1 ↑ 2
entire population, especially 27,000 elderly
most roads most railways lines some building materials buildings or services that
require cooling
inland areas (particularly urban)
areas with high concentrations of elderly and infants (eg. West Rosebud)
increased mortality and morbidity in vulnerable groups
increased infrastructure maintenance costs disruptions to transport networks increased risk of food and water born disease
outbreaks increased summer peak demand increased cooling costs
transport construction local government
services such as child care, environmental health
elderly (27,000) infants (8,000) residents in low quality
housing (e.g. rental) or low income households
Average rainfall 2030 2070
Average annual ↓ 0-8 % ↓ 0-23 %
Catchment stream flows (worst case) ↓ 25 % ↓ >50 %
Droughts ↑ frequency & severity
entire population
municipal parks and gardens playing fields water & wastewater
infrastructure other infrastructure on clay
soils
areas not connected to mains supply
high water requirement sites
wetlands, heritage gardens and other reserves
increased water prices increased reliance on non-traditional supply sources access to water for some activities (possibly) viability of some water dependent businesses and
activities increased maintenance costs, some infrastructure
nurseries, garden services, etc
local government services such as parks, recreation
water suppliers and retailers
households not
connected to mains supply
low income households (possibly)
Extreme rainfall 2030 2070
2 hour ↑ 25 % ↑ 70 %
12 hour ↑ 22 % ↑ 61 %
24 hour ↑ 17 % ↑ 50 %
72 hour ↓ 2 % ↑ 48 %
Maximum flood heights ↑ ↑
Flood return intervals (ARI) ↓ flash
↔ riverine
↓ flash
↓ riverine
up to 530 people
does not include most areas on Port Phillip Bay side due to gaps in flood hazard mapping
204 residential properties (~ 100 dwellings)
50 commercial and industrial properties
public infrastructure including schools,, halls
reserves and parks 128 km of roads, 8 bridges water and drainage
infrastructure
Western Port Bay Crib Point,
Hastings, Shoreham and Stony Point
Port Phillip Bay data incomplete
increased flood damage to public infrastructure, especially roads and bridges
increased flood damage costs to residential and commercial buildings
disruption to transport increased emergency services demand and costs
local government transport residential
low income households businesses and
properties without adequate insurance
residences with limited freeboard above 1:100 year flood (e.g. <300 mm clearance)
Sea level rise / storm surge 2030 2070
Sea level rise ↑ 0.17 m ↑ 0.49 m
Storm tide – max. height, 1:100 year ARI (current 1.14m, Rosebud) 1.35 m 1.78 m
Storm tide – max. height, 1:100 year ARI (current 2.09m, Somers) 2.28 m 2.74 m
Storm surge – change to 1:100 year ARI
↓ to 1:40 - 1:10
↓ to 1:20 - 1:2
Inundation area Port Phillip*** (1:100 year storm surge) 0.8 sq km 1.5 sq km
Inundation area Western Port (1:100 year storm surge) 2.6 sq km 3.3 sq km
1,400 people due to coarse
resolution of models, people and properties exposed to inundation may be understated, particularly on Port Phillip Bay
637 residential properties approx. 30 commercial and
other properties most beaches and foreshore
reserves including Mt Eliza, Rosebud, Rye, Somers
most boating facilities 45km of roads including
sections of Nepean Highway
Western Port Bay Hastings, Stony
Point, Crib Point Shoreham,
Balnarring Port Phillip Bay Balcombe Creek,
Dromana Bay, Safety Beach, Dunns Creek, West Rosebud
partial or (in worst case) complete loss of land values in affected areas
major amenity impacts associated with damage to or loss of beaches and foreshore reserves
impacts on businesses dependent on beach related tourism
increased insurance costs or lack of access to insurance
costs associated with beach and foreshore maintenance (e.g. beach renourishment)
tourism recreation and
boating local government
low income households elderly households
Fire weather 2030 2050
No. of very high and extreme forest fire risk days (~ 9 days current) ↑ 1 - 2 ↑ 5 - 7
No. of very high and extreme grass fire risk days (~ 95 days current) ↑ 7 - 15 ↑ 9 - 30
up to 34,000 people, mostly in urban fringe, semi-rural areas adjacent to bushland
13,500 residences 185 commercial and
industrial properties 4,500 public use and
unspecified including schools, medical facilities and numerous reserves
568 km of roads
urban fringe, semi-rural and rural areas scattered throughout Shire, especially bushland and adjacent areas
increased damage costs to residential properties health impacts including loss of life and air quality increased emergency service costs stress, social disruption
residential emergency
services local government transport
people living in older housing (in exposed areas)
properties that have not been adequately prepared
low income households
* Key to climate changes: ↑ increase; ↓ decrease; ↔ no significant change. Absence of number next to arrow indicates magnitude of change has not been quantified. ** Based on current (2006) population and projected changes to 2070. *** Subject to uncertainty.

Printed on recycled stock.