Impact of different forms of landuse on the vegetation of ...
164
Impact of different forms of land use on the vegetation of the Southern Kalahari Duneveld DISSERTATION ZUR ERLANGUNG DES DOKTORGRADES DER NATURWISSENSCHAFTEN (DR. RER. NAT.) DER NATURWISSENSCHAFTLICHEN FAKULTÄT III - BIOLOGIE UND VORKLINISCHE MEDIZIN DER UNIVERSITÄT REGENSBURG vorgelegt von Anne Horn geb. Krämer aus Hannover korrigierte und ergänzte Fassung November 2008
Transcript of Impact of different forms of landuse on the vegetation of ...

Impact of different forms of land use on the vegetation of the Southern Kalahari Duneveld
DISSERTATION ZUR ERLANGUNG DES DOKTORGRADES DER NATURWISSENSCHAFTEN (DR. RER. NAT.) DER
NATURWISSENSCHAFTLICHEN FAKULTÄT III - BIOLOGIE UND VORKLINISCHE MEDIZIN DER UNIVERSITÄT REGENSBURG
vorgelegt von Anne Horn geb. Krämer aus Hannover
korrigierte und ergänzte Fassung November 2008

Promotionsgesuch eingereicht am 29. Mai 2007 Die Arbeit wurde angeleitet von Prof. Dr. Peter Poschlod. Prüfungsausschuss Vorsitzender Prof. Dr. Thomas Dresselhaus 1. Prüfer Prof. Dr. Peter Poschlod 2. Prüfer Prof. Dr. Steven Higgins 3. Prüfer Prof. Dr. Christoph Oberprieler Ersatzperson Prof. Dr. Erhard Strohm Kolloquium abgenommen am 26. Juli 2007

Hiermit versichere ich an Eides statt, dass ich diese Arbeit selbstständig angefertigt und keine anderen als die angegebenen Hilfsmittel verwendet habe. Alle wörtlichen oder sinngemäßen Entlehnungen sind deutlich als solche gekennzeichnet. Regensburg, den 4. November 2008 ________________________________
Photo M. Leipold 2006

___________________________________________________________________ contents
Contents Chapter 1 Introduction 1 Chapter 2 100 years of sheep farming in the Southern Kalahari Duneveld – effects on floristic and functional composition of the vegetation 11 Chapter 3 Comparative analysis of sheep and game farming effects on the vegetation in the Southern Kalahari Duneveld 41 Chapter 4 Long-distance dispersal in the Southern Kalahari Duneveld, South Africa and its sensitivity to sheep farming Kalahari 71 Chapter 5 Effects of land use on gene flow between populations of Southern Kalahari Cucurbitaceae: Cucumis africanus L. f. and Citrullus lanatus ssp. lanatus var. caffer (Schrad.) Mansf. 103 Chapter 6 Conclusions & Perspectives 123 Summary 129 Acknowledgements 131 References 133 Appendix 1 Complete species list of all plants found during the vegetation survey 147
Appendix 2 C/N ratio, tannin content, life-span, palatability from literature and signs of grazing damage 151 Appendix 3 Long-distance dispersal potential for different vectors of all tested species 153 Appendix 4 seed and diaspore measurements for all species included in the dispersal experiments 155 Appendix 5 UPGMA dendrograms calculated with Nei’s genetic distances between populations 159

_________________________________________________________ general introduction
Chapter 1
General introduction The Southern Kalahari Duneveld is a dry, extremely open and relatively species poor savanna that only marginally supports livestock farming with droughts frequently threatening the economic survival of the farmers (Leistner 1967, van Rooyen & van Rooyen 1998). Furthermore, the soils and plants are very phosphorous deficient, so that extra nutrients need to be supplied to livestock (Reinach 1961, Thomas & Shaw 1991). However, the area is considered relatively valuable for livestock farming as it is not infested by tsetse flies and the vegetation is classified as “sweetveld” (Leistner 1967, Cooke 1985), meaning that the plants are still palatable in their dry state. The Southern Kalahari is in the regionally unique position of being devoid of natural permanent sources of surface water, so human impacts have been minimal until the beginning of commercial farming about 100 years ago (Denbow 1984, Denbow & Wilmsen 1986, Fourie et al. 1987). As the vegetation in African savannas has co-evolved with a high number of native herbivores since their formation about 2,5 million years ago (Bredenkamp et al. 2002) it was often thought to be highly resilient to grazing. There are various theories about the factors and their relative importance in keeping the balance between the extremes of pure grassland and forest in contemporary savannas, mostly involving the opposing forces of soil water and nutrient content, grazing and fire (e.g. Walker 1987, Sankaran et al. 2005). There is an ongoing debate concerning the magnitude of the impact of livestock farming in savannas in general and in the Kalahari in particular in comparison with abiotic factors (for critical reviews see Hoffman & Cowling 1990, Mace 1991 or Thomas & Twyman 2004). A number of studies, e.g. Biot (1988, 1993), Abel et al. (1987), Abel and Blaikie (1989), Scoones (1990, 1993), Abel (1993), have generated strong evidence, that in much of semi-arid southern Africa, these systems are resilient and productivity decline is negligible or very slow. Sankaran et al. (2005) claim, that in drier areas (< 650 mm mean annual precipitation) fire and herbivory are less important factors for the determination of the woody plant cover, as there is too little water for trees to form a continuous forest. Therefore, seasonal rainfall should have a more important influence on the percentage of woody cover, vegetation composition and condition in semi-arid rangelands (Noy-Meir 1973, Ellis & Swift 1988, Sankaran et al. 2005). While low to intermediate grazing pressure is beneficial to the perennial grasses in stimulating more vigorous growth (Crawley 1983) and improving their nutrient content (Scholes 1990) most recent studies agree that overgrazing leads to veld degradation (e.g. Booysen & Roswell 1983, Frost 1985, Tolsma et al. 1987, Andrew 1988, Perkins & Thomas 1993, Young & Solbrig 1993, Ringrose et al. 1996, Parker & Witkowski 1999, White 2000, Weber et al. 2000, Williams & Albertson 2006). Negative effects of overgrazing are not restricted to plants, but also extend to many animal groups (Tews et al. 2004), with reduced diversity of small mammals or carnivores on overgrazed farms (Bergström 2004, Blaum et al. 2007). In his study of the Southern Kalahari in 1967 Leistner already warned against the destructive effect of livestock farming and predicted serious veld degradation should the then current land
1

_________________________________________________________ general introduction
management techniques be continued. He describes a commonly employed technique, called “maktrap” that involves high numbers of sheep destroying much of the perennial grass cover to produce the low, open vegetation that sheep require. According to Walker et al. (1981) and other authors (Dean et al. 1993, Hoffman et al. 1995, Palmer & van Rooyen 1998, McIntyre & Lavorel 2001), the typical sequence of degradation in a semi-arid savanna starts with a decline in the perennial grass cover, moves through a phase of increasing annual and woody plant cover and may culminate in either completely bare ground or thick scrub (bush encroachment) in extreme cases leading to a severe loss of biodiversity and economical productivity. This final collapse most often happens if drought stress adds to the general situation. This then also leads to increased erosion and changes in soil nutrient content and/or in some cases the accumulation of allelopathic chemicals (Moore & Odendaal 1987, Moore 1989, van Rooyen 2000). This sequence can also be observed spatially, along livestock grazing intensity gradients within single camps with increasing distance from watering points or other foci of animal activity, also called piospheres (Tolsma et al. 1987, Andrew 1988, Perkins & Thomas 1993, Ringrose et al. 1996). Bush encroachment near watering points is a well known phenomenon in many arid areas in general and in the Kalahari in particular (e.g. Skarpe 1986, Tolsma et al. 1987, Perkins & Thomas 1993, Dean & McDonald 1994, and Ringrose et al. 1996). Martens (1971) even reported livestock-related veld degradation as far as 10 km away from the water in Eastern Botswana. Piosphere patterns have also been observed for accumulation of livestock faeces, the resultant increase in soil nutrients near water, soil compaction, percentage of bare ground and degree of defoliation among others (Andrew 1988). Contrastingly, in the Kgalagadi Gemsbok Transfrontier Park there were no obvious piosphere patterns except for the immediate vicinity of the watering point (van Rooyen et al. 1990). Once the final stages of degradation have been reached, regeneration does not occur naturally decades after livestock removal (e.g. Barnes 1979, O’Connor 1991, van Rooyen 2000), which is also supported by modelling studies (Jeltsch et al. 1997b). This stable state is self-reinforced through a number of factors, such as the competitive strength of the encroaching bushes and possible allelopathic effects (Moore & Odendaal 1987, Moore 1989), the low seed-availability due to short seedbank persistence of perennial grasses with large seeds and short dispersal distances (O’Connor 1991, O’Connor & Pickett 1992). Extensive and costly bush clearing and re-seeding methods thus seem to be unavoidable to restore severely degraded veld (Milton & Dean 1995). Most studies, however, have been conducted in more mesic savannas, which are thought to be more sensitive to changing levels of utilisation (e.g. Sankaran et al. 2005), while arid areas are thought to be primarily influenced by seasonal rainfall (van Rooyen et al. 1990, 1994, Fourie et al. 1987). However, a modelling study by Jeltsch et al. (1997b) showed a marked increase in shrub cover around the watering point within a century of currently recommended livestock densities for a savanna with an average annual rainfall of 220mm. This controversy is in urgent need of more information as the different scenarios have vastly different implications on future land use strategies. The sustainability of current land use practices in the Southern Kalahari, therefore, is unclear (e.g. Leistner 1967, Perkins and Thomas 1993, Dougill & Cox 1995) and their impact on the vegetation and biodiversity is complex and has been the subject of a number of studies focussing on various aspects of degradation (e.g. van Rooyen 2000). However, very little exact information is available on the impact of sheep farming (Fourie et al. 1987, van Rooyen 2000), which is the most common land use in the southern-most part of the Kalahari in South
2

_________________________________________________________ general introduction
Africa. Foraging behaviour and food choice of cattle, sheep and mixed antelopes assemblages show significant differences (du Toit 1990, Skinner & Smithers 1990, Owen-Smith 1999). Furthermore, animal behaviour and defecation patterns differ in their impact on soil nutrient transport, with livestock often causing nutrient depletion in the matrix and accumulation around watering points or under trees, where animal rest in the heat of the day (Tolsma et al. 1987, Schlesinger & Pilmanis 1998, Augustine 2003, Feral et al. 2003, Aranibar et al. 2004). While on livestock farms piosphere patterns (Andrew 1988) as well as general veld degradation are wide-spread phenomena, piospheres should generally be less distinct in game areas as game species are more mobile and, in combination of several species, utilise different parts of the vegetation. The actual causes for the observed vegetation responses to livestock farming are not well researched, however, most general theories speculate that feeding and trampling damage weakens palatable species in the competition with unpalatable species to an extent of their complete elimination, especially during droughts (e.g. Walker et al. 1981). However, impacts of livestock farming could also be working through altering processes of plant regeneration or dispersal. For example, changes in available dispersal vectors such as sheep instead of a mix of antelopes for zoochorous plant species or animal behaviour such as sedentary grazing in fenced camps replacing unrestrictedly roaming antelopes could induce vegetation changes by way of altered dispersal patterns. This facet of agricultural land use impact has so far been overlooked in most studies. However, van Rheede van Oudtshoorn & van Rooyen (1999) report that long-distance dispersal is of comparatively little importance for species’ survival in semi-arid and arid regions and little information on dispersal potentials is available in general even though this knowledge would be essential for accurate predictions of the regeneration behaviour of long-term degraded patches with depleted seedbanks (van Rooyen 2000) or species’ mobility during climate change caused habitat shifts. Also, there is no information on whether plants adapted to long-distance dispersal by animals would experience genetic degeneration through reduced gene flow if dispersers are removed or limited in their movement (Ellstram & Eland 1993). Comparative studies (e.g. Hamrick & Godt 1996, Nybom & Bartish 2000, Vekemans & Hardy 2004) report that animal-dispersed species have particularly high levels of gene flow and therefore little spatial structuring in between populations, so if dispersal was limited this is likely to show effects in population genetic structure. This effect is particularly critical for former continuously distributed common species, like most Kalahari species (van Rooyen & van Rooyen 1998), as they are likely to be adapted to high levels of gene flow.
3

_________________________________________________________ general introduction
Many important questions could as yet not be fully resolved and require further scientific attention:
• Does sheep farming in the Southern Kalahari in its current form have a negative impact on the vegetation?
• What are the effects on biodiversity and total perennial grass cover? • How does the magnitude of this impact depend on stocking density? • What factors are important in causing the vegetation change? • What are the plants’ long-distance-dispersal potentials and what are the most
important vectors? • How does land use influence plants’ long-distance dispersal potential? • Are there any effects on gene flow and local genetic diversity? • Can we predict future vegetation changes if current land use techniques are continued? • How can land degradation be prevented? • What are promising methods for vegetation restoration?
Realistically answering these questions is vital for understanding the processes of degradation, regeneration and long-distance migration of plants in this area securing sustainable future land use and restoration planning if the Southern Kalahari is to be kept intact both in terms of biodiversity and productivity. In an attempt to contribute to the resolution of this intricately complex problem we designed and executed this project. Firstly, we conducted a basic vegetation survey over three intermediate to wet years including a total of 18 sheep farms with different stocking levels, representative of the area to determine the current state of the vegetation (chapter 2). During the last year we additionally included five game camps adjacent to sheep camps included in the former survey to compare the impact of sheep and mixed game assemblages onto the vegetation (chapter 3). For this comparison, we also gathered data on feeding damage on all plant species found within the relevées in 2006 on both game and sheep camps. Information on species’ palatability was extracted from the literature as well as experimentally determined for collected plant material of the most common plants through qualifying their C/N ratio and tannin content establishing a relative palatability scale. To study possible alternative causes for the vegetation changes (apart from direct feeding damage and competitive changes between palatable and unpalatable plants), we collected diaspores of most common plants and investigated their long-distance dispersal potential through sheep and antelopes using laboratory simulations and germination trials from collected dung samples (chapter 4). Complementarily, we investigated wind and water dispersal potentials to allow an evaluation of the zoochory potential in comparison with the total long-distance dispersal potentials. Finally, we collected samples of two putatively endozoochorous species, Cucumis africanus L.f. and Citrullus lanatus spp. lanatus var. caffer (Schrad.) Mansf., on a number of farms and repeated the sampling with a similar spatial design in the adjacent national park to then conduct a population genetic analysis comparing gene flow and local genetic diversity in both areas (chapter 5). The last chapter (chapter 6) contains a synthesis of our results in the context of the available literature and consequential predictions on future vegetation change should current conditions and land use techniques prevail, suggestions of alternative land use strategies and recommendation for the restoration of degraded areas. The remainder of this chapter provides an exhaustive description of the study areas to put the following chapters into perspective.
4

_________________________________________________________ general introduction
geography The Kalahari sands stretch from north of the Orange River in South Africa North of the Congo River into Gabon and from Angola to Zimbabwe on an almost flat plateau about 1000 m over sea level (figure 1). They cover 2.500.000 km2, which makes them the largest stretch of sand in the world (Leistner & Werger 1973). The Southern Kalahari has been defined by Leistner (1967) as the extreme West and South-West of the Kalahari and covers an area of 124.000 km2 in South Africa, Namibia and Botswana. It is characterised by stabilised parallel sand dunes, rising to an average of 10 m above the separating dune valleys (dune streets), that are interspersed with ephemeral lakes (pans) and rivers. The region is traversed by four ephemeral rivers, the Nossob and Auob from the North, that meet at Twee Rivieren, and the Molopo and the Kuruman from the East meeting the Nossob at Andriesvale to run westwards until a duneveld blocks the riverbed. In moister geological periods the river continues southwards joining the Orange River (Shaw & Thomas 1996, Deacon & Lancaster 1988). Administratively, the region now belongs to the Mier District of the Siyanda District Municipality of South Africa. The Mier district contains only a few larger settlements, i.e. Rietfontein, Askham, Noenieput, Grootmier and Kleinmier, and has a total population of 6844 people, who mostly depend on livestock farming and state pensions supporting their livelihoods (Siyanda District Municipality Census 2001).
geology & soils, geomorphology The whole of the Southern Kalahari is covered by a layer of red, aeolian sand up to 200 m in depth (Thomas & Shaw 1991), which is highly deficient in nutrients and without any soil structure (Wellington 1955, Dregne 1968, Bergström & Skarpe 1985, Buckley at al. 1987 a,b, Thomas & Shaw 1993). The aeolian sand was piled into parallel longitudinal dunes by the prevailing north-westerly winds during the Pleistocene (1,8 Million to 11.000 years B.P.) resulting in a particle size-differentiation between dune-streets and dune-crests with the sand on the dune crest and slope being coarser and even more nutrient deficient than the sand in the dune streets (Cooke 1985, Thomas & Shaw 1991, van Rooyen 2000). Underneath is a layer of light calcareous sandstone, typically exhibiting a hard crust of limestone at the top (du Toit 1954, van der Merwe 1962). In places where this layer is close to the surface or near pans the overlying sand is lighter in colour and more acidic (Siderius 1972). The primary watertable is more than 100m deep, but Jennings (1974) report a secondary watertable at about 20m depth.
5

_________________________________________________________ general introduction
figure 1: map of the study area including the location of the weather stations
6

_________________________________________________________ general introduction
climate The Southern Kalahari receives most of its rainfall in the late summer and early autumn months with a gradient from 150 mm in the arid South-West to about 300 mm in the slightly moister North-East as the moisture is derived from the Indian Ocean (Leistner 1967). The rainfall is highly variable and unreliable with > 45 % interannual variance and often falls in short, highly localised convectional showers (Leistner 1967) with 50 % of the storms generating less than 10 mm of rain (Pike 1971, Tyson 1986). Temperatures ranges are high from hot summer days and warm nights in January (avg. daily max. 37,4°C/ min. 19,5 °C) to mild winter days and cold nights in June and July (avg. daily max. 22,2 °C/ min. 1,2 °C) with frequent occurrences of frost (van Rooyen 1984). With only very few days of significant cloud cover the total potential evaporation is 21 times higher than the total rainfall (measured near Upington, Thomas & Shaw 1991, Scholes & Walker 2004). Climate change effects for the Kalahari are difficult to foresee with information on tropical and subtropical zones generally being scarce, but nevertheless Joubert et al. (1996) attempt a basic interpretation of the climate models: they predict that mean annual rainfalls are unlikely to change significantly with a declining number of small rainfall events (< 3 mm) and an increase of over 40 % of large rainfall events (> 113 mm). Additionally a decline of drought years was predicted. In contrast to this rather positive scenario newer models predict more detrimental changes, i.e. Hulme’s model (1996) that predicts an increase of evapotranspiration by 4–12 % and thus lower soil water content due to higher expected temperatures. Similarly, Christensen et al. (2007) predict an increase in local temperatures of ca. 3°C and ca. 5% decrease in annual rainfall with a higher frequency of extreme rainfall events
flora Flora and vegetation of the Southern Kalahari have been exhaustively treated by Leistner (1967) and van Rooyen & van Rooyen (1998), so the reader is referred to these sources for further, more detailed information. The flora of the Southern Kalahari is transitional between the Sudano-Zambezian- and the Karoo-Namib floristic region with large woody elements and annual forbs mostly linking to the former and most matrix species to the latter (Werger & Coetzee 1978, Werger 1986). However, the floristic borders in Southern Africa are still being discussed: while Monod (1957), White (1965, 1971, 1983), Barker (1983) and Menaut (1983) support a stronger floristic connection to the Sudano-Zambezian region Volk (1966), Werger (1973, 1978 a,b,c, 1982, 1986), Skarpe (1986) and Westfall & van Staden (1996) argue that the Southern Kalahari should be grouped with the Karoo-Namib-region. Jürgens (1991), however, argues that the Nama-Karoo should be included in the Sudano-Zambezian floristic region, so in this case the Southern Kalahari’s floristic affinities could easily be assigned to the Sudano-Zambezian region. Phytosociologically, the most common plant community in the study area has been classified as Acacia haematoxylon – Centropodia glauca dune field by Lubbinge (1999). Species richness in the Southern Kalahari is comparatively low with 550 species on 120.000 km2 (Gibbs Russell 1987, Cowling et al. 1989) and there are only 8 endemic species, i.e. the natural hybrid Acacia erioloba E. Mey x A. haematoxylon Willd., Helichrysum arenicola M.D. Hend., Hermannia burchelli (Sweet) I. Verd., Kohautia ramosissima Bremek, Neuradopsis austro-africana (Schinz) Bremek. & Oberm., Neuradopsis bechuanensis Bremek. & Schweick., Plinthus sericeus Pax and Stipagrostis amabilis (Schweick.) de Winter.
7

_________________________________________________________ general introduction
Among the trees and shrubs of the Duneveld the Fabaceae are the most important family, with Acacia being the dominant genus. Other common larger woody plants are the shepherd’s tree (Boscia albitrunca (Burch.) Gilg & Ben.) or Lycium L. spp shrubs. The most species-rich families in general are Asteraceae, Poaceae are the Fabaceae (Leistner 1967, van Rooyen & van Rooyen 1998). Important perennial grasses are Stipagrostis CDG Nees spp, Eragrostis Wolf spp and Aristida L. spp, while the annual grass Schmidtia kalihariensis Stent. is the most dominant of the annual grasses (Leistner 1967, van Rooyen & van Rooyen 1998). The various geomorphological units, i.e. dune crests, dune slopes and dune streets, and also the sub-canopy habitat each have their own, clearly distinguishable floristic composition, while all of the typical duneveld communities are distinct from the atypical pan-rim and riverbed flora (Leistner 1967, Leistner 1996).
vegetation The African savannas have existed similar to the current form since the Cenozoic (65 million years B.P., Scott et al. 1996). There are various theories about the factors and their relative keeping the balance between the extremes of pure grassland and forest in contemporary savannas, mostly involving the opposing forces of soil water and nutrient content, grazing and fire (e.g. Walker 1987, Sankaran et al. 2005). In drier areas (< 650 mm mean annual precipitation) fire is a less important factor for the determination of the woody plant cover, as there rarely is enough biomass available to fuel a fire, and, therefore, seasonal rainfall plays a more important role (Sankaran et al. 2005). Savannas are often restricted to areas above 200 to 350 mm of mean annual precipitation (Ellery et al. 1991, Scholes 1997), but as specific soil characteristics of the Kalahari allow for rainwater to penetrate quickly avoiding evaporation and be stored over the calcrete layer, the low level of rainfall can support a savanna vegetation typical for areas with higher rainfall (Scholes 1997). In Acocks (1953) classification of South Africa’s veld types (1953) the Southern Kalahari’s vegetation is classified as “Western Form of Kalahari Thornveld”, an extremely open thorn savanna with hemicryptophytes and therophytes in between the trees and shrubs with a higher tree cover along the dry riverbeds and towards the North-East. The most common vegetation types according to Low & Rebelo (1996) are the thorny Kalahari Dune Bushveld and the shrubby Kalahari Dune Bushveld vegetation types. The Southern Kalahari is part of the Savanna biome as defined by van Rooyen & Bredenkamp (1996 a,b). While the matrix vegetation is mostly characterised by apparently wind-dispersed perennial grasses, the sub-canopy area beneath larger trees provides its own distinct habitat with many nitrophilous annuals and zoochorous perennials (Milton & Dean 1995, Leistner 1996, Dean et al. 1999).
indigenous herbivores The Kalahari is known for its high diversity of large indigenous herbivores (Skinner & Smithers 1990). Common antelopes in conserved areas include the small, solitary common duiker (Sylvicapra grimmia) and steenbok (Raphicerus campestris) and the larger, gregarious Springbok (Antidorcas marsupialis), gemsbok (Oryx gazella), red hartebeest (Alcelaphus buselaphus caama), kudu (Tragelaphus strepsiceros), blue wildebeest (Connochaetes taurinus) and eland (Taurotragus oryx) (SANParks 2007). Under natural conditions, the larger antelopes roam vast areas, following the flush of new growth after good rainfalls when possible (Skead 1980, Skinner et al. 1984), and rarely stay stationary for longer times. Most of them are very drought tolerant and can extract all their water requirements from the plants
8
_________________________________________________________ general introduction
they consume. If unhindered in their movement, they do not overutilise the vegetation (Leistner 1967, du Toit 1990, Skinner & Smithers 1990, Owen-Smith 1999). The Southern Kalahari also has a high number of small herbivorous rodents, especially in the protected areas of the Kgalagadi Transfrontier Park, which play a major role as seed predators for many plant species (Bergström 2004, van Rooyen 2000).
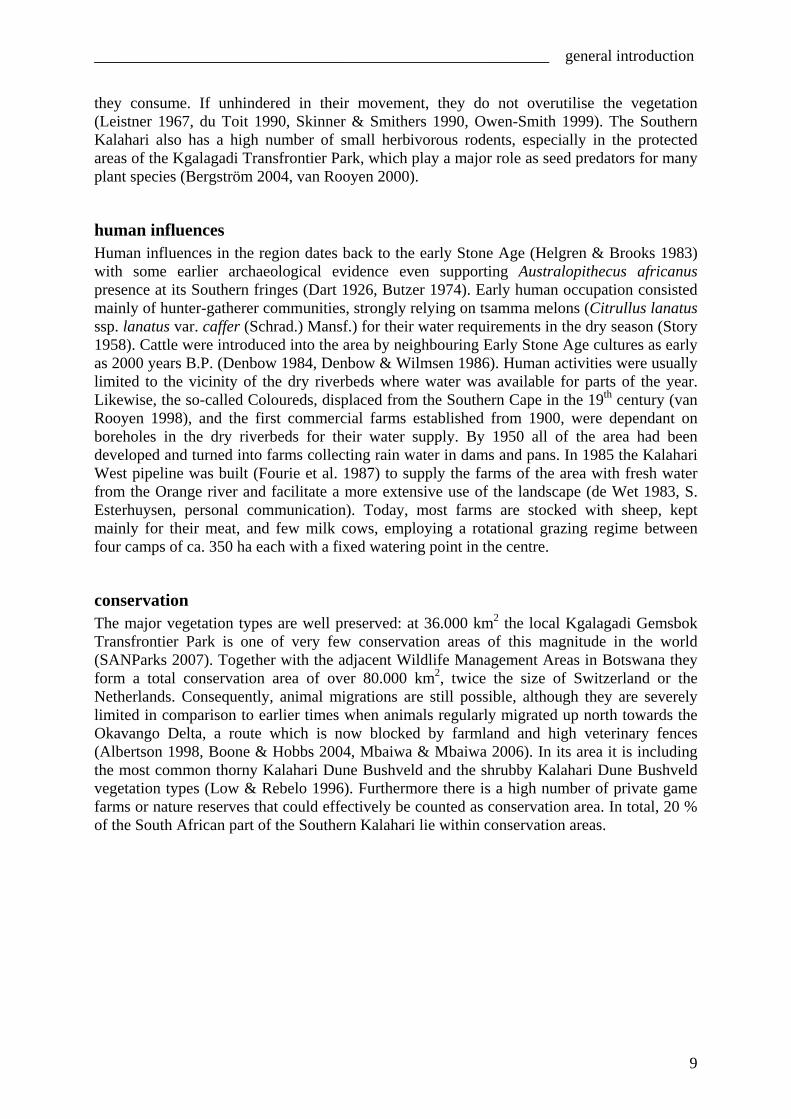
human influences Human influences in the region dates back to the early Stone Age (Helgren & Brooks 1983) with some earlier archaeological evidence even supporting Australopithecus africanus presence at its Southern fringes (Dart 1926, Butzer 1974). Early human occupation consisted mainly of hunter-gatherer communities, strongly relying on tsamma melons (Citrullus lanatus ssp. lanatus var. caffer (Schrad.) Mansf.) for their water requirements in the dry season (Story 1958). Cattle were introduced into the area by neighbouring Early Stone Age cultures as early as 2000 years B.P. (Denbow 1984, Denbow & Wilmsen 1986). Human activities were usually limited to the vicinity of the dry riverbeds where water was available for parts of the year. Likewise, the so-called Coloureds, displaced from the Southern Cape in the 19th century (van Rooyen 1998), and the first commercial farms established from 1900, were dependant on boreholes in the dry riverbeds for their water supply. By 1950 all of the area had been developed and turned into farms collecting rain water in dams and pans. In 1985 the Kalahari West pipeline was built (Fourie et al. 1987) to supply the farms of the area with fresh water from the Orange river and facilitate a more extensive use of the landscape (de Wet 1983, S. Esterhuysen, personal communication). Today, most farms are stocked with sheep, kept mainly for their meat, and few milk cows, employing a rotational grazing regime between four camps of ca. 350 ha each with a fixed watering point in the centre.
conservation The major vegetation types are well preserved: at 36.000 km2 the local Kgalagadi Gemsbok Transfrontier Park is one of very few conservation areas of this magnitude in the world (SANParks 2007). Together with the adjacent Wildlife Management Areas in Botswana they form a total conservation area of over 80.000 km2, twice the size of Switzerland or the Netherlands. Consequently, animal migrations are still possible, although they are severely limited in comparison to earlier times when animals regularly migrated up north towards the Okavango Delta, a route which is now blocked by farmland and high veterinary fences (Albertson 1998, Boone & Hobbs 2004, Mbaiwa & Mbaiwa 2006). In its area it is including the most common thorny Kalahari Dune Bushveld and the shrubby Kalahari Dune Bushveld vegetation types (Low & Rebelo 1996). Furthermore there is a high number of private game farms or nature reserves that could effectively be counted as conservation area. In total, 20 % of the South African part of the Southern Kalahari lie within conservation areas.
9

_________________________________________________________ general introduction
10

__________________________________________ Chapter 2: 100 years of sheep farming
Chapter 2
100 years of sheep farming in the Southern Kalahari Duneveld –
effects on floristic and functional composition of the vegetation
abstract Although negative effects of stock farming have been shown many times for semi-arid savannas, there is still dispute regarding their severity and time-scale, especially for areas on the drier end of the spectrum. This study therefore examines effects of sheep farming in the arid Southern Kalahari Duneveld on vegetation composition, species richness and cover of perennial grasses in correlation with farm age. As the vegetation is heterogenic, we focussed on three distinct characteristic habitats, i.e. the grassy matrix of the interdune streets, the dune-crests and the sub-canopy area of larger trees. All habitats responded to variations in current stocking densities and/ or distance from the watering point (as a substitute of local animal activity) with changes in species’ cover values. Intermediate stocking densities were associated with highest species numbers and cover of perennial grasses in all habitats, except for the grassy matrix habitat where low stocking rates resulted in the highest cover of perennial grasses. Distance from the watering point had no effect in the dune-crest habitat, but in the grassy matrix the area around the watering point had lowest species numbers and cover of perennial plants, while in the sub-canopy this effect extended to intermediate distances. Farm age affected species composition, species numbers and cover of perennial grasses in all habitats, especially in the grassy matrix habitat. This confirms that some effects in this system take relatively long, i.e. over 50 years, to manifest. A comparison with data from an earlier survey of the area by Leistner (1967) corroborated this further, by showing a much higher species richness and higher proportion of hemicryptophytic and succulent species in comparison to this study. A climatic cause for this trend seems unlikely as another current study by van Rooyen & van Rooyen (1998) in the adjacent National Park also reports much higher species numbers and a life-form spectrum resembling that of Leistner (1967).
11

__________________________________________ Chapter 2: 100 years of sheep farming
introduction Savannas in Africa have co-evolved with a broad range of large indigenous herbivores since their formation about 2,5 million years ago (Bredenkamp et al. 2002) and were therefore initially thought to be highly resilient to grazing with about 55% of the herbaceous mass consumed by herbivores (Milchunas & Lauenroth 1993). Nonetheless savannas worldwide are known to be sensitive to overgrazing by livestock, especially in correlation with droughts (e.g. Booysen & Roswell 1983, Frost 1985, Parker & Witkowski 1999, White 2000, Weber et al. 2000). Continuous grazing with high livestock numbers is reported to cause veld degradation through a decrease in palatable grasses, shrub encroachment and an increase of annual forbs and grasses and bare ground (Hoffman et al. 1995, Palmer & van Rooyen 1998, McIntyre & Lavorel 2001). Accordingly, the intensity of grazing is cited as one of the key factors determining the vegetation composition in semi-arid to arid areas together with rainfall, fires and soil nutrient levels (Huntley & Walker 1982, Scholes & Walker 2004, Sankaran et al. 2005). Degradation usually starts around focal points of animal activity, such as watering points, and spreads outwards with continued grazing pressure resulting in characteristic piosphere patterns (Tolsma et al. 1987, Andrew 1988, Perkins & Thomas 1993, Ringrose et al. 1996), which were radiating as far out as 10 km from the watering point in a study from Eastern Botswana, only limited by the maximum mobility of the animals (Martens 1971). This range degradation can be a serious threat to livestock production with critical economical impacts (Buffington & Herbel 1965, Archer 1989, O’Connor 1991, Van Vegten 1983). The Southern Kalahari Duneveld is an extremely open arid to semi-arid savanna. There is no natural permanent surface water, so until the early 1900s human impact was restricted to low numbers of indigenous hunter-gatherer tribes and nomadic pastoralists (Talbot 1961, Denbow 1984, Denbow & Wilmsen 1986, Tietema et al. 1991, Perkins & Thomas 1993). At the end of the 19th century the land was surveyed and soon afterwards the first livestock farms were established along the dry riverbeds with boreholes supplying water to humans and their animals (Dean & MacDonald 1994). By the 1950s the whole area had been developed into farmland and by 1980 most farms had been divided into camps of ca. 350 ha each (S. Esterhuysen, regional agricultural extension officer, personal communication). When a water-pipeline was laid in 1985 livestock numbers increased significantly, especially on the farms at greater distances from the dry riverbeds, where borehole water was not accessible or too saline for stock (Fourie et al. 1987). Throughout the last 100 years, cattle, sheep and goat-farming have been the main sources of income within the region with sheep farming presently the most important and dominant land use (S. Esterhuysen, personal communication). At the same time, numbers of indigenous antelopes were reduced through competition from stock and hunting (Skead 1980). Most studies on savanna degradation were conducted in comparatively more mesic environments and focussed on the effect of cattle on the vegetation (e.g. van Vegten 1983, Skarpe 1990a,b, Fynn & O’Connor 2000, Ringrose 2003). However, mesic systems are likely to react differently than more arid systems (Sankaran et al. 2005). Correspondingly, Jeltsch et al. (1997a) predicted a significant increase of shrub cover near the watering point on livestock farms with 397 mm annual rainfall within 50 years in a modelling study, while a drier scenario with 220 mm annual rainfall did not show clear effects within that time period. When, however, the time span was increased to 100 years, both scenarios showed a significant increase in shrub cover, even under stocking regimes currently advocated by pasture scientists (= 10 livestock units (LSU)/km2). These results were corroborated by
12

__________________________________________ Chapter 2: 100 years of sheep farming
another study (Weber et al. 2000) incorporating combinations of foraging heterogeneity and primary production responses, which predicted effects from stocking densities as low as 5 LSU per km2 under the most realistic factor combinations. Locally, Fourie et al. (1987) report that livestock farming on a local research farm in the Southern Kalahari did not have a deteriorating effect within 30 to 40 years, with climate variability overriding possible effects of grazing. However, van Rooyen et al. (1984) find no evidence of directional trends related to grazing or browsing pressures by indigenous antelopes in the Kgalagadi Transfrontier Park in the North of the study area. Furthermore, Hellden (1991) and Hannan et al. (1991) report only very spatially limited effects of boreholes and no outward growth of this piosphere effect over time in the similarly arid Sahel. While climate clearly is a dominant factor in this water-limited environment (Noy-Meir 1973, Ellis & Swift 1988, Sankaran et al. 2005), severe local veld degradation, especially on older farms along the riverbeds and around watering points is obvious and a correlation to livestock grazing seems probable (Leistner 1967, Dean & MacDonald 1994, Jeltsch et al. 1997a, Palmer & van Rooyen 1998, Illius & O’Connor 1999). This study, therefore, aims to provide an up-to-date overview over the effects of sheep farming and its varying intensities as inferred from stocking rates, duration of grazing (i.e. farm age) and distance to the watering point in comparison to climate factors. Due to the particular animal foraging behaviour and feeding preferences (landowners, personal communication), vegetation responses are likely to differ between habitats and are, therefore, examined separately for three important habitats of the Southern Kalahari, i.e. the typical dune-street grassy matrix community, the sub-canopy habitat underneath the scattered trees and the vegetation of the dune-crests. For this purpose we first present a basic description of all habitat types and then analyse the vegetation patterns in correlation with grazing intensity indicators, i.e. distance from the watering point, stocking densities and farm age.
13

__________________________________________ Chapter 2: 100 years of sheep farming
methods
study area The Southern Kalahari Duneveld, as defined by Leistner (1967), is the South-Western-most part of the Kalahari, West and South of the Nossob riverbed and is characterised by parallel longitudinal sand dunes. The area belongs to the Northern Cape Province of South Africa and therein constitutes most of the former Gordonia district. Three dry riverbeds dissect the duneveld, namely the Auob, the Molopo and the Kuruman, while a large number of pans are distributed over the whole region, all of which originate in the more mesic period of the Pleistocene (Shaw & Thomas 1996, Deacon & Lancaster 1988). Except for the riverbeds and pans, which are not treated in this study, the soil typically consists of a layer of “pink” to “red” oxidised sand without clear soil horizons (Leistner 1967), which can reach up to 200 m in depth (McKee 1979). The sand quality varies from the dune-crest, where it is coarsest and most nutrient-deficient, to the interdune valleys (dune-streets) with finer and slightly more nutrient rich sand (Cooke 1985, van Rooyen 2000). Where an underlying calcrete layer approaches the surface, the sand is lighter (“pink”) and richer in nutrients (Siderius 1972). Rain falls mainly in the summer and autumn months and ranges from an average of 150 mm in the South-West to about 250 mm in the North-East with large interannual and spatial variation as most rain falls during highly localised convectional storms (SA Weather Bureau, email communication). The primary water table is more than 100m deep, but Jennings (1974) report a secondary water table at about 20m of depth. Temperatures are hot in summer, with average daily maximum of 37,4°C in January and mild in the winter with commonly occurring mild frosts (SA Weather Bureau, email communication). The vegetation represents an extremely open thorn-savanna with tufted hemicryptophytic C4-grasses dominating the perennial matrix layer (Ellis et al. 1980). Perennial vegetation cover is significantly higher than could be expected at this low average annual rainfall, but the specific characteristics of the sandy soil, which prevent run-off and evaporation and store water over the calcrete layer, allow for soil moisture status to be much higher than in other areas with similar rainfall amounts (Scholes 1997). In addition high numbers of annuals appear after good rainfalls. The vegetation is classified as “sweetveld” (Tainton 1981, Ellery et al. 1995), which means that most grasses have a relatively high nutritional value even in their dry state. The vegetation composition corresponds with the topographical heterogeneity, with dune-crests, -slopes and -streets forming distinct vegetation types. Furthermore, the sub-canopy area underneath larger trees represent a unique environment with less radiation input, milder temperatures and relatively higher soil water and nutrient content (Perkins & Thomas 1993, Milton & Dean 1995, Leistner 1996). This comparatively favourable environment is due to the effects of shading, rain caught by the tree foliage and channelled down along the trunk and nutrient input through defecating animals, which use the tree as nesting sites or source of shade in the heat of the day. Correspondingly, the sub-canopy area shows a plant community distinct from the surrounding grassy matrix (Leistner 1996). Floristically, the region is a transition zone between the Sudano-Zambesica and Karoo-Namib regions, with trees and grasses mostly belonging to the Sudano-Zambesica while forbs and shrubs often show links to the Karoo-Namib region (e.g. White 1965, 1971, 1983, Werger 1973, 1978 a,b,c, 1982, 1986). Most larger woody plants belong to the genus Acacia Miller, with Boscia albitrunca (Burch.) Gilg & Benedict being the only non-leguminous tree in the area. Most perennial grasses belong to the genera Aristida L., Eragrostis N.M Wolf and Stipagrostis Nees while Schmidtia kalihariensis Stent is the most dominant annual grass.
14

__________________________________________ Chapter 2: 100 years of sheep farming
Floristic composition of herbaceous and small woody plants is more diverse, with a large proportion of Fabaceae. Typical indicators of overutilised veld in the non-calcareous duneveld are the shrubs Rhigozum trichotomum Burch., Acacia mellifera (Vahl) Benth. ssp. detinens (Burch.) Brenan and A. hebeclada DC. and the annual Schmidtia kalihariensis Stent and Tribulus zeyheri Send. as well as large patches of bare ground, especially on the dunes (Leistner 1967).
vegetation survey The survey was conducted over the summer and autumn months between February 2004 and April 2006 including intermediate to extreme seasonal rainfall (figure 1). 16 farms were included with a total of 25 camps (table 1 & figure 2) as non-repetitive, independent samples. In every camp 10 x 10m2 plots were placed along a grazing intensity gradient with increasing distance from the watering point up to 2km for three habitats, i.e. grassy matrix (up to 10 plots per camp), sub-canopy area of trees with crown area > 20m2 (up to 10 plots per camp) and dune crest (3 plots per camp). Grass plots were selected in ca. 0, 10, 20, 40, 80, 160, 320, 640 and 1280m distance from the watering point with an additional plot at the end of the camp or at 2000m. Sub-canopy plots were placed in the vicinity of the respective grass plot where possible, while dune-crest plots were placed in short, intermediate and long distance from the watering point over the whole camp. For every plot species composition was determined and species’ ground cover values in % estimated. The farms were up to 80km from the village of Askham and were established between 1900 and 1960 (table 1). Stocking densities on all farms were well below the recommended 10 LSU per km2 (Fourie et al. 1987). Most farms were fenced into camps of an average of 368ha, but a few farms were still farmed as a single-camp unit. For the statistical analyses, farm age and stocking densities were categorised as follows: farms between from 46 to 66 years were coded as 50 years, while farms between 86 and 106 years were coded as 100 years. Stocking densities were coded as low (1,88–3,51 LSU/km2), medium (3,51–5,13 LSU/km2) and high (> 5,13 LSU/km2).
species identification & coding for analysis Species were preliminary identified with the field guide of van Rooyen (2001), and identifications were confirmed later using the respective taxonomic revisions and herbarium specimen in the Compton Herbarium in Cape Town. Species were coded as either annual or perennial for an average year in the Kalahari and categorized into life-forms (Raunkiaer 1934) using available data from Leistner (1967), van der Walt & le Riche (1999) and van Rooyen (2001) in addition to own observations. A few species found during the vegetation survey could not be identified to species level or categorized into life-forms due to their young age, therefore, not all species detected were included in the analysis. For comparisons of species numbers and life-forms between habitats, and allowing comparison with a study of Leistner (1996), species occurring in several habitats were coded as present in a habitat type only if they exceeded 10% of the cover of the same species in the habitat it was most dominant in, therefore highlighting the distinguishing characteristics between habitats.
15

__________________________________________ Chapter 2: 100 years of sheep farming
table 1: camp description (LSU/km2 = converted large stock units per km2, avg rain = average annual rainfall, rain = seasonal rainfall during the study season) (data extracted from personal communications with the land owners)
camp latitude [S dec]
longitude [E dec]
farm age [years] LSU/km2 avg rain
[mm] rain [mm] camp size [ha]
A 26,51 20,61 96 6,8 160 266 1862 B 26,57 20,44 61 2,1 150 310 2740 C 26,64 20,40 55 2,2 150 310 300 D 26,74 20,62 66 6,2 240 180 2647 E 26,82 20,89 66 3,6 250 420 347 F1 26,91 20,73 105 2,7 180 160 459 F2 26,93 20,77 105 2,7 180 160 450 G1 27,00 20,81 106 2,0 200 300 327 H1 27,00 20,85 88 3,7 175 336 204 I1 27,01 20,66 106 2,2 175 428 448 H2 27,02 20,89 88 3,7 175 234 257 G2 27,02 20,81 106 2,0 200 300 228 H3 27,03 20,84 88 3,7 175 234 149 I2 27,04 20,70 106 2,2 175 428 377 J 27,09 21,07 99 2,3 200 400 245
K1 27,10 20,75 50 1,9 180 180 360 L 27,12 20,40 101 2,3 150 164 500
K2 27,15 20,85 50 1,9 180 180 464 M1 27,24 20,72 46 2,9 200 225 243 M2 27,26 20,71 46 2,9 200 225 252 N1 27,26 20,82 51 3,4 200 220 528 N1 27,36 20,81 51 3,4 200 220 585 O 27,51 21,02 56 2,4 150 300 459 P1 27,57 20,79 59 3,4 150 310 578 P1 27,62 20,72 59 3,4 150 310 344
16

__________________________________________ Chapter 2: 100 years of sheep farming
prec
ipita
tion/
mon
th [m
m]
020406080100
120
140
Jul-0
2Ja
n-03
Jul-0
3Ja
n-04
Jul-0
4Ja
n-05
Jul-0
5Ja
n-06
Upi
ngto
nTw
ee R
ivie
ren
van
Zyls
rus
figure 1: precipitation [mm] from July 2002 to June 2006 from three weather stations around the study area (black boxes at the bottom indicate time of the vegetation survey)
17
__________________________________________ Chapter 2: 100 years of sheep farming
figure 2: map of the Southern Kalahari with farms included in the survey
B A
C
D
E F I G H J
L K
M N
O P
18

__________________________________________ Chapter 2: 100 years of sheep farming
environmental input factors The input factors included in the analysis as potentially relevant for the vegetation are reported and their potential significance explained in table 2: table 2 factors for statistical analyses and their potential significance
input factor significance average rainfall (millimetre/year)
ubiquitously correlated with vegetation composition
seasonal rainfall (millimetre/ year)
highly correlated with vegetation composition in systems with variable rainfall amounts, such as arid systems
longitude (degree) substitute for distance between farms, rainfall gradient, soil gradient, landuse gradients, which are not separately included in the analysis, but which could be affecting the vegetation
latitude (degree) substitute for distance between farms, rainfall gradient, soil gradient, landuse gradients, which are not separately included in the analysis, but which could be affecting the vegetation
farm age (years) potentially correlated with vegetation composition, due to slow reactions in highly stressed and variable systems
distance from the watering point (meter)
substitute for grazing intensity, potentially correlated with vegetation composition
current stocking density (livestock unit/ hectare)
potentially correlated with vegetation composition
output factors The effect of the above-mentioned input factors on vegetation composition, relative species cover, species richness and cover of perennial grasses are analyzed and reported. Species richness was included as an indicator of biodiversity value, while the cover of perennial grasses was included as they are the major life-form in the Kalahari duneveld and of major importance to the landusers in their determination of sheep grazing capacity.
statistical analysis For the multivariate analysis detrended correspondence analysis (DCA) were calculated using PCOrd 5.0 (McCune & Meffert 1999) providing gradient length over two units, to show the plots’ relationship to each other and their correlation with species’ cover values and habitat factors. If length of gradient was below two units, the data set was checked for outliers (plots) and one or a maximum of two plots were removed. If after exclusion of the outliers gradient length was still lower than two units a DCA with rare species weighted down and a Principal Component Analysis (PCA) were calculated. Percentage of variance explained by the axes was calculated using relative Euclidian distances. Only vectors with variance explained over 10% were shown in graphs. Tests for significant correlations and differences between groups were calculated in SPSS 12.0 (SPSS Inc., Chicago, USA) using non-parametric Spearman-Rho correlation for independent samples and either T-tests or Mann-Whitney-U-tests for comparing means of normally distributed and non-normally distributed data respectively.
19

__________________________________________ Chapter 2: 100 years of sheep farming
results A total of 390 plots were examined. Of these 245 were grassy matrix plots, 69 sub-canopy plots and 76 dune-crest plots. The lower number of sub-canopy plots was due to the low density of larger trees (i.e. canopy > 20m2) in the area. A comparatively low number of dune plots were sampled as there was little variation observed between sites in the field. 175 different species were recorded in total, with 138 species on grassy matrix plots, 103 species in the sub-canopy area and 68 species on the dune-crest. In all habitats, Fabaceae and Poaceae were among the three most important families with Liliaceae/ Asparagaceae only among these for grassy matrix plots (table 2). On the dune-crest, Aizoaceae species became relatively more frequent, while sub-canopy plots showed relatively high species numbers of Amaranthaceae, Convolvulaceae and Solanaceae. table 3: representation of the 12 largest families (according to species numbers) for the total study area (the 3 largest families and the three different habitats
total grassy matrix sub-canopy dune-crest number of species 160 110 63 33 % Rank % Rank % Rank % Rank 1,2 10 Aizoaceae 5,6 4 6,1 4 3,2 11 15,2 2 Amaranthaceae 2,5 12 0,9 6,3 4 3 10 Asclepiadaceae 2,5 12 1,8 11 6,1 5 Asteraceae 5 5 5,5 5 4,8 7,5 9,1 3,5 3 12,5 Capperaceae 3,8 7,5 Chenopodiaceae 1,9 0,9 6,1 7,5 Convolvulaceae 3,8 7,5 5,5 6 6,3 4 6,1 7,5 Cucurbitaceae 4,4 6 2,7 9 4,8 7,5 6,1 7,5 Euphorbiaceae 1,9 1,8 12 4,8 7,5 Fabaceae 21,9 1 24,5 1 14,3 1 9,1 3,5 0,9 Liliaceae + Asparagaceae 6,9 3 7,3 3 3,2 11 6,1 7,5 3 12,5 Poaceae 14,4 2 15,5 2 7,9 2 18,2 1 3 12,5 3 12,5 Scrophulariaceae 3,1 10 3,6 8 3,2 11 Solanaceae 3,1 10 6,3 4 Sterculiaceae 3,1 10 4,5 7 4,8 7,5 3 12,5 Zygophyllaceae 1,3 total percentage of 12 largest families 77,7 86,4 77,8 100
20

__________________________________________ Chapter 2: 100 years of sheep farming
Both combined multivariate analyses of species’ cover values as well as presence/absence data showed a clear grouping of the plots from the three separate habitats with tree size, presence/ absence or cover of Schmidtia kalihariensis, the dominant annual grass and Stipagrostis amabilis, the dominant perennial grass on the dune-crest, being separating factors (figures 3 & 4).
figure 3: DCA of all 390 plots with species’ cover values (percentage of variance explained by Axis 1 = 36,2% and Axis 2 = 6,8%, only species and habitat vectors with percentage of variance explained > 10% are shown ) (avg rain = average rainfall, rain = seasonal rainfall, Schm kal = Schmidtia kalihariensis, Stip ama = Stipagrostis amabilis)
figure 4: DCA of all 390 plots with species coded as either present or absent (0/1), percentage of variance explained by Axis 1 = 52% and Axis 2 = 7,2%, only species and habitat vectors with percentage of variance explained > 10 % are shown ) (avg rain = average rainfall, rain = seasonal rainfall, Schm kal = Schmidtia kalihariensis, Stip ama = Stipagrostis amabilis)
21

__________________________________________ Chapter 2: 100 years of sheep farming
Among the habitats included in this study, the dune-crest had the lowest proportion of therophytes, while the grassy matrix habitat was intermediate in this respect and the sub-canopy flora had the maximum relative importance of therophytes (table 4). Hemi-cryptophytes showed the opposite trend, while nanophanerophytes were most common on the dune-crest. Other life-forms showed little variation between habitats.
table 4: extended life-form spectra after Raunkiaer (1934) and Leistner (1996) in percent of species based on presence/ absence of species for the three habitats
life-form total grassy matrix
sub-canopy
dune-crest
succulents 1 0 0 3 Microphanerophytes 2 3 2 3 Nanophanerophytes 13 10 13 23
Chamaephytes 11 12 8 8 Hemicryptophytes 13 13 6 10
Cryptophytes 18 18 15 15 Therophytes 42 45 56 38
grassy matrix In multivariate analysis based on species’ cover values, the distance from watering point was highly correlated with maximum variance on Axis 1, with plots near the watering point typically showing high cover values of Schmidtia kalihariensis and Tribulus zeyheri (figure 5). With increasing distance the plots became more variable, with either Centropodia glauca, Stipagrostis obtusa or S. ciliata becoming more important as indicators for species’ cover values. Species composition (figure 6) correlated more with farm age and average rainfall, with Centropodia glauca being the only important species indicative of species composition
sub-canopy On sub-canopy plots species’ cover values were highly correlated with total cover of perennial grasses/ Stipagrostis ciliata cover and grazing intensity/ Schmidtia kalihariensis cover (figure 7). The age of the farm was also an important determinant, independent on the former factors. Farm age, however, became the most important determinant for species composition of common species, with tree size and distance from watering point as independent secondary indicators (figure 8). Species richness was highly correlated with tree size, distance from watering point and total cover of perennial grasses per plot. Farm age also proved to be an important indicator during a PCA analysis of presence/absence data with species richness being independent of farm age but highly correlated with presence of Schmidtia kalihariensis (figure 9).
dune-crest On dune-crests grazing intensity was the most important indicator of species’ cover values (figure 10), with distance from the watering point also having a high significance. The plots on the upper right hand side of the diagram are almost bare dunes in direct vicinity of the watering point. Cover of Stipagrostis amabilis and total cover of perennial grasses were highly correlated with each other as well as with latitude. The dune-crest plots were the only ones that showed the importance of geographical locality within the sampling area for both species’ cover values as well as species composition (figure 11). Seasonal rainfall as an
22

__________________________________________ Chapter 2: 100 years of sheep farming
important indicator of species composition, but was uncorrelated with species richness and total cover of perennial grasses, while average rainfall showed weak correlations with both.
distance
Aris mer
Cent glaRequ sph
Schm kal
Stip cil
Stip obt
Trib zey
grass
Axis 1
Axi
s 2
year200420052006
figure 5: DCA of all 245 grass plots with species' cover values (percentage of the variance explained by Axis 1 = 36,7% and Axis 2 = 20,2%; only species and habitat vectors > 10% of explained variance are shown) (Aris mer = Aristida meridionalis, Cent gla = Centropodia glauca, distance = distance from watering point, Requ sph = Requienia sphaerosperma, Schm kal = Schmidtia kalihariensis, Stip cil = Stipagrostis ciliata, Stip obt = Stipagrostis obtusa, Trib zey = Tribulus zeyheri)
farm ageavg rain
Cent gla
grass 0/1
Axis 1
Axi
s 2
year200420052006
figure 6: DCA of all 245 grass plots with species scored as either present or absent (0/1), percentage of variance explained by Axis 1 = 18,3% and Axis 2 = 8,0%, only species and habitat vectors with percentage of variance explained > 10% are shown) (avg rain = average rain, Cent gla = Centropodia glauca)
23

__________________________________________ Chapter 2: 100 years of sheep farming
farm age
LSUhacover of perennial grasses
Schm kal
Stip cil
sub-canopy
Axis 1
Axi
s 2
year200420052006
figure 7: DCA of all 69 sub-canopy plots with species' cover values (percentage of variance explained by Axis 1 = 45,8 % and Axis 2 = 20,3%, only species and habitat vectors with percentage of explained variance > 10% are shown) (LSUha = livestock units per hectare, Schm kal = Schmidtia kalihariensis, Stip cil = Stipagrostis ciliata)
figure 8: DCA of all 69 sub-canopy plots with species scored as either present or absent, with rare species weighted down (percentage of variance explained by Axis 1 = 25,0% and Axis 2 = 10,5%, only species and habitat vectors with percentage of variance explained > 10% are shown) (distance = distance from watering point)
24

__________________________________________ Chapter 2: 100 years of sheep farming
figure 9: PCA of all 69 sub-canopy plots with species scored as either present or absent (percentage of variance explained by Axis 1 = 4,0 % and Axis 2 = 0,1 %, only species and habitat vectors with percentage of variance explained > 10 % are shown) (Schm kal = Schmidtia kalihariensis, species = species number per plot)
25

__________________________________________ Chapter 2: 100 years of sheep farming
figure 10: DCA of all 76 dune-crest plots with species' cover values (percentage of variance explained by Axis 1 = 67,4 % and Axis 2 = 5,8 %, only species and habitat vectors with percentage of variance explained > 10% are shown) (distance = distance from the watering point, LSUha = livestock units per hectare, South = latitudinal plot location, Stip ama = Stipagrostis amabilis)
figure 11: DCA of all 76 dune-crest plots with species' cover values (percentage of variance explained by Axis 1 = 26,4 % and Axis 2 = 14,1 %, only species and habitat vectors with percentage of variance explained > 10% are shown) (avg rain = average rainfall, East = longitudinal plot location, rain = seasonal rainfall, South = latitudinal plot location)
26

__________________________________________ Chapter 2: 100 years of sheep farming
species richness and cover of perennial grasses and their patterns Species richness was highest on sub-canopy plots and lowest on dune plots while cover of perennial grasses per plot showed the opposite trend, with highest cover reached on the dune-crests and lowest in the sub-canopy area (figure 12). All habitats were significantly different from each other (T-test or Mann-Whitney-U-test for independent samples, p < 0,001)
figure 12 left: species number per plot for all habitats including 245 grassy matrix plots (average = 11,86), 69 sub-canopy plots (average 15,58) and 76 dune plots (average 9,38) — right: cover of perennial grasses per plot for all habitats including 245 grassy matrix plots (average = 6,82), 69 sub-canopy plots (average = 1,44) and 76 dune-crest plots (average = 6,82)
27

__________________________________________ Chapter 2: 100 years of sheep farming
Species richness and cover of perennial grasses were highly correlated with a number of environmental and land use factors (table 5). Average rainfall was correlated only with species richness and cover of perennial grasses on dune-crest plots, while seasonal rain wasn’t correlated with species number at all, but did show significant correlations with cover of perennial grasses on grassy matrix (positive) and dune-crest plots (negative). Land use duration and intensity as measured in livestock units/km2 and distance from the watering point had strong effects on both species richness and cover of perennial grasses on grassy matrix plots, while sub-canopy plots were only influenced by distance from the watering point and dune-crest plots had significantly lower species numbers on plots subjected to high livestock numbers. table 5: Spearman Rho-correlation of species number per plot and habitat factors (above) and of cover of perennial grasses per plot and habitat factors (below) (* = p < 0,05 and ** = p < 0,01)
avg species number avg rain rain farm age LSU/km2 distance avg cover of
perennial grasses grass n.s. n.s. -0,15* -0,13* 0,30** 0,39**
sub-canopy n.s. n.s. n.s. n.s. 0,40** 0,40** dune 0,29* n.s. n.s. -0,25* n.s. 0,32**
avg cover of
perennial grasses avg rain rain farm age LSU/km2 distance avg species number
grass n.s. 0,29** -0,30** n.s. 0,48** 0,39** sub-canopy n.s. n.s. n.s. n.s. 0,47** 0,40**
dune 0,61** -0,37** n.s. n.s. n.s. 0,32** While species richness on grassy matrix plots increased only to a distance from the watering point of about 160m (figure 13, left), sub-canopy plots showed a more or less constant increase up to distances of 2000m (figure 15, left). On dune-crest plots no correlation of species richness with distance existed (figure 16, left). Cover of perennial grasses increased on grassy matrix plots up to 160 to 320m from the watering point (figure 13, right) with sub-canopy plots showing a similar pattern (figure 15, right) while dune-crests, once again, showed no trend with increasing distance from the watering point (figure 16, right).
28

__________________________________________ Chapter 2: 100 years of sheep farming
figure 13 left: species numbers on grass plots against distance from watering point (7–40 plots per distance category) — right: cover of perennial grasses on grass plots against distance from watering point (7 – 40 plots per distance category)
All common species of perennial grasses showed an increase in average cover with increasing distance from the watering point on grassy matrix plots, whereas the two common annual species Schmidtia kalihariensis and Brachiaria glomerata had their maxima at 20 and 40 m respectively (figure 14). There was neither a significant increase of total cover of perennial grasses, or single perennial species farther than 160 m away from the watering point. figure 14: average cover per plot [%] of common grasses on grassy matrix plots (annuals: Aristida congesta (Aris con), Brachiaria glomerata (Brac glo), Schmidtia kalihariensis (Schm kal); perennials: A. meridionalis (Aris mer), Eragrostis lehmanniana (Erag leh), Centropodia glauca (Cent
gla), Stipagrostis cilata (Stip cil), S. obtusa (Stip obt) and S. uniplumis (Stip uni)) and total cover of perennial grasses
29

__________________________________________ Chapter 2: 100 years of sheep farming
figure 15 left: species numbers on sub-canopy plots against distance from watering point (5-14 plots per distance category) — right: cover of perennial grasses on sub-canopy plots against distance from watering point (5-14 plots per distance category)
figure 16 left: species number per plot on dune-crest plots against distance from watering point (2–21 plots per distance category) — right: cover of perennial grasses per plot und dune plots against distance from watering point (2–21 plots per distance category)
30

__________________________________________ Chapter 2: 100 years of sheep farming
figure 17: average cover per plot - left: typical sub-canopy species (annuals: Acrotome inflata (Acro inf), Amaranthus thunbergii (Amar thu), Setaria verticillata (Seta ver), Cleome gynandra (Cleo gyn), Eragrostis biflora (Erag bif), Hermbstaedtia fleckii (Herm fle) and perennials: Lycium bosciifolium (Lyci bos)) — right: common dune-crest species (annuals: Brachiaria glomerata (Brac glo), Limeum arenicolum (Lime are), Schmidtia kalihariensis (Schm kal) and perennials: Centropodia glauca (Cent gla), Eragrostis lehmanniana (Erag leh), E. trichophora (Erag tri), Orthanthera jasminiflora (Orth jas), Requienia sphaerosperma (Requ sph), Stipagrostis amabilis (Stip ama) and Stipagrostis uniplumis (Stip uni))
Most common typical sub-canopy species showed highest cover values between 80 and 320m from the watering point (figure 17). On dune-crest plots the most dominant plant species, the perennial grass Stipagrostis amabilis, did not show any cover trends with distance while the other characteristic dune grass, i.e. Eragrostis trichophora (Leistner 1967) as well as the annual grasses Brachiaria glomerata and Schmidtia kalihariensis had a maximum cover at 40 to 80m from the watering point. Other typical dune species such as Orthanthera jasminiflora showed less clear responses.
31

__________________________________________ Chapter 2: 100 years of sheep farming
The age of the farm did not show a significant effect on species richness (figure 18, table 6). It did, however, have a significant effect on the cover of perennial grasses, with older farms having significantly higher values on dune-crests and lower cover values in the grassy matrix.
41
figure 18: left: species number per plot on all habitats on 50 and 100 year old farms (number of plots on the bottom) – right: cover of perennial grasses per plot on 50 and 100 year old farms (number of plots on the bottom)
table 6: average species number per plot on all habitats on 50 and 100 year old farms (significant differences between groups tested with T-test for independent samples) and average cover of perennial grasses per plot on all habitats on 50 and 100 year old farms (significant differences between groups tested with Mann-Whitney-U-test for independent samples) (n.s. = not significant)
average species number per plot habitat 50 years 100 years significance T-test
dune-crest 8,93 9,91 n.s. grassy matrix 12,42 11,25 n.s. sub-canopy 15,80 15,41 n.s.
average cover of perennial grasses per plot habitat 50 years 100 years significance U-Test
dune-crest 10,12 13,94 0,018 grassy matrix 9,09 4,31 0,000 sub-canopy 1,51 1,38 n.s.
32
__________________________________________ Chapter 2: 100 years of sheep farming
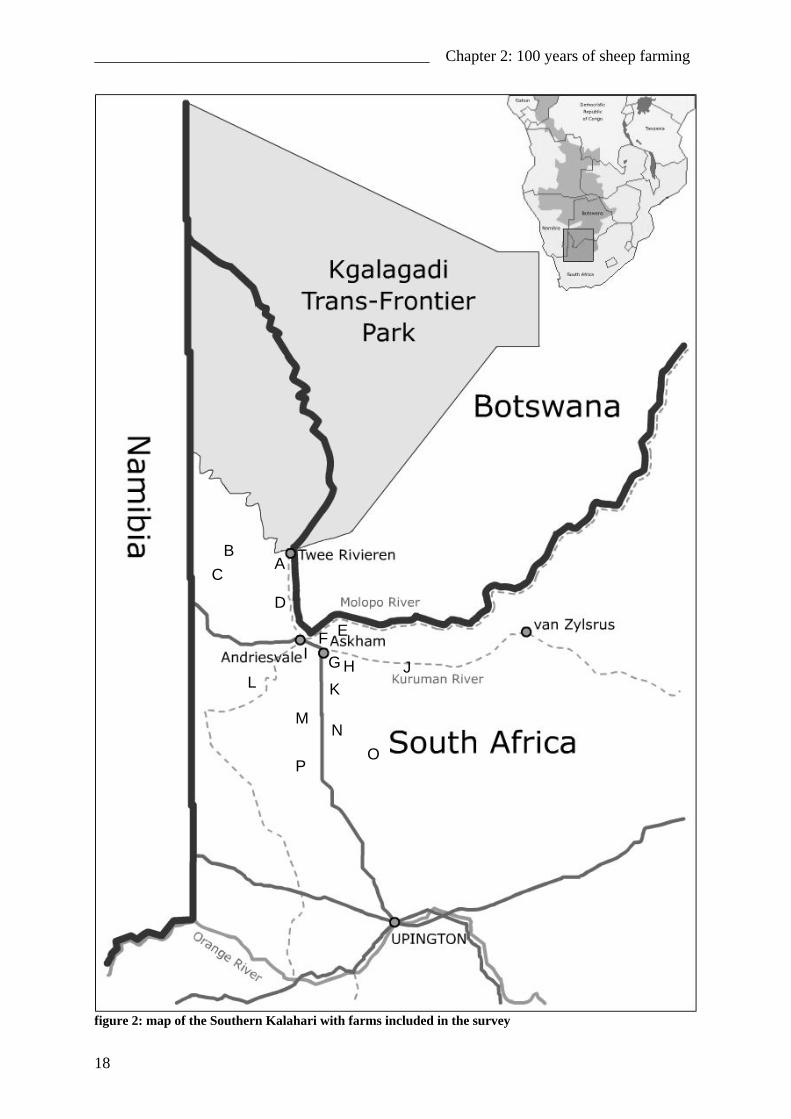
Current grazing intensity measured in converted livestock units per km2 did have marked effects on species richness and cover of perennial grasses (figure 19 & table 7). While species numbers were generally highest under intermediate and lowest under high grazing intensity, cover of perennial grasses showed habitat specific responses. While dune-crests and sub-canopy plots had highest cover values under intermediate grazing intensity, cover of perennial grasses was highest under low grazing intensity.
figure 19 left: species number per plot in all habitats with low (1,88–3,51 LSU/km2) to high (5,13–6,76 LSU/km2) grazing intensity (number of plots on the bottom) — right: cover of perennial grasses [%] per plot on all habitats with low (1,88 – 3,51 LSU/ km2) to high (5,13 – 6,76 LSU/ km2) grazing intensity (number of plots on the bottom)
table 7: averages of species numbers per plot against grazing intensity (T-test for significant differences between groups) and average cover of perennial grasses per plot against grazing intensity (Mann-Whitney-U-test for significant differences between independent samples)
average species number significance T-test habitat low medium high low - medium medium - high low – high
dune-crest 9,53 12,5 5,88 0,036 0,002 0,003 grassy matrix 11,78 13,32 7,20 n.s. 0,001 0,003 sub-canopy 14,62 18,61 9 0,014 n.s. n.s.
average cover of perennial grasses significance U-test
habitat low medium high low - medium medium - high low - high dune-crest 12,26 14,33 7,13 n.s. n.s. n.s.
grassy matrix 7,51 4,35 4,40 0,001 n.s. 0,043 sub-canopy 1,39 1,65 0,10 n.s. n.s. n.s.
33

__________________________________________ Chapter 2: 100 years of sheep farming
discussion The combined multivariate analysis of all habitats showed a clear floristic distinction between the three of them. The dune-crest plots were associated with a high cover of Stipagrostis amabilis, the dominant perennial grass occurring on all but the most degraded dunes. Grassy matrix plots were separated from sub-canopy plots along a gradient of Schmidtia kalihariensis cover, with grassy matrix plots associated with low to intermediate cover values and sub-canopy plots with high cover of S. kalihariensis. This confirms S. kalihariensis status as an indicator of overgrazing (Leistner 1967) as it corresponds to the degree of animal activity in these habitats. table 8: representation of the 12 largest families (according to species numbers) for the study area including Duneveld, rivers and pans (Leistner ’67, van Rooyen & van Rooyen 1998) and Duneveld only (this study) (the 3 largest families for any study shaded in grey)
whole Southern Kalahari Southern Duneveld Leistner ‘67 van Rooyen & van
Rooyen 1998 this study
number of species 438 498 160 % Rank % Rank % Rank Aizoaceae 4,3 6 6,5 5 5,6 4 Amaranthaceae 2,3 10,5 2,5 10,5 2,5 12 Asclepiadaceae 2,0 2,8 8,5 2,5 12 Asteraceae 11,9 2 14,3 1 5 5 Capperaceae ? ? 3,8 7,5 Chenopodiaceae 2,3 10,5 2,8 8,5 1,9 Convolvulaceae ? ? 3,8 7,5 Cucurbitaceae 2,5 8 2,5 10,5 4,4 6 Euphorbiaceae 2,3 10,5 2,3 12 1,9 Fabaceae 7,8 3 11,1 2 21,9 1 Liliaceae + Asparagaceae 6,2 4 7,3 4 6,9 3 Poaceae 14,6 1 10,6 3 14,4 2 Scrophulariaceae 4,8 5 4,0 6 3,1 10 Solanaceae 2,0 1,8 3,1 10 Sterculiaceae 2,7 7 3,0 7 3,1 10 Zygophyllaceae 2,3 10,5 1,5 1,3 total percentage of 12 largest families 69,7 64,0 77,7
The vegetation survey yielded a total floristic composition resembling other studies from the area on the family level with Fabaceae and Poaceae being among the three most species rich families (Leistner 1967, van Rooyen & van Rooyen 1998). Asteraceae species were comparatively rarer in our study, instead the combined Liliaceae/ Asparagaceae and Aizoaceae were relatively more species rich than in the other studies. This difference is most probably related to different growth forms, with Liliaceae/ Asparagaceae and Aizoaceae surviving the dry season as either bulbs or seeds, so they are not affected by grazing. While the grassy matrix had a higher proportion of Liliaceae/ Asparagaceae, the dune-crest had a higher ratio of Aizoaceae species, which could have something to do with the mobile soils of the dunes that could easily cover bulbs with too much sand to reach the surface. The floristic composition of the sub-canopy habitat contained no clearly dominant families other than the Poaceae and Fabaceae, but shows distinct differences to Acock’s data as reported in Leistner (1996). Their most species rich family, the Asteraceae only reaches rank 7,5 among the most species-rich families in our study, while their third most species-rich family, the Asclepiadaceae are not represented at all in the sub-canopy area in our study.
34

__________________________________________ Chapter 2: 100 years of sheep farming
table 9: representation of the 12 largest families (according to species numbers) for the single habitats within the Duneveld (the families with a rank < 4 for any habitat are shaded in grey)
grassy matrix sub-canopy dune-crest this study Leistner ‘96 this study this study number of species 110 134 63 33 % Rank % Rank % Rank % Rank Acanthaceae 1,2 10 3,7 8 0 0 Aizoaceae 6,1 4 1,5 3,2 11 15,2 2 Amaranthaceae 0,9 4,5 6,5 6,3 4 3,0 10 Asclepiadaceae 1,8 11 6,7 3 0 6,1 5 Asteraceae 5,5 5 15,6 1 4,8 7,5 9,1 3,5 Boraginaceae 0 ? 0 3,0 12,5 Chenopodiaceae 0,9 2,2 11 1,6 6,1 7,5 Convolvulaceae 5,5 6 ? 6,3 4 6,1 7,5 Cucurbitaceae 2,7 9 5,2 5 4,8 7,5 6,1 7,5 Euphorbiaceae 1,8 12 0 4,8 7,5 0 Fabaceae 24,5 1 0 14,3 1 9,1 3,5 Lamiaceae 0,9 5,2 4 1,6 0 Liliaceae + Asparagaceae 7,3 3 3 9 3,2 11 6,1 7,5
Malvaceae 0,9 2,2 11 0 0 Neuradaceae 1,8 13 ? 0 3,0 12,5 Pedaliaceae 1,8 14 ? 0 Poaceae 15,5 2 14,9 2 7,9 2 18,2 1 Polygonaceae 0,9 ? 0 3,0 12,5 Portulacaceae 1,8 15 ? 1,6 3,0 12,5 Scrophulariaceae 3,6 8 2,2 11 3,2 11 0 Solanaceae 0 4,5 6,5 6,3 4 0 Sterculiaceae 4,5 7 2,2 4,8 7,5 3,0 12,5 total percentage of 12 largest families 86,4 69,9 77,8 100
Instead, our study reports a relatively high number of Fabaceae, that were conspicuously absent in Leistner (1996) or studies by Bews (1917) and Mostert (1958), who reported on more mesic savannas east of the Duneveld. Leistner (1996), in agreement with Mostert (1958), speculates, that the absence of Fabaceae in the sub-canopy area in these studies could be explained by their high light requirements. He further contemplates the role of the higher soil nitrogen levels in this context. As some annual forbs in the Central Kalahari have been found to be capable of nitrogen fixation (Aranibar et al. 2004) and related Southern Kalahari species could, therefore, also be nitrogen-fixers, these species would have a competitive advantage in the nitrogen-deficient matrix soils, but not in the sub-canopy area. However, the abundance of legume species in the sub-canopy area in our study contradicts these hypotheses. It would be interested in this context to evaluate nitrogen-fixing ability of leguminous forbs in the area. Our total species numbers of 175 as well as average species richness per plot with 9,38 on the dune-crest, 11,86 in the grassy matrix and 15,58 in the sub-canopy area, were relatively low in comparison with other local studies, e.g. Leistner (1967) report a total of 438 plant species with averages of 22,8 species on 100 m2 plots on the dune-crest and 32,1 species in the grassy matrix. This would partially be explained by the potentially wider range and larger area of sampling by Leistner (1967) and van Rooyen & van Rooyen (1998), possibly including not only the winter annual flora and larger section of the rainfall gradient but also a larger topographical and edaphic variation. However, it could also indicate a species pauperisation in the sheep farming area in comparison to the earlier study of Leistner or the study in the
35

__________________________________________ Chapter 2: 100 years of sheep farming
protected area by van Rooyen & van Rooyen (1998). This latter interpretation is supported by the shifts in vegetation composition and reduced species richness with farm age observed in this study (see below). table 10: extended life-form spectra after Raunkiaer (1934) and Leistner (1996) in percent of species based on presence/ absence of species for the three habitats in comparison to other studies
life-form all habitats grassy matrix sub-canopy dune-
crest
Leistner ‘67
van Rooyen & van
Rooyen 1998
this study
this study
Leistner ‘96
this study
this study
succulents 2 1 1 0 9 0 3 Microphanerophytes 3 1 2 3 2 2 3 Nanophanerophytes 8 7 13 10 7 13 23
Chamaephytes 12 15 11 12 6 8 8 Hemicryptophytes 34 31 13 13 47 6 10
Cryptophytes 8 13 18 18 1 15 15 Therophytes 33 31 42 45 28 56 38
In accordance to the studies of Leistner (1967) and van Rooyen & van Rooyen (1998) our study shows the typical life-form spectrum of an arid area with a high importance of therophytes and cryptophytes, but a much lower proportion of hemicryptophytic species in accordance to their putative higher grazing sensitivity (table 10). Especially the sub-canopy habitat shows signs of intense grazing with an extremely high proportion of therophytes and cryptophytes with few hemicryptophytes. In contrast, the grassy matrix shows relatively fewer therophytes and cryptophytes and a higher proportion of hemicryptophytes, while the dune-crests show an intermediate spectrum for these life-forms and a high proportion of nanophanerophytes. This distribution could be attributed to a relative grazing intensity gradient, with highest grazing intensity in the sub-canopy area. However, soil characteristics such as soil mobility and soil-water content, both of which are relatively high on the dunes, probably also play a role in this context. Functional types of grasses change with distance from the watering type with annual species like Schmidtia kalihariensis being replaced by a range of perennial grass species, i.e. Centropodia glauca, Stipagrostis ciliata or Stipagrostis obtusa, at greater distances. This is consistent with trends found in regional piosphere studies (Tolsma et al. 1987, Andrew 1988, Perkins & Thomas 1993, Ringrose et al. 1996) or in grassy eucalypt woodlands in Australia (McIntyre & Lavorel 2001) that also report an increase of annual grasses with higher grazing intensities. In a comparison of the sub-canopy habitat with the study by Leistner (1996) our sub-canopy habitat, once again, shows a relatively higher number of therophytic and cryptophytic species, which could, once again, be interpreted as either higher grazing pressure or a more arid location in comparison with Leistner’s (1996) study. Another difference between sub-canopy life-form spectra was the absence of succulents in our study, which were relatively important in Leistner (1996). Succulents often have a shallow root system, which can be easily exposed by sand movements (Leistner 1967) and would, therefore, benefit from the firmer soils in the sub-canopy area (Leistner 1996). However, the only succulents found during our study grew on the dune-crests under Stipagrostis amabilis. Perhaps, the grazing and especially trampling intensity in our study area was too high to allow succulent persistence. In agreement with our initial hypothesis the vegetation did respond to sheep farming and varying forms thereof: Floristic composition changes with farm age and is mostly unaffected
36

__________________________________________ Chapter 2: 100 years of sheep farming
by both distance from the watering point and current stocking density in all habitats, which indicates that sensible species have been lost all over the camp and that this trend is likely to be irreversible. These results correspond well with the modelling study by Jeltsch et al. (1997a), which predicted habitat degradation in arid areas only after more then 50 years. In contrast, species richness and species cover values per plot, generally reacts to both distance from the watering point and current stocking densities, so that lowering high stocking densities is likely to result in an increase of species richness and cover of grazing sensitive species over time in degraded areas. In spite of these general trends, the three habitats are not equally sensitive to landuse factors (table 11). table 11 vegetation characteristics significantly affected by landuse factors in the different habitats habitat farm age distance from watering
point current stocking density
grassy matrix
floristic composition species richness cover of perennial grasses
species cover values species richness cover of perennial grasses
species richness cover of perennial grasses
sub-canopy
floristic composition species cover values
floristic composition species richness cover of perennial grasses
species cover values species richness
dune crest
floristic composition cover of perennial grasses
species cover values species cover values species richness
Through shifts in vegetation composition 100 year old farms seem to have lost some of the grazing sensitive rare or small grassy matrix species that occur on 50 year old farms, causing a total reduction in species richness, with few species entering the system. In contrast, most common or large species have not experienced significant changes in that time. An exception to this trend are the perennial grasses that on 100 year old farms have less than 50% of the cover observed on 50 year old farms. However, similar to the perennial grasses, most other common or large species react to distance from the watering point, indicating their sensitivity to extreme grazing pressure. These extreme grazing pressures also cause a general decrease in species richness in the vicinity of the watering point. These effects are restricted to the area of less than 160m away from the watering point, this is equivalent to the “sacrifice zone” stipulated by Jeltsch et al. (1997b) and slightly lower than the 200m found to be extremely degraded by Tolsma et al. (1987) for slightly more mesic sites in Botswana. Current stocking density does not affect floristic composition or cover values, as recovery rates of formerly intensely grazed areas are slow. Nonetheless, both species richness and cover of perennial grasses are positively affected by intermediate to lower stocking rates. In the sub-canopy area there are significant shifts in vegetation composition from young to old farms, which have, however, not lead to a reduction is species richness. This means, that grazing tolerant species must have increased in numbers and cover values over that time, while more sensitive species disappeared. On sub-canopy plots, species richness and cover of perennial grasses was likewise increasing with distance, with perennial grass cover reaching and holding its maximum, once again, at 160m, while species richness increased up to the end of the gradient. As most common sub-canopy species reached their maximum average cover at low to intermediate distances from the watering point, it can be concluded that the continued increase of species richness at higher distances is caused by relatively rare, grazing intolerant species. Farm age did not play a significant role in determining species richness and cover of perennial grasses in the sub-canopy habitat, but stocking density showed a correlation with species richness peaking at intermediate levels, while cover of perennial grasses was not significantly affected. Farm age
37
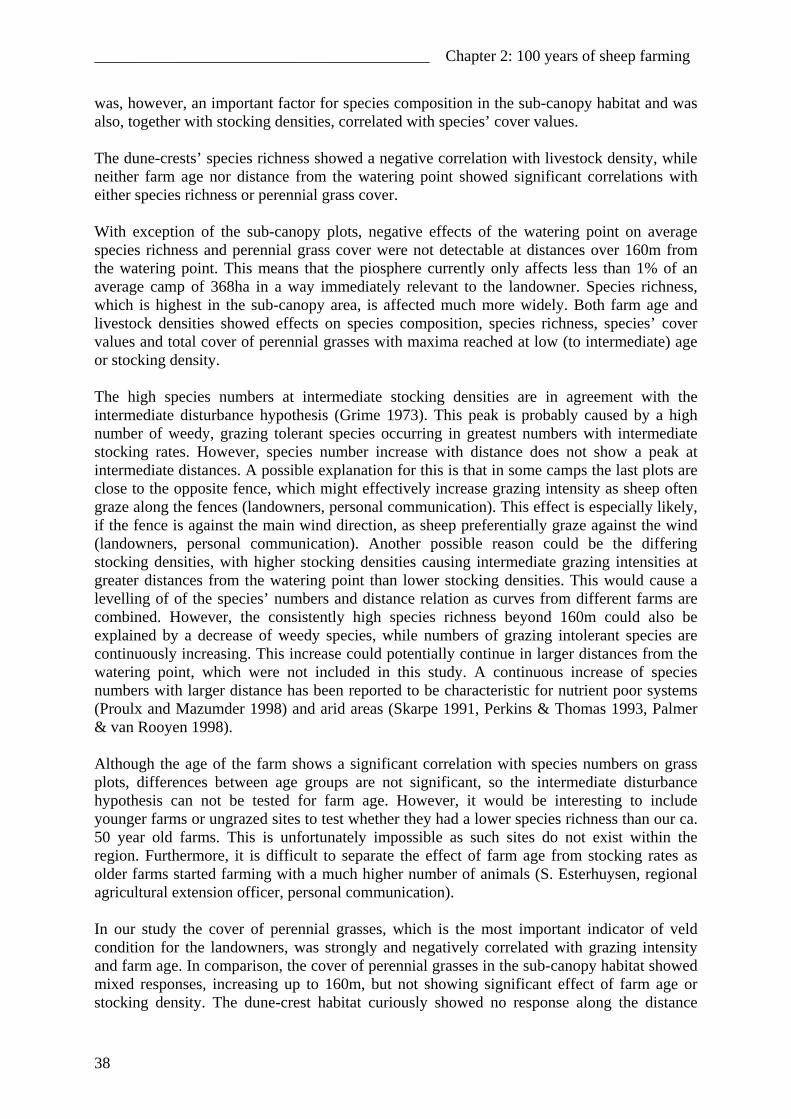
__________________________________________ Chapter 2: 100 years of sheep farming
was, however, an important factor for species composition in the sub-canopy habitat and was also, together with stocking densities, correlated with species’ cover values. The dune-crests’ species richness showed a negative correlation with livestock density, while neither farm age nor distance from the watering point showed significant correlations with either species richness or perennial grass cover. With exception of the sub-canopy plots, negative effects of the watering point on average species richness and perennial grass cover were not detectable at distances over 160m from the watering point. This means that the piosphere currently only affects less than 1% of an average camp of 368ha in a way immediately relevant to the landowner. Species richness, which is highest in the sub-canopy area, is affected much more widely. Both farm age and livestock densities showed effects on species composition, species richness, species’ cover values and total cover of perennial grasses with maxima reached at low (to intermediate) age or stocking density. The high species numbers at intermediate stocking densities are in agreement with the intermediate disturbance hypothesis (Grime 1973). This peak is probably caused by a high number of weedy, grazing tolerant species occurring in greatest numbers with intermediate stocking rates. However, species number increase with distance does not show a peak at intermediate distances. A possible explanation for this is that in some camps the last plots are close to the opposite fence, which might effectively increase grazing intensity as sheep often graze along the fences (landowners, personal communication). This effect is especially likely, if the fence is against the main wind direction, as sheep preferentially graze against the wind (landowners, personal communication). Another possible reason could be the differing stocking densities, with higher stocking densities causing intermediate grazing intensities at greater distances from the watering point than lower stocking densities. This would cause a levelling of of the species’ numbers and distance relation as curves from different farms are combined. However, the consistently high species richness beyond 160m could also be explained by a decrease of weedy species, while numbers of grazing intolerant species are continuously increasing. This increase could potentially continue in larger distances from the watering point, which were not included in this study. A continuous increase of species numbers with larger distance has been reported to be characteristic for nutrient poor systems (Proulx and Mazumder 1998) and arid areas (Skarpe 1991, Perkins & Thomas 1993, Palmer & van Rooyen 1998). Although the age of the farm shows a significant correlation with species numbers on grass plots, differences between age groups are not significant, so the intermediate disturbance hypothesis can not be tested for farm age. However, it would be interesting to include younger farms or ungrazed sites to test whether they had a lower species richness than our ca. 50 year old farms. This is unfortunately impossible as such sites do not exist within the region. Furthermore, it is difficult to separate the effect of farm age from stocking rates as older farms started farming with a much higher number of animals (S. Esterhuysen, regional agricultural extension officer, personal communication). In our study the cover of perennial grasses, which is the most important indicator of veld condition for the landowners, was strongly and negatively correlated with grazing intensity and farm age. In comparison, the cover of perennial grasses in the sub-canopy habitat showed mixed responses, increasing up to 160m, but not showing significant effect of farm age or stocking density. The dune-crest habitat curiously showed no response along the distance
38
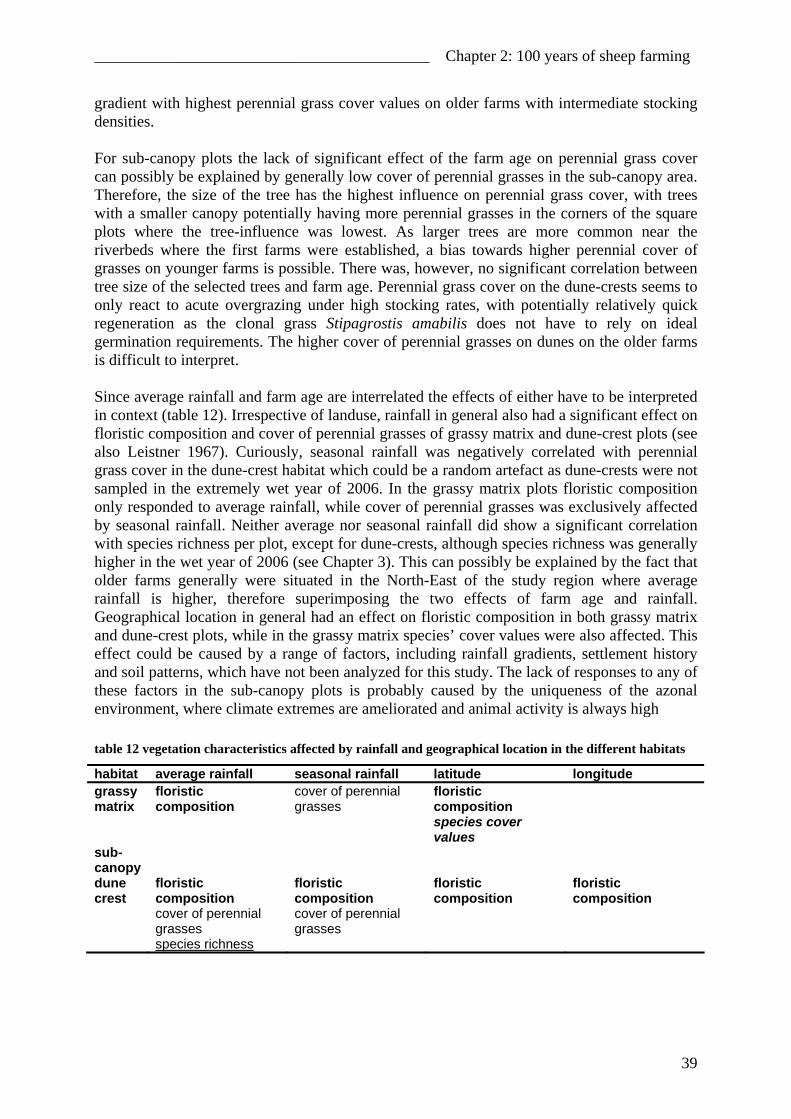
__________________________________________ Chapter 2: 100 years of sheep farming
gradient with highest perennial grass cover values on older farms with intermediate stocking densities. For sub-canopy plots the lack of significant effect of the farm age on perennial grass cover can possibly be explained by generally low cover of perennial grasses in the sub-canopy area. Therefore, the size of the tree has the highest influence on perennial grass cover, with trees with a smaller canopy potentially having more perennial grasses in the corners of the square plots where the tree-influence was lowest. As larger trees are more common near the riverbeds where the first farms were established, a bias towards higher perennial cover of grasses on younger farms is possible. There was, however, no significant correlation between tree size of the selected trees and farm age. Perennial grass cover on the dune-crests seems to only react to acute overgrazing under high stocking rates, with potentially relatively quick regeneration as the clonal grass Stipagrostis amabilis does not have to rely on ideal germination requirements. The higher cover of perennial grasses on dunes on the older farms is difficult to interpret. Since average rainfall and farm age are interrelated the effects of either have to be interpreted in context (table 12). Irrespective of landuse, rainfall in general also had a significant effect on floristic composition and cover of perennial grasses of grassy matrix and dune-crest plots (see also Leistner 1967). Curiously, seasonal rainfall was negatively correlated with perennial grass cover in the dune-crest habitat which could be a random artefact as dune-crests were not sampled in the extremely wet year of 2006. In the grassy matrix plots floristic composition only responded to average rainfall, while cover of perennial grasses was exclusively affected by seasonal rainfall. Neither average nor seasonal rainfall did show a significant correlation with species richness per plot, except for dune-crests, although species richness was generally higher in the wet year of 2006 (see Chapter 3). This can possibly be explained by the fact that older farms generally were situated in the North-East of the study region where average rainfall is higher, therefore superimposing the two effects of farm age and rainfall. Geographical location in general had an effect on floristic composition in both grassy matrix and dune-crest plots, while in the grassy matrix species’ cover values were also affected. This effect could be caused by a range of factors, including rainfall gradients, settlement history and soil patterns, which have not been analyzed for this study. The lack of responses to any of these factors in the sub-canopy plots is probably caused by the uniqueness of the azonal environment, where climate extremes are ameliorated and animal activity is always high
table 12 vegetation characteristics affected by rainfall and geographical location in the different habitats
habitat average rainfall seasonal rainfall latitude longitude grassy matrix
floristic composition
cover of perennial grasses
floristic composition species cover values
sub-canopy
dune crest
floristic composition cover of perennial grasses species richness
floristic composition cover of perennial grasses
floristic composition
floristic composition
39

__________________________________________ Chapter 2: 100 years of sheep farming
40
conclusions & perspectives Altogether, currently intermediate stocking densities seem to have a negative effect on the veld condition in general, as inferred from the cover of perennial grasses. This trend can be expected to aggravate over time. Vegetation sensitivity to grazing differs between habitats with only the sub-canopy habitat increasing in species richness with distances from the watering point over 160m. However, it would be interesting to examine areas in larger distances from the watering point or areas that have not been grazed, such as the road verges, to test whether an increase of species richness can be observed, especially for rare, grazing intolerant species as could be expected from studies in more mesic habitats (Proulx and Mazumder 1998, Skarpe 1991, Perkins & Thomas 1993, Palmer & van Rooyen 1998). If veld condition is to be sustained in the long-term, we, therefore recommend to lower stocking densities even below the 5 LSU per km2 that Weber & Jeltsch (2000) found to be the sustainable in their modelling study using the most critical combination of variables. Otherwise, cover of perennial grasses and numbers of grazing-intolerant species are likely to decrease, which could constitute a practically irreversible process as many restoration studies have shown (Moore & Odendaal 1987, O’Connor 1991, van Rooyen 2000) A confounding factor in predicting future vegetation developments is the role of future effects of climate change in Southern Kalahari region: while Joubert et al. (1996) predicted slightly higher rainfalls with less variability, most other studies are more pessimistic (Hulme 1996, Rutherford et al. 1999, Christensen et al. 2007) predicting that average annual rainfall will decrease with a higher general variability and a higher frequency of extreme weather events in this already highly variable environment. As droughts aggravate the effect of overgrazing (e.g. Booysen & Roswell 1983), the vegetation could therefore become increasingly sensitive. Furthermore, the climate zone appropriate for Stipagrostis amabilis, the dominant perennial grass on the dunes acting as the most important stabiliser of the sand, is predicted to shift completely out of the Southern Kalahari by 2050 (Rutherford et al. 1999b). This would also constitute a critical problem for the currently stable dunes, which is even more severe as overgrazing by itself results in increasing amounts of bare sand. Consequently, dunes are predicted to become more prone to re-mobilisation, especially with increasing wind speeds expected during extreme weather events (Thomas et al. 2005).
_________________________ Chapter 3: Comparative analysis of sheep and game farming
Chapter 3
Comparative analysis of sheep and game farming effects on the
vegetation in the Southern Kalahari Duneveld
abstract Game farming in the Kalahari is commonly seen as a potentially economical way of using degraded veld while it is recovering. At provincial level, game farms are even considered to be conservation areas. Although there are indications from other areas that these functions could be fulfilled, very little is known about the impact of game farming on the vegetation and its potential recovery in the Kalahari. We therefore undertook to study the vegetation on game camps of various ages in comparison to adjacent sheep camps. Species richness of perennial plants increased with distance from the watering point in both sheep and game camps, while annual species richness increased only on sheep camps. The vegetation composition on grassy matrix plots changed with increasing distance on both sheep and game plots. Perennial grasses generally increased with distance, while sheep camps also showed an increase of grazing tolerant tall woody plants, perennial forbs and shrubs with distance. C/N ratios were generally high, while tannin content was low in all plants with little variation. There was no indication of animal feeding preferences in regard of these factors, nor were there any clear differences between sheep and game camps. Furthermore, our results showed no significant differences between average plots on sheep and game camps, but sheep camps had stronger gradients in species composition and cover values with increasing distance from the watering point. In comparison, the vegetation on game camps was generally more strongly correlated with farm age and seasonal or average rainfall. Game farming seems to be an effective way to restore degraded vegetation in the study area. However, these effects are likely to vary strongly with stocking rate and game species composition and can not be seen as a quick veld improvement measure since vegetation response is slow and depends strongly on rainfall.
41

_________________________ Chapter 3: Comparative analysis of sheep and game farming
introduction The currently dominant livestock farming in the arid to semi-arid Acacia savanna of the Southern Kalahari has been reported to have a negative, long-lasting effect on the vegetation through shrub encroachment or loss of palatable perennial species, especially around watering points and when stocking rates are high (Leistner 1967, Walker 1981, Andrew 1984, Able & Blaikie 1989, O’Connor & Roux 1995, Perkins 1996, Harrison & Shackleton 1999, Thomas et al. 2000, Jeltsch et al. 1997, Chapter 2). Therefore this form of land use is unlikely to be sustainable in the long-term even with the low stocking rates currently recommended by pasture scientists (reported in Jeltsch et al. 1997, van Rooyen 2000). To insure the sustainable provision of livelihoods for the local population, to prevent further degradation of the landscape and restore already degraded patches, alternative land use strategies are being developed. Among these, game farming is regarded as one of the most promising options (Cooke 1985, Barnes 1998). As antelopes are indigenous to the area, game farming is considered to be more sustainable and also less susceptible to the frequent droughts, parasites and diseases. Furthermore, it is thought to be profitable use of land too degraded for economical sheep farming as antelopes utilise the vegetation differently from livestock (du Toit 1990, Skinner & Smithers 1990, Owen-Smith 1999) and are potentially better adapted to digest food with higher levels of secondary defensive compounds (Robbins et al. 1987) that often dominate overgrazed systems. Consequently, game farming has become an increasingly popular alternative or supplement to livestock farming, generating income through game-viewing, hunting tourism and biltong (jerky) hunting (Eloff 2002, Reilly et al. 2003, Saltz et al. 2004). Foraging behaviour and food choice of cattle, sheep and mixed antelopes assemblages show significant differences (du Toit 1990, Skinner & Smithers 1990, Owen-Smith 1999). Furthermore, animal behaviour and defecation patterns differ in their impact on soil nutrient transport, with livestock often causing nutrient depletion in the matrix and accumulation around watering points or under trees, where animal rest in the heat of the day (Tolsma et al. 1987, Schlesinger & Pilmans 1989, Augustine 2003, Feral et al. 2003, Aranibar et al. 2004). Moreover, seed dispersal potentials by sheep and native antelopes differ strongly both in respect of plant species and total numbers of seeds being dispersed (Chapter 4). While on livestock farms piosphere patterns (Andrew 1988) as well as general veld degradation are wide-spread phenomena (see above), piospheres should generally be less distinct in game areas as game species are more mobile and, in combination of several species, utilise different parts of the vegetation (du Toit 1990, Skinner & Smithers 1990). Compatibly, the studies by Smet & Ward (2005, 2006) report a decrease of soil nutrient gradients near watering points as well as a recovery of the vegetation on former cattle ranches within 10 years of game farming in an Acacia savanna with 388 mm average annual precipitation. However, there are also a few studies that report negative impact of game on the vegetation in semi-arid areas: e.g. Parker & Witkowski (1999) and Trash (2000), who describe piosphere patterns and degradation of the herbaceous vegetation in a private nature reserve and the neighbouring Kruger National Park with Acacia savanna at 419 mm average annual precipitation. More arid areas like the Kgalagadi Gemsbok Transfrontier Park or the Central Kalahari Game Reserve typically show less distinct piosphere pattern (van Rooyen et al. 1994, Makhabu et al. 2002). Very little information is available on vegetation responses to game farming on former livestock farms and its restoration potential, especially for arid areas or the Southern Kalahari. Notwithstanding the current scarcity of information, game farms are often included with nature reserves as effective conservation areas in general reports (e.g. Siyanda District Municipality Census 2001). This information, however, would be necessary to assess the
42

_________________________ Chapter 3: Comparative analysis of sheep and game farming
effects of game farming on veld condition and biodiversity as well as its sustainability in the future. Our study, therefore, is aiming to contribute to fill this gap of knowledge for former sheep farms in the Southern Kalahari Duneveld, comparing piosphere gradients strengths and vegetation composition in sheep and game camps. We hypothesise, that game farming on former sheep camps in the Southern Kalahari Duneveld would result in an improvement of veld condition in comparison with neighbouring sheep camps that are still in use, both in terms of total vegetation and piosphere gradient strength. The vegetation’s responses could manifest as changes in species composition, total and relative species cover, proportion of palatable or grazing sensitive species and shifts in life-form composition, e.g. between annual and perennial species. Vegetation changes are likely to depend highly on plant palatability and herbivore preferences, which in turn are influenced by plant C/N ratio (Mattson 1980) and condensed tannin content among other factors (Cooper & Owen-Smith 1985, Robbins et al. 1987). Therefore, an impact of the herbivore shift on the vegetation’s C/N ratio and tannin content and their gradients is likely. Testing these hypotheses, we conducted a vegetation survey on five game and neighbouring sheep camps along a grazing gradient with increasing distance to the watering point, determining species composition and species’ cover values as well as grazing damage. To detect possible piosphere differences on an even more basic level, we further analysed all common plants for their C/N ratio and tannin contents and related these to palatability information from the literature and our own data on grazing damages.
43

_________________________ Chapter 3: Comparative analysis of sheep and game farming
methods
study area The study area is situated within the Duneveld of the Southern Kalahari, in the former Gordonia district of the Northern Cape Province of South Africa between 25-28°S and 20-23°C East (figure 1). The major topographical feature of this region are the long, red sand dunes parallel to the dominant wind direction, that are dissected by a few dry riverbeds and interspersed with a number of pans. The soils of the duneveld are pre-dominantly nutrient poor oxidised sands without distinct soil horizons, and an underlying layer of calcrete in varying depth (Cooke 1985, Thomas & Shaw 1991). Summers are hot with day temperatures reaching over 40°C and mild nights (20-25°C), while the winter days are mild with occasional night frost. Average precipitation ranges between 150 mm in the Southwest and 250 mm in the Northeast of the region with most of the rain falling during thunderstorms in the summer and early autumn months (SA Weather service, email communication). While in the years 2004 and 2005 precipitation was close to average, rainfall in year 2006 was extraordinarily high with up to 450 mm of rain. The landscape is an open savanna or bushveld with sparsely scattered Acacia erioloba, A. haematoxylon and Boscia albitrunca trees and a matrix of clumped grasses mainly consisting of Stipagrostis, Aristida and Eragrostis spp. The vegetation in the sub-canopy area of the trees and the areas around the watering points is distinctly different from the matrix in the dune streets with a higher proportion of shrubs and herbaceous species in these habitats (Chapter 2). The study area does not have natural permanent water sources, therefore, until 50 to 100 years ago, large herbivore and in particular human impact was comparatively low as water independent indigenous antelope species only exerted very low grazing pressure Denbow 1984, Denbow & Wilmsen 1986). In the early 1900s the first farms were established in the area, using borehole water from the superficially dry riverbed as well as rainwater that was collected in dams (Fourie et al. 1985). By the 1950s the whole region had been claimed as farmland and in 1985 a pipeline was built from the Orange River into the Kalahari that allowed for an intensification of livestock farming (Fourie et al. 1985). Nowadays most people farm with Dorper sheep as well as low numbers of cattle, with only a few farms focusing entirely on game farming or devoting a part of the farm to this purpose (S. Esterhuysen, regional agricultural extension officer, personal communication). Larger antelopes stocked in varying numbers in the game camps of the farms included in the study were springbok (Antidorcas marsupialis), red hartebeest (Alcelaphus buselaphus), gemsbok (Oryx gazella), blesbok (Damaliscus dorcas), impala (Aepyceros melampus), kudu (Tragelaphus strepsiceros), black Wildebeest (Connochaetes gnu), eland (Taurotagus oryx) and giraffe (Giraffa camelopardalis). Furthermore, there were naturally occurring smaller antelopes like steenbok (Raphicerus campestris) and common duiker (Sylvicapra grimmia).
44

_________________________ Chapter 3: Comparative analysis of sheep and game farming
A
B C D
E
figure 1: map of the study region with the location of the farms included in this chapter
45

_________________________ Chapter 3: Comparative analysis of sheep and game farming
vegetation survey The vegetation survey was conducted in the vicinity of Askham during March and April 2006 on five farms (figure 1, table 1) with one sheep and one game camp in direct vicinity of each other. Plots were placed in the grassy matrix with increasing distance from watering point (0, 10, 20, 40, 80, 160, 320, 640, 1280 and > 2000 m, coded as distance class 1 to 10). Sub-canopy plots were placed as near to the grassy matrix plots as possible if there were large trees with canopy sizes over 20 m2 present. Plots size in both habitats was 10 x 10 m2. For every plot species composition and estimated species ground cover in % were noted. Additionally, we determined the occurrence of signs of grazing damage in every plot.
table 1: information on the farms included in the vegetation survey (LSU/ ha = livestock units per hectare)
age rain LSU/ ha farm farm game camp avg 2006 sheep game
A (North) 66 6 250 420 0,056 0,066 B (West) 101 11 150 164 0,022 0,062
C (Centre) 80 13 180 360 0,037 0,034 D (East) 99 26 200 400 0,023 0,071
E (South) 46 23 150 300 0,023 0,044
species identification & categorization Species were preliminary identified with the field guide of van Rooyen (2001), and identifications were confirmed later using the respective taxonomic revisions and herbarium specimen in the Compton Herbarium in Cape Town. Species were coded as either annual or perennial for an average year in the Kalahari and categorized into life-forms (Raunkiaer 1934) using available data from Leistner (1967), van der Walt & le Riche (1999) and van Rooyen (2001) in addition to own observations.
leaf material collection Leaf-material of 41 of the most common plant species of the herb and shrub layer was collected parallel to the vegetation survey from several locations and air-dried in the field. There are few poisonous plants in the area, but these rarely reach significant cover values, so none of them were included in the analyses.
carbon/ nitrogen ratio The dried plant material was pulverised with a Retsch-Mill (Retsch MM 301: 2 steel balls in a 2 ml Eppendorf tube, 2 times 1 min at 30 oscillations/ min) until fully homogenised. 2 to 5 mg samples of the pulverised leaf material were analysed with a Vario EL II elemental analyser and the carbon and nitrogen content determined.
tannin content For the determination of the tannin content we followed the method developed by J. Heilmann (unpublished). 1 g of the leaf sample was dried at 100 – 105 °C for 2 hours and the dry weight loss determined. 200 mg of the dried, roughly crushed leaf material was boiled for 15 minutes in 40 ml methanol/ water-solution (18:42) and after cooling topped up with another 50 ml of the methanol/ water-solution. 20 ml of this solution was filtered, of which only the second 10 ml was used for further steps. 5 ml of the filtrate was mixed with 25 ml of an acetate-buffer-solution (pH 5,1) and topped up with 20 ml of water (solution 1). 20 ml of this solution was
46

_________________________ Chapter 3: Comparative analysis of sheep and game farming
separated and thoroughly shaken with an added 100 mg of Casein for one hour and subsequently filtered (solution 2). 5 ml of both solutions were mixed with 2 ml of Folin’s reagent (phospho-18-tungstic acid), 20 ml of water and topped up with 23 ml sodium carbonate-solution (10,6%) (solution 1a and 2a). A possible occurrence of suspended particles was removed by centrifugation. The photometric tannin content determination was calibrated with gallic acid. For this purpose, the acid was first dried for 2 hours at 80°C and the dry weight loss was determined. 50 mg of the dry gallic acid was dissolved in 50 ml water and topped up with 50 ml of acetate-buffer-solution (pH 5,1). 0,5 ml of this solution were mixed with 2 ml of Folin’s reagent, 20 ml of water and topped up with 27,5 ml sodium-carbonate solution (10,6%). For the blank sample 2,5 ml acetate-buffer-solution (pH 5,1), 2 ml of Folin’s reagent and 22,5 ml water were topped up with 23 ml sodium-carbonate solution (10,6%). After 40 minutes the absorption of all samples was measured at 720 nm in a 1 cm cuvette and related to the blank sample. The tannin content was then determined with the following formula: (absorption (solution 1a) - absorption (solution 2a)) * 5000 * m (gallic acid) tannin content = ------------------------------------------------------------------------------------------- m (sample) * absorption (gallic acid a) * (100 – dry weight loss (sample))
palatability Plant palatability was calculated as frequency of grazing damage in all plots in which the species was found. In addition to our own data we used palatability data from the literature (e.g. Leistner 1967, van der Walt & le Riche 1999, van Rooyen 2001,) as well as farmers’ observations (personal communication).
47

_________________________ Chapter 3: Comparative analysis of sheep and game farming
data analysis All results were analyzed for possible correlations which each other and a number of environmental input factors (table 2). table 2 factors for statistical analyses and their potential significance
input factor significance average rainfall ubiquitously correlated with vegetation composition (millimetres/year) seasonal rainfall highly correlated with vegetation composition in systems with
variable rainfall amounts, such as arid systems (millimetres/ year) longitude (degree) substitute for distance between farms, rainfall gradient, soil
gradient, landuse gradients, which are not separately included in the analysis, but which could be affecting the vegetation
latitude (degree) substitute for distance between farms, rainfall gradient, soil gradient, landuse gradients, which are not separately included in the analysis, but which could be affecting the vegetation
farm age (years) potentially correlated with vegetation composition, due to slow reactions in highly stressed and variable systems
camp type (sheep or game)
potentially correlated with vegetation composition
game camp age (years) (= 0 for sheep camps)
potentially correlated with vegetation composition, due to slow reactions in highly stressed and variable systems,
distance from the substitute for grazing intensity, potentially correlated with vegetation composition watering point (meter)
current stocking density potentially correlated with vegetation composition (livestock unit/ hectare) Statistical data analysis was performed in SPSS 12.0 (SPSS Inc., Chicago, USA) using multivariate and non-parametric test-methods, i.e. Spearman Rho-correlations and Mann Whitney U- or Wilcoxon Z-tests for significant differences between groups of either independent or paired samples respectively. Multivariate analyses were performed in PCOrd 5.0 (McCune & Meffert 1999), doing a detrended correspondence analysis (DCA).
48

_________________________ Chapter 3: Comparative analysis of sheep and game farming
results The survey included a total of 100 10 x 10m2 grassy matrix plots on either sheep and game camps and 26 and 33 10 x 10 m2 sub-canopy plots underneath trees with canopy sizes over 20m2 respectively. The lower sub-canopy plot numbers are due to the general scarcity of larger trees out of the dry riverbeds and their vicinity.
species richness Total species numbers were slightly higher on game camps with 100 plant species, with only 95 plant species on sheep camps. This difference was mostly due to a slightly higher total perennial plant species richness on grassy matrix plots (figure 2). Sub-canopy plots were generally more species rich than grassy-matrix plots and contained more species on sheep camps than on game camps. For annual plants game camps had higher average species number per plot on sub-canopy plots, whereas perennial species were more numerous on sheep camps in both habitats. However, none of the differences were significant. Total species numbers for either annual or perennial plant species were generally slightly higher on game camps in both habitats, except for annuals, that were more numerous on sub-canopy plots in sheep camps.
figure 2: species numbers on grassy matrix and sub-canopy plots for game and sheep camps for all species (left) and for annual and perennial species separately (right), total species number are given in the boxes below
carbon/nitrogen ratio & tannin content Within the analysed plant species carbon/nitrogen ratios (C/N) ranged from 6,93 in the thorny sub-canopy shrub Lycium bosciifolium to 68,11 in the perennial dune grass Stipagrostis amabilis (table 3). The perennial grasses of the genera Eragrostis, Stipagrostis and Centropodia, which are regarded as valuable grazing plants, have the five highest C/N ratios among the tested species. The lowest C/N ratios were found in the sub-canopy habitat, in the thorny shrubs of the genus Lycium and the annuals Amaranthus thunbergii, Cucumis africanus and Cleome gynandra. Tannin contents are generally low and range from no tannin detectable in half of all tested species to 0,69 %. The most tannin “rich” species were the annuals Oxygonum delagoense, Indigofera alternans, Chenopodium opulifolium and Hermbstaedtia fleckii and the perennial creeper Acanthosycios naudinianus.
49

_________________________ Chapter 3: Comparative analysis of sheep and game farming
table 3: C/N ratios and tannin content for the 41 analysed plant species
compound life-span average median st dev
min species max species
annuals 2,48 2,34 1,03 0,86 Bulbostylis hispidula
Amaranthus thunbergii 4,23
N perennials 2,15 2,19 1,42 0,63 Stipagrostis
amabilis Lycium
bosciifolium 5,59
Cleome gynandra
Crotalaria sphaerocarpa annuals 37,30 37,29 3,35 31,73 44,5
C Cucumis africanus
Fabaceae sp30 perennials 39,48 41,02 4,95 26,64 47,32
annuals 18,53 16,76 9,95 8,05 Amaranthus thunbergii
Bulbostylis hispidula 45,17
C/N perennials 29,56 18,5 21,13 6,93 Lycium
bosciifolium Stipagrostis
amabilis 68,11
annuals 0,18 0,07 0,32 0 many 0,69 Hermstaedtia fleckii tannin
perennials 0,13 0 0,2 0 many 0,68 Acanthosycios naudinianus
C/N ratios were higher on average for perennial plants (figure 3), but differences between both life-span groups were not significant (Mann-Whitney-U-test). Likewise, differences in tannin content between lifespan groups are not significantly different, but in this case tannin content was higher in annual plants. There was no significant correlation between C/N ratio and tannin content, e.g. both Amaranthus thunbergii and Lycium bosciifolium, exhibiting the lowest and highest C/N ratio respectively, had no detectable tannin content.
figure 3: C/N ratio (left) and tannin content [%] (right) for all annual and perennial plants (Acan nau = Acanthosycios naudinianus, Bulb his = Bulbostylis hispidula, Brac glo = Brachiaria glomerata, Herm fle = Hermbstaedtia fleckii, Herm tom = Hermannia tomentosa)
50
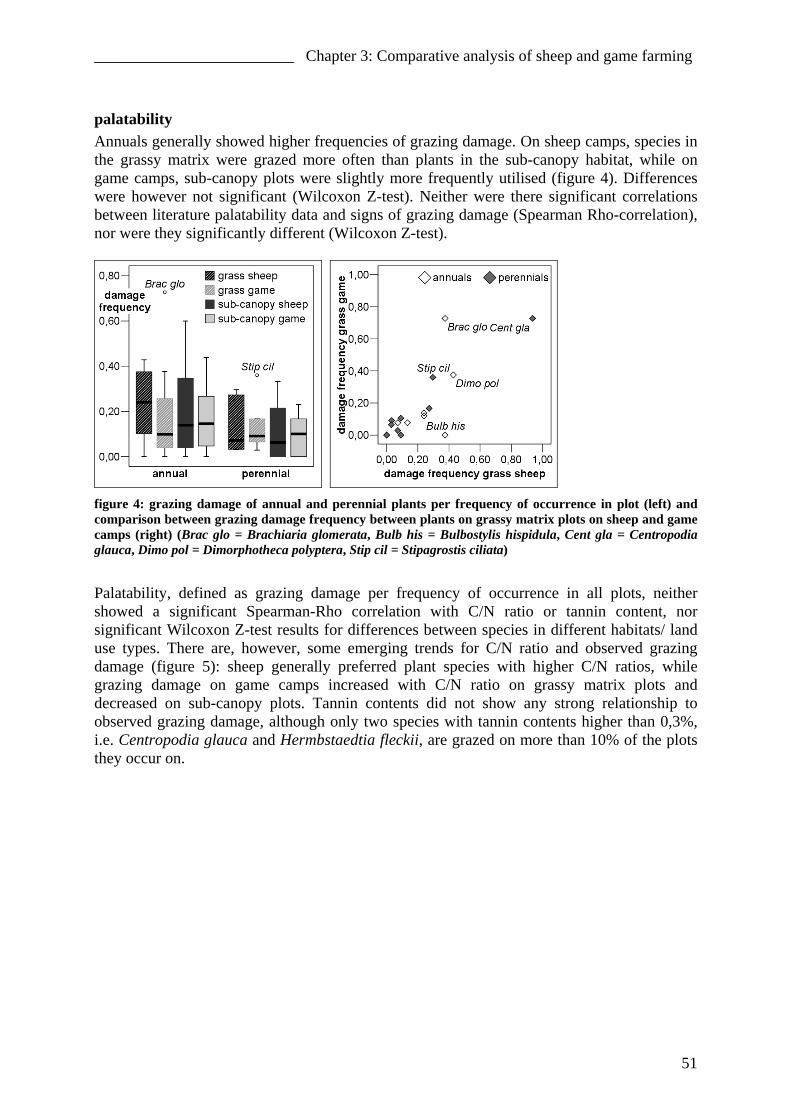
_________________________ Chapter 3: Comparative analysis of sheep and game farming
palatability Annuals generally showed higher frequencies of grazing damage. On sheep camps, species in the grassy matrix were grazed more often than plants in the sub-canopy habitat, while on game camps, sub-canopy plots were slightly more frequently utilised (figure 4). Differences were however not significant (Wilcoxon Z-test). Neither were there significant correlations between literature palatability data and signs of grazing damage (Spearman Rho-correlation), nor were they significantly different (Wilcoxon Z-test).
figure 4: grazing damage of annual and perennial plants per frequency of occurrence in plot (left) and comparison between grazing damage frequency between plants on grassy matrix plots on sheep and game camps (right) (Brac glo = Brachiaria glomerata, Bulb his = Bulbostylis hispidula, Cent gla = Centropodia glauca, Dimo pol = Dimorphotheca polyptera, Stip cil = Stipagrostis ciliata)
Palatability, defined as grazing damage per frequency of occurrence in all plots, neither showed a significant Spearman-Rho correlation with C/N ratio or tannin content, nor significant Wilcoxon Z-test results for differences between species in different habitats/ land use types. There are, however, some emerging trends for C/N ratio and observed grazing damage (figure 5): sheep generally preferred plant species with higher C/N ratios, while grazing damage on game camps increased with C/N ratio on grassy matrix plots and decreased on sub-canopy plots. Tannin contents did not show any strong relationship to observed grazing damage, although only two species with tannin contents higher than 0,3%, i.e. Centropodia glauca and Hermbstaedtia fleckii, are grazed on more than 10% of the plots they occur on.
51

_________________________ Chapter 3: Comparative analysis of sheep and game farming
matrix
0
20
40
60
80
100
0 20 40 60 80C/N
graz
ing
freq
uenc
y [%
]sheep game sub-canopy
0
20
40
60
80
100
0 20 40 60 80
C/N
graz
ing
freq
uenc
y [%
]
sheep game
Amar thuCent glaCent gla
Cent glaBrac glo
sub-canopy
0
20
40
60
80
100
0 0,2 0,4 0,6 0,8
tannin content [%]
graz
ing
freq
uenc
y [%
]sheep gamematrix
0
20
40
60
80
100
0 0,2 0,4 0,6 0,8tannin content [%]
graz
ing
freq
uenc
y [%
]
sheep game
Amar thuCent gla Cent gla
Cent gla Brac glo
Herm fle
figure 5: grazing frequency against C/N and tannin content [%] for grassy matrix and sub-canopy plots on sheep and game camps (Amar thu = Amaranthus thunbergii, Brac glo = Brachiaria glomerata, Cent gla = Centropodia glauca, Herm fle = Hermbstaedtia fleckii)
52

_________________________ Chapter 3: Comparative analysis of sheep and game farming
distance from watering point & species numbers Species numbers generally increased with distance from the watering point (figures 6 & 7). This trend, however, was not found among annual plants on game camps.
matrix annuals
R2 = 0,01
R2 = 0,21**
0
5
10
15
20
25
1 10 100 1000 10000distance [m]
spec
ies
num
bers
game sheepgame sheep
sub-canopy annuals
R2 = 0,01R2 = 0,18**
0
5
10
15
20
25
1 10 100 1000 10000distance [m]
spec
ies
num
bers
game sheepgame sheep
figure 6: species number against distance for annual plant species on grassy matrix (above) and sub-canopy plots (below) (Pearson correlation coefficient: explained variation R2, ** = p < 0,01)
53

_________________________ Chapter 3: Comparative analysis of sheep and game farming
matrix perennials
R2 = 0,21** R2 = 0,16**
0
5
10
15
20
25
1 10 100 1000 10000distance [m]
spec
ies
num
bers
game sheepgame sheep
sub-canopy perennials
R2 = 0,21**R2 = 0,16**
0
5
10
15
20
25
1 10 100 1000 10000distance [m]
spec
ies
num
bers
game sheepgame sheep
figure 7: species numbers against distance for perennial plant species on grassy matrix (above) and sub-canopy plots (below) (Pearson correlation coefficient: explained variation R2, ** = p < 0,01)
distance from watering point & vegetation composition On grassy matrix plots within sheep camps, relative cover of annual grasses decreased with distance from the watering point, with perennial grasses, perennial forbs and dwarf shrubs (mainly Hermannia tomentosa and Requienia sphaerosperma) as well as woody plants (mainly Rhigozum trichotomum) gaining in relative importance (figure 8). On game camps no strong increase of perennial shrubs and forbs was found. Relative cover of annual grasses in greater distances from the watering point was much higher on game camps than on sheep camps, but cover of perennial grasses increased similarly to the sheep camps.
54

_________________________ Chapter 3: Comparative analysis of sheep and game farming
grass - sheep
0%
20%
40%
60%
80%
100%
1 2 3 4 5 6 7 8 9 10
distance class
% o
f tot
al c
over
grass - game
0%
20%
40%
60%
80%
100%
1 2 3 4 5 6 7 8 9 10
distance class%
of t
otal
cov
er
tall woody plantperennial grassperennial forb & shrubannual grassannual forb
figure 8: relative cover of tall woody plants, perennial grasses, perennial forbs and shrubs, annual grasses and annual forbs against distance from watering point (distance class) on grassy matrix plots (distance classes 1 = 0m, 2 = 10m, 3 = 20m, 4 = 40m, 5 = 80m, 6 = 160m, 7 = 320m, 8 = 640m, 9 = 1280m, 10 = > 1280m)
There were no clear trends in vegetation composition of the sub-canopy plots with increasing distance from the watering point, nor were there any great differences between sheep and game camps (figure 9), except perhaps the higher cover of perennial forbs and shrubs on sheep camps.
sub-canopy - sheep
0%
20%
40%
60%
80%
100%
2 3 4 6 7 8 9 10
distance class
% o
f tot
al c
over
sub-canopy - game
0%
20%
40%
60%
80%
100%
1 2 3 4 5 6 7 8 9 10
distance class
% o
f tot
al c
over
tall woody plantperennial grassperennial forb & shrubannual grassannual forb
figure 9: relative cover of tall woody plants, perennial grasses, perennial forbs and shrubs, annual grasses and annual forbs against distance from watering point (distance class) on sub-canopy plots (distance classes 1 = 0m, 2 = 10m, 3 = 20m, 4 = 40m, 5 = 80m, 6 = 160m, 7 = 320m, 8 = 640m, 9 = 1280m, 10 = > 1280m)
55

_________________________ Chapter 3: Comparative analysis of sheep and game farming
distance from watering point & single species’ response Species cover values for different species (only species also included in content’s analysis) either increased or decreased along the grazing gradient or did not show any clear directional trends in our analysis (figure 10). Few species showed significant results, but gradient slopes were generally slightly higher on sheep camps than on game camps. Two exceptions were Stipagrostis ciliata and Amaranthus thunbergii that increased more strongly with distance from the watering points on game camps. Interestingly, Schmidtia kalihariensis decreased on both sheep and game camps on grassy matrix plots, while it increased on the sub-canopy plots.
Trib zey
Cent gla
Stip cil
Schm kal
-0,03
-0,02
-0,01
0,00
0,01
-0,03 -0,02 -0,01 0,00 0,01
grass sheep
gras
s ga
me
-0,001
0,000
0,001
-0,001 0,000 0,001
grass sheep
gras
s ga
me
Amar thu
Schm kal
-0,03
-0,02
-0,01
0,00
0,01
-0,03 -0,02 -0,01 0,00 0,01
sub-canopy sheep
sub-
cano
py g
ame
-0,001
0,000
0,001
-0,001 0,000 0,001
sub-canopy sheep
sub-
cano
py g
ame
figure 10: linear regression coefficients of single plant species cover on sheep and game camps with distance from watering point (up to 1500 m) for grassy matrix plots (above) sub-canopy plots (below) with extreme values labelled (left) and magnification of the less responsive species (right) (Amar thu = Amaranthus thunbergii, Cent gla = Centropodia glauca, Schm kal = Schmidtia kalihariensis, Stip cil = Stipagrostis ciliata)
56

_________________________ Chapter 3: Comparative analysis of sheep and game farming
distance from watering point & average C/N ratios and tannin contents Average C/N ratio of the grassy matrix plots increased slightly with distance (figure 11), especially on game camps, which were also reaching higher average C/N ratio farthest from the watering point. Sub-canopy plots showed no C/N ratio gradients with increasing distance from the watering point, nor did either of the habitats for average tannin content (there were no trees > 20 m2 canopy cover within the first 20 m of the watering point).
matrix
R2 = 0,04
RS = 0,20**
0
10
20
30
40
50
60
70
1 10 100 1.000 10.000distance [m]
aver
age
C/N
per
plo
t
sheep gamesheep game
sub-canopy
R2 = 0,07 RS = 0,01
0
10
20
30
40
50
60
70
1 10 100 1.000 10.000distance [m]
aver
age
C/N
per
plo
t
sheep gamesheep game
figure 11: average C/N ratio per plot against distance from watering point for grassy matrix (above) and sub-canopy plots (below) (Pearsson correlation coefficient R2 and Spearman Rho-correlation coefficient RS, ** p < 0,01)
57

_________________________ Chapter 3: Comparative analysis of sheep and game farming
Tannin contents did not show any directional trends with increasing distance from watering point in either grassy matrix or sub-canopy plots (figure 12).
matrix
R2 = 0,00 R2 = 0,00
0,00
0,10
0,20
0,30
0,40
1 10 100 1.000 10.000
distance [m]
aver
age
tann
in p
er p
lot [
%]
sheep gamesheep game
sub-canopy
R2 = 0,02 RS = 0,01
0,00
0,10
0,20
0,30
0,40
1 10 100 1.000 10.000
distance [m]
aver
age
tann
in p
er p
lot [
%]
sheep gamesheep game
figure 12: average tannin content per plot against distance from watering point for grassy matrix (above) and sub-canopy plots (below) (Pearsson correlation coefficient R2 and Spearman Rho-correlation coefficient RS, ** p < 0,01)
58

_________________________ Chapter 3: Comparative analysis of sheep and game farming
multivariate analysis In the ordination diagrams only environmental vectors with a correlation of variance explained higher than 20% are displayed for clarity’s sake. On grassy matrix plots distance from the watering point and C/N ratio showed a strong correlation with species cover values on both sheep and game camps (figures 13, 14 & 15). In sheep camps, species’ cover values were strongly correlated with species numbers per plot (figure 14), while this trend was not apparent in game camps (figure 15). Instead, they showed a correlation with tannin content in the vegetation. In contrast, species composition in grassy matrix plots (figures 16, 17 & 18) was correlated with geographical location, farm age and species numbers, while distance and C/N ratio was only correlated to species composition on sheep camps (figure 17). Seasonal and average rainfall were only correlated with species composition on game camps (figure 18).
figure 13 multivariate analysis of all grassy matrix plots (DCA) with species cover values including camp type, distance from watering point, species numbers per plot, livestock unit/ ha, farm age, age of game camp, C/N ratio, tannin content, average and seasonal rainfall, only vectors with variance explained > 20% are shown (percentage of variance explained by Axis 1: 61% and Axis 2: 12%)
59

_________________________ Chapter 3: Comparative analysis of sheep and game farming
figure 14 multivariate analysis of all grassy matrix plots on sheep camps (DCA) with species cover values including camp type, distance from watering point, species numbers per plot, livestock unit/ ha, farm age, C/N ratio, tannin content, average and seasonal rainfall, only vectors with variance explained > 20% are shown (percentage of variance explained by Axis 1: 56 % and Axis 2: 20%)
figure 15 multivariate analysis of all grassy matrix plots on game camps (DCA) with species cover values including camp type, distance from watering point, species numbers per plot, livestock unit/ ha, farm age, age of game camp, C/N ratio, tannin content, average and seasonal rainfall, only vectors with variance explained > 20% are shown (percentage of variance explained by Axis 1: 71 % and Axis 2: 5%)
60

_________________________ Chapter 3: Comparative analysis of sheep and game farming
figure 16 multivariate analysis of all grassy matrix plots (DCA) with species presence or absence including camp type, distance from watering point, species numbers per plot, livestock unit/ ha, farm age, age of game camp, C/N ratio, tannin content, average and seasonal rainfall, only vectors with variance explained > 20% are shown (percentage of variance explained by Axis 1: 33 % and Axis 2: 22%)
figure 17 multivariate analysis of all grassy matrix plots on sheep camps (DCA) with species presence or absence including camp type, distance from watering point, species numbers per plot, livestock unit/ ha, farm age, C/N ratio, tannin content, average and seasonal rainfall, only vectors with variance explained > 20% are shown (percentage of variance explained by Axis 1: 52 % and Axis 2: 11%)
61

_________________________ Chapter 3: Comparative analysis of sheep and game farming
figure 18 multivariate analysis of all grassy matrix plots on game camps (DCA) with species presence or absence including camp type, distance from watering point, species numbers per plot, livestock unit/ ha, farm age, age of game camp, C/N ratio, tannin content, average and seasonal rainfall (rain), only vectors with variance explained > 20% are shown (scaled down 50%) (percentage of variance explained by Axis 1: 31 % and Axis 2: 24%)
In subcanopy plots species cover values showed little variation, so only species composition was analyzed for this habitat type. In all camps, farm age, longitude and rain was correlated with species composition (figures 19, 20 & 21). Only for the whole data-set a correlation with age of the game camp was apparent (figure 19). A correlation with distance from the watering-point and C/N ratio was only found on sheep camps (figure 20). As a general trend, correlation with distance from the watering point was always stronger in sheep camps than in game camps (table 4). This was particularly clear for species composition. table 4 percentage of variance in the data-set explained by distance from watering point (relative Euclidian distance)
data-set all plots sheep camps game camps 47 50 40 species cover values grassy matrix
<10 38 <10 grassy matrix species composition 10 34 <10 sub-canopy
62

_________________________ Chapter 3: Comparative analysis of sheep and game farming
figure 19 multivariate analysis of all sub-canopy plots (DCA) with species presence or absence including camp type, distance from watering point, species numbers per plot, livestock unit/ ha, farm age, age of game camp, tree canopy size, C/N ratio, tannin content, average and seasonal rainfall, only vectors with variance explained > 20% are shown (percentage of variance explained by Axis 1: 31 % and Axis 2: 15%)
figure 20 multivariate analysis of all sub-canopy plots on sheep camps (DCA) with species presence or absence including camp type, distance from watering point, species numbers per plot, livestock unit/ ha, farm age, tree canopy size, C/N ratio, tannin content, average and seasonal rainfall, only vectors with variance explained > 20% are shown (percentage of variance explained by Axis 1: 25 % and Axis 2: 24%)
63

_________________________ Chapter 3: Comparative analysis of sheep and game farming
figure 21 multivariate analysis of all sub-canopy plots on game camps (DCA) with species presence or absence including camp type, distance from watering point, species numbers per plot, livestock unit/ ha, farm age, age of game camp, tree canopy size, C/N ratio, tannin content, average and seasonal rainfall, only vectors with variance explained > 20% are shown (percentage of variance explained by Axis 1: 43 % and Axis 2: 20%)
64

_________________________ Chapter 3: Comparative analysis of sheep and game farming
discussion Average species numbers per plot were generally low with higher numbers on sub-canopy plots for either camp type. Our numbers from ca. 10 to 20 species on a 100 m2 plots fit in well with other current savanna studies in Southern Africa reporting an average of 18,2 species in 100 m2 plots (Shackleton 2000), but are much lower than the 32,1 species in the grassy matrix plots reported by Leistner (1967). This could indicate a species loss in comparison with Leistner’s study. There were no significant differences between plots on sheep and game camps, although game camps had slightly higher total species numbers in the sub-canopy area. They also were much more variable with plot species numbers equal to or below plots on sheep camps. The same trend was found by Shackleton (2000) in a comparative study of conservation areas and communal lands in savanna vegetation near the Kruger National Park and by Dahlberg (1996) in a moister savanna in North Eastern Botswana. Shackleton explains his results with the intermediate disturbance levels (Grime 1973) in the communal area as they had not sampled in the direct vicinity of local homesteads, where he hypothesized that species number would be lower. This would imply, that game camps lack some of the disturbance tolerant plants which can be found in sheep camps, however, this could not be confirmed through the multivariate analysis. C/N ratios were generally high and comparable to those reported in other studies within the Southern African savannas that included species examined in this study (Skarpe & Bergström 1986, Aranibar & Macko 2005). In disagreement with Mattson’s (1980) hypothesis, which predicts lower C/N ratios in short-lived, fast growing plant species, our data show no significant differences for plant C/N ratio between annual and perennial species, although perennial species have a much larger range, with perennial grasses typically having the highest C/N ratios. Tannin content was low with less than 1% for all species. However, it is possible that tannin as well as nitrogen content was unusually low in the sample year of 2006 as plants grew extraordinarily tall due to the above average rainfalls, therefore effectively “diluting” plant tannin and nitrogen contents. This phenomenon is referred to as “green drought” by the local farmers, implying that animals might starve even though their stomachs are full of food. However, similarly low levels of plant nitrogen content were found for some of our tested species in other studies from the Kalahari (Skarpe & Bergström 1986, Aranibar & Macko 2005) don’t support this theory. Some relatively nitrogen-rich plants use defence-mechanisms (i.e. structural or chemical deterrents) to deter herbivores, e.g. the thorny Lycium spp. and Asparagus nelsii, but a significant effect to prove this trend could not be found in our study (data not shown). Our data show no strong relationship between plant C/N ratios, tannin contents and grazing damage through either sheep or antelopes, except for a tendency of sub-canopy species being more likely to be grazed on game camps. The lack of significant differences between camp types could possibly to some extent be explained by the abundance of palatable plant material in the extremely wet year of the study, so that all animals could select plants of high feeding value, regardless of the food type they would normally eat if forced to by food shortages. However both sheep and antelopes show a trend of preferring plants with higher C/N ratios. This could indicate that nitrogen richer plants produce some kind of deterrent, i.e. thorns which were found for some species, as a higher nitrogen content would generally be beneficial for the animals’ nutrient requirements (Mattson 1980). However, there is neither a correlation of structural, nor of chemical deterrents (including tannin content and other substances such as the acid produced by Schmidtia kalihariensis) with grazing damage. This is comparable to results of Cooper & Owen-Smith (1985), who measured tannin contents of plants in a bushveld savanna in South Africa with 630 mm precipitation, that did not show a
65

_________________________ Chapter 3: Comparative analysis of sheep and game farming
significant correlation between total tannin content and general antelope or goat palatability, whereas impalas showed a significant correlation between grazing preferences and nitrogen-content. In their study only condensed tannin > 5% had an effect on herbivore preferences, but since our total tannin contents were below 1%, our condensed tannin levels, consequently, were below 1%, therefore not reaching their threshold level. These results imply that feeding preferences by animals in the Kalahari must be determined by factors not included in the analysis, e.g. alkaloids, which have been found to show high levels in plants with low tannin contents (Feeny 1976, Silvertown & Dodd 1997) or easy accessibility of more nutrient-rich plant parts. Average species richness generally increased with distance from the watering point from ca. 10 to 20 species, except among annual plants on sub-canopy plots in game camps, where species numbers did not show any trends. The rate of increase was usually slightly smaller on game camps which were also generally reaching lower species numbers at the greater distances from the watering point. This increase in species richness with decreasing grazing pressure is typical for a nutrient poor environment (Proulx and Mazumbder 1998) and agrees with other studies in dryland ecosystems (Skarpe 1991, Perkins & Thomas 1993, Palmer & van Rooyen 1998). The fact that for annual species the strength of the gradient was more clearly distinct between sheep and game camps has probably been caused by the feeding preferences of the more mobile antelopes, foraging on annual forbs all over the camp with similar intensities. Annual plant cover is extremely high in the vicinity of the watering points and decreased strongly with distance. Decrease in annual grass cover was stronger on sheep camps with perennial grasses, forbs and shrubs as well as tall woody plant cover relatively increasing, indicating low levels of bush encroachment. The relative increase of the perennial non-grass component on sheep camps consisted mostly of less palatable plants like Hermannia tomentosa, Requienia sphaerosperma and Rhigozum trichotomum. In contrast, the perennial grass component increased clearly on game camps, showing a recovery of areas that supposedly still had a perennial grass basis. The annual grass component remained relatively high throughout the plot, which can probably be explained by the high rainfalls and the open space available because of the lower shrub cover (van Rooyen 2000). The increase of grazing tolerant perennial forbs and woody vegetation in larger distances from the watering point is characteristic for piospheres in dry rangelands, as Perkins (1996) found a similar phenomenon in distances of 200 to 2000 m from the watering point. These patterns are in line with findings from other studies in dry rangelands (Skarpe 1991, Perkins & Thomas 1993, Palmer & van Rooyen 1998). Only a few species showed a significant and strong linear response to the grazing gradient with increasing distance from the watering point. While the annual grass Schmidtia kalihariensis was decreasing, perennial grasses were increasing with distance from the watering point on grassy matrix plots, in correspondence to their classification as increasers or decreasers in van Rooyen et al. (1991). On sub-canopy plots a small increase in cover of S. kalihariensis with distance was found, which is easily explainable considering the extremely high grazing pressure on the sub-canopy vegetation that only declines with larger distances from the watering point, so that even known unpalatable species like S. kalihariensis are either eaten or else destroyed by trampling. The trends detected during this study with higher relative nitrogen content in the vicinity of the watering points or on sub-canopy plots may be interpreted in two ways: either nitrogen-rich plants need the nitrogen-enriched soil in those environments (increased nitrogen input through faeces) and/ or nitrogen-rich plants are able to recover more quickly from grazing damage and thus have a competitive advantage (Mattson 1980). Another hypothesis is that
66

_________________________ Chapter 3: Comparative analysis of sheep and game farming
relatively less plant matter is consumed of nitrogen-rich plants as less material is needed to fulfil the nitrogen-requirements of the herbivore, but the scarcity of nitrogen-rich plants make this effect unlikely in the Kalahari environment as highly palatable plants are often grazed to the ground, especially by sheep (Feral et al. 2003). Nitrogen fixation does not occur among Kalahari Acacia spp. (Aranibar et al. 2004), so this can not explain the higher nitrogen content of the sub-canopy soils. However, Aranibar et al. (2004) reported signs of nitrogen-fixation of annual leguminous forbs in the Central Kalahari, which could have an effect on the sub-canopy habitat or the vicinity of the watering point, where annual forbs are common. The most likely explanation of the observed patterns is probably a combination of these factors with nitrogen rich plants needing more nitrogen in the soil and either being able to recover faster from herbivory or using nitrogen to produce deterrents. The role of nitrogen-fixing annual forbs is difficult to determine as no information is available for locally common species. The stronger trend for the C/N ratio increase on grassy matrix plots in game camps, which was the only significant correlation with distance from the watering the point, is possibly a transitional effect: as grazing pressure on nitrogen-rich plants in the direct vicinity of the watering point decreases with the switch to game farming, the potentially dominant seedbank of these species in the soil of these locations will initially cause their dominance in the vegetation as they are now loosing less of their biomass due to herbivory. This effect is likely to level off once the more competitive perennial grass species have once again gained relative dominance. In addition, species with a high C/N ratio such as the perennial grasses can recover from greater densities in higher distances from the watering point and so are likely to reach a high level relatively quickly. Species’ cover values were strongly correlated with distance from the watering point in grassy matrix plots on both camp types with strength of gradient being stronger in sheep camps (table 5). Sub-canopy plots showed too little variation among dominant species to see any trends which is in line with their hypothesized uniform grazing pressure as a preferred location for all animals. However, distance from the watering point was correlated with species composition in the sub-canopy habitat on sheep camps, whereas there was no such gradient in the data from game camps. These results show, that game farming has an effect in generally evening out grazing gradients in the vegetation including species richness, although the gradient of C/N ratio has steepened with perennial grasses relatively rapidly recovering in the distance and annual plants temporarily increasing in cover near the watering point. The absence of grazing tolerant woody species at higher distances on grassy matrix plots in game camps could be due to their disappearing in the course of the game farming or to the shorter period of sheep farming, so that bush encroachment had not reached values similar to current sheep camps. The latter is more likely since areas encroached by bushes, especially by Rhigozum trichotomum, are changing notoriously slowly (van Rooyen 1998). Species composition was generally strongly correlated with farm age, location and rainfall, both seasonal and average, with the importance of farm age supporting the results of Jeltsch et al. (1997), rainfall being generally of fundamental importance and the location probably mirroring the local rainfall gradient. Only in the complete data-set of all sub-canopy plots was there a signal of the age of the game camp, indicating that small differences in species composition between game and sheep camps can be found depending on the duration of game farming.
67

_________________________ Chapter 3: Comparative analysis of sheep and game farming
table 5 factors correlated with species’ cover values and composition in the multivariate analysis (only for variance explained > 20%)
camp type habitat data distance game age farm age location rain
+ n.a. all cover n.a. + all composition grassy
matrix + n.a. cover sheep + n.a. + + composition + cover game + + + composition + + + + all composition sub-
canopy + n.a. + + + sheep composition + + + game composition
The lack of clear differences between average plots in sheep and game camps, especially within the grassy matrix, are probably due to either a slower regeneration time, for example caused by generally low soil nutrient availability, seed dispersal limitations (Chapter 4), or by the presence of water-dependant, pre-dominantly grazing antelopes such as blue wildebeest, kudu and blesbok as well as zebra, that are not indigenous to the duneveld (Apps 2000).
68

_________________________ Chapter 3: Comparative analysis of sheep and game farming
conclusions & perspectives Our results indicate that game farming in its current form is indeed having an overall beneficial, but relatively small effect on the vegetation and its species richness. This effect is most evident among annual plants and in the grassy matrix with a partial regeneration of the perennial grass component and lower levels of shrub encroachment, while the sub-canopy vegetation shows slightly lower average total species richness. Vegetation responses occur slowly as suggested by many studies (e.g. Jeltsch et al. 1997) and are likely to still be in progress even on the older game camps. It is probable that the process of vegetation regeneration can still be optimised, with stocking rates and camp sizes adapted further to simulate natural conditions and possible reseeding for dispersal-limited species (Chapter 4), if a more speedy recovery is desired. However, game farming is currently not very economically profitable with prices for venison far below mutton and beef, while tourists currently only provide supplementary income for many game farmers who only have minor parts of their property set aside for game. Consequently, suitable markets will have to be developed before farmers will substitute or even only supplement livestock production with game farming on a larger scale before the vegetation is degraded through the whole area.
69

_________________________ Chapter 3: Comparative analysis of sheep and game farming
70

______________________________ Chapter 4: Land use effects on long-distance dispersal
Chapter 4
Long-distance dispersal in the Southern Kalahari Duneveld,
South Africa and its sensitivity to sheep farming
abstract The Southern Kalahari Duneveld is an area without natural fresh water sources, with nutrient poor soils and relatively high diversity of large indigenous antelopes. Animal dispersal could potentially be of high importance in this system and therefore sensitive to changes in animal composition and grazing management, as have occurred in the last 100 years due to the onset of commercial sheep farming. This study therefore aims to establish long-distance dispersal potentials of Kalahari plants through various vectors by means of standardized dispersal experiments to compare their relative relevance in a natural or agricultural environment. In general, animal species present, disturbance intensity and soil characteristics have a complex combined effect on dispersal of the Kalahari plants. We found that abiotic dispersal is of relatively little relevance, due to generally low wind dispersal potentials and the scarcity of water dispersal opportunities, even though water dispersal potentials were theoretically high. Biotic dispersal potentials showed two trends: external animal dispersal potential in antelope fur was generally low, while internal animal dispersal was relatively high. Both external and internal animal dispersal potentials varied significantly between antelopes and sheep, both in species dispersed and number of seeds transported. This was reflected in their relevance in the vegetation, with intensively used areas (i.e. near watering points) or habitats (shady sub-canopy area) showing high internal animal dispersal potentials in comparison to the grassy matrix, which especially at higher distances from the watering point, showed relatively higher wind dispersal potentials. In addition to disturbance intensity, soil mobility and nutrient richness seemed to be important, with the nutrient-poor, highly mobile environment on the dune-crest also showing high importance of internal animal dispersal, since the often large seeds transported by this mode of dispersal are less reliant on soil nutrients, don’t get blown away as easily and can potentially survive being covered in sand.
71

______________________________ Chapter 4: Land use effects on long-distance dispersal
introduction The Kalahari is an arid to semi-arid savanna stretching over 2,5 million km2 over the centre of Southern Africa with relatively homogenous sandy soils and a rainfall gradient from 150 mm in the dry South to 1000 mm in the North (Leistner 1967, Scholes & Parsons 1997). The local vegetation is sparse but it nonetheless supports a high diversity of large indigenous herbivores and provides livelihoods for a great number of local livestock holders, both subsistence and commercial farmers. The lack of permanent natural water sources has prevented the continuous utilisation of most of the area until recently, when artificial watering points were established (Denbow 1984, Denbow & Wilmsen 1986, Fourie et al. 1987). Previously, indigenous, largely water-independent antelope herds roamed vast areas following the flush of new growth after summer rains, moving northwards in winter where pans provided permanent water access until they were restricted by farm and veterinary fences built from the 1960s (Albertson 1998). Therefore, the vegetation has not evolved with the permanent high grazing pressures by sedentary livestock typical for current land use management. Consequently, the vegetation is sensitive to continuous overutilisation, especially during the frequent times of drought, and many patches are already degraded (Perkins and Thomas 1993a,b, Dougill & Cox 1995, van Rooyen 2000). Unfortunately, regeneration of degraded areas can take several decades without costly and labour intensive human intervention (e.g. Barnes 1979, Jeltsch et al. 1997, van Rooyen 2000). Another threat to the area is the anticipated climate change (Rutherford et al. 1999, Christensen et al. 2007) during which the region is predicted to become even drier. There are many available theories as to how and why degradation proceeds (Leistner 1967, Walker 1981, Skarpe 1986, Tolsma et al. 1987, Perkins & Thomas 1993, Dean & McDonald 1994, and Ringrose et al. 1996), why regeneration is slow (van Rooyen 2000) or how the vegetation is likely to shift when the climate changes (Rutherford et al. 1999, Hannah et al. 2002). Unfortunately, most of them miss a crucial piece of information: the role of the long-distance dispersal (LDD) potentials via different vectors. The LDD potentials of savanna plants have received relatively little attention in contrast to plants growing in temperate (e.g. Bonn & Poschlod 1998) or desert regions (e.g. van Rooyen et al. 1990, Gutterman & Shem-Tov 1996, 1997). Van Rheede van Oudtshoorn & van Rooyen (1999) write that LDD in arid areas is often restricted (anti-telechory, Zohary 1937), especially among annual plants, to insure that the progeny remains in the locality that has proven to be adequate for the mother plant. Instead, dispersal in time is reported to be highly relevant as climatic conditions are highly variable, germination under unfavourable conditions is likely to be fatal (Gutterman 1993) and high seed persistence in the seedbank is commonly negatively associated with LDD (Venable & Brown 1988). Complementarily, LDD potential is also likely to be restricted if the preferred habitat is small, but linear, like a dry riverbed, unless directed modes of dispersal are used (Howe & Smallwood 1982, Howe 1986). For perennial plants or slightly moister regions the situation is different: competition for water is producing regular spacing in adult individuals (e.g. distribution of grasses in the Southern Kalahari Duneveld), and therefore the level of competition, especially between conspecifics, is likely to be high. Furthermore, high levels of habitat heterogeneity would require higher dispersal potentials so that the diaspores can reach the next suitable patch. Although water limitation is a dominant and unifying factor in this environment and the sandy soils are relatively homogenous, spatial heterogeneity can still be high: common causes for habitat heterogeneity in the Kalahari are the varying depth of the calcrete layer influencing soil
72

______________________________ Chapter 4: Land use effects on long-distance dispersal
characteristics of the overlying sand, varying exposition to wind and light, soil structure and nutrient variations influenced by both topography and biotic factors. Furthermore, if the required habitat is rare and patchily distributed (e.g. safe-sites/ nurse plants), directed LDD (Howe & Smallwood 1982, Howe 1986) is likely to be important. Research in Africa was focussing heavily on dispersal of Acacia spp. (Leistner 1961, Janzen 1969, Coe & Coe 1987, Hoffman et al. 1989, Miller 1994 a,b, 1995, Barnes et al. 1997, Dudley 1999, Rohner & Ward 1999, Barnes 2001 a,b, Or & Ward 2003). However, Dean et al. (1999) provide a general overview of hypothetical dispersal vectors of plant species growing in the matrix vegetation and in the sub-canopy area of trees in the Nossob riverbed within the Kgalagadi Transfrontier park. They report a concentration of plants putatively dispersed by frugivores in the sub-canopy area, while most matrix species were showing adaptations to wind dispersal. Plants with inconspicuous, indehiscent seeds hidden among palatable leaves, that are putatively dispersed by herbivores (Janzen 1984), do not show a clear habitat association. Furthermore, Milton & Dean (2001) showed that animal dung in the Kalahari contains viable seeds of a number of plant species in an anecdotal study for a range of herbivorous and non-herbivorous animals. Accurate and empirically confirmed information on LDD potentials, however, is essential to understand the vegetation responses to land use or climate changes for the development of effective restoration strategies and make realistic predictions for the future. For example, high wind dispersal potentials for most plant species would indicate, that land use is unlikely to have a distinct effect on dispersal patterns, whereas high animal dispersal potentials could possibly cause seed limitations in livestock farms for plant species exclusively or mostly dispersed by native antelopes. In this study we, therefore, aim to determine the LDD potentials through wind, water and animals for the most common plant species in a number of local habitats and the likely impact of the current sheep farming on fenced camps in comparison to natural conditions. Following Bonn & Poschlod (1998), we restrict the term “LDD” to dispersal through wind, water and large mammalian herbivores only, i.e. vectors that can disperse seeds over distances larger than 100m (see also Willson 1993). Smaller animals, including birds, rarely transport seeds over equivalent distances (e.g. Kollmann 1994, Grunicke 1996) and are therefore excluded. Likewise, dispersal by humans is not treated in this study, since human densities are minimal and their impact is mostly restricted to roads or the direct vicinity of homesteads. Among the LDD-vectors in the Kalahari animal dispersal is likely to be the most effective as antelopes are highly mobile and deer in Europe have been found to be able to disperse seeds over large enough distances necessary to explain post-glacial distribution range extensions for many species (Pakeman 2001). Even though animal dispersal is commonly associated with more productive habitats (Milton et al. 1990, Willson et al. 1990), the numerous and highly mobile antelopes offer themselves as an efficient means of dispersal. As the local flora has co-evolved with the local fauna since the Cenozoic (Scott et al. 1996, Bredenkamp et al. 2002) and a higher diversity of dispersers can result in higher dispersal success (Bleher & Böhning-Gaese 2001, Bugla & Poschlod 2005) the replacement of native large herbivores with livestock could affect the dispersal patterns. This, in turn, could be one of the factors responsible for the change of vegetation observed on sheep farms (Chapter 2 & 3). We therefore hypothesise, that the plants of the Kalahari Duneveld, with its high level of spatial heterogeneity, generally have high LDD potentials, with direct dispersal being most important in small, patchily distributed habitats such as the sub-canopy habitat. As sheep with their thick wool and special feeding preferences are distinct from the natural range of
73

______________________________ Chapter 4: Land use effects on long-distance dispersal
shorthaired, indigenous, grazing and browsing antelopes (du Toit 1990, Skinner & Smithers 1990, Owen-Smith 1999), we further hypothesise that plants show different zoochorous dispersal potentials between animal groups. Since Fischer et al. (1996) proved, that dispersal potential can not be deduced from visible seed/ diaspore characteristics only, a number of experiments were performed to determine dispersal potential in an unambiguous manner. However, plants often have more than one type of dispersal unit or a number of different seed types and, furthermore, a plant’s dispersal potential is also affected by the availability of vectors and various environmental conditions, which means that the experimental determination of dispersal potential will always only be an approximation of the real dispersal potential. Our study, therefore, presents a compromise between complete accuracy and processible species numbers as we were aiming to examine the whole ecosystem rather than to describe exact single species’ behaviour. For this purpose, we conducted standardised experiments to measure terminal velocity, floating ability, retention in shaken sheep and antelope fur and germination after simulated chewing and digestion in comparison to untreated samples. Supplementary, we measured average plant height during a vegetation survey (chapter 3) collected dung samples of sheep and antelopes and determined the number and type of seedlings emerging from the dung. From this data we calculated basic LDD potentials for all vectors, i.e. wind, water, sheep and antelope though attachment to fur and digestion. LDD potential as defined in this study describes the potential of one seed to travel over a long distance and does not include any information on the number of seeds dispersed. We describe dispersal quality rather than quantity (Schupp 1993), as unfortunately no accurate data on wind, seed production and frequency and quality of plant-animal interactions (i.e. number of seeds attached to fur or eaten) or their variation over time was available. LDD potential was correlated to the species’ habitat preferences and grazing sensitivity as inferred by its occurrence along a grazing gradient (Chapters 2 and 3). We did not include experiments to measure horizontal wind transport (Schurr 2005), as small scale soil relief is too high to allow for significant distances to be covered as the seeds are quickly trapped in animal footprints, mouse or scorpion holes and the like (personal observation). However, during thunderstorms or passing “dust devils” all types of diaspores are likely to be lifted from the ground due to a high level of updraft and turbulences (Tackenberg et al. 2003), and then would be transported according to their terminal velocity. A number of plant species have specialised in large diaspores attaching to animals’ feet called trample burrs like Tribulus zeyheri or Harpagophytum procumbens, but since these adaptations were so rare this mode of dispersal was also excluded from this study. Unfortunately, as the experiments required a large number of seeds to produce significant results, not all experiments could be conducted for all species as adequate seed collection could not be completed for some species.
74

______________________________ Chapter 4: Land use effects on long-distance dispersal
methods
study area The study area is situated within the Duneveld of the Southern Kalahari, in the Mier district of the Northern Cape Province of South Africa between 25-28°S and 20-23°C East. The major topological feature of this region are the long, red sand dunes parallel to the dominant wind direction, that are dissected by a few dry riverbeds and interspersed with a number of pans. The soils of the duneveld are mostly relatively nutrient poor oxidised sands without distinct soil horizons and an underlying layer of calcrete in varying depth (Cooke 1985, Thomas & Shaw 1991). Summers are hot with day temperatures reaching over 40°C and mild nights (20-25°C), while the winter days are mild and the nights can occasionally have frost. Average precipitation ranges between 150 mm in the Southwest and 250 mm in the Northeast of the region with most of the rain falling during thunderstorms in the summer and early autumn months (SA Weather service). The landscape is an open savanna to bushveld with sparse Acacia erioloba, A. haematoxylon and Boscia albitrunca trees and a matrix of tufted grasses mainly consisting of Stipagrostis, Aristida and Eragrostis spp. The vegetation on the dune crests is clearly distinct with the robust grass S. amabilis being the dominant plant species. Likewise, the vegetation in the sub-canopy area underneath the trees or the areas around the watering points is distinctly different from the matrix in the dune streets with a higher proportion of shrubs and herbaceous species in these habitats (Chapter 2). The area does not have natural permanent water sources, therefore, until 100 years ago, large herbivore and in particular human impact was comparatively low. In the early 1900s the first commercial farms were established in the area, using borehole water from the superficially dry riverbed as well as rainwater that was collected in dams. In 1985 a pipeline was built from the Orange River into the Kalahari, which induced an intensification of land use. Nowadays most people farm with Dorper sheep as well as cattle in low numbers with only a few farms focusing entirely on game farming or devoting a part of the farm to this purpose. Larger antelopes occurring in the game camps are springbok (Antidorcas marsupialis), red hartebeest (Alcelaphus buselaphus), gemsbok (Oryx gazella), blesbok (Damaliscus dorcas), kudu (Tragelaphus strepsiceros), impala (Aepyceros melampus), black wildebeest (Connochaetes gnu) and eland (Taurotragus oryx). Furthermore, there are also smaller antelopes like steenbok (Raphicerus campestris) and common duiker (Sylvicapra grimmia) as well as a few Ostriches (Struthio camelus), Zebras (Equus quagga) and Giraffes (Giraffa camelopardalis).
diaspore collection Diaspores of 57 of the most common plant species were collected from dune streets and crests as well as the sub-canopy habitat underneath larger trees in the area around Askham during the autumn months between February 2004 and May 2006 from at least five individuals and from at least two different localities. The most common plant on the dune crests, Stipagrostis amabilis, could unfortunately not be included as the plants rarely produce seeds with only one infructescence encountered during a three year study (Chapter 2).
dung collection Dung samples were collected from five sites, each site including a game camp and an adjacent sheep camp. Once a month between February to May 2006 dung samples were collected from 20 sheep, 10 smaller (e.g. springbok) and 10 larger antelopes (e.g. gemsbok) from each of the five sites. Dung from other animal, e.g. duikers, steenbok, rabbits, zebra or giraffe, were not
75

______________________________ Chapter 4: Land use effects on long-distance dispersal
collected as they were either too rare or too small and thus unlikely to have a significant effect on LDD due to their small range sizes (Pakeman 2001).
wind dispersal Experimental proceedings were adapted from Tackenberg et al. (2003). Terminal velocity was measured by determining the time a diaspore took to fall down a distance of two meters. This measurement was repeated for ten diaspores with intact appendages. Plant height was determined in autumn 2006 during height measurements of all species in 400 1 m2 plots in the field (Horn et al., unpublished data). Wind dispersal potential was then determined by combining terminal velocity and releasing height following Tackenberg (2001, WarP 100).
water dispersal Experimental proceedings were adapted from the LEDA traitbase collecting and measuring standards (Kleyer & Knevel 2005). Diaspore buoyancy was determined by carefully pouring the seeds into a gently shaken beaker (100 rpm, 2 cm diameter) filled with distilled water and counting the number of floating seeds after a week. For this measurement we conducted two replicates with 50 seeds each. Hydrochory potential was determined by using the number of seeds still floating after one week.
external animal dispersal Experimental proceedings were adapted from Römermann et al. (2005) and Tackenberg et al. (2006). 50 diaspores were scattered onto animal fur and then briefly combed in with a very coarsely toothed wooden brush to simulate the animal brushing past the plant (one stroke with the direction of the fur, one against it, two opposing strokes perpendicular to the former). The fur was mounted vertically on a specially constructed machine moving the fur for an hour with 40 distinct strokes per minute. Experiments were conducted with sheep and springbok fur with two replications of 50 seeds each for each fur type. External animal dispersal potential was determined weighting the percentage of diaspore retention in the fur with the plant height (table 1) to allow for different attachment probabilities according to plant-animal height relation. Plants with average heights above and below the respective animal were included in the analysis with a reduced factors as it is still possible that seeds would reach the fur since plant heights vary greatly, seeds can fall down from large plants or be picked up from smaller plants while the animal is resting on the ground. table 1 weighting factors plant height for the determination of LDD-potentials in animal fur
weighting factor sheep springbok 0,5 < 20 cm < 40 cm 1 20 - 70 cm 40 - 90 cm
0,5 > 70 cm > 90 cm
internal animal dispersal Experimental proceedings were adapted from Römermann et al. (2005) and are designed to simulate chewing and digestion representing typical grazing species like cattle and sheep. 50 diaspores were disconnected from easily detachable appendages and then loaded with a weight of ca. 70 kg, with the weight being twisted twice for 90° to simulate chewing. Thereafter, the diaspores got transferred into hydrochloric acid (0,1 M) and left to soak for
76

______________________________ Chapter 4: Land use effects on long-distance dispersal
eight hours. After the elution of the acid with sterile water, the diaspores were subjected to a stratification treatment, to either simulate a Kalahari winter with 8 weeks at 4°C or a summer scenario with 4 weeks at 60°C for 8 hours a day with the remainder of the time left at room temperature. After the stratification treatment the diaspores were exposed to a theoretically favourable germination environment in a climate chamber (28°C/12 h in the light and 14°C/12h in the dark at an air humidity of 65%) and kept moist with fungicide solution (Fonganil 0,5g/l water). Seedlings were defined as showing either part of the primary root or shoot, counted and removed from the sample. Control samples were simultaneously subjected to the same stratification and climate chamber treatment. Each combination of treatments was conducted with three replicates (Baskin & Baskin 1998). Internal animal dispersal potential was determined by using the number of seedlings after the simulated digestion and dividing it by the number of seedlings from the control. Grazing and browsing ruminants differ in their gut anatomy (Hofmann 1973) with browsing species typically having higher ruminal turnover rates and lower cellulose digestion efficiencies (but see also Robbins et al. 1995). No simulation protocol was available for browsing species. To remedy this gap and study internal dispersal under natural conditions, we conducted a comparative germination trial including both sheep and antelope dung. For the dung germination trials, the dung samples were air-dried, packed in plastic bags with air holes and stored at cool temperatures in an un-heated greenhouse at the National Botanical Institute in Kirstenbosch (Cape Town, South Africa) over winter. In September 2006 the dung samples were thoroughly sieved to remove sand and debris, weighed and spread out on a layer of sterile sand. The germination took place in the same greenhouse where seeds in the dung were allowed to germinate for 12 weeks. The pots were watered daily until soaked. Day temperatures ranged between 25 and 50°C, nights were cold at first with temperatures around 9°C in the first month and between 15 and 20°C thereafter. Seedlings were counted on a weekly basis and allowed to grow to a state allowing for identification providing they didn’t die off beforehand.
comparative analysis For the comparative analysis of all dispersal vectors all dispersal potentials were coded into six categories (table 2). For testing for significant differences and correlations between vectors only 30 species for which all dispersal potentials could be determined were included.
table 2 categories for comparative analysis of dispersal potentials
dispersal Vector wind water Fur
simulated digestion
dispersal potential
[m/ sec weighted by plant height =
WArP 100 ] [seeds afloat after
one week]
[seeds retained after 1 h weighted with plant height]
[seeds germinated simulation /control]
very low (1) 0 0 - 4 % 0 - 4 % 0 - 4 % low (2) 1 5 - 8 % 5 - 8 % 5 - 8 %
low – med (3) 2 – 3 9 - 16 % 9 - 16 % 9 - 16 % med – high (4) 4 – 5 17 – 32 % 17 – 32 % 17 – 32 %
high (5) 6 - 7 33 – 64 % 33 – 64 % 33 – 64 % very high (6) 8 - 9 > 64 % > 64 % > 64 %
77

______________________________ Chapter 4: Land use effects on long-distance dispersal
plant life-span Plant life-span was extracted from the literature (e.g. Leistner 1967, van der Walt & le Riche, 1999, van Rooyen 2001) and supplemented by own observations. Plants were categorized as either annual or perennial for a typical Kalahari year.
habitat effects The percentage of total cover for all species on dune crests (86 x 100 m2 plots), in the grassy matrix (375 x 100 m2 plots) and in the sub-canopy areas of trees with at least 20 m2 canopy cover (114 x 100m2 plots) was extracted from a vegetation survey of 16 farms in the area of Askham (Chapters 2 and 3). The lower number of plots for the sub-canopy habitat was caused by the relative rarity of larger trees, while the lower numbers of dune crest relevées was justified by their high homogeneity over the whole study area (Chapter 2). The dispersal potential categories for each species were then weighted with the cover percentage of total cover and the averages and distributions compared between habitats.
effect of grazing intensity Effective grazing intensity was inferred from distance to the watering point with highest grazing intensity occurring directly next to the watering point (Andrew 1988). The cover values of all species in three distance classes from the watering point (< 40m = 1, 40 – 230m = 2, and > 320m = 3) was extracted from the vegetation survey (Chapters 2 and 3 including a total of 580 10m2 plots on 16 farms around Askham). The dispersal potential categories for each species were then weighted with the percentage of total cover of each distance group, yielding LDD-spectra for the three grazing intensity levels. Averages and distributions of LDD-potentials were compared between distance classes.
data analysis Data analyses were conducted with SPSS 12.0 (SPSS Inc., Chicago, USA) and PCOrd 5.0 (McCune & Meffert 1999). As most data did not show normal distributions and some data was in the form of intervals or categories, non-parametric test had to be used to test for correlations (Spearman-Rho correlation) and significant differences between averages (Mann-Whitney U-Test or Wilcoxon–Test for matched data-pairs). The multivariate analysis of all dispersal types was conducted in PCOrd using a Principal Component Analysis (PCA) as the gradient within the data was too low for Detrended Correspondence Analysis (DCA).
78

______________________________ Chapter 4: Land use effects on long-distance dispersal
results
wind dispersal Only two of the 57 tested species had a high to very high wind LDD potential (figure 1). These were Orthanthera jasminiflora (LDD 5), a relatively rare creeper with large plumes on each seed and the common grass Stipagrostis uniplumis (LDD 5). Most other grasses and Rhigozum trichotomum, a shrub known for its high bush encroachment potential with light winged fruit, had an intermediate to high wind LDD-potential (LDD 4). Legumes and cucurbits with typically larger, round seeds without appendages that are presented in large pods or fleshy fruit, had the lowest wind LDD (LDD1).
0
10
20
30
40
50
1 2 3 4 5 6
wind LDD-potential (1 = very low to 6 = very high)
num
ber o
f spe
cies
[%]
figure 1: LDD-potential by wind for 57 species’ diaspores
79

______________________________ Chapter 4: Land use effects on long-distance dispersal
water dispersal Most of the 52 tested species showed a very high water dispersal potential with 64 to 100% of the seeds still afloat after one week (figure 2). Many species germinated during the experiment, even some of those that did not germinate during the germination experiment for the endozoochory test control. Once again, legumes and cucurbits showed low dispersal potentials (but also high germination rates during the experiment).
0
20
40
60
80
100
0 min 5 min 1 h 2 h 6 h 1 day 1 week
seeds floating after time x
num
ber o
f spe
cies
[%] 0-4 4-8
8-16 16-3232-64 64-100
figure 2: Percentage of 52 species with number of floating seeds (y-Axis) against time (x-Axis)
80

______________________________ Chapter 4: Land use effects on long-distance dispersal
external animal dispersal For most of the 50 species tested LDD-potential in springbok fur was low, however, dispersal potentials in sheep fur were much higher (table 3 and figure 3). Average dispersal potential was significantly different between fur types (Wilcoxon Z-test, p < 0,01), with an average of 61,9% of the diaspores retained in sheep fur and 20% in springbok fur. Once again, LDD-potentials for legumes and cucurbits were low. The two most common grasses, i.e. the annual Schmidtia kalihariensis and the perennial Stipagrostis ciliata, both showed a very high difference between retention in springbok and sheep fur, while most other grasses like Aristida or other Stipagrostis spp. showed consistently high dispersal potentials. table 3 list of the 22 species with LDD potential in sheep fur > 2 LDD units higher than in antelope fur
2 LDD units 3 LDD units 4 LDD units 5 LDD units Brachiaria glomerata Bulbostylis hispidula Acrotome inflata Cleome gynandra Crotalaria spartioides Crotalaria sphaerocarpa Amaranthus thunbergii Limeum fenestratum Cucumis africanus Helichrysum ciliatum Centropodia glauca Merremia verecunda Dicoma capensis Limeum arenicolum Stipagrostis ciliata Dimorphotheca polyptera Orthantera jasminiflora Eragrostis biflora Parkinsonia africana Hermannia tomentosa Plinthus sericeus Hermstaedtia fleckii Pollichia campestris Nolletia arenosa Salsola sp Schmidtia kalihariensis Sericorema remotiflora Sesamum triphyllum Setaria verticillata Solanum capense Trianthema parviflora Tribulus zeyeri
0
10
20
30
40
50
1 2 3 4 5 6LDD-potential through springbok and sheep fur
num
ber
of s
peci
es [%
] springbok sheep
figure 3: LDD-potentials of 50 species for dispersal through springbok and sheep fur
81

______________________________ Chapter 4: Land use effects on long-distance dispersal
internal animal dispersal - simulation Only seeds of 33 of 50 tested plant species germinated in the climate chamber in either of the treatments. Results are only shown for the treatment that resulted in the highest total number of seedling. Many species were germinating after the simulated digestion treatment in only slightly lower or, in some cases, even higher numbers than in the control (figures 4 & 5). Among these are species with large seeds like Acacia spp. or Cucumis africanus as well as species with small seeds hidden within the foliage such as Amaranthus thunbergii or Chenopodium opulifolium.
Tria par
Stip cil
Sola cap
Seta ver
Schm kal
Requ sph
Port ole
Plin ser
Phyl angOrth jas
Orni sei
Noll areHerm fle
Erag tri
Erag leh
Dimo pol
Cucu afr
Crot sphCrot spa
Citr lan
Chen opu
Aris mer
Amar thu
Acro inf
Acan nau
Acac mel
Acac heb
Acac haeAcac eri
1
10
100
1 10 100
germinated seeds control [%]
germ
inat
ed s
eeds
sim
ulat
ed d
iges
tion
[%]
figure 4: germination of 33 species after simulated digestion (not depicting species with germination rates > 1%) against germination from control samples, the dashed line indicates a survival rate of 100% with all species above the line being stimulated by simulation treatment (Acac eri = Acacia erioloba, Acac hae = Acacia haematoxylon, Acac heb = Acacia hebeclada, Acac mel = Acacia mellifera, Acac nau = Acanthosycios naudinianus, Acro inf = Acrotome inflata, Amar thu = Amaranthus thunbergii, Aris mer = Aristida meridionalis, Chen opu = Chenopodium opulifolium, Citr lan = Citrullus lanatus, Crot spa = Crotalaria spartioides, Crot sph = Crotalaria sphaerocarpa, Cucu afr = Cucumis africanus, Dimo pol = Dimorphotheca polyptera, Erag leh = Eragrostis lehmanniana, Erag tri = Eragrostis trichophora, Herm fle = Hermstaedtia fleckii, Noll are = Nolletia arenosa, Orni sei = Ornithogalum seineri, Orth jas = Orthanthera jasminiflora, Phyl ang = Phyllanthus angolensis, Plin ser = Plinthus sericeus, Port ole = Portulaca oleraceae, Requ sph = Requienia sphaerosperma, Schm kal = Schmidtia kalihariensis, Seta ver = Setaria verticillata, Sola cap = Solanum capense, Stip cil = Stipagrostis ciliata, Tria par = Trianthema parviflora)
82

______________________________ Chapter 4: Land use effects on long-distance dispersal
0
10
20
30
40
50
0 - 4 4 - 8 8 - 16 16 - 32 32 - 64 > 64
% of seeds germinated after simulation/ control
no o
f spe
cies
[%]
figure 5: Percentage of 33 species against percentage of seeds germinating after the simulated digestion in comparison to the control
83

______________________________ Chapter 4: Land use effects on long-distance dispersal
internal animal dispersal – germination from dung samples A large proportion of the seedlings died during the course of the experiment before they could be identified more accurately than as an Acacia, grass or herb species. This was possibly caused by the cool night-time temperatures in the first month or some very hot days in the later period. The only species that could be safely identified at this stage was the herb Amaranthus thunbergii, which germinated in great numbers. A significantly higher number of Acacia spp. seedlings germinated from game dung than from sheep dung samples (figures 6 & 7). The same was valid for herbaceous species, although the difference was less pronounced in the latter case. Grass seed germination did not show a significant difference between animal types.
0
5
10
15
20
25
30
Acacia grasses other
num
ber o
f see
dlin
gs
sheepmixed game
b
a
b
a a
a
figure 6: The percentage of seedlings emerging per 1 kg of dung within 8 weeks in 2006, significance (class coded as a or b) of differences calculated with a Mann-Whitney-U-test (p <0,01)
0
5
10
15
20
25
30
Acacia grasses other
num
ber o
f see
dlin
gs
sheep 2005sheep 2006mixed game 2005mixed game 2006
figure 7: Number of seedlings emerging from 1 kg of dung collected within 8 weeks in either 2005 or 2006
84

______________________________ Chapter 4: Land use effects on long-distance dispersal
all dispersal vectors Most tested plants showed high LDD-potentials by means of water, sheep fur and simulated digestion, whether wind and springbok fur were generally less effective vectors (figure 8).
Long-distance dispersal potential
0
20
40
60
80
100
wind water sheepfur
sb fur sim dig
dispersal vectors
num
ber o
f spe
cies
[%]
very highhighmed-highlow-medlowvery low
figure 8: percentage of species with very low to very high LDD potential (sb fur = springbok fur, sim dig = simulated digestion) for all tested species (wind = 57, water = 52, fur = 50 and simulated digestion = 33)
Consistently, for the 30 species that had been tested for all dispersal vectors, water, sheep fur and simulated digestion showed to be the most effective for LDD, while wind and especially springbok fur were significantly less effective (Wilcoxon-Z-test, p < 0,01) (figure 9).
wind water sheep fur springbok fur
simulated digestion
1
2
3
4
5
6dispersal potential
dispersal vectors
b b b
c
a
figure 9: average dispersal potentials for the 30 species that all dispersal potentials were available for (1 = very low to 6 = very high), significant differences tested with Wilcoxon-Z-test (p < 0,01)
In a principal component analysis of LDD potentials for the 30 species that were tested for all vectors we could show that LDD-potential through wind, water and animal fur were positively correlated with each other, while internal dispersal was negatively correlated with wind dispersal and independent of the other vectors (figure 10, table 4).
85
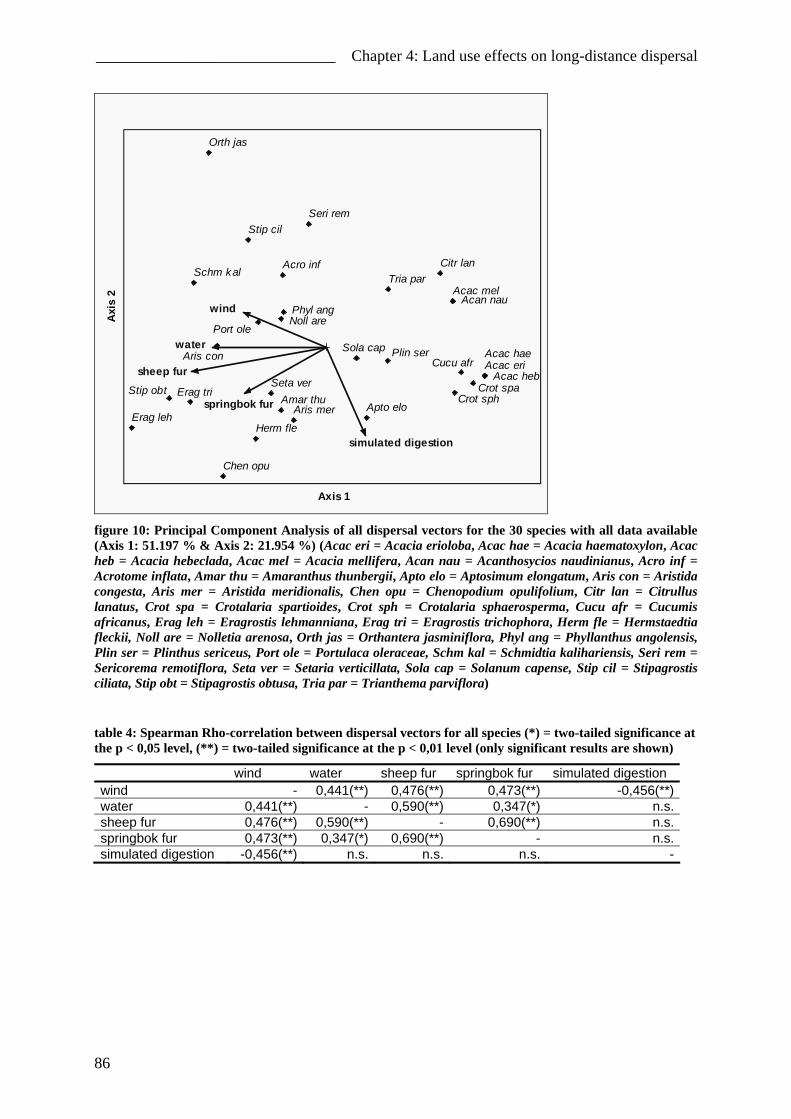
______________________________ Chapter 4: Land use effects on long-distance dispersal
Acro inf
Aris con
Citr lan
Erag leh
Orth jas
Phyl ang
Schm kal
Seri remStip cil
Port ole
Acac melAcan nau
Erag tri
Noll are
Tria par
Seta verStip obt
Acac eriAcac hae
Acac heb
Amar thuApto eloAris mer
Chen opu
Crot spaCrot sph
Cucu afr
Herm fle
Plin serSola cap
wind
water
sheep fur
springbok fur
simulated digestion
Axis 1
Axi
s 2
figure 10: Principal Component Analysis of all dispersal vectors for the 30 species with all data available (Axis 1: 51.197 % & Axis 2: 21.954 %) (Acac eri = Acacia erioloba, Acac hae = Acacia haematoxylon, Acac heb = Acacia hebeclada, Acac mel = Acacia mellifera, Acan nau = Acanthosycios naudinianus, Acro inf = Acrotome inflata, Amar thu = Amaranthus thunbergii, Apto elo = Aptosimum elongatum, Aris con = Aristida congesta, Aris mer = Aristida meridionalis, Chen opu = Chenopodium opulifolium, Citr lan = Citrullus lanatus, Crot spa = Crotalaria spartioides, Crot sph = Crotalaria sphaerosperma, Cucu afr = Cucumis africanus, Erag leh = Eragrostis lehmanniana, Erag tri = Eragrostis trichophora, Herm fle = Hermstaedtia fleckii, Noll are = Nolletia arenosa, Orth jas = Orthantera jasminiflora, Phyl ang = Phyllanthus angolensis, Plin ser = Plinthus sericeus, Port ole = Portulaca oleraceae, Schm kal = Schmidtia kalihariensis, Seri rem = Sericorema remotiflora, Seta ver = Setaria verticillata, Sola cap = Solanum capense, Stip cil = Stipagrostis ciliata, Stip obt = Stipagrostis obtusa, Tria par = Trianthema parviflora)
table 4: Spearman Rho-correlation between dispersal vectors for all species (*) = two-tailed significance at the p < 0,05 level, (**) = two-tailed significance at the p < 0,01 level (only significant results are shown)
wind water sheep fur springbok fur simulated digestion wind - 0,441(**) 0,476(**) 0,473(**) -0,456(**)water 0,441(**) - 0,590(**) 0,347(*) n.s.sheep fur 0,476(**) 0,590(**) - 0,690(**) n.s.springbok fur 0,473(**) 0,347(*) 0,690(**) - n.s.simulated digestion -0,456(**) n.s. n.s. n.s. -
86

______________________________ Chapter 4: Land use effects on long-distance dispersal
plant life-span Annual and perennial plants were analysed separately for their LDD-potentials through all vectors: while annuals tend to have higher dispersal potentials via water and animal fur, perennial plants showed more efficient internal dispersal (figure 11). There were, however, no significant differences between plant life-span groups for any vector (Mann-Whitney-U-test).
figure 11: LDD-potentials for all vectors against plant life-span for the 30 species that were tested for all vectors (Schm kal = Schmidtia kalihariensis, Crot sph = Crotalaria sphaerocarpa, Citr lan = Citrullus lanatus)
87

______________________________ Chapter 4: Land use effects on long-distance dispersal
habitat effects The vegetation was analysed with and without S. kalihariensis included in the total cover values, as it is by far the most dominant species, with > 5, 50 and 80% of the total cover in dune, grass and sub-canopy habitats, respectively, and thus was obscuring the analysis of the other species. The cover values of plants included in the analysis are especially low for the dune habitat, where seeds of the most dominant plant, the grass Stipagrostis amabilis, that is responsible for > 70% of the total cover, could not be collected as this grass only rarely produces seeds. Among the 57 tested species, the cover of species with medium to high LDD-potentials by wind was high, except for the dune-crest habitat, where all except the very high LDD potentials were equally common (figure 12). Excluding S. kalihariensis the vegetation’s average wind dispersal potentials becomes even lower, with the grassy matrix habitat showing the highest cover values for plants with medium to high LDD-potentials.
wind
0
20
40
60
80
100
dune grass treehabitat
tota
l cov
er [%
] very highhighmed-highlow-medlowvery low
wind
0
20
40
60
80
100
dune grass treehabitat
cove
r exc
l. Sk
al [%
]
very highhighmed-highlow-medlowvery low
figure 12: LDD-potentials of 57 species by wind in three distinct habitats, with (left) and without (right) S. kalihariensis (Skal) included in the analysis
88

______________________________ Chapter 4: Land use effects on long-distance dispersal
Among the tested 52 species, the cover of species with high LDD-potentials by water was high for all habitats, with the grassy matrix habitat showing lowest values, especially when S. kalihariensis was excluded (figure 13).
water
0
20
40
60
80
100
dune grass treehabitat
tota
l cov
er [%
] very highhighmed-highlow-medlowvery low
water
0
20
40
60
80
100
dune grass treehabitat
cove
r ex
cl. S
kal [
%]
very highhighmed-highlow-medlowvery low
figure 13: LDD-potentials of 52 species by water in three distinct habitats, with (left) and without (right) S. kalihariensis included in the analysis
Among the cover of 50 species, the cover of species with high LDD-potentials through sheep fur was high in all habitats when S. kalihariensis was included (figure 14). Without S. kalihariensis, however, LDD-potentials were much lower, especially in the grassy matrix habitat.
sheep fur
0
20
40
60
80
100
dune grass treehabitat
tota
l cov
er [%
] very highhighmed-highlow-medlowvery low
sheep fur
0
20
40
60
80
100
dune grass treehabitat
cove
r exc
l. S
kal [
%]
very highhighmed-highlow-medlowvery low
figure 14: LDD-potentials of 50 species by sheep fur in three distinct habitats, with (left) and without (right) S. kalihariensis included in the analysis
89
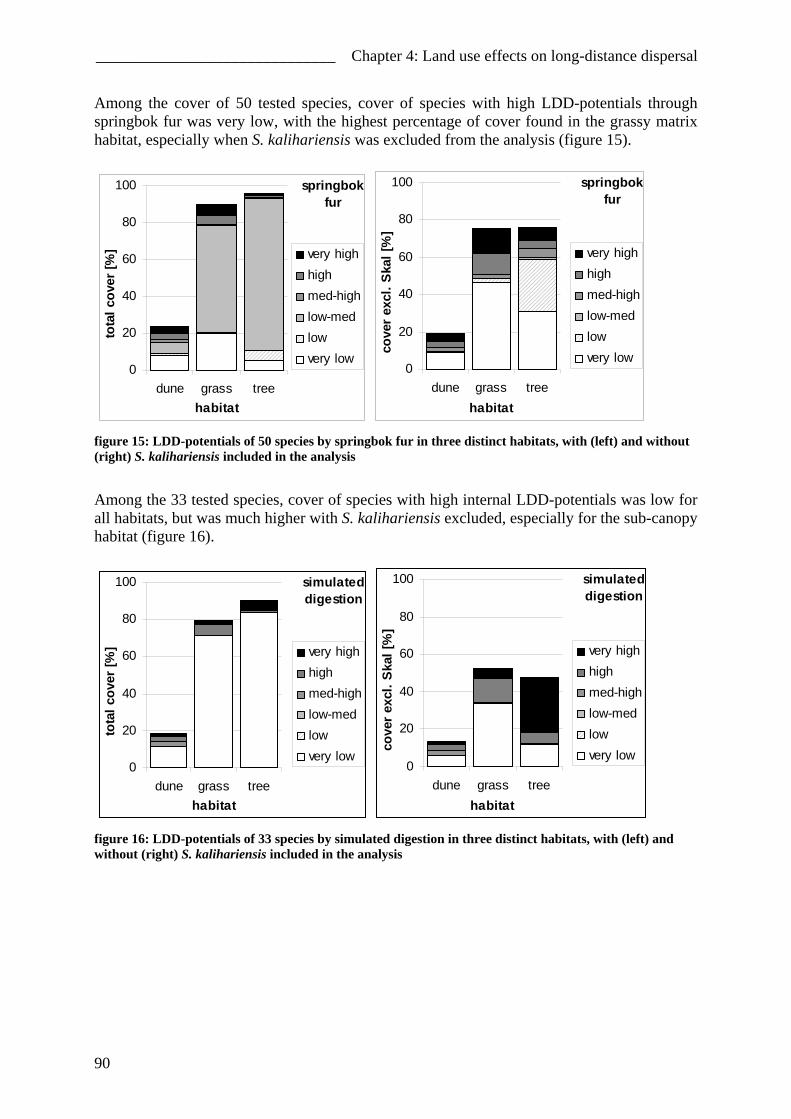
______________________________ Chapter 4: Land use effects on long-distance dispersal
Among the cover of 50 tested species, cover of species with high LDD-potentials through springbok fur was very low, with the highest percentage of cover found in the grassy matrix habitat, especially when S. kalihariensis was excluded from the analysis (figure 15).
springbokfur
0
20
40
60
80
100
dune grass treehabitat
tota
l cov
er [%
] very highhighmed-highlow-medlowvery low
springbokfur
0
20
40
60
80
100
dune grass treehabitat
cove
r ex
cl. S
kal [
%]
very highhighmed-highlow-medlowvery low
figure 15: LDD-potentials of 50 species by springbok fur in three distinct habitats, with (left) and without (right) S. kalihariensis included in the analysis
Among the 33 tested species, cover of species with high internal LDD-potentials was low for all habitats, but was much higher with S. kalihariensis excluded, especially for the sub-canopy habitat (figure 16).
simulateddigestion
0
20
40
60
80
100
dune grass treehabitat
tota
l cov
er [%
] very highhighmed-highlow-medlowvery low
simulateddigestion
0
20
40
60
80
100
dune grass treehabitat
cove
r ex
cl. S
kal [
%]
very highhighmed-highlow-medlowvery low
figure 16: LDD-potentials of 33 species by simulated digestion in three distinct habitats, with (left) and without (right) S. kalihariensis included in the analysis
90

______________________________ Chapter 4: Land use effects on long-distance dispersal
effect of grazing intensity/ distance from watering point Among the 57 plants included in the analysis, cover of species with high wind dispersal potentials is low, while plant species with medium LDD-potential dominate and increase in relative cover with distance from the watering point (figure 17). This trend is particularly clear, when S. kalihariensis is excluded from the analysis.
wind
0
20
40
60
80
100
< 16 - 32 - 64 - 128 - 256 - 512 - 1024 >1024distance from watering point [m]
tota
l cov
er [%
] very highhighmed-highlow-medlowvery low
wind
0
20
40
60
80
100
< 16 - 32 - 64 - 128 - 256 - 512 - 1024 >1024distance from watering point [m]
cove
r exc
l Ska
l [%
]
very highhighmed-highlow-medlowvery low
figure 17: LDD-potential of 57 species by wind against distance from watering point, with (above) and without (below) S. kalihariensis included in the analysis
91

______________________________ Chapter 4: Land use effects on long-distance dispersal
Among the 52 plants included in the analysis, the cover of species with high water dispersal potentials is high and decreased with distance from watering point (figure 18). Once again, this trend becomes much clearer if S. kalihariensis is excluded from the analysis.
water
0
20
40
60
80
100
< 16 - 32 - 64 - 128 - 256 - 512 - 1024 >1024distance from watering point [m]
tota
l cov
er [%
] very highhighmed-highlow-medlowvery low
water
0
20
40
60
80
100
< 16 - 32 - 64 - 128 - 256 - 512 - 1024 >1024distance from watering point [m]
cove
r ex
cl S
kal [
%]
very highhighmed-highlow-medlowvery low
figure 18: LDD-potentials of 52 species by water against distance from the watering point, with (above) and without (below) S. kalihariensis included in the analysis
92
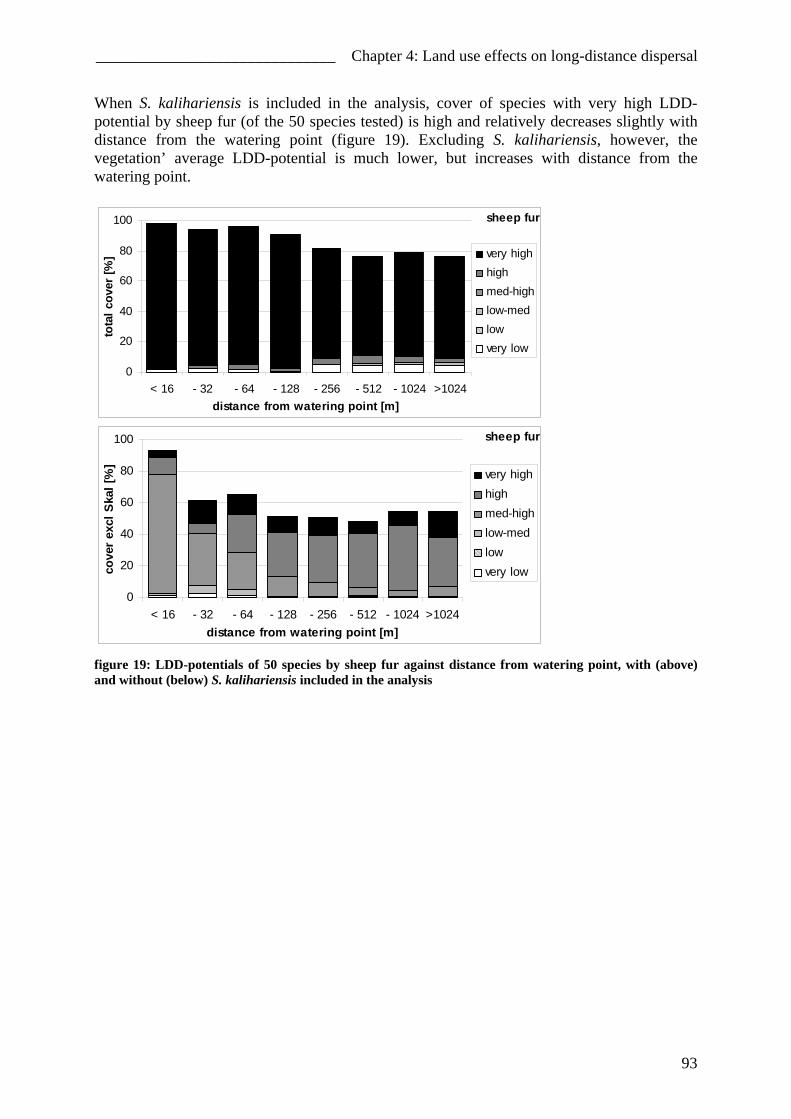
______________________________ Chapter 4: Land use effects on long-distance dispersal
When S. kalihariensis is included in the analysis, cover of species with very high LDD-potential by sheep fur (of the 50 species tested) is high and relatively decreases slightly with distance from the watering point (figure 19). Excluding S. kalihariensis, however, the vegetation’ average LDD-potential is much lower, but increases with distance from the watering point.
sheep fur
0
20
40
60
80
100
< 16 - 32 - 64 - 128 - 256 - 512 - 1024 >1024distance from watering point [m]
tota
l cov
er [%
] very highhighmed-highlow-medlowvery low
sheep fur
0
20
40
60
80
100
< 16 - 32 - 64 - 128 - 256 - 512 - 1024 >1024distance from watering point [m]
cove
r ex
cl S
kal [
%]
very highhighmed-highlow-medlowvery low
figure 19: LDD-potentials of 50 species by sheep fur against distance from watering point, with (above) and without (below) S. kalihariensis included in the analysis
93
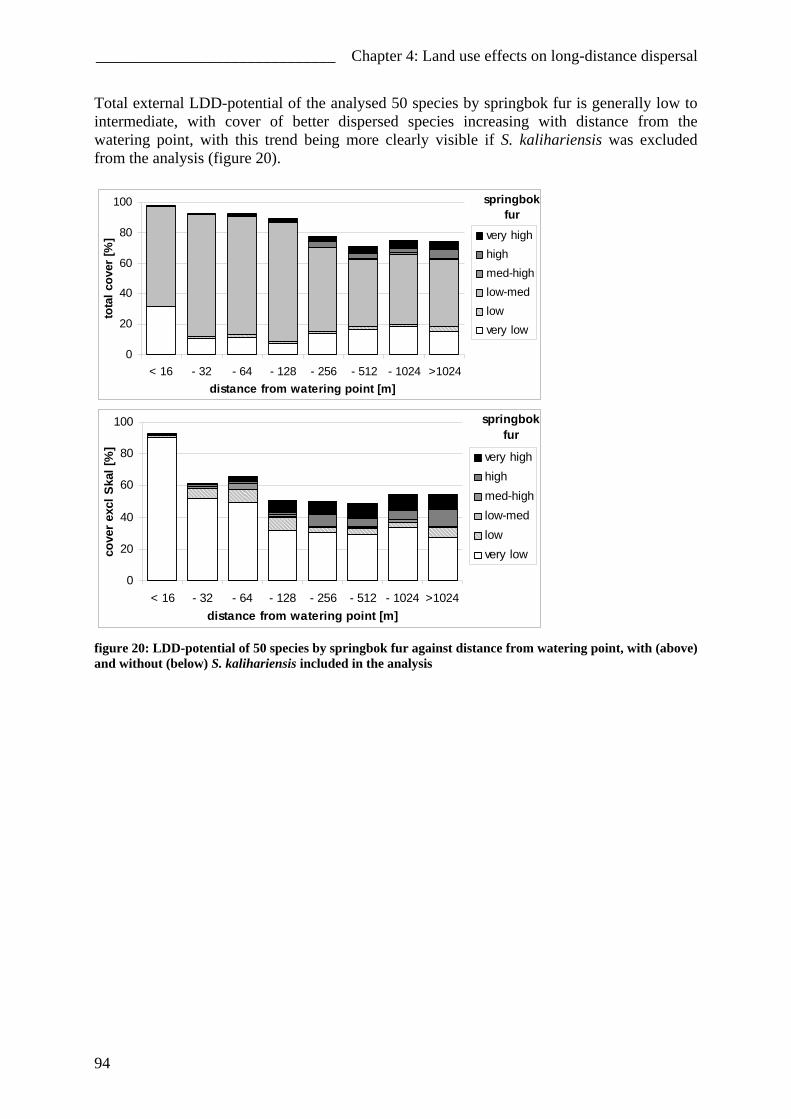
______________________________ Chapter 4: Land use effects on long-distance dispersal
Total external LDD-potential of the analysed 50 species by springbok fur is generally low to intermediate, with cover of better dispersed species increasing with distance from the watering point, with this trend being more clearly visible if S. kalihariensis was excluded from the analysis (figure 20).
springbokfur
0
20
40
60
80
100
< 16 - 32 - 64 - 128 - 256 - 512 - 1024 >1024distance from watering point [m]
tota
l cov
er [%
] very highhighmed-highlow-medlowvery low
springbok
fur
0
20
40
60
80
100
< 16 - 32 - 64 - 128 - 256 - 512 - 1024 >1024distance from watering point [m]
cove
r exc
l Ska
l [%
]
very highhighmed-highlow-medlowvery low
figure 20: LDD-potential of 50 species by springbok fur against distance from watering point, with (above) and without (below) S. kalihariensis included in the analysis
94

______________________________ Chapter 4: Land use effects on long-distance dispersal
Excluding S. kalihariensis, the average internal LDD-potential of 33 species through simulated digestion of the vegetation was very low and only minimally increasing with distance from the watering point, but without S. kalihariensis relative cover of well-dispersed plants was much higher with about 50% of the cover showing high to very high LDD-potentials by this vector (figure 21), decreasing with distance from the watering point.
simulateddigestion
0
20
40
60
80
100
< 16 - 32 - 64 - 128 - 256 - 512 - 1024 >1024distance from watering point [m]
tota
l cov
er [%
] very highhighmed-highlow-medlowvery low
simulateddigestion
0
20
40
60
80
100
< 16 - 32 - 64 - 128 - 256 - 512 - 1024 >1024distance from watering point [m]
cove
r ex
cl S
kal [
%]
very highhighmed-highlow-medlowvery low
figure 21: LDD-potentials of 33 species by simulated digestion, with (above) and without (below) S. kalihariensis included in the analysis
95
______________________________ Chapter 4: Land use effects on long-distance dispersal
discussion Consistent with our initial hypothesis, LDD potentials, especially animal dispersal potentials, were high, and varied between habitats. As abiotic dispersal effectively was of little importance, due to relatively low dispersal potential through wind and the rarity of surface flow, animal dispersal was of great significance. The patchy habitat of the sub-canopy, being adapted to higher levels of more or less continuous herbivory, had the highest rates of effective, directed LDD through internal dispersal. In contrast, the continuous grassy matrix in greater distances from the watering point, being adapted to sporadic herbivory, had highest potentials for wind and external animal dispersal through springbok. The dune-crest habitat was intermediate and anyhow was dominated by the clonal grass Stipagrostis amabilis. Furthermore, there were significant differences between zoochorous dispersal potentials through sheep and antelopes. The analyses for habitat differences and grazing sensitivity were more meaningful for the description of the whole plant community when the annual S. kalihariensis was excluded, as it was extremely dominant in all habitats, especially in wet years and/ or overgrazed patches, so only the exclusive analyses will be discussed in detail. S. kalihariensis itself had high water and external LDD potentials, with wind dispersal also playing a minor role, while internal animal dispersal was negligible. Whereas annual plants had higher LDD-potentials in water or sheep fur, perennial plants had higher internal dispersal potentials. This supports the theory reported in van Rheede van Oudtshoorn & van Rooyen 1999) that LDD is not as important for annual species, since zoochorous LDD potential were low and neither water nor external animal dispersal were likely to be effective for LDD under natural circumstances in the short-term. Although the open landscape would allow for effective wind dispersal, wind dispersal potential of most plants was relatively low. Wind dispersal potential was highest in the grassy matrix habitat, as could be expected due to the openness of the vegetation and relative rarity of other dispersal vectors, and lowest on dune-crests. The relative low importance of wind-dispersal on the dune-crest supports our theory of lower LDD potentials in linearly distributed habitats, but could have several other reasons: perhaps seeds which are blown away too easily will not be able to establish in this wind-exposed habitat. Also, seeds on the dune-crest are likely to be buried in sand and large seeds have been found to be significantly more capable to emerge through thicker layers of soil (Bond et al. 1999) and large seeds are generally less effectively transported by wind (e.g. Tackenberg 2003, Römermann 2005). Yet, wind speeds at the dune-crests are much higher than in the dune-streets (Bullard et al. 1996), so wind-dispersal potentials might not be realistically comparable. Wind dispersal potential is furthermore correlated with higher distances from the watering point, where animal vector availability is lower. In a comparative study of grasses in Botswana Ernst et al. (1992) found similarly low terminal velocity values and predicted a maximum dispersal distance of 13 m at wind speeds of 10 m/ sec for their slowest species, Enneapogon cenchroides. Terminal velocity data from a number of open habitats in North-Western Europe show significant variation (Römermann 2006), therefore it seems possible that wind dispersal potential, which is highly correlated with diaspore/ seed size and density parameters, is also strongly influenced by soil characteristics. Seedlings germinating from larger, nutrient rich seeds may have an advantage on nutrient poor or mobile soils, or during droughts, although the evidence for this is still ambiguous (Leishman 1995, Westoby et al. 1996, Milberg & Lamont 1997, Bond et al. 1999). This connection could possibly explain the low wind-dispersal potentials found in our study as the soil of the Southern Kalahari is particularly nutrient poor. However, the comparatively
96

______________________________ Chapter 4: Land use effects on long-distance dispersal
low wind-potentials in our study can only be interpreted taking into account the open landscape with normally sparse vegetation, which does not strongly slow down the wind closer to the soil surface. This means that wind dispersal is perhaps more effective than in the habitats that the wind-dispersal potential index (WArP 100, Tackenberg 2001) was developed for. Also, the dominant north-westerly winds blow with the greatest frequency and strength during August and September, when the vegetation is dry and many annuals have died of leaving the soil at its barest (Leistner 1967). By this time of the year, however, seeds of most species are likely to have been consumed by seed predators or hidden in the soil (van Rooyen 2000). Furthermore, the high frequency of dust devils additionally increases the chances of wind dispersal. Consequently, it is difficult to estimate realistic wind-dispersal potentials, but the particularly low values found still indicate generally low dispersal potentials through this vector. In contrast, water dispersal potentials were generally high. LDD-potential by water was lowest for grassy matrix and similarly high in the other two habitats, but for all habitat types more than 70% of the cover consisted of species with very high LDD-potentials. The high values for the sub-canopy plots can possibly be explained by the typical association of large trees with dry riverbeds and their vicinity, but the relatively high value for the dune-crests is difficult to explain. Species with a high dispersal potential through water had the highest cover in the vicinity of the watering point. Since plant species from dry areas growing in the riverbeds and their immediate surroundings, experience high grazing and trampling pressures and thus would be likely to adapt to both water dispersal and high grazing pressures and consequently dominate strongly grazed areas in the Duneveld as well. Therefore a subset of these species dominates the nutrient enriched areas around the watering points with their corresponding high grazing pressure. It would be interesting in this context, to compare the results of our study with LDD potentials of dry riverbed plants or plants of the moister parts of the Kalahari. The average of 52,54 % of the diaspores still afloat after one week compares well with the data for North-Western European dry grasslands with ca. 50% (Römermann 2006). However, the definition of water dispersal potential may have to be reconsidered as in the Kalahari environment diaspores that do not float could be transported on the bottom of the watercourse and germinate and/or establish in favourable habitats once the water has run off or evaporated. The water dispersal potential might also have been underestimated for some species, e.g. Acacia spp. where only seeds were tested but not the pods themselves. In general, even if water dispersal potential was to include possible under-water transport and thus be even higher, it is unlikely that water normally plays a significant role in dispersing seeds in the current environment with the region’s watercourses only flowing two or three times every century and virtually no sheet flow occurring on the sandy soils. However, in times of flooding the seeds are guaranteed to be transported over long distances to habitats that are likely to be wetter than the average environment, which is an extremely important advantage in dry areas. High water dispersal potential could further have been caused by seed characteristics important for other dispersal modes such as seed/ diaspore density or challenges related to other processes during the plant’s life-span. External LDD-potentials in springbok fur are relatively low, so external animal dispersal cannot have played as great a role in the natural environment as in e.g. European grasslands (Römermann 2006) that had a longer time of co-evolution with sheep or other animals with thicker fur (6000-8000 years for domesticated sheep and ca. 2,5 million years for wild sheep and their progenitors, Bunch et al. 2006).
97

______________________________ Chapter 4: Land use effects on long-distance dispersal
Dispersal potentials measured in springbok fur were highest in the grassy matrix and increased with distance from the watering point while dispersal potentials measured in sheep fur were highest in the sub-canopy habitat, but also increased with distance from the watering point, possibly influenced by higher sheep activity in these environments. Seeds not adapted to dispersal in antelope fur would originally probably not have shown a concentration in environments with high animal activity, so this could be a result of the current sheep farming. There is, however, an alternative explanation for the prevalence of external dispersal in sheep fur in the sub-canopy and most intensely grazed areas: adaptation to dispersal in lion manes (Martijn Kos, personal communication). Maned lions evolved in Africa at least 320.000 to 190.000 years ago (Yamaguchi et al. 2004) and as lions often shelter in the sub-canopy area, hunt near watering points and frequently move within their large ranges (Eloff 2002), they could have been potentially important dispersers for sub-canopy plant species even though their densities are much lower than those of the antelopes. Sheep and game differ significantly in their potential to disperse diaspores: sheep have a much higher external dispersal potential than springbok for many species. The high average number of the diaspores remaining in sheep fur after an hour fits in well with data from open landscapes in North-Western Europe (Römermann 2006). Many annual plants that are dominant in the sub-canopy habitat, especially near the watering point, have high dispersal potentials in sheep but are not dispersed in antelope fur at all. These species decrease in cover values with increasing distance from the watering point (chapters 2 and 3) relative to perennial species with high external dispersal potentials for both sheep and springbok. This explains the apparent contradiction between high external dispersal potential through sheep fur in the sub-canopy habitat with high animal activity and the relative increase with decreasing animal activity along a grazing gradient. Germination experiments with seeds from arid areas have been proven difficult as many species produce dormant seeds, that only germinate in a narrow range of conditions and even then, germination rates are often low (e.g. Ellner & Shmida 1981, Veenendal & Ernst 1991, Günster 1992, Esler 1999). Our experiments suffered from the same problems, therefore any interpretation of the experimental results of the simulated digestion experiment needs to be aware of the data’s limitations as results are only available for 33 species. Of all species that germinated nine did so with an average of less than 10% of all seeds. Bearing in mind these restrictions we will nevertheless attempt a cautious interpretation. Plants that germinated in high proportions after the simulated digestions typically were species with large nutritious pods, fruit with a high water content or small dehiscious seeds hidden in palatable foliage (Janzen 1984), which is accordance to the (semi-)morphological classification of plant species into dispersal types used by Dean et al. (1999). Correspondingly, internal dispersal determined through simulated digestion experiments is most common where animal activity is highest, both in the sub-canopy habitat and in the vicinity of the watering point. The high frequency of plant species with internally dispersed seeds in the sub-canopy area is in concurrence with studies by Guevara & Laborde (1993), Milton & Dean (1995), Tester et al. (1987), Kos (2007) and many others, most of which focussed on fleshy-fruited, bird-dispersed species. However, internal dispersal is also common on the dune-crest, where the deposition in a stable nutrient poor patch and possible burial through dung-beetles (van der Pijl 1982, Estrada & Coates-Estrada 1991, Estrada et al. 1993, Shepherd & Chapman 1998) is especially favourable in these nutrient poor, unstable soils. Especially Acacia spp and most other Fabaceae show high survival rates after the simulated digestion treatment (Gardener et al. 1993, Miller 1996).
98

______________________________ Chapter 4: Land use effects on long-distance dispersal
Furthermore, internal dispersal could be even more important than the results of our study can prove since the many species whose apparently viable seeds did not germinate during our experiments were probably species with strong dormancies, which, in turn, are likely to have higher internal animal dispersal potentials (e.g. Pakeman 2002). For example, the germination rates after the simulated digestion among the Cucurbitaceae (Cucumis africanus, Citrullus lanatus and Acanthosycios naudinianus) were relatively low, which is surprising as their fruit are commonly eaten by many animals and there seem to be no adaptations to other forms of LDD. However, a definitive judgement for the Cucurbitaceae should perhaps be reserved, as they have been observed to germinate from dung in the field (Leistner 1967, personal observation), germination rates for these species were generally very low and data from a population genetic study for Citrullus lanatus and Cucumis africanus (Chapter 5) suggest effective mixing of genes over long distances. The only grass with survival rates reaching about 10% was the dune grass Eragrostis trichophora, the grass species most commonly found in the dung germination experiment in 2005. Of the species germinating in our study, the species with the highest survival rates were mostly congruent with other studies, i.e. many short-lived forbs (Malo & Suarez 1995) like Amaranthus thunbergii and Portulaca oleraceae and leguminous trees (e.g. Brown & Archer 1987, Reid & Ellis 1995) like Acacia erioloba. Exceptions to these rules are the grasses Setaria verticillata and Eragrostis trichophora that germinated reasonably well after the digestion simulation. Results from the dung germination experiments show a consistent and significant difference between sheep and mixed game dung with most dicotyledonous seedlings emerging from game dung, whereas grasses emerged in equal, though lower numbers from both animal groups. The dispersal of Acacias is significantly higher through internal dispersal by game, with other dispersal vectors being more or less irrelevant. However, as our dung samples were only collected during the rainy season when sufficient grazing was available and the drier year showing higher germination of Acacia spp. from the dung, it is likely that sheep consume a higher number of Acacia seeds during the dry winter and spring months, when antelopes would naturally avoid this area. However, the longer duration of the time the pods are exposed to parasitic borer beetles is likely to cause high fatalities among the seeds. The low germination rates correspond with data from Milton & Dean (2001) that reported a maximum of three seedlings emerging per 100g for animal species included in this study. It is remarkable that on the other hand they found 126 intact seeds in a 4g sample of springbok dung! It can therefore be concluded that a large proportion of the seeds in the dung sample might not have germinated in the course of the experiment. There are conspicuous differences between the two years of the investigation with both animal groups apparently shifting from a diet heavy in Acacia pods in the dry year of 2005 to various herbaceous species in the unusually wet year of 2006. Acacia spp. and Amaranthus thunbergii, that germinated in large numbers also showed high survival rates in the digestion simulation experiments, which may be interpreted as a validation of our experimental design. Compared to North-Western European habitats, endozoochory potential among the 33 germinating species is high with an average of 58% of the seeds surviving digestion as compared to ca. 30–40 % for most European habitats (Römermann 2006). A total of 73% of the species germinated after the simulation as compared to 37 % of the available species set (of 98 species) germinating from dung samples from a range of sites in Great Britain (Pakeman at al. 2002) or 31 % (of 350 species) of all species present and 57% of the 100 most frequent species in a dehesa system in Spain (De Miguel 1988, Malo & Suarez 1995). Even considering the artificially high percentage of species with germinating seeds after endozoochory simulation due to the exclusion of the ingestion-filter, and our diaspore
99

______________________________ Chapter 4: Land use effects on long-distance dispersal
collection being restricted to the most common species, internal animal dispersal is unusually frequent. This is possibly due to the nutrient deficient, mobile soils and heterogeneous environment, that make large seed sizes and LDD advantageous and deposition in a dung patch especially beneficial (Venable & Brown 1993, Leishman 1995, Westoby et al. 1996, Milberg & Lamont 1997, Bond et al. 1999). Additionally, there is a high chance for the dung pellets to be rolled into a ball and buried in the sand by dung beetles, thus removing the seeds from the range of potential seed predators while the dung beetle larvae only consume the dung and leave the seeds untouched (van der Pijl 1982, Estrada & Coates-Estrada 1991, Estrada et al. 1993, Shepherd & Chapman 1998).
100

______________________________ Chapter 4: Land use effects on long-distance dispersal
conclusions & perspectives The LDD-potentials of the tested species were generally high and strongly determined not only by the availability of dispersal vectors, but also by adaptations to soil nutrient levels and stability, grazing sensitivities, and perhaps adaptations to other originally correlated challenges. Concurrent to existing theories (Leistner 1967, Dean et al. 1999) our study found clear differences in dispersal potentials between the three included habitats for all dispersal strategies and also along a grazing gradient. High wind and external animal dispersal on the one side and high internal animal dispersal on the other were found in separate environments and also depend on opposing diaspore characteristics (Römermann 2006, own data, not shown), some plants have diaspores with resistance enhancing structures, while others have more compact diaspores, with only very small diaspores potentially being dispersed by both vectors. A few of the tested species, namely Acacia mellifera, Acanthosycios naudinianus, Citrullus lanatus and Trianthema parviflora, had overall low dispersal potentials, a plausible reason for which could be that a higher internal animal dispersal potential could not be detected during our simulated digestion experiment due to unsuitable germination conditions or missing stratification. Sheep farming in the Kalahari had a strong effect on the LDD of plant species with animal dispersal through sheep and antelopes showing significant differences regarding both total dispersal potentials and dispersed species. This is even more relevant as animal dispersal is of generally high importance in this system with abiotic vectors being rarely available (water) or not ideally suited to the local requirement (wind) that seeds should be as large as possible enhancing establishing success rates in the nutrient poor, mobile environment. It is unlikely, however, that vegetation changes caused by dispersal restrictions would be immediately obvious to the land-users, as grass seeds are altogether better dispersed by sheep. Acacia spp. could eventually become rarer, as they were significantly less effectively dispersed through sheep in summer and autumn, but are probably more limited by suitable germination conditions (Barnes 2001) than dispersal rates. Negative effects on biodiversity through changes in dispersal vectors are most likely to occur among herbaceous species that are adapted to internal animal dispersal. Many species, of which seeds did not germinate during the digestion simulation experiment, or could not be collected or not be collected in sufficient quantities, were species with large seeds. This could indicate a possible adaptation to internal animal dispersal, which would make them vulnerable to land use shifts. We, therefore, claim that LDD in the context of climate change and regeneration of degraded areas is likely to be restricted for some species, especially Acacia spp. and herbaceous species (see also van Rooyen 2000), if animal access to the plants of a range of animal dispersers is not encouraged. This is in concurrence with results by Bugla & Poschlod (2005), that found highest species richness in regenerating grasslands on plots that were accessible to the greatest number of animal groups. Furthermore, regeneration in the Kalahari is probably also slowed down by the low germination rates of many species. At last, a more accurate description of the species-level impact of sheep farming on the quantities of dispersed seeds, dispersal distances would benefit greatly from additional studies of wind and animal dispersal. These should include long-term wind monitoring and species level information on seed production, diaspore attachment and detachment rates to fur under natural conditions and germination from faeces.
101

______________________________ Chapter 4: Land use effects on long-distance dispersal
102

_______________________________________ Chapter 5: Effects of land use on gene flow
Chapter 5
Effects of land use on gene flow between populations of Southern
Kalahari Cucurbitaceae: Cucumis africanus L. f. and Citrullus
lanatus ssp. lanatus var. caffer (Schrad.) Mansf.
abstract Within the last 100 years, most of the Southern Kalahari Duneveld has been transformed from a boundless semi-arid savanna devoid of permanent natural fresh water sources and supporting only minimal human and wild animal densities, to an extensively used agricultural area divided into fenced grazing camps with sheep replacing the native antelopes such as springbok and gemsbok. Only in the Kgalagadi Transfrontier Park are the natural vegetation and animal life protected and the animals allowed to move according to season. Since the relevance of animals as dispersal vectors has been demonstrated to be substantial in this area, changes in available animal vectors and restrictions in their mobility could show an effect on gene flow and therewith genetic differentiation between populations. This study addresses this issue, examining population genetic patterns for two species most likely to respond rapidly due to their short life-span, putatively short pollination distances and dependence on larger herbivores for dispersal: the short-lived perennial Cucumis africanus and the annual Citrullus lanatus (both Cucurbitaceae). Interestingly, the two species show partially opposite results: while C. lanatus shows a lower level of gene flow in the farming area, C. africanus shows the opposite result. We hypothesize, that C. africanus’ smaller seed size is responsible for that. The seeds are small enough to potentially survive digestions by birds or smaller mammals, such as mice, which are much more abundant in the park and could thus ingest most seeds before antelopes would eat them, leading to a more localized dispersal pattern. On the farms, sheep or antelopes are more likely to consume and disperse seeds, transporting them over distances larger than those achieved by the smaller animals. Since we specifically selected species most likely to show an effect of landuse changes and even for the study species the effects are small as yet and direction can be influenced by many factors, it is unlikely that, in the short term, other species in the area would show any reduction in gene flow and increased differentiation between populations.
103

_______________________________________ Chapter 5: Effects of land use on gene flow
introduction In the Kalahari, a large proportion of the plant species can be dispersed through ingestion by large indigenous herbivores or livestock (Chapter 4). Endozoochory is highly beneficial for plants in this environment as, in addition to being dispersed and deposited in a nutrient enriched environment, seeds further profit from dung beetles burying the seeds with the dung ball (van der Pijl 1982, Estrada & Coates-Estrada 1991, Estrada et al. 1993, Shepherd & Chapman 1998). Dispersal through large herbivores is known to frequently result in long-distance dispersal for many plant species (Willson et al. 1993), which has marked effects on genetic diversity among population in comparison to more frequent shorter distance dispersal events, (e.g. Austerlitz & Garnier-Géré 2003). In general, most studies report high average population genetic variance for animal dispersed species (Hamrick et al. 1993, Hamrick & Godt 1997). Conversely, species that show high levels of seed-mediated gene flow can be predicted to have effective means of long-distance dispersal (Ouborg et al. 1999). For example, Honnay et al. (2006) claim that effective animal dispersal is responsible for the lack of genetic erosion of Anthyllis vulneraria L. in fragments connected by transhumant sheep routes. In consequence, effectively animal dispersed plants should generally show less sensitivity to fragmentation, which can otherwise lead to erosion of genetic variation and an increased genetic differentiation between populations (Wright 1931, 1951, Loveless & Hamrick 1984, Hamrick & Godt 1990, Templeton et al. 1990, Schaal & Leverich 1996, Young et al. 1996, Glitzendammer & Soltis 2000, Francisco-Ortega et al. 2000, Cole 2003, Maki et al. 2003, Tomimatsu & Ohara 2003). However, plant species dispersed by more or less sedentary animals can show comparatively low levels of population differentiation (Jordano & Godoy 2000). Similarly, if sedentary or gregarious animals were restricted in their movement gene flow could decrease (Boone & Hobbs 2004). Also, the animal species present, i.e. a specific antelope, plays a critical role in this context, determining which plant species will be dispersed, the number of seeds dispersed and how far seeds are transported. Recent changes in the landscape of the Southern Kalahari could constitute an unapparent form of fragmentation with the habitat appearing to be continuous. The Southern Kalahari is a semi-arid shrub-savanna that had remained relatively undisturbed by human influences until recently, as there are no natural permanent sources of water in the whole area. At the beginning of the 19th century land surveyors divided the land into farm plots and settlers began to establish the first fenced livestock farms along the dry riverbeds using rain and boreholes for the water supply. By the 1950s the whole area had been developed into farmland, except for the Kgalagadi Transfrontier Park, which is one of the biggest conservation areas worldwide (SANParks 2007). Land use intensity increased when a water pipeline was built in 1985 bringing in water from the Orange River. Farms were divided into camps with one watering point usually supplying four camps that animal were rotated between (Fourie et al. 1987). Due to competition with livestock, numbers of indigenous water independent antelopes, such as springbok (Antidorcas marsupialis) and gemsbok (Oryx gazella), decreased (Skead 1980, Bergström & Skarpe 1999, Wallgren 2001, Granlund 2001) and those remaining were progressively more hindered in their movements by the growing number of fences. Many antelopes can easily jump over farm fences, but are unwilling to do so under normal circumstances (landowners, personal communication). It is thus possible that populations of animal-dispersed plants are experiencing limited gene flow, because of the scarcity of the natural dispersers and their restricted mobility due to the camp fences. This could lead to a reduction in gene flow and an associated genetic
104

_______________________________________ Chapter 5: Effects of land use on gene flow
differentiation between population in the farming area in comparison to natural circumstances or current conditions in the park. Population genetic patterns would be especially quick to respond in short-lived, insect-pollinated plant species with low long-distance dispersal potentials through vectors other than large mammals. This effect is particularly likely in large-seeded plants, that are not, or only in small proportions, dispersed by small herbivores, but rely on large herbivores such as the indigenous antelopes. A shift from a range of large native herbivores to one dominant type of livestock is likely to have an impact on both numbers of seeds dispersed and distance seeds are transported. Altogether, effects of genetic erosion in the Southern Kalahari are likely to manifest most rapidly in infrequent annual plants with insect-pollinated flowers and large seeds, that can only be effectively transported by large animals. Very little information is available on the genetic effects of land use changes and the speed at which possible responses would occur. This information would be highly valuable for land use planning or developing counter measures to prevent genetic degradation. A notable exception is the study by Kleijn & Steinger (2002) that noted a lower genotypic diversity in grazed vs. mown populations of the clonal herb Veratrum album L. in Alpine grasslands, which they attributed to shifts in dominant reproduction mode. The Kalahari Cucurbitaceae provide an almost ideal case study to detect species’ responses to disperser shifts and limitations with the insect-pollinated, internally dispersed species Cucumis africanus L.f. (hereafter: C. africanus) and Citrullus lanatus ssp. lanatus var. caffer (Schrad.) Mansf. (hereafter: C. lanatus) that fulfil most of the above-mentioned conditions. Both species have water-rich fruit that provide water during the winter months, when little other water is naturally available, and are known to be consumed by a large range of native animals and thereafter germinate from dung or survive simulated digestion experiments (Leistner 1967, Chapter 4). The annual C. lanatus is reported to even have played a significant role influencing the nomadic routes of the indigenous hunter-gatherer tribes (Story 1958). The annual to perennial C. africanus has much smaller seeds and could potentially be dispersed by a larger range of animals including birds (Leistner 1967, M. Kos, personal communication), while C. lanatus is likely to be dependent on large herbivores for dispersal and could therefore experience higher levels of gene flow between populations. Contrastingly, C. africanus could show lower gene flow over long distances as a larger proportion of the seeds is eaten by smaller animals and dispersed locally and responses to changes in gene flow should be slower due to its potentially longer life-span. There are differences in population densities between the two species: within the farm area we found an average of 40 individuals/ ha of C. africanus plants but only 5 individuals/ ha of C. lanatus. As both species are thought to be relatively self-incompatible (Njoroge 2004), cross-pollination with more distant conspecifics is more likely in species with lower densities (Levin & Kerster 1969), which would lead to higher rates of gene flow between C. lanatus populations. Unfortunately, we had no accurate information about population densities of either species within the Kgalagadi Transfrontier Park, but as both species are positively associated with grazing intensity (Chapter 2) it is possible that they are less common in the park, which could explain potentially higher rates of gene flow there. Similarly, there is no exact information available on the feeding preferences of livestock in comparison with indigenous antelopes in respect of the study species, i.e. whether sheep or antelope eat more fruit or which percentage of seeds survives gut passage for either species. However, experimental results from a study of 33 Kalahari plant species (Appendix 4) show that compact seeds have a higher digestion survival probability, so the less compact, pointy seeds
105

_______________________________________ Chapter 5: Effects of land use on gene flow
of C. africanus possibly have a comparatively lower potential for endozoochorous dispersal than C. lanatus, although the latter did not germinate after the simulated digestion experiment. Considering all available information we, therefore, hypothesise that of the two species C. lanatus is generally more likely to experience a lower level of gene flow in the farming area in comparison to the nearby Kgalagadi Gemsbok Transfrontier Park under the current land use scheme. This would eventually lead to lower local genetic diversity as well as higher genetic distances between populations. Only if dispersal limitations are severe, trends are likely to be detectable after such a short period. To test for these effects, we sampled populations of both species from different farms with a maximum distance between samples of ca. 150 km and repeated this sampling in the park with a similar design and subjected them to an Amplified Fragment Length Polymorphisms (AFLP), Analysis the results of which are presented and critically discussed in this chapter.
106

_______________________________________ Chapter 5: Effects of land use on gene flow
methods
study area The study area is situated within the Duneveld of the Southern Kalahari, in the Gordonia district of the Northern Cape Province of South Africa between 25-28°S and 20-23°C East. The major feature of this region are the long, red sand dunes parallel to the dominant wind direction, that are dissected by a few dry riverbeds and interspersed with a number of pans. The region is traversed by four ephemeral rivers, the Nossob and Auob from the North, that meet at Twee Rivieren, and the Molopo and the Kuruman from the East, meeting the Nossob at Andriesvale to run westwards until a duneveld blocks the riverbed. The soils of the duneveld are mostly relatively nutrient poor oxidised sands without distinct soil horizons and an underlying layer of calcrete in varying depth (Cooke 1985, Thomas & Shaw 1991). Summers are hot with day temperatures reaching over 40°C and mild nights (20-25°C), while the winter days are mild and the nights can occasionally have frost. Average precipitation ranges between 150 mm in the Southwest and 250 mm in the Northeast of the region with most of the rain falling during thunderstorms in the summer and early autumn months (SA Weather Bureau, email communication). Nowadays most people farm with Dorper sheep (Ovis aries) as well as cattle (Bos taurus) with a few farms focusing on game farming or devoting a part of the farm to that purpose. The farms have an average size of ca. 10.000 ha with usually 25 to 30 fenced camps. Many farms show signs of overgrazing, especially the older farms along the rivers and in the direct vicinity of the watering points (Chapter 2). The Kgalagadi Gemsbok Transfrontier Park, which is one of the largest conservation areas in the world and stretches over 3.600.000 ha in South Africa and Botswana remained in relatively natural conditions. It houses large numbers of indigenous antelopes such as blue wildebeest (Connochaetes taurinus), eland (Taurotragus oryx), gemsbok (Oryx gazella), kudu (Tragelaphus strepsiceros), red hartebeest (Alcelaphus buselaphus ssp. caama) and springbok (Antidorcas marsupialis) as well as a few giraffes (Giraffa camelopardalis). The park is not fenced on the Botswanian side, but is rimmed with a wildlife management area, which encourages sustainable use of the region (Twyman 2002). Consequently, migrations are still possible, although they are severely limited in comparison to earlier times when animals regularly migrated up north towards the Okavango Delta, a route which is now blocked by farmland and high veterinary fences (Albertson 1998, Boone & Hobbs 2004, Mbaiwa & Mbaiwa 2006). Therefore, artificial watering points had been installed to allow animals to remain in the area and prevent them from dying of thirst on the way north along the fences (van Rooyen et al. 1991).
study species The study species Cucumis africanus L.f. and Citrullus lanatus ssp. lanatus var. caffer (Schrad.) Mansf. are relatively common and widespread within the Southern Kalahari. Both are members of the family Cucurbitaceae that includes a wide range of plants cultivated for human consumption such as cucumbers (Cucumis sativus), pumpkins (e.g. Cucurbita pepo) or melons (e.g. Cucumis melo). Cucumis africanus L. f.: Synonym: Cucumis hookeri Naudin Common local names: wild cucumber or springbok cucumber. C. africanus is widely distributed in the semi-arid to arid areas of Southern Africa. In the Kalahari it is found in deep sand, often in disturbed areas and along roadsides, under trees and
107

_______________________________________ Chapter 5: Effects of land use on gene flow
around watering points (van Rooyen 2001). Meeuse (1962) describes it as an annual to perennial, monoecious, prostrate or scandent herb, sometimes with woody, thickened roots. The flowers are pollinated by bees and presumably other insects as well (van Rooyen 2001). The fruit is an ellipsoid to oblong-ellipsoid berry 3–9 cm × 2–4.5 cm, strongly longitudinally striped pale greenish-white and purplish-brown when ripe, with soft spines 3–6 mm long. The seeds are ellipsoid, compressed, 4–7 mm × 2–3.8 mm × 1–1.2 mm. (Jeffrey 1980). There are several types of fruit: large oblong, non-bitter fruit that are frequently consumed by game and local people in Angola, Namibia and South Africa, and smaller, bitter and poisonous fruit and also an intermediate form with intermediate properties. Citrullus lanatus ssp. lanatus var. caffer (Schrad.) Mansf. Common local name: Tsamma or Tsama Melon Citrullus lanatus ssp. lanatus var. caffer (Schrad.) Mansf. (Fursa 1972) is restricted to the Kalahari region, where it prefers deep sands and occurs especially in dry watercourses and the sandy flats surrounding them. It is also found naturally in disturbed areas or as a weed in cultivated lands. Meeuse (1962) describes it as a monoecious, annual, scandent or trailing herb up to 4(–10) m long. It was found that in Kenya C. lanatus depends heavily on the honeybee, Apis mellifera L., as the main pollinator. Other pollen vectors identified include Xylocopa bees, halictid bees, Hypotrigona bees, flies and beetles (Njoroge et al. 2004). The fruit is a berry, usually globose to oblong, 5–20 cm long and weighing 0.1––2.5 kg, white to green, grey or yellow, mottled or striped, flesh white to pale green, yellow or red, many-seeded. The seeds are obovate to elliptical, flattened, 0.5–1.5 cm × 0.5–1 cm, smooth, yellow to brown or black, rarely white. They are consumed by a wide range of wild animals as well as local people for water and also nutrient content. This variety is thought to be the wild progenitor of the cultivated watermelon C. lanatus ssp. vulgaris (Jeffrey 1967).
sample design For both C. africanus and C. lanatus up to 10 commercial sheep farms and the South African part of the Kgalagadi Transfrontier Park were sampled with ca. 10 individuals per farm and in the different localities in the park.
sample collection From each individual either two to three leaves and/or two thin slices of fruit skin (C. lanatus only) were collected, placed in a tea bag and immediately stored in a container of silica gel (sodium silicate) for desiccation.
laboratory procedures DNA-Extraction was performed using the Cetyl Trimethyl Ammonium Bromide (CTAB) - method (adapted from Rogers & Bendich 1994). 5mg of plant material were pulverized (Retsch MM 301: 1 min at 30 oscillations/ min), suspended in 700µl of CTAB-buffer-solution (74°C, 100 mM Tris-HCl, pH 9,5; 20 mM EDTA, pH 8,0; 1,4 M NaCl; 1% PEG; 2% CTAB, 2,5 µl/ ml β - Mercaptoethanol) and incubated at 74°C in a water bath (medingen W6) for 30 minutes. After cooling to room temperature, 700µl of chloroform-isoamylalcohol-solution (24:1) were mixed with the sample and the proteins precipitated at 14.000 rpm for 10 minutes at 4°C (eppendorf centrifuge 5417R). 550µl of the DNA-containing supernatant were transferred to a fresh tube, topped up with 550µl chloroform-isoamylalcohol-solution and the sample centrifuged as above. Following the transfer of 400µl of the supernatant into another
108

_______________________________________ Chapter 5: Effects of land use on gene flow
tube, 400µl isopropanole were added and the sample incubated at room temperature for 30 minutes after which the DNA was precipitated at 10.000 rpm for 5 minutes at 4°C. After removal of the isopropanole, the DNA-pellet was washed with 500µl of cool ethanol (70%) and precipitated again at 14.000 rpm for 15 minutes at 4°C. The ethanol was then decanted and the residue completely vaporized (eppendorf concentrator 5301), before the pellet was dissolved in 100µl cool TE-Buffer (10 mM Tris-HCl, pH 8,0; 1 mM EDTA, pH 8,0). DNA-concentration was determined photometrically (λ260, Genesys 6 Thermo spectronic) and adjusted to 7,8 ng/µl with water (Roth). Restriction & Ligation: All AFLP procedures followed laboratory instructions adapted from Beckman Coulter. 6,4µl adjusted DNA-extract was added to a reaction mix consisting of 1µl T4 ligase buffer, 0,1µl NaCl 5M, 0,5 µl BSA (1 mg/ml), 0,5µl Msel adaptor-pair (0,25µl GAC.GAT.GAG.TCC.TGA.G + 0,25µl TAC.TCA.GGA.CTC.AT), 0,5µl EcoRI adaptor-pair (0,25µl CTC.GTA.GAC.TGC.GTA.CC + 0,25µl AAT.TGG.TAC.GCA.GTC.TAC, all adaptors from MWG Biotech), 0,25µl Msel enzyme (10 U/µl), 0,25 µl EcoRI enzyme (10 U/µl) and 0,5µl T4 DNA ligase (1 U/µl, all enzymes and buffer from Fermentas). The DNA was then cut into fragments and the adaptors ligated to the overhanging “sticky ends” by incubating the sample at 37°C for 2 hours, then at 70°C for 10 minutes (eppendorf mastercycler ep-gradient). DNA-concentration of the product was adjusted by diluting 2µl of the sample with 18µl TE 0,1 buffer. Pre-Selective Amplification: All the following steps were carried out on ice. Cucumis africanus For each sample 1µl of the adjusted restriction/ ligation-product was added to a reaction mix consisting of 3,75µl AFLP Core Mix (Applied Biosystems), 0,125µl pre-selective Msel-primer (GAT.GAG.TCC.TGA.GTA.AC, 10µM) and 0,125µl pre-selective EcoRI-primer (GAC.TGC.GTA.CCA.ATT.CA, 10µM, both primers MWG Biotech), vortexed and spun down. The samples were then incubated in a thermocycler (table 1). Hereafter, the samples were spun down again and their DNA-content measured photometrically (1µl pre-selective amplification product + 9µl water in a 10µl cuvette). The samples were then diluted by adding 28,5µl TE 0,1 buffer to 1,5µl of pre-selective amplification product. table 1: Pre-Selective Amplification thermocycler program
step temperature duration repetitions 1 94°C 2 minutes 1 94°C 20 seconds 2 56°C 30 seconds 30 72°C 2 minutes 3 72°C 2 minutes 1 4 60° C 30 minutes 1 5 4°C forever 1 Citrullus lanatus For each sample 1µl of the adjusted restriction/ ligation-product was added to a reaction mix consisting of 3,025µl water (Roth), 0,125µl pre-selective Msel-primer, 0,125µl pre-selective EcoRI-primer, 0,5µl buffer S (PeqLab, 10x), 0,2µl dNTP-solution (5 mM, mixed from dNTP-set 1, Roth) and 0,025µl TAQ-polymerase (PeqLab, 5 U/µl). The samples were then incubated in a thermocycler (table 1). Thereafter the samples were spun down and their DNA-content measured photometrically (1µl pre-selective amplification product + 9µl water in a 10µl cuvette). The samples were then diluted by adding 28,5µl TE 0,1 buffer to 1,5µl of pre-selective amplification product.
109

_______________________________________ Chapter 5: Effects of land use on gene flow
Selective Amplification: All the following steps have to be carried out on ice. The selective amplification was carried out for three different selective primer pairs, which were labelled with luminant black (D2), green (D3) and blue (D4) to get a maximum number of bands with one sequencer run. Cucumis africanus 0,75µl of the diluted pre-selective amplification product were added to a reaction mix consisting of 3,75µl AFLP-Core mix, 0,25µl selective Msel primer (D2: GAT.GAG.TCC.TGA.GTA.ACT.T, D3: GAT.GAG.TCC.TGA.GTA.ACA.C, D4: GAT.GAG.TCC.TGA.GTA.ACA.T, MWG Biotech, 5µM) and 0,25µl selective EcoRI primer (D2: GAC.TGC.GTA.CCA.ATT.CAA.C, D3: GAC.TGC.GTA.CCA.ATT.CAA.G, D4: GAC.TGC.GTA.CCA.ATT.CAC.T, Proligo France SAS, 1µM), vortexed and spun down. The samples were then incubated in a thermocycler (table 2). Following the completion of the program the samples were spun down, covered in tin foil and stored at 4 °C. table 2: Selective Amplification thermocycler program
step temperature duration repetitions 1 94°C 2 minutes 94°C 20 seconds 2 66°C 30 seconds touchdown 1°C/ cycle 10 cycles 72°C 2 minutes 94°C 20 seconds 3 56°C 30 seconds 25 cycles 72°C 2 minutes 4 60°C 30 minutes 5 4 °C forever Citrullus lanatus For each sample 0,75 µl of the diluted pre-selective amplification product were added to a reaction mix consisting of 3,025 µl water (Roth), 0,25 µl selective Msel primer (D2: GAT.GAG.TCC.TGA.GTA.ACA.A, D3: GAT.GAG.TCC.TGA.GTA.ACT.A, D4: GAT.GAG.TCC.TGA.GTA.ACT.T, MWG Biotech, 5 µM), 0,25 µl selective EcoRI primer (D2: GAC.TGC.GTA.CCA.ATT.CAA.C, D3: GAC.TGC.GTA.CCA.ATT.CAG.G, D4: GAC.TGC.GTA.CCA.ATT.CAC.T, Proligo France SAS, 1 µM), 0,5 µl buffer S, 0,2 µl dNTP-solution and 0,025 µl TAQ-polymerase, vortexed and spun down. The samples were then incubated in a thermocycler (table 2). Following the completion of the program the samples were spun down, covered in tin foil to protect the light sensitive labels and stored cool at 4 °C. DNA precipitation & preparation for Sequencer: To adjust the luminance of the three colours, the D3 and D4 samples were diluted, with 20µl TE 0,1 buffer being added to the D3 samples and 30µl to the D4 samples. Then all three colours for one individual were mixed, adding together 5µl of the D2 and D3 samples respectively and 2,5µl of the D4 samples. Each combined sample was then added to a reaction mix consisting of 2µl NaAc (3M, pH 5,2), 2µl of Na2EDTA (100 mM, pH 8) and 1µl glycogen. To precipitate the DNA 60µl of ice-cold 96% ethanol were added per sample, each sample was vortexed immediately afterwards and centrifuged at 14.000 rpm and 4°C for 20 minutes. The supernatant was then removed and replaced with 200µl of ice-cold 70% ethanol to wash the pellets and centrifuged at 14.000 rpm and 4°C for 20 minutes again. The supernatant was removed again and, to ensure complete removal, the samples were then dried in a vacuum centrifuge for 15 minutes. Hereafter the samples were stored cool at 4°C.
110

_______________________________________ Chapter 5: Effects of land use on gene flow
For the sequencer run the samples were dissolved in 24,8µl CEQ sample loading solution (Beckman Coulter). To enable the size determination of the fragments 0,2µl CEQ DNA size standard (Beckman Coulter) was added to each sample. The mixture was then left to stand at room temperature for 15 minutes. The samples were vortexed and spun down, then left to stand another 15 minutes. Finally samples were transferred into the sample plate and covered with mineral oil to prevent evaporation during the sequencer run. sequencer run: The buffer plate was filled with CEQ loading buffer and the sequencer (Beckman Coulter CEQTM 8000 Genetic Analysis System) adjusted to the size standard (size standard 400,10/1 %). The run was then carried out following the method Fra-4-75/90.
data analysis Fragments were scored as either present or absent within Bionumerics 3.0 (Applied Maths, Kortrijk, Belgium) to create a binary matrix, which was then used for all further analyses. However, before we proceeded with the data analysis we compared AFLP patterns of leaf and fruit skin samples for a number of individuals of C. lanatus to ensure comparability, which we could prove to exist for all samples. genetic diversity: Average Nei’s (1963) gene diversity, Shannon’s (1949) Information Index and level of polymorphisms were calculated with popgene (Yeh & Boyle 1997) for all populations, both land use groups and the whole study area. Average values per group were tested for correlations with sample size and tested for significant differences with a Pearson-test in SPSS 12.0 (SPSS Inc., Chicago, USA). partitioning of genetic diversity: The proportion of total genetic diversity in the whole study area found between farms and park, as well as the proportion of genetic diversity in the land use group found between populations was also calculated in popgene, which additionally provided the number of immigrants per population and generation or per land use group respectively. An analysis of molecular variance (AMOVA) was performed with genalex (Peakall & Smouse 2006) using squared genetic distance (Huff et al. 1993). All AMOVA steps were permuted 9999 times. spatial and genetic correlations between individuals, populations and land use groups: A cluster analysis was performed with Bionumerics 3.0 (Applied Maths, Kortrijk, Belgium) using Ward (1963) algorithm and Jaccard (1901) similarity coefficient between individual pairs and populations. Furthermore, a principal coordinates analysis was performed with MVSP 3.1 (Kovach Computing services, Anglesey, Wales) using Bray-Curtis distances. Furthermore, we calculated linear genetic distance (Huff et al. 1993) between all individuals in genalex and tested their correlation with geographical distance with a Mantel-test. The regression analyses were permuted 9999 times. For a more detailed analysis of spatial structure we calculated kinship coefficients (Hardy 2003) between individuals and regression slopes for a number of distance ranges with SPAGeDi (Hardy & Vekemans 2002). Average kinship coefficients from an equal number of individual pairs within both groups with a distance of 0 – 1, 1 – 5, 50 – 100 and 100 – 150 km were compared with a T-test in SPSS. Distance classes for regression analyses were defined according to the requirements described by Hardy (2006), i.e. each class had to contain at least 100 pairs of individuals, more than 50% of all individuals were represented at least once and the coefficient of variation of the number of times each individual was represented was below one. Regression analyses were calculated for all individuals below 5 km and below 100 km and 150 km. As the slope of the regression analysis was much steeper within the first 5 – 10 km, the analyses were repeated
111

_______________________________________ Chapter 5: Effects of land use on gene flow
excluding the first 10 km. All analyses were executed for all individuals collectively as well as for individuals from farms and the park separately. Regression analyses for the separate groups were computed with the reference allele frequencies from all individuals. All regression analyses were permuted 10.000 times and two-tailed tests were reported for significance values.
112

_______________________________________ Chapter 5: Effects of land use on gene flow
results Due to random failures during the laboratory procedures, not all individual samples could be used for the statistical analyses, so many populations are represented by less than 10 individuals (tables 3 and 4). table 3: farm and park location names for all C. africanus populations showing number of samples included in the analyses
Cucumis africanus farms n park n Avilion 10 Auob 1 10 False Vley 9 Auob 2 10 Loch Lomond 10 Dune Street 8 Loch Marée 8 Nossob 1 11 Rea 10 Nossob 2 6 Rooipan Noord 9 Nossob 3 11 Rooipan Suid 7 Twee Rivieren 10 Swartpan 10 Twee Rivieren Noord 8 farms total 73 park total 74 farms avg. 9,13 park avg. 9,25 table 4: farm and park location names for all C. lanatus populations showing number of samples included in the analyses
Citrullus lanatus farms n park n Avilion 6 Auob 1 6 Brand Duin 8 Dune Street 9 Drieling 14 Nossob 1 10 Loch Broom 10 Nossob 2 9 Rooipan (North) 9 Nossob 3 7 Rooipan (South) 5 Nossob 4 8 Sonderpan 9 Twee Rivieren 14 farms total 61 park total 63 farms avg. 8,71 park avg. 9,00
genetic diversity While C. africanus showed slightly higher genetic diversity within farm populations than within park populations, the opposite trend was found for C. lanatus (table 5). On the land use group level, both species showed higher total diversity in the park. There were, however, no significant differences in genetic diversity markers between populations from farms or from the park (T-Test) for either species. All genetic diversity markers showed a trend to higher values for larger sample sizes, however only for C. africanus was level of polymorphism significantly correlated with sample size (Pearsson-test = 0,504, p < 0,05).
113
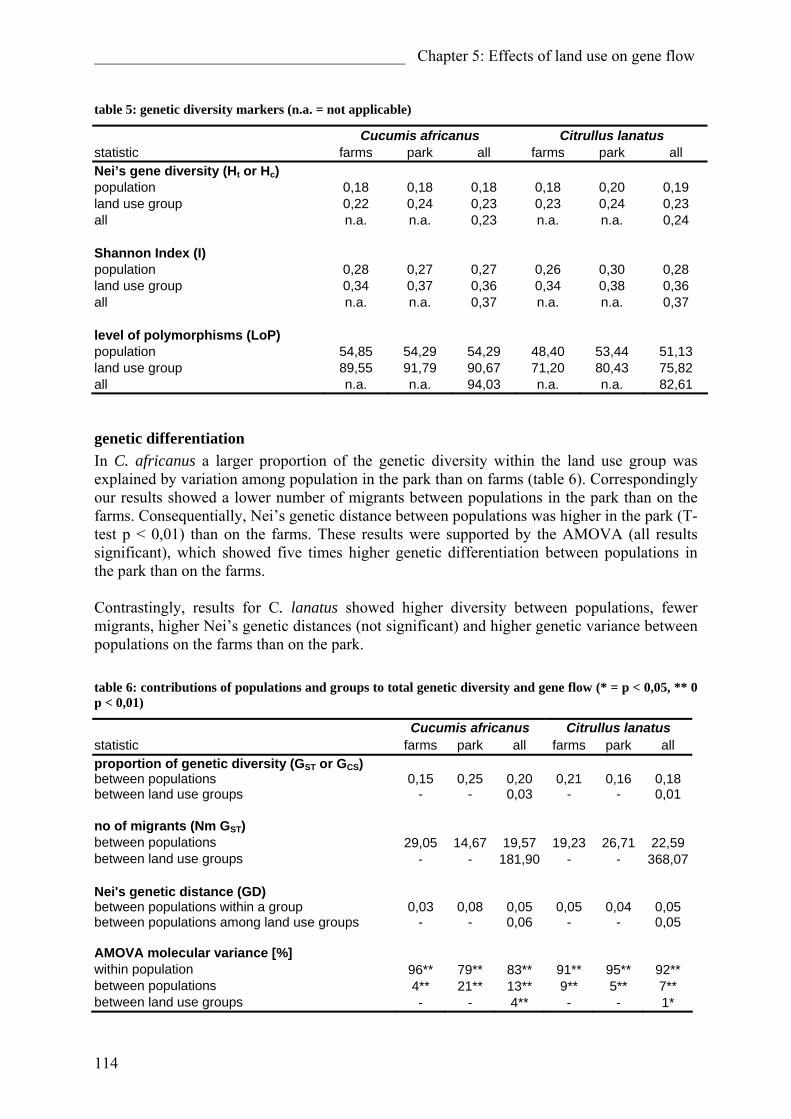
_______________________________________ Chapter 5: Effects of land use on gene flow
table 5: genetic diversity markers (n.a. = not applicable)
Cucumis africanus Citrullus lanatus statistic farms park all farms park all Nei’s gene diversity (Ht or Hc) population 0,18 0,18 0,18 0,18 0,20 0,19 land use group 0,22 0,24 0,23 0,23 0,24 0,23 all n.a. n.a. 0,23 n.a. n.a. 0,24 Shannon Index (I) population 0,28 0,27 0,27 0,26 0,30 0,28 land use group 0,34 0,37 0,36 0,34 0,38 0,36 all n.a. n.a. 0,37 n.a. n.a. 0,37 level of polymorphisms (LoP) population 54,85 54,29 54,29 48,40 53,44 51,13 land use group 89,55 91,79 90,67 71,20 80,43 75,82 all n.a. n.a. 94,03 n.a. n.a. 82,61
genetic differentiation In C. africanus a larger proportion of the genetic diversity within the land use group was explained by variation among population in the park than on farms (table 6). Correspondingly our results showed a lower number of migrants between populations in the park than on the farms. Consequentially, Nei’s genetic distance between populations was higher in the park (T-test p < 0,01) than on the farms. These results were supported by the AMOVA (all results significant), which showed five times higher genetic differentiation between populations in the park than on the farms. Contrastingly, results for C. lanatus showed higher diversity between populations, fewer migrants, higher Nei’s genetic distances (not significant) and higher genetic variance between populations on the farms than on the park. table 6: contributions of populations and groups to total genetic diversity and gene flow (* = p < 0,05, ** 0 p < 0,01)
Cucumis africanus Citrullus lanatus statistic farms park all farms park all proportion of genetic diversity (GST or GCS) between populations 0,15 0,25 0,20 0,21 0,16 0,18 between land use groups - - 0,03 - - 0,01 no of migrants (Nm GST) between populations 29,05 14,67 19,57 19,23 26,71 22,59 between land use groups - - 181,90 - - 368,07 Nei's genetic distance (GD) between populations within a group 0,03 0,08 0,05 0,05 0,04 0,05 between populations among land use groups - - 0,06 - - 0,05 AMOVA molecular variance [%] within population 96** 79** 83** 91** 95** 92** between populations 4** 21** 13** 9** 5** 7** between land use groups - - 4** - - 1*
114
_______________________________________ Chapter 5: Effects of land use on gene flow
Ward Cluster dendrograms calculated from Jaccard binary similarity coefficients between individuals showed no obvious correlation between individuals from the same population or the same land use group for either species (data not shown). However, both a UPGMA cluster analysis using Nei’s distance on a population level (Appendix 5) and a principal coordinate analysis showed some differentiation between populations. For C. africanus some populations from the area of Twee Rivieren in the park were clearly separated from the other populations, whereas the remaining populations from the park and from the farms overlapped and showed similar levels of variation (figure 1). C. lanatus showed a lower level of total variation with most farm populations showing much less variation than park populations and farm populations being arranged along a latitudinal gradient with park populations occupying intermediate positions with a high level of variation (figure 2).
115

_______________________________________ Chapter 5: Effects of land use on gene flow
farm populations
park populations
figure 1: Principal coordinates analysis (Bray Curtis distance) of Cucumis africanus populations (north to south = light to dark symbols), percentage of variance explained by Axis 1 = 30,21 & Axis 2 = 20,47
farm populations
park populations
figure 2: Principal coordinates analysis (Bray Curtis distance) of Citrullus lanatus populations (north to south = light to dark symbols), percentage of variance explained by Axis 1 = 17,68 & Axis 2 = 9,37
116

_______________________________________ Chapter 5: Effects of land use on gene flow
spatial genetic correlations A Mantel-test of correlations between linear genetic distance and geographic distance between individuals in genalex did not show significant results for either species (C. africanus R = -0,024 and p = 0,221, C. lanatus R = 0,024 and p = 0,199). We did, however, find significant correlations between kinship coefficient and logarithmic distances for a number of distance ranges. For C. africanus the kinship coefficient of pairs less than 10 km apart was much higher in the park than in the farming area (figure 3). In contrast to this, C. lanatus doesn’t show obvious differences in spatial structuring between the two landuse groups.
Cucumis africanus
-0,1
0
0,1
0,2
0,3
0,01 0,1 1 10 100 1000
geographical distance [km]
kins
hip
coef
ficie
nt
parkfarmsall
Citrullus lanatus
-0,1
0
0,1
0,2
0,3
0,01 0,1 1 10 100 1000
geographical distance [km]
kins
hip
coef
ficie
nt
allfarmspark
figure 3: kinship coefficient versus geographic distance between individuals for C. africanus (above) and C. lanatus (below)
Only C. lanatus showed significant levels of spatial structuring within land use groups over 10 km and only within the park (table 7). For all other groups there was no significant spatial correlation over larger distances. For short distances, both species showed distinctly higher kinship coefficients within the park, this result was, however, only significant for C. africanus under 1 km. For distances over 50 km, kinship coefficients were significantly smaller between individuals in the park than on the farms for C. africanus and larger for C. lanatus (T-Test) (table 8).
117

_______________________________________ Chapter 5: Effects of land use on gene flow
table 7: spatial structure within 100 km ranges (b log = regression of kinship coefficient with logarithmic distance, r2 = coefficient of determination, sp = Hardy’s spatial structure marker (2003) (significance values from 10000 permutations * = p < 0,01, ** = p < 0,001)
Cucumis africanus Citrullus lanatus average kinship coefficient for 100 closest individual pairs
0,1171 0,0904
average distance 100 closest pairs [km]
0,1391 0,0153
statistic farms park all farms park all b log 0 - 100 km -0,0047** -0,0378** -0,0222** -0,0088** -0,0079** -0,0100**r2 0 - 100 km 0,0049 0,0894 0,0453 0,0623 0,0312 0,0537 sp 0 - 100 km 0,0053 0,0428 0,0251 0,0097 0,0087 0,0110 b log 10 - 100 km n.s. n.s. -0,0079* n.s. -0,0114* -0,0155**r2 10 - 100 km - - 0,0011 - 0,0053 0,0078 sp 10 - 100 km - - 0,0089 - 0,0125 0,0170
table 8: average kinship coefficient within land use groups for different distances between individual pairs (significant differences between groups: T-test * = p < 0,05, ** = p < 0,01)
Cucumis africanus Citrullus lanatus statistic farms park farms park 0 - 1 km 0,032** 0,187** 0,028 0,645 n/ group 68 43 1 - 5 km 0,033 0,047 0,012 0,231 n/ group 158 96 50 - 100 km 0,019** -0,034** -0,012* 0,003* n/ group 880 330 100 - 150 km - - -0,033** -0,010** n/ group - 390
118

_______________________________________ Chapter 5: Effects of land use on gene flow
discussion Both C. africanus and C. lanatus generally showed high genetic diversity within and gene flow between populations. There were significant differences between farms and park that showed opposing trends for our two study species: while C. lanatus showed signs of fragmentation such as lower levels of gene flow between distant populations and lower within population genetic diversity in the farms in concurrence to our initial hypotheses (e.g. Templeton et al. 1990, Young et al. 1996), this was not the case for C. africanus. Both species had an unusually low gene diversity in comparison to other relatively widely distribute species with low levels of selfing and dispersal through ingestion (Nybom & Bartish 2000) (table 9). This is probably due to their short life-span, as both species show similar values to other annual and short-lived plant species. However, their levels of gene flow and genetic similarity between populations are much higher, probably due to highly effective long-distance dispersal. This discrepancy could possibly be explained by the fact that species that are customarily categorized as endozoochorous, based on morphology are mostly plants with fleshy fruit (Eriksson & Bremer 1992, Fischer et al. 1996), many of which are long-lived woody or clonal plants, such as many Rosaceae. Therefore, many short-lived plants that have potentially internally dispersed seeds are not included as such in comparative reports of e.g. Nybom & Bartish (2000). Both of our study species have lower GST values than those reported for the corresponding life form, with the difference being unusually high for the annual C. lanatus (0,18 vs. 0,47!). table 9 Gene Diversity per population and Gst obtained with RAPD markers, extracted from Nybom & Bartish (2000) in comparison with our data
species attributes Gene Diversity/ population Gst outcrossing 0,260 0,23 mixed breeding 0,219 0,19 wide distribution 0,208 0,33 regional distribution 0,222 0,35 annual 0,125 0,47 short-lived 0,242 0,23 dicotyledonous 0,191 0,32 seeds ingested 0,228 0,17 Cucumis africanus 0,182 0,20 Citrullus lanatus 0,191 0,18 The spatial structuring in our data corresponds partially to data shown in Vekemans & Hardy (2004) (table 10), with our values generally being similar to theirs for outcrossing or endozoochorously dispersed plants, but much lower than their herbaceous or animal-pollinated plant. An exception is C. africanus within the park, which shows much higher spatial structuring similar to other herbaceous plants. table 10 sp-statistics extracted from Vekemans & Hardy (2004) in comparison with our data
species attribute sp Cucumis africanus Citrullus lanatus self-incompatible 0,0134 farm 0,0053 0,0097 outcrossing 0,0126 park 0,0428 0,0087 mixed breeding 0,0372
all pairs all 0,0251 0,0110
herbaceous 0,0459 farm n.s. n.s. animal-pollinated 0,0171 park n.s. 0,0125 animal-dispersed 0,0088
only pairs > 10km all 0,0089 0,0170
119

_______________________________________ Chapter 5: Effects of land use on gene flow
Altogether, there are few studies available on natural population genetic patterns of short-lived, internally dispersed plants. Also, many of these have become cultivated crops, which interact with wild or feral populations. In this context, some research has been conducted on Cucurbitaceae: for example, Montes-Hernandez & Eguiarte (2002) report high levels of gene flow between wild and domesticated subspecies of Cucurbita argyrosperma, which they curiously attribute to unexpectedly high pollination distances through insects, or Gwanama et al. (2000) who studied the relations between landraces of Cucurbita moschata Duch. One of the few studies concentrating on wild populations is that of Bisht et al. (2004), that, in concurrence with our data, reports high levels of gene flow and proportion of total diversity within populations for the herbaceous annual wild cucumber Cucumis sativus var. hardwickii (Cucurbitaceae) from the western Himalayas. Contrastingly, Zoro Bi et al. (2003) and Martinez-Castillo et al. (2006) report values for population differentiation for the potentially internally dispersed, herbaceous Phaseolus lunatus L. (lima bean) that are twice as high as values found in our study, possibly due to the high self-compatibility of that species. Consequentially, we can say that similarly to other Cucurbits, total genetic diversity and gene flow in both our study species is unusually high for internally dispersed, short-lived plants. An abnormality within our study is the population genetic structure of C. africanus within the park that shows relatively high levels of spatial structuring, possibly due to recent introductions from another region. This effect however can not be excluded for farm populations, although our data do not show any support for this in the farm area. The generally high levels of diversity and gene flow over long distances have probably mostly been caused by unusually effective internal seed dispersal. It is also possible that insect-pollination is generating more effective gene flow than normal as insect pollinators in this habitat have to cover unusually large distances, due to the low densities of flowering plants (Levin & Kerster 1969). Insect pollinators have been claimed to be responsible for extensive gene flow in some cases, e.g. for seven Panamanian Ficus species (Nason et al. 1998). A further possible reason for the persistently low levels of differentiation in both species could be high soil seedbank longevity, evolved due to high temporal habitat quality variation, which would buffer any effects from the more recent developments (Templeton & Levin 1979, Hairston & De Stasio 1988, Ellner & Hairston 1994). For example, persistent seedbanks have been empirically proven to enhance genetic diversity and buffer population differentiation in the rare Clarkia sprinvillensis (Onagraceae) (Mc Cue & Holtsford 1998). Unfortunately, seedbank persistence has not been examined for our study species, but in a germination experiment (Chapter 4) they showed extremely low germination rates, which hints towards a longer seed bank persistence. However, their large seed size would suggest more transient seed banks according to Thompson et al. (1993). As C. africanus has smaller seeds, it would, therefore, perhaps have a higher seed bank persistence than C. lanatus, thus more effectively buffering the effect of genetic differentiation due to dispersal restrictions. Concurrent to our initial hypothesis, C. lanatus showed signs of decreased gene flow in the farming area whereas C. africanus does not. We had not expected, however, that C. africanus would show higher levels of gene flow among the farms than between populations within the park. Both species show relatively high levels of spatial structuring over short-distances in the park. We propose that seed size and small and large mammal abundance and mobility are the major determinators of this pattern. Since C. africanus has smaller seeds, it can potentially be dispersed by small mammals, which are more common in the park than on the farms. In comparison, their numbers and diversity is reduced in the farming area as the high numbers of sheep effectively reduce their food resources (Bergström 2004). Therefore, the high numbers
120

_______________________________________ Chapter 5: Effects of land use on gene flow
of small mammals in the park consume a larger proportion of the seeds and thus result in short average seed dispersal distances while sheep on the farms eat and disperse most of the seeds over intermediate distances. Additionally, it is possible that seed-dispersing birds like the weaverbirds are more common in the park and are thus contributing to shorter dispersal distances since they are highly territorial. Finally, for C. africanus, it is likely that plant were introduced into the area, e.g. through release of antelopes brought in from another region, which would also significantly contribute to higher spatial structuring of genetic composition. The situation is different for C. lanatus: C. lanatus has much larger seeds, also their fruit skin is harder and possibly difficult to penetrate for smaller animals, so it is likely that a larger proportion of the seeds is consumed and dispersed by antelopes or sheep, which leads to stronger spatial structure within the farming area as sheep are restricted in their long-distance movements. Due to the lower numbers of large herbivores in the park a higher number of seeds might escape being consumed and dispersed, which would explain a strong spatial pattern on a small scale in the park whereas the high numbers of sheep on the farms are probably consuming and dispersing all seeds over intermediate distances. As Cucurbits are known to hybridise successfully within and between species (Cucurbita: Wilson 1990, Montes-Hernandez & Eguiarte 2002; Citrullus Singh 1978, Fulks et al. 1979, Herrington et al. 1986; Cucumis Singh & Yadava 1984) the high levels of gene flow through effective long-distance dispersal found in our study could become a problem in landscapes with genetically engineered seed-bearing Citrullus or Cucumis species. These could then easily hybridise with wild or feral species, even if original distances between populations are too large to be covered by pollinators, as seeds that escape the fields through consumption by animals can potentially reach much larger distances. However, both Citrullus and Cucumis have been found to have low pollen fertility in the F1 hybrid generation (Sain & Joshi 2003), so the effects are difficult to predict.
121

_______________________________________ Chapter 5: Effects of land use on gene flow
122
conclusions & perspectives Our results show that dispersal by gregarious large herbivores can lead to very high levels of population genetic diversity and gene flow between distant localities. The effect of land use changes is not unequivocal, but for C. lanatus our data show a trend supporting our original hypothesis: that gene flow has become significantly restricted due to farming practices. The effect is, however, minimal at present. It would be most informative to determine, whether the rate of gene flow between the park and the areas North of it has decreased in comparison to former times with uninhibited antelope migrations as far the Okavango Delta, which is now restricted by farm and veterinary fences (Albertson 1998, Boone & Hobbs 2004, Mbaiwa & Mbaiwa 2006). We would therefore recommend extend the study and analyse gene flow levels for both species on larger scales covering most of the original antelope migration routes and test for disruptions due to veterinary fences. It would also be important to establish the effect of different small mammals abundances on a smaller scale in detail. However, as we specifically selected our study species to be most likely to show relatively quick gene flow-related responses to a shift from highly mobile, gregarious antelopes to more or less sedentary sheep, other species are very unlikely to show any effects in the short-term.

__________________________________________ Chapter 6: Conclusions & Perspectives
Chapter 6
Conclusions & Perspectives Sheep farming and the level of grazing intensity, as inferred by stocking density, farm age and distance from the watering point, showed significant effects on the vegetation. Optima of general veld condition, defined as highest levels of perennial grass cover, and total species richness occurred under different conditions. The cover of perennial grasses increased with decreasing grazing intensity, while species richness was highest at low to intermediate grazing intensity. The strength of the response to increasing grazing intensity with decreasing distance to the watering point varied between habitat types (figures 1 & 2). This is probably due to the animals’ behavioural characteristics: the sub-canopy area is used for sheltering during the heat of the day and is, therefore experiencing relatively high grazing pressure. The grassy matrix of the dune-streets, in turn, is grazed in preference to adjacent dune-crests (landowners, personal communication) resulting in the relatively lowest grazing intensity on the dune-crest.
grazing tolerant plantse.g. Schmidtia kalihariensis grazing sensitive plants
e.g. Stipagrostis ciliata
grazing intolerant plantse.g. Stipagrostis obtusa
total species number
spec
ies
num
bers
decreasing grazing intensity
sub-canopy grassy matrix dune-crest
grazing tolerant plantse.g. Schmidtia kalihariensis grazing sensitive plants
e.g. Stipagrostis ciliata
grazing intolerant plantse.g. Stipagrostis obtusa
total species number
spec
ies
num
bers
decreasing grazing intensity
sub-canopy grassy matrix dune-crest
figure 1: schematic relation of species number and grazing intensity (such as with increasing distance from watering point) with total species number per plot and grazing intensity ranges that different habitats were subjected to (extension of grey bars) (above) and species numbers of different grazing response groups (below)
On grassy matrix plots average species richness levelled off at intermediate distances from the watering point during the three year vegetation survey, but showed signs of a continuous increase for the unusually wet year of 2006. None of this is consistent with the intermediate disturbance-hypothesis developed by Grime (1973). There a number of possible explanations for this pattern: In some camps the last plots are close to the opposite fence, which might effectively increase grazing intensity as sheep often graze along the fences (landowners,
123

__________________________________________ Chapter 6: Conclusions & Perspectives
personal communication). This effect is especially likely, if the fence is against the main wind direction, as sheep preferentially graze against the wind (landowners, personal communication). Another possible reason would be the differing stocking densities, higher stocking densities create intermediate grazing intensities at greater distances from the watering point than lower stocking densities. This would cause a levelling of of the species’ numbers against distance from the watering point when curves from different farms are combined. However, the consistently high species richness beyond 160m could also be explained by the decrease of weedy species, such as Schmidtia kalihariensis, while grazing intolerant species, like Stipagrostis obtusa, are increasing (Figure 1). For other nutrient poor and/or arid systems a continuous increase of species numbers with larger distance has been reported to by typical (Skarpe 1991, Perkins & Thomas 1993, Palmer & van Rooyen 1998 Proulx and Mazumbder 1998). Similarly, a continuous increase of grazing intolerant species could potentially occur in distances farther than 2km from the watering point, which could not be included in this study due to the size of the camps. Current intermediate to high stocking densities had an adverse effect on perennial grass cover in the grassy matrix vegetation, with duration of farming and proximity of the watering point having similar effects. This is consistent with studies conducted in more mesic savanna regions (Booysen & Roswell 1983, Frost 1985, Tolsma et al. 1987, Andrew 1988, Perkins & Thomas 1993, Young & Solbrig 1993, Ringrose et al. 1996, Parker & Witkowski 1999, White 2000, Weber et al. 2000, Williams & Albertson 2006). In agreement with the modelling study of Jeltsch et al. (1997a), that reported noticeable effects of grazing under a comparable rainfall regime within 100 years, younger farms showed average perennial grass cover comparable to values found in greater distance from the watering point, while older farms had much lower average cover values indicating a slow growth of the piosphere. Although the tree-density in the Southern Kalahari is almost too low to still justify the classification of the vegetation type as savanna (Scholes & Walker 2004), the few trees are of key importance. They provide shade for the larger animals, nesting sites for birds, buffer climate extremes and provide a relatively moister und nutrient-rich environment for plants (Belsky 1993, Perkins & Thomas 1993, Milton & Dean 1995, Leistner 1996). Sub-canopy plots had the highest species richness compared to other habitats. Maximum species richness per plot was found at intermediate stocking densities, however, along a grazing gradient with increasing distance from the watering point species richness was highest farthest away, which would suggest higher sensitivity of some sub-canopy species to overutilisation. This interpretation is supported by the fact that common sub-canopy species have highest cover values and frequencies at intermediate distances, which means that the high species richness at greater distances are caused by rarer species. Dune-crests had the lowest species richness per plot, but the highest cover of perennial grasses, consisting mostly of one species, i.e. the clonal Stipagrostis amabilis. Sheep farming had only limited effects on the dune-crest vegetation with only high stocking rates showing a clear negative response on species richness and less clearly on cover of perennial grasses.
124

__________________________________________ Chapter 6: Conclusions & Perspectives
Stipagrostis amabilis
Centropodia glauca
Stipagrostis ciliata
Stipagrostis obtusa
Schmidtia kalihariensis
Rhigozum trichotomum
Lycium hirsutum
Eragrostis biflora
Pollichia campestris
Solanumcapense
Amaranthus thunbergii
Hermbstaedtia fleckii
Acrotome inflata
Dis
tanc
e fro
mth
ew
ater
ing
poin
tgrassy matrix sub-canopy areadune-crest
figure 2: Schematic illustration of the effect of increasing distance from the watering point from 0-2000m under high stocking densities on species composition of the three habitat types - dune-crest, grassy matrix and sub-canopy area (only most common species depicted)
125

__________________________________________ Chapter 6: Conclusions & Perspectives
However, if land use was switched to game farming, vegetation differentiation to neighbouring sheep camps was undetectable to very slow within 6–23 years at current antelope stocking densities, which is in agreement to the slow vegetation reactions to sheep grazing. Total species numbers were slightly higher on game camps and the cover of perennial grasses increased on grassy matrix plots within the game camps relative to sheep camps. This effect, however, was only visible on plots in large distances from the watering point. Furthermore, game camps showed lower cover values of perennial forbs and shrubs, which typically are of low grazing value to sheep, but are browsed by antelopes (du Toit 1990, Skinner & Smithers 1990, Owen-Smith 1999). In contrast, the studies by Smet & Ward (2005, 2006) report a much faster and comprehensive reaction of the vegetation with a recovery of the vegetation on former cattle ranches within 10 years of game farming in an Acacia savanna with 388 mm average annual precipitation. This slow recovery of the perennial grasses could be partially due to seed dispersal limitations. It is likely that seedbank persistence for the large-seeded, perennial grasses is low (O’Connor 1991, Milton & Dean 1995, van Rooyen 2000), as highly degraded areas don’t regenerate within decades of animal exclusion (Dean & MacDonald 1994, Jeltsch et al. 1997b, Palmer & van Rooyen 1998 van Rooyen 2000). Especially Stipagrostis spp. and Centropodia glauca, that are the most important grasses under good veld conditions, have low long-distance dispersal potentials. However, in agreement with the study of Dean et al. (1999), species with relatively higher wind dispersal potentials were most important in the grassy matrix. Animal dispersal potentials were relatively low, although dispersal potential in springbok fur was highest in this habitat. There were no significant differences between endozoochorous dispersal potentials of sheep and antelopes for grass seeds. Acacia spp. have been known to be dispersed endozoochorously with ingestion effectively increasing the number of viable seeds (Eloff 1959, Ernst & Tolsma 1990), as seed predation by bruchid beetles can destroy up to 100 % of the annual seed production (Coe & Coe 1987). Accordingly, all Acacia spp. seeds were germinating in great numbers during our endozoochory experiments. Seedlings germinating from faeces during a greenhouse trial were significantly more frequent in antelope dung than in sheep dung, but the effect on adult tree-density is difficult to predict as Acacia spp. regeneration is probably more limited by sufficient water supplies after germination than seed numbers (Hoffman et al. 1995, van Rooyen et al. 1984, 1990, Theron et al. 1985). Many typical for the sub-canopy areas had relatively high zoochorous dispersal potentials, indicating adaptation to higher levels of animal activity as suggested by Dean et al. (1999). Due to diaspore characteristics and the rarity of flooding in the Duneveld area, effective abiotic dispersal potentials are likely to be low, even though many species showed high water dispersal potential during simulation trials. This effectively leaves animals to disperse seeds over larger distances. Therefore, even small differences in dispersal potential are likely to induce significant responses on the long-term. Consequently, the replacement of a range of gregarious antelopes with sedentary sheep has severe effect on the potential and effective long-distance dispersal potential for many species. This could have been partially responsible for the observed differences in species-richness and -composition in comparison with the more species-rich Kgalagadi Transfrontier Park (van Rooyen & van Rooyen 1998) or the older study by Leistner (1967). Consistently, dispersal limitations due vector change and mobility restrictions, probably were the reason for the observed decrease of genetic diversity within populations and geneflow of
126

__________________________________________ Chapter 6: Conclusions & Perspectives
the putatively more sensible of the two examined plant species within the farming area in comparison to the adjacent Kgalagadi Transfrontier Park. However, the negatively affected species, Citrullus lanatus ssp. lanatus var. caffer (Schrad.) Mansf., a large-seeded, internally dispersed wild melon, had been specifically selected due to its characteristics making it sensitive to animal disperser shifts and show quick responses. In contrast, the other studied species, Cucumis africanus L.f., even showed an increase of local genetic diversity and geneflow in the farming area. As most other plant species probably do not exclusively rely on large mammalian herbivores for the dispersal of their seeds and/or are pollinated by wind, chances of a reduced geneflow are low in the short-term. We hypothesise, that, therefore, there is a low risk of genetical degradation due to current land use strategies for other the plant species. Recapitulating, we would, therefore, recommend to lower stocking densities to or under a level of 3,51 livestock units per km2, which is equivalent to a herd of ca. 340 sheep (ewes) on a typical four camp system with an average camp size of 368ha (Chapter 2). It might be possible to compensate for financial losses by prudently increasing the numbers of browsing or grazing/ browsing antelope species, such as springbok, eland and kudu (du Toit 1990, Skinner & Smithers 1990, Owen-Smith 1999), notwithstanding the costs involved and lower income through lower meat prices for venison. Many studies on exclusive or mixed game-farming are showing promising results (Cooke 1985, Dekker 1998, van der Waal & Dekker 2000, Saltz et al. 2004) with indigenous antelopes being better adapted to drought and local pests and diseases. Not only would that allow a more balanced and sustainable utilisation of the veld (du Toit 1990, Skinner & Smithers 1990, Owen-Smith 1999), it would also be beneficial for the dispersal of many dicotyledonous plant species, which antelopes were dispersing endozoochorously in much higher quantities and over larger distances than sheep. However, it is necessary that stocking densities on game farms are appropriately suited to the local conditions, which can not be directly derived from livestock carrying capacities (Bothma et al. 2004). Furthermore, to allow for efficient long-distance dispersal and, therefore, effective geneflow, over larger distances the establishment of wider corridors along the dry riverbeds should be considered. However, climate change alone, with a predicted increase in local temperatures of ca. 3°C and ca. 5% decrease in annual rainfall with a higher frequency of extreme rainfall events, is predicted to result in the extinction of 16,4% of the species in the Kgalagadi Transfrontier Park within the next 100 years (Schulze 1997, Rutherford et al. 1999, Christensen et al. 2007) and a remobilisation of the Southern Kalahari dunes by 2039 (Thomas et al. 2005). The climate zone associated with Nama Karoo (including the Southern Kalahari) is projected to move several hundreds of kilometres southwards and eastwards within South Africa (Rutherford et al. 1999). For example, the climate zone appropriate for Stipagrostis amabilis, the dominant perennial grass on the dunes acting as the most important stabiliser of the sand, is predicted to shift completely out of the Southern Kalahari by 2050 (Rutherford et al. 1999b). The combined effects of climate change and sheep farming are likely to aggravate and/ or speed up the species loss in the whole farming area as well as the mobilisation of the dunes on more intensively stocked farms. Although the climate change predictions are well-supported (Christensen et al. 2007), it is possible that effects might be less pronounced than suspected, for example if plant species prove to be more flexible than expected, or be moderated by rapid and effective human counter-measures. But even if the effects are as serious as predicted, the immigration of plant species currently adapted to the anticipated conditions might at least partially buffer the species losses in the Southern Kalahari. However, in their study on climate change effects on
127

__________________________________________ Chapter 6: Conclusions & Perspectives
128
biome shifts, Rutherford et al. (1999) did not find a biome type currently typical for environmental conditions anticipated for the Southern Kalahari. Furthermore, even within the Kalahari, plant dispersal under the current land use system might be too limited to ensure a migration of plant species to the North as most species have low wind dispersal, but high zoochorous dispersal potentials. Also, although the Kalahari environment appears to be relatively homogeneous over long-distances small local variations in soil factors might prevent the establishment of migrating species (Ringrose et al. 2003). Altogether, it is likely that the appropriate grazing densities of sheep will be declining in the future with water provision by pipeline also being likely to be limited (Hulme 1996, Christensen et al. 2007). A shift to land use forms more compatible with drier climates, such as game farming and/on larger farm sizes (e.g. Cooke 1985), could attenuate or slow down the predicted changes and secure a more sustainable income for the remainder of this century. The restoration of currently degraded areas, which is already an almost indiscernible process (van Rooyen 2000, Jeltsch et al 1997b), might become increasingly difficult and expensive. A complete exclusion of sheep and antelopes during seed maturation is, however, not advisable as so many plant species are animal dispersed. Once the seedlings have germinated, animals should be excluded until the plants are reaching seed maturity again to prevent the young, highly palatable seedling from being consumed or trampled. In heavily degraded areas with bare dunes and dune-streets encroached by Rhigozum trichotomum or otherwise dominated by bare soils or Schmidtia kalihariensis after good rainfalls, seed banks are depleted over large areas (O’Connor 1991, van Rooyen 2000). In face of the fact that most species have limited wind dispersal potentials, water dispersal is likely to be sporadic at best and that improving migration possibilities for game may not be a realistic option in the near future, sowing of desirable perennial grasses might be the only option to improve veld condition (Milton & Dean 1995). However, costs are high and seed predation by birds, rodent and especially ants (for smaller seeds) may be result in severe seed losses (van Rooyen 2000). To enhance regeneration probability, sowing should be ante-ceded by mechanical removal of R. trichotomum or bushes, of which the cut branches can be used to cover bare areas, especially on the dunes, which helps trapping wind-dispersed seeds and wind-blown fine soil particles which improve the depleted nutrient content of degraded dunes (van Rooyen 2000). However, the success of seedling-establishment, especially if high numbers of S. kalihariensis seeds are present, is variable and severely limited by rainfall (Gutterman 1993, Milton & Dean 1995) with failures being a common result of many restoration attempts (Snymann 1999).

_________________________________________________________________ Summary
Summary
Land degradation in semi-arid to arid savannas is often associated with overgrazing in combination with droughts. This generally results in bush-encroachment, a shift from palatable, large-seeded perennial grasses to less palatable, annual grasses, an increase in bare ground and a decrease in species richness. The causes and processes are not fully understood, although current hypotheses state that stress-adapted, perennial species are more sensitive to disturbance and are replaced by disturbance tolerant species, that profit from the empty space and higher water supply once the cover of perennial grasses has thinned. The sensitivity of a plant to disturbance, such as herbivory, is likely to be dependant on form and degree as well as timing of the disturbance. Disturbance factors commonly encountered in an environment are likely to be countered by the evolution of tolerance or resistance or even mutualistic relationships, while new disturbances could presumably have strong negative effects, culminating in (local) extinction if the plant can not adapt fast enough or the disturbance persists. The Southern Kalahari Duneveld has not been subjected to continuous high levels of grazing until recently, as there are no permanent surface sources of water. Indigenous antelopes opportunistically utilised the region whenever fresh growth was available after good rainfalls and migrated north during the dry season. The area was considered valuable grazing land as the nutrient quality of the grasses is still adequate for livestock in its dry winterstate and serious pests and diseases are absent. Therefore, permanent commercial farms were established in the area from the early to mid 20th century, using borehole water and a fresh-water pipeline from the Orange to supply themselves and their stock, most of which are sheep. Although sheep are commonly rotated between camps, so grazing pressure is not exactly permanent, the vegetation is subjected to grazing pressures far beyond those it has adapted to and extending into seasons where antelopes were not present in the area. Furthermore, antelope numbers fluctuated more strongly with many animal dieing during droughts and numbers only slowly recovering thereafter. In contrast, sheep numbers are kept relatively stable with farmers providing extra food during droughts. Parallely, antelope numbers declined, due to active measures or indirect effects. Consequently, the vegetation is not only subjected to new disturbances, it also potentially looses mutualistic benefits that have evolved with the indigenous herbivores, such as seed dispersal and associated maintenance of geneflow over large distances. Available literature reports that vegetation of the arid to semi-arid Southern Kalahari is relatively resistant to current grazing pressures and no effect of distance to watering point on the vegetation could be detected in the adjacent Kgalagadi Transfrontier Park. In concurrence, simulation models using climate scenarios corresponding to the region showed no effect of grazing under low or intermediate grazing levels within 50 years. However, the simulation model did show distinct degradation after 100 years under all grazing levels. Consistently, degradation can be observed with high levels of shrub-encroachment and bare soil around watering points, especially on older farms. This study aimed at determining the extent of degradation caused by sheep farming in the Southern Kalahari Duneveld under a range of stocking densities and in increasing distance to the watering point, comparing older and younger farms. For this purpose, the direct effect on species composition and cover values was examined in an extensive vegetation survey
129
_________________________________________________________________ Summary
130
including the dune-valleys, the dune-crest and sub-canopy vegetation under larger trees. The survey on the sheep camps was supplemented with game camps on former sheep camps to test for possible differentiation. Furthermore, the impact of the change of available animal dispersal vectors and their mobility on long-distance dispersal potential and geneflow was determined in an exemplary manner for selected plant species. Our results showed a negative impact of high grazing intensity on cover of perennial grasses, life-form and species richness, with highest species richness for intermediate to low grazing intensities. The three habitats were floristically and functionally distinct from each other and differed in their responses to grazing pressures. Total species richness was lower and functional composition more indicative of a stressful environment than reported in an older study conducted in the area and a study from the Kgalagadi Transfrontier Park. Game farming did not result in a significant differentiation to adjacent sheep camps, however, cover of perennial grasses and total species richness were higher than on sheep camps, while cover of perennial forbs and shrubs was lower. Long-distance dispersal potentials were determined using standardised experiments, supplemented with a germination experiment with collected dung samples of sheep and antelopes. Wind dispersal potentials were generally relatively low, while water dispersal potentials were high. Epizoochorous dispersal potentials differed between sheep and antelopes, with all species being dispersed better in sheep fur than in springbok fur. Experimentally determined endozoochorous dispersal potential was high for many species. The germination experiment showed significant differences between numbers and composition of seedling emerging from sheep and antelope dung. While grass seedlings emerged in equal numbers, dicotyledonous species germinated in higher numbers from game dung. In a population genetic study for two endozoochorously dispersed plant species, geneflow, population differentiation and local genetic diversity were analysed in the farming area in comparison with the adjacent Kgalagadi Transfrontier Park. The data illustrate a detrimental effect of the current landuse on the putatively more sensitive species, displayed as lower population genetic diversity and higher between population differentiation within the farming area. Detrimental effects on the vegetation are likely to aggravate over time, resulting in a decrease in species richness and veld condition. As flooding events are rare and wind-dispersal potentials are low, plants are strongly depending on animals to disperse their seeds over long distances and maintain geneflow. Therefore, the differences in dispersal potential through sheep and antelopes are likely to cause vegetation differentiation in the long-term and were possibly partially responsible for veld degradation and species losses. Effects of vector change and fencing are likely to have been responsible for the genetic deterioration observed in one of the examined species, effectively experiencing fragmentation of the habitat. However, the species was selected due to its character combination making it most likely to be sensitive to the local landuse changes and effects are significant, but, as yet, small. Consequently, the risk of genetic degradation for the remainder of the species is not likely to be critical in the short-term. Therefore, we recommend a lowering of stocking densities to or below 3,51 livestock units/km2 and suggest a shift from livestock to mixed or exclusive game farming in appropriate stocking densities. To maintain long-distance geneflow the establishment of corridors should be considered. For the restoration of degraded veld, it might be necessary to sow seeds of desirable grasses as abiotic dispersal is not likely to result in the natural regeneration. As the risk of degradation due to overgrazing increases is likely to aggravate in the face of the predicted climate changes the adaptation of the farming methods to the sensitive environment might delay negative effects or even enable a sustainable land utilisation on the long-term.

__________________________________________________________ Acknowledgements
Acknowledgements
The project was funded by the BMBF (German ministry for education and research) via the BIOTA project within the framework of the BIOLOG biodiversity complex. Maritjie Smit in the name of the Northern Cape Nature Conservation generously provided collecting and export permits for herbarium specimen and seeds. The South African National Parks Board enabled research in the Kgalagadi Transfrontier Park which was greatly facilitated by the staff in the park. Many people helped with the design, implementation, analysis and presentation of this project, by either scientific or moral support or both. Without them this study would not have been possible. I am greatly indebted to all of them. I am especially grateful to my supervisor Prof. Peter Poschlod who gave essential input on all stages of the project. Dr. Christoph Reisch’s generous assistance was essential to the implementation of the population genetic analysis and highly appreciated. I would also like to thank Prof. Dr. Steven Higgins for agreeing to be the second referee of this thesis. Seppie Esterhuysen, (regional agricultural extension officer), Nico de Wet (former agricultural extension officer), Elias le Riche (former warden of the Kgalagadi Transfrontier National Park) and many farmers provided critical insight into farming practice and local veld knowledge with constituted the foundation on which this project was developed. All farmers offered exceptional hospitality and support, making us feel like welcome guests whenever we visited them for interviews, offering many a cool drink or full blown Kalahari braai. I would like to express my deepest gratitude especially towards Manda and Nico de Wet, Retha and Johan Stadler, Elda and Hennie Shoeman, Willie Snyman, Johanna & Kruger du Toit, Miems Krugel and Rainier Liebenberg (†). Our landlords, Hannetjie and Pittie van der Westhuizen were always supportive in every possible way which made us feel at home in Askham and made everything from finding phone numbers to organising spare parts for the bakkie a lot easier. Bernd Wasiolka, a collegue from Potsdam, helped with many small daily problems in his incredibly practical way. In South Africa Sue Milton, Conny and Rainer Krug, Charles Musil and Derryck de Witt generously provided greenhouse space and practical support during the dung germination trials at the University of Stellenbosch and at the Botanical Institute of South Africa in Kirstenbosch, Cape Town. Species identification at the Compton Herbarium in Kirstenbosch was greatly facilitated by the help of Edwina Marinus and the scientific staff. In Germany our lab assistants Inge Lauer, Petra Schitko, Peter Hummel and Günther Kolb helped in all possible ways enduring frequent interruptions in their work. Wioletta Moggert, our departmental secretary, provided much appreciated organisational support and acted as a viable emergency contact during field periods. My collegues Martijn Kos, Gerriet Fokuhl, Sven Himmelreich, Rosa Maria Lo Presti and many other members of the department patiently answered all questions put to them regarding all aspects of this project and were essential for the daily progress. I am furthermore especially grateful to Andreas Frisch, Martijn Kos and Heidrun Will for reading and commenting on earlier drafts of sections of this thesis. Niels Blaum and his colleagues at the university of Potsdam assisted with financial and practical organisation of the project.
131

__________________________________________________________ Acknowledgements
132
Fanny Langerwisch, Gregor Pachmann, Kathrin Stroka and Martin Leipold helped with the collection of the data in the field and at home, which made fieldwork a manageable and pleasant exercise. Many other students further helped with experiments and data capture. I am deeply thankful to Helen and Brian Daniels and Willie Snyman for providing permanent homes for Ziggy and Snoopy, our adopted stray dogs, whose company always cheered me up, and who zealously guarded our property in Askham. Without the constant support of my parents and my in-law family in Cape Town, this thesis would neither have been started nor finished. And thanks a million times to my husband, Trygve Horn, for his love and support through good times and bad times.
THANK YOU ALL FOR YOUR HELP!

________________________________________________________________ References
References Abel, N.O.J. (1993). Reducing cattle numbers on southern African communal range: is it worth it? In: Behnke,
R. H., Scoones, I. & Kerven,C. (eds.). Range Ecology at Disequilibrium: New Models of Natural Variability and Pastoral Adaptation in African Savannas. London: Overseas Development Institute, 173-195.
Abel, N.O.J. & Blaikie, P.M. (1989). Land degradation, stocking rates and conservation policies in the communal rangelands of Botswana and Zimbabwe. Land Degradation and Rehabilitation 1, 101-123.
Abel, N.O.J., Flint, M.E., Hunter, N.D., Chandler, D. & Maka, G. (1987). Cattle-keeping, ecological change and communal management in Ngwaketse. Addis Ababa: I.L.C.A., Gaborone: Integrated Farming Pilot Project, Ministry of Agriculture, and Norwich: Overseas Development Group, University of East Anglia.
Acocks, J.P.H. (1953). Veld types of South Africa. Memoirs of the Botanical Survey of South Africa 28.
Albertson, A. (1998). Northern Botswana veterinary fences: Critical ecological impacts. Maun: Okavango People’s Wildlife Trust. http://www.stud.ntnu.no/~skjetnep/owls/fences/index.html, accessed 13/05/07.
Andrew, M.H. (1988). Grazing impact in relation to livestock watering points. Trends in ecology and evolution 3, 336-339.
Anonymous (2001). Siyanda District Municipal Census IDP. http://www.siyanda-dm.co.za, accessed 05/05/07.
Apps, P. (2000) Smither’s Mammals of Southern Africa. A field guide. Struik Publishers, 166-231.
Aranibar, J. N. & Macko, S.A. (2005). SAFARI 2000 Plant and Soil C and N Isotopes, Southern Africa, 1995-2000. Data set. Available on-line [http://daac.ornl.gov/] from Oak Ridge National Laboratory Distributed Active Archive Center, Oak Ridge, Tennessee, U.S.A.
Aranibar, J.N., Otter, L., Macko, S.A., Feral, C.J.W., Epstein, H.E., Dowty, P.R., Eckardt, F., Shugart, H.H., & Swap, R.J. (2004). Nitrogen cycling in the soil-plant system along a precipitation gradient in the Kalahari sands. Global Change Biology 10, 359-373.
Archer, S. (1989). Have Southern Texas Savannas Been Converted to Woodlands in Recent History? Am. Nat. 134, 545-561.
Augustine, D.J. (2003). Long-term, livestock-mediated redistribution of nitrogen and phosphorus in an East African savanna. Journal of Applied Ecology 40, 137-149.
Austerlitz, F. & Garnier-Géré, P.H. (2003). Modelling the impact of colonisation on genetic diversity and differentiation of forest trees: interaction of life cycle, pollen flow and seed long-distance dispersal. Heredity 90.
Barker, J. F. (1983). Towards a biogeography of the Kalahari; Part 1 and 2. Botswana Not. Rec. 15, 85-98.
Barnes, D. (1979). Cattle ranching in the semi-arid Savannas of east and southern Africa. In Walker, B. (ed.). Management of Semi-Arid Ecosystems, Elsevier, The Netherlands, 9-54.
Barnes, P. (1998). Herbage yield and quality in four woody forage plants in a sub humid environment in Ghana. Agroforestry System 42, 25-32.
Barnes, M.E. (2001a). Effects of large herbivores and fire on the regeneration of Acacia erioloba woodlands in Chobe National Park, Botswana. Afr. J. Ecol. 39.
Barnes, M.E. (2001b). Seed predation, germination and seedling establishment of Acacia erioloba in northern Botswana. Journal of Arid Environments 49, 541-554.
Barnes, R.D., Fagg, C.W. & Milton, S.J. (1997). Acacia erioloba, monograph and annotated bibliography. Oxford Forestry Institute Tropical Forestry Paper 35, 1-41.
Baskin, C.C. & Baskin, J.M. (1998). Seeds - ecology, biogeography and evolution of dormancy and germination. Academic press, San Diego, California.
Bekker, R.M., Bakker, J.P., Grandin, U., Kalamees, R., Milberg, P., Poschlod, P., Thompson, K. & Willems, J.H. (1998). Seed size, shape and vertical distribution in the soil: indicators of seed longivity. Functional Ecology 12(5), 834-842.
133

________________________________________________________________ References
Bergström, A. (2004). Small mammal diversity in Kalahari - impact of land-use and pans in a semi-arid savanna, southwestern Botswana. Minor Field Study 105. Committee of Tropical Ecology, Uppsala University, Sweden.
Bergström, R. & Skarpe, C. (1985). Characteristics of the Kalahari sand in western Botswana. Meddelande fran Väixtbiologiska Institutionen 1985, 3.
Bergström, R. & Skarpe, C. (1999). The abundance of large wild herbivores in a semi-arid savanna in relation to seasons, pans and livestock. African Journal of Ecology 37, 12-26.
Bews, J.W. (1917). The plant succession in the thorn veld. South Afr. Assoc. Advancement Sci. 7, 121.
Biot, Y. (1988). Forecasting productivity losses caused by sheet and rill erosion in semi-arid rangeland: a case study from the communal areas of Botswana. Ph.D. Thesis, University of East Anglia, Norwich.
Biot, Y. (1993). How long can high stocking densities be sustained? In: Behnke, R.H., Scoones, I. & Kerven, C. (eds.). Range ecology at disequilibrium: new models of natural variability and pastoral adaptation in African savannas. London: Overseas Development Institute, 153-172.
Bisht, I.S., Bhat, K.V., Tanwar, S.P.S., Bhandari, D.C. & Joshi, K. (2004). Distribution and genetic diversity of Cucumis sativus var. hardwickii (Royle) Alef in India. Journal of Horticultural Science & Biotechnology 79, 783-791.
Blaum, N., Rossmanith, E., Schwager, M, & Jeltsch, F. (in press). Responses of mammalian carnivores to land use in arid Kalahari rangelands. Basic and Applied Ecology. doi:10.1016/j.baae.2006.09.003.
Bleher, B. & Böhning-Gaese, K. (2001). Consequences of frugivore diversity for seed dispersl, seedling establishment and the spatial pattern of seedlings and trees. Oecologia 129, 385-394.
Bond, W.J., Honig, M. & Maze, K.E. (1999). Seed size and seedling emergence: an allometric relationship and some ecological implications. Oecologia 120, 132-136.
Bonn, S. & Poschlod, P. (1998). Ausbreitungsbiologie der Pflanzen Mitteleuropas. Grundlagen und kulturhistorische Aspekte. Quelle and Meyer, Wiesbaden, Germany.
Boone, R.B. & Hobbs, N.T. (2004). Lines around fragments: Effects of fragmentation on large herbivores. African Journal of Range and Forage Science 21, 79-90.
Booysen, J. & Roswell, D.I. (1983). The drought problem in the Karoo areas. Proc. Grassl. Soc. S. Afr. 18, 4045.
Bredenkamp GJ, Spada F, & Kazmierczak E. (2002). On the origin of northern and southern hemisphere grasslands. Plant Ecology 163, 209-229.
Brown, J.R. & Archer, S. (1987). Woody plant seed dispersal and gap formation in a North American subtropical savanna woodland: the role of domestic herbivores. Vegetatio 73, 73-80.
Buckley, R.C., Gubb, A. & Wasson, R.J. (1987a). Parallel duneveld ecosystems: predicted soil nitrogen gradient tested. J. Arid Environ. 12, 105-110.
Buckley, R.C., Wasson, R.J. & Gubb, A. (1987b). Phosphorus and potassium status of arid duneveld soils in central Australia and southern Africa, and biogeographic implications. J. Arid Environ. 13, 211-216.
Buffington, L.D. & Herbel, C.H. (1965). Vegetational Changes on a Semidesert Grassland Range from 1958 to 1963. Ecol. Monogr. 35, 139-164.
Bugla, B. & Poschlod, P. (2005). Biotopverbund für die Migration von Pflanzen – Förderung von Ausbreitungsprozessen statt „statischen“ Korridoren und Trittsteinen. Das Fallbeispiel „Pflanzenarten der Sandmagerrasen“ in Bamberg, Bayern. In: Reck, H., Haenel, K., Böttcher, M. & Winter, A. (eds.). Lebensraumkorridore für Mensch und Natur. Naturschutz und Biologische Vielfalt 17. Bundesamt für Naturschutz, Bonn- Bad Godesberg, 101-117.
Bullard, J.E., Thomas, D.S.G., Livingstone, I. & Wiggs, G.F.S. (1996). Wind energy variations in the southwestern Kalahari Desert and implications for linear dunefield activity, Earth Surface Processes and Landforms 21, 263-278.
Bunch, T.D., Wu, C., Zhang, Y.-P. & Wang, S. (2006). Phylogenetic Analysis of Snow Sheep (Ovis nivicola) and Closely Related Taxa. Heredity 97, 21-30.
Butzer, K.W. (1974). Paleoecology of South African australopithecines: Taung revisited. Curr. Anthropol. 15, 367-382.
134

________________________________________________________________ References
Christensen, J.H., Hewitson, B., Busuioc, A., Chen, A., Gao, X., Held, I., Jones, R., Kolli, R.K., Kwon, W.-T., Laprise, R., Magaña Rueda, V., Mearns, L., Menéndez, C.G., Räisänen, J., Rinke, A., Sarr A. & Whetton, P. (2007). Regional Climate Projections. In: Solomon, S., Qin, D., Manning, M., Chen, Z., Marquis, M., Averyt, K.B., Tignor, M. & Miller, H.L. (eds.). Climate Change 2007: The Physical Science Basis. Contribution of Working Group I to the Fourth Assessment Report of the Intergovernmental Panel on Climate Change. Cambridge University Press, Cambridge, United Kingdom and New York, NY, USA.
Coe, M. & Coe, C. (1987). Large herbivores, acacia trees and bruchid beetles. South African Journal of Science 83, 624-635.
Cole, C.T. (2003). Genetic variation in rare and common plants. Annual Review of Ecology, Evolution, and Systematics 34, 213-237.
Cooke, H.J. (1985). The Kalahari today: a case of conflict over resource use. Geographical Journal 151, 75-85.
Cooper, S.M. & Owen-Smith, N. (1985). Condensed tannins deter feeding by browsing ruminants. Oecologia 67, 142-146.
Cowling, R.M., Gibbs Russel, G.E., Hoffman, M.T. & Hilton-Taylor, C. (1989). Patterns of plant species diversity in southern Africa. In Huntley, B.J. (ed.). Biotic diversity in Southern Africa. Oxford University Press, Cape Town, pp. 19-49.
Crawley, M.J. (1983). Herbivory: dynamics of plant-animal interactions. University of California Press, Berkeley, Calif..
Dahlberg, A.C. (1996). Interpretations of environmental change and diversity: A study from North East District, Botswana. Ph.D. Dissertation Series 7. The Department of Physical Geography, Stockholm University.
Dart, R.A. (1926). Taungs and its significance. Nat Hist 26, 315-327.
Deacon, J. & Lancaster, N. (1988). Late Quaternary palaeoenvironments of Southern Africa. Clarendon Press, Oxford.
Dean, W.R.J. & MacDonald, I.A.W. (1994). Historical changes in stocking rates of domestic livestock as a measure of semi-arid and arid rangeland degradation in the Cape Province, South Africa. J. Arid Environ. 26, 281-298
Dean, W.R.J., Milton, S.J. & Jeltsch, F. (1999). Large trees, fertile islands, and birds in arid savanna. Journal of Arid Environments 41, 61-78.
Dean,W.R., Milton, S.J., du Plessis, M. & Siegfried,W.R. (1993). Dryland Degradation: Symptoms, Stages, and Hypothetical Cures. In: Roundy, B. A. et al. (eds.). Proceedings: Wildland Shrub andarid land restoration symposium. Las Vegas, NV, Gen Tech. Rep. INT-GTR-315. Ogden, Utah, USDA USFS Intermountain Research Satation.
de Miguel, J.M. (1989). Estructura de un sistema silvopastoral de dehesa. Vegetacion, habitats y uso del territorio por el ganado. Ph.D. Thesis, Universidad Complutense de Madrid.
Denbow, J.R. (1984). Prehistoric herders and foragers of the Kalahari: The evidence for 1500 Years of interaction. In: Schririe, C. (ed.). Past and present in hunter gatherer studies. Orlando, 175-193.
Denbow, J.R. & Wilmsen, E. (1986). The advent and course of pastoralism in the Kalahari. Science 234, 1509-1515.
de Wet, N.J. (1983). Die role van `n demonstrasieplaas as voorligtingskanaal. M. Inst. Agrar. University of Pretoria.
Dougill, A. & Cox, J. (1995). Land degradation and grazing in the Kalahari: new analysis and alternative perspectives. ODI Pastoral Development Network Series, Rep. 38.
Dregne, H.E. (1968). Appraisal of research on surface materials of desert environments. In: McGinnies, W.G., Goldman, B.J. & Paylore, P. (eds.) Deserts of the World - an appraisal of research into their physical and biological environments. University of Arizona Press, Tucson, 285-377.
du Toit, A.L. (1952). Geology of South Africa, 3rd ed. Oliver and Boyd, London.
du Toit, J.T. (1990). Feeding-height stratification among Africa browsing ruminants. African Journal of Ecology 28, 55-61.
Dudley, J.P. (1999). Seed dispersal of Acacia erioloba by African bush elephants in Hwange National Park, Zimbabwe. Afr. J. Ecol. 37, 175-185.
135

________________________________________________________________ References
Ellery, W.N., Scholes, R.J. & Mentis, M.T. (1991). An initial approach to predicting the sensitivity of South African grassland biome to climatic change. South African Journal of Science 87, 499-503.
Ellery, W.N., Scholes, R.J. & Scholes, M.C. (1995). The distribution of sweetveld and sourveld in South Africa’s grassland biome in relation to environmental factors. African Journal of Range and Forage Science 12, 38-45.
Ellis, J.E. & Swift, D.M. (1988). Stability of African pastoral ecosystems: alternate paradigms and implications for development. Journal of Range Management 41, 450-459.
Ellis, R.P., Vogel, J.C. & Fuls, A. (1980). Photosynthetic pathways and the geographical distribution of grasses in South West Africa/ Namibia. S. Afr. J. Sci. 76, 307-314
Ellner, S. & Hairston, N.G. Jr. (1994). Role of overlapping generations in maintaining genetic variation in a fluctuating environment. American Naturalist 143, 403-417.
Ellner, S. & Shmida, A. (1981). Why are adaptations for long-range seed dispersal rare in desert plants? Oecologia 51, 133-144.
Eloff, P.F.C. (1959). Observations on the migration and habits of the antelopes of the Kalahari Gemsbok Park. Koedoe 2, 1-51.
Eloff, T. (2002). The economic realities of the game industry in South Africa. In: Ebedes, H., Reilly B., Van Hoven, W. & Penzhorn, B. (eds.). Sustainable Utilisation-conservation in pratice. In: Bothma, J. Du P. 2005. Extensive Wildlife Production in South Africa. Keynote address: Wildlife Seminar, Northern Game Farmers’ Organisation, Pretoria.
Eriksson, O., & Bremer, B. (1992). Pollination systems, dispersal modes, life forms, and diversification rates in angiosperm families. Evolution 46, 258-266.
Ernst, W.H.O., Veenendal, E.M., V. & Kebakile, M.M. (1992). Possibilities for dispersal in annual and perennial grasses in a savanna in Botswana. Vegetatio 102, 1-11.
Esler, K.J. (1999). Plant reproductive ecology. In: Dean, R. & Milton, S.J. (eds.). The Karoo, 123-144.
Estrada, A. & Coates-Estrada, R. (1991). Howler monkeys (Alouatta palliata), dung beetles(Scarabaeidae) and seed dispersal: Ecological interactions in the tropical rain forest of Los Tuxtlas, Mexico. Journal of Tropical Ecology 7, 459-474.
Estrada, A., Halffter, G., Coates-Estrada, R. & Meritt, D.A., Jr. (1993). Dung beetles attracted to mammalian herbivore (Alouatta palliata) and omnivore (Nasua narica) dung in the tropical rain forest of Los Tuxtlas, Mexico. J. Trop. Ecol. 9, 45-54.
Feeny, P. (1976). Plant apparency and chemical defences. Recent Advances in Phytochemistry 10, 1-41.
Feral, C.J.W., Epstein, H.E., Otter, L., Aranibar, J.N., Shugart, H.H., Macko, S.A. & Ramontsho, J. (2003). Carbon and nitrogen in the soil-plant system along rainfall and land-use gradients in southern Africa. Journal of Arid Environments 54, 327-343.
Fischer, S.F., Poschlod, P. & Beinlich, B. (1996) Experimental studies on the dispersal of plants and animals on sheep in calcareous grasslands. J. Appl. Ecol. 33, 1206-1222.
Francisco-Ortega A., Santos-Guerra A., Kim S.-C., Crawford, D.J. (2000). Plant genetic diversity in the Canary Islands: a conservation perspective. Am J Bot 87, 909-919.
Frost, P.G.H. (1985). Organic matter and nutrient dynamics in a broadleafed African Savanna. In: Tothi U.J.C. & Mott, J.J. (eds.). Ecology and Management of the World's Savannas, 200-206. Australian Academy of Science, Canberra.
Fulks, B.K., Scheerens, J.C. & Bemis, W.P. (1979). Natural hybridization of two Citrullus species. Heredity 70, 214-215.
Fursa, T. B. (1972). K sistematike roda Citrullus Schrad. Bot. Zhur. 57, 31-41.
Fourie, J.H., deWet, N.J. & Page, J.J. (1987). Veld condition and trend in Kalahari duneveld under an extensive stock production system. Journal of Grassland Society of Southern Africa 4, 48-54.
Fynn, R.W.S. & O’Connor, T.G. (2000). Effect of stocking rate and rainfall on rangeland dynamics and cattle performance in a semi-arid savanna, South Africa. Journal of Applied Ecology 37, 491-507.
Gardener, C.J., McIvor, J.G. & Jansen, A. (1993). Survival of seeds of tropical grassland species subjected to bovine digestion. J Appl Ecol 30, 75-85
136

________________________________________________________________ References
Gibbs Russell, G.E. (1987). Preliminary floristic analysis of the major biomes in southern Africa. Bothalia 17, 213-227.
Gitzendammer, M.A. & Soltis, P.S. (2000). Patterns of genetic variation in rare and widespread plant congeners. American Journal of Botany 87, 783-792.
Gould, S. J. & Vrba, E. S. (1982). Exaptation: A missing term in the science of form. Paleobiology 8, 4-15.
Granlund, L. (2001). The abundance of game in relation to villages, livestock and pans - a study in southwestern Kalahari, Botswana. Committee of Tropical Ecology, Minor Field Study 73. Uppsala University.
Grime, J.P. (1973). Competitive exclusion in herbaceous vegetation. Nature 242, 344-347.
Grunicke, U. (1996). Populations- und ausbreitungsbiologische Untersuchungen zur Sukzession auf Weinbergs-brachen am Keuperstufenrand des Remstals. nbb J. Cramer, Berlin.
Günster, A. (1995). Grass cover distribution in the central Namib - a rapid method to assess regional and local rainfall patterns of arid regions? J. Arid. Environ. 29, 107-114.
Guevara, S. & Laborde, J. (1993). Monitoring seed dispersal at isolated standing trees in tropical pastures: consequences for local species availability. Vegetation 107/108, 319-338.
Gutterman, Y. (1993). Seed Germination in Desert Plants. Springer Verlag, Berlin.
Gutterman, Y. & Shem-Tov, S. (1996). Structure and function of the mucilaginous seed coat of Plantago coronopus inhabiting the Negev Desert of Israel. Israel Journal of Plant Science 44, 125-34.
Gutterman, Y. & Shem-Tov, S. (1997). Mucilaginous seed coat structure of Carrichtera annua and Anastatica hierochontica from populations occurring in the Negev Desert highlands of Israel, and adhesion of the seeds to the desert soil crust. J. Arid Environ. 35, 697-707.
Gwanama, C., Labuschagne, M.T. & Botha, A.M. (2000). Analysis of genetic variation in Cucurbita moschata using random amplified polymorphic DNA (RAPD) markers. Euphytica 113, 19-24.
Hairston, N.G. & De Stasio, B.T. (1988) Rate of evolution slowed by a dormant propagule pool. Nature 336, 239-242.
Hamrick, J.L. & Godt, M.J.W. (1990) Allozyme diversity in plant species. In: Plant Population Genetics, Breeding; and Genetic Resources, Brown, A.H.D., Clegg, M.T., Kahler, A.L. & Weir, B.S. (eds.). Sinauer Associates, Sunderland, MA. 43-63.
Hamrick, J.L. & Godt, M.J.W. (1996). Effects of life history traits on genetic diversity in plant species. Phil. Trans. Roy. Soc. London 351, 1292-1298.
Hamrick, J.L.; Murawski, D.A. & Nason, J.D. (1993). The influence of seed dispersal mechanisms on the genetic structure of tropical tree populations. Vegetatio 107/108, 281-297.
Hannah, L., Midgley, G.F., Lovejoy, T., Bond, W.J., Bush, M., Lovett, J.C., Scott, D. & Woodwards, F.I. (2002). Conservation of Biodiversity in a Changing Climate. Conservation Biology 16, 264-268.
Hannan, N.P., Prevost, Y., Diouf, A. & Diallo, O. (1991). Assesment of desertification around deep wells in the Sahel using satellite imagery. J. Appl. Ecol. 28, 173-186.
Hardy, O.J. (2003). Estimation of pairwise relatedness between individuals and characterization of isolation-by-distance processes using dominant genetic markers. Molecular Ecology 12, 1577-1588.
Hardy, O.J., Maggia, L., Bandou, E., Breyne, P., Caron, H., Chevallier, M-H., Doligez, A., Dutech, C., LaTouche-Hallé, C., Troispoux, V., Veron, B. & Degen, B. (2006). Fine-scale genetic structure and gene dispersal inferences in 10 Neotropical tree species. Molecular Ecology 15, 559-571.
Hardy, O.J. & Vekemans, X. (2002). SPAGeDI: a versatile computer programm to analyse spatial genetic structure at the individual or population levels. Molecular Ecology Notes 2, 618-620.
Harrison, Y.A. & Shackleton, C.M. (1999). Resilience of South African communal grazing lands after the removal of high grazing pressure. Land Degradation & Development 10, 225-239.
Helgren, D.M. & Brooks, A.S. (1983). Geoarchaeology at Gi, a Middle Stone Age and Later Stone Age Site in the Northwestern Kalahari. Journal of Archaeological Science 10, 181-197.
Hellden, U. (1991). Desertification – Time for an assesment? Ambio 20, 372-282.
Herrington, M.E., Brown, P.J. & Carr, A.R. (1986). Introgression as a source of bitterness in watermelon.
137

________________________________________________________________ References
HortScience 21,1237-1238.
Hoffman M.T., Bond W.J. & Stock W.D. (1995). Desertification of the eastern karoo, South Africa: conflicting palaeoecological, historical and and soil isotopic evidence. J Arid Environ. 37,159-77.
Hoffman, M.T. & Cowling, R.M. (1990). Desertification in the lower Sundays River Valley, South Africa. Journal of Arid Environment 19, 105-117.
Hoffmann, M.T., Cowling, R.M., Douie, C. & Pierce, S.M. (1989). Seed predation and germination of Acacia erioloba in the Kuiseb River Valley, Namib Desert. S Afr J Bot 55, 103-106.
Hofmann, R.R. (1973) The Ruminant Stomach. In: East African Monographs in Biology 2. East African Literature Bureau, Nairobi, Kenya.
Honnay, O., Coart, E., Butaye, J., Adriaens, D., van Glabeke, S. & Roldán-Ruiz, I. (2006). Low impact of present and historical landscape configuration on the genetics of fragmented Anthyllis vulneraria populations. Biological Conservation 127, 411-419.
Howe, H.F. (1986). Seed dispersal by fruit-eating birds and mammals. In: Murray DR (ed) Seed dispersal, 123-190. Academic Press, Sydney
Howe, H.F. & Smallwood, J. (1982). Ecology of seed dispersal. Ann Rev Ecol Syst 13, 201-228
Huff, D.R., Peakall, R. & Smouse, P.E. (1993). RAPD variation within and among natural populations of outcrossing buffalograss [Buchloe dactyloides (Nutt.) Engelm.]. Theor. Appl. Genet. 86, 927-934.
Hulme, M. (ed.) (1996). Climate change and Southern Africa: an Exploration of Some Potential Impacts and Implications in the SADC Region. Report commissioned by WWF International and co-ordinated by the Climatic Research Unit, UEA, Norwich, UK. University of East Anglia, Norwich, UK/WWF International, Gland, Switzerland.
Huntley, B.J. & Walker, B. (eds.) (1982). Ecology of tropical Savannas. Ecological Studies 42, 101-119.
Illius, A.W. & O‘Connor, T.G. (1999). On the relevance of nonequilibrium concepts to arid and semi-arid grazing systems. Ecol.Appl. 9, 798-813.
Jaccard, P. (1901). Etude Comparative de la Distribution Florale dans une Portion des Alpes et des Jura, Bulletin de la Société vaudoise des Sciences Naturelles 37, 547-579.
Janzen, D.H. (1969). Birds and the ant x Acacia interaction in central America, with notes on birds and other myrmecophytes. The Condor 71, 240-256.
Janzen, D. H. (1984). Dispersal of small seeds by big herbivores: foliage is the fruit. American Naturalist 123, 338-353.
Jeffrey, C. (1967). Cucurbitaceae. In: Flora of Tropical East Africa. Milne-Redhead, E. & Polhill, R.M. (eds.). London. Royal Botanic Gardens, Kew.
Jeffrey, C. (1980). A review of the Cucurbitaceae. Bot. Journ. Linn. Soc. 81, 233–247.
Jennings, C.M.H. (1974). The hydrogeology of Botswana. Ph.D Thesis, University of the Witwatersrand, Johannesburg, South Africa.
Jeltsch, F., Milton, S.J., Dean, W.R.J. & van Rooyen, N. (1997a). Analysing shrub encroachement in the southern Kalahari: a grid-based modelling approach. Journal of Applied Ecology 34, 1497-1508.
Jeltsch, F., Milton, S.J., Dean, W.R.J. & Rooyen, N. (1997b). Simulated pattern formation around artificial waterholes in the semi-arid Kalahari. Journal of Vegetation Science 8, 177-188.
Joubert, A.M., Mason, S.J. & Galpin, J.S. (1996). Droughts over southern Africa in a doubled-CO2 climate. Int. J. Climatol. 16, 1149-1156.
Jürgens, N. (1991).A new approach to the Namib Region. I: Phytogeographic subdivision. Vegetatio 97, 21-38.
Kalikawe, M.C. (1990). Baseline vegetation description at artificial watering points of Central Kalahari Game Reserve. Afr. J. Ecol. 28, 253-256.
Kleijn, D. & Steinger, T. (2002). Contrasting effects of grazing and hay cutting on the spatial and genetic populations structure of Verratum album, an unpalatable, long-lived, clonal species. Journal of Ecology 90, 360-370.
Kleyer, M. & Knevel, I. C. (eds.) (2005). The LEDA Traitbase Collecting and Measuring Standards of Life-history Traits of the Northwest European Flora. LEDA Traitbase project. University of Groningen.
138

________________________________________________________________ References
Community and Conservation Ecology Group. Groningen.
Kollmann, J. (1994). Ausbreitungsökologie endozoochorer Gehölzarten. Veröffentlichungen Projekt Angewandte Ökologie 9, 1-212.
Kos, M. & Poschlod, P. (2007). Seeds Use Temperature Cues to Ensure Germination under Nurse-plant Shade in Xeric Kalahari Savannah. Ann. Bot. 99, 667-675.
Leishman, M.R., Westoby, M. & Jurado, E. (1995). Correlates of seed size variation: a comparison of five temperate floras. Journal of Ecology 83, 517-530.
Leistner, O.A. (1961). On the dispersal of Acacia giraffae by game. Koedoe 4, 101-104.
Leistner, O.A. (1967). The plant ecology of the Southern Kalahari. Memoirs of the Botanical Survey of South Africa 38, 1-172.
Leistner, O.A. (1996). The subcanopy flora in the dynamics of the Kalahari Thornveld. The biodiversity of African Plants, 163-179.
Leistner, O.A. & Werger, M.J.A. (1973). Southern Kalahari Phytosociology. Vegetatio 28, 353-399.
Levin, D. A. & Kerster, H.W. (1969). The dependence of bee-mediated pollen and gene dispersal upon plant density. Evolution 23, 560-571.
Loveless, M. D. & Hamrick, J. L. (1984). Ecological determinants of genetic structure in plant populations. Annu. Rev. Ecol. Syst. 15, 65-95
Low, A.B. & Rebelo, A.G. (1996). Vegetation of South Africa, Lesotho and Swaziland. Department of Environmental Affairs and Tourism, Pretoria.
Lubbinge, J.W. (1999). Phytosociological study of the southern Kalahari duneveld. MSc thesis, University of Pretoria, Pretoria.
Mace, R. (1991). Overgrazing overstated. Nature 349, 280-281.
Makhabu, S.W., Marotsi, B. & Perkins, J. (2002). Vegetation gradients around artificial water points in the Central Kalahari Game Reserve of Botswana. African Journal of Ecology 40, 103-109.
Maki, M., Yamashiro, T. & Matsumura, S. (2003). High levels of genetic diversity in island populations of the island endemic Suzukia luchuensis (Labiatae). Heredity 91, 300-306.
Malo, J.E. & Suárez, F. (1995). Herbivorous mammals as seed dispersers in a Mediterranean dehesa. Oecologia 104, 246-255.
Martens, E. (1971). The effect of tribal grazing patterns on the habitat in the Kalahari. Botswana Notes and Records (special edition) 1, 234-241. The Botswana Society, Gaborone.
Martínez-Castilloa, J., Zizumbo-Villarreala, D., Geptsb, P., Delgado-Valerioa, P. & Colunga-GarcíaMarína, P. (2006) Structure and Genetic Diversity of Wild Populations of Lima Bean (Phaseolus lunatus L.) from the Yucatan Peninsula, Mexico. Crop Science of America 46, 1071-1080.
Mattson, W.J. Jr. (1980). Herbivory in relation to plant nitrogen content. Annu Rev Ecol Syst 11, 119-161
Mbaiwa, J.E. & Mbaiwa, O.I. (2006). The Effects of Veterinary Fences on Wildlife Populations in Okavango Delta, Botswana. International Journal of Wilderness 12, 17-41.
McCue, K.A. & Holtsford, T.P. (1998). Seed bank influences on genetic diversity in the rare annual Clarkia springvillensis (Onagraceae). American Journal of Botany 85, 30-36.
McIntyre, S. & Lavorel, S. (2001). Livestock grazing in subtropical pastures: steps in the analysis of attribute response and plant functional types. Journal of Ecology 89, 209-226.
McKee, E.D. (1979). A Study of Global Sand Seas, Washington, USA: United States Government Printing Office.
Meeuse, A.D. (1962). The Cucurbitaceae of Southern Africa. Bothalia 8,1-111.
Menault, J.C. (1983). The Vegetation of African Savannas. In: Bourlière, F. & Goodall, D.W. (eds.). Tropical Savannas - Ecosystems of the World 13, 109-149. Elsevier, Amsterdam Oxford New York.
Milberg, P. & Lamont, B.B. (1997). Seed/cotyledon size and nutrient content play a major role in early performance of species on nutrient-poor soils. New Phytol 137, 665-672.
Milchunas, D.G. & Lauenroth, W.K. (1993). Quantitative effects of grazing on vegetation and soils over a
139

________________________________________________________________ References
global range of environments. Ecol Monogr. 63,327-366.
Miller, M.F. (1994a). The costs and benefits of Acacia seed consumption by ungulates. Oikos 71, 181-187.
Miller, M.F. (1994b). Large African herbivores, bruchid beetles and their interactions with Acacia seeds. Oecologia 97, 265-270.
Miller, M.F. (1995). Acacia seed survival, seed germination and seedling growth fallowing pod consumption by large herbivores and seed chewing rodents. Afr. J. Ecol. 33, 194-210.
Miller, M.F. (1996). Dispersal of Acacia seeds by ungulates and ostriches in an African savanna. Journal of Tropical Ecology 12, 345-356.
Milton, S.J. & Dean, W.R.J. (1995). South Africa’s arid and semiarid rangelands – why are they changing and can they be restored? Environmental Monitoring and Assessment 37, 245-264.
Milton, S.J. & Dean, W.R.J. (2001). Seeds dispersed in dung of insectivores and herbivores in semi-arid southern Africa. Journal of Arid Environments 47, 465-483.
Milton, S.J., Siegfried, W.R. & Dean, W.R.J. (1990). The distribution of epizoochoric plant species: a clue to the prehistoric use of arid Karoo rangelands by large herbivores. Journal of Biogeography 17, 25-34.
Monod, T.H. (1957). Les grandes divisions chorologiques de l'Afrique. CCTA/CSA 24, 1-47.
Montes-Hernandez, S. & Eguiarte, L.E. (2002). Genetic structure and indirect estimates of gene flow in three taxa of Cucurbita (Cucurbitaceae) in western Mexio. American Journal of Botany 89, 1156-1163.
Moore, A. (1989). Die ekologie en ekofisiologie van Rhigozum trichotomum. PhD thesis, University of Port Elizabeth, South Africa.
Moore, A. & Odendaal, A. (1987). Die ekonomie se implikasies van bosverdigting en bosbeheer soos van toepassing op ’n speenkalfproduksiestelsel in die doringbosveld van die Molopo-gebied. Journal of the Grassland Society of Southern Africa 4, 139-142.
Mostert, J.W.C. (1958). Studies of the vegetation of parts of the Bloemfontein and Brandfort districts. Memoirs of the Botanical Survey of South Africa 31, 311-226.
Nason, J.D., Herre, E.A. & Hamrick, J.L. (1998). The breeding structure of a tropical keystone plant resource. Nature 391, 685-687.
Nei, M. (1963). Effect of selection on the components of genetic variance. In: Hanson, W.D. & Robinson. H.F. (eds.). Statistical genetics and plant breeding. Publ 982, NAS-NRC, Washington District of Columbia, 501-515.
Njoroge, G.N., Gemmill, B., Bussmann, R., Newton, L.E. & Ngumi, V.W. (2004). Pollination ecology of Citrullus lanatus at Yatta, Kenya. International Journal of Tropical Insect Science 24, 73-77.
Noy-Meir, I. (1973). Desert ecosystems: envi- ronment and producers. Ann. Rev. Ecol. Syst. 4, 25-51.
Nybom, H. & Bartish, I.V. (2000). Effects of life history traits and sampling strategies on genetic diversity estimates obtained with RAPD markers in plants. Perspectives in plant ecology, evolution and systematics 3, 93-114.
O’Connor, T.G.O. (1991). Local extinction in perennial grasslands: A life-history approach. The American Naturalist 137, 753-773.
O’Connor, T.G.O. & Pickett, G.A. (1992). The influence of grazing on seed production and seed banks of some African grasslands. Journal of Applied Ecology 29, 247-260.
O’Connor, T.G. & Roux, P.W. (1995). Vegetation changes (1949–71) in a semi-arid, grassy dwarf shrubland in the Karoo, South Africa: influence of rainfall variability and grazing by sheep. Journal of Applied Ecology 32, 612-626.
Or, K. & Ward, D. (2003). Three-way interactions between Acacia, large mammalian herbivores and bruchied beetles - a review. Afr. J. Ecol. 41, 257-265.
Ouborg, N.J., Piquot Y. & van Groenendael J.M. (1999). Population genetics, molecular markers, and the study of dispersal in plants. Journal of Ecology 87, 551-569. Owen-Smith, N. (1999). The animal factor in veld management. In: Tainton, N.M. (ed.). Veld Management in
South Africa. University of Natal Press, Pietermaritzburg, South Africa.
Pakeman, R.J. (2001). Plant migration rates and seed dispersal mechanisms. Journal of Biogeography 28, 795-
140

________________________________________________________________ References
800.
Pakeman, R.J., Digneffe, G. & Small, J.L. (2002). Ecological correlates of endozoochory by herbivores. Functional Ecology 16, 296-304.
Palmer, B. & van Rooyen, A.F. (1998). Detecting vegetation change in the southern Kalahari using Landsat TM data. Journal of Arid Environments 39, 143-153.
Parker, A.H. & Witkowski, E.T.F. (1999). Long-term impacts of abundant perennial water provision for game on herbaceous vegetation in a semi-arid African savanna woodland. Journal of Arid Environments 41, 309-321.
Perkins, J. (1996). Botswana: fencing out the equity issue. Cattle posts and cattle ranching in the Kalahari desert. Journal of Arid Environments 33, 503-517.
Perkins, J.S. & Thomas, D.S.G. (1993a). Environmental response and sensitivity to permanent cattle ranching, semi-arid western central Botswana. In: Landscape sensitivity. Thomas, D.S.G. & Allison, R.J. (eds.). 273-286. John Wiley, Chichester.
Perkins, J.S. & Thomas, D.S.G. (1993b). Spreading deserts or spatially confined environmental impacts? Land degradation and cattle ranching in the Kalaha Kalahari Desert of Botswana. Land Degradation and Rehabilitation 4, 179-194.
Pike, J.G. (1971). Rainfall over Botswana. In: Anonymus (ed.). Proceedings of the conference on sustained production from semi-arid areas. The Botswana Society, Gaborone, 69-76.
Proulx, M. & Mazumder, A. (1998). Reversal of grazing impact on plant species richness in nutrient-poor vs nutrient-rich ecosystems. Ecology 79, 2581-2592.
Raunkiaer, C. (1934). The life form of plants. Oxford University Press, Oxford.
Reid, R.S. & Ellis, J.E. (1995). Livestock-mediated Tree Regeneration: Impacts of Pastoralists on Dry Tropical Woodlands. Ecological Applications 5, 978-992.
Reilly, B.K., Sutherland, V.A. & Harley, V. (2003). The nature and extent of wildlife ranching in Gauteng province, South Africa. South African Journal of Wildlife Research 33, 141-144.
Reinach, N. (1961). The availability of the phosphorus in a locally produced dicalcium phosphate. South African Journal of Agricultural Science 4, 107-108.
Ringrose, S., Chanda, R., Nkambwe, M. & Sefe, F. (1996). Environmental change in the mid-Boteti area of North-Central Botswana: biophysical processes and human perceptions. Env. Mgmnt 20, 397-410.
Ringrose, S., Matheson, W., Wolski, P. & Huntsman-Mapila, P. (2003). Vegetation cover trends along the Botswana Kalahari transect. Journal of Arid Environments 54, 297-317.
Römermann, C., Tackenberg, O. & Poschlod, P. (2005). Dispersability traits- buoyancy, external animal dispersal (epizoochory), internal animal dispersal (endozoochory) and dispersal obtained from the literature. In: The LEDA Traitbase collecting and measuring standards of life history traits of the Northwest European flora. LEDA Traitbase project publication. Knevel, I.C., Bekker, R.M., Kunzmann, D., Stadler, M., Thompson, K. (eds.).124-133.
Römermann, C. (2006). Patterns and processes of plant species frequency and life-history traits. Diss. Bot. 402, 1-117.
Robbins, C.T. Mole, S., Hagerman, A.E. & Hanley, T.A. (1987). Role of tannins in defending plants against ruminants: reduction in dry matter digestion? Ecology 68, 1606-1615.
Robbins, C.T., Spalinger, D.E. & van Hoven, W. (1995) Adaptation of ruminants to browse and grass diets: are anatomical-based browser-grazer interpretations valid? Oecologia 103, 208-213.
Rogers, S.O. & Bendich, A.L. (1994). Extraction of total cellular DNA from plants, algae and fungi. In: Gelvin, S.B. & Schilperoort, A.R. (eds). Plant Molecular Biology Manual, 2nd edn. 1-8 Kluwer Academic Publishers, Dodrecht.
Rohner, C. & Ward, D. (1999). Large Mammalian Herbivores and the conservation of arid Acacia Stands in the Middle East. Conservation Biology 13, 1162-1171.
Rutherford, M.C, Midgley, G.F., Bond, W.J., Powrie, L.W., Musil, C.F., Roberts R. & Allsopp, J. (1999a). South African Country Study on Climate Change. Terrestrial Plant Diversity Section, Vulnerability and Adaptation. Department of Environmental Affairs and Tourism, Pretoria
141

________________________________________________________________ References
Rutherford, M.C., Powrie, L.W. & Schulze, R.E. (1999b). Climate change in conservation areas of South Africa and its potential impact on floristic composition: a first assessment. Diversity and Distributions 5, 253-262.
Sain, R.S. & Joshi, P. (2003). Pollen fertility of interspecific F1 hybrids in genus Citrullus (Cucurbitaceae). Current Science 85, 431-435
Saltz, D., Ward, D., Kapofi, I. & Karamata, J. (2004). Population estimation and harvesting potential for game in arid Namibia. South African Journal of Wildlife Research 34, 153-161.
Sankaran, M., Hanan, N.P., Scholes, R.J., Ratnam, J., Augustine, D.J., Cade, B.S., Gignoux, J., Higgins, S.I., Le Roux, X., Ludwig, F., Ardo, J., Banyikwa, F., Bronn, A., Bucini, G., Caylor, K.K., Coughenour, M.B., Diouf, A., Ekaya, W., Feral, C.J., February, E.C., Frost, P.G.H., Hiernaux, P., Hrabar, H., Metzger, K.L., Prins, H.H.T., Ringrose, S., Sea, W., Tews, J., Worden, J., Zambatis, N. (2005). Determinants of woody cover in African savannas. Nature 438, 846-849.
SANParks (2007). The Kgalagadi Transfrontier Park. http://www.sanparks.org/parks/kgalagadi, accessed 05/05/07.
Schaal, B.A. & Leverich, W.J. (1996). Molecular variation in isolated plant populations. Plant Species Biology 11, 33-40.
Schlesinger, W.H. & Pilmanis, A.M. (1998). Plant–soil interactions in deserts. Biogeochemistry 42, 169-187.
Scholes, R.J. (1990). The influence of soil fertility on the ecology of southern African savannas. J. Biogeogr. 17, 417-419.
Scholes, R.J. (1997). Savanna. In: Cowling, R.M., Richardson, D.M. & Pierce, S.M. (eds.). Vegetation of southern Africa. Cambridge University Press, Cambridge, 258-278.
Scholes R.J. & Walker B.H. (2004). An African Savanna: Synthesis of the Nylsvley Study. Cambridge University Press, Cambridge, UK.
Schulze, R.E. (1997). Impacts of global climate change in a hydrologically vulnerable region: challenges to South African hydrologists. Progress in Physical Geography 21, 113-136.
Schupp, E.W. (1993). Quantity, quality and the effectiveness of seed dispersal by animals. Vegetatio, 107/108, 15-29.
Schurr, F.M., Bond, W.J., F., M.G., & I., H.S. (2005) A mechanistic model for secondary seed dispersal by wind and its experimental validation. Journal of Ecology, 93, 1017-1028.
Scoones, I. (1990). Livestock populations and the household economy: a case study from southern Zimbabwe. Ph.D. Thesis, University of London.
Scoones, I. (1993) Why are there so many animals? Cattle population dynamics in the communal areas of Zimbabwe. In: Range ecology at disequilibrium: new models of natural variability and pastoral adaptation in African savannas. Behnke, R.H., Scoones, I. & Kerven, C. (eds.). 62-76. Overseas Development Institute, International Institute for Environment and Development, and Commonwealth Secretariat, London.
Scott, L. (1996). Palynology of hyrax middens: 2000 years of paleoenvironmental history in Namibia. Quaternary International 33, 73-79.
Schulze, E.-D., Caldwell, M.M., Canadell, J., Mooney, H.A., Jackson, R.B., Parson, D., Scholes, R.J., Sala, O.E. & Trimborn, P. (1998). Downward flux of water through roots (i.e. inverse hydraulic lift) in dry Kalahari sands. Oecologia 115, 460-462.
Shackleton, C.M. (2000). Comparison of plant diversity in protected and communal lands in the Bushbuckridge lowveld savanna, South Africa. Biol Conserv 94, 273-285.
Shannon, C.E. (1949). Communication theory of secrecy systems. Bell Sys. Tech. J. 28, 656-715.
Shaw, P.A. & Thomas, D.S.G. (1996). The quaternary palaeoenvironmental history of the Kalahari, Southern Africa. Journal of Arid Environments 32, 9-22.
Shepherd, V. E. & Chapman, C. A. (1998). Dung beetles as secondary seed dispersers: impact on seed predation and germination. J. Trop. Ecol. 14, 199-215.
Siderius, W. (1972). Soils of Eastern and Northern Botswana. Tech.Document 3, UNDP (SF).
Silvertown, J. & Dodd, M. (1997). Comparing plants and connecting traits. In: Plant life histories: Ecology, phylogeny and evolution. Silvertown, J., Franco, M. & Harper, J.L. (eds.). 3-16. Cambridge University Press,
142

________________________________________________________________ References
Cambridge.
Singh, A.K. (1978). Cytogenetics of semi-arid plants. III. A natural interspecific hybrid of Cucurbitaceae (Citrullus colocynthis × Citrullus vulgaris Schrad). Cytologia 43, 569-574.
Singh, A.K. & Yadava, K.S. (1984). An analysis of interspecific hybrids and phylogenetic implications in Cucumis (Cucurbitaceae). Plant Syst Evol 147, 237-252.
Smet, M. & Ward, D. (2005). A comparison of the effects of different rangeland management systems on plant species composition, diversity and vegetation structure in a semi-arid savanna. African Journal of Range & Forage Science 22, 59-71.
Smet, M. & Ward, D. (2006). Soil quality gradients around water-points under different management systems in a semi-arid savanna, South Africa Journal of Arid Environments 64, 251-269.
Skead, C.L. (1980). Historical mammal incidence in the Cape Province, vol. 1. Cape Nature Conservation, Cape Town, 494-597.
Skarpe, C. (1986). Plant community structure in relation to grazing and environmental changes along a north-south transect in the western Kalahari. Vegetatio 68, 3-18.
Skarpe, C. (1990a). Shrub layer dynamics under different herbivore densities in an arid savanna, Botswana. Journal of Applied Ecology 27, 873-885.
Skarpe, C. (1990b). Structure of the woody vegetation in disturbed and undisturbed arid savanna, Botswana. Vegetatio 87,11-18.
Skarpe, C. (1991). Spatial patterns and dynamics of woody vegetation in an arid savanna. J. Veg. Sci. 2, 565-572.
Skarpe, C. & Bergström, R. (1986). Nutrient content and digestibility of forage plants in relation to plant phenology and rainfall in the Kalahari, Botswana. Journal of Arid Environments 11, 147-164.
Skinner, J.D. & Smithers, R.H.N. (1990). The mammals of the southern African subregion. University of Pretoria, Pretoria.
Skinner, J.D., Aarde, R.J. & Van Jaarsveld, A.S. (1984). Adaptations in three species of large mammals (Antidorcas marsupialis, Hystrix africaeaustralis, Hyaena brunnera) to arid environments. S. Afr. J. Zool. 19(2), 92-96.
Snyman, H.A. (1999). Short-term effect of soil-water, defoliation and rangeland condition on productivity of a semi-arid rangeland in South Africa. J. Arid Environ. 43, 47-62.
Story, R. (1958). Some plants used by the Bushmen in obtaining food and water. Botanical Survey Memoir 30. Department of Agriculture, Division of Botany, Pretoria.
Tackenberg, O. (2001). Methoden zur Bewertung gradueller Unterschiede des Ausbreitungspotentials von Pflanzenarten. Modellierung des Windausbreitungspotentials und regelbasierte Ableitung des Fernausbreitungspotentials. Dissertationes Botanicae 347: i-viii, 1-138.
Tackenberg, O., Poschlod, P. & Bonn, S. (2003). Assessment of wind dispersal potential in plant species. Ecological Monographs 73, 191-205.
Tackenberg, O., Poschlod, P. & Kahmen, S. (2003). Dandelion seed dispersal: The horizontal wind speed does not matter for long-distance dispersal - it is updraft. Plant Biology 5, 451-454.
Tackenberg, O., Römermann, C., Thompson, K. & Poschlod, P. (2006). What does diaspore morphology tell us about external animal dispersal? Evidence from standardized experiments measuring seed retention on animal-coats. Basic and Applied Ecology 7, 45-58.
Tainton, N.M. (1981). Veld and Pasture Management in South Africa, Shuter & Shooter, Pietermaritzburg.
Talbot, W.J. (1961). Land utilization in the arid regions of southern Africa, part 1: South Africa. In:Stamp, L.D. (ed.). A history of land use in arid regions, arid zone research 17, Unesco, Paris, 299-338.
Templeton, A. R. & Levin, D.A. (1979). Evolutionary consequences of seed pools. American Naturalist 114, 232-249.
Templeton, A.R, Shaw, K., Routman, E. & Davis, S.K. (1990). The genetic consequences of habitat fragmentation. Annals of the Missouri Botanical Garden 77, 13-27.
Tester, M., Patton, D.C., Reid, N. and Lange, R.T. (1987). Seed dispersal by birds and densities of shrubs under trees in arid south Australia. Trans. R. Soc. S. Aust. 111, 1-5.
143

________________________________________________________________ References
Tews, J., Blaum, N. & Jeltsch, F. (2004a). Structural and animal species diversity in arid and semi-arid savannas of the southern Kalahari. Annals of Arid Zone 42,1-13.
Thomas, D.S.G. & Shaw, P.A. (1991). The Kalahari Environment. Cambridge University Press, 218 pp.
Thomas, D.S.G. & Shaw, P.A. (1993). The evolution and characteristics of the Kalahari, southern Africa. Journal of Arid Environments 25, 97-108.
Thomas DSG, Sporton D. & Perkins J. (2000). The environmental impact of livestock ranches in the Kalahari, Botswana: natural resource use, ecological change and human response in a dynamic dryland system. Land Degradation & Development 11, 327-341.
Thomas, D.S.G. & Twyman, C. (2004). Good or bad rangeland? Hybrid knowledge, science, and local understandings of vegetation dynamics in the Kalahari. Land Degeneration & Development 15, 215-231.
Thomas, D.S.G., Knight, M. & Wiggs, G.F.S. (2005). Remobilization of southern African desert dune systems by twenty-first century global warming. Nature 435, 1218-1221.
Thompson, K., Band, S.R. & Hodgson, J.G. (1993). Seed size and shape predict persistence in the soil. Funct. Ecol. 7, 236-41
Thrash, I. (2000). Determinants of the extent of indigenous large herbivore impact on herbaceous vegetation at watering points in the north-eastern lowveld, South Africa. Journal of Arid Environments 44, 61-72.
Tietema, T., Tolsma, D.J., Veenendaal, E.M. & Schroten, J. (1991). Plant responses to human activities in the tropical savanna ecosystem of Botswana. In: Rozema, J. & Verkleij, J.A.C. (eds.). Ecological responses to environmental stresses. Kluwer Academic Publishers, Dordrecht, 262-276.
Tolsma, D.J., Ernst, W.H.O. & Verwey, R.A. (1987). Nutrients in soil and vegetation around two artificial waterpoints in eastern Botswana. Journal of Applied Ecology 24, 991-1000.
Tomimatsu, H. & Ohara, M. (2003). Genetic diversity and local population structure of fragmented populations of Trillium camschatcense (Trilliaceae). Biol. Conserv. 109, 249-258.
Twyman, C., Dougill, A., Sporton, D. & Thomas, D.S.G. (2002). Community fencing in open rangelands: a case study of community self-empowerment in eastern Namibia. Review of African Political Economy 27, 9-26.
Tyson, P.D. (1986). Climatic change and variability in southern Africa. Oxford University Press, Cape Town, Southern America.
van der Merwe, C.R. (1962). Soil Group and Subgroups of South Africa. Div. of Chem. Services, Dept. of Agriculture.
van der Pijl, L. (1982). Principles of Dispersal in Higher Plants, 3rd edn. Springer-Verlag, Berlin.
van der Walt, P. & Le Riche, E. (1999). The Kalahari and its plants. Info Naturae, Pretoria.
van Rheede van Oudtshoorn, K. & Van Rooyen, M.W. (1999). Dispersal Biology of Desert Plants. Springer Verlag: Berlin.
van Rooyen AF. (1998). Combating desertification in the southern Kalahari: connecting science with community action in South Africa. Journal of Arid Environments 39, 285-298.
van Rooyen, A.F. (2000). Rangeland degradation in the southern Kalahari. PhD, University of Natal, Pietermaritzburg.
van Rooyen, N. (2001). Flowering plants of the Kalahari dunes. Lynnwood, Pretoria.
van Rooyen N. & Bredenkamp G.J. (1996a). Clay Thorn Bushveld, Mixed Bushveld, Kalahari Plains Thorn Bushveld. In: Low, A.B. & Rebelo, A.G. (eds.). Vegetation of South Africa, Lesotho and Swaziland. A Companion to the Vegetation Map of South Africa, Lesotho and Swaziland. Department of Environmental Affairs and Tourism, Pretoria, 23, 26, 35.
van Rooyen, N. & Bredenkamp, G.J. (1996b). Mixed Lowveld Bushveld. In: Low, A.B. & Rebelo, A.G. (eds,), Vegetation of South Africa, Lesotho and Swaziland. A Companion to the Vegetation Map of South Africa, Lesotho and Swaziland. Department of Environmental Affairs and Tourism, Pretoria, 27.
van Rooyen, N. & van Rooyen, M.W. (1998). Vegetation of the south-western arid Kalahari: an overview. Trans. R. Soc. S. Afr. 53, 113-140.
van Rooyen, N., Bredenkamp, G.J. & Theron, G.K. (1991). Kalahari vegetation: veld condition, trends and ecological status of species. Koedoe 34, 61-72.
144

________________________________________________________________ References
van Rooyen, N., Bezuidenhout, D., Theron, G.K. & du Bothma, J.P. (1990). Monitoring of the vegetation around artificial watering points (windmills) in the Kalahari Gemsbok National Park. Koedoe 33, 63-88.
van Rooyen, N., van Rensburg, D.J., Theron, G.K. & Bothma, J. du P. (1984). A preliminary report on the dynamics of the vegetation of the Kalahari Gemsbok National Park. Koedoe 27, 83-102.
van Rooyen, N., Bredenkamp, G.J., Theron, G.K., du Bothma, J.P. & Le Riche, E.A.N. (1994). Vegetational gradients around artificial watering points in the Kalahari Gemsbok National Park. Journal of Arid Environments 26, 349-361.
van Vegten, J.A. (1983). Thombush Invasion in a Savanna Ecosystem in Eastern Botswana. Vegetatio 56, 3-7.
Veendendal, E.M. & Ernst, W.H.O. (1991). Dormancy patterns in accessions of caryopses from savanna grass species in South Eastern Botswana. Acta Botanica Neerlandica 40, 297-309.
Vekemans, X. & Hardy, O.J. (2004). New insights from fine-scale spatial genetic structure analyses in plant populations. Molecular Ecology 13, 921-935.
Venable, D.L. & Brown, J.S. (1988). The selective interactions of dispersal, dormancy, and seed size as adaptations for reducing risk in variable environments. American Naturalist 131, 360-384.
Venable, D.L. & Brown, J.S. (1993) The population-dynamic functions of seed dispersal. Vegetatio, 107/108, 31-35.
Viio, T.M. (2003)
Volk, O.H. (1966). Die Florengebiete von Südwestafrika. J.S.W.A. Wiss. Ges. Windhoek 20, 25-58.
Walker, B.H. (1987). A general model of savanna structure and function. In: Walker, B.H. (ed.). Determinants of tropical savannas. IRL Press Limited, Oxford, UK, 1-12.
Walker, B.H., Ludwig, D., Holling, C.S. & Peterman, R.M. (1981). Stability of semi-arid savannah grazing systems. Journal of Ecology 69, 473-498.
Wallgren, M. (2001). Mammal communities in the Southern Kalahari – distribution and species composition. Committee of Tropical Ecology, Uppsala University, Minor Field Study 69.
Ward, J. H. (1963). Hierarchical grouping to optimize an objective function. J. Am. Stat. Assoc. 58, 236-244.
Weber, G.E. & Jeltsch, F. (2000). Long-term impacts of livestock herbivory on herbaceous and woody vegetation in semiarid savannas. Basic Appl. Ecol. 1, 13-23.
Weber, G.E., Moloney, K. & Jeltsch, F. (2000). Simulated longterm vegetation response to alternative stocking strategies in savanna rangelands. Plant Ecol. 150, 77-96.
Wellington, J.H. (1955). Southern Africa - A Geographic Study. Vol. 1. Physical Geography. Cambridge University Press, UK, 528 pp.
Werger, M.J.A. (1973). Phytosociology of the upper Orange River Vally: A syntaxonomical and synecological study. DSc. Dissertation. University of Nijmegen, Nijmegen.
Werger, M.J.A. (1978a). Biogeography and ecology of southern Africa. Monographiae Biologicae 13. Dr. W. Junk bv Publishers, The Hague, The Netherlands.
Werger, M.J.A. (1978b). The Karoo-Namib Region. In: Werger, M. J. A. (ed), Biogeography and Ecology of Southern Africa, 1, 231–299. Junk, The Hague.
Werger, M.J.A. (1978c). The Sudano-Zambesian region. In: Werger, M.J.A. (ed.). Biogeography and ecology of Southern Africa 1. W. Junk, The Hague, 301-462.
Werger, M.J.A. (1982). Vegetation geographical patterns as a key to the past, with emphasis on the dry vegetation types of South Africa. Bothalia 14, 405-410.
Werger, M.J.A. (1986). The Karoo and Southern Kalahari. In: Evenari, M., Noy-Meir, I. & Goodall, D.W. Ecosystems of the World 12b: Hot deserts and arid shrublands. Amsterdam, 282-358.
Werger, M.J.A. & Coetzee, B.J. (1978). The Sudano-Zambezian Region. In: Werger, M.J.A. (ed.). Biogeography and Ecology of Southern Africa. Junk, The Hague, 301-463.
Westfall, R.H. & Van Staden, J.M. (1996). Primary divisions of the biomes of South Africa. South African Journal of Science 92, 373-375.
Westoby, M., Leishman, M.R. & Lord, J. M. (1996). Comparative ecology of seed size and seed dispersal. Philosophical Transactions of the Royal Society B 351, 1309-1318.
145

________________________________________________________________ References
146
White, F. (1965). The savanna woodlands of the Zambezian and Sudanian Domains. Webbia 19, 651-681.
White, F. (1971). The taxonomic and ecological basis of chorology. Mitt. Bot. Staatssamml. München. 10, 91-112.
White, F. (1983). The vegetation of Africa. A descriptive rnemoir to accornpany the Unesco/AETAFT/UNISO vegetation map of Africa. Unesco, Natural Resources Research, 356 pp.
White, R. (2000). Impact of cattle on Botswana’s Rangeland Environment. In: Ringrose, S. & Chanda, R. (eds.). Towards sustainable management in the Kalahari region. University of Botswana, Gaborone, BW, 230-243.
Williams, C.A. & Albertson, J.D. (2006). Dynamical effects of the statistical structure of annual rainfall on dryland vegetation. Global Change Biology 12, 777-792.
Willson, M.F. (1993) Dispersal mode, seed shadows, and colonization patterns. Vegetatio 107/108, 261-280.
Willson, M.F., Rice, B. & Westoby, M. (1990) Seed dispersal spectra: comparison of temperate plant communities. Journal of Vegetation Science 1, 547-562.
Wright, S. (1931). Statistical methods in biology. J. Am. Stat. Assoc. 26, 155-163.
Wright, S. (1951). The genetical structure of populations. Ann. Eugen. 15, 323-354.
Yamaguchi, N., Cooper, A., Werdelin, L. & Macdonald, D.W. (2004). Evolution of the mane and group-living in the lion (Panthera leo): a review. J. Zool. (Lond.) 263, 329-342.
Yeh, F.C. & Boyle, T.J.B. (1997). Population genetic analysis of codominant and dominant markers and quantitative traits. Belgian Journal of Botany 129, 157.
Young, A., T. Boyle, T. & Brown, T. (1996). The population genetic consequences of habitat fragmentation for plants. Trends in Ecology and Evolution 11, 413-418.
Young, M.D. & Solbrig, O.T. (1993). Providing an environmentally sustainable, economically profitable and socially equitable future for the world’s savannas. In: Young, M.D. & Solbrig, O.T. (eds.). The World’s Savannas. UNESCO Man and the Biosphere Series, Paris, 321-344.
Zohary, M. (1937). Die verbreitungsökologischen Verhältnisse Palästinas. Die antitelechorischen Erscheinungen. Beih. Bot. Zentr. 56, 1-55
Zoro Bi I., Maquet A. & Baudoin J.-P. (2003). Population genetic structure of wild Phaseolus lunatus (Fabaceae), with special reference to population sizes. American Journal of Botany 90, 897-904.

_______________________________________________ Appendix 1:complete species list
Appendix 1 complete species list of all plants found during the vegetation survey 2003-2006 with life-span, Raunkiear’s life form and habitat association (≥ 75% of cover found in one habitat, only for species with a total cover ≥ 1 m2)
family species name life-span life-form habitat assosociation Acanthaceae Monechma genistifolium perennial chamaephyte grassy matrix Acanthaceae Monechma incanum perennial chamaephyte sheep camps Aizoaceae Galenia africana var. africana perennial Nano-Phanerophyte Aizoaceae Gisekia africana annual Therophyte Aizoaceae Limeum areniculum annual Therophyte Aizoaceae Limeum argute-carinatum annual Therophyte Aizoaceae Limeum fenestratum annual Therophyte dune Aizoaceae Limeum spec annual Therophyte Aizoaceae Limeum sulcatum sulcatum annual Therophyte game camps Aizoaceae Limeum viscosum viscosum annual Therophyte grassy matrix Aizoaceae Plinthus sericeus perennial Nano-Phanerophyte Aizoaceae Trianthema parvifolia parvifolia annual Therophyte sub-canopy Amaranthaceae Amaranthus praetermissus annual Therophyte Amaranthaceae Amaranthus thunbergii annual Therophyte sub-canopy
Amaranthaceae Hermbstaedtia fleckii annual Therophyte sub-canopy, game camps
Amaranthaceae Sericorema remotiflora perennial chamaephyte Asclepiadaceae Cynanchum orangeanum perennial cryptophyte Asclepiadaceae Gomphocarpus fruticosus perennial Nano-Phanerophyte grassy matrix Asclepiadaceae Hoodia gordonii perennial Succulent Asclepiadaceae Orthanthera jasminiflora perennial cryptophyte dune Asparagaceae Asparagus nelsii perennial chamaephyte Asphodelaceae Trachyandra laxa perennial cryptophyte Asteraceae Arctotis leiocarpa annual therophyte Asteraceae Asteraceae spec Asteraceae Asteraceae spec 2 perennial hemicryptophyte
Asteraceae Dicoma capensis perennial hemicryptophyte grassy matrix, sheep camps
Asteraceae Dimorphotheca polyptera annual therophyte sheep camps Asteraceae Hirpicium echinus perennial chamaephyte Asteraceae Nolletia arenosa perennial hemicryptophyte Asteraceae Nolletia spec perennial hemicryptophyte Asteraceae Nolletia spec 2 perennial hemicryptophyte Asteraceae Senecio spec annual therophyte Bignoniaceae Rhigozum trichotomum perennial nanophanerophyte grassy matrix Boraginaceae Ehretia rigida perennial nanophanerophyte Boraginaceae Heliotropium ciliatum perennial hemicryptophyte game camps Boraginaceae Heliotropium lineare perennial hemicryptophyte Capparaceae Boscia albitrunca perennial megaphanerophyte Capparaceae Boscia foetida perennial nanophanerophyte Capparaceae Cleome gynandra annual therophyte sub-canopy Capparaceae Cleome kalachariensis annual therophyte Capparaceae Cleome paxii annual therophyte Chenopodiaceae Chenopodium opulifolium annual therophyte Chenopodiaceae Lophiocarpus polystachyus annual therophyte grassy matrix Chenopodiaceae Salsola spec perennial nanophanerophyte dune Colchicaceae Camptorrhiza strumosa perennial cryptophyte
147

_______________________________________________ Appendix 1:complete species list
family species name life-span life-form habitat assosociation Convolvulaceae Convolvulus ocellatus perennial chamaephyte Convolvulaceae Ipomoea hackeliana annual therophyte sheep camps Convolvulaceae Ipomoea magnusiana annual therophyte Covolvulaceae Merremia spec. perennial cryptophyte Covolvulaceae Merremia verecunda perennial cryptophyte
Convolvulaceae Xenostegia tridentata angustifolia perennial cryptophyte
Cucurbitaceae Acanthosicyos naudinianus perennial cryptophyte Cucurbitaceae Citrullus lanatus annual therophyte Cucurbitaceae Coccinia rehmannii perennial cryptophyte Cucurbitaceae Cucumis africanus perennial cryptophyte sheep camps Cucurbitaceae Cucurbitaceae spec 1 perennial cryptophyte Cucurbitaceae Cucurbitaceae spec 2 Cucurbitaceae Kedrostis africana perennial cryptophyte Cucurbitaceae Momordica balsamina perennial cryptophyte Cyperaceae Bulbostylus hispidula annual therophyte Euphorbiaceae Chamaesyce inaequalitera annual therophyte Euphorbiaceae Jatropha spec perennial cryptophyte Euphorbiaceae Phyllanthus angolensis annual therophyte Fabaceae Acacia erioloba perennial megaphanerophyte
Fabaceae Acacia erioloba x haematoxylon perennial megaphanerophyte Fabaceae Acacia haematoxylon perennial megaphanerophyte Fabaceae Acacia hebeclada perennial nanophanerophyte
Fabaceae Acacia mellifera perennial nanophanerophyte sub-canopy, game camps
Fabaceae Crotalaria orientalis perennial nanophanerophyte Fabaceae Crotalaria podocarpa annual therophyte Fabaceae Crotalaria spartioides perennial nanophanerophyte dune Fabaceae Crotalaria sphaerocarpa annual therophyte game camps Fabaceae Cyamopsis serrata annual therophyte Fabaceae Fabaceae spec Fabaceae Fabaceae spec 2 Fabaceae Fabaceae spec 3 Fabaceae Fabaceae spec 4 Fabaceae Fabaceae spec 5 annual therophyte game camps Fabaceae Fabaceae spec 6
Fabaceae Fabaceae spec 30 perennial chamaephyte grassy matrx, game camps
Fabaceae Indigofera alternans annual therophyte grassy matrix, sheep camps
Fabaceae Indigofera charleriana annual therophyte game camps Fabaceae Indigofera daleoides perennial hemicryptophyte grassy matrix Fabaceae Indigofera spec Fabaceae Indigofera spec 2 Fabaceae Indigofera spec 3 Fabaceae Indigofera spec 4 Fabaceae Indigofera spec 5 Fabaceae Indigofera spec 6 Fabaceae Indigofera spec 7 Fabaceae Lebeckia linearifolia perennial nanophanerophyte game camps Fabaceae Lotononis platycarpa annual therophyte grassy matrix
Fabaceae Parkinsonia africana perennial megaphanerophyte sub-canopy, sheep camps
148

_______________________________________________ Appendix 1:complete species list
family species name life-span life-form habitat assosociation
Fabaceae Prosopis glandulosa var. glandulosa perennial megaphanerophyte
Fabaceae Requienia sphaerosperma perennial chamaephyte sheep camps
Fabaceae Senna italica perennial cryptophyte grassy matrix, sheep camps
Geraniaceae Geraniaceae spec annual therophyte Hyacinthaceae Ledebouria undulata perennial cryptophyte Hyacinthaceae Ornithogalum seineri perennial cryptophyte
Illecebraceae Pollichia campestris perennial nanophanerophyte sub-canopy, game camps
Iridaceae Iridaceae spec perennial cryptophyte Lamiaceae Acrotome inflata annual therophyte sheep camps Liliaceae Liliaceae spec 1 perennial cryptophyte Liliaceae Liliaceae spec 2 perennial cryptophyte Liliaceae Liliaceae spec 3 perennial cryptophyte Liliaceae Liliaceae spec 4 perennial cryptophyte Liliaceae Liliaceae spec 5 perennial cryptophyte Malvaceae Radyera urens perennial cryptophyte Molluginaceae Mollugo cerviana annual therophyte Neuradaceae Grielum humifusum annual therophyte Neuradaceae Neurada procumbens annual therophyte
Nyctaginaceae Boerhavia repens subsp. repens annual therophyte
Oxalidaceae Oxalis sessilis perennial cryptophyte Papaveraceae Argemone ochroleuca annual therophyte Pedaliaceae Harpagophytum procumbens perennial cryptophyte Pedaliaceae Sesamum triphyllum annual therophyte
Poaceae Aristida adscensionis annual therophyte grassy matrix, sheep camps
Poaceae Aristida congesta annual therophyte grassy matrix, sheep camps
Poaceae Aristida meridionales perennial hemicryptophyte Poaceae Brachiaria glomerata annual therophyte Poaceae Briza spec annual therophyte Poaceae Cenruchs ciliaris annual therophyte sun-canopy Poaceae Centropodia glauca perennial hemicryptophyte Poaceae Chloris virgata annual therophyte Poaceae Eragrostis biflora annual therophyte sheep camps Poaceae Eragrostis echinochloidea annual therophyte game camps Poaceae Eragrostis lehmanniana perennial hemicryptophyte Poaceae Eragrostis trichophora perennial hemicryptophyte dune Poaceae Poa spec Poaceae Poaceae spec Poaceae Poaceae spec 2 Poaceae Poaceae spec 3 Poaceae Schmidtia kalahariensis annual therophyte Poaceae Stipagrostis amabilis perennial hemicryptophyte dune, sheep camps Poaceae Stipagrostis ciliata perennial hemicryptophyte grassy matrix Poaceae Stipagrostis obtusa perennial hemicryptophyte grassy matrix
Poaceae Stipagrostis uniplumis perennial hemicryptophyte grassy matrix, sheep camps
Poaceae Tragus racemosus annual therophyte Poaceae Triraphis purpurea annual therophyte Polygonaceae Oxygonum delagoense annual therophyte
149

_______________________________________________ Appendix 1:complete species list
150
family species name life-span life-form habitat assosociation Polygonaceae Portulaca oleraceae annual therophyte sub-canopy Portulacaceae Talinum crispatulum annual therophyte Portulacaceae Talinum spec annual therophyte
Rubiaceae Kohautia caespitosa brachyloba annual therophyte Scophulariaceae Aptosimum albomarginatum perennial chamaephyte grassy matrix Scophulariaceae Aptosimum elongatum perennial hemicryptophyte sheep camps Scophulariaceae Aptosimum lineare perennial hemicryptophyte Scophulariaceae Aptosimum spec perennial hemicryptophyte Scrophulariaceae Peliostomum leucorrhizum perennial chamaephyte
Solanaceae Lycium bosciifolium perennial nanophanerophyte sub-canopy, sheep camps
Solanaceae Lycium cinereum perennial nanophanerophyte sub-canopy, sheep camps
Solanaceae Lycium hirsutum perennial nanophanerophyte sub-canopy Solanaceae Solanum incanum perennial chamaephyte Sterculiaceae Hermannia bicolor perennial hemicryptophyte Sterculiaceae Hermannia burchellii perennial nanophanerophyte Sterculiaceae Hermannia modesta annual therophyte Sterculiaceae Hermannia spec Sterculiaceae Hermannia tomentosa perennial chamaephyte Verbenaceae Chascanum pumilum perennial chamaephyte Zygophyllaceae Tribulus terrestris annual therophyte Zygophyllaceae Tribulus zeyeri annual therophyte unknown Gen spec 1 unknown Gen spec 2 unknown Gen spec 3 unknown Gen spec 4 unknown Gen spec 5 unknown Gen spec 6 unknown Gen spec 7 unknown Gen spec 8 unknown Gen spec 9 unknown Gen spec 10 unknown Gen spec 11 unknown Gen spec 12 unknown Gen spec 13 unknown Gen spec 14 unknown Gen spec 15 unknown Gen spec 16 unknown Gen spec 17 unknown Gen spec 18 unknown Gen spec 19 unknown Gen spec 20 unknown Gen spec 21 unknown Gen spec 22 unknown Gen spec 23 unknown Gen spec 24

________________________________ Appendix 2: C/N ratio, tannin content & palatability
Appendix 2 C/N ratio, tannin content, life-span, palatability from literature and signs of grazing damage (plots with grazing damage/ plots of occurence) on grassy matrix and sub-canopy plots on sheep and game camps during a vegetation survey in 2006
C/N tannin life-span palatability literature matrix sub-canopy sheep game sheep game
Acantosycios naudinianus 15,03 0,68 perennial high Acrotome inflata 11,29 0,20 annual low 29 Amaranthus thunbergii 8,05 0,00 annual high 59 86 Aptosimum elongatum 46,46 0,00 perennial medium 9 0 14 Aristida meridionalis 41,86 0,18 perennial medium 0 0 Asparagus nelsii 12,94 0,00 perennial high 0 Brachiaria glomerata 38,66 0,00 annual medium 38 73 60 33 Bulbostylis hispidula 45,17 0,00 annual low 38 0 11 4 Centropodia glauca 62,56 0,41 perennial high 94 73 80 Chenopodium opulifolium 9,51 0,61 annual high 0 Citrullus lanatus 8,60 0,00 annual high 0 Cleome gynandra 8,28 0,22 annual high 23 52 Crotalaria sphaerocarpa 19,96 0,00 annual high 0 0 Cucumis africanus 8,18 0,13 perennial high 27 17 33 23 Dimorphotheca polyptera 13,78 0,00 annual medium 43 38 17 20 Eragrostis biflora 21,33 0,17 annual medium 15 31 Eragrostis lehmanniana 37,48 0,00 perennial high 3 9 21 10 Eragrostis trichophora 51,93 0,10 perennial medium Fabaceae Gen spec 30 18,02 0,00 perennial medium 0 17 Heliotropium ciliatium 11,12 0,35 perennial medium 0 9 Hermbstaedtia fleckii 12,45 0,69 annual low 40 Hermannualia tomentosa 18,51 0,50 perennial medium 7 3 6 0 Indigofera alternans 14,10 0,54 annual high 0 0 0 5 Indigofera charleriana 19,44 0,14 annual medium 13 0 Lebeckia linearis 22,95 0,00 perennial medium Limeum arenicolum 14,91 0,00 annual medium 13 8 0 17 Lotononis platycarpa 23,72 0,00 annual medium 7 8 33 0 Lycium bosciifolium 6,93 0,00 perennial medium 20 30 Lycium hirsutum 7,20 0,00 perennial medium 13 8 Monechma incanum 16,79 0,00 perennial high Oyxgonum delagoense 20,83 0,51 annual high Phyllanthus angolensis 18,62 0,00 annual medium Pollichia campestris 13,40 0,10 perennial high 15 31 Requienia sphaerosperma 16,46 0,23 perennial low 3 6 0 0 Rhigozum trichotomum 21,23 0,13 perennial low 9 11 20 Schmidtia kalihariensis 30,54 0,17 annual low 24 12 36 44 Sesamum triphyllum 19,05 0,00 annual high 50 Stipagrostis amabilis 68,11 0,00 perennial high Stipagrostis ciliata 59,71 0,00 perennial high 30 36 0 17 Stipagrostis obtusa 64,07 0,00 perennial high 0 0 13 Tribulus zeyeri 12,31 0,29 annual high 24 14 8 13 average 24,18 0,16 st dev 17,37 0,21
151

________________________________ Appendix 2: C/N ratio, tannin content & palatability
152

___________________________________ Appendix 3: LDD-potentials of all tested species
Appendix 3 Long-distance dispersal potential for different vectors of all tested species (1 = very low to 6 = very high)
species name wind water sheep fur springbok fur digestion Acacia erioloba 1 1 1 1 6 Acacia haematoxylon 1 1 1 1 6 Acacia hebeclada 1 1 1 1 6 Acacia mellifera 1 1 1 1 4 Acanthosycios naudinianus 1 1 1 1 4 Acrotome inflata 3 6 5 1 1 Amaranthus thunbergii 3 6 6 2 6 Aptosimum elongatum 3 2 5 4 6 Aristida congesta 4 1 6 5 1 Aristida meridionalis 4 3 5 5 6 Brachiaria glomerata 3 6 6 4 Bulbostylis hispidula 3 6 5 2 Centropodia glauca 4 1 5 1 Chenopodium opulifolium 3 6 6 5 6 Citrullus lanatus 1 1 1 1 1 Cleome gynandra 3 6 6 1 Crotalaria spartioides 1 1 3 1 6 Crotalaria sphaerocarpa 1 2 4 1 6 Cucumis africanus 2 1 3 1 6 Cyamopsis serrata 1 1 Dicoma capensis 3 3 5 3 Dimorphotheca polyptera 4 5 3 1 Eragrostis biflora 3 5 6 4 Eragrostis lehmanniana 3 6 6 6 1 Eragrostis trichophora 3 6 6 5 4 Gisekia africana 4 6 5 4 Heliotropium ciliatum 2 6 4 1 Hermannia tomentosa 3 6 4 2 Hermstaedtia fleckii 3 6 6 4 6 Limeum arenicolum 3 6 4 1 Limeum fenestratum 3 6 5 1 Merremia verecunda 1 6 1 Nolletia arenosa 3 6 5 3 4 Ornithogalum seineri 3 4 Orthanthera jasminiflora 5 6 4 1 1 Oxygonum delagoense 3 6 Parkinsonia afrricana 1 1 4 1 Phyllanthus angolensis 3 5 5 4 1 Plinthus sericeus 3 5 4 1 6 Pollichia campestris 3 6 5 2 Portulaca oleraceae 3 6 5 4 3 Requienia sphaerosperma 2 5 Rhigozum trichotomum 4 5 Salsola spec 3 6 6 3 Schmidtia kalihariensis 4 6 6 3 1 Sericorema remotiflora 4 5 4 1 1 Sesamum triphyllum 3 1 4 1 Setaria verticillata 2 6 6 3 5 Solanum capense 3 6 4 1 6
153

___________________________________ Appendix 3: LDD-potentials of all tested species
154
species name wind water sheep fur springbok fur digestion Stipagrostis ciliata 4 6 5 1 1 Stipagrostis obtusa 4 6 6 5 5 Stipagrostis uniplumis 5 6 5 6 Talinum crispatulum 2 Trianthema parviflora 3 3 4 1 4 Tribulus zeyeri 1 6 4 1 Xenostegia tridentata 1 4 average 2,70 4,25 4,47 2,37 3,94 standard deviation 1,13 2,18 1,56 1,64 2,14

_________________________________________ Appendix 4: seed and diaspore correlates
Appendix 4 seed (with all easily removable structures removed) and diaspore (diasp.) measurements for all species included in the dispersal experiments – for many species the seed was equivalent to the diaspore, so for these species only one set of measurements is included – the diaspore shape (Bekker et al 1998) was calculated using this formula: diaspore shape = (Σ (x - x´)2) / n with x = extension of length, width or height, x´ = their averages and n = 3
weight [mg] length [mm] width [mm] height [mm] shape species name diasp. seed diasp. seed diasp. seed diasp. seed diasp. seed
Acacia erioloba 382,03 382,03 12,13 9,39 4,50 0,07
Acacia haematoxylon
131,87 131,87 9,47 6,64 4,47 0,05
Acacia hebeclada
142,36 142,36 8,86 6,87 3,61 0,06
Acacia mellifera
77,06 77,06 9,46 8,33 1,47 0,14
Acanthosycios naudinianus
54,62 54,62 9,42 5,46 2,86 0,08
Acrotome inflata
2,81 1,14 14,73 2,92 2,80 1,12 2,80 0,89 0,15 0,12
Amaranthus thunbergii
0,68 0,68 1,26 1,06 0,77 0,05
Aptosimum elongatum
0,29 0,29 1,32 0,75 0,26 0,13
Aristida congesta
0,53 0,53 23,00 5,13 15,90 0,47 15,90 0,39 0,02 0,14
Aristida meridionalis
1,25 1,25 45,98 7,22 0,64 0,55 0,64 0,55 0,22 0,20
Brachiaria glomerata
0,66 0,66 2,89 3,11 2,42 1,58 2,24 1,55 0,01 0,09
Bulbostylis hispidula
0,34 0,34 1,17 0,93 0,93 0,01
Centropodia glauca
1,19 1,19 7,76 1,98 0,93 0,15
Chenopodium opulifolium
0,17 0,17 1,04 0,95 0,42 0,07
Citrullus lanatus
114,65 114,65 10,59 6,59 2,57 0,10
Cleome gynandra
0,29 0,29 1,47 1,47 0,70 0,06
Crotalaria spartioides
0,24 0,24 0,91 0,83 0,60 0,02
Crotalaria sphaerocarpa
9,07 9,07 3,38 2,83 1,38 0,06
Cucumis africanus
3,63 3,63 2,60 1,79 0,89 0,08
Cyamopsis serrata
6,10 6,10 2,78 2,22 1,42 0,04
Dicoma capensis
1,55 1,55 9,74 3,53 7,34 1,16 7,34 1,16 0,01 0,06
155

_________________________________________ Appendix 4: seed and diaspore correlates
weight [mg] length [mm] width [mm] height [mm] shape species name diasp. seed diasp. seed diasp. seed diasp. seed diasp. seedDimorphotheca polyptera
0,53 0,53 3,62 3,62 2,13 2,13 1,67 1,67 0,05 0,06
Eragrostis biflora
0,07 0,07 0,62 0,49 0,40 0,02
Eragrostis lehmanniana 0,10 0,10 0,82 0,48 0,35 0,06
Eragrostis trichophora 0,07 0,07 0,71 0,39 0,32 0,06
Gisekia africana 0,13 0,13 1,48 1,10 0,35 0,10
Heliotropium ciliatum
9,17 9,17 3,94 3,94 3,25 3,25 2,69 2,69 0,02 0,02
Hermannia tomentosa
0,26 0,26 1,18 0,85 0,56 0,05
Hermstaedtia fleckii
0,31 0,31 1,08 0,97 0,73 0,02
Limeum arenicolum
1,62 1,62 2,81 2,10 1,40 0,04
Limeum fenestratum
2,33 1,56 5,78 2,45 6,56 2,23 1,94 1,94 0,12 0,07
Merremia verecunda
34,49 34,49 4,33 3,72 3,18 0,02
Nolletia arenosa
0,13 0,11 3,60 1,80 0,73 0,76 0,26 0,23 0,17 0,15
Ornithogalum seineri
3,25 3,25 6,52 5,97 0,83 0,16
Orthanthera jasminiflora
23,19 15,90 7,48 4,54 1,56 0,10
Oxygonum delagoense
15,22 9,93 10,82 7,45 8,90 2,83 8,90 0,31 0,01 0,08
Parkinsonia afrricana
73,22 73,22 7,81 4,56 3,32 0,06
Phyllanthus angolensis
0,16 0,16 0,88 0,76 0,80 0,00
Plinthus sericeus
0,20 0,20 0,83 0,53 0,44 0,04
Pollichia campestris
0,27 0,27 1,28 0,76 0,76 0,04
Portulaca oleraceae
0,11 0,11 0,77 0,70 0,70 0,00
Requienia sphaerosperma
2,54 2,54 2,14 1,81 1,10 0,04
Rhigozum trichotomum
4,80 3,71 13,62 7,73 6,27 5,49 0,32 0,32 0,16 0,16
Salsola spec 0,41 0,41 1,76 1,76 1,65 1,65 1,01 1,01 0,04 0,04
Schmidtia kalihariensis
0,81 0,46 5,28 1,79 2,45 0,80 1,72 0,45 0,08 0,09
Sericorema remotiflora
13,86 13,86 10,68 10,68 14,60 14,60 14,60 14,60 0,03 0,04
Sesamum triphyllum
1,47 1,63 4,28 2,59 3,17 1,47 1,55 1,36 0,07 0,06
156

_________________________________________ Appendix 4: seed and diaspore correlates
weight [mg] length [mm] width [mm] height [mm] shape species name diasp. seed diasp. seed diasp. seed diasp. seed diasp. seedSetaria verticillata
0,51 0,51 1,73 0,91 0,64 0,07
Solanum capense
3,15 3,15 3,36 2,60 0,96 0,09
Stipagrostis ciliata
4,40 3,19 51,26 6,75 0,70 0,70 0,70 0,70 0,22 0,20
Stipagrostis obtusa
0,82 0,68 26,45 3,03 0,61 0,61 0,61 0,61 0,21 0,18
Stipagrostis uniplumis
0,56 0,56 3,43 0,57 0,59 0,15
Talinum crispatulum
1,16 1,16 2,15 1,63 0,74 0,07
Trianthema parviflora
0,11 0,11 0,80 0,69 0,48 0,03
Tribulus zeyeri 18,41 18,41 6,82 3,08 4,28 0,05
Xenostegia tridentata
12,21 12,21 3,64 2,91 2,30 0,02
Pearsson (terminal velocity) or Spearman-Rho-correlation (all others) of seed measurements with dispersal factors – terminal velocity is used for the calculation of wind dispersal potential, buoancy for water dispersal potential, retention in fur for dispersal in fur and digestion survival for the dispersal by ingestation - (*) = two-tailed significance at the p < 0,05 level, (**) = two-tailed significance at the p < 0,01 level (only significant results are shown)
retention in fur
terminal velocity buoancy
sheep springbok digestion survival
diaspore 0,443(**) -0,551(**) -0,688(**) -0,681(**) n.s. mass [mg] seed 0,449(**) -0,573(**) -0,688(**) -0,673(**) n.s. diaspore -0,297(*) -0,394(**) -0,465(**) -0,484(**) n.s. max volume (length*
width*height)[mm3] seed 0,482(**) -0,524(**) -0,712(**) -0,680(**) n.s. diaspore -0,402(**) n.s. n.s. n.s. n.s. shape seed n.s. n.s. n.s. n.s. n.s. diaspore 0,618(**) -0,331(*) n.s. n.s. 0,565(**) density (max volume/
mass) [mg/mm3] seed n.s. n.s. n.s. n.s. n.s.
157

_________________________________________ Appendix 4: seed and diaspore correlates
158
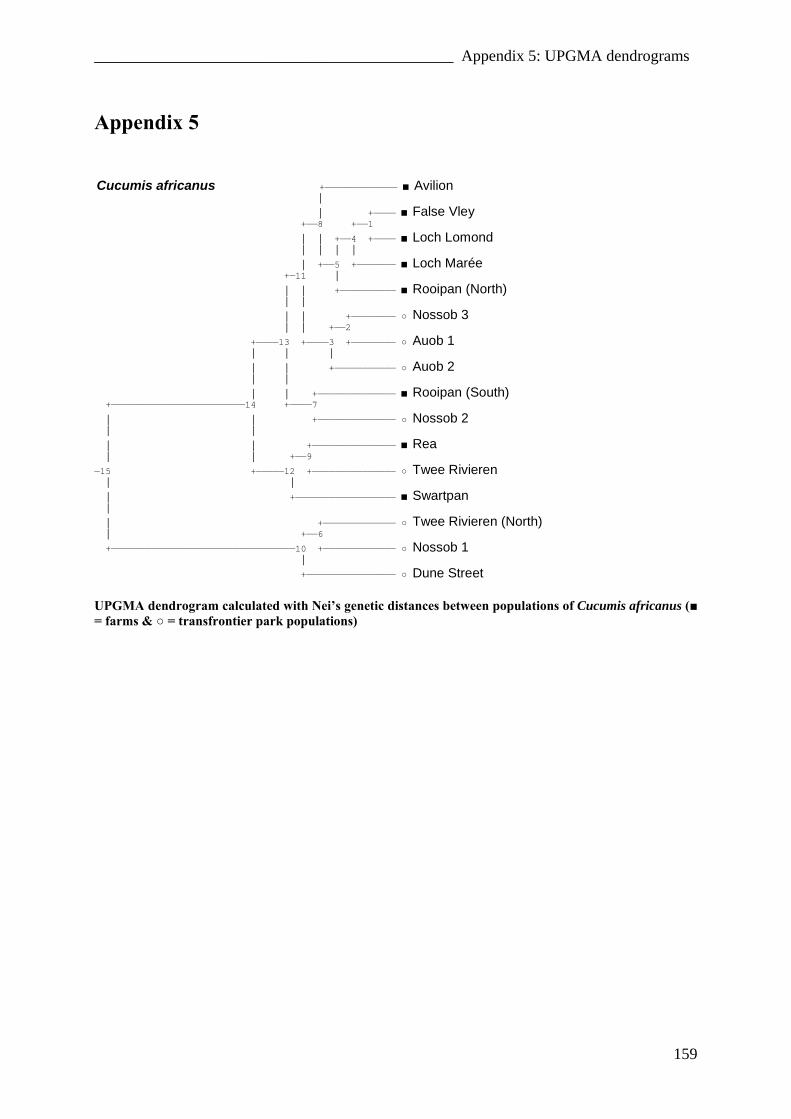
_____________________________________________ Appendix 5: UPGMA dendrograms
Appendix 5
Cucumis africanus +————————————— ■ Avilion │
│ +———— ■ False Vley +——8 +——1
│ │ +——4 +———— ■ Loch Lomond │ │ │ │
│ +——5 +——————— ■ Loch Marée +—11 │
│ │ +—————————— ■ Rooipan (North) │ │
│ │ +———————— ○ Nossob 3 │ │ +——2
+————13 +————3 +———————— ○ Auob 1 │ │ │
│ │ +——————————— ○ Auob 2 │ │
│ │ +—————————————— ■ Rooipan (South) +————————————————————————14 +————7
│ │ +—————————————— ○ Nossob 2 │ │
│ │ +——————————————— ■ Rea │ │ +——9
—15 +—————12 +——————————————— ○ Twee Rivieren │ │
│ +—————————————————— ■ Swartpan │
│ +————————————— ○ Twee Rivieren (North) │ +——6
+—————————————————————————————————10 +————————————— ○ Nossob 1 │
+———————————————— ○ Dune Street
UPGMA dendrogram calculated with Nei’s genetic distances between populations of Cucumis africanus (■ = farms & ○ = transfrontier park populations)
159

_____________________________________________ Appendix 5: UPGMA dendrograms
160
Citrullus lanatus +────────────────────────────────────── ■ Avilion +───────12
│ +────────────────────────────────────── ■ Rooipan (South) │
│ +────────────────────────── ■ Brand Duin │ +─────────6
│ │ │ +─────────────────────── ■ Loch Broom ─13 │ +──4
│ │ +─────────────────────── ■ Rooipan (North) │ │
│ │ +────────── ■ Drieling │ │ +───1
│ │ +────2 +────────── ○ Nossob 2 │ │ │ │
+─────────11 +──3 +────────────── ■ Sonderpan │ │ │
│ +────5 +─────────────────── ○ Auob 1 │ │ │
│ +──8 +────────────────────── ○ Dune Street │ │ │
│ │ │ +──────────────────────── ○ Twee Rivieren │ +──9 +──7
│ │ │ +──────────────────────── ○ Nossob 1 +─10 │
│ +────────────────────────────── ○ Nossob 4 │
+───────────────────────────────── ○ Nossob 3
UPGMA dendrogram calculated with Nei’s genetic distances between populations of Citrullus lanatus (■ = farms & ○ = transfrontier park populations)