
Hood River and Pelton Ladder Evaluation Studies/67531/metadc711324/m2/1/high... · Hood River and...
47
April 1994 DOE/BP-00631-3 Hood River and Pelton Ladder Evaluation Studies 1993 Annual Report
-
Upload
vuongkhuong -
Category
Documents
-
view
216 -
download
0
Transcript of Hood River and Pelton Ladder Evaluation Studies/67531/metadc711324/m2/1/high... · Hood River and...

April 1994DOE/BP-00631-3
Hood River and Pelton Ladder Evaluation Studies
1993Annual Report

This Document should be cited as follows:
Olsen, Erik, Rod French, James Newton, ''Hood River and Pelton Ladder Evaluation Studies'', Project No. 1989-02900, 47 electronic pages, (BPA Report DOE/BP-00631-3)
Field37:
This report was funded by the Bonneville Power Administration (BPA), U.S. Department of Energy, as part of BPA's program to protect, mitigate, and enhance fish and wildlife affected by the development and operation of hydroelectric facilities on the Columbia River and its tributaries. The views in this report are the author's and do not necessarily represent the views of BPA.
Bonneville Power AdministrationP.O. Box 3621Portland, Oregon 97208

HOOD RIVER AND PELTON LADDEREVALUATION STUDIES
ANNUAL REPORT 1993
Prepared by:
Erik A. OlsenConfederated Tribes of the Warm Springs Reservation
Warm Springs, OR 97761
and
Rod A. FrenchJames A. Newton
Oregon Department of Fish and WildlifePortland, OR 97207
Prepared for:
U. S. Department of EnergyBonneville Power Administration
Division of Fish and WildlifeP.O. Box 3621
Portland, OR 97208362 1
Project Numbers:89-29, 89-29-01, 89-053-03, 89-053-04, 93-019
Contract Numbers:DE-BI79-89BP0063 1DE-BI79-89BP00632DE-BI79-93BP8 1756DE-BI79-93BP81758DE-BI79-93BP9992 1
APRIL 1994

CONTENTS
INTRODUCTION . . . . . . . . . . . . . . . . . . . . . . . . . . . . . . . . .
METHODS . . . . . . . . . . . . . . . . . . . . . . . . . . . . . . . . . . . .
RESULTS . . . . . . . . . . . . . . . . . . . . . . . . . . . . . . . . . . . . .Summer Steelhead . . . . . . . . . . . . . . . . . . . . . . . . . . . . . .Winter Steelhead . . . . . . . . . . . . . . . . . . . . . . . . . . . . .Spring Chinook Salmon . . . . . . . . . . . . . . . . . . . . . . . . . .Coho Salmon . . . . . . . . . . . . . . . . . . . . . . . . . . . . . . .
HATCHERY PRODUCTION . . . . . . . . . . . . . . . . . . . . . . . . . . . . . . .
ENGINEERING . . . . . . . . . . . . . . . . . . . . . . . . . . . . . . . . . . .Powerdale Dam . . . . . . . . . . . . . . . . . . . . . . . . . . . . . . .Pelton Ladder . . . . . . . . . . . . . . . . . . . . . . . . . . . . . . .
SCREENING EVALUATION . . . . . . . . . . . . . . . . . . . . . . . . . . . . . .
HABITAT . . . . . . . . . . . . . . . . . . . . . . . . . . . . . . . . . . . . .
SUMMARY . . . . . . . . . . . . . . . . . . . . . . . . . . . . . . . . . . . . .
ACKNOWLEDGEMENTS . . . . . . . . . . . . . . . . . . . . . . . . . . . . . . . .
1
1
9
101011
12
12
14
44
REFERENCES . . . . . . . . . . . . . . . . . . . . . . . . . . . . . . 45

INTRODUCTION
The primary goals of the Hood River Production Project (HRPP) are 1) to increaseproduction of wild summer and winter steelhead (Oncorhynchus mykiss) and 2) toreintroduce spring chinook salmon (Oncorhynchus tshawytscha) into the Hood Riversubbasin. Harvest and escapement goals are identified in the Hood River and PeltonLadder master plans. Strategies for achieving the production goals were initiallydevised based on various assumptions about carrying capacity, survival rates, andescapement of stocks of anadromous salmonids in the Hood River subbasin. To obtainthe information needed to more accurately estimate each parameter we operated anadult trap at Powerdale Dam to collect life history and escapement information onstocks of anadromous salmonids entering the Hood River subbasin. The OregonDepartment of Fish and Wildlife (ODFW) funded the monitoring program at PowerdaleDam beginning in December 1991, and Bonneville Power Administration (BPA) took overthe funding in August 1992.
The contract period for this project was 1 October 1992 through 30 September 1993.Objectives for FY 93 were 1) to develop a long term monitoring and evaluation planfor the Hood River and Pelton Ladder (Hood River/Pelton Ladder) projects, 2) toidentify monitoring and evaluation needs for FY 94, 3) to prepare an annual reportsummarizing data collected at Powerdale Dam through 30 September 1993, and 4) tocontinue work on the various activities needed to construct hatchery facilities inthe Hood River subbasin and for making the necessary modifications to Pelton Ladder.Objectives 1 and 2 were completed as the Hood River/Pelton Ladder Master Agreement.This report summarizes the life history and escapement data collected at thePowerdale Dam adult trap and the status of the engineering work. We will use thelife history and escapement data 1) to test the assumptions on which harvest andescapement goals for the Hood River and Pelton Ladder master plans are based, and2) to develop biologically based management recommendations for implementing HRPP.We will continue to collect life history and escapement data at the adult trapduring both the development and execution of HRPP.
METHODS
An upstream migrant fish trap was installed at Powerdale Dam in December 1991.Powerdale Dam, which is owned and operated by Pacific Power and Light (PP&L), islocated at river mile. (RM) 4.5 in the main stem of the Hood River (Figure 1). Thetrap was installed in the uppermost pool of an existing fish ladder located on theeast bank of the river. The stop log water intake control of the fish ladder wasmodified to let water flow through a submerged opening in the ladder. A removablebar grate with one inch spaces between bars blocked the submerged opening to preventfish from leaving the top pool of the ladder. A fyke, installed at the entrance tothe uppermost pool, prevented fish from backing down the ladder after they enteredthe uppermost pool. A wood slat cover was put on the trap to prevent fish from

jumping out of the trap and a lock on the cover prevented poaching. A false floorof wood slats was installed at the bottom of the trap to reduce the depth of thetrap from about 4.5 feet to about 2 feet. This modification facilitated removal ofthe fish. In June 1992, we replaced the submerged fyke with a finger weir becauseit was observed that spring chinook salmon would avoid swimming through thesubmerged fyke and would often try to jump over it. We did not observe anymigration delay or abnormal fish behavior with the new design.
The adult trap at Powerdale Dam has been operated daily since December 1991 exceptduring the winter when low stream temperatures slow upstream migration. Generally,the trap is checked in the morning to minimize potential handling stress associatedwith sampling fish during the afternoon when, typically, water temperatures arehigher.
We individually removed each jack and adult fish from the adult trap using a softmesh landing net, then transferred them to a holding tank where we identified theirspecies, examined them for injuries, and determined their sex. We distinguishedspring and fall races of chinook salmon based on run timing, external coloration,and general appearance. We distinguished summer and winter races of steelhead basedon fin marks, external coloration, degree of scale tightness and scale erosion,state of sexual maturity relative to the time of year, external parasite load, colorof gill filaments, and general appearance. After examining each fish, we insertedit into a flexible rubber sleeve that covered the fishes eyes. This procedurereduced thrashing and eliminated the need for anaesthetizing the fish in order tomeasure its fork length and to attach uniquely numbered anchor tags. Fork lengthswere measured to the nearest 0.5 cm. We entered field data on a computer form andentered it into a database.
We estimated fecundity of winter steelhead used as hatchery broodstock by airspawning females and estimating the number of eggs per female with a volumetricdisplacement technique.
We collected scale samples from almost all jack and adult fish sampled at the trap.Samples were collected from the key scale area on each side of the fish and placedinto uniquely numbered scale envelopes which we sent to ODFW's research laboratoryin Corvallis, OR. There, the scale samples were mounted on gummed cards and acetateimpressions were made of them. The impressions were viewed by microfiche. Wedetermined origin-wild or hatchery-and life history-freshwater and oceanages-using scale analysis (Borgerson et al.. 1992).
We classified summer and winter races of steelhead as wild or hatchery fish based onfin mark and scale analysis. We assumed all unmarked summer and winter steelheadclassified as wild were returns from production in the Hood River subbasin. Weassumed that adipose clipped and unmarked summer steelhead classified as hatcheryfish were returns from subbasin hatchery production releases. Adipose clipped
2

summer steelhead were classified as Hood River subbasin hatchery fish because allsubbasin hatchery production is adipose clipped prior to release as smolts (seeHATCHERY PRODUCTION). Marked and unmarked winter steelhead were classified as HoodRiver subbasin hatchery fish based on fin mark and age.
Hatchery winter steelhead from the 1989 brood were the first fin marked fishreleased into the Hood River subbasin. We assumed returning unmarked hatcherywinter steelhead from earlier broods were Hood River subbasin hatchery fish. Summerand winter steelhead that were not classified as wild or Hood River subbasinhatchery fish were classified as stray hatchery fish. Currently, all hatcherywinter steelhead released in the Hood River subbasin are fin clipped prior torelease and alternate brood releases are marked with a unique fin clip combination.
Fin clipped steelhead, classified as wild, were not used in estimating migrationtiming, sex ratio, or age structure to minimize the potential for misidentificationof origin. This group of fish would include marked wild and natural strays and HoodRiver subbasin wild fish with deformed fins or whose fins were removed by sportfishers. Fin removal has been observed in the Hood River subbasin (personalcommunication on 11/17/93 with Jim Newton, Oregon Department of Fish and Wildlife,The Dalles, Oregon). To estimate escapements, we assumed that marked summer andwinter steelhead, classified as wild fish, were returns from wild Hood Riversubbasin production. Generally, numbers of marked wild fish were very low. We alsoassumed that summer and winter steelhead with regenerated scales, or from which wetook no scale samples, occurred as wild, Hood River subbasin hatchery, and strayhatchery fish in the same proportions as those in the sample population.
We classified spring chinook salmon as natural or hatchery fish based on fin markand scale analysis. We assumed unmarked spring chinook salmon classified as naturalwere returns from subbasin production. We assumed all unmarked and adipose clippedspring chinook salmon classified as hatchery fish were returns from Hood Riversubbasin hatchery production releases because a large component of the Hood Riversubbasin hatchery production releases are unmarked, and because all marked hatcheryfish are released with an adipose clip (see HATCHERY PRODUCTION). No marked springchinook salmon in the 1993 run year were classified as wild. Hatchery springchinook salmon that had a fin clip combination other than a single adipose clip wereclassified as a stray hatchery fish. To estimate escapements, we assumed thatspring chinook salmon with regenerated scales, or from which we took no scalesamples, occurred as wild, Hood River subbasin hatchery, and stray hatchery fish inthe same proportions as those in the sample population.
Coho salmon (Oncorhynchus kisutch) were classified as wild or hatchery fish based onfin mark and scale analyses. We assumed wild coho salmon were returns from subbasinproduction. Marked and unmarked hatchery coho salmon were assumed to be straysbecause no hatchery coho salmon are currently released into the Hood River subbasin.We estimated migration timing, sex ratio, age structure, and escapements using the
3

same methods described for summer and winter steelhead Only one fin clipped cohosalmon in the 1992 run year was class ified as a wild f sh.
RESULTS
Summer Steelhead
Wild and subbasin Foster stock hatchery summer steelhead began entering the adulttrap at Powerdale Dam in the last 2 weeks of March (Table 1). The median migrationdate for wild summer steelhead occurred within the last 2 weeks of July 1992, andfor Foster stock hatchery summer steelhead the median migration date was in the last2 weeks of June 1992 (Table 1). Migration to Powerdale Dam was completed by earlyMay 1993 for both wild and Foster stock hatchery components of the run (Table 1).
In the 1992-93 run year, summer steelhead escapement to Powerdale Dam was estimatedat 484 wild, 1.682 Foster stock hatchery, and 56 stray hatchery fish (Table 2).Wild summer steelhead migrated mainly as freshwater age 2 and age 3 smolts andreturned mainly as 2 salt adults (Table 3). Foster stock hatchery fish all migratedin the year of release (i.e. freshwater age 1 smolts) and returned mainly as 2 saltadults (Table 3). We estimated that 3.6% of the wild fish and 0.8% of the Fosterstock hatchery fish were repeat spawners (Table 3). No repeat spawners had morethan one spawning check (Table 4).
Mean fork length of wild summer steelhead without a spawning check ranged from 54-57cm for 1 salt adults, 68-70 cm for 2 salt adults, and was 82 cm for 3 salt adults(Table 5). Mean fork length of Foster stock subbasin hatchery summer steelheadwithout a spawning check was 55 cm for 1 salt adults, 68 cm for 2 salt adults, and78 cm for 3 salt adults (Table 5).
With the exception of age 2/3 fish. most wild summer steelhead returned as females(Table 6). Most returning Foster stock hatchery summer steelhead were males in agecategories l/l and l/3 and females in age category l/2 (Table 6). Female repeatspawners made up 65% of the wild and 77% of the Foster stock hatchery returns (Table6).
Winter Steelhead
2Winter steelhead entered the adult trap at Powerdale Dam as early as the firstweeks of December (Tables 7 and 8). The median migration date for wild wintersteelhead occurred in April and for Big Creek stock hatchery winter steelheadoccurred from early February to early March (Tables 7 and 8). Migration toPowerdale Dam was completed by early to late June for the wild run and by late
it
Aprilto early May for the Big Creek stock hatchery run (Tab es 7 and 8). In both the
4

1991-92 and 1992-93 run years, the wild run of winter steelhead migrated into theHood River subbasin later than the Big Creek stock hatchery run. Historically, theBig Creek stock was used as broodstock for the hatchery supplementation program inthe Hood River subbasin.
Until the 1991 brood release, hatchery broodstock was taken exclusively from the BigCreek stock of winter steelhead. The 1991 brood was to have been the first in whichall hatchery broodstock was collected from the wild Hood River stock. However,several Big Creek stock hatchery winter steelhead were incorporated into thehatchery broodstock in 1991 because of high pre-spawning mortality and the lownumbers of adults collected as broodstock (see HATCHERY PRODUCTION). The 1992 broodis the first brood for which hatchery broodstock was collected entirely from thewild Hood River stock of winter steelhead. The first adults from the 1992 broodrelease will return as 1 salt adults in the 1993-94 run year.
For the 1991-92 and 1992-93 run years, estimates of winter steelhead escapementranged from 408 to 693 wild, 213 to 289 subbasin hatchery, and 30 to 34 strayhatchery fish (Table 9). Currently, all hatchery fish caught at Powerdale Dam arehauled downriver and released at the mouth of the Hood River. This program wasimplemented to prevent Big Creek stock hatchery winter steelhead from spawning abovePowerdale Dam. Adult returns from the 1993 brood release of Hood River stockhatchery winter steelhead will be the first hatchery fish that will be passed abovePowerdale Dam. Adult hatchery returns from the 1991 brood release of wintersteelhead will not be passed above Powerdale Dam because they are progeny of wildand Big Creek stock hatchery winter steelhead (see HATCHERY PRODUCTION). Adulthatchery returns from the 1992 brood release of winter steelhead will also not bepassed above Powerdale Dam. Hatchery broodstock was not collected from throughoutthe entire run and for this reason returns from the 1992 brood release are notconsidered to be genetically similar to the wild stock. All stray hatchery fish arehauled downriver and released at the mouth of the Hood River.
Most wild winter steelhead migrated as freshwater age 2 and age 3 smolts andreturned mainly as 2 and 3 salt adults (Table 10). Most subbasin hatchery fishmigrated in the year of release (freshwater age 1 smolt) and returned mostly as 2and 3 salt adults (Table 10). We estimated that 2.4% of the subbasin hatchery fishreturning in the 1991-92 run year had a scale pattern indicating they remained inthe Hood River subbasin for 1 year before migration as smolts. Repeat spawnerscomprised 7.4% to 7.9% of the wild winter steelhead run and 2.0% to 3.8% of thesubbasin hatchery winter steelhead run sampled at Powerdale Dam (Table 10). Fewrepeat spawners had more than one spawning check (Tables 11 and 12).
Mean fork length of wild winter steelhead without a spawning check ranged from 59 to66 cm for 2 salt adults and 76 to 80 cm for 3 salt adults (Tables 13 and 14). Meanfork length for subbasin hatchery winter steelhead without a spawning check was 57cm for 1 salt adults and ranged from 62 to 73 cm for 2,salt adults and 75 to 77 cm

for 3 salt adults (Tables 13 and 14).
Although sex ratio as a percentage of females varied markedly among age classes,wild winter steelhead returned mostly as females (Table 15). Subbasin hatcherywinter steelhead mainly returned as males in age category l/2 and as females in agecategories l/l and l/3 (Table 15). Both wild and subbasin hatchery repeat spawnersreturned mainly as females.
Fecundity estimates ranged from 1,930 to 4,950 eggs per female for 2 salt adults andfrom 2,502 to 6,398 eggs per female for 3 salt adults (Table 16).
Spring Chinook Salmon
Natural spring chinook salmon entered the adult trap at Powerdale Dam early in Mayand subbasin hatchery spring chinook salmon entered the adult trap late in April(Table 17). The median date of migration occurred within the last 2 weeks of Junefor the natural run, and within the last 2 weeks of May for the subbasin hatcheryrun (Table 17). The natural run completed its migration to Powerdale Dam by lateJuly, and the subbasin hatchery run completed its migration by late September (Table17).
In the 1992 run year, spring chinook escapement was estimated at 35 natural, 411subbasin hatchery, and 1 stray hatchery fish (Table 18). Scale analysis indicatedthat natural spring chinook salmon migrated mainly as subyearling (age 0+) smoltsand returned mainly as age 4 adults (Table 19). Subbasin hatchery spring chinooksalmon all migrated as age l+ (freshwater age 2) smolts and returned mainly as age 4adults (Table 19).
All jack and adult fish which migrated as subyearling smolts. and were unmarked, hada freshwater scale pattern that was not typical of natural or hatchery stockslocated above Bonneville Dam. Scale analysis indicated that annuli were fartherapart than those typically observed on scales taken from either group of fish.Spring chinook salmon with this unique scale pattern were classified as having anaccelerated growth pattern before migration as smolts and were categorized asnatural fish for purposes of estimating escapement. However, Oregon stocks of wildand natural spring chinook salmon above Bonneville Dam do not exhibit a subyearlinglife history pattern. Almost all spring chinook salmon in the Deschutes Riversubbasin migrate as yearling smolts (Lindsay et al., 1989). Fewer than one percentof the returning wild spring chinook salmon in the John Day River subbasin migrateas subyearling smolts (Lindsay et al., 1984). No returning wild spring chinooksalmon in the Grande Ronde and Imnaha river subbasins have shown a subyearling smoltlife history pattern (telephone communication on 11/16/93 with Rhine Messmer, OregonDepartment of Fish and Wildlife, La Grande, Oregon). We proposed two hypotheses toexplain the anomalous life history pattern: 1) these fish are summer or fall run
6
chinook salmon that were mis-classified as spring chinook salmon and 2) these fishare unmarked stray hatchery produced fish released as fingerlings.
Fall chinook salmon migrate almost entirely as subyearling smolts, and upriverstocks of summer chinook migrate as either subyearling or yearling smolts dependingon the stock (telephone communication on 10/15/93 with Don Swartz, Oregon Departmentof Fish and Wildlife, Clackamas, Oregon). Typically, returning jack and adultsummer chinook salmon migrate past Bonneville Dam in June and July. Peak migrationoccurs in July (Oregon Department of Fish and Wildlife and Washington Department ofFisheries, 1991). Fall chinook salmon usually return to freshwater in August andSeptember (Oregon Department of Fish and Wildlife and Washington Department ofFisheries, 1991). The run timing data on spring chinook salmon showing asubyearling smolt migration pattern indicates that migration timing may be too earlyto warrant classifying this group of chinook salmon as either summer or fall runfish. More than half of these fish were sampled before July and all were sampledbefore August.
Historically, several hatcheries released fingerling spring chinook salmon near theHood River subbasin either annually or semiannually. These hatcheries include:Carson National Fish Hatchery (CNFH) in the Wind River subbasin. Little White SalmonNational Fish Hatchery (LWSNFH) in the Little White Salmon River subbasin, KlickitatHatchery in the Klickitat River subbasin. and Warm Springs National Fish Hatchery(WSNFH) in the Deschutes River subbasin. None of the unmarked spring chinook salmonsampled at Powerdale could have originated from WSNFH because all fingerlingreleases are adipose clipped and coded wire tagged before release. Generally,strays originating from CNFH can also be discounted based on age since the lastrelease of fingerlings from CNFH was from the 1987 brood (telephone communication on10/20/93 with Tim Roth, U.S. Fish and Wildlife Service, Hazel Dell, Washington).These fish would have returned as five year olds in 1992. Spring chinook salmonwith a subyearling life history pattern returned mostly as 4 year old fish(Table 18) from the 1989 brood. Only one five year old spring chinook salmon with asubyearling life history pattern was sampled at Powerdale Dam.
If unmarked hatchery spring chinook salmon with a subyearling smolt migrationpattern are straying into the Hood River subbasin, it is likely that a significantnumber would have originated from either LWSNFH or Klickitat Hatchery. Unmarkedfingerling spring chinook salmon are currently released annually from LWSNFH intothe Little White Salmon River subbasin and semiannually from Klickitat Hatchery intothe Klickitat River subbasin. Fingerling releases from LWSNFH are reared in ahatchery program that was designed to accelerate growth so that June releases willweigh about 30 to 40 fish/pound. Fingerling releases from Klickitat Hatcheryrepresent excess production and are not reared in any specialized hatchery programdesigned to accelerate growth. At this time we cannot determine if these productiongroups are straying into the Hood River subbasin. While our scale samples werebeing analyzed, no scale samples were available from jack and adult spring chinook
7

salmon returning to the Little White Salmon and Klickitat river subbasins forcomparison with the scale samples from the Hood River subbasin. In 1994, we willcollect scale samples from jack and adult spring chinook salmon with a subyearlingsmolt life history pattern that return to the Little White Salmon and Klickitatriver subbasins. These scale samples will be used to determine if returns fromfingerling production releases from LWSNFH and Klickitat Hatchery stray into theHood River subbasin.
Currently, no direct evidence is available to indicate whether unmarked springchinook salmon with subyearling smolt life history patterns are returns fromsubbasin natural production or are unmarked stray hatchery fish. Survival rates forfingerling releases from LWSNFH indicate, however, that numbers of fish expected tostray into the Hood River subbasin are fairly low. Fingerling production releasesfrom LWSNFH ranged from approximately 574,200 to 1.050,OO for the 1987-89 broods(telephone communication on 10/20/93 with Tim Roth, U.S. Fish and Wildlife Service,Hazel Dell, Washington). Tom Roth reported recovering a total of 22 fish in 1993from Drane Lake, at the mouth of the Little White Salmon River, and the Little WhiteSalmon River sport fishery (telephone communication on 10/20/93 with Tim Roth, U.S.Fish and Wildlife Service, Hazel Dell, Washington). This is less than the number offish that were sampled at Powerdale Dam. Low survival rates from fingerling toreturning jack and adult fish back to the Little White Salmon River subbasinindicate that it is unlikely that large numbers of fish would be straying into theHood River subbasin. Currently, no information is available on juvenile and adultlife history patterns for hatchery spring chinook salmon released as fingerlingsfrom LWSNFH. It is possible that hatchery fish released as fingerlings may exhibita much higher straying rate than hatchery fish released as smolts. A higherstraying rate would reduce survival back to the Little White Salmon River subbasinwhile increasing the number of fish straying into other subbasins.
Additional information is needed to determine whether natural spring chinook salmonin the Hood River subbasin migrate as subyearling smolts. The question may be mootafter HRPP is fully implemented. One of the main goals of HRPP is to re-establish anatural run of spring chinook salmon in the Hood River subbasin. Although naturalproduction now occurs in the subbasin. we assume they are progeny of stray or Carsonstock hatchery spring chinook salmon spawning in the wild. Upon full implementationof HRPP, neither the 1) naturally produced progeny of Carson stock spring chinooksalmon, 2) marked Carson stock hatchery spring chinook salmon, nor 3) hatchery strayspring chinook salmon will be passed above Powerdale Dam. The hatchery program willuse the Deschutes stock of spring chinook salmon to develop a natural run in theHood River subbasin. Deschutes stock hatchery spring chinook salmon do not exhibita subyearling smolt life history pattern in the Deschutes River subbasin and we donot anticipate that this life history pattern will occur in the natural run thatbecomes established in the Hood River subbasin.
Mean fork length of wild spring chinook salmon that migrated as yearling smolts was
8

72 cm for age 4 adults and 85 cm for age 5 adults (Table 20). Mean fork length forsubbasin hatchery produced spring chinook salmon was 74 cm for age 4 adults and 88cm for age 5 adults (Table 20).
Sex ratio as a percentage of females varied widely for age 4 and age 5 adult springchinook salmon (Table 21). The sex ratio for the combined group of natural springchinook salmon was 57% for age 4 adults and 75% for age 5 adults. The sex ratio ofsubbasin hatchery fish was 76% for age 4 adults and 71% for age 5 adults (Table 21)
Coho Salmon
In the 1992 run year, wild coho salmon entered the adult trap at Powerdale Dam inthe first 2 weeks of September (Table 22). No wild coho salmon were recovered inthe 1993 run year (Table 23). The median date of migration for wild coho salmonoccurred in the last 2 weeks of September and migration was completed by earlyNovember (Table 221. The early entry time of wild coho salmon suggests these fishmay be progeny of hatchery strays. Oregon's coastal stocks of wild coho salmon, aswell as those in the Clackamas River subbasin, do not enter freshwater until aboutearly to late October and their peak migration does not occur until around Novemberthrough January (telephone communication on 11/18/93 with Al McGie, ODFW, Corvallis,Oregon).
For the 1992 through 1993 run years, estimates of coho salmon escapement ranged from0 to 23 wild and from 32 to 80 stray hatchery fish (Table 24). All wild coho salmonreturned as adults (Tables 24 and 25).
For wild adult coho salmon, mean fork length was 58 cm (Table 26) and the sex ratioas a percentage of females was 64% (Table 28). Mean fork length of stray hatcheryadult coho salmon ranged from 58 to 64 cm (Tables 26 and 27).
HATCHERY PRODUCTION
Numbers of hatchery steelhead smolts released into the Hood River subbasin rangedfrom 70,928 to 99,973 summer steelhead and from 4.595 to 48,985 winter steelhead forthe 1987-92 broods (Tables 29 and 30). Numbers of hatchery spring chinook salmonsmolts released into the Hood River subbasin ranged from 75,205 to 197,988 smoltsfor the 1986-91 broods (Table 31). All hatchery summer and winter steelhead fromthe 1987-92 broods and hatchery spring chinook from the 1986-91 broods were releasedas full term smolts. The first hatchery production release of spring chinook salmoninto the Hood River subbasin was the release of 92,680 fingerlings from the 1985brood (Table 31). Earlier hatchery brood releases of summer and winter steelheadcan be found in Olsen et al. (1992).

The 1991 brood of spring chinook salmon was the first brood from which hatcherybroodstock was collected entirely from the Deschutes stock, The hatchery wintersteelhead program was to have collected hatchery broodstock for the 1991 broodentirely from the wild Hood River stock, However, because of high pre-spawningmortality and the low numbers of adults collected for hatchery broodstock, severalBig Creek stock hatchery winter steelhead were incorporated into the hatcherybroodstock. Beginning with the 1992 brood, hatchery broodstock was collectedentirely from the wild Hood River stock. There are no further plans to utilizeeither the Carson or Big Creek stocks as broodstock for the Hood River hatcherysupplementation program.
The current hatchery production goal for winter steelhead is about 40,000 to 50,000smolts. Volunteer anglers collected hatchery broodstock for the 1991 brood release,but pre-spawning mortality was high and fewer eggs were collected than the targetgoal. After 1991. the hatchery broodstock collection program at Powerdale Damreplaced the volunteer program.
ENGINEERING
Powerdale Dam
ODFW engineers completed the preliminary design on the proposed Powerdale Dam adultfish facility. The department distributed a memorandum and preliminary designs forreview and comment to the affected agencies. Engineers also completed about 40% ofthe final design for the construction bid documents. Planning is nearly on scheduleto advertise for construction bids in February 1994. Engineers are currentlyselecting a consultant to prepare the detailed mechanical and electrical design.ODFW engineers also asked PP&L to initiate a Federal Energy and RegulatoryCommission (FERC) review of the preliminary fish facility design.
Engineers from ODFW. PP&L, and other resource and regulatory agencies coordinated indeveloping the design of the fish facility. ODFW also consulted with NationalMarine Fisheries Service (NMFS) fish passage experts who were concerned that thecurrent and proposed fish passage facilities at Powerdale Dam may delay upstreammigrant adults. All parties acknowledged that FERC relicensing, which will occurwithin the next 10 years, may result in directives that will require PP&L to modifythe existing fishway. These changes might necessitate modifications to the proposedadult fish facility. The parties came to an agreement that potential laddermodifications at some undetermined future date should not preclude further designand construction of the new adult fish facilities.
An all-weather access road to Powerdale Dam is critical for construction andoperation. Road development has been extremely challenging because of the generalphysical terrain near the mouth of the subbasin and the acquisition of easements for
10
. .

the road right-of-way. BPA right-of-way specialists identified the potential accessroutes to the east abutment of Powerdale Dam. In addition, ODFW engineers reviewedthe access routes and eliminated all but one alternative after considering maximumallowable road grade and road construction difficulties. Surveys have beencompleted and the preliminary alignment has been established for the access road.ODFW engineers completed much of the final design work for this access route.
ODFW personnel and BPA right-of-way specialists contacted the three privatelandowners who will be affected by development of the access road. All three willhave to agree to a road easement through their property before ODFW engineers cancomplete the final design and prepare bid documents for construction advertisement.All three landowners agreed to provide the easement but one property owner hasindicated that he will provide an easement only on condition that hatchery wintersteelhead are not passed above Powerdale Dam. Agreeing to this condition isunacceptable given the goals of HRPP. Negotiations between ODFW and the landownerhave already modified his position, but further negotiation will be needed beforethis issue is resolved.
ODFW engineers and BPA right-of-way specialists conducted a cursory survey of a sitefor a smolt acclimation and adult holding facility near Parkdale, Oregon. Personnelfrom both agencies met with the landowner and the adjacent property owner to discussbuilding a hatchery facility on the property. Both parties reacted favorably to theproposal. ODFW engineers completed preliminary designs for the proposed hatcheryfacility.
Pelton Ladder
ODFW engineers completed the final design work for modification of Pelton Ladder.Pelton Ladder, which is located in the Deschutes River subbasin, will be used torear spring chinook salmon to smolt size before they are released into the HoodRiver subbasin. Bid documents for construction of modifications to Pelton Ladderalso have been completed. Copies of the final project design and technicalconstruction specifications were distributed to all appropriate parties.
The drop-in rotary fish screens at the downstream end of each fish rearing cell willnot be included in the general construction contract for FY 94. Additional designwork remains to be completed on these units.
Inadequate funding has set back the completion of modifications to Pelton Ladder,but we are developing funding and scheduling proposals in anticipation that adequatefunding will become available in FY 94. It is planned that construction work onPelton Ladder will be completed by mid-October of FY 94 and that the ladder will bescreened in FY 95. Currently, we are proposing to rear 1994 brood spring chinooksalmon in Pelton Ladder for release in the Hood River subbasin in April 1996.
11

SCREENING EVALUATION
Irrigated orchards dominate agricultural use in the Hood River subbasin. A varietyof surface sources provide irrigation water in the subbasin. Five irrigationdistricts provide most of the irrigation water. The irrigation districts, theirwater sources, and water rights are summarized in Table 32.
Only one irrigation diversion on an anadromous fish bearing stream is not nowequipped with protective fish screening. The diversion is operated by the East ForkIrrigation District (EFID). It has its source in the East Fork Hood River (RM 6.3;Figure 1; Table 32). This diversion was screened from 1961-63 but the screens werelater abandoned because of continual mechanical breakdowns.
Several screened irrigation diversions on anadromous fish bearing streams do notmeet the current anadromous salmonid water approach velocities of 0.4 feet persecond for juvenile fish under 60 mm fork length and 0.8 feet per second forjuvenile fish over 60 mm fork length. These diversions are the Neal Creek screen,at RM 6.0 in Neal Creek, that has approach velocities of about 2 feet per second andthe Farmers Irrigation District (FID) screen, at RM 11.6 in the main stem HoodRiver, that has approach velocities at more than 1 foot per second (Figure 1).
The Middle Fork Irrigation District outlet from Clear Branch Reservoir (LaurenceLake; Figure 1) is above the existing anadromous fish distribution. However, thisoutlet does not appear to have adequate screening to protect resident salmonids,including a remnant bull trout population.
The largest diversion in the Hood River subbasin is PP&L's hydroelectric intakelocated on the main stem of the Hood River at Powerdale Dam (RM 4.5: Figure 1).This intake can divert up to 500 cfs through a vertical traveling screen array.Water approach velocities at the screen surface probably exceed present criteria forjuvenile salmon, but good bypass flows are likely to be effective for movingdownstream migrants past this diversion.
Dee Forest Products maintains an unscreened diversion on Tony Creek (RM 0.75; Figure1) that diverts up to 2.5 cfs for industrial uses and fire protection. Thisdiversion does not prevent fish from entering the pipeline intake.
HABITAT
The intent of HRPP was to achieve subbasin production goals using hatcherysupplementation, however, subbasin production is considered to be low as a result ofrelatively unproductive water, steep gradients, high turbidity and siltation, lackof in-stream structure, and relatively little spawning gravel (ODFW and CTWS, 1990).
12

Although many of these constraints result from natural occurrences, several havebeen aggravated by a long history of land management practices that include problemsassociated with timber harvest, water withdrawal, agricultural use, andhydroelectric development. Improved environmental laws and regulations helped slowthe degradation of habitat, and various habitat improvement projects have alleviatedsome of the more critical habitat related problems. Although the combined effecthas been to reduce juvenile mortality and to increase carrying capacity, severalhabitat improvement projects remain that can increase subbasin production capacity.These projects provide a mechanism for increasing the benefits associated with HRPP.
Public and private lands in the Hood River subbasin, managed for either timberharvest or agricultural use, have had a significant impact on anadromous salmonidhabitat. Projects designed to rectify some of the more severe habitat problems havebeen initiated in the upper drainage where most of the public land is located.Mount Hood National Forest (MHNF) manages the largest block of public land. MHNFencompasses approximately 120,000 acres of land including 53 linear miles of streamconsidered suitable for anadromous salmonid habitat or about 27% of the linearmileage of stream on MHNF lands (ODFW and CTWS, 1990). In 1989, the MHNF began avariety of projects designed to improve habitat degraded as a result of past landmanagement practices. These projects focused on increasing channel roughness andin-stream structure by introducing large woody material and boulders into thestream. These habitat improvements were in Clear Branch Creek, above and belowLaurence Lake; Lake Branch Creek: West Fork Hood River: McGee Creek: RobinhoodCreek, and the East Fork Hood River (telephone communication on 11/19/93 with ChutiRidgley. United States Forest Service, Parkdale, Oregon). Other habitat improvementprojects include work on private lands in Tony and Neal creeks, by ODFW, and onGreen Point Creek, by FID. The FID improved habitat in Green Point Creek asmitigation for construction of a hydroelectric facility. ODFW continues to workwith diversion operators to minimize the loss of downstream migrant juveniles.Currently, several habitat projects are in the planning stages for implementation onMHNF lands.
Although several habitat problems in the subbasin have been corrected, problem areasstill remain that need to be addressed to fully realize the potential of HRPP. Pasthabitat improvement projects focused on improving passage for upstream migrantadults and downstream migrant juveniles. Currently, one major unscreened irrigationdiversion needs to be screened and several screened diversions need improvement ormajor repairs (see SCREENING EVALUATION). The East Fork Irrigation District (EFID)operates and maintains the unscreened diversion. We believe this diversion has amajor impact on fry-to-smolt survival. Projects that would improve passage forupstream migrant adults are limited to a few tributary streams. We believe all mainstem passage problems have been rectified. Projects to improve adult passageinclude improvement of passage past the Middle Fork Irrigation District's (MFID)diversion ditch in Evans Creek: passage past a cataract at the mouth of Ode11 Creek:and passage through a road culvert in Bear Creek.
13

Several areas of the Hood River subbasin have been identified as sites that wouldbenefit from habitat improvement projects. Riparian enhancement projects have beenidentified for Neal, Evans, and Baldwin Creeks. Additional stream structureprojects have been identified for the West Fork Hood River, Wisehart Creek, EmilCreek, McGee Creek. Green Point Creek, and Ode11 Creek. Clear Branch Creek belowLaurence Lake is a site for gravel supplementation. Habitat improvement in theseareas provides an alternative for increasing the subbasins carrying capacity.Habitat inventory work to be completed as part of the Hood River/Pelton Ladderevaluation studies will increase the information about habitat deficiencies and willbe used to develop priorities for habitat improvement projects in the subbasin. Wewill need to evaluate the effectiveness of various types of habitat projects todetermine which would provide the greatest benefit in the Hood River subbasin.Habitat improvements demonstrating the greatest potential for improving egg-to-smeltsurvival and for increasing carrying capacity will have the highest priorities.Recommendations will be based in part on the life history and production informationcollected as part of the Hood River/Pelton Ladder evaluation studies.
SUMMARY
In December 1991, the monitoring and evaluation program in the Hood River subbasinbegan collecting life history and production information on stocks of anadromoussalmonids returning to the subbasin. The program was implemented to provide theinformation needed to evaluate various management options for implementing HRPP.Information will also be used to prepare the environmental assessment (EA) needed toevaluate the programs impact on the human environment. Bonneville PowerAdministration (BPA) will prepare the EA in compliance with federal guidelinesestablished in the National Environmental Policy Act.
This report summarizes the life history and production data collected at thePowerdale Dam trap on two complete run years of winter steelhead and coho salmon antone complete run year of summer steelhead and spring chinook salmon. The data willbe used as baseline information 1) for evaluating HRPP, 2) for evaluating theprogram's impact on indigenous stocks of anadromous salmonids, and 3) for preparingthe EA. We will continue to collect baseline information on indigenous stocks ofanadromous salmonids for several years before implementation of HRPP. We will alsobegin collecting baseline life history and production information on stocks ofresident salmonids in FY 94.
.14

g
Farmers Irrigation Ditch
Farmerr Irrigdtlon Ditch lLOW line
p-yFJ East Fork Irrigation Ditch
(5sc Stanley Smith Canall
JNCL Neal Creek Lateral
Figure 1. Map of the Hood River subbasin
15

Table 1. Migration timing of Summer steelhead captured at the Powerdale Dam trap in the 199293 run year
Period Number Cumulative % Number Cumulative % Number Cumulative % Number Cumulative %
Mar 01-15Mar 16-31Apr 01-15
Apr 16-30May 01-15May 16-31
Jun 01-15Jun 16-30Jul 01-15Jul 16-31Aug 01-15Aug 16-31Sep 01-15Sep 16-30
Oct 01-15Octt 16-31Nov 01-15Nov 16-30
Oec 01-15Dec 16-31Jan 01-15Jan 16-31Feb 01-15Feb 16-29Mar 01-15Mar 16-31
Apr 01-15Apr 16-30May 01-15
May 16-31Jun 01-15
Totals
0 0 01 0.2 8
12 2.7 48
6 4.0 827 5.5 131
21 9.9 191
31 16.4 136
68 30.6 27949 40.9 25348 50.9 220
37 58.7 136
18 62.5 2817 66.0 26
55 77.6 55
25 82.8 24
24 87.8 1038 95.8 1512 98.3 4
2 98.7 1
1 99.0 40 99.0 0
1 99.2 0
0 99.2 0
0 99.2 01 99.4 0
1 99.6 3
0 99.6 110 99.6 4
2 100 1
0 100 0
0 100 0
477 1,670
0 0 0 10.5 0 0 2
3.4 0 0 1
8.3 0 0 016.1 2 3.6 127.5 3 8.9 0
35.7 0 8.9 1
52.4 2 12.5 1
67.5 6 23.2 2
80.7 4 30.4 2
88.9 3 35.7 1
90.5 0 35.7 192.1 4 42.9 0
95.4 16 71.4 1
96.8 0 71.4 2
97.4 4 78.6 0
98.3 5 87.5 2
98.6 0 87.5 0
98.6 0 87.5 0
98.9 0 87.5 1
98.9 0 87.5 0
98.9 1 89.3 0
98.9 1 91.1 0
98.9 0 91.1 0
98.9 1 92.9 0
99.0 1 94.6 0
99.7 3 100 0
99.9 0 100 0
100 0 100 0
100 0 100 0
100 0 100 0
56 19
5.315.821.1
21.1
26.326.3
31.6
36.847.4
57.963.2
68.4
68.473.7
64.2
84.2
94.794.7
94.7
100
100100
100
100100100
100
100
100
100
100
Wild Subbasin hatchery Stray hatchery Unknown
16

Table 2. Summer steelhead escapements to the Powerdale Dam trap by origin, run year. and age category. fish of unknown origin were allocated toorigin categories based on scale analysis and the ratio of fish of known origin (see METHODS).
Origin,Run Year
Total Freshwater/Ocean aqe Repeatescapement l/l l/2 l/3 l/4 2/l 2/2 2/3 3/l 3/Z 4/2 spawners
Wild.1992-93 484 5 --
Subbasin hatchery.1992-93 1.682 48 1.477 143
- - 25 305 48 6 77
1 -- -- -- - -
17
13
Stray hatchery.1992-93 56 4 43 a __ ____ -- __ 1

Table 3. Age compositiona (percent) of adult summer steelhead sampled at the Powerdale Dam trap by origin and run year
Origin. Freshwater/Ocean age RepeatRun Year N l/l l/2 l/3 l/4 2/l 2/2 2/3 3/l 3/2 4/2 spawners
Wild,1992-93 477 -- 1.0 -- 5.2 62.9 9.9 1.3 15.9 0.2 3.6
Subbasin hatchery,1992-93 1.669 2.8 87.8 8.5 0.06 -- -- -- 0.8
Stray hatchery,
1992-93 56 7.1 76.8 14.3 -- -- 1.8 -- --
a Estimates in a given run year may not add to 100% due to rounding error.

Table 4. Mean fork length (cm) of summer steelhead with spawning checks in the 1992-93 M year by origin.sex. and age category. Fish were sampled at the Powerdale Dam trap.
Origin.Sample pop..
Statistic 1/1s.2 l/2s.3Freshwater/Ocean age
2/1s.2 2/2s.3 2/2s.4 . 3/1s.2 3J2s.3
Wild.Female.
NMeanSTDRange
Hale.NMeanSTDRange
Total.NMeanSTDRange
Subbasin hatchery.Female.
NhnSTDRange
Hale.NMeanSTDRange
Total.NMeanSTDme
-- -- 2 7-- -- 72.00 74.07-- -- 4.95 3.68-- -- 68.5-75.5 69.0-78.0
--------
-- 1 3__ 64.5 74.33-- -- 1.89-_ 64.5 73.0-76.5
--------
------_-
3 1069.50 74.155.57 3.14
64.5-75.5 69.0-78.0
1 962.0 72.56
-- 2.8462.0 68.0-77.0
1 260.0 73.50
-- 3.5460.0 71-O-76.0
-- --
-- --
2 1161.00 72.731.41 2.81
-- ---- ---- --- - --60.0-62.0 68.0-77.0
177.5
--77.5
--------
177.50
--77.50
--------
--------
--------
--------
158.0
--58.0
158.0
--58.0
--------
--------
--------
173.5
--73.5
--__----
173.5
--73.5
--------
--- -----
--------
19

Table 5. Mean fork length (cm) of s-r steelhead without spawning checks in the 1992-93 run year by orlgln. +sex. and age category. Flsh weresampled at the Powerdale Dam trap.
Origln.Sample pop.,
Statlstlc l/l l/2 l/3 l/4Frw/Ocean age
2/l 2/2 2/3 3/l 3 /2 4 /2Sampleamean
Wild,Female.
N --Mean --STD --Range --
Male,N --Mean --STD --Range --
Total.N --Mean --
2 STD ----Range
Su;ba& hatchery,
N 'Mean 55.2STD 4.97Range 42.0-61.5,
63.:--
63.5
- -- -----
63.:
63:;
35068.745.64
36.5-82.5
12773.299.53
46.0-97.5
47769.957.18
36.5-97.5
1.15567.604.29
42.0-84.5
51571.696.61
50.0-92.5
1.67068.865.45
42.0-92.5.
58.:3.41
51.5-63.
23769.194.44
59.0-80.5
78.:: 52.9:2.92 9.41
71.0-82.5 36.5-59.0
6168.243.70
59.5-76.5
3 --
69.33 --
2.75 --
66.5-72.O --
----. .. .
--------
------- -
- -------
90.:
90:;
90.:
90:;
5
52.1:4.26
46.0-58.5
56.:;4.59
46.0-63.5
6371.375.47
58.0-82.5
30069.644.75
58.0-82.5
83.:;5.53
74.0-97.5
69.::4.84
59.5-77.0
67.5:3.54
65.0-70.0
62.:
62:i
82. :‘i 54.5:. 68.:;5.52 9.28 3.94
71-o-97.5 36.5-62.5 59.5-77.0
68.6:2.82
65.0-72.0
--
--
--
--
76.::4.32
64.0-84.5
794 4.89
69.0.92;5
1.07467.443.45
51.0-77.0
-- me
. . .-
.- --
.- -I
Male.NMeanSTDRange
Total.NMeanSTD.Range
5 4 . :3.08
50.0-62.0
39270.813.94
51.5-87.5
4 7 1.466 142.55.11 68.34 78.46
4.04 3.89 5.0042.0-62.0 51.0-87.5 64.0-92.5
- ---- -- -
a Mean estlmate Includes steelhead with spawning checks and steelhead in which the origin but not the age of the fish could be determined from thescale sample.

Table 9 Winter steelhead escapements to the Powerdale Dam trap by origin. run year, and age category Fish of unknown origin were allocated toorigin categories based on scale analysis and the ratio of fish of known origin (see METHODS)
Origin,Stock, Total Freshwater/Ocean aoe Repeat
Run Year escapement l/l l/2 l/3 2/l 2/2 2/3 2/4 3/1 3/2 3/3 4/2 spawners
Wild.Hood River.
1991-921992-93
693 3 4 9 421 75 0 1 111 17 1 51
408 2 6 35 173 122 1 1 20 16 0 32
Subbasin hatchery,Big Creek,
1991-92 289 269 7 6 1 -- -- -- 61992-93 206 65 133 0 0 _. -- -- a
Mixed.a1992-93 7 7 -- -- --
Stray hatchery,1991-92 34 19 14 -- 11992-93 30 18 9 __ 3
a Returns from the 1991 brood are progeny of wild x Big Creek stock hatchery crosses

Table 10 Age compositiona (percent) of winter steelhead sampled at the Powerdale Dam trap by origin and run year
Origin.Stock,
Run yearFreshwater/Ocean aqe
N l/lRepeat
l/2 l/3 2/l 2/2 2/3 2/4 3/l 3/2 3/3 4/2 spawners
Wild.Hood River.
1991-921992-93
662 -- 05 06 1.4 60.7 10 7 0 02 16 0 2.4 02 74392 -- 0.5 15 8.78.7 42.3 29 a 0.3 0.3 4.8 38 0 79
Subbasln hatchery,Big Creek,
1991-92 245 93 1 24 20 ,o 4 -- -- -- _ -- 2.01992-93 185 -- 31 4 64 9 -- 0 0 --
b 3.8Mixed.
1992-93 6 100 -- -- -- -- -- --
zStray hatchery,
1991-92 32 56.2 40 6 -- -- 311992-93 29 -- 58.6 310 -- __ -- __ __ 10.3
a Estimates In a given run year may not add to 100% due to rounding error.b Returns from the 1991 brood are progeny of wild x Big Creek stock hatchery crosses.

Table 11 Mean fork length (cm) of winter steelhead with spawning checks ln the 1991-92 run year by orlgln. sex, and age category Fish were sampled at thePowerdale Dam trap
Origin.Sample pop Freshwater/Ocean Age
Statistic l/25 3 1/3s 4 l / 2 s5 3s 4 2/ls 2 2/2s212s 3 2lZs.4 213s 4 3i2s 3 313s 4 212s 3s 4 213s 4s 5
Wild.Female,
N --Mean --STD
Range __
Male.N --
Mean __STD --Range --
Total.N --Mean --
STD --Range --
Hatchery.Female.
N 2Mean 72 5STD 2 83Range 70 5-74 5
Male.N 1Mean 68.0STD --
Range 68 0Total.
N 3Mean 71.00STD 3.28Range 68 o-74 5
-- - -
--
1 183 0 73 0
83 0 73 0
- - - --- - --- - --- --
1 183 0 73 0
-- --83.0 73.0
3 12 163 50 67 08 79 05 63 4 14 --
60.0-70.0 60 5-78 0 79 0
3 2 5 3 563.50 68.74 77 50 84.505.63 4 92 1.32 3 48
60 O-70 0 60 5-81.0 76 5-79 0 78 5-87 5
13 2 4 4 1 5 170 27 76.75 84 38 67 12 81 5 75 20 82 05 23 0 35 4 01 3 28 -- 4 62 --
64 O-81 0 76 5-77.0 78 5-87 5 65 O-72 0 81 5 69.0-80 0 82 0
- - -- - -- - -- - --- -- ---- - - - -
-- - - --- - -- - -- - - - - -- - - - - -
- - -- - -- - - - - -- - - - --- - - - - -
185 0 - -
85.0
4 1 5 167 12 81 5 75 20 82 03 28 -- 4 62 --
65 O-72 0 81.5 69 0-800 0 82 0
- - --
-- - -
- -

Table 12 Mean fork length (cm) of winter steelhead with spawning checks in the 1992-93 run year by origin. sex, and age category. Fish were sampledat the Powerdale Dam trap
Origin.Sample pop
StatisticFreshwater/Ocean aqe
112s 3 Z/ls.Z 212s 3 2l3s.4 3j2s.3 212s 3s 4
Wild.Female.
NMeanSTDRange
Male,NMeanSTDRange
Total,
184 5
__84 5
15 569 77 83 804 60 4 25
63 O-78 0 78 5-89 0
4 270 62 81.003 94 1 41
66 5-74 0 80 O-82 0
363 679 82
58 O-75 0
170 00
70.00
__
__
3 16 5 4 263 67 69 78 83 80 70.62 81 009 82 4 45 4 25 3.94 1 41
58.0-75 0 63.0-78.0 78 5-89 0 66.5-74.0 80 O-82.0
NMeanSTDRange
184 5
Subbasin hatchery.Female,
NMeanSTDRange
Male,NMeanSTDRange
Total,NMeanSTDRange
84.5
575.505.50
68 O-82 0
268.007.78
62.5-73 5
__ __
773.366 61
62.5-82 0__

Table 13 Mean fork length (cm) of winter steelhead without spawning checks in the 1991-92 run year by origin, sex. and age category. Fish weresampled at the Powerdale Dam trap
Origin.Sample pop..
Statistic l/2 l/3 2/lFreshwater/Ocean aqe Samplea
2/2 2/3 3/l 3/2 3/3 4/2 mean
Wild.Female,
NMeanSTDRange
Male,NMeanSTDRange
Total.NMednSTDRange
2 3 235 4563 50 76.50 65 45 74.346 36 1 32 4 28 4.37
59 O-68 0 75 5-78 0 54 5-80 0 64 5-86 5
68 1464 60 76 543 52 5 79
56.0-71 0 68 5-88.5
38 266 01 86 005 29 6 36
55 O-76.0 81 5-90 5
1 40759 5 67 40
6 0459.5 54.5-88 5
27067 68
__ 7 3144.0-90 5
106 16 1 67765 10 77.72 59 5 67 514 27 6 50 6 57
55 O-76 0 68.5-90 5 59 5 44.0-90 5
__
151 5
51 5
151 5
51.5
_-
___.
__
1 160.5 77 5
9 167 2648 56 67 16 79 102 10 4 76 4 11
44 o-51 0 56.5-82.5 72 O-87 560.5 77 5
3 4 9 402 7162 50 76 75 48 56 66 16 76 064 82 1.19 2 10 4 56 4 82
59 O-68 0 75 5-78 0 44 o-51 0 54 5-82 5 64 5-87 5
Subbasln hatcheryFemale,
NMeanST0Range
Male,NMeanSTDRange
Total,NMeanSTDRange
81 6 __ 363 51 74 67 71 002 83 4.81 1 32
56 O-70 0 70 5-83 0 -- 70 O-72 5 __
10964 674 79
56 O-83.0
17564.163.46
55 5-81 5
_- 284_- 64 36
4 0255.5-83.0
__
__ ___-
76 i
76.5
14763 973 22
55 5-73 0
275 009 19
68 5-81 5__
228 6 __63 81 74 67 __3 09 4 81
55.5-73 0 70 5-83 0
5 172 60 76 5
76 55 18
68.5-81.5
a Mean estimates include steelhead with spawning checks and steelhead In which the origin but not the age of the fish could be determined from thescale sample

Table 14 Mean fork length (cm) of winter steelhead without spawning checks in the 1992.93 run year by origin, sex, and age category. Fish weresampled at the Powerdale Dam trap
Origin.Sample pop
Statistic l/l l/2 l/3 2/lFreshwater/Ocean aqe
2/2 2/3 2/4 3/l 3/2 3/3Sampleamean
Wild,Female,
NMeanSTDRange
Male,NMeanSTDRange
Total,NMeanSTD
28 Range
164.5
6415
4 9 104 8473.88 55 28 64 67 76.122.84 2 15 4.03 4.53
71.5-78 0 52 5-59.0 54 O-76 5 65.5-87.0
2 25 62 3382 75 51 26 67 14 80 893 18 2.99 4 95 6 47
80 5-85 0 46 O-58 0 56 O-80.0 70.5-95 0
__ 1 8 9 24755.0 64 81 77 28 69.80
__ __ 5.26 5 90 7.75__ 55 0 60 O-73 0 71 5-88 5 52 5-89 0
1,
95 i __ 65 iii_- __ 3 72
95 a 61.5-75.0
85.1;5.87
77.5-92 0
14868.5611.51
46 O-95 0
19 15 39565 29 80.43 69 334.32 6.94 9.34
60 O-75.0 71.5-92.0 46 O-95 0
_- ______ _-__
__ -___ _-
____ _-
11973.456.64
54 O-86 5
8870.2610.37
54 O-93.0
20772.098.55
54 O-93.0
154 0
5470
2 6 34 16659.25 76 83 52 32 65 597.42 5.28 3 30 4 54
54 O-64.5 71.5-85 0 46 O-59 0 54 O-80 0
117 1 195.0 55 0
95Ti 55 0
77.475 56
65.5-95.0
Subbasin hatchery.bFemale.
N 4Mean 57 38STD 2.36Range 54 o-59 5
Male.N 2Mean 55 75STD 2 47Range 54 o-57 5
Total.N 6Mean 56.83STD 2.29Range 54.0-59 5
12 8960.71 75 742 51 3.64
57.0-64.5 67 O-86.5
46 3162 33 81 852.67 4 82
57 O-67 0 67 O-93.0
58 12061.99 77 322 70 4 79
57.0-67.0 67 O-93 0
- - - -- -
- -- -
- -- -
- -
- -- -
-
a Mean estimates include steelhead with spawning checks and steelhead in which the origin but not the age of the fish could be determined from thescale sample
b Age l/l winter steelhead are returns from the 1991 brood release. These fish are progeny of wild x Big Creek stock hatchery crosses

Table 15. Winter steelhead sex ratios as a percentage of females by origin. run year, and age category Fish were sampled at the Powerdale Dam trap.(Sample size in parentheses )
Origin.Stock, Freshwater/Ocean aqe Repeat
Run year l/l l/2 1/3 2/1 2/2 2/3 2/4 3/l 3/2 313 4/2 spawners
Wild.Hood River,
1991-921992-93
67 (3) 75 (4) 0 (9) 58 (402) 63 (71) -- 0 (1) 64 (106) 88 (16) 100 (1) 65 (49)50 (2) 67 (6) 26 (34) 63 (166) 72 (117) 0 (1) 100 (1) 42 (19) 60 (15) -- a7 (31)
Subbasin hatchery.Big Creek,
1991-92 36 (228) 100 (6) -- 60 (5)1992-93 21 (58) 74 (120) --
Mixed.a1992-93 67 (6) -- __
100 (1) __ 80 (5)__ 71 (7)
a Returns from the 1991 brood are progeny of wild x Big Creek stock hatchery crosses

Table 16 Mean fecundity of wild winter steelhead by ocean age Fish were sampled at the Power-dale Damtrap.
Ocean age, Mean forkRun year len.gth (cm) N
FecundityMean Range 95% CI
2 Salt,1991-92 62 7 11 2.940 1,930 - 4.950 f 624
1992-93 66 4a 8 3.620 3,036 - 4.117 f 317
3 Salt,1991-92 74 8 6 3,032 2,502 - 4.080 k 572
1992-93 78 8 a 4,286 2.916 - 6,398 f 1.341
a Fork length was not recorded for one fish
30

Table 17 Migration timing of spring chinook salmon captured at the Powerdale Dam trap in the 1992 run year
Period Number Cumulative % Number Cumulative % Number Cumulative % Number Cumulative %
Wi ld Subbasin hatchery Stray hatchery Unknown
Apr 01-15 0Apr 16-30 0May 01-15 1May 16-31 8Jun 01-15 5Jun 16-30 11Jul 01-15 4Jul 16-31 4Aug 01-15 0Aug 16-31 0Sep 01-15 0Sep 16-30 IIOct 01-15 0
Totals 33 309 1 104
00
3027 342 475 887 9100100100100100100
0 09 29
70 25 6107 60 253 77 350 93 513 97 74 99 02 99 70 99.70 99.71 1000 100
0 0 00 3 290 12 14 40 46 58 70 25 82 70 13 95.20 2 97 10 0 97 1
100 2 99 0100 0 99.0100 0 99.0100 1 100100 0 100
Table 18 Spring chinook salmon escapements to the Powerdale Dam trap by origin. run year, and agecategory Fish of unknown origin were allocated to origin categories based on scale analysis and the ratioof fish of known origin (see METHODS).
Origin. TotalRun year escapement 13 14
Freshwater Total age1.5 2.3 2.4 2.5
Natural,1992 35 1 21 1 9 3
Subbasin hatchery,1992 411 -- __ 1 391 19
Stray hatchery.1992 1 1 __
31

Table 19. Age compositiona (percent) of spring chinook salmon sampled at the Powerdale Dam trap by originand run year
Origin.Run year N
Freshwater Total aqe13 14 1.5 23 2.4 25
Natural,1992 33 30 60 6 30 24 2 91
Subbasin hatchery,1992 302 03 95 0 46
a Estimates in a given run year may not add to 100% due to rounding error
32

Table 20 Mean fork length (cm) of spring chinook salmon in the 1992 run year by origin. sex. and agecategory Fish were sampled at the Powerdale Dam trap
Origin.Sample pop
Statistic 13Freshwater Total aqe Samplea
14 15 2.3 24 2.5 mean
Natural,Female,
NMeanSTDRange
Male,NMeanSTDRange
Total,NMeanST0Range
14 180 04 86 07 19
62 o-91 0 85.0
2 2 1969 75 85.25 79 828 13 10 96 8 03
64 O-75 5 77 5-93.0 62.0-93 0
1 671 0 84 00
6 1871 0 79 o-95 0
184 0
84 0
1478 439 04
57 5-95 0
673 179 31
57 5-82 0
1 20 1 8 3 3371 0 81 22 86 0 72 31 84 83 79.23
7 00 8 59 7 78 8 3671 0 62 O-95 0 86 0 57 5-82 0 77 5-93 0 57 5-95 0
Subbasln hatchery,Jacks,
NMeanSTDRange
Female,NMeanSTDRange
Male,NMeanSTDRange
Total,NMeanSTDRange
154 5
- -
54 5
218 10 22873 34 84.85 73 844 18 8 21 5.00
53 5-93 0 72.0-99.0 53.5-99.0
69 4 7375.07 96 75 76 255 91 5 12 7.67
56 O-89.0 91 O-102 0 56 O-102 0
154 5
54 5
287 14 30973 75 88 25 74.324.71 9 16 5.92
53 5-93 0 72 O-102 0 53 5102.0
a Mean estimates include spring chlnook salmon in which the origin but not the age of the fish could bedetermined from the scale sample
33

Table 21 Spring chinook salmon sex ratios as a percentage of females by origin, run year, and agecategory Fish were sampled at the Powerdale Dam trap (Sample size in parentheses )
Origin.Run year
Freshwater Total aqe1.3 14 15 23 24 25
Natural,1992
Subbasln hatchery,1992
0 (1) 70 (20) 100 (1) 25 (8) 67 (3)
0 (1) 76 (287) 71 (14)
34

Table 22 Migration timing of coho salmon captured at the Powerdale Dam trap in the 1992 run year
PeriodWild Stray hatchery
Number Cumulative % Number Cumulative %Unknown
Number Cumulative %
Aug 01-15 0 0 0 0Aug 16-31 0 0 1 13Sep 01-15 1 45 6 89Sep 16-30 11 54 5 37 55 7Oct 01-15 5 72 3 12 70 9Oct 16-31 4 95 5 12 86 1Nov 01-15 1 100 11 100Nov 16-30 0 100 0 100
Totals 22 79
000
50.00
10000
Table 23 Migration timing of coho salmon captured at the Powerdale Dam trap lnthe 1993 run year
PeriodStray hatchery
Number Cumulative %Unknown
Number Cumulative %
Aug 01-15 0 0 0 0Aug 16-31 0 0 1 25 0Sep 01-15 1 36 1 50 0Sep 16-30 3 14 3 1 75 0Oct 01-15 9 46 4 0 75 0Oct 16-31 10 82 1 0 75 0Nov 01-15 0 82 1 0 75 0Nov 16-30 3 92 9 0 75 0Dec l-15 2 100 1 100
Totals 28 4
35

Table 24 Coho salmon escapements to the Powerdale Dam trapby origin. run year. and age category Fish of unknownorigin were allocated to origin categories based on scaleanalysis and the ratlo of fish of known origin (see METHODS).
Origin. Total Freshwater Total ageRun year escapement 2.2 23
Wild.19921993
23 230 --
Stray hatchery,19921993
80 13 6732 0 32
Table 25 Age composition (percent) of coho salmon sampledat the Powerdale Dam trap by orlgln and run year
Origin. Freshwater Total aqeRun year N 22 23
Wild.19921993
22 1000
Stray hatchery,19921993
79 16 5 83 528 a 100
36

Table 26 Mean fork length (cm) of coho salmon in the 1992 run year byorigin, sex. and age category Fish were sampled at the Powerdale Damtrap
Origin,Sample pop ,
StatisticFreshwater.Total aqe
2.3
-
2.2Sampleamean
Wild.Female,
NMeanSTDRange
Male,NMeanSTDRange
Total,NMeanSTDRange
Stray hatchery,Jacks,
N 13Mean 37 85STD 2.90Range 31.0-44 5
Female,N __
MeanSTDRange --
Male,N --
Mean --
STDRange --
Total,N 13Mean 37 a5STD 2.90Range 31 o-44 5
14 1460.86 60.854.29 4.28
52 5-66 0 52 5-66 0
8 853 62 53 628 25 8 24
43 5-67.5 43 5-67 5
22 2258.23 58 236.83 6 83
43 5-67 5 43 5-67 5
1337 852.90
31.0-44.5
24 2459.62 59.626 71 6 71
40 O-68 5 40.0-68.5
42 4257 44 57.447 15 7.15
41 5-72.5 41.5-72 5
66 7958.23 54 887 03 10 02
40 O-72 5 31 O-72 5
a Mean estimate includes coho salmon in which the orlg>n but not the ageof the fish could be determined from the scale sample
37
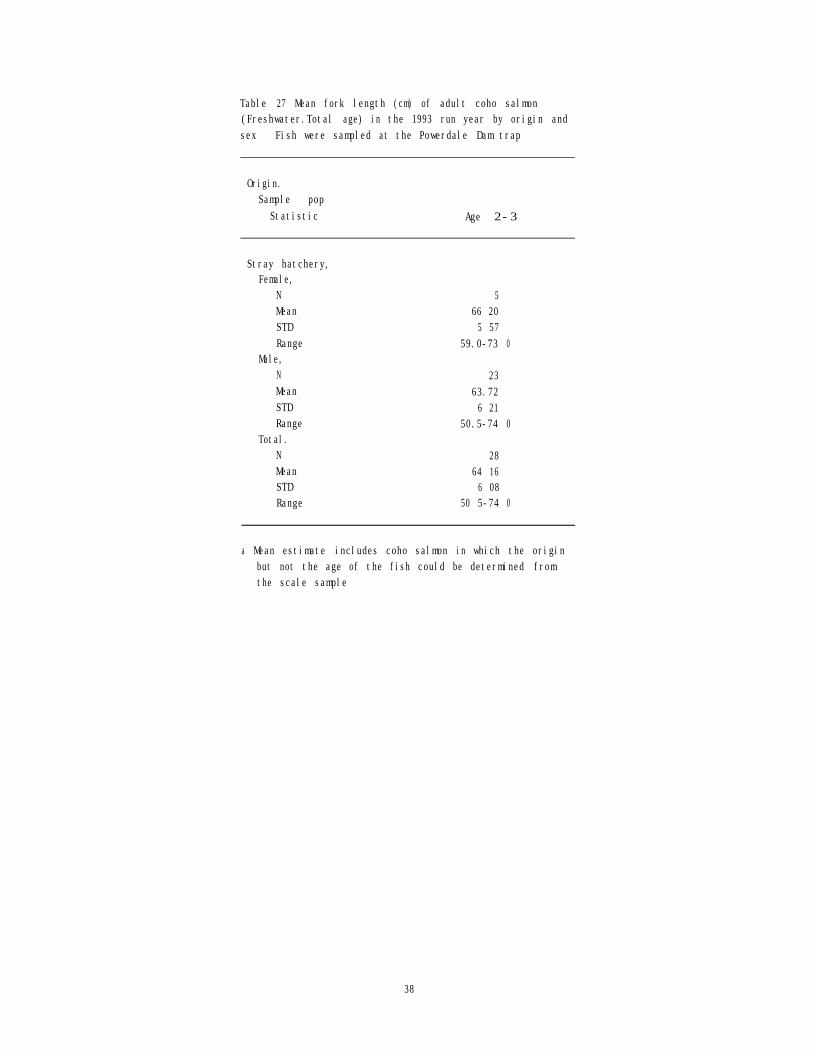
Table 27 Mean fork length (cm) of adult coho salmon(Freshwater.Total age) in the 1993 run year by origin andsex Fish were sampled at the Powerdale Dam trap
Origin.Sample pop
Statistic Age 2-3
Stray hatchery,Female,
NMeanSTDRange
Male,NMeanSTDRange
Total.NMeanSTDRange
566 205 57
59.0-73 0
2363.726 21
50.5-74 0
2864 166 08
50 5-74 0
a Mean estimate includes coho salmon in which the originbut not the age of the fish could be determined fromthe scale sample
38

Table 28 Coho salmon sex ratios as a percentage of femalesby origin. run year, and age category. Fish were sampled atthe Powerdale Dam trap (Sample size in parentheses )
Origin. Freshwater Total aqeRun year 22 23
Wild,19921993
64 (22)
Stray hatchery,19921993
62 c13ja 36 (66)18 (28)
a Eight Jacks were classified as females based on visualobservation
39

Table 29 Hatchery juvenile summer steelhead releases In the Hood River subbasln for the 1987-92 broodsa
Broodstock. Fin clipbHatchery, or coded Survival Date(s) Number
Brood year wire tag rate (%) released Fish/lb released Release location
Foster.cOak Springs.
19871987198719871987198719871987
AD 04/08/88 44 5,830 Hood RiverAD 04/11/88 46 5.026 Hood RiverAD 04/04-05/88 47 17.249 Hood RiverAD 04/08/88 44 5.500 West Fork Hood RiverAD 04/04/88 45 5,400 West Fork Hood RiverAD 04/06/88 4.6 10,324 West Fork Hood RiverAD 04/04-05/88 47 17,188 West Fork Hood RiverAD 04/07/88 50 12.350 West Fork Hood River
1988 AD 04/07/89 53 12.826 Hood River1988 AD 04/11/89 55 13,630 Hood River1988 AD 05/02-03/89 43 10.213 West Fork Hood River1988 AD 04/10/89 53 19,504 West Fork Hood River1988 AD 04/06.12/89 55 32,853 West Fork Hood River
1989 AD1989 AD1989 AD1989 AD1989 AD1989 AD
04/04/90 53 4,876 Hood River04/11/90 65 10.660 Hood River04/04.05/90 5.3 25,422 West Fork Hood River04/03/90 5.4 5.940 West Fork Hood River04/03.09/90 55 20.306 West Fork Hood River04/06/90 57 14,591 West Fork Hood River
19901990199019901990199019901990
19911991199119911991199119911991
199219921992
ADADADADADADADAD
04/29/91 5.4 7.020 Hood River04/30/91 55 14.743 Hood River04/24/91 58 7.013 Hood River04/22/9i 52 12,787 West Fork Hood River04/23/91 53 6,943 West Fork Hood River04/24/91 55 6,869 West Fork Hood River04/23/91 56 6.776 West Fork Hood River04/23/91 58 14.981 West Fork Hood River
AD 04/08/92 48 5.880 Hood RiverAD 04/07/92 5.2 12.870 Hood RiverAD 04/06/92 54 13.365 Hood RiverAD 04/08/92 55 6,958 Hood RiverAD 04/07/92 47 15.082 West Fork Hood RiverAD 04/07/92 52 15,023 West Fork Hood RiverAD 04/06/92 54 13.750 West Fork Hood RiverAD 04/08/92 5.5 17,045 West Fork Hood River
AD 04/07-08/93 60 33.570 West Fork Hood RiverAD 05/04/93 6.3 17,955 West Fork Hood RiverAD 05/05/93 65 19.403 West Fork Hood River
i Estimates of production releases prior to the 1987 brood are in Olsen et al. (1992)Ad = Adipose.
' The Foster stock was developed from the Skamanla stock of summer steelhead
40

Table 30 Hatchery juvenile winter steelhead releases in the Hood River subbasin for the 1987-92 broodsa
Broodstock. Fin cllpbHatchery, or coded Survival Date(s) Number
Brood year wire tag rate (%) released Fish/lb released Release location
Big Creek,Trojan Ponds
1988 No mark 04/17/89 42 4,890 East Fork Hood River
19891989
Gnat Creek,1987
Ad 04/12/90 4.7 4,253 Middle Fork Hood RiverAd 04/12/90 47 7,755 East Fork Hood River
No mark 04/22/88 56 28.000 MFk Hood River
1989 Ad1989 Ad
1990 Ad-LM1990 Ad-LM
Mixed.cOak Springs.
1991 Ad 03/31/92 46 4,595 East Fork Hood River
Hood River.Oak Springs,
199219921992
Ad-LP 04/06/93 5.8 15,225 Middle Fork Hood RiverAd-LP 04/06/93 60 15.420 East Fork Hood RiverAd-LP 04/06/93 56 18,340 East Fork Hood River
05/09/9005/09/90
__ 04/23/91-- 04/23/91
54 12.015 Middle Fork Hood River54 12,015 East Fork Hood River
5.2 5,356 Middle Fork Hood River52 15.078 East Fork Hood River
; Estimates of production releases prior to the 1987 brood are in Olsen et al. (1992Ad = Adipose, LP = Left Pectoral; LM = Left Maxillary.
' The 1991 brood are progeny of wild x Big Creek stock hatchery crosses.
41

Table 31broodsa.
Hatchery Juvenile spring chinook salmon releases in the Hood River subbasin for the 1985-91
Life history stage,Broodstock. Fin clip
Hatchery, or coded Survival Date(s) NumberBrood year wire tag rate (%) released Fish/lb released Release location
Fingerling.Carson,
Irrigon.1985
Smolt.Carson.
Bonneville.1986198619861986198619861986198619861986
1987 No mark1987 No mark1987 No mark1987 07-42-581987 No mark1987 07-42-58
1988 07-52-231988 No mark1988 No mark1988 07-52-231988 No mark1988 No mark1988 07-52-231988 No mark1988 07-52-231988 No mark1988 No mark
1989 07-55-301989 No mark1989 No mark
199019901990
No mark 06/18/86 23 0 92.680 West Fork Hood River
No markNo markNo markNo markNo markNo markNo mark07-42-5707-42-5707-42-57
No markNo mark07-56-59
03/14/88 9.4 11.724 West Fork Hood River03/ 14/88 97 30.895 West Fork Hood River03/ 14/88 10.1 11.644 West Fork Hood River03/14/88 10 2 12,288 West Fork Hood River03/14/88 10 5 4,988 West Fork Hood River03/14/88 10 8 9,150 West Fork Hood River03/14/88 11.1 14,570 West Fork Hood River03/14/88 11 2 34,548 West Fork Hood River03/14/88 11 4 14,443 West Fork Hood River03/14/88 11 6 5,689 West Fork Hood River
03/09/89 10 0 33,013 West Fork Hood River03/09/89 10.8 31,828 West Fork Hood River03/09/89 11 0 7.419 West Fork Hood River03/09/89 11 0 24,698 West Fork Hood River03109189 11 1 8,568 West Fork Hood River03/09/89 11 1 28,521 West Fork Hood River
03/13/9003/12-13/9003/13/9003/13/9003/12/9003/12/9003/14/9003/12-13/9003/14/9003/12/9003/12/90
03/25/9103/25/9103/25/91
0410219204/02/9204/02/92
94 23.970 West Fork Hood River99 42,565 West Fork Hood River10.0 20,799 West Fork Hood River10 0 10.650 West Fork Hood River10 1 11.209 West Fork Hood River10 2 13,973 West Fork Hood River10 2 10,761 West Fork Hood River10 3 30,483 West Fork Hood River10.4 14,144 West Fork Hood River10 5 7.770 West Fork Hood River10.8 11.664 West Fork Hood River
94 53.614 West Fork Hood River98 29,399 West Fork Hood River
11 2 42.419 West Fork Hood River
97 41,647 West Fork Hood River99 62.954 West Fork Hood River10 2 58,694 West Fork Hood River
42

Table 31 Continued
Life history stage,Broodstock, Fin clip
Hatchery, or coded Survival Date(s) NumberBrood year wire tag rate (%) released Fish/lb released Release location
Smolt. (cant 1Deschutes.
Bonneville.1991 07-33-35 04/01/93 11 2 11,760 West Fork Hood River1991 07-33-35 04/01/93 11.3 34,685 West Fork Hood River
Round Butte,1991 07-50-22 R2 -- 04/08.09/93 6.7 28.760 West Fork Hood River
a The 1986 brood release is the first production release of hatchery spring chinook smolts into the HoodRiver subbasin
Table 32 Primary irrigation diversions in the Hood River subbasln and their water source andwater right
Irrigation district Water source Water right
East Fork Irrigation DistrictMount Hood Irrigation DistrictMiddle Fork Irrigation DistrictMiddle Fork Irrigation DistrictMiddle Fork Irrigation DistrictMiddle Fork Irrigation DistrictDee Irrigation DistrictDee Irrigation DistrictFarmers Irrigation DistrictFarmers Irrigation DistrictFarmers Irrigation District
E Fk Hood RiverE Fk Hood RiverClear Branch ReservoirClear Branch tributariesTrout CreekWishart CreekW Fk Hood RiverW Fk Hood RiverHood RiverW Fk Hood RiverHood River tributaries
113 cfs15 cfs
127 cfs40 cfs6 cfs1 cfs
22 cfs57 cfs75 cfs
58 5 cfs73 cfs
43

ACKNOWLEDGEMENTS
We sincerely appreciate the many persons who helped complete this report. Specialthanks to Jim Newton and Steve Pribyl of the ODFW, mid-Columbia fisheries district,for both the construction and operation of the Powerdale trap and for supervision offield personnel. We thank them for their insight and guidance throughout the study.We also thank trap operators Jim Burgett, Brian Arrington, and Rod Linnell withoutwhom we would know much less about the abundance and life history of anadromoussalmonids in the Hood River subbasln. We gratefully appreciate the contributions ofscale readers Lisa Borgerson and Ken Kenaston, and of Mary Ann Davis who entered allscale and trap data'into a database. We would also like to thank Pacific Power andLight (PP&L) for allowing us to operate an adult trapping facility at Powerdale Damand both Steve Pribyl and Patty O'Toole for editing drafts of the report.
44

REFERENCES
Borgerson, L.A. 1992. Scale analysis. Annual Progress Report of the OregonDepartment of Fish and Wildlife (Project Number F-144-R-4) to U.S. Fish andWildlife Service, Vancouver, Washington.
Lindsay, R.B., W.J. Knox, M.W. Flesher, B.J. Smith, E.A. Olsen, and L.S. Lutz.1986. Study of wild spring chinook salmon in the John Day river system. FinalReport of Oregon Department of Fish and Wildlife (Contract No.DE-AI79-84BP12737, Project Number 83-335) to Bonneville Power Administration,Portland, Oregon.
Lindsay, R.B., B.C. Jonasson, R.K. Schroeder, and B.C. Cates. 1989. Spring chinooksalmon in the Deschutes River, Oregon. Information Reports (89-4) of OregonDepartment of Fish and Wildlife, Portland, Oregon.
Olsen, E., P. Pierce, M. McLean, and K. Hatch. 1992. Stock summary reports forColumbia River anadromous salmonids, volume II: Oregon. Final Report of OregonDepartment of Fish and Wildlife (Project Number 88-108, Contract NumberDE-FC79-89BP94402) to Bonneville Power Administration, Portland, Oregon.
Oregon Department of Fish and Wildlife and Confederated Tribes of the Warm SpringsReservation of Oregon. 1990. Hood River subbasin salmon and steelheadproduction plan. Columbia Basin System Planning Report to Northwest PowerPlanning Council, Portland, Oregon.
Oregon Department of Fish and Wildlife and Washington Department of Fisheries. 1991.Columbia River fish runs and fisheries, 1960-90. Status Report, Portland,Oregon.
45