Homework Econ Finishing Macro transition to Micro Chapters 16-19 Bonus Homework Due Tuesday, March...
70
Homework Econ Finishing Macro transition to Micro Chapters 16-19 Bonus Homework Due Tuesday, March 7, 2006 • AP Packet V – We will be working on many of the activities in the packet. Some will be for homework credit. Graphing Test! Not Adjusted! Total Points=100! March 8 th at the very earliest. March 10 th at the very latest.
-
Upload
howard-taylor -
Category
Documents
-
view
221 -
download
2
Transcript of Homework Econ Finishing Macro transition to Micro Chapters 16-19 Bonus Homework Due Tuesday, March...

Homework Econ
Finishing Macro transition to Micro Chapters 16-19
Bonus Homework Due Tuesday, March 7, 2006
• AP Packet V – We will be working on many of the activities in the packet. Some will be for homework credit.
Graphing Test! Not Adjusted! Total Points=100!March 8th at the very earliest.March 10th at the very latest.
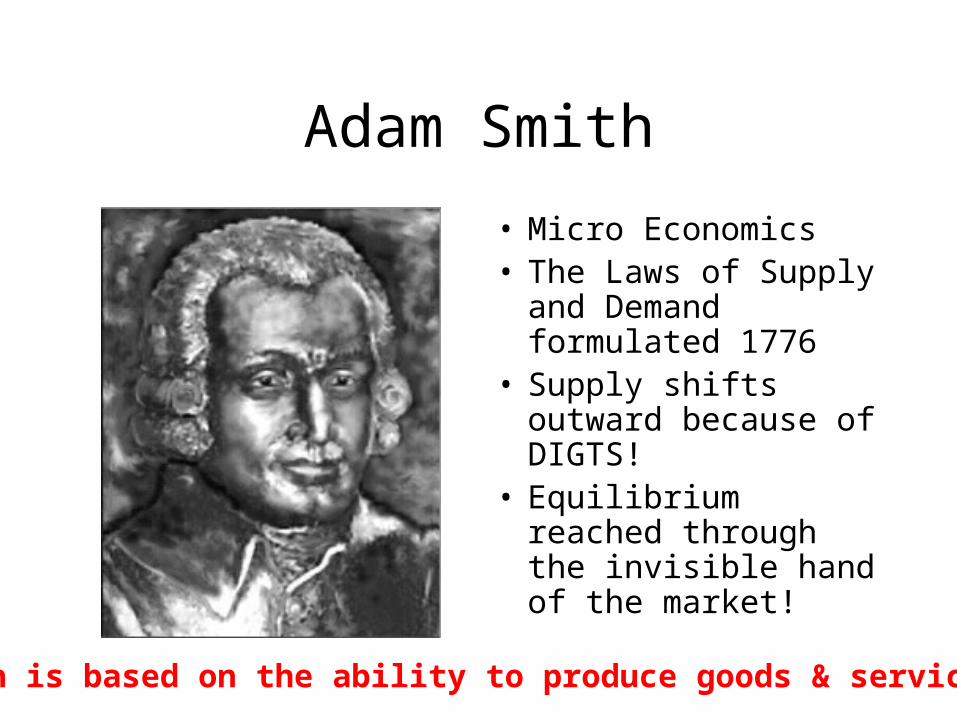
Adam Smith
• Micro Economics• The Laws of Supply
and Demand formulated 1776
• Supply shifts outward because of DIGTS!
• Equilibrium reached through the invisible hand of the market!
Wealth is based on the ability to produce goods & services!

David Ricardo Free Trade 1820’s
• Theories on Trade • Comparative Advantage• Trade is based on relative
opportunity cost.• Countries specialize in
production of products with the lowest opportunity cost.
Wealth is increased through specialization and trade!

J. B. Say 1830’s
• Supply creates its own demand!
• Aggregate supply is a vertical line!
• Demand determines only the price.
• Aggregate supply should be increased to improve standard of living!
Wealth is increased as output increases: “Supply creates Demand!
Classics and Keynes: AD-AS InterpretationClassics and Keynes: AD-AS Interpretation
Classical Economics...Classical Economics...

Classics and Keynes: AD-AS InterpretationClassics and Keynes: AD-AS Interpretation
Classical Economics...Classical Economics...Laissez-faireLaissez-faire

Classics and Keynes: AD-AS InterpretationClassics and Keynes: AD-AS Interpretation
Classical Economics...Classical Economics...Laissez-faireLaissez-faireVertical aggregate supply curveVertical aggregate supply curve

Classics and Keynes: AD-AS InterpretationClassics and Keynes: AD-AS Interpretation
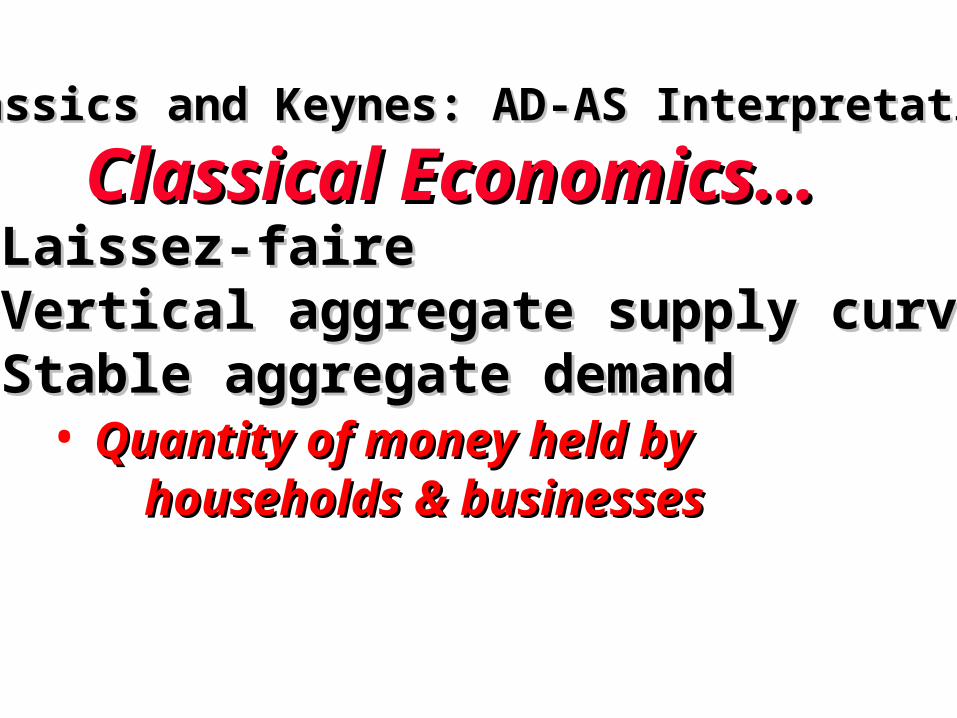
Classical Economics...Classical Economics...Laissez-faireLaissez-faireVertical aggregate supply curveVertical aggregate supply curveStable aggregate demandStable aggregate demand
Classics and Keynes: AD-AS InterpretationClassics and Keynes: AD-AS Interpretation
Classical Economics...Classical Economics...Laissez-faireLaissez-faireVertical aggregate supply curveVertical aggregate supply curveStable aggregate demandStable aggregate demand
• Quantity of money held byQuantity of money held byhouseholds & businesseshouseholds & businesses
• Purchasing power of money isPurchasing power of money isdetermined by the price leveldetermined by the price level
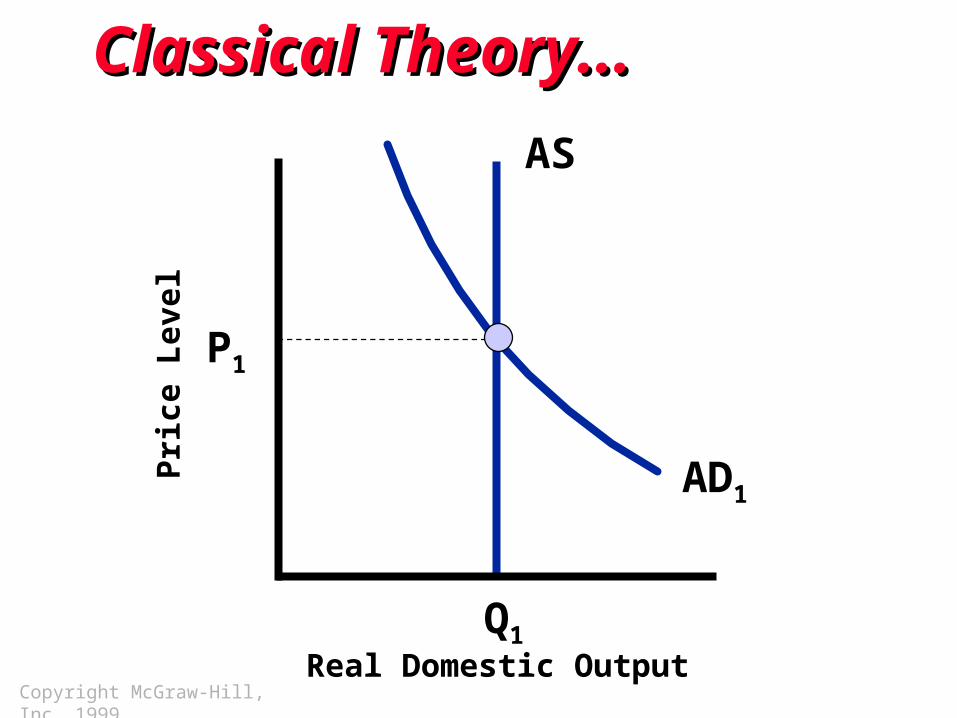
Classical Theory...Classical Theory...
P1
Q1
Pri
ce L
evel
Real Domestic Output
AS
AD1
Copyright McGraw-Hill, Inc. 1999

Classical Theory...Classical Theory...
P1
Q1
P2
Pri
ce L
evel
Real Domestic Output
AS
AD1
AD2
Copyright McGraw-Hill, Inc. 1999

John Maynard Keynes – 1930’s
• Father of Keynesian Economics
• Macro economies my be fine tuned!
• Fiscal policy may be used expand aggregate demand.
• Aggregate supply is horizontal not vertical
An absence of Demand makes Supply meaningless!

Milton Friedman 1950’s – 2000’s!
• A limited role for government!
• No Fiscal or Federal Reserve interventions
• Simply grow the money supply at 3-5% to grow the economy!
Increasing Money Supply will increase NGDP!MS * V = NGDP
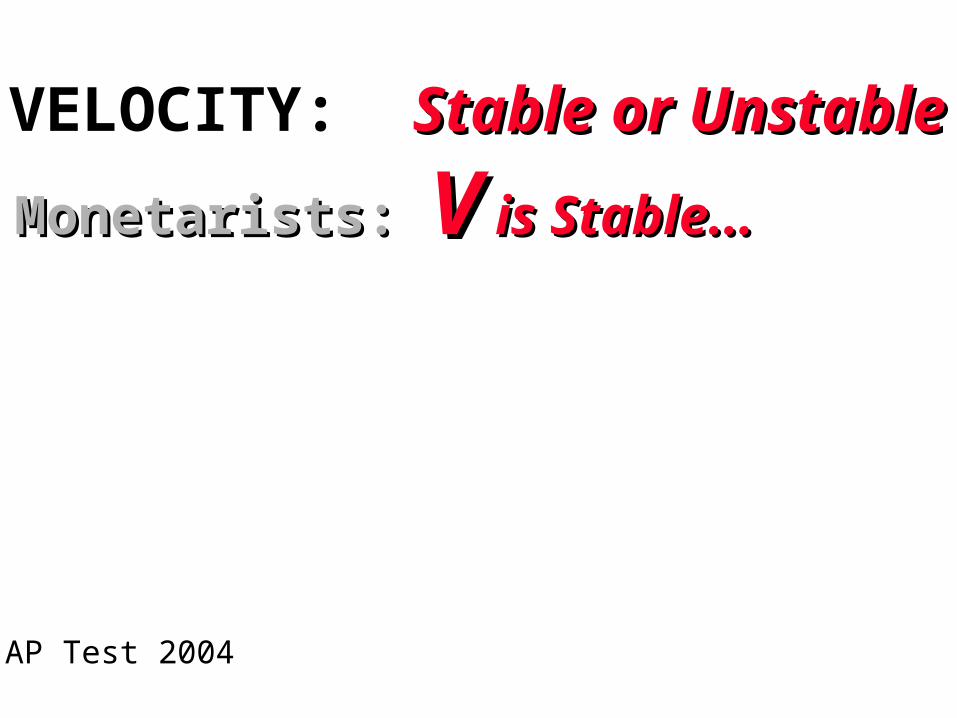
VELOCITY: Stable or UnstableStable or Unstable
Monetarists: Monetarists: VV is Stable... is Stable...
AP Test 2004
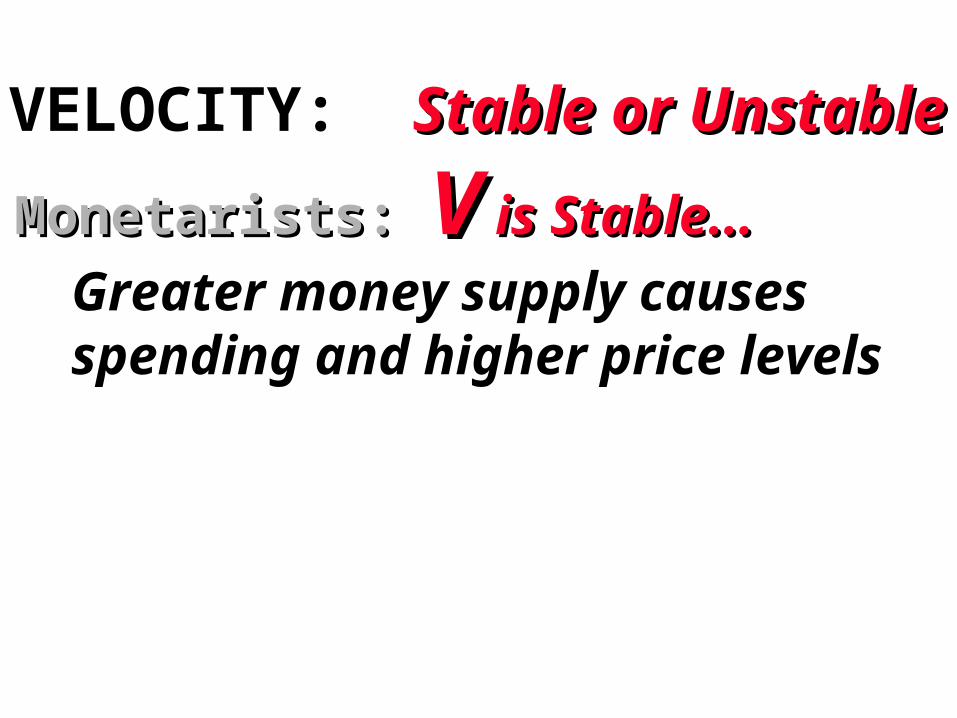
VELOCITY: Stable or UnstableStable or Unstable
Monetarists: Monetarists: VV is Stable... is Stable...
Greater money supply causesspending and higher price levels
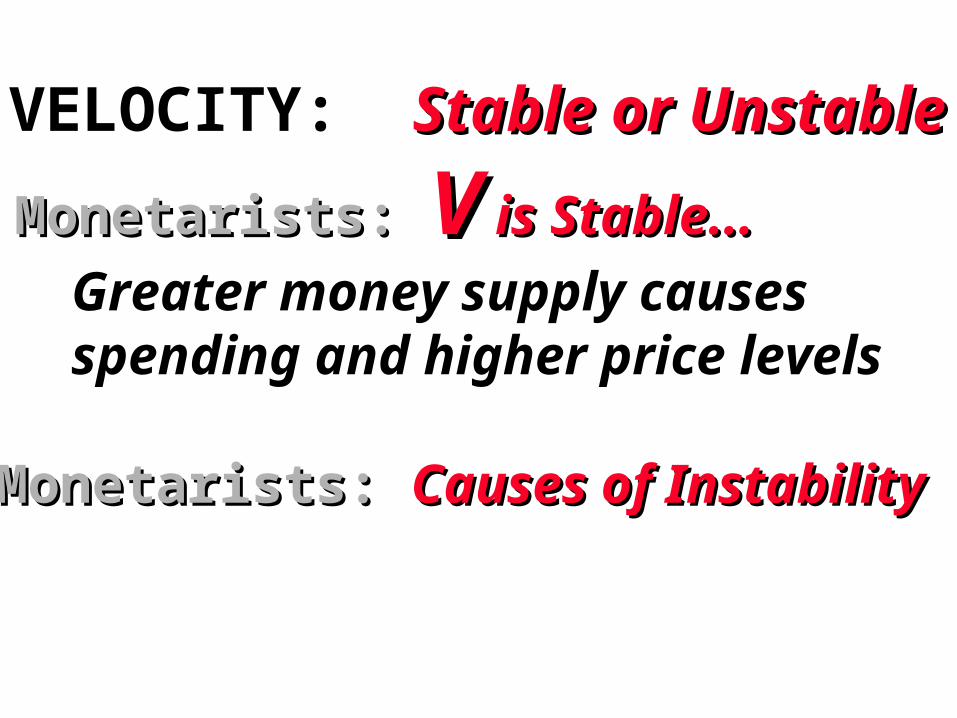
VELOCITY: Stable or UnstableStable or Unstable
Monetarists: Monetarists: VV is Stable... is Stable...
Greater money supply causesspending and higher price levels
Monetarists: Monetarists: Causes of InstabilityCauses of Instability
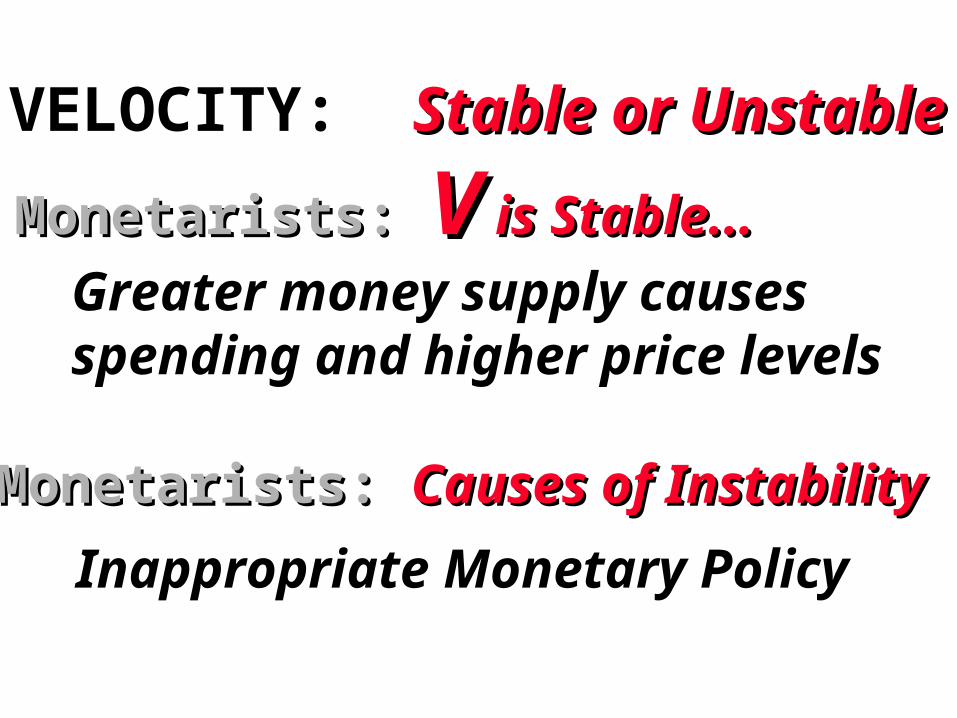
VELOCITY: Stable or UnstableStable or Unstable
Monetarists: Monetarists: VV is Stable... is Stable...
Greater money supply causesspending and higher price levels
Monetarists: Monetarists: Causes of InstabilityCauses of Instability
Inappropriate Monetary Policy


Alban W. Phillips
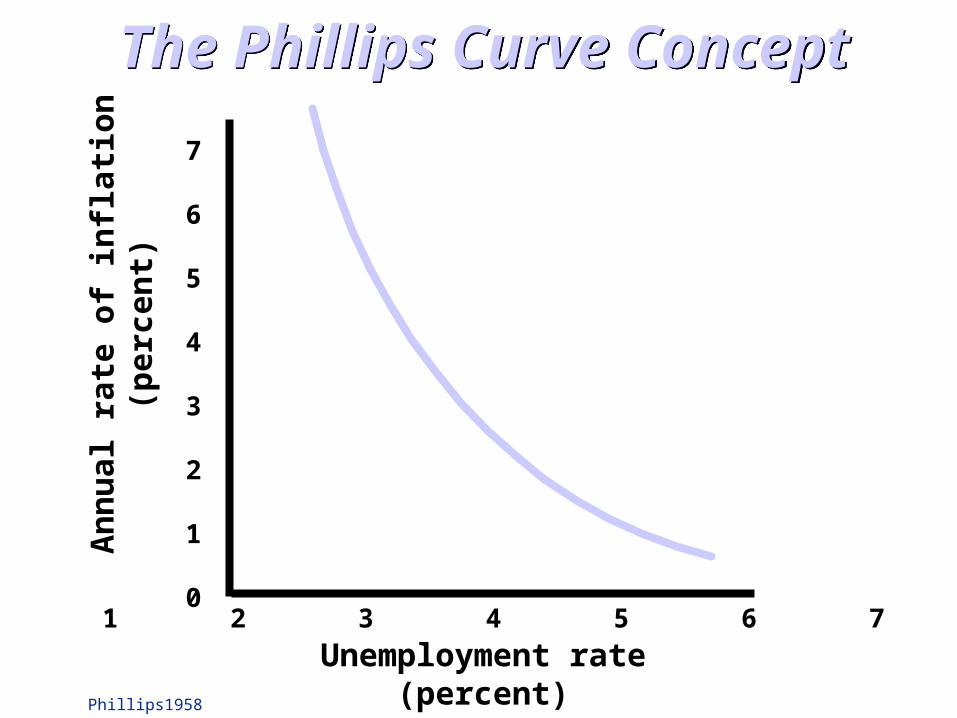
• Discovers and explained the relationship between inflation & unemployment!
• Discovered that they may not exist simultaneously!
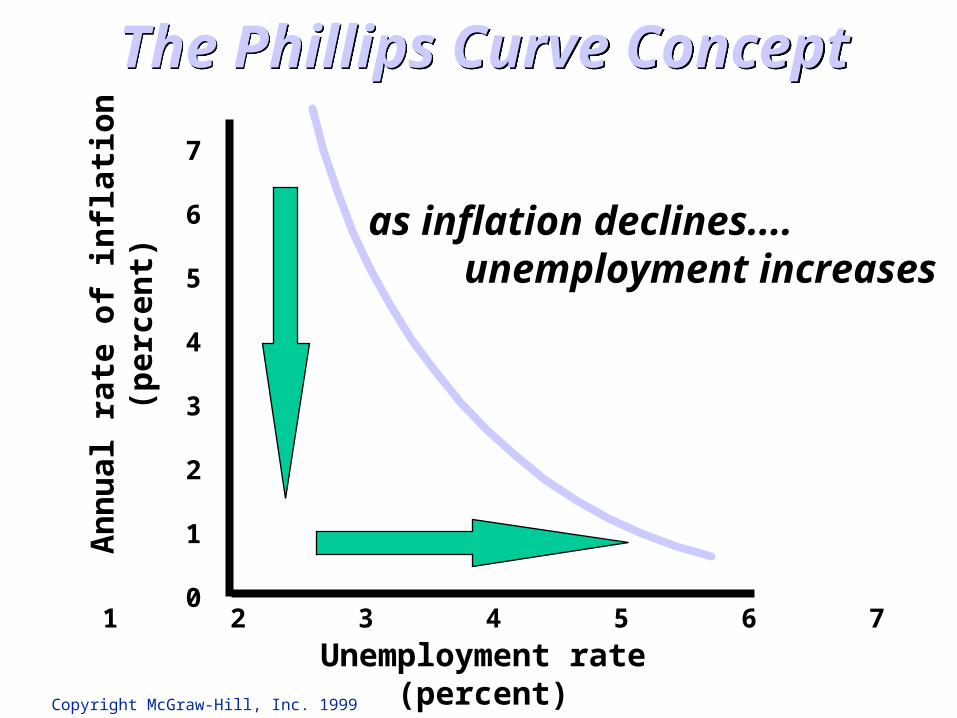
Provide a Keynesian Trade Off Between Inflation & Unemployment!Fine Tuning An Aggregate Economy Was Possible!

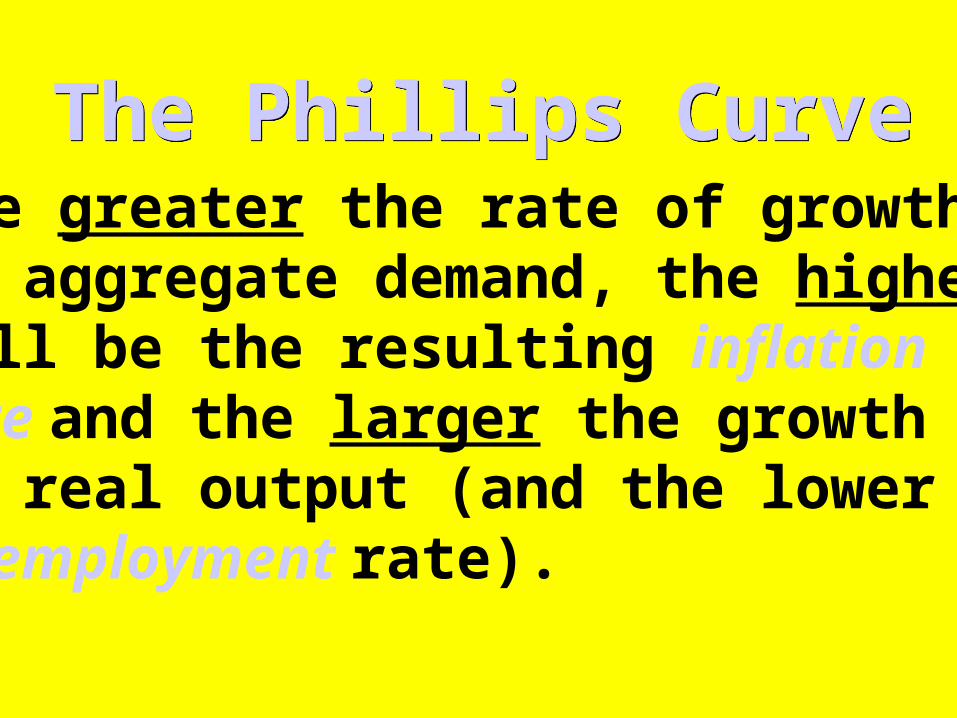
The Phillips CurveThe Phillips CurveThe greater the rate of growthof aggregate demand, the higherwill be the resulting inflationrate and the larger the growthof real output (and the lower theunemployment rate).
An
nu
al r
ate
of in
flat
ion
(per
cen
t)
Unemployment rate(percent)
7
6
5
4
3
2
1
01 2 3 4 5 6 7
The Phillips Curve ConceptThe Phillips Curve Concept
Phillips1958

An
nu
al r
ate
of in
flat
ion
(per
cen
t)
Unemployment rate(percent)
7
6
5
4
3
2
1
01 2 3 4 5 6 7
as inflation declines....
The Phillips Curve ConceptThe Phillips Curve Concept
Copyright McGraw-Hill, Inc. 1999
An
nu
al r
ate
of in
flat
ion
(per
cen
t)
Unemployment rate(percent)
7
6
5
4
3
2
1
01 2 3 4 5 6 7
as inflation declines....unemployment increases
The Phillips Curve ConceptThe Phillips Curve Concept
Copyright McGraw-Hill, Inc. 1999
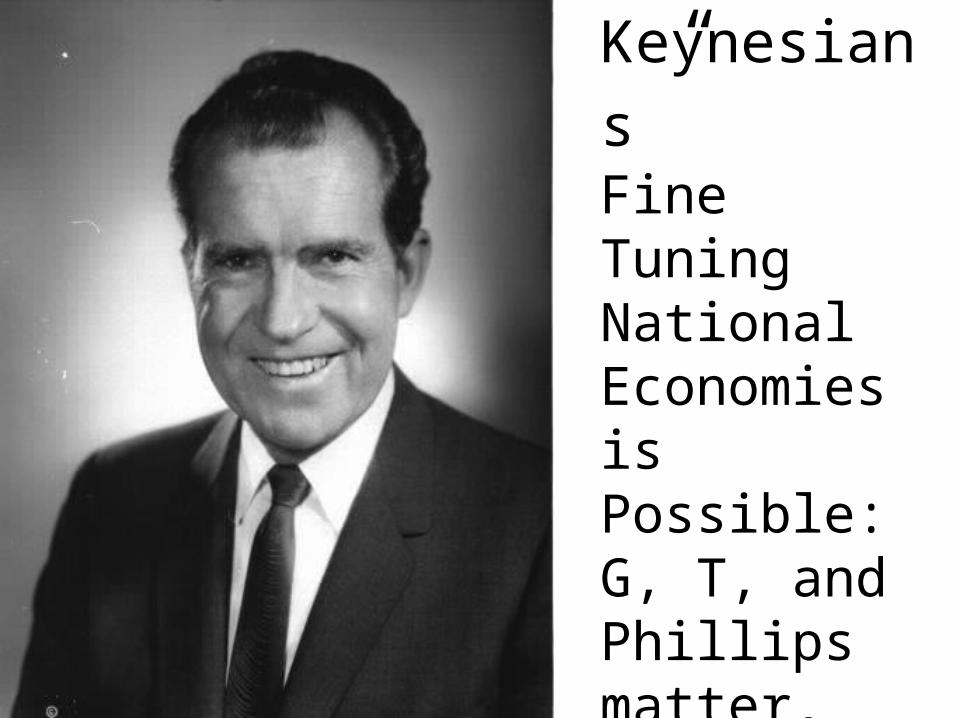
“We’re all
Keynesians”Fine Tuning National Economies is Possible: G, T, and Phillips matter, deficits don’t!

Stabilization Policy DilemmaStabilization Policy DilemmaPolicies to manage aggregate demand canbe used to choose a point on the PhillipsCurve, but such policies do not improvethe “unemployment rate-inflation rate”tradeoff embodied in the curve .
Policies to manage aggregate demand canbe used to choose a point on the PhillipsCurve, but such policies do not improvethe “unemployment rate-inflation rate”tradeoff embodied in the curve .
Stagflation: A Shifting Phillips Curve?
Stagflation: A Shifting Phillips Curve?
Can a Noble Prize be taken way?

AdverseAdverse
AggregateAggregate
SupplySupply
ShocksShocks
Copyright McGraw-Hill, Inc. 1999
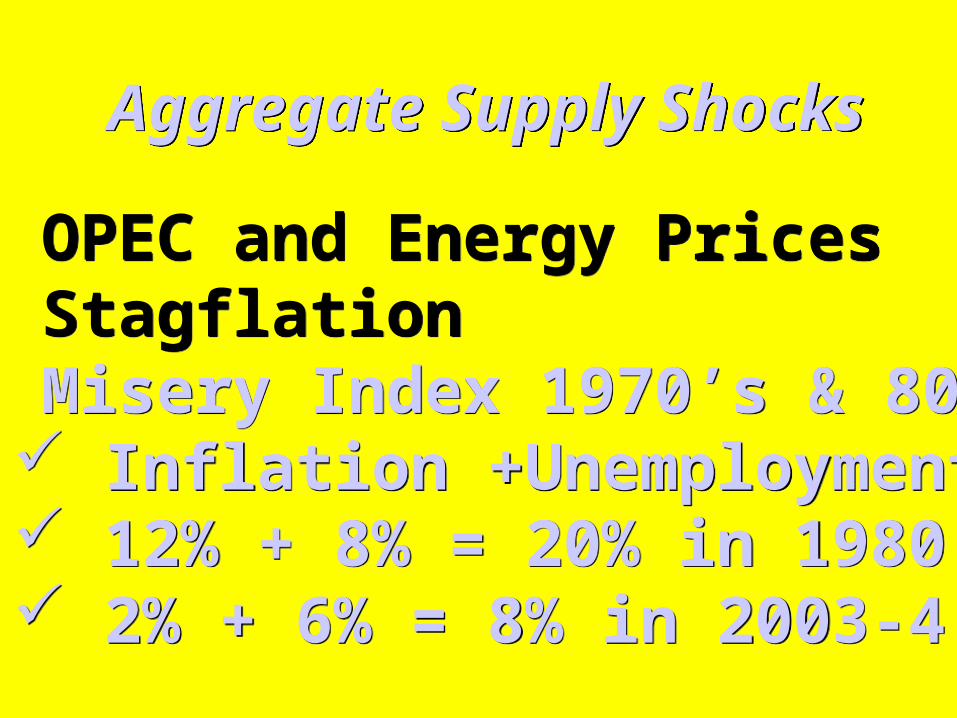
• OPEC and Energy Prices• Stagflation • Misery Index 1970’s & 80’s
Inflation +Unemployment 12% + 8% = 20% in 1980 2% + 6% = 8% in 2003-4
• OPEC and Energy Prices• Stagflation • Misery Index 1970’s & 80’s
Inflation +Unemployment 12% + 8% = 20% in 1980 2% + 6% = 8% in 2003-4
Aggregate Supply ShocksAggregate Supply Shocks
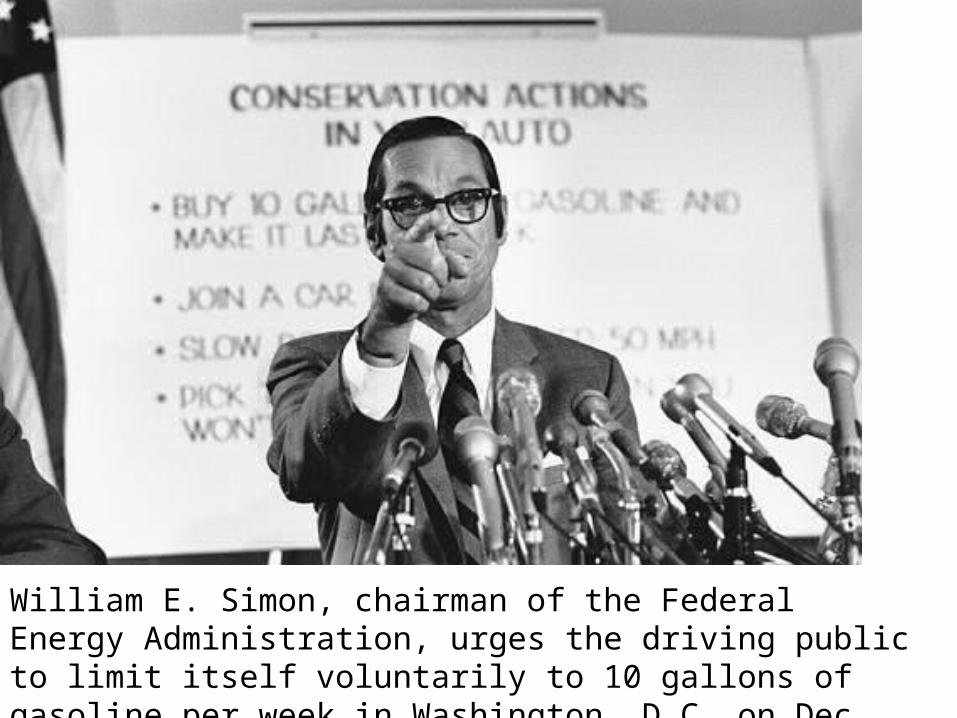
William E. Simon, chairman of the Federal Energy Administration, urges the driving public to limit itself voluntarily to 10 gallons of gasoline per week in Washington, D.C. on Dec. 20, 1973.
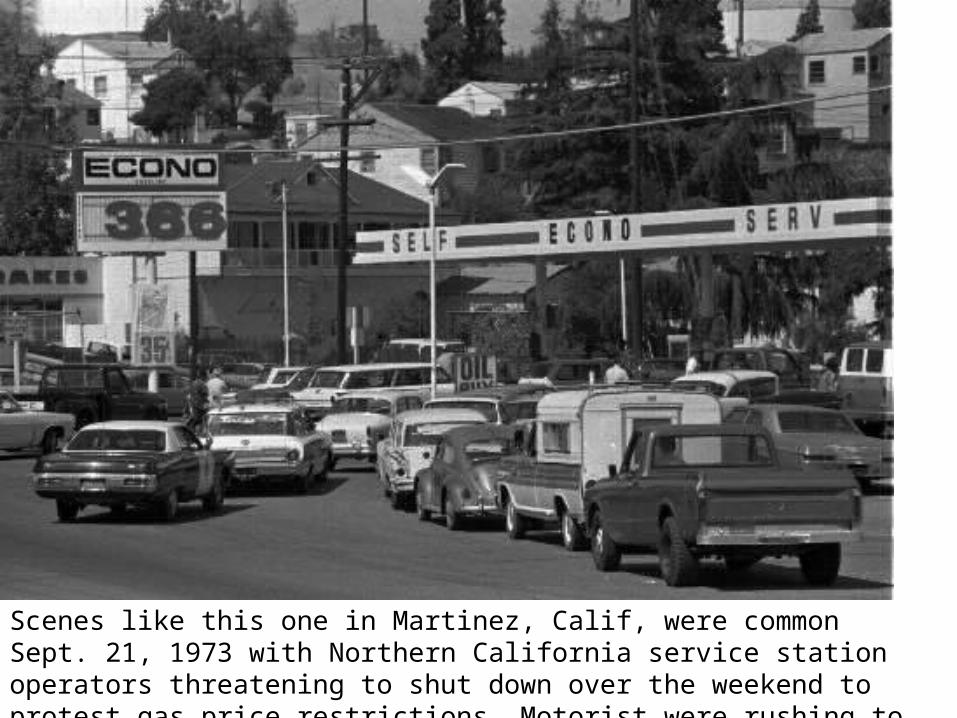
Scenes like this one in Martinez, Calif, were common Sept. 21, 1973 with Northern California service station operators threatening to shut down over the weekend to protest gas price restrictions. Motorist were rushing to fill their gas tanks.
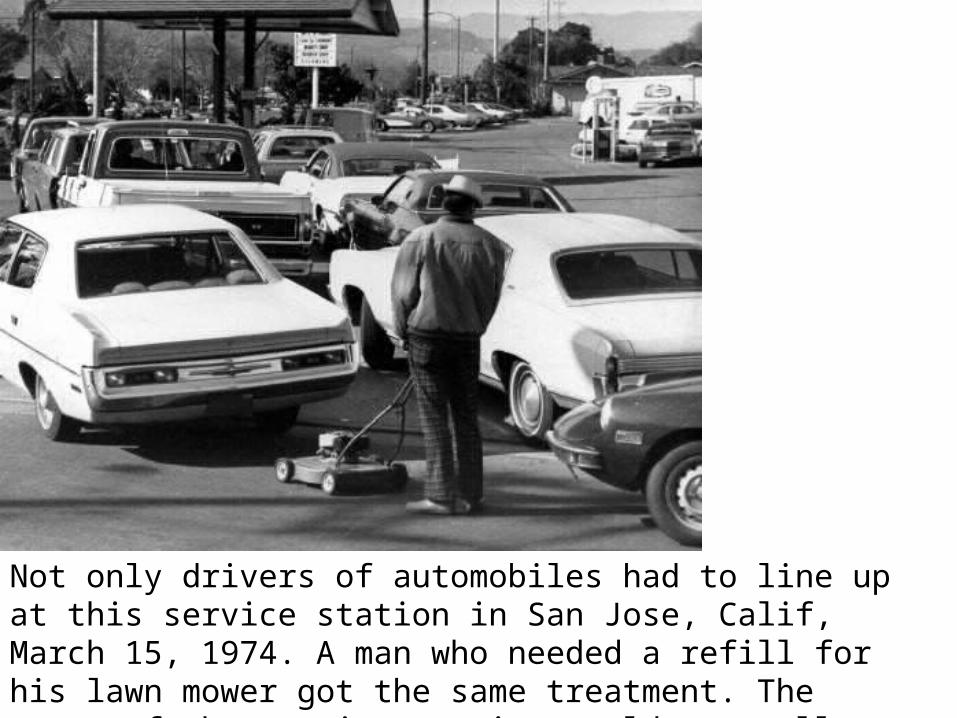
Not only drivers of automobiles had to line up at this service station in San Jose, Calif, March 15, 1974. A man who needed a refill for his lawn mower got the same treatment. The owner of the service station would not sell gas to people showing up with containers.
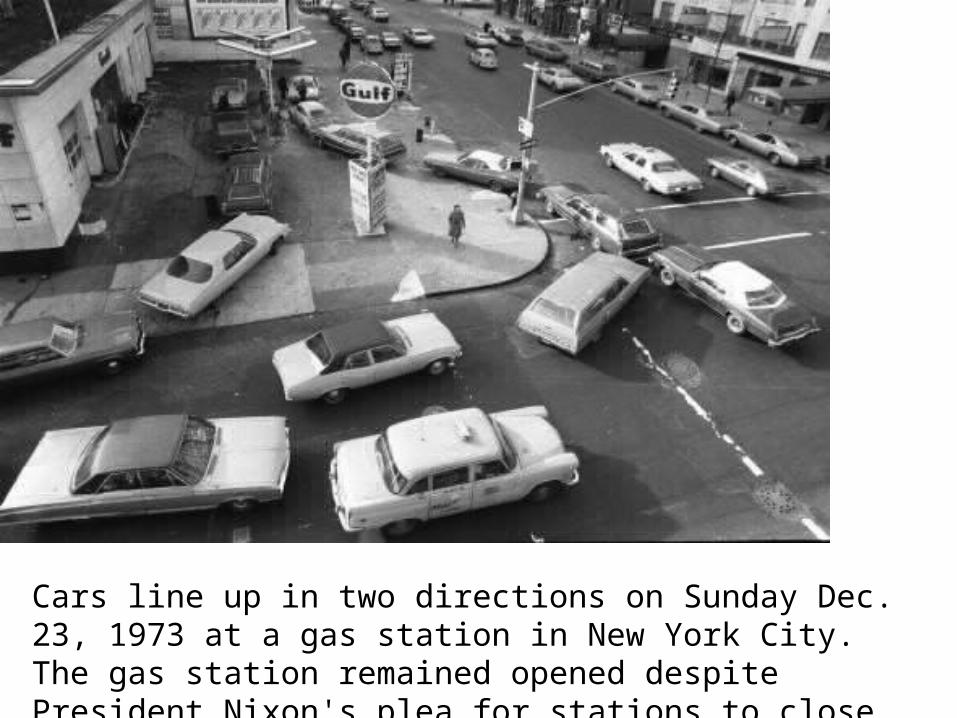
Cars line up in two directions on Sunday Dec. 23, 1973 at a gas station in New York City. The gas station remained opened despite President Nixon's plea for stations to close on Sundays.

This is an aerial View of the Safeway gas station, on Northern Blvd. and 36th street, in the Queens section of New York City on Feb. 8, 1974 during the energy crisis.
The pumps are here!
The line waiting forGas!

U.S. President Jimmy Carter signs his energy proposals in the Oval Office of the White House in Washington, D.C., Wednesday, Jan. 26, 1977. At left is his energy adviser James Schlesinger. The proposals are expected to help areas hit by the gas shortage.

o
P1
Q2
AD
AS1
AS2
Q1
P2
Aggregate Supply ShocksAggregate Supply Shocks
Pri
ce L
evel
Real domestic output
Negative growth with rising prices!

Natural Rate HypothesisNatural Rate Hypothesisdoubts the existence of an inverserelationship between inflation and unemployment....
doubts the existence of an inverserelationship between inflation and unemployment....
Two VariantsTwo VariantsAdaptive Expectations TheoryRational Expectations TheoryAdaptive Expectations TheoryRational Expectations Theory
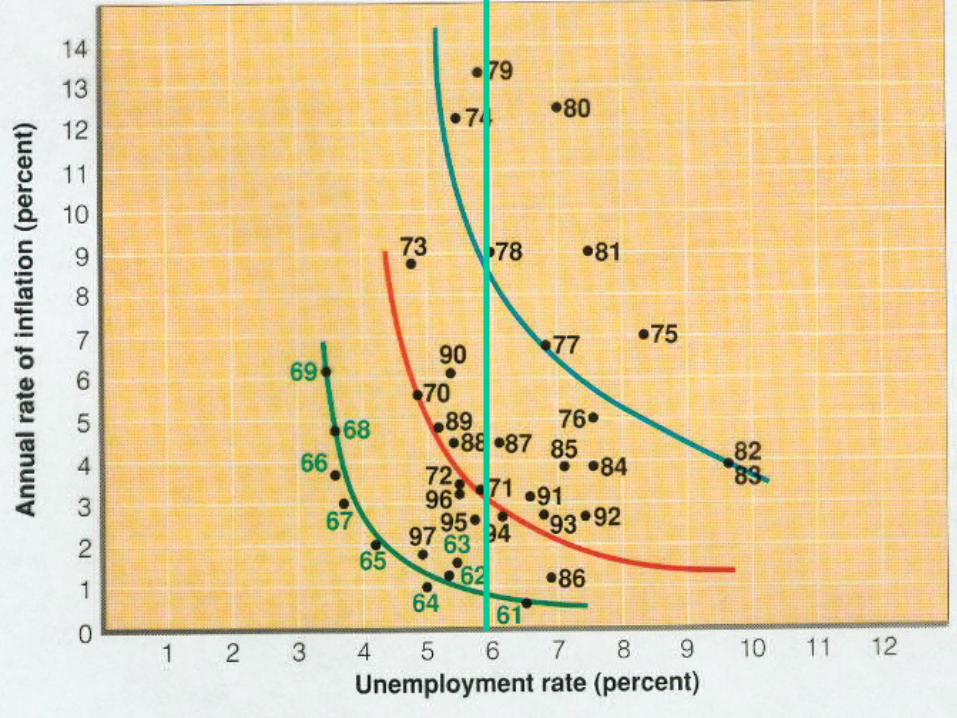
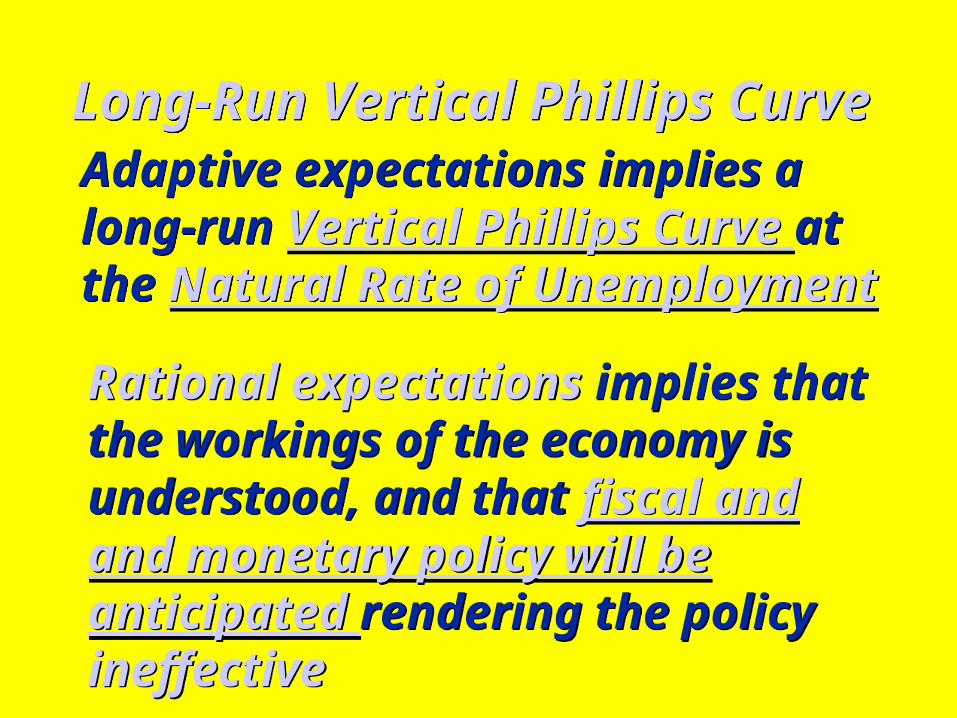
Long-Run Vertical Phillips Curve Long-Run Vertical Phillips Curve Adaptive expectations implies a long-run Vertical Phillips Curve atthe Natural Rate of Unemployment
Adaptive expectations implies a long-run Vertical Phillips Curve atthe Natural Rate of Unemployment
Rational expectations implies thatthe workings of the economy is understood, and that fiscal andand monetary policy will beanticipated rendering the policyineffective
Rational expectations implies thatthe workings of the economy is understood, and that fiscal andand monetary policy will beanticipated rendering the policyineffective

An
nu
al r
ate
of in
flat
ion
(per
cen
t)
Unemployment rate(percent)
7
6
5
4
3
2
1
01 2 3 4 5 6 7
The Phillips Curve ConceptThe Phillips Curve Concept
Phillips1958
Short RunPhillipsCurves
Long RunPhillipsCurve

Stagflation
• The 1970’s saw a tripling of oil prices
• The 1970’s saw draught and a series of massive crop failures
• Aggregate supply shifted to the left
• Neither Keynesian nor Fed policy presents a good solution!
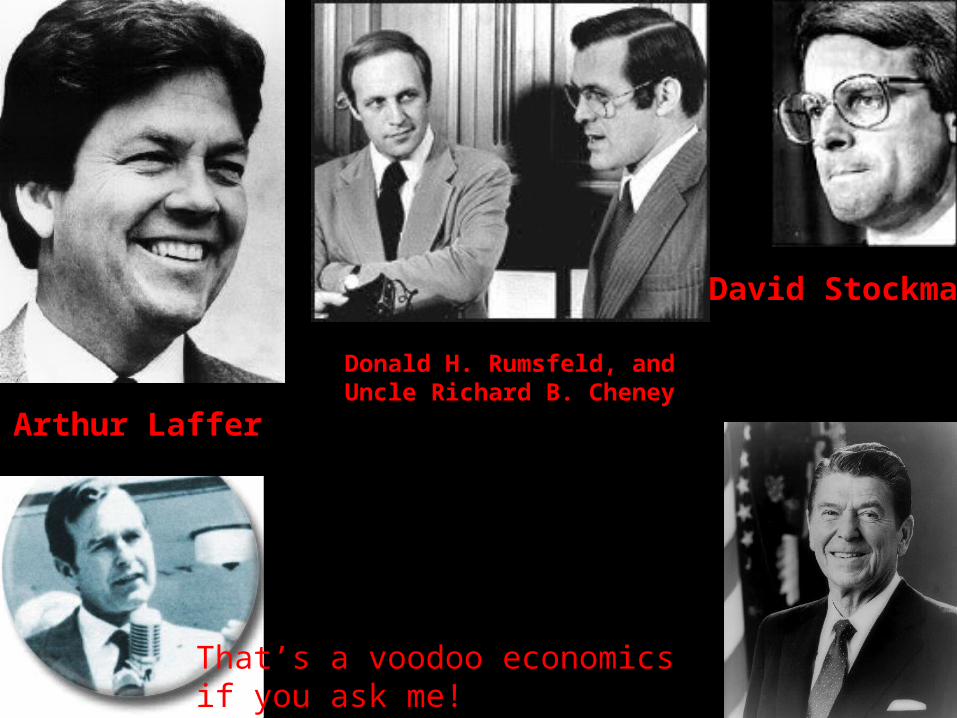
Donald H. Rumsfeld, and Uncle Richard B. Cheney
Arthur Laffer
David Stockman
That’s a voodoo economics if you ask me!

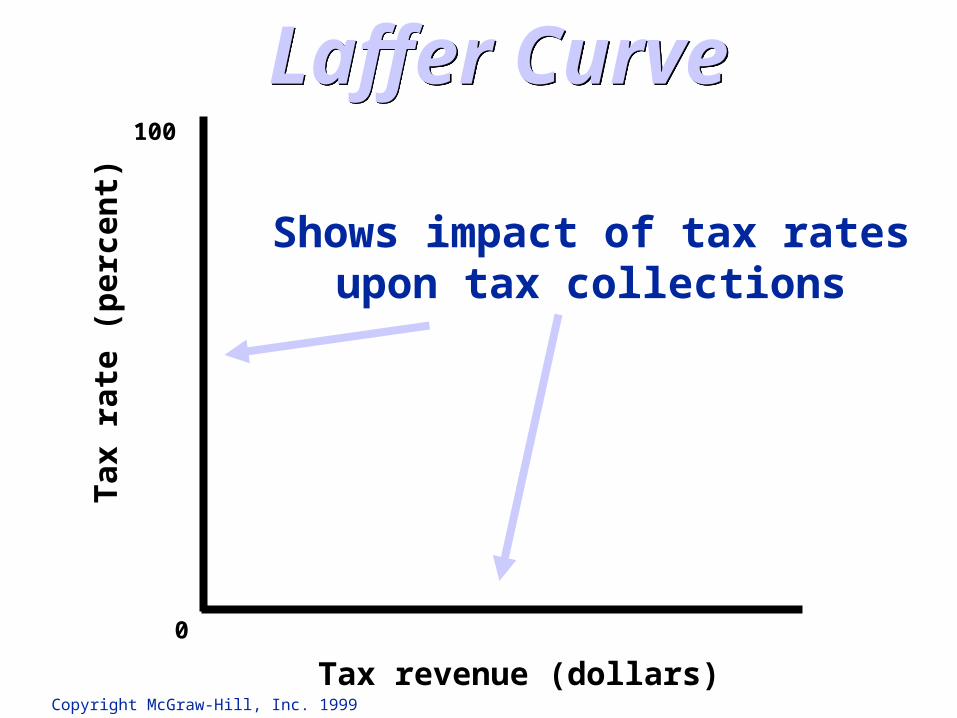
Arthur Laffer
• Laffer’s curve became the basis for Reaganomics and the Tax Cutting policies of the Republican Party!
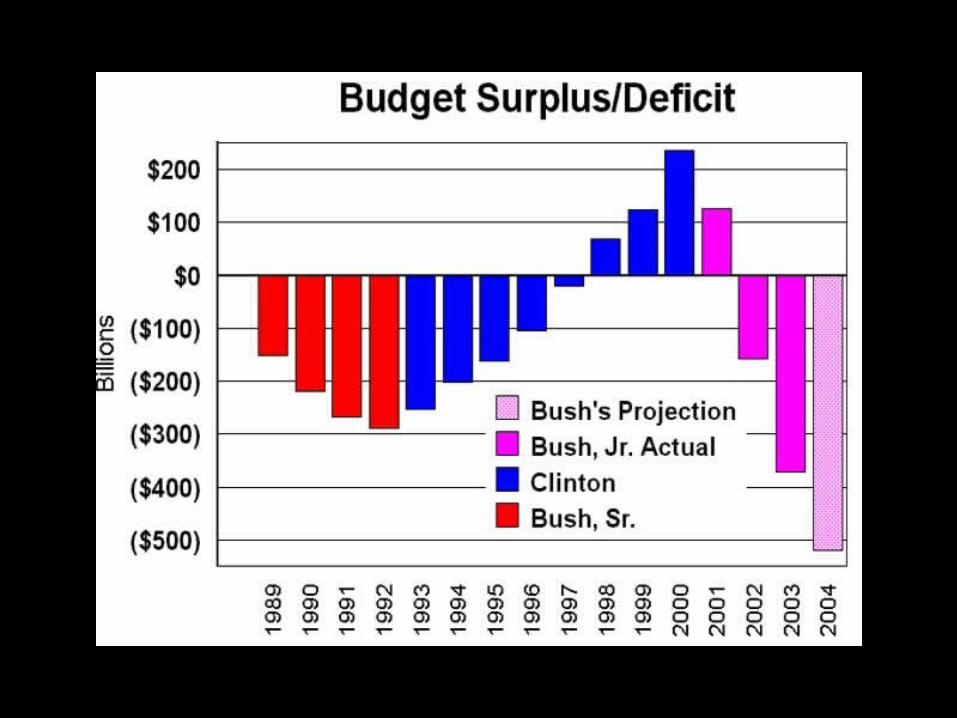
• Reagan’s tax cuts sent deficits soaring in the 1980’s
Tax cuts stimulate growth shifting AS outward ending Stagflation!
0
100
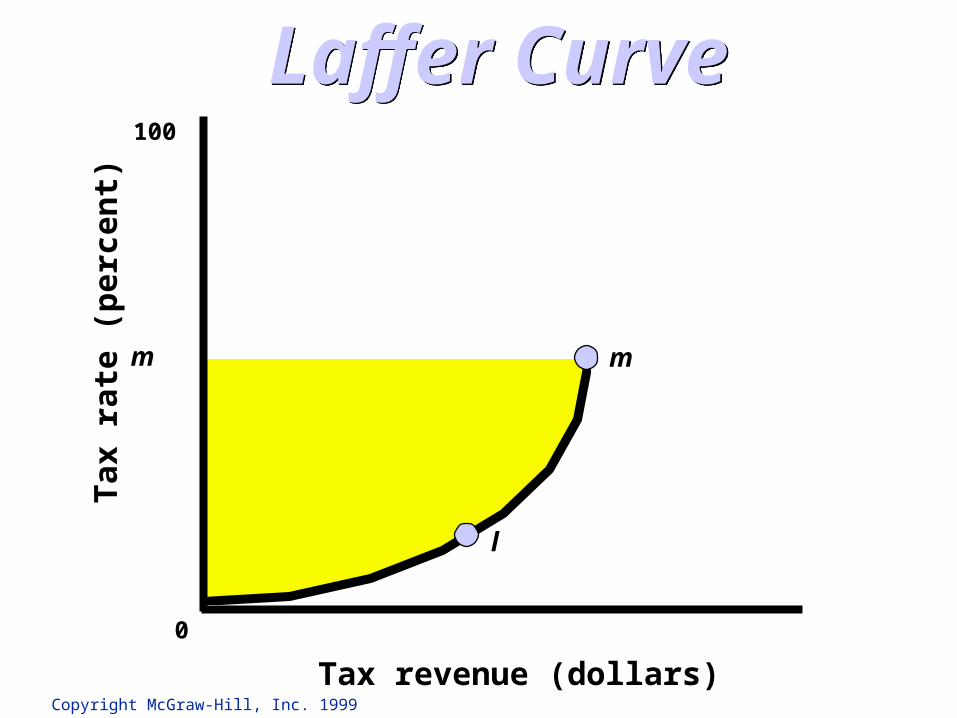
Shows impact of tax ratesupon tax collections
Laffer CurveLaffer Curve
Tax revenue (dollars)
Tax
rat
e (p
erce
nt)
Copyright McGraw-Hill, Inc. 1999

0
100
l
Laffer CurveLaffer Curve
Tax revenue (dollars)
Tax
rat
e (p
erce
nt)
Copyright McGraw-Hill, Inc. 1999
0
100
m m
l
Laffer CurveLaffer Curve
Tax revenue (dollars)
Tax
rat
e (p
erce
nt)
Copyright McGraw-Hill, Inc. 1999

0
100
m m
n
l
Laffer CurveLaffer Curve
Tax revenue (dollars)
Tax
rat
e (p
erce
nt)
Copyright McGraw-Hill, Inc. 1999

0
100
m m
n
l
Laffer CurveLaffer Curve
Tax revenue (dollars)
Tax
rat
e (p
erce
nt)
Copyright McGraw-Hill, Inc. 1999

Supply-Side EconomicsSupply-Side Economics
•Tax Cuts: To stimulate Business Investment To induce incentives to work•Deregulation of Business•Incentives to save and invest
• Laffer Curve as a ProofLess tax evasion
•Tax Cuts: To stimulate Business Investment To induce incentives to work•Deregulation of Business•Incentives to save and invest
• Laffer Curve as a ProofLess tax evasion
It’s All About Increased Output!
P
Q
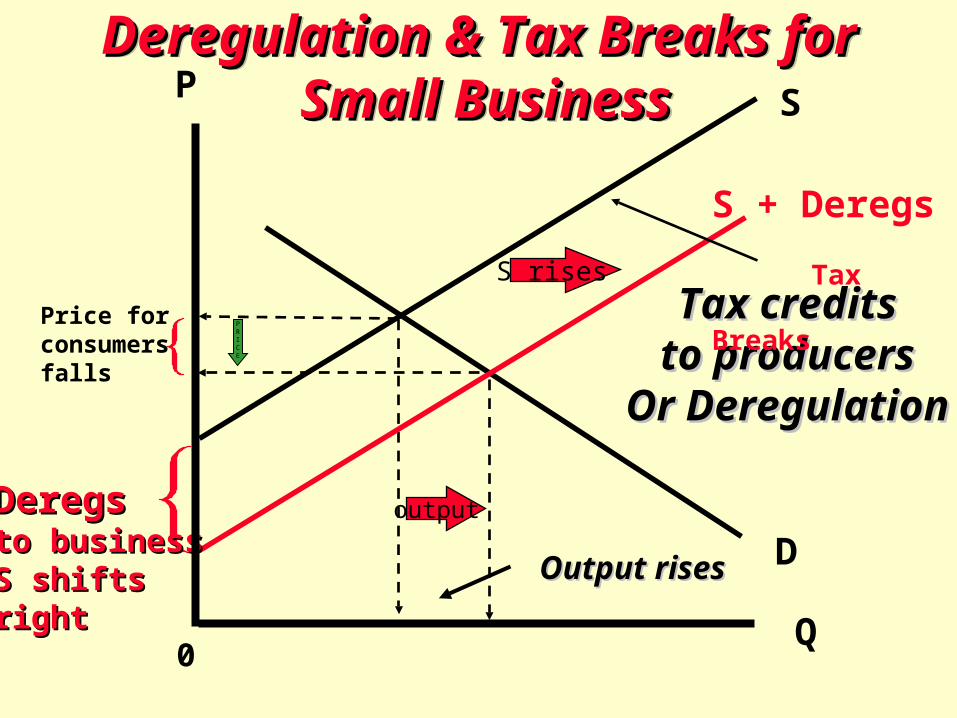
Deregulation & Tax Breaks forDeregulation & Tax Breaks for Small BusinessSmall Business
Deregulation & Tax Breaks forDeregulation & Tax Breaks for Small BusinessSmall Business
D
0
Tax creditsTax creditsto producersto producers
Or DeregulationOr Deregulation
S rises
S
S + Deregs
Tax Breaks
DeregsDeregsto businessto businessS shifts S shifts rightright
output
Output risesOutput rises
Price for consumersfalls
PRICE

o
P2
Q1
AD
AS2 = Sum allMicro Supply
AS1
Q2
P1
Supply-Side EconomicsSupply-Side Economics
Pri
ce L
evel
Real domestic output
Micro Growth of Small Business Spurs Aggregate Growth
StagflationCan End AsPrice LevelFalls andRGDP, Output, &EmploymentRise!
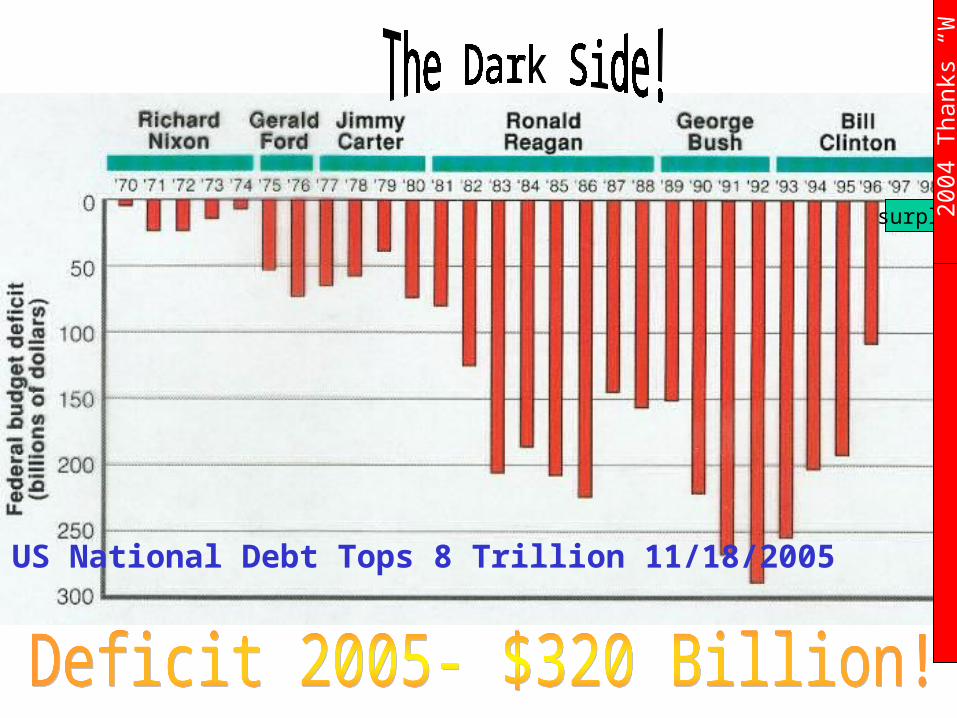
surplus
2 00 4
Th a
n ks
“ W”!
US National Debt Tops 8 Trillion 11/18/2005

No LoansFor College!
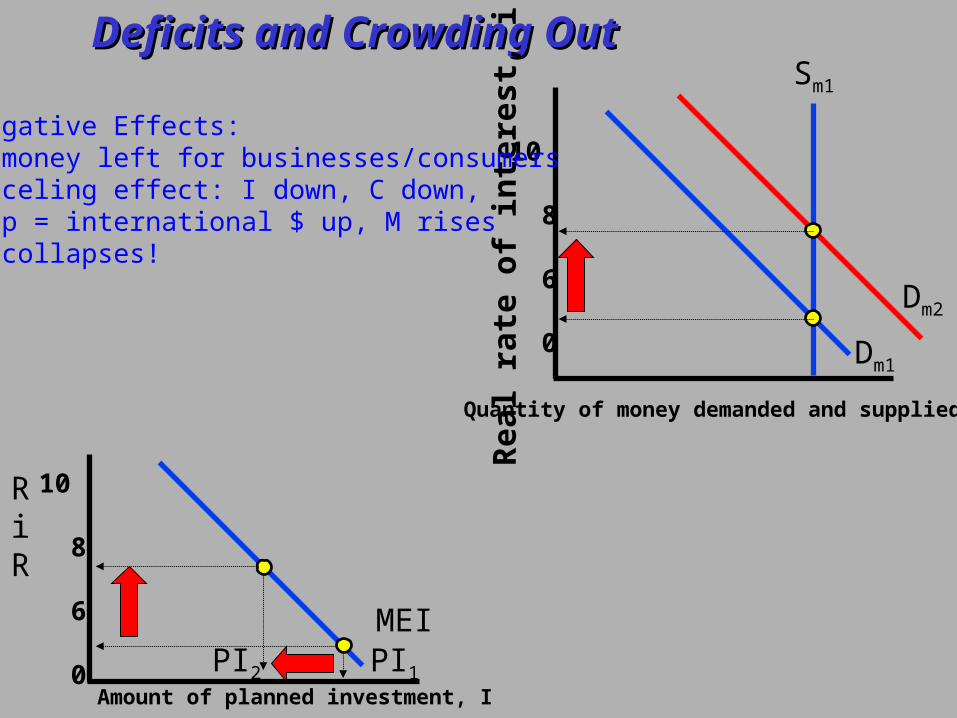
Deficits and Crowding OutDeficits and Crowding Out
Rea
l rat
e of
inte
rest
, i
10
8
6
0
Sm1
Quantity of money demanded and supplied
Dm1
Dm2
Amount of planned investment, I
RiR
10
8
6
0
MEIPI1PI2
The Negative Effects:1. No money left for businesses/consumers2. Canceling effect: I down, C down,3. i up = international $ up, M rises4. AD collapses!
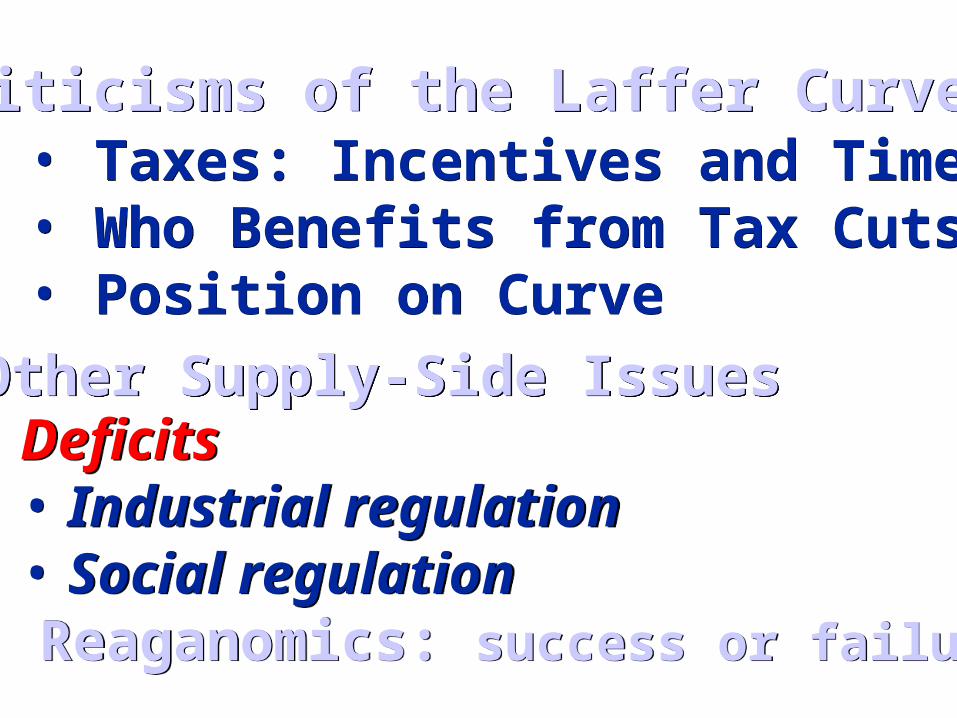
Criticisms of the Laffer CurveCriticisms of the Laffer Curve• Taxes: Incentives and Time• Who Benefits from Tax Cuts• Position on Curve
• Taxes: Incentives and Time• Who Benefits from Tax Cuts• Position on Curve
Other Supply-Side IssuesOther Supply-Side Issues• Deficits
• Industrial regulation• Social regulation
• Reaganomics: success or failure
• Deficits• Industrial regulation• Social regulation
• Reaganomics: success or failure
GROWTH ofAggregate Supply?
GROWTH ofAggregate Supply?
Are we presently growingas a National Economy?

Two Economic Growth Definitions:Two Economic Growth Definitions:
• An increase in real GDP occurringover a period of time
• An increase in real GDP per capitaoccurring over a period of time
• An increase in real GDP occurringover a period of time
• An increase in real GDP per capitaoccurring over a period of time
Growth EconomicsGrowth Economics
Supplyside’s Goal:Shift AS, LRAS, PPC right!
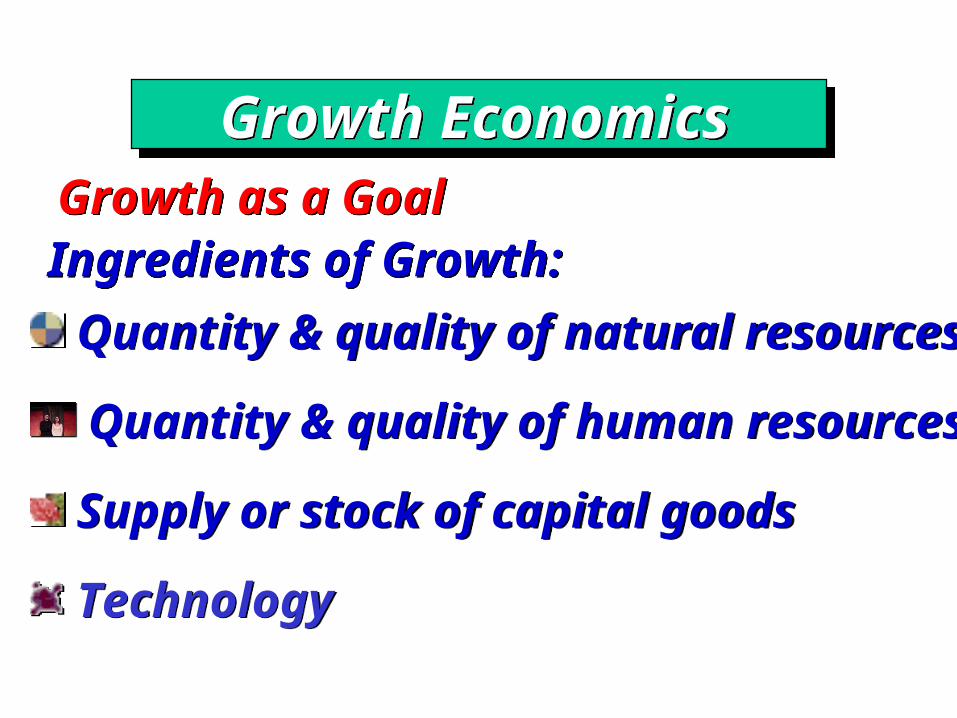
Growth as a GoalGrowth as a GoalIngredients of Growth:Ingredients of Growth:
Quantity & quality of natural resources
Quantity & quality of human resources
Supply or stock of capital goods
Technology
Quantity & quality of natural resources
Quantity & quality of human resources
Supply or stock of capital goods
Technology
Growth EconomicsGrowth Economics

PRODUCTION POSSIBILITIESPRODUCTION POSSIBILITIES
Economic Growth
Q
Q
A
B
C
D
a
b
Cap
ital
Go
od
sC
apit
al G
oo
ds
Consumer GoodsConsumer Goods

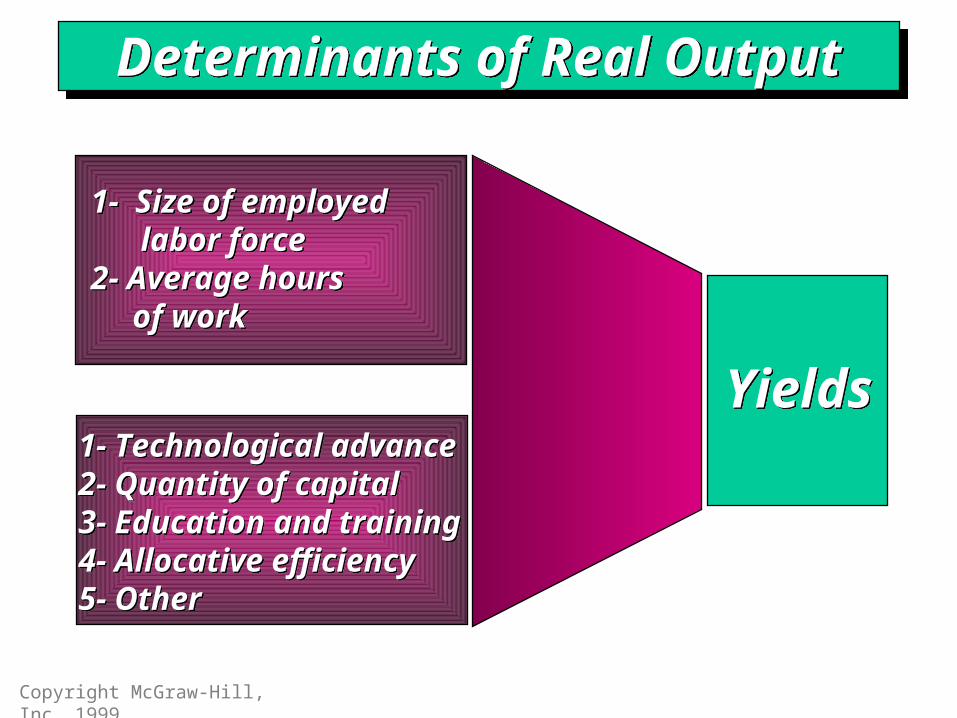
1- Size of employed labor force2- Average hours of work
1- Size of employed labor force2- Average hours of work
1- Technological advance2- Quantity of capital3- Education and training4- Allocative efficiency5- Other
1- Technological advance2- Quantity of capital3- Education and training4- Allocative efficiency5- Other
Determinants of Real OutputDeterminants of Real Output
1- Size of employed labor force2- Average hours of work
1- Size of employed labor force2- Average hours of work
1- Technological advance2- Quantity of capital3- Education and training4- Allocative efficiency5- Other
1- Technological advance2- Quantity of capital3- Education and training4- Allocative efficiency5- Other
YieldsYields
Determinants of Real OutputDeterminants of Real Output
Copyright McGraw-Hill, Inc. 1999

1- Size of employed labor force2- Average hours of work
1- Size of employed labor force2- Average hours of work
1- Technological advance2- Quantity of capital3- Education and training4- Allocative efficiency5- Other
1- Technological advance2- Quantity of capital3- Education and training4- Allocative efficiency5- Other
REALDOMESTIC
OUTPUT
REALDOMESTIC
OUTPUT
Determinants of Real OutputDeterminants of Real Output
Copyright McGraw-Hill, Inc. 1999

AD - AS FrameworkAD - AS FrameworkP
rice
Lev
el
RGDP – OUTPUT - EMPLOYMENT
o
P1
AS’2
LRAS1
$5 Trillion
LRAS2
$12 Trillion
AD1
AS’1
AD2
P2

PRODUCTION POSSIBILITIESPRODUCTION POSSIBILITIES
Economic Growth
Q
Q
A
B
C
D
a
b
Cap
ital
Go
od
sC
apit
al G
oo
ds
Consumer GoodsConsumer Goods

Real GDP has increasedsixfold since 1940
Real GDP has increasedsixfold since 1940
Improved Products and ServicesAdded LeisureEnvironmental Effects
Improved Products and ServicesAdded LeisureEnvironmental Effects
United StatesGrowth
United StatesGrowth
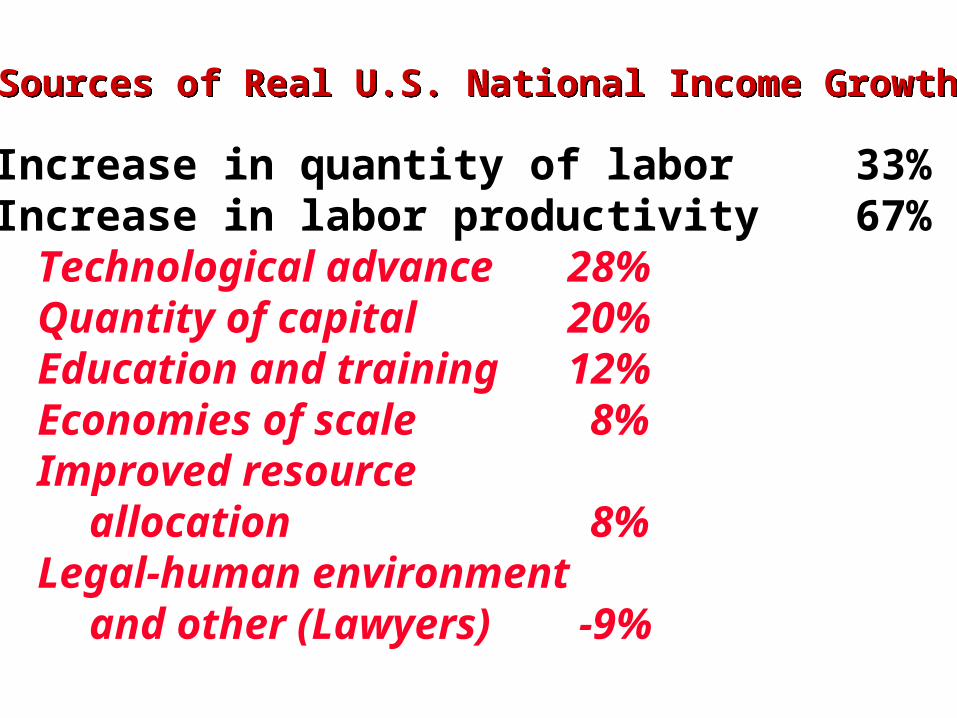
Sources of Real U.S. National Income GrowthSources of Real U.S. National Income Growth
Increase in quantity of labor 33%Increase in labor productivity 67% Technological advance 28% Quantity of capital 20% Education and training 12% Economies of scale 8% Improved resource
allocation 8% Legal-human environment
and other (Lawyers) -9%

Causes Slowed ProductivityCauses Slowed Productivity1- Labor Quality
Decline in experienceLess able workersSlowing of rise in educational attainment
2- Technological Progress3- Investment – 1990’s Bubble
Low saving rateImport competitionRegulationReduced infrastructure spending
1- Labor QualityDecline in experienceLess able workersSlowing of rise in educational attainment
2- Technological Progress3- Investment – 1990’s Bubble
Low saving rateImport competitionRegulationReduced infrastructure spending