Great Barrier Reef Water Quality: Current...
97
Great Barrier Reef Water Quality: Current Issues SEPTEMBER 2001
Transcript of Great Barrier Reef Water Quality: Current...

Great Barrier Reef Water Quality: Current IssuesSEPTEMBER 2001

Great Barrier Reef Water Quality: Current Issues
Edited by David Haynes
September 2001
GBR Water Quality 1

© Great Barrier Reef Marine Park Authority 2001 ISSN ISBN 1 876945 01 X. Published September 2001 by the Great Barrier Reef Marine Park Authority. This work is copyright. Apart from any use as permitted under the Copyright Act 1968, no part may be reproduced by any process without prior written permission from the Great Barrier Reef Marine Park Authority. Requests and inquiries concerning reproduction and rights should be addressed to the Director, Information Support Group, Great Barrier Reef Marine Park Authority, PO Box 1379, Townsville Qld 4810. The opinions expressed in this document are not necessarily those of the Great Barrier Reef Marine Park Authority. Accuracy in calculations, figures, tables, names, quotations, references etc. is the complete responsibility of the authors. National Library of Australia Cataloguing-in-Publication data: Great Barrier Reef water quality: current issues. Bibliography. ISBN 1 876945 01 X.
Water quality – Queensland – Great Barrier Reef. 2. Water quality – environmental aspects – Queensland – Great Barrier Reef. 3. Ecosystem management – Queensland - Great Barrier Reef. I. Haynes, David, 1958-. II. Great Barrier Reef Marine Park Authority (Australia). III. Title.
333.91641609943
Photographic credits
Front Cover: David Wachenfeld Figure 4: Peter O’Reagain Figure 29: Kirsten Michalek-Wagner Contributing authors
David Haynes, Deb Bass, Jon Brodie, Caroline Christie, Michelle Devlin, Kirsten Michalek-Wagner, Sheriden Morris, Michelle Ramsay, Jamie Storrie, Jane Waterhouse and Hugh Yorkston.
PO Box 1379 Townsville, Qld, 4810 Telephone 07 47 500700

Table of Contents
1 EXECUTIVE SUMMARY...............................................................................................................1
2 THE GREAT BARRIER REEF WORLD HERITAGE AREA ...................................................3
2.1 INTRODUCTION ..........................................................................................................................3 2.2 THE GREAT BARRIER REEF WORLD HERITAGE AREA...............................................................3 2.3 THE GREAT BARRIER REEF LAGOON .........................................................................................5 2.4 SOURCES OF POLLUTANTS TO THE GREAT BARRIER REEF.........................................................5
3 THE GREAT BARRIER REEF CATCHMENT...........................................................................6
3.1 CATCHMENT LAND USE ............................................................................................................6 3.2 CATCHMENT SOURCES OF POLLUTION......................................................................................7
3.2.1 Rangeland Grazing.................................................................................................................7 3.2.2 Sugarcane Cultivation............................................................................................................9 3.2.3 Other Crops ..........................................................................................................................10 3.2.4 Coastal Aquaculture.............................................................................................................12
3.3 WETLAND CLEARING AND ACID SULPHATE SOILS ................................................................12 3.4 COASTAL DEVELOPMENT.........................................................................................................16
3.4.1 Settlement.............................................................................................................................16 3.4.2 Stormwater and Sewage Discharges ....................................................................................17 3.4.3 Coastal Heavy Industry........................................................................................................18
3.5 MINING.....................................................................................................................................18 3.6 DAM CONSTRUCTION ..............................................................................................................21
4 PRINCIPAL WATER QUALITY INFLUENCES ON GREAT BARRIER REEF ECOSYSTEMS ........................................................................................................................................22
4.1 NUTRIENTS ...............................................................................................................................22 4.2 SEDIMENTS AND TURBIDITY.....................................................................................................23 4.3 SALINITY ...................................................................................................................................24 4.4 OTHER POLLUTANTS................................................................................................................24
4.4.1 Organochlorine Pesticides ....................................................................................................24 4.4.2 Dioxins .................................................................................................................................25 4.4.3 Modern pesticides, insecticides and herbicides.....................................................................25 4.4.4 Heavy Metals........................................................................................................................25
4.5 GLOBAL ATMOSPHERIC CHANGES ..........................................................................................26 5 GREAT BARRIER REEF CATCHMENT WATER QUALITY STATUS .............................29
5.1 RIVERS.......................................................................................................................................29 5.1.1 Water Flows..........................................................................................................................29 5.1.2 Nutrients ..............................................................................................................................30 5.1.3 Sediment Discharges ............................................................................................................30
5.2 ACID SULPHATE SOILS .............................................................................................................31 6 GREAT BARRIER REEF WATER QUALITY STATUS .........................................................32
6.1 AMBIENT GREAT BARRIER REEF WATER QUALITY .................................................................32 6.2 WATER COLUMN NUTRIENTS AND CHLOROPHYLL................................................................33 6.3 TRANSPORT OF POLLUTANTS FROM CATCHMENTS TO THE SEA: FLOOD PLUMES.................33
6.3.1 Flood Plume Composition ....................................................................................................33 6.3.2 Flood Plume Spatial Variability ...........................................................................................33
i

6.4 SEAWATER TEMPERATURE AND CORAL BLEACHING ...............................................................41 6.5 HEAVY METALS........................................................................................................................41 6.6 HERBICIDES...............................................................................................................................42 6.7 INSECTIDES ...............................................................................................................................43 6.8 POLLUTANTS IN MARINE MAMMALS ......................................................................................44 6.9 DIOXINS ....................................................................................................................................44
7 SHIPPING MOVEMENT AND ASSOCIATED POLLUTION ISSUES .............................48
7.1 SHIPPING MOVEMENT..............................................................................................................48 7.2 SHIPPING INCIDENTS AND POLLUTION ...................................................................................50
7.2.1 Ship Contaminants...............................................................................................................50 7.2.2 Oil Spills...............................................................................................................................54 7.2.3 Litter.....................................................................................................................................56
7.3 BALLAST WATER ......................................................................................................................57 7.4 RISK ASSESSMENT OF OIL AND CARGO SPILLS........................................................................58
8 CURRENT INSTITUTIONAL AND POLICY ARRANGEMENTS FOR WATER QUALITY MANAGEMENT........................................................................................................61
8.1 GOVERNANCE AND LEGISLATION ...........................................................................................61 8.1.1 Commonwealth Regime........................................................................................................61 8.1.2 Queensland Regime..............................................................................................................61
8.2 PLANNING INSTRUMENTS........................................................................................................63 8.2.1 State and Regional Planning Instruments...........................................................................63 8.2.2 Local Government Planning Instruments............................................................................63
8.3 NON-STATUTORY INSTRUMENTS.............................................................................................64 8.3.1 Industry Codes of Practice....................................................................................................64 8.3.2 Farm Management Plans .....................................................................................................64
8.4 INTEGRATED CATCHMENT MANAGEMENT.............................................................................64 8.5 EDUCATION AND COMMUNICATION.......................................................................................65
9 CONCLUSIONS ............................................................................................................................66
10 REFERENCES.................................................................................................................................71
ii

List of figures FIGURE 1. THE GREAT BARRIER REEF WORLD HERITAGE AREA AND ITS ASSOCIATED CATCHMENTS,
QUEENSLAND, AUSTRALIA..........................................................................................................4 FIGURE 2. INCREASE IN QUEENSLAND LAND AREA USED FOR SUGAR CULTIVATION FROM 1930 TO 1996
(GILBERT 2001). ...........................................................................................................................8 FIGURE 3. INCREASES IN THE USE OF NITROGEN AND PHOSPHORUS FERTILISER ON THE GREAT BARRIER
REEF CATCHMENT (PULSFORD 1996). .........................................................................................8 FIGURE 4. CATTLE GRAZING, BURDEKIN CATCHMENT. ............................................................................11 FIGURE 5. SUGARCANE CROPPING, GREAT BARRIER REEF CATCHMENT...................................................11 FIGURE 6. AQUACULTURE PRODUCTION PONDS, GREAT BARRIER REEF CATCHMENT.............................13 FIGURE 7. WETLAND CLEARING FOR AGRICULTURAL EXPANSION, GREAT BARRIER REEF CATCHMENT. 14 FIGURE 8. CHANGES IN VEGETATION COVER OF MELALEUCA WETLANDS AND RAINFOREST IN THE
HERBERT RIVER CATCHMENT, NORTH QUEENSLAND, SINCE EUROPEAN SETTLEMENT (JOHNSON ET AL. 2000). ............................................................................................................14
FIGURE 9. PROJECTED AVERAGE PERCENTAGE ANNUAL POPULATION GROWTH 1996 TO 2016 (DCILGP 1998)..........................................................................................................................................16
FIGURE 10. SUN METALS ZINC REFINERY, TOWNSVILLE..............................................................................19 FIGURE 11. GLADSTONE POWER STATION, GLADSTONE. ............................................................................19 FIGURE 12. CONCEPTUAL MODEL OF POLLUTANT MOVEMENT AND PARTITIONING IN THE MARINE
ENVIRONMENT. .........................................................................................................................28 FIGURE 13. RELATIONSHIP BETWEEN DIN (DISSOLVED INORGANIC NITROGEN (NITRATE + AMMONIA))
FLOOD FLOW CONCENTRATIONS AND PERCENTAGE AREA OF DEVELOPED CATCHMENT WITHIN THE GREAT BARRIER REEF CATCHMENT (WACHENFELD ET AL. 1998). .......................31
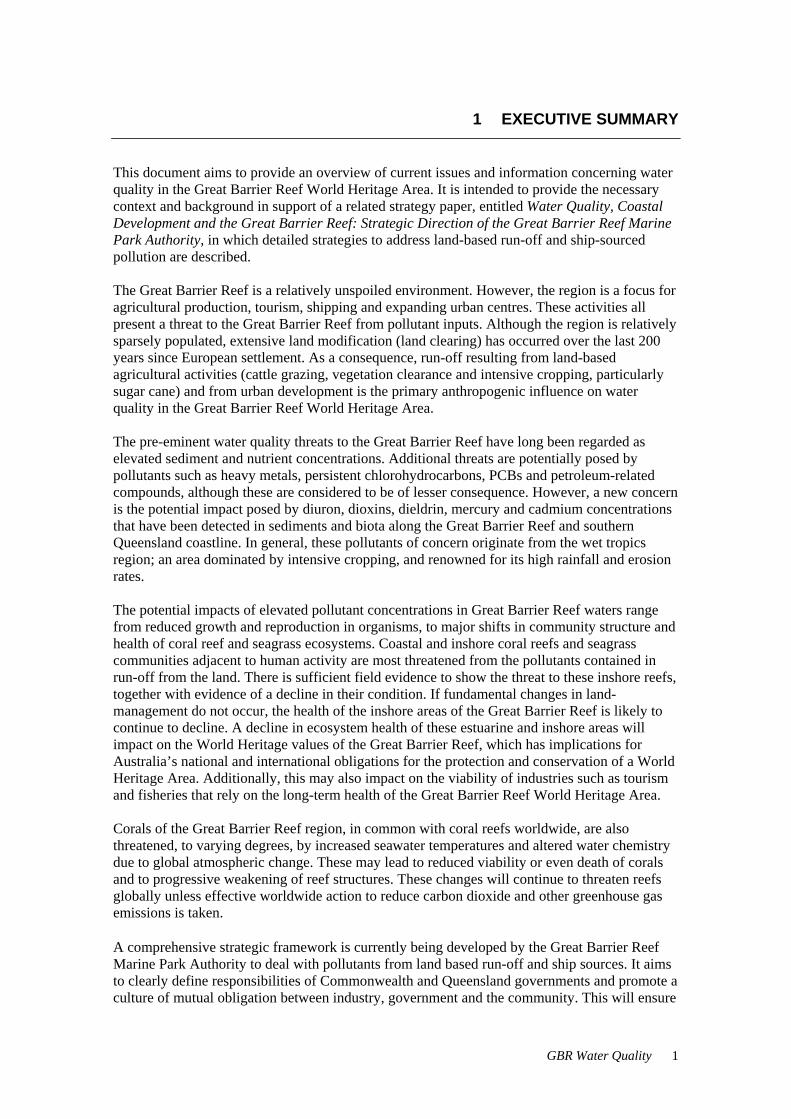
FIGURE 14. FLOOD PLUME, GREAT BARRIER REEF CATCHMENT..................................................................34 FIGURE 15. FREQUENCY OF FLOOD PLUMES OVER THE WET TROPICS AREA, 1990-2000. ...........................36 FIGURE 16. INSHORE REEFS AT RISK IN THE: HINCHINBROOK ISLAND (A) AND TOWNSVILLE (B) REGIONS.37 FIGURE 17. INSHORE REEFS AT RISK IN THE: WHITSUNDAY (A) AND GLADSTONE (B) REGIONS. ...............38 FIGURE 18. SAMPLING FOR CHLOROPHYLL A, CENTRAL GREAT BARRIER REEF. .........................................39 FIGURE 19. MEAN (SE) CHLOROPHYLL A CONCENTRATIONS, GREAT BARRIER REEF, 1991-2000 (DEVLIN
ET AL. 2001B).............................................................................................................................39 FIGURE 20. MEAN CHLOROPHYLL CONCENTRATIONS OVER TIME FOR THE NORTHERN (1) AND CENTRAL
(2) GREAT BARRIER REEF, 1993-1999 (DEVLIN ET AL. 2001B)...................................................40 FIGURE 21. DUGONG CARCASS STRANDING LOCATIONS, 1999-2000 (HAYNES 2000)...............................45 FIGURE 22. DUGONG CARCASS TISSUE SAMPLING, TOWNSVILLE, APRIL 1999. ..........................................46 FIGURE 23. MARINE MAMMAL OCDD CONCENTRATIONS (HAYNES ET AL. 1999). .....................................46 FIGURE 24. GREAT BARRIER REEF SHIPPING TRANSIT ROUTES. ...................................................................49 FIGURE 25. MARINE INCIDENTS IN THE WORLD HERITAGE AREA, 1987-1997............................................51 FIGURE 26. CARGO SHIP PEACOCK AGROUND ON PIPER REEF, 1996...........................................................52 FIGURE 27: OIL SPILLS IN THE GREAT BARRIER REEF REGION, 1994-1998. ..................................................55 FIGURE 28. OIL SPILL RISK MAP OF THE GREAT BARRIER REEF. ...................................................................59 FIGURE 29. DEPLOYMENT OF DGT SAMPLERS, OSPREY REEF, SEPTEMBER 2000. .........................................67 FIGURE 30. GREAT BARRIER REEF AREAS AT RISK FROM LAND-BASED POLLUTION....................................69
iii

List of Tables TABLE 1. AREA OF LAND UNDER GRAZING IN THE GREAT BARRIER REEF CATCHMENT (ANON 1993). ....7 TABLE 2. ESTIMATED COASTAL WETLAND HABITAT DECLINE IN SELECTED GREAT BARRIER REEF
CATCHMENTS..................................................................................................................................15 TABLE 3. STATUS OF ISLAND SEWAGE TREATMENT FACILITIES IN THE GREAT BARRIER REEF WORLD
HERITAGE AREA (WATERHOUSE AND JOHNSON 2000)................................................................20 TABLE 4. AMBIENT LEVELS FOR PHYSICO-CHEMICAL PARAMETERS IN WATERS OF THE GREAT BARRIER
REEF (BRODIE AND CHRISTIE UNPUBLISHED DATA). ...................................................................32 TABLE 5. WET TROPICS FLOOD PLUME WATER QUALITY CHARACTERISTICS, 1994-1999. .........................34 TABLE 6. GREAT BARRIER REEF NEARSHORE METAL CONCENTRATION RANGES COMPARED WITH
AUSTRALIAN SEDIMENT METAL GUIDELINES (HAYNES 2000). (ALL CONCENTRATIONS MG KG-1). ...............................................................................................................................................41
TABLE 7. POTENTIAL DIURON WATER COLUMN CONCENTRATIONS (HAYNES ET AL. 2000A). .................42 TABLE 8. COMPARISON OF ER-L AND ER-M CONCENTRATIONS AND GREAT BARRIER REEF SEDIMENT
POLLUTANT CONCENTRATIONS (HAYNES ET AL. 2000A). ...........................................................43 TABLE 9. CONCENTRATIONS OF 2,3,7,8 SUBSTITUTED PCDD AND PCDF CONGENERS IN GBR
SEDIMENT (MÜLLER ET AL. 1999)..................................................................................................47 TABLE 10. SHIPPING ARRIVALS AND PILOTED ARRIVALS BY PORTS IN THE GREAT BARRIER REEF
WORLD HERITAGE AREA 1985/6 TO 1994/5 (ANON 1996). .......................................................48 TABLE 11. SHIPPING INCIDENTS RECORDED FOR THE GREAT BARRIER REEF, 1987-1997............................50 TABLE 12. MEAN (SD) SEDIMENT TBT CONCENTRATIONS IN THE NORTHERN AND CENTRAL GREAT
BARRIER REEF, 1999 (HAYNES AND LOONG 2001). ......................................................................53 TABLE 13. MEAN (SD) SEDIMENT COPPER CONCENTRATIONS IN THE NORTHERN AND CENTRAL GREAT
BARRIER REEF, 1999 (HAYNES AND LOONG 2001). ......................................................................53 TABLE 14. NUMBER OF OIL/FUEL SPILLS REPORTED IN THE GREAT BARRIER REEF (1987-1997)...............55 TABLE 15. NUMBER OF INTERTIDAL DEBRIS ITEMS RECORDED IN THE FAR NORTHERN GREAT BARRIER
REEF, 1996 (HAYNES 1997). ...........................................................................................................56 TABLE 16. ESTIMATES OF BALLAST WATER DISCHARGED TO GREAT BARRIER REEF PORTS (HILLIARD
AND RAAYMAKERS 1997)...............................................................................................................57 TABLE 17. CRITICAL GREAT BARRIER REEF RISK AREAS FROM SHIPPING INCIDENTS..................................58
iv
1 EXECUTIVE SUMMARY
This document aims to provide an overview of current issues and information concerning water quality in the Great Barrier Reef World Heritage Area. It is intended to provide the necessary context and background in support of a related strategy paper, entitled Water Quality, Coastal Development and the Great Barrier Reef: Strategic Direction of the Great Barrier Reef Marine Park Authority, in which detailed strategies to address land-based run-off and ship-sourced pollution are described. The Great Barrier Reef is a relatively unspoiled environment. However, the region is a focus for agricultural production, tourism, shipping and expanding urban centres. These activities all present a threat to the Great Barrier Reef from pollutant inputs. Although the region is relatively sparsely populated, extensive land modification (land clearing) has occurred over the last 200 years since European settlement. As a consequence, run-off resulting from land-based agricultural activities (cattle grazing, vegetation clearance and intensive cropping, particularly sugar cane) and from urban development is the primary anthropogenic influence on water quality in the Great Barrier Reef World Heritage Area. The pre-eminent water quality threats to the Great Barrier Reef have long been regarded as elevated sediment and nutrient concentrations. Additional threats are potentially posed by pollutants such as heavy metals, persistent chlorohydrocarbons, PCBs and petroleum-related compounds, although these are considered to be of lesser consequence. However, a new concern is the potential impact posed by diuron, dioxins, dieldrin, mercury and cadmium concentrations that have been detected in sediments and biota along the Great Barrier Reef and southern Queensland coastline. In general, these pollutants of concern originate from the wet tropics region; an area dominated by intensive cropping, and renowned for its high rainfall and erosion rates. The potential impacts of elevated pollutant concentrations in Great Barrier Reef waters range from reduced growth and reproduction in organisms, to major shifts in community structure and health of coral reef and seagrass ecosystems. Coastal and inshore coral reefs and seagrass communities adjacent to human activity are most threatened from the pollutants contained in run-off from the land. There is sufficient field evidence to show the threat to these inshore reefs, together with evidence of a decline in their condition. If fundamental changes in land-management do not occur, the health of the inshore areas of the Great Barrier Reef is likely to continue to decline. A decline in ecosystem health of these estuarine and inshore areas will impact on the World Heritage values of the Great Barrier Reef, which has implications for Australia’s national and international obligations for the protection and conservation of a World Heritage Area. Additionally, this may also impact on the viability of industries such as tourism and fisheries that rely on the long-term health of the Great Barrier Reef World Heritage Area. Corals of the Great Barrier Reef region, in common with coral reefs worldwide, are also threatened, to varying degrees, by increased seawater temperatures and altered water chemistry due to global atmospheric change. These may lead to reduced viability or even death of corals and to progressive weakening of reef structures. These changes will continue to threaten reefs globally unless effective worldwide action to reduce carbon dioxide and other greenhouse gas emissions is taken. A comprehensive strategic framework is currently being developed by the Great Barrier Reef Marine Park Authority to deal with pollutants from land based run-off and ship sources. It aims to clearly define responsibilities of Commonwealth and Queensland governments and promote a culture of mutual obligation between industry, government and the community. This will ensure
GBR Water Quality 1

that existing and emerging planning instruments that include water quality objectives and agreed criteria for auditing progress, are integrated and used to address water quality problems. A sound legislative framework already exists to prevent and respond to incidents of marine pollution arising from shipping activities. However, the shipping strategy currently being developed as part of the Great Barrier Reef Marine Park Authority’s strategy will help minimise adverse impacts of shipping activities within the Great Barrier Reef World Heritage Area. This will be achieved by enhancing current management arrangements and ensuring that best practice is maintained. This will involve an international strategy and clarification of roles and responsibilities, as well as ensuring that Commonwealth and Queensland resources are coordinated in order to maximise emergency response capabilities. To ensure these management strategies are working, long-term monitoring programs are required to enable assessment of change in environmentally relevant water pollutant concentrations. Water chemistry data derived using innovative data acquisition techniques can play an early warning role in the assessment of impacts of contaminants on mangrove, seagrass and coral reef organisms of the Great Barrier Reef World Heritage Area. Moreover, such monitoring could contribute to the understanding of interactions of contaminants with high ultraviolet light and temperature conditions associated with global atmospheric change. Without consideration of the subtle impacts of chemical contaminants, managers will fail to fully understand the status of tropical marine ecosystems and the risks associated with anthropogenic impacts.
2

2 THE GREAT BARRIER REEF WORLD HERITAGE AREA
Water quality deterioration and associated impacts on the ecosystems of the Great Barrier Reef have always been seen as high priority issues for management of the Great Barrier Reef system (eg Bennell 1978). As a consequence, research to establish the degree of risk from water quality threats and to identifying sources of pollution, has been a priority of the Great Barrier Reef Marine Park Authority since the establishment of the Marine Park in 1975. Through the 1980s and 1990s, compilations and syntheses of research results and workshops in this area have been progressively reported. Significant examples include publications on: ¶ Chemical spill response (Craik 1985); ¶ Downstream effects of land use (Hunter et al. 1996); ¶ Wetlands adjacent to the Great Barrier Reef (Haynes et al. 1998b); ¶ Land use and nutrient loading of the Great Barrier Reef (Yellowlees 1991); ¶ Nutrients (Baldwin 1988, 1990); ¶ Contaminants (Dutton 1985; Kellaway 1999; Hutchings and Haynes 2000); and ¶ Terrestrial run-off (Williams 2001) This report continues to add to the list by presenting a summary of current knowledge about the types and importance of water quality threats facing the Great Barrier Reef World Heritage Area up to the year 2001.
2.1 Introduction The Great Barrier Reef is situated adjacent to the Queensland (and north-eastern Australian) coast, and is the largest reef system in the world (Figure 1). It is a relatively unspoiled environment, although the region is a focus of agricultural production, tourism, shipping and urban centres (Lucas et al. 1997; Gilbert 2001). These all present a risk to the Great Barrier Reef from pollutant inputs associated with anthropogenic activities. Protection of the ecological systems of the Great Barrier Reef World Heritage Area from pollutants is recognised as one the major challenges facing the Great Barrier Reef Marine Park Authority in managing the World Heritage Area. Achievement of this goal is difficult, as most water quality problems are a consequence of practices that are not under the direct control of the reef management authority (Haynes and Michalek-Wagner 2000).
2.2 The Great Barrier Reef World Heritage Area The Great Barrier Reef extends approximately 2000 km parallel to the Queensland coast between latitude 9o and 24oS and covers an area of approximately 350 000 km2 (Figure 1). It consists of an archipelagic complex of over 3000 reefs and was proclaimed a Marine Park in 1975 and listed on the World Heritage Register in 1981 in recognition of its outstanding universal value (GBRMPA 1981). A majority of the reefs are situated on the mid- and outer-continental shelf and are located 20 to 150 km from the continental landmass. The main reef does not form a continuous barrier, but consists of individual reefs separated by inter-reefal waters. A significant number of reefs (ca 750) also exist at ‘inshore’ or ‘nearshore’ sites (Furnas and Brodie 1996), close to the coast, within the Great Barrier Reef Lagoon. The Great Barrier Reef is the largest of the world’s 552 World Heritage Areas and provides habitat for a diversity of marine life including a number of endangered animals such as dugong, cetaceans and turtles (Lucas et al. 1997). The Great Barrier Reef World Heritage Area also supports extensive areas of inshore and deeper water seagrass beds (Lee Long et al. 1993) and intertidal mangrove forests.
GBR Water Quality 3

Figure 1. The Great Barrier Reef World Heritage Area and its associated catchments, Queensland, Australia.
4

2.3 The Great Barrier Reef Lagoon The Great Barrier Reef largely isolates the continental shelf sea (the Great Barrier Reef lagoon) from the adjacent Coral Sea along the northern Queensland coast (Furnas and Mitchell 1997). In general, oceanic water exchanges freely between the Coral Sea and outer barrier reefs, whereas coastal run-off and inshore processes are the major determinant of inshore lagoon water quality. Water movements within the reef matrix and the Great Barrier Reef lagoon are related to geostatic pressure gradients in the adjacent East Australian Current (Church 1987), shelf waves (Wolanski and Bennett 1983), tidal currents (Church et al. 1985) and wind stress (Wolanski and Pickard 1985). Water mixing induced by winds and the reef matrix is sufficient to keep the water column vertically well mixed (Furnas and Mitchell 1997). However, significant but short-lived stratification of the water column occurs as a consequence of up welling along the continental shelf-break and through the movement of flood plumes along, and across the Great Barrier Reef lagoon. South of the Daintree River (16oS), wind stress from southeast trade winds tends to force surface and coastal waters northwards in opposition to the southward geostrophic water flow driven by the East Australian Current (Burrage et al. 1997). As a result, waters in the outer portion of the Great Barrier Reef lagoon and the outer shelf reef matrix are separated from the coastal zone by a dynamic front in the Great Barrier Reef lagoon (King 1995). This front also traps terrestrial material within 10-15 km of the coast, forming an inshore wedge of terrigenous sediments (Belperio 1983; Johnson 1996; Larcombe et al. 1995). Only rarely during periods of low wind speed or northerly winds, do river flood plumes spread across the Great Barrier Reef shelf and directly impact the reefs of the mid-shelf and outer shelf (Devlin et al. 2001a).
2.4 Sources of Pollutants to the Great Barrier Reef
The Great Barrier Reef catchment is the predominant source of pollution to the Great Barrier Reef. For the central Great Barrier Reef, 40% of external nitrogen inputs and 55% of external phosphorus inputs are derived from land-based sources with the other main sources being deepwater up welling, rainfall and nitrogen fixation (Furnas et al. 1995). However, inputs of catchment-sourced nutrients have increased by a factor of four since 1850 (Moss et al. 1993; Rayment and Neil 1997), while the inputs of other sources have not changed over time due to anthropogenic factors. Thus, the rise in total nitrogen and phosphorus input loads to the central Great Barrier Reef is of the order of 30% since 1850, with the rise due entirely to land-based sources. Nutrient input loads to the inshore area of the Great Barrier Reef (a small fraction of the area and volume of the Great Barrier Reef lagoon), have risen by much greater than 30% following catchment development. There are still uncertainties about the impact of increased land-based sources on sediment/nutrient loads to the mid and outer reefs. Under some conditions, dissolved and/or fine-grained components may sometimes be transported to the mid shelf reefs or beyond. Although the frequency of mid shelf reef flood plumes is low, their impact may still be significant (McCook and Spagnol 2001).
Pesticide residue loads are also sourced primarily from the Great Barrier Reef catchment (Hutchings and Haynes 2000), with only minor amounts of some volatile compounds possibly coming from other areas via aerial transport (Kurtz and Atlas 1990). Shipping-sourced pollutant loads are generally low. Small amounts of sewage are discharged, operational oil-spills occur and shipping anti-fouling compounds are released into the water, but the quantities are relatively minor. Ballast water discharges may introduce exotic species and disease organisms to the Great Barrier Reef, however the risk appears to be low on present evidence. The primary risk of shipping as a source of pollution is related to the chance of a major oil-spill, therefore an acute rather than chronic threat.
GBR Water Quality 5

3 THE GREAT BARRIER REEF CATCHMENT
3.1 Catchment Land Use The coastal region adjoining the Great Barrier Reef World Heritage Area is divided into a number of wet and dry tropical catchments, with forty drainage basins comprising approximately 25% of the land area of Queensland draining directly into the Great Barrier Reef lagoon (Gilbert 2001). Most catchments are small (<10,000 km2), however the Burdekin (133,000 km2) and Fitzroy River catchments (143,000 km2) are among the largest in Australia. Human activity in these catchments is the primary determinant of altered water quality that is ultimately transmitted to the Great Barrier Reef World Heritage Area. Although population growth and urban expansion in Southeastern Queensland has been rapid, the northern Queensland coast still remains relatively sparsely populated (Anon 1999b). Only 700,000 of the State’s 2.9 million residents live in the coastal areas adjacent to the Great Barrier Reef World Heritage Area. Despite this low population pressure, extensive land modification (land clearing) has occurred over the last 200 years since European settlement (Anon 1993). Today, 80% of the land area of catchments adjacent to the Great Barrier Reef World Heritage Area support some form of agricultural production (Gilbert 2001). To place Queensland land use and vegetation clearing activities into perspective, more than 50 % of the State’s original 117 million hectares of woody vegetation has been cleared primarily for agricultural purposes since European settlement (Anon 1999b). As a consequence, erosion is increased and run-off resulting from these agricultural activities and urban development, is the primary anthropogenic influence on water quality in the Great Barrier Reef World Heritage Area (Bell 1991; Moss et al. 1993; Anon 1993; Brodie 1997). Grazing of cattle for beef production is the largest single land use on the Great Barrier Reef catchment with cropping, (mainly of sugarcane) being a significant agricultural industry in coastal areas between Bundaberg and Port Douglas. Other significant catchment land uses include aquaculture and mining of coal and various metals. There are approximately 4,500,000 beef cattle grazed in Great Barrier Reef catchments, with highest stock numbers in the Fitzroy and Burdekin catchments (Table 1). The area under sugarcane cultivation in Great Barrier Reef catchments has increased steadily over the last 100 years reaching approximately 400,000 ha by 2000 (Figure 2). There are thirty-three existing prawn and barramundi aquaculture developments adjacent to the Great Barrier Reef World Heritage Area, ten of which are currently expanding or have plans for future expansion. There are a further six aquaculture proposals, and three operations which have been approved but have either not commenced or are incomplete. Farms range in size from 2 ha to 127 ha with a total of approximately 400 to 450 ha in production (Lobegeiger 1998).
6

Table 1. Area of land under grazing in the Great Barrier Reef catchment (Anon 1993).
Basin Name Area of Grazing Land (km2) *
Proportion of basin grazed (%)
North-East Cape York Jacky Jacky, Olive, Pascoe, Lockhardt, Stewart, Normanby, Jeannie, Endeavour
26,720
62 Mossman-Daintree 930 36 Barron 1,200 55 Mulgrave-Russell 160 8 Johnstone 570 24 Tully-Murray 530 19 Herbert 7,970 66 Ross-Black 850 29 Burdekin-Haughton 118,060 88 Don 3,850 97 Proserpine 1,679 67 Pioneer, O’Connell 1,940 49 Shoalwater, Plane, Styx, Waterpark 4,970 44 Fitzroy 119,320 84 Baffle, Boyne, Calliope 6,360 69 Burnett, Burrum, Kolan 26,520 67 Mary 5,830 61 *Grazing land may include areas of State Forest and Timber Reserves.
3.2 Catchment Sources of Pollution
3.2.1 Rangeland Grazing
The majority of the Great Barrier Reef catchment is used for rangeland beef grazing (Figure 4). Grazing on the large, dry catchments adjacent to the Great Barrier Reef Marine Park has resulted in extensive tree clearance, particularly Brigalow, for conversion to pasture (Gilbert 2001). The principal consequence for the Great Barrier Reef of beef grazing on catchment lands results from greatly increased soil erosion (Ciesiolka 1987) due to woodland removal, overgrazing, (especially in drought conditions, where vegetation cover falls below 40% (McIvor et al. 1995)) and streambank erosion when cattle have direct access to streams (Finlayson and Brigza 1993). Overgrazing has become a problem since the shift from British cattle breeds to Brahman breeds. Braham breeds survive in more adverse conditions, hence they allow high stocking rates during drought conditions which exacerbates erosion. Estimates of the increase in soil erosion from natural conditions to present day conditions (Ciesiolka 1976; Lawrence and Thorburn 1989; Rayment and Neil 1997) range from: ¶ 0.9 tonnes per hectare per year on catchments with minor gully erosion; ¶ 1.6 tonnes with one active gully; and ¶ 27-30 tonnes with severe gully erosion.
GBR Water Quality 7

0
100
200
300
400
1930
1934
1938
1942
1946
1950
1954
1958
1962
1966
1970
1974
1978
1982
1986
1990
1994
Area
(ha
X 1
000)
Figure 2. Increase in Queensland land area used for sugar cultivation from 1930 to 1996 (Gilbert 2001).
0
2000
4000
6000
8000
10000
12000
14000
16000
1910 1915 1920 1925 1930 1935 1940 1945 1950 1955 1960 1965 1970 1975 1980 1985 1990
Phos
phor
us (t
onne
s)
0
10000
20000
30000
40000
50000
60000
70000
80000
90000
Nitr
ogen
(ton
nes)
to ta l phosphorusto ta l n itrogen
Figure 3. Increases in the use of nitrogen and phosphorus fertiliser on the Great Barrier Reef catchment (Pulsford 1996).
8

An estimated 15 to 28 million tonnes of sediment is delivered to the Great Barrier Reef from the catchment annually (Moss et al. 1993; Neil and Yu 1996a, 1996b; Rayment and Neil 1997; Wasson 1997). Sediments lost from Great Barrier Reef catchments also carry a large quantity of nitrogen (N) and phosphorus (P) (and other plant nutrient elements such as iron and silicon). N and P are the natural nutrients present in the soil, but are also associated with added fertiliser and are mobilised through erosion (Rayment and Neil 1997). Calculations of the quantity of N and P lost from Great Barrier Reef catchments give estimates of about 80,000 tonnes per year of N and about 35,000 tonnes of P (Moss et al. 1993; Rayment and Neil 1997). This represents a large component of the additional N and P now entering the Great Barrier Reef from the catchment compared to pre-European times. In fact, it is estimated that four times as much N and P is now entering the Great Barrier Reef (Moss et al. 1993; Rayment and Neil 1997); most of which is attributable to soil erosion arising from rangeland grazing.
3.2.2 Sugarcane Cultivation
Sugarcane is by far the largest crop on the Great Barrier Reef catchment. The area of cane has increased relatively uniformly over the last fifty years (Figure 2). Sugarcane is grown on the coastal floodplains of the rivers south of the Daintree, with small but increasing areas also grown on the Atherton Tablelands. Sugarcane, as it has been cultivated since the 1950s, requires substantial use of inorganic fertiliser, particularly nitrogen. The large increase in the use of nitrogen fertiliser on the Great Barrier Reef catchment over the last 50 years (Figure 3) is primarily due to the expansion of caneland (Figure 2), as well as increasing fertiliser use per hectare. Current fertiliser use recommendations for cane cultivation in Queensland are about 150 to 200 kg/ha/year of nitrogen fertiliser (as N). Thus approximately 65,000 tonnes of nitrogen is applied to cane on the Great Barrier Reef catchment per year. Some use of fertiliser above the recommended rates is reported (Schroeder et al. 1998). It is becoming clear that trash (sugar cane leaves) retention, now the primary means of cane cultivation on the Great Barrier Reef catchment, returns up to 50 kg/ha/year of N to the soil, and potentially to the crop and surrounding environment, after about five years of this practice (Robertson and Thorburn 1999; Thorburn et al. 2000). In the Sarina/Mackay area, dunder (a waste from alcohol distilling) is also added to sugarcane soils, as is mill-mud (a waste from sugar mill operations) in areas close to mills. These materials also contain N and P, causing substantial over-fertilisation in some areas (Schroeder et al. 1998), particularly when inorganic fertilisers are applied as well. Of the 200 kg/ha of fertiliser N applied annually to sugar cane crops, about 70 kg is taken up by the crop (Reganzani and Armour 2000). The remaining 130 kg/ha/year are lost to a number of environmental compartments including the atmosphere (volatilization and denitrification) (Freney et al. 1994; Weier et al. 1996), groundwater (Bohl et al. 2000), run-off (Reganzani and Armour 2000) and soil storage (including trash storage) (Robertson and Thorburn 1999). The proportion lost to each compartment depends on climate, weather, soil type, cultivation practices, fertiliser application practices and hydrology (Reganzani et al. 1996; McShane et al. 1993; Moody et al. 1996). A large fraction of the lost nitrogen reaches adjacent streams and rivers, as has been shown in the Johnstone River (Hunter et al. 1996; Hunter 1997); Herbert River (Mitchell et al. 1997); Burdekin River irrigation area (Congdon and Lukacs 1996); and the Atherton Tablelands (Hunter et al. 1999). Soil erosion from cane land was recognised as a major sediment source to river systems when the predominant cultivation technique was burnt cane harvesting (‘conventional cultivation’) (Prove and Hicks 1991). Erosion rates of up to 500 tonnes/ha/year were measured on Johnstone River cane lands under conventional cultivation (Prove and Hicks 1991).
GBR Water Quality 9

With the move to green cane harvesting/trash blanketing (GCTB) using minimum tillage, soil erosion rates dropped dramatically with average losses of 10 tonnes/ha/year (Prove and Hicks 1991; Rayment and Neil 1997). Considerable soil loss still occurs in the plant cane stage (up to 50 tonnes/ha/year), but there is minimal loss in ratoon (regrowth) crops using GCTB (about 5 tonnes/ha/year). With ratoon crops comprising on average four crops in every five, the overall average loss for the complete five year crop cycle is about 10 tonnes/ha/year, only marginally higher than the natural rate of soil erosion on the flood plain. Most of the cane grown in the Great Barrier Reef catchment now uses GCTB, with the exception of the Burdekin region. Nutrient loss associated with soil erosion is also minimised under GCTB cultivation, making losses of N and P associated with fertiliser the major source of nutrients from cane lands in recent times. Soil loss in newly developed cane lands can be severe and this has been anecdotally noted in the expansion areas of the Tully/Murray floodplain during the 1990s. Such losses may, in part, explain the major rise in particulate nitrogen concentrations in the Tully River during the 1990s (Mitchell et al. 2000). In summary, sugarcane cultivation on the Great Barrier Reef catchment probably contributes about 20,000 tonnes of N per year on average to the Great Barrier Reef. This is about 25% of the total load (Moss et al. 1993; Rayment and Neil 1997). In areas of intense sugarcane cultivation, such as the Wet Tropics (Figure 5), it contributes the majority of the dissolved inorganic nitrogen (nitrate and ammonia) transported by the rivers (Hunter 1997; Hunter and Walton 1997; Mitchell et al. 1997). This contribution is rising with increasing cane area and fertiliser usage rates.
3.2.3 Other Crops
Other major crops grown on the Great Barrier Reef catchment are cotton, (mostly on the Fitzroy), and horticultural crops - particularly bananas, other tree crops such as mangos and lychees, and vegetable crops such as tomatoes. There has been considerable expansion of banana crops in the Tully catchment area in the last thirteen years. Nitrogen fertiliser rates on these crops can be high, e.g. for bananas approximately 450 kg/ha/year (as N). Overall, banana crops use the equivalent of approximately 6.5% of the amount of N fertilizer used on sugarcane. Loss of fertiliser from bananas follows similar pathways to sugarcane grown in the same area (Prove et al. 1997) and presents a similar, albeit smaller source due to the smaller cultivation areas involved (Hunter et al. 1996). However due to the nature of their cultivation, (bananas are usually grown on steeper slopes in more elevated areas of the catchment than sugarcane), they contribute disproportionately high leachate and soil erosion losses. Cotton grown on the Fitzroy catchment uses nitrogen at rates of about 150 kg/ha/year and considerable loss of nitrogen from cotton cultivation has been measured downstream from the cropping areas (Noble et al. 1997).
10

Figure 4. Cattle grazing, Burdekin catchment.
Figure 5. Sugarcane cropping, Great Barrier Reef catchment.
GBR Water Quality 11

3.2.4 Coastal Aquaculture
Coastal pond-based aquaculture now occupies about 450 ha on the Great Barrier Reef coast (Figure 6). This area is dominated by cultivation of penaid prawns and to a lesser degree, finfish (e.g. barramundi). The discharge from aquaculture under present cultivation techniques contains high concentrations of suspended solids and nutrients (N and P). The loss of N and P in the discharge per hectare of pond is about 10 times that lost from one hectare of sugarcane cultivation with GCTB (Brennan 1999). However, with only 450 ha of existing ponds, the load of N and P from coastal aquaculture is very small compared to losses from 400,000 ha of sugarcane cultivation. However, aquaculture is expanding rapidly with another 1000 ha of ponds now under construction or planned to begin construction shortly. Techniques using particle settlement ponds and cleanup ponds containing algae, bivalves and fish can reduce suspended solids and nutrients in pond discharges to low levels (Prinsloo et al. 1999; Troell et al. 1999). If such techniques were introduced in new operations, and existing farms retrofitted, discharge of sediment, N and P from coastal aquaculture could be significantly reduced. Discharge of prawn pond effluent can also lead to changes of local salinity regimes. Recent research conducted by the Cooperative Research Centre (CRC) for Aquaculture has found that regular discharge of high salinity effluent from prawn farms, impacts upon the salinity regime in the estuarine receiving and mixing zones. The consequences of this alteration in salinity are yet to be determined (Trott and Alongi 1999). Aquaculture also presents the risk of release of disease to the environment by the accidental introduction of exotic parasites and pathogens to wild stock and other marine species; undetected importation of infectious product in prawns and prawn feeds; and the amplification of endemic diseases associated with the intensive culturing of aquaculture species. Pathogens in Queensland prawn farms comprise a wide variety of taxa, including the pathogenic bacteria Vibrio spp. (Vibrio anguillarum, V. harveyi and V. alginolyticus) (Smith 1993).
3.3 Wetland Clearing and Acid Sulphate Soils Vegetation clearing associated with agricultural (and urban) expansion has led to major losses and alteration of wetland habitat in catchments adjacent to the Great Barrier Reef (Figures 7 and 8; Table 2). Examples include: ¶ 646 ha of mangrove wetlands were lost to clearing and reclamation for industrial and urban
development between 1941 and 1989 on the Curtis Coast, south of Rockhampton, (QDEH 1994).
¶ Approximately 80 % of ephemeral wetlands have been lost on the Burdekin River floodplain, (Tait, pers com).
¶ 60-70 % of Melaleuca wetlands and a significant proportion of sedgelands have been lost from Cairns to Ingham (Barron, Russell-Mulgrave, Johnstone, Murray and Herbert Rivers), (Johnson et al. 1998a; Russell and Hales 1994).
¶ An estimated 600 ha of mangroves were lost in Trinity Inlet, Cairns, to industrial development in the years leading up to 1978 (Olsen 1983).
12

Figure 6. Aquaculture production ponds, Great Barrier Reef catchment.
Coastal wetlands north of Port Douglas have been to date less disturbed, a consequence of their remoteness (Anon 1999b; Ramsay 2001). In coastal areas where wetlands are disturbed, potential acid sulphate soils (PASS) can occur. Queensland has extensive areas (an estimated 2.3 million ha) of potential acid sulphate soils located in low lying areas near the coast (Sammut and Lines-Kelly 1996; White et al. 1997). PASS soils contain iron sulphides that are normally protected from contact with the air in a layer of waterlogged soil. When these soils are drained and exposed to the air, they oxidize to produce sulphuric acid that can acidify soil water, ground water and eventually surface waters. Acidity can also mobilise soil-bound heavy metals and make these biologically available (Sammut et al. 1994), as well as reduce water column dissolved oxygen concentrations to critical levels (Cook et al. 2000). Acid production can persist for years following PASS exposure, rendering surrounding soil toxic and barren, and killing fish and aquatic plants and invertebrates in adjacent waterways (White et al. 1996; White et al. 1997). Construction of canal estates, marinas, housing/industrial estates, roads, golf courses, aquaculture ponds, and sand/gravel extraction and drainage for sugar cane, can disturb PASS and release sulphuric acid which may then drain into adjacent waterways (Powell and Ahern 1999).
GBR Water Quality 13

Figure 7. Wetland clearing for agricultural expansion, Great Barrier Reef catchment.
0
20000
40000
60000
80000
100000
120000
140000
1860 1943 1961 1977 1988 1996Year
Source: Johnson et al ., 2000
Are
a (h
a) MelaleucaRainforest
Figure 8. Changes in vegetation cover of Melaleuca wetlands and rainforest in the Herbert River catchment, North Queensland, since European settlement (Johnson et al. 2000).
14

Table 2. Estimated coastal wetland habitat decline in selected Great Barrier Reef catchments.
Wetland Type Past Area
1942/1951/1952 (ha)
Present Area
1992/1996 (ha)
Estimated Loss
(%)
Tully-Murray Catchment
Melaleuca
Total
6750
6750
3960
3960
41
41
Russell-Mulgrave Catchment
Mangrove 775 787 +
Melaleuca 3860 1808 53
Palm Forest 1766 738 58
Rainforest 1759 308 82
Sedge Swamp 1077 562 48
Mixed Melaleuca
Total
666
9903
319
4522
52
54
Johnstone Catchment
Mangrove 176 202 +
Melaleuca 1277 282 78
Palm Forest 439 160 64
Sedge Swamp 499 225 55
Mixed Melaleuca
Total
462
2853
258
1127
44
60
Moresby Catchment
Mangrove 2233 2873 +
Freshwater
Total
Herbert Catchment
(lower floodplain)
Mangrove
Melaleuca
Rainforest
Total
3363
5596
14000 38000 122000
174000
1175
4048
13500 13000 122000
148500
65
28
0.36 66 -
15
Grand Total 199102 162157 19
(Source: Russell and Hales 1994; Russell et al. 1996a, b; Skull 1996; Johnson et al. 1998a; Johnson et al. 2000).
GBR Water Quality 15

3.4 Coastal Development
3.4.1 Settlement
There are 21 local government areas adjacent to the coastal waters of the Great Barrier Reef World Heritage Area and a further 22 that encompass its catchment. Most of these local government areas have populations numbers less than 25,000, while the populations of Cairns, Thuringowa/Townsville, Mackay, Rockhampton and Gladstone range between 26,000 and 140,000 (Pitts 1998). The majority of coastal Shires have growing populations (Figure 9), and it is expected that pressure for coastal development adjacent to the Great Barrier Reef will increase, with further modification of coastal environments and downstream impacts on (the values of) the Great Barrier Reef World Heritage Area. Significant growth is projected for urban areas in Queensland’s coastal zone. Average growth rates for major coastal centres such as Cairns, exceeded 4% between 1991-1996 (EPA 1999). As a consequence, local governments along the coast face the challenge of balancing the demands of economic development associated with urban expansion with maintenance of healthy local coastal ecosystems (Figures 10 and 11). An integral component of this is protection of local water quality and maintenance of aquatic habitat.
-1.5 -1 -0.5 0 0.5 1 1.5 2 2.5 3 3.5
Torres
Cook
Douglas
Cairns City
Johnstone
Hinchinbrook
Cardwell
Thuringowa City
Townsville City
Burdekin
Bowen
Whitsunday
City of Mackay
Sarina
Broadsound
Livingstone
Calliope
Gladstone
Rockhampton
Fitzroy
Miriam Vale
Averal Annual Population Growth 1996-2016
Figure 9. Projected average percentage annual population growth 1996 to 2016 (DCILGP 1998).
16

3.4.2 Stormwater and Sewage Discharges
Industrial sites that accumulate surface contamination have the potential to pollute stormwaters. In addition, dust, spillages, erosion products and stockpiles of raw materials, products or waste can be flushed by rainfall or washing activities into stormwater drainage streams. For example, metal refineries, such as Queensland Nickel operations near Townsville, may contribute acidic drainage, sediment, and metals from other non-point source areas, and mine tailings to receiving streams. This may result in degraded water quality and limitations on the beneficial uses of waterbodies (Caruso and Ward 1998). Run-off from fuel storage sites may also pollute receiving waters. For example, low concentrations of petroleum-like hydrocarbons were isolated from tissue samples from the holothurian Holothuria sp. and the coral Acropora sp. collected from the Great Barrier Reef Capricorn Group in 1981 (Coates et al. 1986). These contaminants were believed to originate from industrial operations at Gladstone or from petroleum bearing shale deposits in the region. Tissue samples collected elsewhere in reef waters by Coates were uncontaminated with hydrocarbons. Cities and towns with populations of approximately 3000 or more people generally have sewage treatment plants. Smaller settlements rely on a mixture of small-scale treatment facilities or septic systems. In the Great Barrier Reef catchment area, the majority of sewage effluent from coastal settlements is discharged to waterways upstream of the Great Barrier Reef, with a small proportion of island resorts discharging wastewater directly into the Great Barrier Reef World Heritage Area. There are six island resorts that have permits to discharge tertiary effluent (i.e. effluent that has been subject to nutrient removal) or tertiary equivalent effluent (5% discharge of secondary treated effluent with the remainder to land irrigation), directly into the Marine Park. The Townsville (Cleveland Bay), Whitsunday (Cannonvale) and Yeppoon sewage treatment plants discharge a portion of the effluent generated from their population centres directly into the Great Barrier Reef World Heritage Area. Several coastal sewage treatment plants serving major populations reuse a proportion of secondary treated effluent for land irrigation. A review of island sewage treatment plants was completed in 2000 and the findings are summarised in Table 3 (Waterhouse and Johnson 2001). In general, there has been an improvement in sewage management for the island resorts in the Great Barrier Reef World Heritage Area since 1996, and many systems have been upgraded to tertiary treatment systems with land irrigation of treated effluent. There are a number of systems that require immediate improvements, and the Queensland EPA is currently managing these issues. The Great Barrier Reef Marine Park Authority intends to review existing discharge guidelines. It will consider those guidelines applied by Queensland agencies to achieve consistency in management of discharges to the Great Barrier Reef World Heritage Area. In the longer term, standards applied to sewage discharged to waterways that flow into the Great Barrier Reef World Heritage Area will also be reviewed. The recently released draft State Coastal Management Plan requires discharges into Queensland coastal waters to achieve appropriate nutrient removal by 2010. This will apply to most sewage treatment facilities servicing population centres adjacent to the Great Barrier Reef World Heritage Area. The most well known occurrence of sewage discharge in the Great Barrier Reef is probably the situation at Green Island, near Cairns. Prolonged discharge of primary treated effluent led to abnormal and luxuriant growth of seagrass in an area near the cay where hydrodynamic retention of the diluted effluent occurred (van Woesik 1989). Since then, the system has been upgraded to tertiary treatment and environmental changes are being monitored. It has also been demonstrated that the secondary treated discharge from Hayman Island in the Whitsunday Group has caused localised effects on an adjacent coral reef (Steven and van Woesik 1990).
GBR Water Quality 17

The discharge from the Airlie Beach to Pioneer Bay settlement is believed to have caused significant impacts to seagrasses and minor increases in macroalgae growing over hard corals in Pioneer Bay and Boathaven Bay (FRC 1999). The management of floodwater is an important issue, especially in the Wet Tropics region of northern Queensland. City Councils are now required to develop stormwater management plans and most subdivision proposals are required to integrate stormwater management with the local government stormwater system. Floodwater management is also an important issue in rural shires, especially in those with a high percentage of intensive agriculture. Many Shires are developing Shire drainage plans, often with significant government funding. Stormwater management is addressed by Queensland under the Environmental Protection (Water) Policy 1997. This policy requires the cooperative development of water quality standards and objectives and stormwater management plans between local government, industry and the Environmental Protection Agency. To date, (December 2000), only one water body (Trinity Inlet) has defined water quality objectives.
3.4.3 Coastal Heavy Industry
The Calliope, Gladstone and Townsville/Thuringowa local government areas contain the greatest proportion of heavy industry in Great Barrier Reef catchments. There are thirteen existing heavy industry operations (including an alumina refinery and aluminium smelter and a power generation station) as well as five proposals for further development of heavy industry in the Gladstone area. The Stuart Shale Oil proposal is also a significant industrial development on the Great Barrier Reef catchment, particularly if it proceeds to Stage 3 of the development where mining may extend into the Great Barrier Reef World Heritage Area. In the Townsville/Thuringowa area the principal heavy industries are a zinc refinery and smelter (Figure 10), a copper refinery and a nickel refinery. There are two industrial effluent outfalls that discharge into the marine environment – the Queensland Nickel Refinery, Thuringowa; and the trade waste discharge facility at Fisherman’s Landing Wharf, Gladstone. A number of industries discharge to the Fisherman’s Landing facility and this results in a variety of contaminants in the effluent. Atmospheric deposition of industrial pollutants is an important source of pollutants to the marine environment (Figure 11). These sources of nitrogen and other industrial emissions may be of concern in built up areas along the Great Barrier Reef coast, however it is expected that atmospheric inputs of pollutants would be comparatively small compared to inputs from run-off and effluent discharges to the Great Barrier Reef World Heritage Area due to the predominantly south-east wind regime in the region carrying air-borne pollutants inland rather than to the Great Barrier Reef.
3.5 Mining Coal production is the major mining operation carried out in the Great Barrier Reef catchment area, with mines in the region producing approximately 96% of Queensland’s 95 million tonnes of annual black coal production (Gilbert 2001). Other mining operations close to the coast include shale oil operations north of Gladstone, silica mining near Cape Flattery and magnesia mining north of Rockhampton. There is likely to be further expansion of port activities to support these mines. Expansion of operations at the Port of Hay Point are presently proposed in order to cater for expanding coal export operations from central Queensland.
18

Figure 10. Sun Metals Zinc Refinery, Townsville.
.
Figure 11. Gladstone Power Station, Gladstone.
GBR Water Quality 19

Table 3. Status of island sewage treatment facilities in the Great Barrier Reef World Heritage Area (Waterhouse and Johnson 2001).
Operation Specifications of sewerage treatment facilities
June 1994 June 2000
Cairns GBR Section Lizard Island Resort 2¯, LI 3¯, LI Lizard Island Research Station Pit toilets CT Double Island Resort 2¯, LI No change Fitzroy Island Resort & Camp Ground ST, AT No change Green Island Resort 3¯, LI, reuse No change Dunk Island Resort & Camp Ground 2¯, LI 3¯, LI Central GBR Section Bedarra Island Resort 2¯, LI 3¯, LI Hinchinbrook Island Resort 2¯, LI No change Palm Island Community 2¯, creek discharge 3¯, LI Orpheus Island Resort ST, AT No change Orpheus Island Research Station ST Unsatisfactory ST Nelly Bay Community (Magnetic Is) 2¯, LI No change Horseshoe Bay Community (Magnetic Is) 2¯, effluent lagoon No change South Molle Island Resort Partial 3¯, MO Partial 3¯, MO, LI (100%) Club Crocodile Long Island Resort Partial 3¯, LI 2¯, LI Palm Bay Hideaway Resort (Long Is) ST No change Paradise Bay Resort (Long Is) ST 2¯, LI Hayman Island Resort 2¯, MO, LI 2¯, MO (<5%), LI Hook Island Resort & Backpackers Unsatisfactory ST No change Hamilton Island Resort & Residential 2¯, MO (60%), LI 2¯, MO (40%), LI Lindeman Island Club Med Resort 3¯, LI No change Daydream Island Resort 2¯, MO, LI 2¯, LI (100%) Mackay / Capricorn GBR Section Great Keppel Island Resort 2¯, MO Partial 3¯, LI (100%) Keppel Haven Resort 2¯, LI 3¯, LI Keppel Island Holidays (YHA) 2¯, LI No change Pumpkin Island Resort ST, ET No change Brampton Island Resort 2¯, LI 2¯, MO (?), LI Newry Island Resort ST No change Heron Island Resort & Research Station 2¯, SI 3¯, reuse in toilets (20%) One Tree Island Research Station Sea disposal CT Lady Elliot Island Resort 2¯, Land disposal No change
3¯ - tertiary treatment, 2¯ - secondary treatment, AT - absorption trenches, CT - composting toilets, ET - Evaporation Trenches, LI - Land Irrigation, MO - Marine Outfall, SI - Subsoil Injection, ST - Septic tanks.
20

3.6 Dam Construction Larger cities or populations also require a dependable water supply and this has been the impetus for the construction of many dams in Queensland. There are 123 official dams and weirs within the Great Barrier Reef catchment (Gilbert 2001). Provision of water for expanding agricultural activities and human settlement has led to a number of proposals to construct new water storage facilities. These existing and proposed facilities have the capacity to modify water regimes and have potential for significant downstream impact on the Great Barrier Reef World Heritage Area. Local river impacts include impediment of the movement of fauna along waterways, alteration of water temperature and flow regimes, loss of habitat and degraded water quality through reduced oxygen levels and release of toxicants such as hydrogen sulphide (Bunn and Arthington 1997). Marine impacts are often related to loss of breeding habitat for fish and altered hydrological regimes in estuarine areas.
GBR Water Quality 21

4 PRINCIPAL WATER QUALITY INFLUENCES ON GREAT BARRIER REEF ECOSYSTEMS
Coral reefs are influenced by a range of water quality variables. In general, they are adapted to tolerate variations in water quality, however when critical thresholds are exceeded they may be adversely impacted. Major water quality variables affecting coral reef health include water temperature, salinity, nutrient and suspended sediment concentrations, as well as other toxicants including pesticides.
4.1 Nutrients The two principal nutrients, nitrogen and phosphorus, exist in several forms in marine waters. Water column nitrogen includes inorganic nitrogen species (NH4, NO2 and NO3), dissolved organic nitrogen (DON) and particulate nitrogen. Similarly, phosphorus exists as dissolved inorganic and organic phosphorus (PO4 and DOP) and particulate phosphorus. The availability of dissolved inorganic nitrogen partially controls primary production in the Great Barrier Reef. Dissolved inorganic nutrients are taken up directly by phytoplankton and converted to particulate organic matter. Coral communities and their symbiotic zooxanthellae also take up dissolved nutrients directly from the water column. Under non-flood conditions, total dissolved inorganic nitrogen stocks (DIN) are only sufficient for approximately one doubling of phytoplankton biomass (Furnas and Mitchell 1997). In contrast, sufficient phosphorus and silicon are usually available for several to many biomass doublings. Nutrient supply to the Great Barrier Reef is affected by a diverse array of inputs. These include: ¶ river discharges (Mitchell et al. 1997); ¶ urban stormwater and wastewater run-off (Brodie 1994; Mitchell and Furnas 1997); ¶ atmospheric inputs following rainfall events (Furnas et al. 1995); ¶ planktonic and microphytobenthic nitrogen fixation (Furnas and Brodie 1996); and ¶ deeper ocean supply following Coral Sea up welling (Furnas and Mitchell 1986). ¶ resuspension of nearshore sediments and their associated nutrients is also a major source of
nutrient recycling during strong wind events (Walker and O'Donnell 1981; Gagan et al. 1987).
The majority of nutrients are continuously recycled within the Great Barrier Reef ecosystem, with only approximately 5% per annum of nutrients being added from new sources (Furnas and Brodie 1996; Furnas et al. 1997). In the inshore areas of the Great Barrier Reef, riverine discharge is the single biggest source of nutrients (Furnas et al. 1997). The bulk of this nutrient discharge occurs during tropical monsoon flood flows. Elevated nutrient concentrations result in a range of impacts on coral communities (Tomascik and Sander 1985; Ward and Harrison 1997; Koop et al. 2001) and under extreme situations, can result in coral reef community collapse (Smith et al. 1981; Lapointe and O'Connell 1989). There are a number of ways in which elevated nutrients affect corals: ¶ By promoting phytoplankton growth which in turn supports increased numbers of filter
feeding organisms such as tubeworms, sponges and bivalves which compete with coral for space (Smith et al. 1981).
¶ Macroalgal blooms may result under enhanced nutrient regimes and macroalgae may overgrow coral structures, out-competing polyps for space and shading coral colonies to critical levels. This effect has been demonstrated in numerous coral reef systems worldwide including the Red Sea (Walker and Ormond 1982) and in Barbados (Tomascik and Sander 1985), with the best documented example in Kaneohe Bay, Hawaii (Smith et al. 1981).
22

¶ Excessive phosphorus concentrations result in coral colonies with less dense, and hence weakened skeletons, which make colonies more susceptible to damage from storm action (Wilkinson 1996). Neither macroalgae nor most filter feeders add to reef consolidation through calcification.
¶ Elevated nutrients have been demonstrated to inhibit fertilisation rates and embryo formation in the corals Acropora longicyathus and A. aspera, as well as causing direct coral mortality (Ward and Harrison 1997; Koop et al. 2001).
4.2 Sediments and Turbidity As for nutrients, there is unequivocal evidence that high, chronic input of terrestrial sediment and organic matter will lead to reef destruction through burial, disruption of recruitment or deleterious community shifts. Regardless of whether such sediment loads are natural or the result of human activity, excessive sediment loads can impact corals through: ¶ smothering when particles settle out (sedimentation) and ¶ by reducing light availability (turbidity) and potentially reducing coral photosynthesis and
growth (Rogers 1990; Anthony 1999a; Anthony 1999b). Increased sediment loads combined with eutrophic (nutrient rich) conditions may result in the formation of marine snow, viscous suspended particles, which may also impact corals (Fabricius and Wolanski 2000). Corals and other small sessile invertebrates have to expend considerable energy to rid themselves of large marine snow particles compared to the normal, smaller ‘clean’ sediment particles of oligotrophic (nutrient poor) waters (Fabricius and Wolanski 2000). This creates a metabolic energy drain which may reduce reproductive capacity and the organism’s capacity to grow. Offshore coral reef environments are generally regarded as being adapted to low turbidity and low-nutrient conditions. In contrast, nearshore and coastal reef systems have evolved in relatively turbid environments where suspended sediment and turbidity are influenced by local wind and wave regimes rather than by sediment supply (Larcombe and Woolfe 1999). Despite high turbidity levels and sedimentation rates, a number of inshore reefs sustain high and healthy coral cover and diversity, suggesting local adaptation to intense sedimentation regimes (Ayling and Ayling 1998). One reason for this may be that coral populations from inshore turbid environments have a greater capacity than offshore species to feed and thus obtain energy from sediment particles (Anthony 1999a). Energy obtained in this way could balance phototrophic energy reductions caused by shading in shallow turbid waters. However, particle feeding is unlikely to be a sole energy source in consistently turbid waters (Anthony 1999b). Sediment smothering in inshore waters is reduced in higher energy areas as water movement removes excessive sediment before it affects coral (Johnson 1996), enabling successful coral growth and recruitment. Elevated sediment and nutrient concentrations can also be deleterious to seagrass beds. Australian seagrass communities are generally characterised by low ambient nutrient loadings and increased nutrients and water turbidity can adversely affect seagrasses by lowering ambient light levels (Walker et al. 1999). Three major factors can cause a reduction in light availability (Shepherd et al. 1989; Walker and McComb 1992; Abal and Dennison 1996), which will reduce the photosynthetic capability of affected seagrasses: ¶ Chronic increases in dissolved nutrients leading to a proliferation of algae including
phytoplankton, benthic macroalgae or algal epiphytes on seagrass stems and leaves; ¶ Chronic or acute increases in suspended sediments leading to increased water column
turbidity; and
GBR Water Quality 23

¶ Pulsed increases in suspended sediments and/or phytoplankton blooms that cause a dramatic reduction of water column light penetration for a limited time.
4.3 Salinity Reef corals exist in seawater salinities ranging from 25 to 42‰ (Coles and Jokiel 1992). At the lower end of the salinity tolerance range, many examples exist of lethal and sublethal effects of lowered salinities following storm and flood events (Coles and Jokiel 1992). Symptoms of coral stress caused by lowered salinities include excessive mucous release and loss of zooxanthellae (bleaching). Salinity impacts to corals are confounded by other flood related stresses such as sedimentation, turbidity and increased ultraviolet radiation exposure. Shallow reefs in the Keppel Island region suffered almost complete mortality due to prolonged salinity stress following the 1991 Fitzroy River floods (van Woesik et al. 1995), and 50% of the fringing reef around Snapper Island was killed by freshwater flood run-off in 1998 (Ayling and Ayling 1998).
4.4 Other Pollutants Agriculture, urban settlement and industrial activities around the world have contributed to the widespread contamination of global marine ecosystems with pesticide residues, organochlorine compounds and heavy metals (Tatsukawa et al. 1990; Fowler 1990). These types of pollutants are persistent, highly toxic and many are essentially permanent additions to the environment (Clark 1992; Richardson 1995).
4.4.1 Organochlorine Pesticides
Chlorinated organic compounds (or organochlorines) are carbon-based chemicals that contain bound chlorine. These compounds are mostly artificial and enter the environment mainly through human activities. However, it is now recognised that marine algae and invertebrates and natural processes such as forest fires also contribute variable quantities of organochlorines to the environment (Leach et al. 1985; Enell and Wennberg 1991; Gribble 1994). Chlorinated organic compounds have had a wide range of industrial and agricultural applications, although many of them are now banned from use. They include pesticides such as DDT (dichloro-diphenyl-trichloroethane) and lindane (g-HCH or gamma-hexachlorocyclohexane) and polychlorinated biphenyls (PCBs), which are also used in a range of industrial applications including dielectrics in electrical transformers. The few studies of the impacts of organochlorine compounds carried out in Australian freshwater and marine environments indicate that environmental contamination by organochlorine substances has occurred at relatively low concentrations in Australia. Highest concentrations have been associated with centres of urbanisation (Richardson 1995). This contamination pattern is similar to the findings of studies elsewhere which have identified chlorinated organic compounds in estuarine and marine sediments near major metropolitan areas along the eastern coast of the United States and at a wide range of locations in Europe and Asia associated with human settlement (Alvarez Piñeiro et al. 1995; Mohapatra et al. 1995; Agnihotri et al. 1996; Thompson et al. 1996;). Organochlorine pesticides enter the environment via a number of routes following their release or application (Figure 12). They may enter the atmosphere directly during spraying, and later following volatilisation of deposited spray from both foliage and surface soil (Nash and Hill 1990). Pesticides may also enter the atmosphere adsorbed to wind-blown dust particles (Clark
24

1992), which are ultimately re-deposited on land or water. Applied and deposited pesticides are transported from application and depositional sites to the aquatic environment in overland flows and ground leachate following rainfalls (Clendening et al. 1990). Organochlorine compounds can also enter the environment as contaminants contained in effluent discharges and in urban stormwater run-off. Organochlorine compounds are highly hydrophobic and once in the water column, tend to adsorb to fine particulates or be bioaccumulated into lipids in aquatic biota (Olsen et al. 1982). The final distribution of organochlorine compounds between the different phases in the aquatic environment is complex (Connell 1995). The consequences of organochlorine tissue accumulation are also complex (Clark 1992) and organochlorine pesticides and polychlorinated biphenyls (PCBs) have been implicated in reproductive and immunological abnormalities observed in terrestrial bird populations and in marine mammal populations (Boon et al. 1992). While the impact of organochlorines are still unclear for lower invertebrates such as corals, their potential toxicity to immune systems and reproductive processes is of concern.
4.4.2 Dioxins
Dioxins are a group of 210 chlorinated compounds consisting of chlorinated dibenzo-para-dioxins (PCDDs) and chlorinated dibenzofurans (PCDFs). They are formed during various chemical and industrial manufacturing processes, by combustion of organic material (Kjeller et al. 1991), and also via lesser known natural processes (Hashimoto et al. 1995; Alcock et al. 1998). They are known to display a diverse and complex array of toxicological properties (Buckland et al. 1990) and have been detected in a variety of marine mammals (Buckland et al. 1990; Norstrom et al. 1990; Oehme et al. 1995; Jarman et al. 1996; Muir et al. 1996; Tarasova et al. 1997). It has been assumed that no significant sources of PCDDs and PCDFs exist in Australia’s northeast tropical region as it has a relatively low population density with little industrial activity. However, high concentrations of octachlorinated dibenzodioxin (OCDD) and a relatively unusual PCDD/F congener profile have been found in topsoil samples from a sugar cane field in northern Queensland (Müller et al. 1996a; Müller et al. 1996b).
4.4.3 Modern pesticides, insecticides and herbicides
A number of new generation insecticides and herbicides are now used by the Queensland agricultural industry. Insecticides in use include chlorpyrifos and herbicides in use include atrazine, diuron, 2,4-D, glyphosate and paraquat (Hamilton and Haydon 1996). Chronic herbicide exposure from agricultural run-off has the potential to negatively impact on seagrasses and other photo-autotrophic reef organisms (Vandermeulen et al. 1972; Ralph 2000; Haynes et al. 2000b). This includes shallow water reef-building corals that rely on their symbiotic zooxanthellae for nutrition (Davies 1991). Other pesticides in use include rodenticides such as thallium sulphate, and the mercury based compound, methylethoxymercuric chloride (MEMC) used to treat sugar cane fungal disease (Hamilton and Haydon 1996).
4.4.4 Heavy Metals
Heavy metals are natural constituents of rocks and soils and enter the environment as a consequence of weathering and erosion (Förstner 1989). Many metals are biologically essential, but all have the potential to be toxic to biota above certain threshold concentrations. Following industrialisation, unnatural quantities of metals such as arsenic (As), cadmium (Cd), copper (Cu), mercury (Hg), lead (Pb), nickel (Ni) and zinc (Zn) have been released, and continue to be released into the aquatic environment through agricultural, urban stormwater and wastewater discharges. As, Cd, Cu, Hg and Zn are the metals with the most potential impact that enter the environment as a consequence of agricultural activity. Zn and Cu are used in small amounts as
GBR Water Quality 25

fertilisers in some soils deficient in these elements, and As, Cd and Hg are constituents of some fungicides (Hunter 1992). Cu is also used as an algaecide and Cd and Zn occur as contaminants of phosphatic fertilisers (Rayment et al. 1989). Another metallic compound, organotin, has no natural counterparts and is generally introduced into the marine environment through biocide applications, principally as constituents of antifouling paints (Witney 1989). Metals are strongly associated with particulates and enter the marine environment in a similar fashion to organochlorine compounds. They mostly enter the environment via the atmospheric transport of dust and through sediment movement in overland flows and in waterways (Bryan 1971). Additional quantities of metals are also added to the environment via the discharge of effluent and urban stormwater. Particulate metals in suspension and in bottom sediments are not generally directly available to aquatic organisms. The exception to this are sediment bound metals, which can be accumulated following solubilisation in the acidic juices of a sediment-feeder’s gut (Waldichuk 1985). The rates at which metals are solubilised from particulates is dependent on environmental factors including dissolved oxygen concentrations, pH, salinity and temperature (Waldichuk 1985). Once dissolved in the water column, metals may be accumulated by marine invertebrates from solution via passive uptake across permeable surfaces such as gills and the digestive tract (Rainbow 1990). Cellular metal toxicity is primarily due to the chemical inactivation of cellular enzymes responsible for normal organism survival and function (Förstner 1989). Organism growth, reproduction and behaviour are also potentially affected by elevated environmental metal concentrations (Langston 1990).
4.5 Global Atmospheric Changes Naturally occurring gases in the earth’s atmosphere act as a blanket around the earth, and help maintain its temperature. This is known as the greenhouse effect. Since the Industrial Revolution, large quantities of these ‘greenhouse gases’ such as carbon dioxide, methane, and nitrous oxide have been added to the earth’s atmosphere as a consequence of human activity. This has led to an increase in the amount of heat from solar radiation trapped by the earth’s atmosphere, leading to warmer global temperatures (Aplin et al. 1997). Atmospheric carbon dioxide levels are expected to reach double pre-industrial levels by the year 2065 (Houghton 1995). It is predicted that the earth’s temperature will continue to rise by approximately 0.3 o C per decade as a consequence of increased atmospheric concentrations of greenhouse gases (Aplin et al. 1997), and this is estimated to result in an increases in sea temperature of 1-2oC by 2100 (Hoegh-Guldberg 1999). Altered global atmospheric changes have a range of potential impacts on tropical seas including: ¶ Elevated concentrations of carbon dioxide in the atmosphere and dissolved in seawater; ¶ Elevated seawater temperatures; ¶ Sea level rise due to melting polar ice; and ¶ Changed climatic patterns including increased frequency of cyclonic events. Increased carbon dioxide concentrations in seawater enhance the dissolution of calcium carbonate, which makes up the coral skeleton. This may reduce calcification rates in coral species, resulting in weakened skeletons and susceptibility to erosion of coral communities. This may lead to changes in coral community structure, reproduction and overall functioning in coral reef environments (Kleypas et al. 1999). Elevated water temperatures cause corals to be physiologically stressed, which upset the critical balance that maintains their symbiotic relationship with the algae (zooxanthellae) that inhabit the coral. When this occurs, the corals lose their colour, becoming bleached. The recognised biological effects of bleaching are reduced coral growth and calcification, reduced reproductive output and increased mortality (Goreau and MacFarlane 1990; Michalek-Wagner and Willis
26

2000a; 2000b). Corals will die if the stress is prolonged. Coral bleaching is most often associated with a significant rise in sea-surface temperature (Berkelmans and Oliver 1999) and is a well-documented disturbance on reefs (Goreau 1964). Before the 1980s, however, bleaching episodes were generally confined to small areas subjected to identifiable local stresses, such as heavy rainfalls or river discharges, which lowered salinity (Yonge and Nicholls 1931; Goreau 1964). During the past two decades, acute and chronic bleaching of corals, including those of the Great Barrier Reef, has occurred on a dramatically increased scale and intensity and have been predominantly correlated with high sea surface temperature anomalies (reviewed in Hoegh-Guldberg 1999). The ecological consequences of bleaching include shifts in community structure and decreases in both species and habitat diversity (Glynn 1993; Marshall and Baird 1999). Increased seawater levels may have an effect on deep-water corals due to decreased light reaching them, but may be beneficial by permitting coral growth on reef flats. However, rising sea levels will have serious impacts on sand cays and coral reef islands, as rising salt water levels will contaminant freshwater lenses which support terrestrial vegetation in these environments (Wilkinson et al. 1996; Wilkinson et al. 1999). Another atmospheric change expected is the continuing loss of the earth’s ozone layer. The ozone layer absorbs a majority of the ultraviolet light entering the earth’s atmosphere. Ozone is destroyed naturally, but the rate of destruction is being accelerated by the release of chemicals such as chlorofluorocarbons (CFCs) (Aplin 1997). It is expected that this would increase the amount of ultraviolet light reaching earth. Ultraviolet light has a variety of destructive effects on marine life (Jokiel 1980), and it can decrease growth rates in symbiotic zooxanthellae and decrease cellular concentrations of chlorophyll a. It is generally accepted that increased ultraviolet light will increase the severity of a coral bleaching event in the presence of high water temperatures (Hoegh-Guldberg 1999), although increased ultraviolet light will not significantly affect coral reefs under normal temperatures (Wilkinson 1999).
GBR Water Quality 27

Partitioning to bottom
Interstitial water Marine infauna
Higher trophic level biota
Lower trophic level biota
Degradation and/or incorporation into sedimentary record
Suspended Solids
Terrestrial and riverine soil and sediments
LAND
Dissolved phase
MARINE SEDIMENT
MARINE WATERS
Terrestrial dust
ATMOSPHERE
Figure 12. Conceptual model of pollutant movement and partitioning in the marine environment.
28

5 GREAT BARRIER REEF CATCHMENT WATER QUALITY STATUS
Water quality in northern Queensland river systems has been modified by vegetation clearance (including the loss and disturbance of riparian vegetation zones in agricultural areas) and agricultural practices since European settlement. This has altered river flow regimes, as well as river sediment and nutrient concentration and loads.
5.1 Rivers
5.1.1 Water Flows
River flows in all catchments adjacent to the Great Barrier Reef are seasonal and are highly variable between years. Riverine discharge in both wet tropics and dry tropics river systems is dominated by large flood events associated with tropical cyclones and monsoonal rainfall (Mitchell et al. 1997; Mitchell and Furnas 1997). Overall, the largest sediment and nutrient inputs to the Great Barrier Reef originate from the large ‘dry’ catchments of the Burdekin and Fitzroy Rivers, a consequence of their larger average water flows and extensive drainage areas (Moss et al. 1993). However, while the large dry catchments have the greatest average flows, significant flood events only occur episodically at intervals ranging between 1 to 10 years or longer. In contrast, river systems in the wet tropics typically flood several times per year on an annual basis. Forty-six catchments are listed by the Australian Water Resources Council (1987) as draining into the Great Barrier Reef. The smallest is 115 km 2 in area (Whitsunday Island) and the largest is 143,000 km 2 in area (Fitzroy River). On average, specific discharge is highest for the small catchments, a well-known hydrologic phenomenon where the run-off ratio (run-off/ precipitation) is greatest in small catchments (Wasson 1997). Flow variability is important in a number of ways. Geomorphologically, variable flows maintain the complexity of instream environments. In turn, river channel complexity influences the diversity of habitats available for various aquatic organisms and certain ecological processes. Ecologically, flow variability underpins the rates of ecosystem processes and the transport of organisms, nutrients, organic carbon, and other materials within rivers and on the flood plains (Thoms and Sheldon 2000). Alterations of river discharges can ultimately impact estuarine and nearshore seawater salinity regimes. For example, Platten (1997) examined correlations between fishery catch rates on coral reefs offshore from the Fitzroy River and flow volumes emanating from that river. He found a significant correlation between catch rates and flood events, suggesting residual benefits from flood events such as increased reproductive success and recruitment to adult population are occurring in fish stocks. Loss of forests, reduction in vegetation cover and increased drainage areas, as well as road networks and hardened surfaces in urban area produce increased run-off ratios (run-off/precipitation). This in turn causes larger river floods with greater discharge volumes as well as a faster more concentrated discharge patterns. Construction of major dams will result in alterations in the supply of sediment and water, as both become trapped behind the dam wall. Generally dams will decrease the occurrence of high flows and alter the pattern of water delivery. The impact of an altered water regime by dams will result in longer periods of low flow, reduced variability of flows, reduced frequency of small to medium flows and poor quality water from impoundments (Burrows and Butler 1998). Throughout the world, there are numerous examples of river regulation devastating estuarine and marine fisheries resources due to: greatly reduced freshwater flow drastically reducing export of nutrients that forms the basis of food chains; coastal erosion and habitat loss due to reduced sediment supply; and the loss of mangrove habitats due to hyper-saline conditions resulting from restricted freshwater flows. In the Great Barrier Reef catchment there are a combination of impacts. In the dry season, the presence of dams, weirs, water regulation and irrigation result in a reduced dry season flow and
GBR Water Quality 29

may also act to moderate flows to some extent. About 10% of the average annual discharge from the Great Barrier Reef catchment (75 km3) can potentially be captured in existing large reservoirs (Gilbert 2001). However, with the onset of the wet season and extreme flow events, there is the possibility of more water moving off the catchment due to loss of vegetation cover and increased run-off ratios. Downstream effects include larger floods with greater discharge volumes as well as a faster, more concentrated discharge pattern. There have been no analyses of data from the Great Barrier Reef lagoon relevant to this issue (Wasson 1997). However, ongoing research into Sr/Ca ratios and d18O in corals, will help quantify changes to river run-off into the Great Barrier Reef lagoon (McCulloch et al. 1994).
5.1.2 Nutrients
Studies on north Queensland rivers have described the movement and activity of particulate and dissolved nutrients in river water flowing into the Great Barrier Reef lagoon (Mitchell et al. 1991; Mitchell and Furnas 1994: Furnas et al. 1995). Seasonal peak concentrations of dissolved inorganic species are typically associated with the first significant rainfall event of the season, which reflects the mobility of oxidised nutrients built up in the catchment during the dry season. First flush river concentrations can exceed 70mM for NO3 and 1mM for PO4 (Mitchell et al. 1996). Dissolved inorganic nitrogen (DIN) concentrations decline rapidly within the flood plume as flood waters are diluted with seawater further downstream, though there are still relatively high source concentrations of inorganic nutrients entering the Great Barrier Reef lagoon waters. Inorganic concentrations progressively decline over the course of the wet season. Concentrations of dissolved organic N and P remain low and relatively constant through the year. Dissolved organic nitrogen (DON) can decline with increasing discharge, suggesting relatively constant input from the watershed and dilutions during major flood events. Concentrations of particulate nitrogen (PN) and particulate phosphate (PP) vary directly with river flow and typically peak during major seasonal flood events, reflecting the transport of organic matter and soil particles through the watershed (Mitchell and Furnas 1997). Concentrations of DIN are elevated by a factor of 3-50 times in rivers draining to the Great Barrier Reef from highly developed, compared to lightly developed catchments (Figure 13). Concentrations of particulate and dissolved nutrients are also often elevated in flood flows from catchments with substantial agriculture and urban development compared with relatively pristine catchments (Eyre and Davies 1996, Mitchell and Furnas 1997). For example, the Jardine River (in a relatively un-impacted catchment) has DIN concentrations of 4 µM compared with the Johnstone River (in a relatively impacted catchment) that has DIN concentrations of 40-75 µM during high flow conditions. Similarly, the upper Tully River catchment, with largely undisturbed rainforest catchment has maximum DIN concentrations of 1-12µM (Faithful and Brodie 1990, Mitchell et al. 2000). However, the lower Tully River catchment, dominated by sugarcane, horticulture, grazing and urban land uses, has DIN concentrations of 40 µM (Mitchell and Furnas 1997). Analysis of a long-term sampling program in the Tully River has demonstrated an increasing trend in nitrate and particulate nitrogen concentrations over a 13-year period (Mitchell et al. 2000). These trends have occurred at the same time as a substantial expansion of intensive agricultural activity within the Tully area and a large increase in fertiliser use associated with increased cane area and increased banana cultivation.
5.1.3 Sediment Discharges
First-order estimates of total river discharges of sediment from the Great Barrier Reef catchment have been derived from models relating erosion and regional land use patterns (Moss et al. 1993, Rayment and Neil 1997). In these models the importance of the large dry catchments
30

120100806040200
80
70
60
50
40
30
20
10
0
Fitzroy
Burdekin
Tully –upper
Tully –low er
HerbertJohnston
Russell- low er
Russell-upperBarron (low er)
DaintreeA nnanJardine
D
IN c
once
ntra
tions
mM
ol
% pristine catchment
Figure 13. Relationship between DIN (dissolved inorganic nitrogen (nitrate + ammonia)) flood flow concentrations and percentage area of developed catchment within the Great Barrier Reef
catchment (Wachenfeld et al. 1998).
where cattle grazing is the dominant land use is evident. Overall, 66 % of the estimated nutrient and sediment flux is estimated to originate from grazing lands, with 8% from cropping lands and 26 % from ‘pristine’ areas (Neil and Yu 1996a). The flux of sediment is estimated to be 3 to 5 times higher than that prior to European settlement (Moss et al. 1993; Rayment and Neil 1997). Increased sediment supply from land use changes and soil erosion results in greater loads of fine sediment moving out into Great Barrier Reef lagoon areas (Pulsford 1996). However, sediment movement studies (Woolfe et al. 1998) suggest that even with the higher loads of sediment discharged from rivers, inshore reefs are not being subject to higher concentrations of sediment or sedimentation. Typically, high concentrations of sediment fall out of the water column and are trapped in north facing bays. However, combinations of turbidity with eutrophic conditions may adversely impact on reefs more severely than turbidity alone (Fabricius and Wolanski 2000).
5.2 Acid Sulphate Soils Thirty-five confirmed fish kills from acid sulphate soil disturbance have been documented along the north Queensland coast between 1997 and 1998 (Anon 1999a). Nine of these were major events that are expected to have a lasting impact on local regional fishery resources. A majority of these have been attributed to agricultural developments, however, in some incidences urban development may be the primary cause. Low water column dissolved oxygen concentrations were cited as the cause of all incidents. Acidic water draining acid sulphate soils are generally poorly oxygenated, have a low pH and may contain elevated concentrations of heavy metals (Cook et al. 2000). These conditions have the potential to impact fish habitat and behaviour, although the impact on Great Barrier Reef fauna has yet to be quantified (Cook et al. 2000).
GBR Water Quality 31

6 GREAT BARRIER REEF WATER QUALITY STATUS
Measurement of water quality in the Great Barrier Reef region began with the Great Barrier Reef Royal Society Expedition of 1928/29, with further work being completed in the 1960/70s by the Commonwealth Scientific and Industrial Research Organisation (CSIRO). However, extensive water quality data sets only began to be collected after the establishment of James Cook University (JCU), the Australian Institute of Marine Science (AIMS) and the Great Barrier Reef Marine Park Authority (GBRMPA) in Townsville in the 1970s. More recently (from 1992), long-term water quality monitoring programs have been initiated by the Australian Institute of Marine Science and the Great Barrier Reef Marine Park Authority and some published data are also available from these sources (Furnas and Brodie 1996; Furnas et al. 1997; Haynes et al. 1998a; Steven et al. 1998).
6.1 Ambient Great Barrier Reef Water Quality Summaries of long term water quality monitoring data show that concentrations of nutrients over the entire Great Barrier Reef are generally low and do not exhibit dramatic latitudinal and cross-shelf gradients or seasonal variability, except during flood events (Table 4) (Furnas and Brodie 1996; Furnas et al. 1997). However, more recent data have begun to indicate that central inshore Great Barrier Reef waters have higher chlorophyll concentrations than offshore waters. The magnitude and importance of high, outlying concentrations associated with monsoonal cyclones and floods were not considered in these data sets.
Table 4. Ambient levels for physico-chemical parameters in waters of the Great Barrier Reef (Brodie and Christie 2001).
Nutrient species Units Estuaries* Inshore areas GBR Lagoon Outer reef
Nitrogen Total N µM 5-11 Particulate N µM 1.5-5 1-4 0.5-5 Dissolved organic N µM 5-13 2-10 4-7 3-5 Nitrate µM 0.07-0.46 0.01-5 0.02-0.5 0.2-2 Nitrite µM 0-0.42 0.05-5 Ammonium µM 0.2-1.52 0.03-3 0.04-0.8 Phosphorus Total P µM 0.2-2 0.1-2 0.01-0.3 Particulate P µM 0.05-0.3 0.05-0.15 Dissolved organic P µM 0-0.17 0.01-1.5 0.02-1.5 0.05-1 Phosphate (DIP) µM 0.01-0.13 0.02-5 0.02-0.3 Silicate µM 5-32 0.9-20 1-8 0.3-2 Chlorophyll a mg L-1 0.7-3.5 0.05-2.2 0.4-4
*Estuarine include estuaries, enclosed waters and waters less than 1 km from the coast.
32

6.2 Water Column Nutrients and Chlorophyll Dissolved nutrients have a relatively short life span in reef waters as they are actively acquired by phytoplankton. As a consequence, chlorophyll concentration acts as a sensitive, surrogate integrator of phytoplankton biomass and hence, nutrient status of sampled water masses (Bell and Elmetri 1995; Brodie et al. 1996). Forty-eight stations situated along nine inshore to offshore transects are currently sampled monthly (Figure 18) in a Great Barrier Reef wide water quality monitoring program (Haynes et al. 1998a). Data collected has confirmed that chlorophyll a concentrations (and therefore nutrient concentrations) recorded from nearshore waters are significantly higher and more variable than samples collected further from the coast (Figure 19). Central and southern regions have higher average inshore chlorophyll a concentrations than the northern region. The northern catchment area (north of Cooktown) is essentially an undisturbed area with limited cropping activities, and grazing that is characterised by low stocking rates. In contrast, the central and southern catchment areas include both the wet and dry tropics catchments (Burdekin-Haughton and Fitzroy River catchments respectively). Both these catchment areas are characterised by intensive cropping activities in the lower catchments and high cattle stocking rates in inland areas. Fertiliser usage in most of the Great Barrier Reef catchments has increased greatly in recent decades (Pulsford 1996), and this has been strongly linked with elevated nutrient concentrations in the aquatic environment (Mitchell et al. 2000). It is postulated that the increase in fertilised cropping activities in the central and southern catchments may be a principal cause for the higher chlorophyll a concentrations in lagoon waters adjacent to these catchments (Devlin et al. 2001b). However, the time-scale over which monitoring programs have been carried out is, as yet, too short to detect any long-term change in nutrient status of Great Barrier Reef waters (Figure 20) (Brodie et al. 1994; Steven et al. 1998; Devlin et al. 2001b).
6.3 Transport of Pollutants from Catchments to the Sea: Flood Plumes Input of terrestrially derived nutrients, sediments and toxicants into nearshore waters is one of the most important processes directly impacting the inshore Great Barrier Reef. In particular, the productivity of continental shelf and estuarine waters is strongly linked to nutrient flow associated with flood events, with the high inputs of particulate and dissolved matter being an integral part of water column productivity (Bunn and Arthington 1997), species composition and abundance of fish populations (Thorrold and McKinnon 1995). This input mainly occurs via river run-off during periods of large-scale flooding, particularly in the wet (monsoon) season (Hart et al. 1988; Brodie and Furnas 1996; Furnas et al. 1997).
6.3.1 Flood Plume Composition
Although very low nutrient and pollutant concentrations are the norm for the Great Barrier Reef water column for most of the year (Table 4), reef systems are periodically subject to high dissolved nutrient and suspended sediment loads (which are more typical of an eutrophic system) during flood events (Figure 14) (Brodie and Furnas 1996). Concentrations of water quality parameters measured in flood plumes and in close proximity to inshore reefs may be 10-400 fold higher than those present under non-flood conditions (Table 5). Suspended sediment concentrations are also high although higher loads may be generated by resuspension of inshore sediments by southeast winds at other times of the year (Johnson 1996; Woolfe et al. 1998).
6.3.2 Flood Plume Spatial Variability
Figure 15 presents a summary of flood plume distribution in central and southern Great Barrier Reef inshore waters over the last 10 years. It delineates those inshore areas of the Great Barrier Reef that are likely to experience highest frequencies of flood plume waters.
GBR Water Quality 33

Figure 14. Flood plume, Great Barrier Reef catchment.
Table 5. Wet tropics flood plume water quality characteristics, 1994-1999 for cyclone events.
Ambient Cyclone Levels* Sadie Violet Ethel Justin Sid Rona
(non-flood) Date 1979-1994 Feb-94 Mar-95 Mar-96 Mar-97 Jan-98 Feb 99 Section Cairns Central Central Northern Central Central Central Shelf sampled Inshore Lagoon Lagoon Inshore Inshore Inshore Inshore Salinity (ppt) 34.18+0.11 6.4 2.2 12.5 0 0 6.3 NH4 (µM) 0.03+ 0.04 3.6 12.8 3.6 9.3 3.13 NO2 (µM) 0.03+ 0.09 0.3 1.2 1.1 0.3 0.5 0.31 NO3 (µM) 0.08+ 0.36 6.9 14.3 1.3 9.1 4.5 5.27 DON (µM) 4.9 18.4 40.4 9.65 27.1 16.7 12.9 PN (µM) 1.6+ 0.9 10.0 10.3 20.3 19.1 17.8 DIP (µM) 0.07+ 0.27 0.5 0.31 0.6 2.5 0.6 0.33 DOP (µM) 0.30 0.3 2.8 2.7 0.8 1.6 0.36 PP (µM) 0.13+ 0.08 1.3 0.96 0.9 0.96 Si(OH)4 (µM) 12.7+ 11.9 27 112 221 112 167 Chlorophyll a (µg L-1)
0.56+ 0.44 2.2 4.6 2.0 4.6 2.5 2.2
Phaeophytin 0.26+ 0.21 4.2 2.6 1.0 3.0 1.4 (µg L-1)
All concentrations represent surface water concentrations (i.e. <1m) *From Furnas et al. (1995). Annual mean (+SD) salinity and concentrations of nutrients, chlorophyll and suspended solids sampled between 1979 and 1994 for the inshore (<10m depth) central and southern Great Barrier Reef in non-flood conditions.
34

Figures 16 and 17 refine the nearshore islands and reefs of the Great Barrier Reef (excluding the far northern Great Barrier Reef for which there is no data available) that are considered susceptible to regular exposure to flood plumes and their entrained pollutants based on long-term flood plume mapping. They include inshore systems adjacent to the Wet Tropics between Port Douglas and Ingham, and adjacent to the Pioneer and Proserpine Rivers. They also include inshore reefs north of the Fitzroy and Burdekin Rivers. The frequency of plume exposure and the high intensity of agricultural practices in adjacent catchments define the nearshore reefs that are at high risk from catchment flood run-off. Extended periods of exposure to highly turbid and nutrient rich concentrations and low salinity waters contained in flood plumes also pose a significant risk to nearshore seagrass communities. Significant losses of Queensland seagrasses occurred in Hervey Bay in 1992 when a persistent plume of turbid water resulting from floods and cyclonic seas increased local water turbidity for an extended time period (Preen et al. 1995).
GBR Water Quality 35

Figure 15. Frequency of flood plumes over the Wet Tropics area, 1990-2000.
36

Figure 16. Inshore reefs at risk in the: Hinchinbrook Island (a) and Townsville (b) regions.
GBR Water Quality 37

Figure 17. Inshore reefs at risk in the: Whitsunday (a) and Gladstone (b) regions.
38
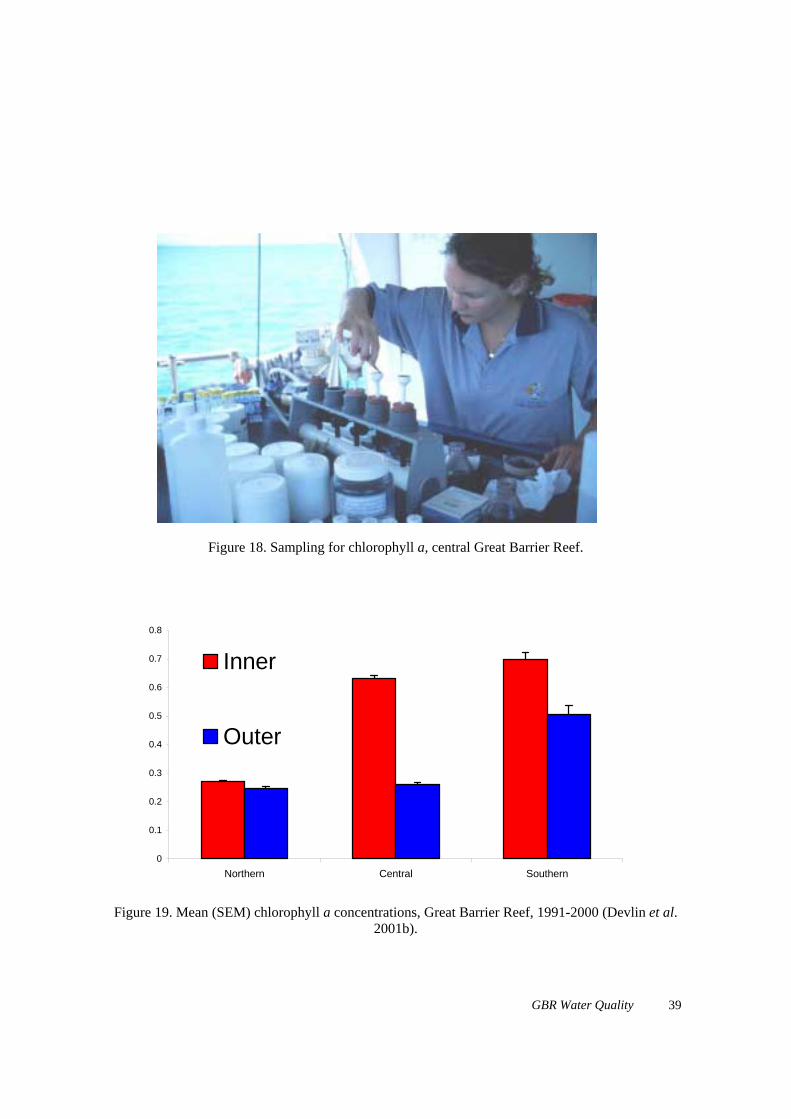
Figure 18. Sampling for chlorophyll a, central Great Barrier Reef.
0
0.1
0.2
0.3
0.4
0.5
0.6
0.7
0.8
Northern Central Southern
Inner
Outer
Figure 19. Mean (SEM) chlorophyll a concentrations, Great Barrier Reef, 1991-2000 (Devlin et al. 2001b).
GBR Water Quality 39

0
0.5
1
1.5
2
2.5
Jan-93M
ar-93M
ay-93Jul-93Sep-93N
ov-93Jan-94M
ar-94M
ay-94Jul-94Sep-94N
ov-94Jan-95M
ar-95M
ay-95Jul-95Sep-95N
ov-95Jan-96M
ar-96M
ay-96Jul-96Sep-96N
ov-96Jan-97M
ar-97M
ay-97Jul-97Sep-97N
ov-97Jan-98M
ar-98M
ay-98Jul-98Sep-98N
ov-98Jan-99M
ar-99M
ay-99Jul-99Sep-99N
ov-99Jan-00
2. Central section
0
0.5
1
1.5
2
2.5
3
3.5
4
Dec-92
Mar-93
Jun-93
Sep-93
Dec-93
Mar-94
Jun-94
Sep-94
Dec-94
Mar-95
Jun-95
Sep-95
Dec-95
Mar-96
Jun-96
Sep-96
Dec-96
Mar-97
Jun-97
Sep-97
Dec-97
Mar-98
Jun-98
Sep-98
Dec-98
Mar-99
Jun-99
Sep-99
Dec-99
INNER OUTER
1. Northern Section
3
3.5
4
INNER OUTER
Figure 20. Mean chlorophyll concentrations over time for the northern (1) and central (2) Great Barrier Reef, 1993-1999 (Devlin et al. 2001b).
40

6.4 Seawater temperature and coral bleaching Bleaching events of varying severity occurred in the Great Barrier Reef in 1980, 1982, 1987, 1992, 1994 and the most severe event occurred in 1998 (Berkelmans and Oliver 1999). The severity of the 1998 event was recorded on a global scale, with bleaching occurring throughout the Pacific region, the Indian Ocean, the Red Sea, the Persian Gulf, the Mediterranean and the Caribbean region (reviewed in Hoegh-Guldberg 1999). Approximately 87% of the inshore reefs of the Great Barrier Reef were affected by this disturbance (Berkelmans and Oliver 1999). The increase in scale and severity of bleaching events is accompanied by evidence for increased frequency of such events (Jones et al. 1997) and has thus led to suggestions that incidences of widespread coral bleaching are a manifestation of global warming (Hoegh-Guldberg 1999). In particular, the 1998 event was associated with elevated sea temperature and high solar radiation and was exacerbated by lowered water salinity in the central and northern Great Barrier Reef.
6.5 Heavy Metals Broadscale surveys have indicated that concentrations of metals present in subtidal sediments are variable along the Queensland coast, and often exceed Australian guidelines for chromium and nickel (Table 6). As many of these samples were collected at locations remote from human influences, it is likely that they are naturally enriched ultramafic igneous rocks and serpentites which can contribute exceptionally high concentrations of these two metals to overlying soils (Lottermoser 1997). Recent work has concluded that mercury concentrations in surface sediments in Bowling Green Bay in the central section of the Great Barrier Reef World Heritage Area are up to three times higher than pre-1850 background concentrations. The majority of this trace metal contamination has been attributed to the downstream transport of mercury used as an amalgam in the gold mining industry
Table 6. Great Barrier Reef nearshore metal concentration ranges compared with Australian sediment metal guidelines (Haynes 2000). (All concentrations mg kg-1).
Metal GBR range for Australian effects Australian effects
nearshore subtidal range low range median sediments (ERL) (ERM) (ANZECC 2000) (ANZECC 2000) Arsenic 0.7-20 20 70 Cadmium 0.5-0.07 1.5 10 Chromium 5-207 80 370 Copper 4-32 65 270 Mercury 0.005-0.07 0.15 1.0 Nickel 5-90 21 52 Lead 2-39 50 220 Zinc 6-117 150 410
GBR Water Quality 41

of northern Queensland at the turn of the 19th century, and through the more recent use of methoxyethylmercuric chloride as a fungicide by the sugar cane industry (Walker and Brunskill 1997; Brunskill et al. 1999). Increases in cadmium and arsenic concentrations in marine sediments in the Hinchinbrook region resulting from the use of phosphatic fertilisers naturally enriched in these elements have been noted adjacent to areas with intensive cropping (Tesiram 1995; Ridd 1999). Marine sediments collected in the vicinity of urban areas are also enriched with a range of metals (Doherty et al. 2000).
6.6 Herbicides Broadscale surveys of sediment herbicide concentrations in nearshore Great Barrier waters during 1998 and 1999 have detected both atrazine and diuron (Haynes et al. 2000a). Atrazine was only detected in sediments collected in the vicinity of the mouth of the Herbert River (0.1-0.3 µg kg-1). In contrast to atrazine, low concentrations of diuron (0.2-10.1 µg kg-1) were found to be widely distributed in marine sediments along the wet tropics coastline between Port Douglas and Lucinda. The herbicide was detected in both subtidal and intertidal samples. Highest concentrations of diuron were detected adjacent to the mouths of the Herbert and Johnstone Rivers. Highest northern Queensland agricultural usage of the herbicide occurs in these two river catchments (Hamilton and Haydon 1996). Based on observed sediment concentrations, partitioning models predicted that chronic water column diuron concentrations near the mouths of most wet tropics rivers are likely to range from 0.1 to 1.0 µg L-1 (Table 7). Concentrations are likely to be higher during monsoon rainfall periods that occur over the summer months as first rainfalls of the wet season flush herbicides from the catchments (November to April). Detection of these levels of diuron contamination are of concern as laboratory trials have indicated that diuron concentrations of less than 1 µg L-1 significantly reduce photosynthetic rates in seagrass commonly found along the Queensland coast (Haynes et al. 2000b). Diuron has also been implicated in dieback of mangrove stands on the central Queensland coast (Duke et al. 2001).
Table 7. Potential Great Barrier Reef diuron water column concentrations (Haynes et al. 2000a).
Location Organic Diuron Diuron (µg L-1) Carbon (µg kg-1) (%) Csoc Koc Cw*
Barron River 0.9 0.4 44 398 0.1 Russell River 1.2 1.6 133 398 0.3 Johnstone River 2.5 10.1 404 398 1.0 Tully River 1.2 1.4 117 398 0.3 Cardwell 1.7 0.8 47 398 0.1 Herbert River 3.4 2.8 82 398 0.2 Lucinda 1.5 1.6 107 398 0.3 Fitzroy River 0.7 0.9 129 398 0.3
* Cw = Csoc (Koc) –1 (Connell 1990) Csoc Concentration in sediments expressed in terms of organic carbon Koc Partitioning coefficient between organic carbon and water Cw Water concentration
42

6.7 Insectides Broadscale surveys have also detected the pesticides lindane, dieldrin and DDT (and its breakdown product DDE) in nearshore marine samples collected along the Queensland coast in 1998 and 1999 (Haynes et al. 2000a). Dieldrin was detected in sediments collected from the mouth of both the Barron and Johnstone Rivers (0.09-0.37 µg kg-1) and in sediments from Halifax Bay (0.05 µg kg-1). Dieldrin was a widely distributed contaminant of Queensland waterways and estuaries in the past (Clegg 1974; Kannan et al. 1995; Russell et al. 1996c; Rayment et al. 1997). It is still consistently detected in crabs (Scylla serrata) collected from estuaries adjacent to agricultural catchments between Moreton Bay and Cairns (Mortimer 2000), although concentrations present in freshwater fish have declined by an order of magnitude between the 1970s and 1990s (Russell et al. 1996c). Dieldrin is also detectable in marine fish tissue (liver) collected from the central Queensland coast adjacent to agricultural activity (von Westernhagen and Klumpp 1995). Where dieldrin was detected, its sediment concentration exceeded both the low effects range (ER-L) and median effects range (ER-M) for observed biological impacts (Kennicutt et al. 1994) to marine sediment infauna (Table 8). As a consequence, it may present a localised threat to nearshore marine organisms along the wet tropics Queensland coast (Haynes et al. 2000a). DDT and its metabolites (DDE) were detected in low concentrations at the mouth of the Barron, Johnstone, Tully, Burdekin and Fitzroy Rivers and in Halifax Bay (Haynes et al. 2000a). Concentrations of DDE exceeded those of DDT at all sampling sites. Low concentrations of DDT and its metabolites have been detected in agricultural soils in the Herbert and Burdekin areas (Cavanagh et al. 2000) and DDT has been consistently detected in crabs (Scylla serrata) collected from Queensland estuaries adjacent to agricultural catchments (Mortimer 2000). Concentrations of DDT have declined in freshwater fish collected in northern Queensland waterways over the last 20 years (Russell et al. 1996c).
Table 8. Comparison of ER-L and ER-M concentrations and Great Barrier Reef sediment pollutant concentrations (Haynes et al. 2000a).
Compound GBR intertidal GBR subtidal ER-L1 ER-M1
sediment range sediment range (mg kg-1) (mg kg-1) (mg kg-1) (mg kg-1)
Atrazine <0.5 <0.1-0.3 Diuron <0.5-1.7 <0.1-10.1 Lindane <1.0 0.19 Dieldrin <1.0 <0.05-0.37 0.02 8 DDT <1.0 0.05 1 7 DDE <1.0 0.26 2 15 äDDT <1.0 0.31 3 350 1(Kennicutt et al. 1994)
GBR Water Quality 43

Lindane was only detected in sediments from the vicinity of the mouth of the Johnstone River. Lindane has not been detected in water or riverine sediment samples collected in the Johnstone catchment in the 1990s (Hunter et al. 1999). However, the pesticide is still detectable in northern Queensland agricultural soils and in sediments from irrigation drains (Cavanagh et al. 1999; Müller et al. 2000). Its limited distribution in nearshore sediments may, in part, be due to its relatively high vapour pressure and rapid volatilisation in tropical regions (Chessels et al. 1988; Kannan et al. 1995).
6.8 Pollutants in Marine Mammals Tissue samples of liver and blubber were salvaged from fifty-three dugong (Dugong dugon) carcasses stranded along the Queensland coast between 1996-2000 (Figure 22) (Haynes et al. 2001a). Liver tissue was analysed for a range of heavy metals and blubber samples were analysed for organochlorine compounds and polychlorinated biphenyls. Metal concentrations were similar in male and female animals and were generally highest in mature animals. Liver concentrations of chromium, copper, iron, nickel and zinc were often higher than concentrations usually present in marine mammals. Liver concentrations of chromium, mercury and nickel were also elevated in a number of animals collected from the wet tropics coastline of northern Queensland (Ingham to Cairns) and/or from Hervey Bay (southern Queensland) in comparison to levels previously reported in Australian dugong. Dieldrin, DDT (and its breakdown products) and/or heptachlor-epoxide were detected in 59% of dugong blubber samples. Concentrations of organochlorines were similar to those reported being present in dugong 20 years earlier, and were low in comparison to concentrations recorded from marine mammal tissue collected elsewhere in the world (Haynes et al. 2001a). Concentrations of octachlorinated dioxin were found to be high in dugong fat tissue compared with concentrations detected in marine mammals elsewhere (Figure 23) (Haynes et al. 1999). Polychlorinated dibenzodioxins (PCDDs) appear to be the most significant organochlorine pollutant bioaccumulated in dugong, with the most important consequences of coastal contamination for Great Barrier Reef dugong populations are likely to be indirect through herbicide impacts to their nearshore seagrass food resource (Haynes et al. 2001a).
6.9 Dioxins
Concentrations of 2,3,7,8 substituted dioxins and furans (PCDDs and PCDFs) were determined in sediment samples collected from sites along the east-coast of Queensland in northern Australia in 1998 (Müller et al. 1998; Müller et al. 1999; Gaus et al. 2001). PCDDs were detectable in all sediment samples while PCDFs were comparatively uncommon (Table 9). The results provide evidence that an unidentified source for higher chlorinated PCDDs exists along the Queensland coast (Müller et al. 1999).
44

NN
0 100 200 300 400
Kilometres
a
arine Park(Area: 339 750 sq km)
Q U E E N S L A N D
PAPUA NEW GUINEA
C O R A L S E A
BRISBANE
Bundaberg
GladstoneRockhampton
Mackay
Ingham
Townsville
Cairns
Ayr
Yeppoon
Proserpine
Bowen
Innisfail
Tully
Port Douglas
LockhartRiver
Port Moresby
Hervey Bay
Nambour
Cooktown
15°S
10°S
145°E 150°E
145°E 150°E
20°S
25°S
10°S
15°S
20°S
25°S
Tropic of Capricorn (23°26.5’S)
BRA Q201 1998
17°30'S147°00'E
10°41'S145°00'E
13°00'S145°00'E
15°00'S146°00'E
21°00'S152°55'E
24°30'S154°00'E
FAR NORTHERNSECTION(Area: 85 050 sq km)
CAIRNS SECTION(Area: 35 500 sq km)
CENTRAL SECTION(Area: 75 850 sq km)
MACKAY / CAPRICORNSECTION
(Area: 143 000 sq km)
GUMOO WOOJABUDDEESECTION
(Area: 350 sq km)
Bamaga
Thursday Island
2
1
1
1
10
3 4
7
14
9
3
GREAT BARRIER REEF Great Barrier Reef World Heritage Are
(Area: 347 800 sq km)
Great Barrier Reef M
GREAT BARRIR REEF Carcass sampling site and sample number
Figure 21. Dugong carcass stranding locations, 1996-2000 (Haynes 2000).
GBR Water Quality 45

Figure 22. Dugong carcass tissue sampling, Townsville, April 1999.
201
18 2865
3 320 12 14
97
0
50
100
150
200
250
Dugon
g
Fur se
al
Common
seal
Ringed
seal
Harp se
al
Balkal
seal
Killer w
hale
Dall's
porpo
ise
Hector
s dolp
hin
Harbou
r porp
oise
OC
DD
(pg/
g)
Figure 23. Marine mammal OCDD concentrations (Haynes et al. 1999).
46

Table 9. Concentrations of 2,3,7,8 substituted PCDD and PCDF congeners in Great Barrier Reef sediment (Müller et al. 1999).
Congener Newry Bay Upstart Bay Pallarenda Cardwell Flinders Is
(pg g-1 TOC) PCDD's 2,3,7,8-TCDD 15 <13 <13 <2.7 <4.2 1,2,3,7,8-PeCDD 66 <13 47 18 21 1,2,3,4,7,8-HxCDD 150 <25 60 55 44 1,2,3,6,7,8-HxCDD 240 <25 140 82 67 1,2,3,7,8,9-HxCDD 440 50 190 170 170 1,2,3,4,6,7,8-HpCDD 9 100 840 4 100 3 500 1 700 OCDD 190 000 17 500 87 000 130 000 26 000 PCDF's 2,3,7,8-TCDF 4.8 <13 <6.7 2.3 <1.4 1,2,3,7,8-PeCDF <13 <13 <13 <1.8 <4.2 2,3,4,7,8-PeCDF <3.2 <5.0 <6.7 <0.9 <1.4 1,2,3,4,7,8-HxCDF <3.2 <13 <13 <1.8 <1.4 1,2,3,6,7,8-HxCDF <4.8 <1.3 <13 <1.8 <1.4 1,2,3,7,8,9-HxCDF <4.8 <6.3 <13 <0.9 <1.4 2,3,4,6,7,8-HxCDF <6.5 <13 <13 <1.8 <4.2 1,2,3,4,6,7,8-HpCDF 15 <13 73 14 <2.8 1,2,3,4,7,8,9-HpCDF <1.6 <5.0 <6.7 0.9 <1.4 OCDF 29 <13 170 55 6.9 TEq (pre 1997) 420 63 210 210 88 S PCDDs/PCDFs 210 000 18 000 91 000 140 000 28 000
GBR Water Quality 47

7 SHIPPING MOVEMENT AND ASSOCIATED POLLUTION ISSUES
Five of Queensland’s six major trading ports for the export of primary products and commodities are located adjacent to, or within, the Great Barrier Reef World Heritage Area at Cape Flattery, Mourilyan, Lucinda, Abbott Point and Hay Point. Other major ports adjacent to the Great Barrier Reef World Heritage Area include Cairns, Townsville, Port Clinton and Gladstone. These ports handle major imports and exports and service regional population centres. The ports of Cairns, Gladstone, Hay Point near Mackay, and Townsville facilitate the bulk of shipping movement with each recording over 500 vessel arrivals for 1994/5 (Table 10).
Table 10. Shipping arrivals and piloted arrivals by ports in the Great Barrier Reef World Heritage Area 1985/6 to 1994/5 (Anon 1996).
Year 1985-86 1985-86 1987-88 1987-88 1989-90 1989-90 1991-92 1991-92 1993-94 1993-94 1994-95 1994-95
Port Total arrivals
Piloted arrivals
Total arrivals
Piloted arrivals
Total arrivals
Piloted arrivals
Total arrivals
Piloted arrivals
Total arrivals
Piloted arrivals
Total arrivals
Piloted arrivals
~ Number ~
Hay Point 419 419 495 495 452 452 519 519 556 556 599 599 Gladstone 506 396 560 411 588 441 737 520 711 504 771 555 Townsville 291 267 374 351 387 352 352 328 547 518 606 544 Cairns 242 96 378 178 385 182 425 186 448 190 585 279 Mackay 134 123 125 114 147 133 100 86 153 134 174 153 Abbot Point 64 64 80 80 82 82 81 81 63 63 76 76 Port Alma 55 46 58 50 66 63 70 60 57 46 70 62 Cape Flattery 36 - 23 23 35 35 40 40 46 46 51 51 Mourilyan 27 27 32 29 25 25 25 25 35 35 37 37 Bundaberg 53 37 48 19 41 14 42 20 50 25 48 33 Lucinda 28 28 23 23 19 19 16 16 26 26 22 22 Thursday Island 206 17 321 51 163 30 193 41 103 1 112 13 Port Douglas - - - - - - - - 1 1 5 5 Cooktown - - - - - - 1 1 2 2 - - Total 2061 1520 2517 1824 2390 1828 2601 1923 2798 2147 3156 2429 (a) Total arrivals are the number of vessels arriving at Queensland ports; (b) Piloted arrivals are the number of piloted vessels arriving at Queensland ports.
7.1 Shipping Movement There are approximately 3000 shipping movements of large vessels (>50 metres in length) within the Great Barrier Reef every year (Huggett and Storrie 2000). About two thirds of these use the inner shipping route with the rest entering or departing through Hydrographers, Palm or Grafton Passages (Figure 24). Bulk carriers comprise the largest proportion of shipping which is consistent with the large amount of trade passing through the bulk ore ports of Hay Point, Abbot Point and Gladstone. Only five percent of shipping consists of oil tankers, most of which are on northerly transits carrying refined product. Ships transiting the inner shipping route carry a wide range of cargoes including bauxite and alumina, manganese, iron ore, coal, sugar, general container freight and oil.
48

NN
0 100 200 300 400
Kilometres
GREAT BARRIER REEFWORLD HERITAGE AREA
Principal Shipping Routes World Heritage Area boundary
Shipping route
Q U E E N S L A N D
PAPUA NEW GUINEA
C O R A L S E A
BRISBANE
Bundaberg
GladstoneRockhampton
Mackay
Ingham
Townsville
Cairns
Ayr
Yeppoon
Proserpine
Bowen
Innisfail
Tully
Port Douglas
LockhartRiver
Port Moresby
Hervey Bay
Nambour
Cooktown
15°S
10°S
145°E 150°E
145°E 150°E
20°S
25°S
10°S
15°S
20°S
25°S
Tropic of Capricorn (23°26.5’S)
Map No. C045/98
Bamaga
Thursday Island
GraftonPassage
Palm Passage
Hydrographers Passage
Figure 24. Great Barrier Reef shipping transit routes.
GBR Water Quality 49

Ships transiting the inner route fall into several categories: ¶ international through traffic not visiting Australian ports; ¶ foreign flagged trading vessels visiting Australian ports; ¶ Australian flagged vessels trading overseas; ¶ Australian coastal traders; and ¶ international and Australian non-commercial traffic (e.g. yachts, motor cruisers, tourist and
naval vessels). Implementation of the Ship Reporting System (REEFREP) in 1997 has provided the first complete picture of the numbers and type of vessels using the Great Barrier Reef inner route, and more importantly, also entering and departing the Great Barrier Reef through Hydrographers, Palm and Grafton Passages.
7.2 Shipping Incidents and Pollution Two hundred and sixty shipping and boating incidents were recorded for Great Barrier Reef World Heritage waters in the 10-year period between 1987 and 1997 (Figure 25; Table 11). These incidents included ship groundings, oils and diesel spills, as well as vessel sinkings. All these incidents have some potential to result in marine pollution.
Table 11. Shipping incidents recorded for the Great Barrier Reef, 1987-1997.
Incident Number Fire (salvaged) 1 Grounded (refloated) 17 Grounded (not refloated) 8 Vessel sinking 42 Vessel spills not associated with above
192
7.2.1 Ship Contaminants
Ship groundings have the potential to release large, concentrated quantities of antifoulant chemicals including tributyl tins (TBT) and copper into reef environments. Since 1995 there have been five large vessel groundings within the Great Barrier Reef Marine Park (Figure 26). These were: ¶ March 1995: Carola grounded on South Ledge Reef (Far Northern Section). The vessel was
re-floated after six hours; ¶ June 1995: Svendborg Guardian grounded on Kurramine Beach (south of Cairns). The
vessel was undamaged and refloated after 12 hours; ¶ July 1996: Peacock grounded on Piper Reef and remained aground for 8 days (Figure 26).
The vessel was successfully refloated; ¶ May 1999: New Reach ran aground on Heath Reef. Ship successfully refloated; and ¶ November 2000: Bunga Terati Satu grounded on Sudbury Reef in November 2000. The
vessel was successfully refloated.
50

Figure 25. Marine incidents in the World Heritage Area, 1987-1997.
GBR Water Quality 51

Figure 26. Cargo ship Peacock aground on Piper Reef, 1996.
Deposition of antifoulants at ship grounding sites and at mooring sites and slipways represents a significant risk to marine life. Antifoulants are used on ship hulls for their biocidal properties to control marine fouling and rely predominantly on combinations of copper and tributyltin (TBT) (Witney 1989). TBT is considered the most effective antifoulant to date; the lifespan of organotin antifoulants is seven years in comparison with two to three years for copper based paints (Bosselmann 1996). On leaching from antifouling paints, tributyltin and copper are directly available in the water column. TBT is moderately hydrophobic and after entering the aquatic environment is rapidly sorbed onto suspended particulate matter, sediments and seagrass (Kelly et al. 1990a; Kelly et al. 1990b; Harris et al. 1996). Copper is also rapidly sorbed to particulates and sediments (Hall and Anderson 1999). TBT is moderately persistent in sediment, with a half-life of months to years, being longer under anaerobic conditions (Maguire 1987; Seligman et al. 1996). Copper also tends to accumulate in the sediment where it remains for indefinite periods until released and made available for uptake by marine organisms, either passively across membranes, or through the gut wall following sediment ingestion (Hall and Anderson 1999). Bioturbation, dredging, storms, anchors, and boat movement can all mobilise sediments and release antifouling contaminants back into the water column. TBT affects cell metabolism by causing malformations of the cell membranes (Alzieu 1996), adversely affecting biological functions such as growth, development, reproduction and immune response (Bryan and Gibbs 1991). Antifouling contaminants are non-specific and are toxic above threshold concentrations to many non-target marine organisms. The most sensitive organisms are molluscs, in which TBT concentrations less than 1ng L-1 can cause imposex (development of male genitalia in female animals) in gastropods (Bryan and Gibbs 1991). TBT toxicity has also been recorded for a diverse range of organisms including oysters, corals
52

(Allemand et al. 1998) and anemones (Mercier et al. 1996). High levels of TBT have also been detected more recently in marine mammals (Iwata et al. 1994). The consequences of this are unknown. Copper, while a biologically essential heavy metal, becomes toxic in elevated concentrations (Olsgard 1999). It exerts toxicity by the chemical inactivation of cellular enzymes (Förstner 1989) causing interference with critical life functions of organism growth, reproduction and behaviour (Langston 1990; Hall and Anderson 1999). Copper can adversely affect fertilisation rates of coral gametes (Reicheld-Brushett and Harrison 1999) and be bioaccumulated by molluscs (Olsgard 1999). However, marine mammals tend to actively regulate copper concentrations (Thompson 1990). Recent surveys of antifoulant concentrations in the central and northern Great Barrier Reef have detected elevated levels of both copper and TBT in several commercial harbours and marinas in the region (Table 12 and 13) (Haynes and Loong 2001). Copper concentrations present at the Cairns and Townsville commercial harbour sites, and marina sites at Townsville and the Whitsundays exceeded ANZECC guidelines (2000). Sites away from the mainland were found to be uncontaminated with either of these compounds, and it is likely that only areas where ships are either berthed for extended time periods or are slipped and antifouled will be polluted by these compounds (Haynes and Loong 2001).
Table 12. Range of sediment TBT concentrations in the northern and central Great Barrier Reef, 1999 (Haynes and Loong 2001).
Port Douglas Cairns Townsville Whitsundays
Mainland port Na* <1-1275 <1-18 <1-4.1 Mainland marina <1 <1-5.5 <1-4.2 <1 Offshore island jetty <1 <1 <1 <1 Outer reef pontoon <1 <1 <1 <1 All concentrations µg g-1 dry wt. *No commercial harbour is present at Port Douglas
Table 13. Mean (Standard Deviation) sediment copper concentrations in the northern and central Great Barrier Reef, 1999 (Haynes and Loong 2001).
Port Douglas Cairns Townsville Whitsundays
Mainland port na *1 70 (61) 113 (105) 7 (6) Mainland marina 9 (5) 33 (1) 72 (7) 34 (24) Offshore island jetty 20 (1) 20 (1) 11 (8) 12 (8) Outer reef pontoon 20 (2) 20 (1) 22 (1) 21 (0) All concentrations µg g-1 dry wt. *1 No commercial harbour is present at Port Douglas
GBR Water Quality 53

Concentrations of TBT have also been measured at two Great Barrier Reef ship-grounding sites at Heath Reef, in the far northern section of the Great Barrier Reef, and at Sudbury Reef, in the Cairns Section. The vessel New Reach ran aground in May 1999, at Heath Reef (Haynes and Loong 2001). The ship grounding resulted in grossly elevated concentrations of TBT being deposited on the reef flat in the vicinity of the grounding (7500-340,000 ng Sn g-1 dry wt). It is likely that the high concentrations of TBT at the site were caused by abrasion and direct deposition of antifoulant onto the reef substrate. The cargo ship Bunga Teratai Satu ran aground on Sudbury Reef in November 2000 (Haynes et al. 2001b). Sediment concentrations of TBT ranged from <1- 17,000 ng Sn g-1, with the highest concentrations of TBT detected in, and within 5 metres of the vessel grounding scar. No TBT was detectable 1000 m away from the grounding site. Sediment concentrations of TBT exceeded ANZECC (2000) guidelines up to 300m from the grounding site. Concentrations of copper (972-21700 mg kg-1 dw) and zinc (1170-192400 mg kg-1 dw) in the grounding scar also exceeded draft ANZECC (2000) sediment guidelines, and were at concentrations likely to present a significant risk to to the local environment. Concentrations of copper and zinc were at background concentrations within 10 metres of the grounding scar. The high toxicity of TBT to coral reef organisms has been documented (Maguire 1984; Mercier et al. 1996; Allemand et al. 1998) and the levels present on Heath Reef and Sudbury Reef are likely to be an ongoing impediment to coral re-establishment.
7.2.2 Oil Spills
Polycyclic aromatic hydrocarbons (PAHs) are natural constituents of crude oil and are a mixture of organic compounds of fossil and biogenic origin. PAHs account for 20% of total hydrocarbons in crude oil and are the most biologically toxic of all the petroleum compounds (Neff 1990). Generally, during oil spill a mixed petroleum product containing a broad spectrum of hydrocarbon classes is released to the marine environment where it may affect a variety of biological processes and is a potent cell mutagen and carcinogen (Capone and Bauer 1992). Worldwide, major inputs of petroleum into the marine environment occur via the following (Anon 1997): ¶ industrial discharge and urban run-off (37%); ¶ vessel operations (33%); ¶ tanker accidents (12%); ¶ atmospheric deposition (9%); ¶ natural seepage (8%); and ¶ exploration production (2%). The fate of petroleum hydrocarbons, once they enter the marine environment, is similar to that of many organic pollutants. The bulk of the petroleum initially introduced into the water column rapidly becomes associated with hydrophobic organic matter and suspended particulates, the volatile compounds then evaporate and the non-volatiles are deposited into the sediment. The component of petroleum left, the emulsion, is not likely to dissolve, adsorb, evaporate or be rapidly biologically degraded and will eventually sink to the bottom and settle in the sediment. While the lighter fractions are suspended in the water column, the most damaging impacts are on larvae and low motility organisms that cannot escape the oil. Typical impacts include changes in feeding or reproductive cycles that ultimately affect population size and fecundity. Once the PAHs have settled in the sediment, filter feeders and benthic organisms are affected with the bioaccumulation of toxic compounds into their tissues, and with genetic mutations and cell degeneration occurring (Peters et al. 1997). One hundred and ninety two minor oil spills were recorded for the World Heritage Area between 1987 and 1997 (Table 14; Figure 27).
54

Table 14. Number of oil/fuel spills reported in the Great Barrier Reef (1987-1997).
Type of Spill Number of Recorded Incidents Diesel 31 Light fuel 11 Oil 62 Tar 4 Debris 3 Bilge/Ballast Water 7 Unidentified 28 Uncertain spill incident TOTAL
81
192
Figure 27: Oil Spills in the Great Barrier Reef region, 1994-1998.
GBR Water Quality 55

7.2.3 Litter
Dumping of rubbish and other debris from ships into the marine environment has become an increasingly serious problem worldwide (Ross et al. 1991). Discarded debris can have a range of environmental consequences. It can entangle wildlife and cause limb amputation and/or death through drowning or strangulation in larger marine animals. Debris can also be ingested and cause internal blockages and result in starvation or other complications, particularly in animals such as turtles (Laist 1987; Beck and Barros 1991; Hutchinson and Simmonds 1991; Slip and Burton 1991; Lucas 1992). There are also economic impacts of debris and rubbish accumulation on beaches. These include the loss of aesthetic values in recreational areas that are reliant on tourism-generated income (Corbin and Singh 1993; Garrity and Levings 1993; Faris and Hart 1994). The fishing industry may also be impacted through the loss of fish catches to abandoned or lost fishing gear (Dixon and Dixon 1981; Jones 1995). Twelve far northern zone vegetated sand cays and three continental islands were surveyed for stranded debris during June 1996 (Haynes 1997), and several surveys of subtidal litter associated with underwater rubbish cleanups were carried out at Butterfly Bay, Whitsundays, since 1996 (Malcolm et al. 1999). A range of rubber, plastic and glass artefacts were commonly found on far northern sand cays and islands (Table 15). The majority of glassware observed consisted of alcoholic drink-bottles and neon and incandescent light globes. Rubber footwear (thongs) comprised the majority of rubber debris and small fishing net floats and fragmented packing cases were the source of most polystyrene debris. The most commonly encountered metal and aluminium debris were aluminium drink cans and aerosol spray-cans. Fishing netting, rope fragments and plastic bags were also found at many sites, but they were present in low densities (Table 15). Densities of plastic, rubber and polystyrene debris were much higher per length of beach on continental islands than on sand cays as surveyed island beaches were surrounded by rocky cliffs that tended to concentrate stranded debris and prevent wind driven re-mobilisation. Lost or abandoned fishing gear and food and drink containers comprised the majority of litter present at subtidal sites in the Whitsundays (Malcolm et al. 1999). Intertidal and subtidal littering appeared to be a combination of intentional littering by throwing items overboard as well as a consequence of items lost over the sides of boats.
Table 15. Number of intertidal debris items recorded in the Far Northern Great Barrier Reef, 1996 (Haynes 1997).
Debris type No. of items
recorded Debris type No. of items
recorded Plastic 980 Rope and Netting 57 Rubber 563 Aluminium 29 Glass 366 Metal 21 Polystyrene 245 Other 9
56

7.3 Ballast Water Ballast water is used to alter the draft trim and stability of a ship during cargo loading and unloading operations at port and at sea. Typically 30-40% of a vessels deadweight tonnage can be carried as ballast water, although large bulk carriers may be as much as 60% of deadweight tonnage (AQIS 1993). Introduction of exotic marine species via ships’ ballast water has become a major environmental concern as it poses threats to local biodiversity, fisheries and aquaculture. Queensland’s fourteen trading ports are estimated to receive discharges of over 30 million tonnes of ballast water each year (Table 16) (Hilliard and Raaymakers 1997). The number of exotic marine “pests” introduced to Australian waters via ballast water discharges and ship hull fouling has been reported to be more than 250 species of introduced algae, invertebrates and fish (SCC/SCFA 1999).
Table 16. Estimates of ballast water discharged to Great Barrier Reef ports (Hilliard and Raaymakers 1997).
Port Number of
ships Ballast water discharged
(tonnes) Hay Point 439 14,000,000 Gladstone 267 4,300,000 Abbot Point 67 2,000,000 Townsville 64 650,000 Mackay 34 280,000 Cape Flattery 27 430,000 Cairns 27 225,000 Mourilyan 25 194,000 Lucinda 17 168,000 Bundaberg 8 65,000 Port Alma 6 17,000
Fifteen introduced species have been recorded for Queensland ports. These include a single species of sponge, three species of isopod, one gastropod species, one nudibranch species, two bryozoan species, five ascidians and two fish species (Hilliard and Raaymakers 1997). There are also 15 cryptogenic species that are taxonomically poorly known and may be cosmopolitan in distribution and of uncertain introduction status. Although untreated ballast water discharged into Australian ports has a virtually 100% chance of containing at least one pest species, the chance that the discharge contains sufficient individuals of a species able to become established in the discharge port is more remote (Hilliard and Raaymakers 1997). A majority of overseas bulk carriers arrive in Queensland ports from Korea and Japan, and pose a relatively low risk of introducing a pest species. As they originate from ports that contain relatively cool waters, pest species would not be expected to survive in Queensland tropical waters (Hilliard and Raaymakers 1997). The exceptions are shipping arriving from the southern Japanese ports, and ports in Singapore and Taiwan. These ports are all located in warmer waters and present a greater risk to sourcing species with the ability to survive in warmer tropical waters and become a local pest.
GBR Water Quality 57

7.4 Risk Assessment of Oil and Cargo Spills Oil spillage from a large vessel represents the single biggest point source pollution threat to the Great Barrier Reef World Heritage Area. A risk assessment was conducted for determine areas at high risk of an oil spill (Huggett et al. 2000). The assessment took into account navigational difficulty, accident history and environment vulnerability. The assessment identified five areas within or adjacent to the Great Barrier Reef that are considered to be at high risk (Figure 28; Table 17).
Table 17. Critical Great Barrier Reef risk areas from shipping incidents
Location Type of Incident Likely
Torres Strait Grounding or collision Inner route north of Cape Flattery Grounding or collision Cape Flattery Contact Whitsunday Islands Grounding or collision Hydrographers Passage Grounding
The contributing factors to the classification of high risk of oils spills and their consequences to the Great Barrier Reef World heritage Area were: Torres Strait ¶ Shallow water region with extensive shoals, banks and reefs; ¶ Subject to strong currents and tidal streams; ¶ Subject to strong trade winds and exposure to severe weather at times; ¶ A complex tidal regime making under keel clearance (UKC) calculations critical; ¶ Navigational complexity; ¶ A narrow channel in parts with limited sea room with the channel being 800 metres wide in
parts; ¶ A high concentration and diversity of traffic, including large tankers, bulk carriers,
container ships, cruise ships, fishing vessels, recreational craft; ¶ Important marine habitats including seagrass beds, coral reefs and an extensive dugong
habitat; ¶ Area contains a large prawn and lobster fishery; ¶ A significant breeding ground for numerous species; ¶ A high diversity of marine life; ¶ High cultural significance and indigenous dependency.
58

Figure 28. Oil spill risk map of the Great Barrier Reef.
GBR Water Quality 59

Inner Route North of Cape Flattery, including port of Cape Flattery ¶ Shallow water regions with extensive shoals, banks and reefs; ¶ Subject to strong tidal streams and currents; ¶ Subject to strong trade winds and exposure to severe weather at times; ¶ Navigational complexity with numerous turning points and limiting depths; ¶ A narrow channel in parts with limited sea room; ¶ A high concentration and diversity of traffic, including tankers, bulk carriers, container
ships; ¶ A high concentration of fishing vessels and small craft especially at night; ¶ Important marine habitats including mangroves, seagrass and coral reefs; ¶ Important marine animals including Dugong and Turtles; ¶ High cultural significance; ¶ World renowned particularly sensitive sea area; ¶ A difficult berthing manoeuvre at Cape Flattery; ¶ World Heritage Area and Marine Park. Whitsunday Islands ¶ Subject to extremely strong tidal streams and currents, including cross currents; ¶ Subject to strong trade winds; ¶ A high concentration of cruise ships transiting close inshore; ¶ Navigational complexity; ¶ A high concentration of commercial and recreational small craft, including significant cross
traffic; ¶ Important marine habitats including seagrass, mangroves and fringing coral reefs; ¶ A primary attraction for the tourism industry; ¶ High socio-economic value; ¶ High recreational and commercial asset. ¶ World Heritage Area and Marine Park. Hydrographers Passage ¶ Subject to extremely strong tidal streams and currents, including cross currents; ¶ Subject to strong trade winds and exposure to severe weather at times; ¶ Navigational complexity; ¶ A high concentration of large bulk carriers; ¶ A very narrow channel (1nm) with extremely limited sea room; ¶ Extensive coral reefs; Improved navigation practices (better charts and improved navigation technology) in addition to increased response capability to deal with major oils spills will help protect the Great Barrier Reef.
60

8 CURRENT INSTITUTIONAL AND POLICY ARRANGEMENTS FOR WATER QUALITY MANAGEMENT
The Great Barrier Reef Marine Park Authority is a Commonwealth Government statutory authority, and is responsible for the management of the Great Barrier Reef Marine Park under the Great Barrier Reef Marine Park Act. Under this Act, declared in 1975, the Great Barrier Reef Marine Park was proclaimed. In 1981, the Great Barrier Reef was listed as a World Heritage Area, which meant that any development must take into account potential impacts on the World Heritage values of the Great Barrier Reef. The Authority operates in partnership with Queensland Government agencies to ensure that the World Heritage values of the Great Barrier Reef are preserved and protected for future generations. The following chapter details the responsibilities of the agencies and the relevant policies and the legislation governing the management of the Great Barrier Reef Marine Park.
8.1 Governance and Legislation
8.1.1 Commonwealth Regime
The vast majority of the Great Barrier Reef World Heritage Area is managed through the provisions of the Great Barrier Reef Marine Park Act 1975, the Great Barrier Reef Marine Park Regulations 1983, GBR Section Zoning Plans and most recently, Plans of Management for specific areas of the Great Barrier Reef Marine Park. The Act, Regulations and other regulatory tools have evolved over the last 25 years to incorporate the world's best environmental practices into management of the Great Barrier Reef Marine Park. Whilst plenary rights for land and water management remain with the Queensland Government, the head of power is vested in the Commonwealth to ensure the values of environmentally sustainable development are implemented. The Commonwealth Environment Protection and Biodiversity Conservation Act (1999) provides for assessment and approval of developments that may have a significant impact on the Great Barrier Reef World Heritage Area’s values. The Great Barrier Reef Marine Park Act (1975), Section 66 2(e), also provides for the regulation of discharges that may impact upon plants and animals of the Great Barrier Reef Marine Park. For example, under this provision, regulations were proclaimed, to regulate aquaculture effluent discharges into waters that drain into waters of the Great Barrier Reef Marine Park. The Great Barrier Reef Ministerial Council was established in 1979 under the Great Barrier Reef Marine Park Act to coordinate policy development between the Commonwealth and Queensland Governments. The Ministerial Council is presently made up of two Commonwealth Ministers and two Queensland Ministers. The chairperson is currently (2001) the Commonwealth Minister for Environment and Heritage.
8.1.2 Queensland Regime
Queensland has approached the management of water quality with regard to point source and non-point source pollution primarily through regulation, planning and assessment instruments. One important instrument is the Environmental Protection Act 1994 (QEP Act) administered by the EPA. Point source pollution is addressed through the assessment of 'environmentally relevant activities' under QEP Act. Activities with point discharge, for example dredging, sewage treatment, marina construction, and aquaculture, are required to obtain a permission. The QEP Act places a 'duty of care' on people not to undertake activities that will cause
GBR Water Quality 61

environmental harm. There are also specific regulations that address the management of resources, for example the Environmental Protection (Water) Policy 1997. This regulation provides for the management of local government wastewater and stormwater and the setting of environmental values and water quality objectives for specific water resources consistent with Australian and New Zealand Guidelines for Fresh and Marine Water Quality. The QEP Act also provides for the preparation of industry 'codes of practice' to address industry-wide voluntary (and potentially statutory) environment protection mechanisms. The implementation of this Act (and its predecessor, the Clean Waters Act) has resulted in effective control and minimisation of pollution from secondary industry and substantial progress in controlling urban sewage discharges. In contrast, strong controls over pollution emanating from agricultural industries were not included in the Act. In place of the ‘command and control’ philosophy of the Act with respect to secondary industries and point sources in general, a ‘duty of care’ provision was incorporated for agriculture. The active component of the duty of care was the requirements that a ‘Code of Best Practice’ system be introduced for agriculture. Adoption of the code was to be voluntary for farmers but if implemented, was able to be used as a defense against prosecution for environmental harm. Agriculture is not considered an environmentally relevant activity within the Queensland regulatory process. As a result, most of the mechanisms available for regulating pollution do not include agricultural activity or development. Recently, some local governments (for example, Hinchinbrook Shire) have made provision for regulating the change or intensification of land use for agricultural purposes in their local government plans. In particular, changes resulting in intensification of agriculture use, such as fertilised cropping, may be constrained such that areas of riparian vegetation and wetlands may be preserved during such changes. The above changes to local government approval requirements have occurred in only one of the 42 local governments found within the Great Barrier Reef catchment. The decision to refuse a request to undertake intensification of agricultural activities in a wetland area in Hinchinbrook Shire is presently under appeal in the Queensland Planning and Environment Court. Management of water resources is administered by the Queensland Department of Natural Resources under the Water Resources Act 1989 and the Water Act 2000. The Water Act 2000 allows for the preparation of Water Resource Plans that provide capacity to protect and/or provide for environmental flows to natural watercourses. Queensland has also passed legislation to manage vegetation clearing. This Act generally only protects ‘endangered’ ecosystems except in the case of specifically designated areas. The Water Act 2000 does not specifically address downstream water quality impacts of expanded water allocation and associated developments. This suggests that the processes do not adequately provide for the protection of the Great Barrier Reef World Heritage Area. Other potentially important legislation for ensuring protection of the Great Barrier Reef World Heritage Area includes the Forestry Act 1959, River Improvement Trust Act 1940 and the Soil Conservation Act 1956. The Queensland Department of Primary Industries provides for protection of coastal resources through the Fisheries Act 1994 and Fisheries Regulations 1995, particularly with regard to the declaration of Fish Habitat Areas and the protection of marine plants. This Department is specifically responsible for dredging activity in Queensland waters where impacts on marine plants are an issue.
62

8.2 Planning Instruments
8.2.1 State and Regional Planning Instruments
State and Regional planning processes set the State-wide policy framework within which decisions on specific impact assessment processes are undertaken. In 1995, the Queensland Government introduced the Coastal Protection and Management Act 1995 to address the issue of attaining consistent management of Queensland's coastal resources. The Act provides for developing a regional perspective of management of development activity with the aim of achieving ecologically sustainable development. To achieve the objectives of the Act, the Queensland Environment Protection Agency (QEPA) prepares statutory Coastal Management Plans for the State and for eleven regions covering the Queensland coastal catchments. Nine of these Regional Plans will cover the Great Barrier Reef catchment and Queensland waters to the 3 nautical mile limit from the territorial sea baseline. These Plans provide the capacity to address a number of broad environmental concerns, especially with regard to loss of wetlands and riparian areas, through the development of State interest policy. They have the potential to address cumulative impacts on the Great Barrier Reef World Heritage Area of development activities outside the boundaries of the Great Barrier Reef World Heritage Area. The policies are required to be incorporated into local government Planning Schemes. Non-statutory regional plans are being developed under the Integrated Planning Act 1997 (IPA) to guide local government on the preparation of Planning Schemes to address State interests for land use and development, protecting valuable features and for the provision of infrastructure. This process is managed by the Department of Communication, Information, Local Government, Planning and Sport (DCILGPS). These plans should identify constraints on where and how development occurs in the coastal zone. The Far North Queensland 2010 regional plan and the Townsville/ Thuringowa Strategy Plan were finalised this year and are presently being implemented. Unlike regional coastal plans, the focus of these plans is growth and development and they are non-statutory plans reliant on the good will of local government for their effective implementation. The plans established under the State regional and coastal planning processes do not provide for the management of existing activities, such as agriculture, that impact on water quality in the Great Barrier Reef World Heritage Area.
8.2.2 Local Government Planning Instruments
Local Government Planning Schemes are developed under the IPA. The Planning Schemes are required to address three core issues. These are; land use and development, infrastructure and valuable features. They are required to identify 'Desired Environment Outcomes’ for the range of land use, development and conservation issues covered by the scheme. Shire Planning Schemes are statutory instruments enforceable by law, but only manage new developments. There are 20 local governments with boundaries along the coast adjacent to the Great Barrier Reef Marine Park and 42 within the catchment of the Great Barrier Reef World Heritage Area. Many have only recently reviewed their old Planning Schemes and have decided to prepare new schemes later in the transitional period. The new Planning Schemes are fundamentally different from the old schemes as they are performance based rather than prescriptive plans. This can lead to significant differences in addressing downstream impacts of development. The level of assessment for different types of development is provided for in each Planning Scheme except where a development is identified as impact assessable in the IPA. The capacity for preparation of Environmental Impact Statements is now largely confined to major projects prepared under
GBR Water Quality 63

the State Development and Public Works Organisations Act 1971 and administered by the Department of State Development. Planning Schemes also only manage new development activities where Council approvals are identified in the scheme. Most agricultural activities in rural zones are ‘as of right’ with no approvals being required.
8.3 Non-Statutory Instruments The primary instrument for the management of environmental aspects of agricultural activity is through the development of voluntary ‘codes of practice’. These codes combine with a number of other voluntary mechanisms to address agricultural run-off in the Great Barrier Reef catchment. Whilst these mechanisms have the potential to reduce pollutant discharge to the Great Barrier Reef World Heritage Area, there will be a considerable time lag for full implementation by agricultural producers with significant resource requirements.
8.3.1 Industry Codes of Practice
¶ Industry specific. ¶ Developed under the Queensland Environmental Protection Act. ¶ If fully implemented in their present form, should reduce pollutant discharge to the Great Barrier
Reef World Heritage Area. ¶ The Codes of Practice are not presently audited in any rigorous way.
8.3.2 Farm Management Plans
¶ Implemented by individual farmers. ¶ May contain elements to reduce farm run-off to waterways and protect wetlands and riparian zones. ¶ Enhanced effectiveness where they form part of a Local Government Scheme or water
management scheme. ¶ These plans may become compulsory in declared irrigation schemes (Queensland Draft Water
Allocation and Management Bill 2000).
8.4 Integrated Catchment Management A number of land management strategies have been initiated over the last 10 years. These include an Integrated Catchment Management (ICM) program, which is based on the premise that decision making processes in management of land and water resources must be coordinated to achieve sustainability (Johnson and Bramley 1996). The recognition of economically sustainable development principles at the farm level through the use of property management plans and development of industry codes of practice is now also emerging (Johnson et al. 1998b). Whilst some notable achievements have been made by Queensland agricultural industries and communities (eg. widespread adoption of sugar cane trash blanketing to minimise exposure of unvegetated soil to rainfall), appropriate land management in Queensland remains a great challenge (ANAO 1997; Boully 2000; Toyne and Farley 2000). Early approaches to catchment management involved a large number of independent projects under the Federally funded Landcare program. Today there is a growing realisation that a more strategic approach on a larger scale, backed by adequate resources is required to achieve effective catchment management (ANAO 1997, Bellamy et al. 1999, Boulty 2000, Toyne and Farley 2000). Although Queensland has committed resources to the development of catchment strategies, their implementation has been limited. However, the incorporation of these strategies into local government and State planning processes has not been realised to date.
64

8.5 Education and Communication A recent survey of public perceptions of the Great Barrier Reef and its management, conducted by the Cooperative Research Centre for the Reef, revealed that the public believed the greatest threats to the Reef were pollution (55%) and general human impact (38%). Raising awareness of stakeholders of the sources and impact of pollution represents an enormous challenge. The over-riding impediment to the uptake of this information is the fact that the impacts and the causes are frequently remote from each other, creating difficulties for recognition and responsibility. Queensland has promoted education and extension programs to improve land management activities through integrated catchment management and other programs. However, there has been insufficient monitoring of the outcomes of these programs to be confident that activities that have detrimental impacts on water quality will be managed to negate these impacts and improve water quality. More than ten year’s experience in funding natural resource research and development by corporations such as the Land and Water Resource Research and Development Corporation identify that the most crucial barriers to improved use or management of natural resources are social, economic and institutional factors, not a lack of scientific knowledge.
GBR Water Quality 65

9 CONCLUSIONS
The greatest threat to the Great Barrier Reef has been identified as land-based run-off resulting from agricultural activities (cattle grazing, vegetation clearance and intensive cropping) in the catchments. Vegetation clearing on Queensland agricultural lands is still being carried out at rates that are up to an order of magnitude higher than in any other Australian State, and soil erosion and associated pollutant losses continue to be significant problems on Queensland agricultural properties (Anon 1999b). Agricultural industries, including grazing and cropping, are currently not accountable for pollutants discharged into Queensland’s catchments. Agriculture is largely exempted from the Queensland Environmental Protection legislation and associated regulatory provisions. Queensland legislative, policy and planning arrangements pertaining to environmental management do not generally consider agriculture as an environmentally relevant activity (ERA), therefore there is no requirement for environmental assessment under the Queensland Integrated Planning Act 1997. Fertiliser usage on most of the Great Barrier Reef catchments has increased greatly in recent decades (Pulsford 1996) and modern agricultural practices have been strongly linked with elevated nutrient concentrations in the aquatic environment (Mitchell et al. 2000). Moreover, there is evidence that eutrophication has occurred in some inshore areas of the Great Barrier Reef World Heritage Area. Increases in local and/or regional nutrient concentrations have led to increased seagrass biomass and distribution at Green Island (Udy et al. 1999) and around Palm Island (Klumpp et al. 1997). At the same time, reductions in coral growth and the relative abundance and composition of corals of nearshore fringing reefs in the Whitsunday region has been linked to elevations in nutrient concentrations (van Woesik et al. 1999). Atrazine and diuron are currently the two most widely used herbicides for the pre- and post-emergence control of weeds in Queensland catchments. An estimated 331 tonnes of atrazine and 197 tonnes of diuron are applied annually to Queensland cane fields (Hamilton and Haydon 1996). The low concentrations of atrazine detected in Great Barrier Reef sediments are likely to be a consequence of herbicide degradation rates which are considerably enhanced by tropical soil conditions, sunlight and saline conditions (Brambilla et al. 1993), resulting in a half life of generally less than 30 days in estuarine (tidal) environments (Obien and Green 1969; Akinyemiju 1991; Huber 1993; Korpraditskul et al. 1993). In contrast, diuron is moderately mobile in soil (Lewis and Gardiner 1996) and has a soil half-life of 100 to 300 days (Lewis and Gardiner 1996), and has an aquatic half-life of approximately 120 days. The widespread occurrence of diuron in Queensland coastal sediments is therefore likely to be a consequence of high local agricultural usage combined with moderate soil mobility and a relatively long aquatic half-life. Large quantities of farm chemicals including organochlorines in liquid formulation are still held on farming properties in Queensland (McGuffog 1996). Over 50% of these are located in catchments adjacent to the Great Barrier Reef. Accidental loss of banned pesticides together with the persistence of organochlorine residues in farming soils would lead to their eventual transport to the marine environment on soil particles. As a consequence, estuarine and nearshore samples along the Queensland coast are likely to continue to be contaminated with these compounds. Dioxin contamination is widespread in northern Queensland agricultural soils and adjacent marine sediments (Müller et al. 1999;Gaus et al. 2001). At present, the sources and/or formation mechanisms and environmental cycling of dioxins are unknown. However, a strong positive correlation between their occurrence in marine sediments and agricultural areas in the northern Queensland wet tropics, has been reported (Müller et al. 1999). Dioxins are also ubiquitous contaminants of dugong populations in the Great Barrier Reef south of Port Douglas (Haynes et al. 1999; Gaus unpublished data).
66
Broadscale, and intensive, site specific monitoring of Great Barrier Reef sediment metal concentrations has now been completed (Doherty et al. 2000), although sediment quality guidelines for heavy metals in the Great Barrier Reef World Heritage Area remain to be developed. With the exception of sites associated with urban and industrial activity, and metals associated with shipping antifoulants (copper, TBT) and farming application (cadmium, mercury), metal contamination in the World Heritage Area remains a relatively local concern. To date, no data is available about the potential impact of first-flush loads of pollutants on nearshore Great Barrier Reef biota. Acquisition of this data is particularly important given the potential synergistic impacts of pollutants (particularly herbicides) on corals and seagrass. These are created by a combination of reduced water salinities and high temperatures often experienced by nearshore seagrass beds and reefs during the summer monsoon months (Devlin et al. 2001b). The capacity of monsoon river flood plumes to transport entrained nutrients to mid and outer-shelf reefs during calm conditions is documented (Devlin et al. 2001b), however no information is available about the offshore transport of other contaminants in the Great Barrier Reef World Heritage Area. The potential impacts of elevated pollutant concentrations in Great Barrier Reef waters can range from reduced growth and reproduction in local biota through to major shifts in community structure and functioning of coral reef and seagrass ecosystems. Maintenance of long-term monitoring programs, some of which utilise innovative data acquisition techniques will enable assessment of change in environmentally relevant water pollutant concentrations over time. Water chemistry data derived using innovative techniques can play an early warning role in the assessment of impacts of contaminants on mangrove, seagrass and coral reef organisms of the Great Barrier Reef World Heritage Area. Moreover, the methods could contribute to the understanding of interactions of contaminants with high light and temperature conditions associated with global climate change. Oil spillage from a large vessel represents the single biggest point source pollution threat to the Great Barrier Reef World Heritage Area. A risk assessment was conducted to determine areas at high risk of an oil spill (Huggett et al. 2000). The assessment identified five areas within or adjacent to the Great Barrier Reef that are considered to be at high risk: Torres Strait, Inner route north of Cape Flattery, Cape Flattery, Whitsunday Islands and Hydrographers Passage. Most of the debris stranded on islands, cays and shorelines of the Great Barrier Reef is likely to be derived from oceanic and local shipping sources and urban stormwater run-off and distributed by prevailing winds and currents. As a consequence, enforcement of legislation prohibiting dumping of debris at sea is particularly difficult. Progress has been made on the determining the types of water column contaminants with the introduction of semi-permeable membrane devices (SPMDs) and diffusive gradients in thin films (DGT) analysis techniques. These techniques reduce some of the problems inherent in the analyses of water, sediment and biota samples for pollutants (Zhang et al. 1998). These devices have the potential to improve knowledge about the distribution of pollutants in the Great Barrier Reef, and when combined with data on coral reef ecosystems will improve knowledge on threats to coral and seagrass communities (Figure 29). A promising tool for this type of sublethal stress assessment in marine organism is the submersible Pulse-Amplitude-Modulated fluorometer (Diving PAM) which measures phototrophic capacity, i.e. a measure of fitness. (Ralph and Burchett 1998; Jones et al. 1999). It is the knowledge of these subtle impacts of chemical contaminants that will allow managers to fully understand the status of tropical marine ecosystems and the risks associated with anthropogenic impacts.
GBR Water Quality 67
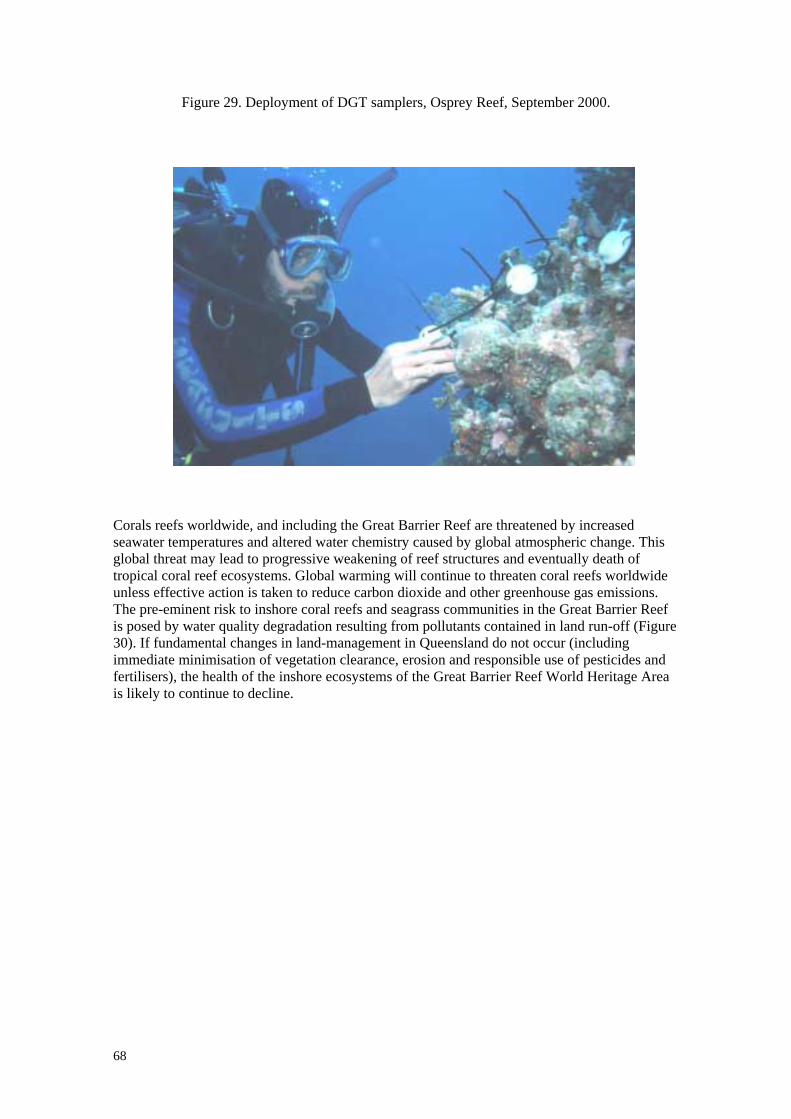
Figure 29. Deployment of DGT samplers, Osprey Reef, September 2000.
Corals reefs worldwide, and including the Great Barrier Reef are threatened by increased seawater temperatures and altered water chemistry caused by global atmospheric change. This global threat may lead to progressive weakening of reef structures and eventually death of tropical coral reef ecosystems. Global warming will continue to threaten coral reefs worldwide unless effective action is taken to reduce carbon dioxide and other greenhouse gas emissions. The pre-eminent risk to inshore coral reefs and seagrass communities in the Great Barrier Reef is posed by water quality degradation resulting from pollutants contained in land run-off (Figure 30). If fundamental changes in land-management in Queensland do not occur (including immediate minimisation of vegetation clearance, erosion and responsible use of pesticides and fertilisers), the health of the inshore ecosystems of the Great Barrier Reef World Heritage Area is likely to continue to decline.
68

Figure 30. Great Barrier Reef areas at risk from land-based pollution.
GBR Water Quality 69

70

10 REFERENCES
Abal, E. G. and Dennison, W. C. (1996). Seagrass depth range and water quality in southern Moreton Bay, Queensland, Australia. Marine and Freshwater Research 47, 763-771.
Agnihotri, N. P., Kulshrestha, G., Gajbhiye, V. T., Mohapatra, S. P., and Singh, S. B. (1996). Organochlorine insecticide residues in agricultural soils of the Indo-Gangetic plain. Environmental Monitoring and Assessment 40, 279-288.
Akinyemiju, O. A. (1991). Persistence of atrazine in a humid tropical soil in the early and late cropping season. Turrilba 41, 129-134.
Alcock, R. E., McLachlan, M. S., Johnston, A. E., and Jones, K. C. (1998). Evidence for the presence of PCDD/Fs in the environment prior to 1900 and further studies on their temporal trends. Environmental Science and Technology 32, 1580-1587.
Allemand, D., Tambutté., Girad, J., and Jaubert, J. (1998). Organic matrix synthesis in the scleractinian coral Stylophora pistillata: role in biomineralisation and potential target of the organotin tributyltin. Journal of Experimental Biology 201, 2001-2009.
Alvarez Piñeiro, M. E., Simal Lozano, J., and Lage Yusty, M. A. (1995). Organochlorine compounds in mussels of the estuarine bays of Galicia (North-west Spain). Marine Pollution Bulletin 30, 484-487.
Alzieu, C. (1996). Biological effects of tributyltin on marine organisms. In Tributyltin: case study of an environmental contaminant, ed. S. J. de Mora. Cambridge University Press, Cambridge. pp. 167-211.
ANAO. (1997). Commonwealth natural resources management and environment programs. Australian National Audit Office, Canberra.
Anon. (1993). The condition of river catchments in Queensland: a broad overview of catchment management issues. Department of Primary Industries, Brisbane.
Anon. (1996). Compendium of Queensland Statistics 1996. Queensland Government.
Anon. (1997). Marine oil pollution: its potential impact and control. Queensland Transport, Brisbane.
Anon. (1999a). Fish kills: A report on water quality related fish kills on the north Queensland coast between Sarina and Cardwell from August 1997 to December 1998. Sunfish Queensland Inc., Bundall, Queensland.
Anon. (1999b). State of the environment, Queensland 1999. Queensland Environment Protection Agency, Brisbane.
Anthony, K. (1999a). Evidence for enhanced particle-feeding capacity in corals on nearshore reefs. Unpublished report to the Great Barrier Reef Marine Park Authority, Townsville.
Anthony, K. R. N. (1999b). Coral suspension feeding on fine particulate matter. Journal of Experimental Marine Biology and Ecology 232, 85-106.
GBR Water Quality 71

ANZECC (2000). Australian and New Zealand guidelines for fresh and marine water quality. Australian and New Zealand Environment and Conservation Council, Canberra.
Aplin, G., Mitchell, P., Cleugh, H., Pitman, A., and Rich, D. (1997). Global environmental crisis, an Australian perspective. Oxford University Press.
AQIS (1998). Australian ballast water program overview. www.Aqis.gov.au/docs/ballast/bprogram1.html
Australian Water Resources Council (1987). 1985 review of Australia’s water resources and water use. Australian Government Printing Service, Canberra.
Ayling, A. M. and Ayling, A. L. (1998). The effect of the Daintree River flood plume on Snapper Island coral reefs. Great Barrier Reef Marine Park Authority Research Publication No. 3, Townsville.
Baldwin, C. (1988). Nutrients in the Great Barrier Reef region. Great Barrier Reef Marine Park Authority, Townsville.
Baldwin, C. (1990). Impacts of elevated nutrients in the Great Barrier Reef. Great Barrier Reef Marine Park Authority, Townsville.
Beck, C.A. and Barros, N.B. (1991). The impact of debris on the Florida manatee. Marine Pollution Bulletin 22, 508–510.
Bell, P. R. F. (1991). Status of eutrophication in the Great Barrier Reef lagoon. Marine Pollution Bulletin 23, 89-93.
Bell, P. R. F. and Elmetri, I. (1995). Ecological indicators of large-scale eutrophication in the Great Barrier Reef lagoon. Ambio 24, 208-215.
Bellamy, J. A., McDonald, G. T., Syme, G. J., and Walker, D. H. (1999). Planning and implementing integrated catchment management. In Evaluation of integrated catchment management in a wet tropical environment, ed. J. A. Bellamy. CSIRO, Brisbane. pp. 229-52.
Belperio, A. P. (1983). Terrigenous sedimentation in the central Great Barrier Reef lagoon: a model from the Burdekin region. Journal of Australian Geology and Geophysics 8, 179-190.
Bennell, N. (1979). Coastal land development - a shadow over the Great Barrier Reef. Australian Parks and Recreation, Nov, 1979, 41-45.
Berkelmans, R. and Oliver, J. K. (1999). Large scale bleaching of corals on the Great Barrier Reef. Coral Reefs 18, 55-60.
Bohl, H.P., Mitchell, D.C., Penny, R.S., and Roth, C.H. (2000). Nitrogen losses via subsurface flow from sugar cane on floodplain soils in the Australian wet tropics. Proceedings of the Australian Society of Sugar Cane Technologists 22, 302-307.
Boon, J. P., van Arnhem, E., Jansen, S., Kannan, N., Petrick, G., Schulz, D., Duinker, J. C., Reijnders, P. J. H., and Goksoyr, A. (1992). The toxicokinetics of PCBs in marine mammals with special reference to possible interactions of individual congeners with the cytochrom P450-dependent monooxygenase system: an overview. In Persistent pollutants in marine ecosystems, eds. C. H. Walker and D. R. Livingstone. Pergamon Press, Oxford. pp. 119-60.
72

Bosselmann, K. (1996). Environmental law and tributyltin in the environment. In Tributyltin; a case study of an environmental contaminant, ed. S. J. de Mara. Cambridge University Press, Great Britian. pp. 237-63
Boully, L. (2000). The need for a new ICM model. Water 27, 26-28.
Brambilla, A., Rindone, B., Polesello, S., Galassi, S., and Balestrini, R. (1993). The fate of triazine pesticides in River Po water. The Science of the Total Environment 132, 339-348.
Brennan, D. (1999). Pollution control policies for Australian prawn farms. Unpublished report, University of Sydney.
Brodie, J. (1994). Management of sewage discharges in the Great Barrier Reef Marine Park. In The 6th Pacific Congress on Marine Science and Technology, PACON (1994), ed. D. Bellwood. James Cook University, Townsville. pp 457-465.
Brodie, J. (1997). The water quality status of the Great Barrier Reef. In State of the Great Barrier Reef World Heritage Area workshop, eds. Wachenfeld, D., Oliver, J., and Davis, K. Great Barrier Reef Marine Park Authority, Townsville. pp 69-96.
Brodie, J. and Furnas, M. J. (1996). Cyclones, river flood plumes and natural water quality extremes in the central Great Barrier Reef. In Downstream Effects of Land Use, eds. H. M. Hunter, A. G. Eyles, and G. E. Rayment. Department of Natural Resources, Brisbane. pp. 367-74.
Brodie, J. and Christie, C. (2001). Great Barrier Reef World Heritage Area: water quality guidelines. Great Barrier Reef Marine Park Authority, Townsville. (In preparation)
Brodie, J., Steven, A., and McGill, R. (1994). Spatial and temporal trends in chlorophyll in waters of the Great Barrier Reef Marine Park. In The 6th Pacific Congress on Marine Science and Technology, PACON (1994), ed. D. Bellwood. James Cook University, Townsville. pp. 77-85.
Brodie, J., Furnas, M. J., Steven, A. D. L., Trott, L. A., Pantus, F., and Wright, M. (1996). Monitoring chlorophyll in the Great Barrier Reef lagoon: trends and variability. Proceedings of the 8th International Coral Reef Symposium. pp 797-802.
Brunskill, G. J., Pfitzner, J., Zargoskis, I., Walker, G. S., and Isdale, P. (1999). An episode of mercury contamination of Bowling Green Bay 1870-1900. In Sources, fates and consequences of pollutants in the Great Barrier Reef and Torres Strait, ed. Kellaway, D. Great Barrier Reef Marine Park Authority, Townsville. p 3. (abstract only)
Bryan, G. W. (1971). The effects of heavy metals (other than mercury) on marine and estuarine organisms. Proceedings of the Ecological Society of London (B) 177, 389-410.
Bryan, G. W. and Gibbs, P. E. (1991). Impact of low concentrations of tributyltin (TBT) on marine organisms: a review. In Metal ecotoxicology, concepts and applications, eds. M. C. Newman and A. W. McIntosh. Lewis Publishers Inc., USA. pp. 323-61.
Buckland, S. J., Hannah, D. J., Taucher, J. A., Slooten, E., and Dawson, S. (1990). Polychlorinated dibenzo-p-dioxins and dibenzofurans in New Zealand's hector's dolphin. Chemosphere 20, 1035-1042.
Bunn, S. and Arthington, A. (1997). Fragile future: downstream impacts of dams and flow regulation. Centre for Catchment and In-stream Research, Griffith University.
GBR Water Quality 73

Burrage, D., Steinberg, C., Bode, L., and Black, K. (1997). Long-term current observations in the Great Barrier Reef. In State of the Great Barrier Reef World Heritage Area Workshop, eds. Wachenfeld, D., Oliver, J., and Davis, K. Great Barrier Reef Marine Park Authority, Townsville. pp 21-45.
Burrows, D. and Butler, B. (1998). Literature review and scoping study of the potential downstream impacts of the proposed Nathan Dam on the Dawson River, Fitzroy River and off shore environments. Final report to the Great Barrier Reef Marine Park Authority, Townsville.
Capone, D. G. and Bauer, J. E. (1992). Environmental microbiology. Clarendon Press, Oxford.
Caruso, B.S. and Ward, R.C. (1998). Assessment of non-point source pollution from inactive mines using a watershed-based approach. Environmental Management 22(2), 225-243.
Cavanagh, J. E., Burns, K. A., Brunskill, G. J., and Coventry, R. J. (1999). Organochlorine pesticide residues in soils and sediments of the Herbert and Burdekin River regions, north Queensland - implications for contamination of the Great Barrier Reef. Marine Pollution Bulletin 39, 367-375.
Chessels, M. J., Hawker, D. W., Connell, D. W., and Papajcsik, I. A. (1988). Factors influencing the distribution of lindane and isomers in soil of an agricultural environment. Chemosphere 17, 1741-1749.
Church, J. A. (1987). East Australian current adjacent to the Great Barrier Reef. Australian Journal of Marine and Freshwater Research 38, 671-683.
Church, J. A., Andrews, J. C., and Boland, F. M. (1985). Tidal currents in the central Great Barrier Reef. Continental Shelf Research 5, 515-531.
Ciesiolka, C. (1987). Catchment management in the Nogoa watershed. Australian Water Resource Council Research Project 80/129. Queensland Department of Primary Industry, Brisbane. 204 p.
Clark, R.B. (1992). Marine Pollution. Claredon Press, Oxford.
Clegg, D. E. (1974). Chlorinated hydrocarbon pesticide residues in oysters (Crassostrea commercialis) in Moreton Bay, Queensland, Australia, 1970-72. Pesticides Monitoring Journal 8, 162-166.
Clendening, L. D., Jury, W. A., and Ernst, F. F. (1990). A field mass balance study of pesticide volatilization, leaching and persistence. In Long-range transport of pesticides, ed. D. A. Kurtz. Lewis Publishers Inc., Michigan, USA. pp. 47-60.
Coates, M., Connell, D. W., Bodero, J., Miller, G.J. and Back, R. (1986). Aliphatic hydrocarbons in Great Barrier Reef organisms and environment. Estuarine, Coastal and Shelf Science 23, 99-113.
Coles, S. L. and Jokiel, P. L. (1992). Effects of salinity on coral reefs. In Pollution in tropical aquatic systems, eds. D. W. Connell and D. W. Hawker. CRC Press Inc., Boca Raton, Florida. pp. 147-68.
Congdon, R.A. and Lukacs, G.P. (1996). Water quality aspects of irrigation run-off from the Burdekin River irrigation area. In Downstream Effects of Land use. eds. Hunter, H.M., Eyles, A.G. and Rayment, G.E. Department of Natural Resources, Brisbane. pp. 73-76.
74

Connell, D. W. (1990). Environmental routes leading to the bioaccumulation of lipophilic chemicals. In Bioaccumulation of xenobiotic compounds, ed. D. W. Connell. CRC Press, Boca Raton, Florida. pp. 47-58.
Connell, D. W. (1995). Occurrence and effects of petroleum hydrocarbons on Australia's marine environment. In The state of the marine environment report for Australia technical annex: 2 pollution, eds. L. P. Zann and D. C. Sutton. Great Barrier Reef Marine Park Authority. Townsville. pp. 47-52.
Cook, F. J., Hicks, W., Gardner, E. A., Carlin, G. D., and Froggatt, D. W. (2000). Export of acidity in drainage water from acid sulphate soils. Marine Pollution Bulletin 41, 319-326.
Corbin, C.J. and Singh, J.G. (1993). Marine debris contamination of beaches in St. Lucia and Dominica. Marine Pollution Bulletin 26, 325–328.
Craik, W. (1985). Workshop on response to hazardous chemical spills in the Great Barrier Reef Region. Great Barrier Reef Marine Park Authority, Townsville.
Craik, W. (1992). The Great Barrier Reef Marine Park: its establishment, development and current status. Marine Pollution Bulletin 25, 122-133.
Davies, P. S. (1991). The effect of daylight variations on the energy budgets of shallow-water corals. Marine Biology 108, 137-144.
DCILGP. (1998). Population projections for Queensland. Department of Communication and Information, Local Government and Planning.
Devlin, M., Waterhouse, J., Taylor, J., and Brodie, J. (2001a). Flood plumes in the Great Barrier Reef: spatial and temporal patterns in composition and distribution. Great Barrier Reef Marine Park Authority, Townsville.
Devlin, M., Christie, C., Waterhouse, J., Haynes, D., and Brodie, J. (2001b). Long-term chlorophyll monitoring in the Great Barrier Reef lagoon. Status Report 2. Great Barrier Reef Marine Park Authority Research Publication Series, Great Barrier Reef Marine Park Authority, Townsville.
Dixon, T.R and Dixon, T.J. (1981). Marine litter surveillance. Marine Pollution Bulletin 12, 289–95.
Doherty, G., Brunskill, G. J., and Ridd, M. J. (2000). Natural and enhanced concentrations of trace metals in sediments of Cleveland Bay, Great Barrier Reef lagoon. Marine Pollution Bulletin 41, 337-344.
Duke, N., Roelfsema, C., Tracey, D., and Godson, L. (2001). A Preliminary investigation of dieback in mangroves in the Mackay region: initial assessment and possible causes. University of Queensland, St Lucia.
Dutton, I.M. (1985). Workshop on contaminants in the waters of the Great Barrier Reef. Great Barrier Reef Marine Park Authority, Townsville.
Enell, M. and Wennberg, L. (1991). Distribution of halogenated organic compounds (AOX) - Swedish transport to surrounding sea areas and mass balance studies in five drainage systems. Water Science and Technology 24, 385-395.
GBR Water Quality 75

Environment Protection Agency (1999). Queensland’s coast: managing its future. A position paper on coastal management in Queensland. Environmental Protection Agency, Brisbane.
Eyre, B. and Davies, P. (1996). A preliminary assessment of suspended sediment and nutrient concentrations in three far north Queensland catchments. In Downstream effects of land use, ed. Hunter, H. M., Eyles, A. G., and Rayment, G. E. Department of Natural Resources, Brisbane. pp 57-64.
Fabricius, K.E. and Wolanski, E. (2000). Rapid smothering of coral reef organisms by muddy marine snow. Estuarine Coastal Shelf Science 50, 115 – 120.
Faithful, J. and Brodie, J. (1990). Tully-Millstream hydroelectric scheme: water quality sampling and testing program. ACTFR Technical Report No. 90/09, Australian Centre for Tropical Freshwater Research, Townsville.
Faris, J. and Hart, K. (1994). Sea of Debris. A Summary of the Third International Conference on Marine Debris, North Carolina Sea Grants College Program.
Finlayson, B.L. and Brizga, S.O. (1993). Anastomosing channels and arroyo development on the Nogoa River, Central Queensland, Australia. Sedimentary Geology 85, 179-190.
Förstner, U. (1989). Contaminated sediments. Springer-Verlag, Berlin.
Fowler, S. W. (1990). Critical review of selected heavy metal and chlorinated hydrocarbon concentrations in the marine environment. Marine Environmental Research 29, 1-64.
FRC (1999). Pioneer Bay Environmental Monitoring Program. Third Monitoring Event, May, 1999. Report to the Whitsunday Shire Council. FRC Coastal Resource and Environmental.
Freney, J.R., Denmead, O.T., Wood, A.W. and Saffigna, P.G. (1994). Ammonia loss following urea addition to sugar cane trash blankets. Proceedings of the Australian Society of Sugar Cane Technologists 16, 114-121.
Furnas, M. and Mitchell, A. (1986). Oceanographic aspects of cyclone Winifred. In Dutton, I. M. ed. The offshore effects of cyclone Winifred. Great Barrier Reef Marine Park Authority Workshop Series. Great Barrier Reef Marine Park Authority, Townsville. pp 41-42.
Furnas, M. J. and Brodie, J. (1996). Current status of nutrient levels and other water quality parameters in the Great Barrier Reef. In Downstream effects of land use, eds. H.M. Hunter, A.G. Eyles and G.E. Rayment. Department of Natural Resources, Brisbane. pp 9-28.
Furnas, M. J. and Mitchell, A. L. (1997). Biological oceanography of the Great Barrier Reef. In The Great Barrier Reef: Science, use and management, eds. Turia, N. and Dalliston, C. Great Barrier Reef Marine Park Authority, Townsville. pp 75-87.
Furnas, M. J., Mitchell, A. W., and Skuza, M. (1995). Nitrogen and phosphorus budgets for the central Great Barrier Reef shelf. Great Barrier Reef Marine Park Authority Research Publication No. 36. Great Barrier Reef Marine Park Authority Townsville.
Furnas, M. J., Mitchell, A., and Skuza, M. (1997). Shelf scale nitrogen and phosphorus budgets for the Central Great Barrier Reef (16o – 19o S). Proceedings of the 8th International Coral Reef Symposium, Panama. pp 809-814.
Gagan, M. K., Sandstrom, M. W., and Chivas, A. R. (1987). Restricted terrestrial carbon input
76
to the continental shelf during Cyclone Winifred: implications for terrestrial run-off to the Great Barrier Reef Province. Coral Reefs 6, 113-119.
Garrity, S.D. and Levings, S.C. (1993). Marine debris along the Caribbean coast of Panama. Marine Pollution Bulletin 26, 317–324.
Gaus, C., Päpke, O., Denisson, N., Haynes, D., Shaw, G., Connell, D.W. and Müller, J. F. (2001). Evidence for the presence of a widespread PCDD source in coastal sediments and soils from Queensland, Australia. Chemosphere 43, 549-558.
Gilbert, M. (2001). Population and major land use in the Great Barrier Reef catchment area: spatial and temporal trends. Great Barrier Reef Marine Park Authority, Townsville.
Glynn P. W. (1993). Coral reef bleaching and ecological perspectives. Coral Reefs 12, 1-17.
Goreau, T.J. (1964). Mass expulsion of zooxanthellae from Jamaican reef communities after hurricane Flora. Science 145, 383-386.
Goreau, T. J., and MacFarlane, A. H. (1990). Reduced growth rate of Montastrea annularis following the 1987-1988 coral-bleaching event. Coral Reefs 8, 211-215.
Gribble, G. W. (1994). The natural production of chlorinated compounds. Environmental Science and Technology 28, 310A-319A.
Hall, L. W. and Anderson, R. D. (1999). A deterministic ecological risk assessment for copper in European saltwater environments. Marine Pollution Bulletin 38, 207-218.
Hamilton, D. and Haydon, G. (1996). Pesticides and fertilisers in the Queensland sugar industry - estimates of usage and likely environmental fate. Queensland Department of Primary Industries.
Harris, J. R. W., Cleary, J. J., and Valkirs, A. O. (1996). Particle-water partitioning and the role of sediments as a sink and secondary source of TBT. In Organotin: environmental fate and effects, eds. M. A. Champ and P. F. Seligman. Chapman and Hall, London. pp. 459-73.
Hart, B. T., Day, G., Sharp-Paul, A., and Beer, T. (1988). Water quality variation during a flood event in the Annan river, North Queensland. Australian Journal of Marine and Freshwater Research 39, 225-243.
Hashimoto, S., Wakimoto, T., and Tatsukawa, R. (1995). Possible natural formation of polychlorinated dibenzo-p-dioxins as evidenced by sediment analysis from the Yellow Sea, the East China Sea and the Pacific Ocean. Marine Pollution Bulletin 30, 341-346.
Haynes, D. (1997). Marine debris on continental islands and sand cays in the far northern section of the Great Barrier Reef Marine Park, Australia. Marine Pollution Bulletin 34, 276-279.
Haynes, D. (2000). Pesticides and heavy metal concentrations in Great Barrier Reef sediment, seagrass and dugong (Dugong dugon). PhD thesis, University of Queensland.
Haynes, D. and Michalek-Wagner, K. (2000). Water quality in the Great Barrier Reef World Heritage Area: past perspectives, current issues and new research directions. Marine Pollution Bulletin 41, 428-434.
Haynes, D. and Loong, D. (2001). Antifoulant (tributyltin and copper) contamination in the Great Barrier Reef, Australia. Environmental Pollution, in review.
GBR Water Quality 77
Haynes, D., Brodie, J., and Devlin, M. (1998a). Long-term monitoring of chlorophyll concentrations in the Great Barrier Reef World Heritage Area. In Proceedings of a workshop on sampling aquatic nutrients in aquatic ecosystems: collecting valid and representative samples, eds. Markwort, K. N. and Maher, W. A. CRC for Freshwater Ecology, Canberra. pp. 115-126.
Haynes, D., Kellaway, D. and Davis, K. (1998b). Protection of wetlands adjacent to the Great Barrier Reef. In Proceedings of a workshop held in Babinda, Queensland, Australia, 25-26 September 1997. Great Barrier Reef Marine Park Authority Workshop Series 24. Townsville. p 124.
Haynes, D., Müller, J.F. and McLachlan, M.S. (1999). Polychlorinated dibenzo-p-dioxins and dibenzofurans in Great Barrier Reef (Australia) dugongs (Dugong dugon). Chemosphere 38, 255-262.
Haynes, D., Müller, J., and Carter, S. (2000a). Pesticide and herbicide residues in sediments and seagrass from the Great Barrier Reef World Heritage Area and Queensland coast. Marine Pollution Bulletin 41, 279-287.
Haynes, D., Ralph, P., Prange, J., and Dennison, W. (2000b). The impact of the herbicide diuron on photosynthesis in three species of tropical seagrass. Marine Pollution Bulletin 41, 288-293.
Haynes, D., Müller, J., Gaus, C. and Carter, S. (2001a). Organochlorine and heavy metal concentrations in blubber and liver tissue collected from Queensland (Australia) dugong (Dugong dugon). (in prep).
Haynes, D., Christie, C., Marshall, P. and Dobbs, K. (2001b). Antifoulant concentrations at the site of the Bunga Teratai Satu grounding, Great Barrier Reef, Australia. Marine Pollution Bulletin, (submitted)
Hilliard, R.W. and Raaymakers, S. (1997). Ballast water risk assessment, Stage 5 report. Ecoports Monograph Series No. 14.
Hoegh-Guldberg, O. (1999). Climate change, coral bleaching and the future of the world's coral reefs. Marine and Freshwater Research 50, 839-866.
Houghton, J. (1995). Global warming, the complete briefing. Nature 375/6509, 30-31.
Huber, W. (1993). Ecotoxicological relevance of atrazine in aquatic systems. Environmental Toxicology and Chemistry 12, 1865-1881.
Huggett, J. Storrie, J. and Foster, A. (2000). Oil-spill risk assessment for the coastal waters of Queensland and the Great Barrier Reef Marine Park. Unpublished report, Great Barrier Reef Marine Park Authority, Townsville.
Hunter, H. M. (1992). Agricultural contaminants in aquatic environments: a review. Department of Primary Industry, Brisbane.
Hunter, H.M. (1997). Nutrients and suspended sediment discharged from the Johnstone River catchment during cyclone Sadie. In Cyclone Sadie flood plumes in the Great Barrier Reef lagoon: composition and consequences, ed. A. Steven. Great Barrier Reef Marine Park Authority Workshop Series No. 22. Townsville. pp 1-8.
Hunter, H.M. and Walton, R. (1997). From land to river to reef lagoon: land use impacts on water quality in the Johnstone River catchment. Department of Natural Resources, Brisbane.
78

Hunter, H.M., Walton, R.S. and Russell, D.J. (1996). Contemporary water quality in the Johnstone River catchment. In Downstream effects of land use, eds. H.M. Hunter, A.G. Eyles and G.E. Rayment. Department of Natural Resources, Brisbane. pp 339-345.
Hunter, H. M., Hargreaves, P. A., and Rayment, G. E (1999). Pesticide residues in surface waters of two northern Queensland catchments. In Sources, fates and consequences of pollutants in the Great Barrier Reef and Torres Strait, ed D. Kellaway, Great Barrier Reef Marine Park Authority, Townsville. p 10. (Abstract only).
Hutchings, P. and Haynes, D. (2000). Sources, fates and consequences of pollutants in the Great Barrier Reef. Marine Pollution Bulletin 41, 265-266.
Hutchinson, J. and Simmonds, M. (1991). A review of the effects of pollution on marine turtles. Greenpeace, London.
Iwata, H., Tanabe, S., Miyazaki, N., and Tatsukawa, R. (1994). Detection of butyltin compound residues in the blubber of marine mammals. Marine Pollution Bulletin 28, 607-12.
Jarman, W. M., Norstrom, R. J., Muir, D. C. G., Rosenberg, B., Simon, M., and Baird, R. W. (1996). Levels of organochlorine compounds, including PCDDs and PCDFs, in the blubber of cetaceans from the west coast of North America. Marine Pollution Bulletin 32, 426-436.
Johnson, D. (1996). 1996 Knowledge summary of terrigenous input to the central Great Barrier Reef. In Great Barrier Reef: terrigenous sediment flux and human impacts, eds. Larcombe, P., Woolfe, K., and Purdon, R. CRC Reef Research Centre, James Cook University, Townsville. pp. 86-90.
Johnson, A. and Bramley, R. (1996). The natural resources of the Herbert River catchment and strategies for their management. CSIRO, Townsville, Australia.
Johnson, A. K. L., Ebert, S. P., and Murray, A. E. (1998a). Spatial and temporal distribution of wetland and riparian zones and opportunities for their management in catchments adjacent to the Great Barrier Reef Marine Park. In Protection of wetlands adjacent to the Great Barrier Reef, eds. Haynes, D., Kellaway, D., and Davis, K. Great Barrier Reef Marine Park Authority, Townsville. pp 82-101.
Johnson, A. K. L., McDonald, G. T., Shrubsole, D. A., and Walker, D. H. (1998b). Natural resource use and management in the Australian sugar industry: current practice and opportunities for improved policy, planning and management. Australian Journal of Environmental Management 5, 97-108.
Johnson, A.K.L., Ebert, S.P. and Murray, A.E. (2000). Land cover change and its environmental significance in the Herbert River catchment, north-east Queensland. Australian Geographer 31, 75-86.
Johnston, P. A., Stringer, R. L., and Santillo, D. (1996). Cetaceans and environmental pollution: the global concerns. In The conservation of whales and dolphins, eds. M. P. Simmonds and J. D. Hutchinson. John Wiley and Sons Ltd. pp. 219-61.
Jokiel, P. (1980). Solar ultraviolet radiation and coral reef epifauna. Science 207, 1069-1071.
Jones, M.M. (1995). Fishing debris in the Australian marine environment. Marine Pollution Bulletin 30, 25–33.
GBR Water Quality 79

Jones, G., Broadbent, A., McDonald, M., and Curran, M. (1997). Dimethylsulphide and dimethylsulphoniopropionate as an indicator of coral stress during the ENCORE experiment at One Tree Island. Report to the Great Barrier Reef Marine Park Authority, Townsville.
Jones, R., Hoegh-Guldberg, O., Larkum, A.W.L., and Schrieber, U. (1998). Temperature induced bleaching of corals begins with impairment of dark metabolism in zooxanthellae. Plant Cell and Environment 21, 1219-1230.
Jones, R. J., Kildea, T., and Hoegh-Guldberg, O. (1999). PAM chlorophyll fluorometry: a new in situ technique for stress assessment in scleractinian corals, used to examine the effects of cyanide from cyanide fishing. Marine Pollution Bulletin 38, 864-874.
Kannan, K., Tanabe, S., and Tatsukawa, R. (1995). Geographical distribution and accumulation features of organochlorine residues in fish in tropical Asia and Oceania. Environmental Science and Technology 29, 2673-2683.
Kellaway, D. (1999). Sources, fates and consequences of pollutants in the Great Barrier Reef and Torres Strait. Great Barrier Reef Marine Park Authority Workshop Series No. 25. Townsville.
Kelly, J. R., Levine, S. N., Buttel, L. A., Carr, K. A., Rudnick, D. T., and Morton, R. D. (1990a). The effects of tributyltin within a Thalassia seagrass ecosystem. Estuaries 13, 301-10.
Kelly, J. R., Rudnick, D. T., Morton, R. D., Buttel, L. A., Levine, S. N., and Carr, K. A. (1990b). Tributyltin and invertebrates of a seagrass ecosystem: exposure and response of different species. Marine Environmental Research 29, 245-276.
Kennicutt, M. C., Wade, T. L., Presley, B. J., Requejo, A. G., and Denoux, G. J. (1994). Sediment contaminants in Casco Bay, Maine: inventories, source, and potential for biological impact. Environmental Science and Technology 28, 1-15.
King, B. (1995). Hydrodynamic complexities of tropical coastal waters: a study through the application of numerical models. James Cook University, Townsville.
Kjeller, L.-O., Jones, K. C., Johnston, A. E., and Rappe, C. (1991). Increases in polychlorinated dibenzo-p-dioxin and -furan content of soils and vegetation since the 1840s. Environmental Science and Technology 25, 1619-1627.
Kleypas, J.A., Buddemeier, R.W., Archer, D., Gattuso, J.P., Langdon, C., Opdyke, B.N. (1999). Geochemical consequences of increased atmospheric carbon dioxide on coral reefs. Science 284, 118-120.
Klumpp, D. W., Done, T., McKinnon, A. D., Brunskill, G. J., and Robertson, A. I. (1997). Response of nearshore reefs to nutrient enhancement: baseline information on nutrient concentrations, primary production and coral reef community structure. Report to the Great Barrier Reef Marine Park Authority, Townsville.
Koop, K., Booth, D., Broadbent, A., Brodie, J., Bucher, D., Capone, D., Coll, J., Dennison, W., Erdmann, M., Harrison, P., Hoegh-Guldberg, O., Hutchings, P. A., Jones, G. B., Larkum, A. W. D., O'Neil, J., Steven, A., Tentori, E., Ward, S., Williamson, J. and Yellowlees, D. (2000). ENCORE: The effect of nutrient enrichment on coral reefs. Synthesis of results and conclusions. Marine Pollution Bulletin 42(2), 91-120.
Korpraditskul, R., Katayama, A., and Kuwatsuka, S. (1993). Chemical and microbiological degradation of atrazine in Japanese and Thai soils. Journal of Pesticide Science 18, 77-83.
80

Kubiak, T. G., Harris, H. J., Smith, L. M., Schartz, T. R., Stalling, D. L., Trick, J. A., Sileo, L., Docherty, D. E., and Erdman, T. C. (1989). Micro-contaminants and reproductive impairment of the Foster's tern on Green Bay, Lake Michigan - 1983. Archives of Environmental Contamination and Toxicology 18, 706-727.
Kuiken, T., Bennett, P. M., Allchin, C. R., Kirkwood, J. K., Baker, J. R., Lockyer, C. H., Walton, M. J., and Sheldrick, M. C. (1994). PCBs, cause of death and body condition in harbour porpoises (Phocoena phocoena) from British waters. Aquatic Toxicology 28, 13-28.
Kurtz, D.A. and Atlas, E.L. (1990). Distribution of hexachlorocyclohexanes in the Pacific ocean basin, air, water, 1987. In Long range transport of pesticides, ed. D.A. Kurtz. Lewis Publishers, Inc., Michigan, USA. pp 143-160.
Laist, D.W. (1987). Overview of the biological effects of lost and discarded plastic debris in the marine environment. Marine Pollution Bulletin 18, 319–326.
Langston, W. J. (1990). Toxic effects of metals and the incidence of metals pollution in marine ecosystems. In Heavy metals in the marine environment, eds. R. W. Furness and P. S. Rainbow. CRC Press, Boca Raton, Florida. pp. 101-22.
Lapointe, B. E. and O'Connell, J. (1989). Nutrient enhanced growth of Cladophora prolifera in Harrington Sound, Bermuda: eutrophication of a confined, phosphorus limited marine ecosystem. Estuarine, Coastal and Shelf Science 28, 347-360.
Larcombe, P., Ridd, P.V., Prytz, A. and Wilson, B. (1995). Factors controlling suspended sediment on inner-shelf coral reefs, Townsville, Australia. Coral Reefs 14, 163-171.
Larcombe, P. and Woolfe, K. (1999). Increased sediment supply to the Great Barrier Reef will not increase sediment accumulation at most coral reefs. Coral Reefs 18, 163-169.
Lawrence, P.A. and Thorburn, P.J. (1989). Changes in hydrology, soil fertility and productivity of Brigalow catchments following clearing. QDPI Publication RQR89002. Queensland Department of Primary Industries, Brisbane.
Leach, J. M., Howard, T. E., and Lanz, H. E. (1985). Chlorinated organics in shellfish from coastal waters. Pulp and paper Canada 86, T389-T401.
Lee Long, W. J., Mellors, J. E., and Coles, R. G.(1993). Seagrasses between Cape York and Hervey Bay, Queensland, Australia. Australian Journal of Marine and Freshwater Research 44, 19-31.
Lewis, S. and Gardiner, J. (1996). Proposed environmental quality standards for diuron, linuron, chlorotoluron and isoproturon in water. National Rivers Authority, Bristol.
Lobegeiger, R. (1998). Aquaculture production survey - Queensland 1996/1997. QDPI Information Series Q198024.
Lottermoser, B. G. (1997). Natural enrichment of topsoils with chromium and other heavy metals, Port Macquarie, New South Wales. Australian Journal of Soil Research 35, 1165-1176.
Lucas, Z. (1992). Monitoring persistent litter in the marine environment on Sable Island, Nova Scotia. Marine Pollution Bulletin 24, 192–199.
Lucas, P. H. C., Webb, T., Valentine, P. S., and Marsh, H. (1997). The outstanding universal value of the Great Barrier Reef World Heritage Area. Great Barrier Reef Marine Park Authority, Townsville.
GBR Water Quality 81

Maguire, R. J. (1984). Butyltin compounds and inorganic tin in sediments in Ontario. Environmental Science and Technology 18, 291-294.
Maguire, R. (1987). Environmental aspects of tributyltin. Applied Organometallic Chemistry 1, 475-498.
Malcolm, H., Fontes, T. and Ashworth, T. (1999). An example of an ongoing refuse and illegal fishing problem at a popular anchorage in the Great Barrier Reef Marine Park. Reef Research 9, 3-5.
Marshall, P.A. and Baird, A.H. (1999). Bleaching of corals on the Central Great Barrier Reef: differential susceptibilities among taxa. Coral Reefs 19, 151-163.
McCook L.J. and Spagnol S. (2001). Modelling and visualising interactions between natural disturbances and eutrophication as causes of coral reef degradation. In Wolanski, E.(ed) Oceanographic processes of coral reefs : physical and biological links in the Great Barrier Reef. CRC Press, Boca Raton, Florida. pp 113-126.
McCulloch, M.T., Gagan, M.K., Mortimer, G.E., Chivas, A.R. and Isdale, P.J. (1994). A high resolution Sr/Ca and ŭ18O coral record from the Great Barrier Reef, Australia and the 1982 –1983 El Nino. Geochimica et Cosmochimica Acta 58, 2747 – 2754.
McGuffog, D. R., Turrell, G., and McGuffog, I. D. (1996). Survey of unwanted chemicals stored on farms in Queensland. McGuffog & Co Pty Ltd, Brisbane. pp 29.
McIvor, J.G., Williams, J. and Gardner, C. J. (1995). Pasture management influences run-off and soil movement in the semi-arid tropics. Australian Journal of Experimental Agriculture 35, 55-65.
McShane, T.J., Reghenzani, J.R., Prove, B.G., and Moody, P.W. (1993). Nutrient balances and transport from sugarcane land – a preliminary report. Proceedings of the Australian Society of Sugar Cane Technologists 15th Conference, 268-275.
Mercier, A., Pelletier, É., and Hamel, J. (1996). Toxicological response of the symbiotic sea anenome Aiptasia pallida to butyltin contamination. Marine Ecological Progress Series 144, 133-146.
Michalek-Wagner, K. and Willis, B. (2000a). Impacts on bleaching on the soft coral Lophophytum compactum. 1. Fecundity, fertilisation and offspring viability. Coral Reefs 19.
Michalek-Wagner, K. and Willis, B. (2000b). Impacts on bleaching on the soft coral Lophophytum compactum. Biochemical changes in adults and their gametes. Coral Reefs 19
Mitchell, A. and Furnas. M. (1994). River inputs of N and P to the central Great Barrier Reef (16-19S). In Proceedings of the Conference of the Australian Society Sugar Cane Technologists, ed. B.T. Egan. pp 30-37.
Mitchell, A. W. and Furnas, M. J. (1997). Terrestrial inputs of nutrients and suspended sediments to the Great Barrier Reef lagoon. Turia, N. and Dalliston, C. (eds.). The Great Barrier Reef: science, use and management. Great Barrier Reef Marine Park Authority, Townsville. pp 59-71.
82
Mitchell, A., Rasmussen, C., Blake, S., Congdon, R., Reghenzani, J., Saffigna, P. and Sturmey, H. (1991). Nutrient status and trends in waters of the Great Barrier Reef Marine Park. In Land use patterns and nutrient loading of the Great Barrier Reef region, ed. D. Yellowlees. Proceedings of a workshop, James Cook University, November 1990. James Cook University, Townsville. pp.108-161.
Mitchell, A. W., Bramley, R. G. V., and Johnson, A. K. L. (1997). Export of nutrients and suspended sediment during a cyclone-mediated flood event in the Herbert River catchment, Australia. Marine and Freshwater Research 48, 79-88.
Mitchell, A. Reghenzani, J.R. and Furnas, M. (2000). Nitrogen levels in the Tully River – a long-term view. Third International River Management Symposium, Brisbane, September 2000.
Mohapatra, S. P., Kumar, M., Gajbhiye, V. T., and Agnihotri, N. P. (1995). Ground water contamination by organochlorine insecticide residues in a rural area in the Indo-Gangetic plain. Environmental Monitoring and Assessment 35, 155-164.
Moody, P.W., Reghenzani, J.R., Armour, J.D., Prove, B.G. and McShane, T.J. (1996). Nutrient balances and transport at farm scale- Johnstone River catchment. In Hunter, H.M., Eyles, A.G. and Rayment, G.E. (eds.) Downstream Effects of Land use. Queensland Department of Natural Resources, pp 347-351.
Mortimer, M. R. (2000). Pesticide and trace metal concentrations in Queensland estuarine crabs. Marine Pollution Bulletin 41, 359-366.
Moss, A. J., Rayment, G. E., Reilly, N., and Best, E. K. (1993). Sediment and nutrient exports from Queensland coastal catchments, a desk study. Queensland Department of Environment and Heritage, Brisbane.
Muir, D. C. G., Ford, C. A., Rosenberg, B., Norstrom, R. J., Simon, M., and Béland, P. (1996). Persistent organochlorines in beluga whales (Deophinapterus leucas) from the St Lawrence River estuary - I. Concentrations and patterns of specific PCBs, chlorinated pesticides and polychlorinated dibenzo-p-dioxins and dibenzofurans. Environmental Pollution 93, 219-234.
Müller, J. F., Sutton, M., Wermuth, U. D., McLachlan, M. S., Will, S., Hawker, D. W., and Connell, D. W. (1996a). Burning sugar cane - a potential source for PAHs and PCDD/Fs. Intersect 96, Brisbane.
Müller, J. F., Sutton, M., Wermuth, U. D., McLachlan, M. S., Will, S., Hawker, D. W., and Connell, D. W. (1996b). Polychlorinated dibenzodioxins and polychlorinated dibenzo-furans in topsoils from northern Queensland, with a history of different trash management. In Sugarcane: research towards efficient and sustainable production. Eds. J. R. Wilson, D. M. Hogarth, J. A. Cambell, and A. L. Garside. CSIRO Division of Tropical Crops and Pastures, Brisbane. pp. 273-4.
Müller, J. F., Haynes, D., and McLachlan, M. S. (1998). PCDD/Fs in the Great Barrier Reef environment of Australia. Organohalogen Compounds 39, 105-108.
Müller, J. F., Haynes, D., McLachlan, M., Bohme, F., Will, S., Shaw, G. R., Mortimer, M., Sadlet, R., and Connell, D. W. (1999). PCDDs, PCDFs, PCBs and HCB in marine and estuarine sediments from Queensland, Australia. Chemosphere 39, 1707-1721.
GBR Water Quality 83

Müller, J.F., Duquesne, S., Ng, J., Shaw, G.R., Krrishnamohan, K., and Manonmanii, K. (2000). Pesticides in sediments from Queensland irrigation channels and drains. Marine Pollution Bulletin 41, 294-301.
Nash, R.G. and Hill, B.D. (1990). Modeling pesticide volatilization and soil decline under controlled conditions. In Long-range transport of pesticides, ed. D.A. Kurtz. Lewis Publishers, Inc., Michigan, USA. pp 17-28.
Neff, J. M. (1990). Composition and fate of petroleum and spill-treating agents in the marine environment. In Sea mammals and oil: confronting the risks, eds. J. R. Geraci and D. J. St.Aubin. Academic Press, Inc., San Diego, California. pp. 1-34.
Neil, D. T. and Yu, B. (1996a). Fluvial sediment yield to the Great Barrier Reef lagoon: Spatial patterns and the effect of land use. In Downstream effects of land use, eds. H. M. Hunter, A. G. Eyles, G. E. Rayment. Department of Natural Resources, Brisbane. pp 281-286.
Neil, D. T. and Yu, B. (1996b). Simple climate-driven models for estimating sediment input to the Great Barrier Reef lagoon. In Great Barrier Reef: terrigenous sediment flux and human impacts, eds. Larcombe, P., Woolfe, K. and Purdon, R. James Cook University, Townsville. pp. 122-127.
Noble, R. M., Rummenie, S. K., Long, P. E., Duivenvoorden, L. J., and Fabbro, L. D. (1997). The Fitzroy River system, monitoring of water quality and biota. In Downstream effects of land use, eds. H. M. Hunter, A. G. Eyles, G. E. Rayment. Department of Natural Resources, Brisbane. Pp. 10 (Abstract only).
Norstrom, R. J., Simon, M., and Muir, D. C. G. (1990). Polychlorinated dibenzo-p-dioxins and dibenzofurans in marine mammals in the Canadian north. Environmental Pollution 66, 1-19.
Obien, S. R. and Green, R. E. (1969). Degradation of atrazine in four Hawaiian soils. Weed Science 17, 509-514.
Oehme, M., Schlabach, M., Hummert, K., Luckas, B., and Nordøy, E. S. (1995). Determination of levels of polychlorinated dibenzo-p-dioxins, dibenzofurans, biphenyls and pesticides in harp seals from the Greenland Sea. The Science of the Total Environment 162, 75-91.
Olsen, C. R., Cutshall, N. H., and Larsen, I. L. (1982). Pollutant-particle associations and dynamics in coastal marine environments: a review. Marine Chemistry 11, 501-533.
Olsen, H. F. (1983). Biological resources of Trinity Inlet and Bay, Queensland. Queensland Department of Primary Industries Bulletin [QB83004].
Olsgard, F. (1999). Effects of copper contamination on recolonisation of subtidal marine soft sediments - an experimental field study. Marine Pollution Bulletin 38, 448-462.
Peters, E. C., Gassman, N. J., Firman, J. C., Richmonds, R. H., and Power, E. A. (1997). Ecotoxicology of tropical marine ecosystems. Environmental Toxicology and Chemistry 16, 12-40.
Pitts, D. (1998). Preliminary study of potential impacts on the Great Barrier Reef World Heritage Area from coastal urban development: a scoping study to identify projects suitable for future funding proposals. Great Barrier Reef Marine Park Authority, Townsville.
Platten, J.R. (1997). The influence of the Fitzroy River discharge on fishery catch rates in central Queensland waters. Central Queensland University, Rockhampton.
84

Powell, B. and Ahern, C. (1999). Nature, origin and distribution of acid sulfate soils: issues for Queensland. In Acid Sulfate Soils and their Management in Coastal Queensland: Forum and Technical Papers, eds. K.M. Hey, C.R. Ahern, V.J. Eldershaw, J.M. Anorov and K.M. Watling, QASSIT and Department of Natural Resources, Brisbane. pp. 1-11.
Preen, A. R., Lee Long, W. J., and Coles, R. G. (1995). Flood and cyclone related loss, and partial recovery, of more than 1000km2 of seagrass in Hervey Bay, Queensland, Australia. Aquatic Botany 52, 3-17.
Prinsloo, J.F., Roets, W., Theron, J., Hoffman, L.C., and Schoonbee, H.J. (1999). Changes in some water quality conditions in recycling water used in three types of biofiltration systems during the production of the sharptooth catfish Clarias gariepinus (Burchell). Water SA (Pretoria) 25, 239-252.
Prove, B. G., and Hicks, W. S. (1991). Soil and nutrient movements from rural lands of north Queensland. In Land Use Patterns and Nutrient Loading of the Great Barrier Reef Region, ed. Yellowlees, D. James Cook University of North Queensland, Townsville. pp 67-76.
Prove, B., Moody, P. and Reganzani, J. (1997). Nutrient balances and transport from agricultural and rainforest lands: a case study in the Johnstone River catchment. Report to Great Barrier Reef Marine Park Authority. Townsville
Pulsford, J. S. (1996). Historical nutrient usage in coastal Queensland river catchments adjacent to the Great Barrier Reef Marine Park. Great Barrier Reef Marine Park Authority Research Publication No. 40, Townsville.
QDEH (1994). Curtis coast study resource report. Queensland Department of Environment and Heritage, Brisbane.
Rainbow, P. S. (1990). Heavy metals in marine invertebrates. In Heavy metals in the marine environment, eds. R. W. Furness and P. S. Rainbow. CRC Press, Boca Raton, Florida. pp. 67-80.
Ralph, P. J. (2000). Herbicide toxicity of Halophila ovalis assessed by chlorophyll a fluorescence. Aquatic Botany 66, 141-152.
Ralph, P. J. and Burchett, M. D. (1998). Photosynthetic response of Halophila ovalis to heavy metal stress. Environmental Pollution 103, 91-101.
Ramsay, M. (2001). Coastal wetlands adjacent to the Great Barrier Reef, Current status and management guidelines. Great Barrier Reef Marine Park Authority, Townsville.
Rayment, G.E. and Neil, D.T. (1997). Sources of material in river discharge. In The Great Barrier Reef: Science, use and management, eds. Turia, N. and Dalliston, C. Great Barrier Reef Marine Park Authority, Townsville. pp 42-58.
Rayment, G. E., Best, E. K., and Hamilton, D. J. (1989). Cadmium in fertilisers and soil amendments. Chemistry International, 10th Australian Symposium Analytical Chemistry.
Rayment, G. E., Moss, A., Mortimer, M., and Haynes, D. (1997). Monitoring pesticides in Queensland's aquatic environment and in the Great Barrier Reef Marine Park. DEAP 97 - 1.
Reganzani, J.R. and Armour, J.D. (2000). Management to minimise nutrient export from canelands. In Environmental short course for sustainable sugar production. ed R.C. Bruce, M. Johnston and G.E. Rayment.CRC for Sustainable sugar production, James Cook University, Townsville. pp. 117-122.
GBR Water Quality 85

Reganzani, J.R., Armour, J.D., Prove, B.G., Moody P.W., and McShane, T. (1996). Nitrogen balances for sugarcane plant and first ratoon crops in the wet tropics. In Sugarcane research towards efficient and sustainable production, ed. J.R. Wilson, D.M. Hogarth, J.A. Campbell and A.L. Garside. CSIRO Division of Tropical Crops and Pasture, Brisbane. pp 275-277.
Reicheld-Brushett, A. J. and Harrison, P. L. (1999). The effect of copper, zinc and cadmium on fertilization success of gametes from scleractinian reef corals. Marine Pollution Bulletin 38, 182-187.
Richardson, B. J. (1995). The problem of chlorinated compounds in Australia's marine environment. In The State of the Marine Environment Report for Australia, Technical Annex: 2, eds. L. P. Zann and D. C. Sutton. Great Barrier Reef Marine Park Authority, Townsville. pp. 53-61.
Ridd, M. (1999). An historical record of cadmium input into the Herbert Estuary. In Sources, fates and consequences of pollutants in the Great Barrier Reef and Torres Strait, ed. Kellaway, D. Great Barrier Reef Marine Park Authority, Townsville. (Abstract only).
Robertson, F.A. and Thornburn, P.J. (2000). Trash management – consequences for soil carbon and nitrogen. Proceedings of the Australian Society of Sugar Cane Technologists 22, 225-229.
Rogers, C. S. (1990). Responses of coral reefs and reef organisms to sedimentation. Marine Ecology Progress Series 62, 185-202.
Ross, J.B., Parker, R. and Strickland, M. (1991). A survey of shoreline litter in Halifax Harbour 1989. Marine Pollution Bulletin 22, 245–248.
Russell, D. J. and Hales, P. W. (1994). Stream habitat and fisheries resources of the Johnstone River catchment. Queensland Department of Primary Industries, Cairns.
Russell, D. J., Hales, P. W., and Helmke, S. A. (1996a). Fish resources and stream habitat of the Moresby River catchment. Department of Primary Industries. Information series.
Russell, D. J., Hales, P. W., and Helmke, S. A. (1996b). Stream habitat and fish resources in the Russell and Mulgrave River catchments. Department of Primary Industries. Information series.
Russell, D. J., Hales, P. W., and Moss, A. (1996c). Pesticide residues in aquatic biota from north-east Queensland coastal streams. Proceedings of the Royal Society of Queensland 106, 23-30.
Sammut, J. and Lines-Kelly, R. (1996). An introduction to acid sulfate soils, Ballina, NSW. Department of the Environment, Sport and Territories.
Sammut, J., White, I., and Melville, M. D. (1994). Stratification in acidified coastal floodplain drains. Wetlands (Australia) 13, 49-64.
Schroeder, B.L., Wood, A.W. and Kingston, G. (1998). Re-evaluation of the basis for fertiliser recommendations in the Australian sugar industry. Proceedings of the Australian Society of Sugar Cane Technologists 20, 239-247.
Seligman, P. F., Maguire, R. J., Lee, R. F., Hinga, K. R., Valkirs, A. O., and Stang, P. M. (1996). Persistence and fate of tributyltin in aquatic ecosystems. In Organotin: Environmental Fate and Effects, eds. M. A. Champ and P. F. Seligman. Chapman and Hall, London. pp. 429-57.
86

Shepherd, S. A., McComb, A. J., Bulthuis, D. A., Neverauskas, V., Steffensen, D. A., and West, R. (1989). Decline of seagrasses. In Biology of seagrasses: a treatise on the biology of seagrasses with special reference to the Australian region, eds. A. W. D. Larkum, A. J. McComb, and S. A. Shepherd. Elsevier, Amsterdam. pp. 346-93.
Skull, S. (1996). Habitat clearing and fragmentation in tropical lowlands, PhD thesis, James Cook University, Townsville.
Slip, D.J. and Burton, H.R. (1991). Accumulation of fishing debris, plastic litter and other artefacts on Heard and Macquarie Islands in the Southern Ocean. Environmental Conservation 18, 249–254.
Smith, (1993). Prawn farming in Australia-sediment is a major issue. Australian Fisheries Dec, 29-32.
Smith, V. S., Kimmerer, W. J., Laws, E. A., Brock, R. E., and Walsh, T. W. (1981). Kaneohe Bay sewage diversion experiment: perspectives on ecosystem responses to nutritional perturbation. Pacific Science 35, 279-340.
Steven, A.D. and van Woesik, R. (1990). A multi-disciplinary examination of the hayman island fringing reef: influence of a secondary sewage discharge. Report to the Great Barrier Reef Marine Park Authority, Townsville.
Steven, A.D.L., Pantus, F., Brooks, D. and Trott, L. (1998). Long-term chlorophyll monitoring in the Great Barrier Reef Lagoon: Status Report 1, 1993-1995. Great Barrier Reef Marine Park Authority, Townsville.
Tarasova, E. N., Mamonlov, A. A., Mamontova, E. A., Klasmeier, J., and McLachlan, M. S. (1997). Polychlorinated dibenzo-p-dioxins (PCDDs) and dibenzofurans (PCDFs) in Baikal seal. Chemosphere 34, 2419-2427.
Tatsukawa, R., Yamaguchi, Y., Kawano, M., Kannan, N., and Tanabe, S. (1990). Global monitoring of organochlorine insecticides- an 11-year case study (1975-1985) of HCHs and DDTs in the open ocean atmosphere and hydrosphere. In Long range transport of pesticides, ed. D. A. Kurtz. Lewis Publishers Inc, Michigan, USA. pp. 127-41.
Tesiram, Y. A. (1995). The use of cadmium, uranium and arsenic as indicators of anthropogenic input into the Herbert River estuary, central Great Barrier Reef. Honours Thesis, James Cook University, Townsville.
Thompson, D. R. (1990). Metal levels in marine vertebrates. In Heavy metals in the marine environment, eds. R. W. Furness and P. S. Rainbow. CRC Press Inc., Boca Raton, Florida. pp. 143-82.
Thompson, A., Allen, J. R., Dodoo, D., Hunter, J., Hawkins, S. J., and Wolff, G. A. (1996). Distribution of chlorinated biphenyls in mussels and sediments from Great Britain and the Irish Sea Coast. Marine Pollution Bulletin 32, 232-237.
Thoms, M. and Sheldon, F. (2000). Channel processes and environmental flow requirements for the Barwon-Darling River. Rivers for the Future 12, 10-19.
Thorburn, P.J., Keating, B.A., Robertson, F.A. and Wood, A.W. (2000). Long-term changes in soil carbon and nitrogen under trash blanketing. Proceedings of the Australian Society of Sugar Cane Technologists 22, 217-224.
GBR Water Quality 87

Thorrold, S. R. and McKinnon, A. D. (1995). Responses of larval assemblages to a riverine plume in coastal waters of the central Great Barrier Reef. Limnology and Oceanography 40, 177-181.
Tomascik, T. and Sander, F. (1985). Effects of eutrophication on reef-building corals. I. Growth rates of the reef-building coral Montastera annularis. Marine Biology 87, 143-155.
Toyne, P. and Farley, R. (2000). The decade of landcare. The Australia Institute, Discussion Paper No. 30.
Troell, M., Ronnback, P., Halling, C., Kautsky, N.and Buschmann, A. (1999). Ecological engineering in aquaculture: use of seaweeds for removing nutrients from intensive mariculture. Journal of Applied Phycology 11, 89-97.
Trott, L. and Alongi, D. (1999). Presentation to the Annual International Conference and Exposition of the World Aquaculture Society, April 1999, Sydney, Australia.
Udy, J. W., Dennison, W. C., Lee Long, W., and McKenzie, L. J. (1999). Responses of seagrass to nutrients in the Great Barrier Reef, Australia. Marine Ecological Progress Series 185, 257-271.
Vandermeulen, J. H., Davis, N. D., and Muscatine, L. (1972). The effect of photosynthesis on zooxanthellae in corals and other marine invertebrates. Marine Biology 16, 185-191.
van Woesik, R. (1989). A preliminary examination of the sedimentology, reef growth and hydrography of Green Island. Report to the Great Barrier Reef Marine Park Authority, Townsville.
van Woesik, R.S., DeVantiers, S.M. and Glazebrook, J.S. (1995). Effects of cyclone Joy on nearshore coral communities of the Great Barrier Reef. Marine Ecology Progress Series 128, 261-270.
van Woesik, R., Tomascik, T., and Blake, S. (1999). Coral assemblages and physico-chemical characteristics of the Whitsunday Islands: evidence of recent community changes. Marine and Freshwater Research 50, 427-440.
Von Westernhagen, H. and Klumpp, D. W. (1995). Xenobiotics in fish from Australian tropical coastal waters, including the Great Barrier Reef. Marine Pollution Bulletin 30, 166-169.
Wachenfeld, D. R., Oliver, J. K., and Morrisey, J. I. (1998). State of the Great Barrier Reef World Heritage Area 1998. Great Barrier Reef Marine Park Authority, Townsville.
Waldichuk, M. (1985). Biological availability of metals to marine organisms. Marine Pollution Bulletin 16, 7-11.
Walker, D., Dennison, W., and Edgar, G. (1999). Status of Australian seagrass research and knowledge. In Seagrass in Australia. Strategic review and development of an R&D plan, eds. A. J. Butler and P. Jernakoff. Commonwealth Scientific and Industrial Research Organisation. pp. 1-24.
Walker, D.I. and Ormond, R.F.G. (1982). Coral death from sewage and phosphate pollution at Aqaba, Red Sea. Marine Pollution Bulletin 13, 21-25.
Walker, D. I. and McComb, A. J. (1992). Seagrass degradation in Australian coastal waters. Marine Pollution Bulletin 25, 191-195.
88

Walker, G. S. and Brunskill, G. J. (1997). Detection of anthropogenic and natural mercury in sediments from the Great Barrier Reef. In The Great Barrier Reef: Science, Use and Management, eds. J. Cambell and C. Dalliston. Great Barrier Reef Marine Park Authority, Townsville. pp 30-36.
Walker, T. A. and O'Donnell, G. (1981). Observations on nitrate, phosphate and silicate in Cleveland Bay, Northern Queensland. Australian Journal of Marine and Freshwater Research 32, 877-87.
Ward, S. and Harrison, P. L. (1997). The effect of elevated nutrient levels on the settlement of coral larvae during the ENCORE experiment, Great Barrier Reef, Australia. In Proceedings of the Eighth International Coral Reef Symposium, eds. Lessios, H. A. and McIntyre, I. G. pp. 890-896.
Wasson, R. (1997). Run-off from the land to the rivers to the sea. In The Great Barrier Reef: science, use and management, ed. Turia, N. and Dalliston, C. Great Barrier Reef Marine Park Authority, Townsville. pp. 23-41.
Waterhouse, J. and Johnson, J. (2001). Status of island sewage systems review of island sewage treatment facilities in the Great Barrier Reef World Heritage Area. Great Barrier Reef Marine Park Authority, Townsville (in press).
Weier, K.L., McEwan, C.W., Vallis, I., Catchpoole, V.R. and Myers, J.R. (1996). Potential for biological denitrification of fertiliser N in sugarcane soils. Australian Journal of Agriculture Research 47, 67-79.
White, I., Melville, M. D., Wilson, B. P., and Bowman, G. M. (1996). Downstream impacts from acid sulphate soils. In Downstream effects of land use eds. Hunter, H. M., Eyles, A. G., and Rayment, G. E. Department of Natural Resources, Brisbane. pp 165-172.
White, I., Melville, M. D., Wilson, B. P., and Sammut, J. (1997). Reducing acidic discharges from coastal wetlands in eastern Australia. Wetlands Ecology and Management 5, 55-72.
Wilkinson, C.R. (1996). Global climate change and coral reefs: impacts on reefs, economies and human cultures. Global Change Biology 2, 547-558.
Wilkinson, C.R. (1999). Global and local threats to coral reef functioning and existence: review and predictions. Marine and Freshwater Research 50, 867-878.
Wilkinson, C., Linden, O., Cesar, H., Hodgson, G., Rubens, J., and Strong, A. E. (1999). Ecological and socioeconomic impacts of 1998 coral mortality in the Indian Ocean: an ENSO impact and a warning of future change? Royal Swedish Academy of Sciences 28, 188-196.
Williams, D. (in review). Review of the impacts of terrestrial runoff on the Great Barrier Reef World Heritage Area. CRC Reef Research Centre, Townsville.
Witney, E. (1989). TBT in antifouling paints - a Queensland perspective. Queensland Department of Primary Industries, Information Series.
Wolanski, E. and Bennett, A. F. (1983). Continental shelf waves and their circulation around the Great Barrier Reef. Australian Journal of Marine and Freshwater Research 34, 23-47.
Wolanski, E. and Pickard, G. L. (1985). Long-term observations of currents on the central Great Barrier Reef continental shelf. Coral Reefs 4, 47-57.
GBR Water Quality 89

Woolfe, K. J., Larcombe, P., Orpin, A. R., Purdon, R. G., Michaelsen, P., McIntyre, C. M., and Amjad, N. (1998). Controls upon inner-shelf sedimentation, Cape York Peninsula, in the region of 12°S. Australian Journal of Earth Sciences 45, 611-621.
Yellowlees, D. (1991). Land use patterns and nutrient loading of the Great Barrier Reef region. James Cook University, Townsville.
Yonge, C. M., and Nichols, A. G. (1931). Studies on the physiology of corals: V. The effect of starvation in light and in darkness on the relationship between corals and zooxanthellae. Scientific Report of the Great Barrier Reef Expedition 1, 177-211.
Zhang, H., Davison, W., Gadi, R., and Kobayashi, T. (1998). In situ measurement of dissolved phosphorus in natural waters using DGT. Analytica Chemica Acta 370, 29-38.
90