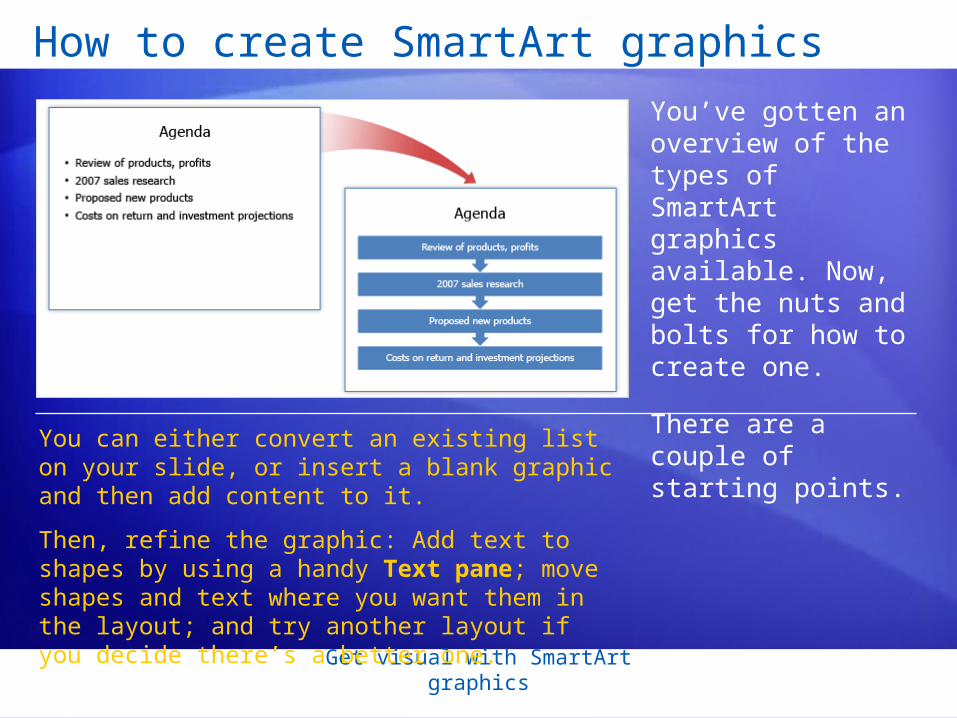
Get visual with SmartArt graphics How to create SmartArt graphics You’ve gotten an overview of the...
19
Get visual with SmartArt graphics How to create SmartArt graphics You’ve gotten an overview of the types of SmartArt graphics available. Now, get the nuts and bolts for how to create one. There are a couple of starting points. You can either convert an existing list on your slide, or insert a blank graphic and then add content to it. Then, refine the graphic: Add text to shapes by using a handy Text pane; move shapes and text where you want them in the layout; and try another layout if you decide there’s a better one.
-
Upload
ursula-pearson -
Category
Documents
-
view
236 -
download
2
Transcript of Get visual with SmartArt graphics How to create SmartArt graphics You’ve gotten an overview of the...
Get visual with SmartArt graphics
How to create SmartArt graphics
You’ve gotten an overview of the types of SmartArt graphics available. Now, get the nuts and bolts for how to create one.
There are a couple of starting points.
You can either convert an existing list on your slide, or insert a blank graphic and then add content to it.
Then, refine the graphic: Add text to shapes by using a handy Text pane; move shapes and text where you want them in the layout; and try another layout if you decide there’s a better one.
Get visual with SmartArt graphics
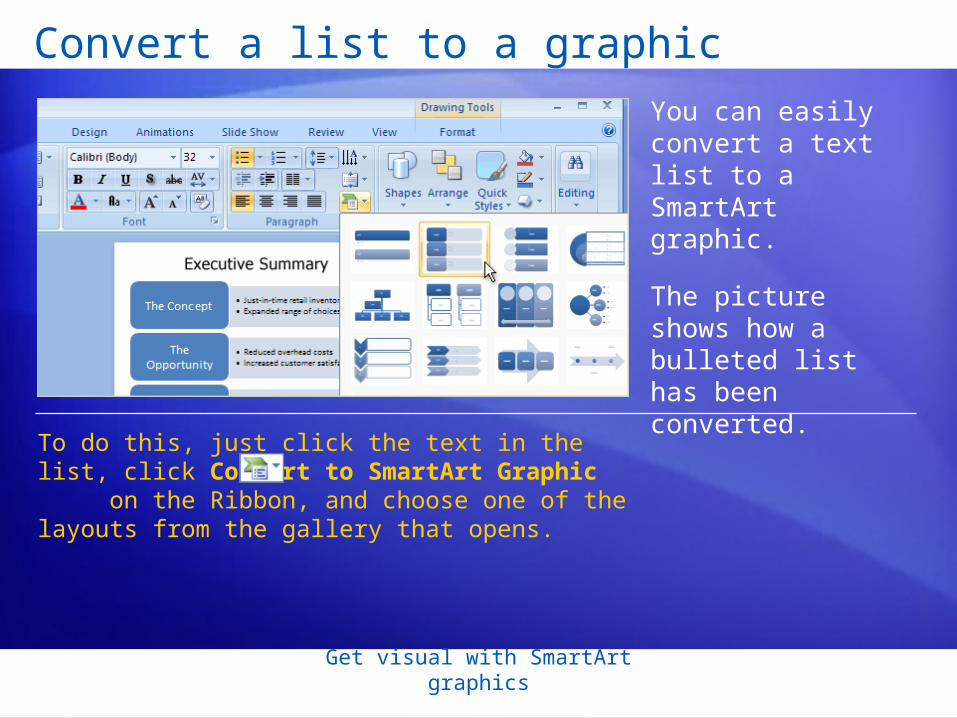
Convert a list to a graphic
You can easily convert a text list to a SmartArt graphic.
The picture shows how a bulleted list has been converted.
To do this, just click the text in the list, click Convert to SmartArt Graphic on the Ribbon, and choose one of the layouts from the gallery that opens.
Get visual with SmartArt graphics
Convert a list to a graphic
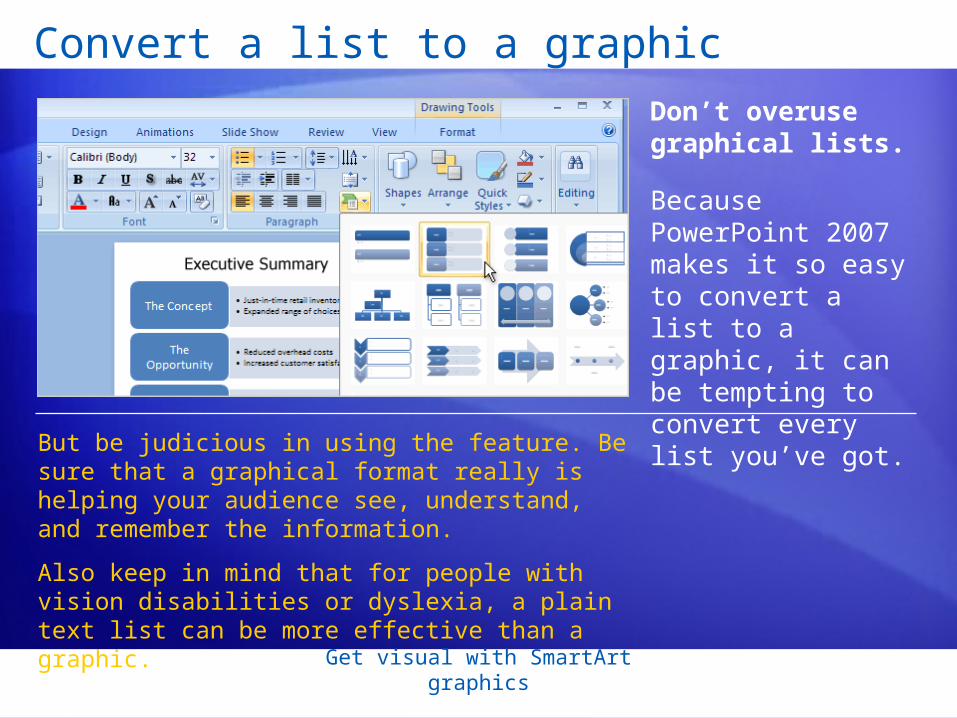
Don’t overuse graphical lists.
Because PowerPoint 2007 makes it so easy to convert a list to a graphic, it can be tempting to convert every list you’ve got.
But be judicious in using the feature. Be sure that a graphical format really is helping your audience see, understand, and remember the information.
Also keep in mind that for people with vision disabilities or dyslexia, a plain text list can be more effective than a graphic.
Get visual with SmartArt graphics
• This conversion feature applies to text only, within a placeholder or any other shape.
• Of the Microsoft Office programs that offer SmartArt graphics, only PowerPoint 2007 has the ability to convert existing text or a list to a SmartArt graphic.
• For existing diagrams, there’s a way to update them to be SmartArt graphics, but that is separate from this conversion feature. That process is shown at the end of the third lesson.
Convert a list to a graphic
A few additional notes about converting lists to SmartArt graphics:
Get visual with SmartArt graphics
Start with a blank graphic: Method 1
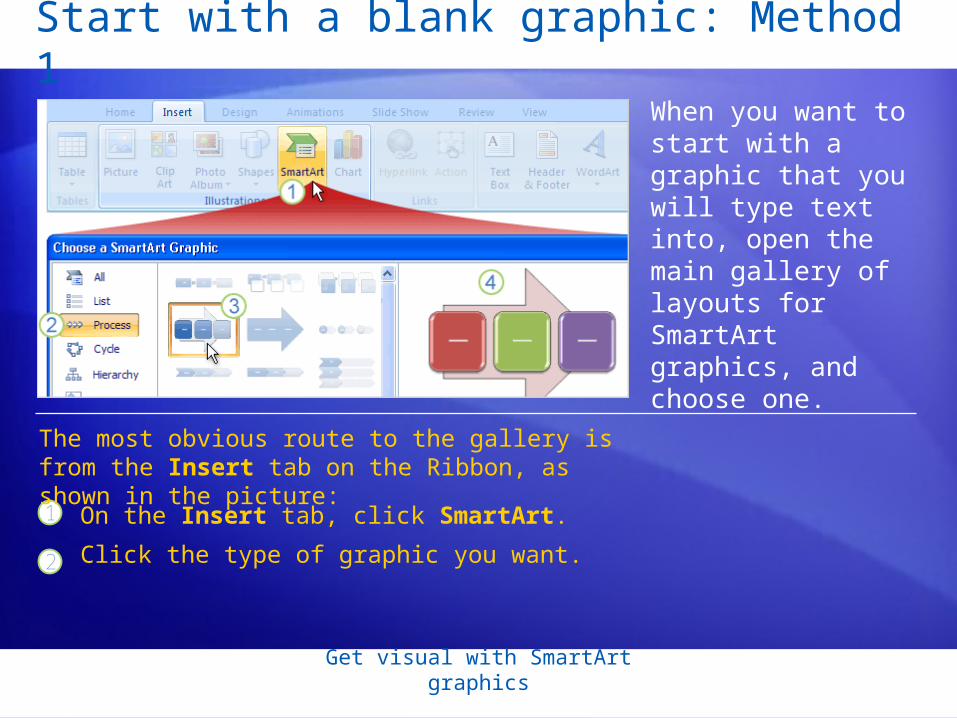
When you want to start with a graphic that you will type text into, open the main gallery of layouts for SmartArt graphics, and choose one.
1
2
On the Insert tab, click SmartArt.
Click the type of graphic you want.
The most obvious route to the gallery is from the Insert tab on the Ribbon, as shown in the picture:
Get visual with SmartArt graphics
Start with a blank graphic: Method 1
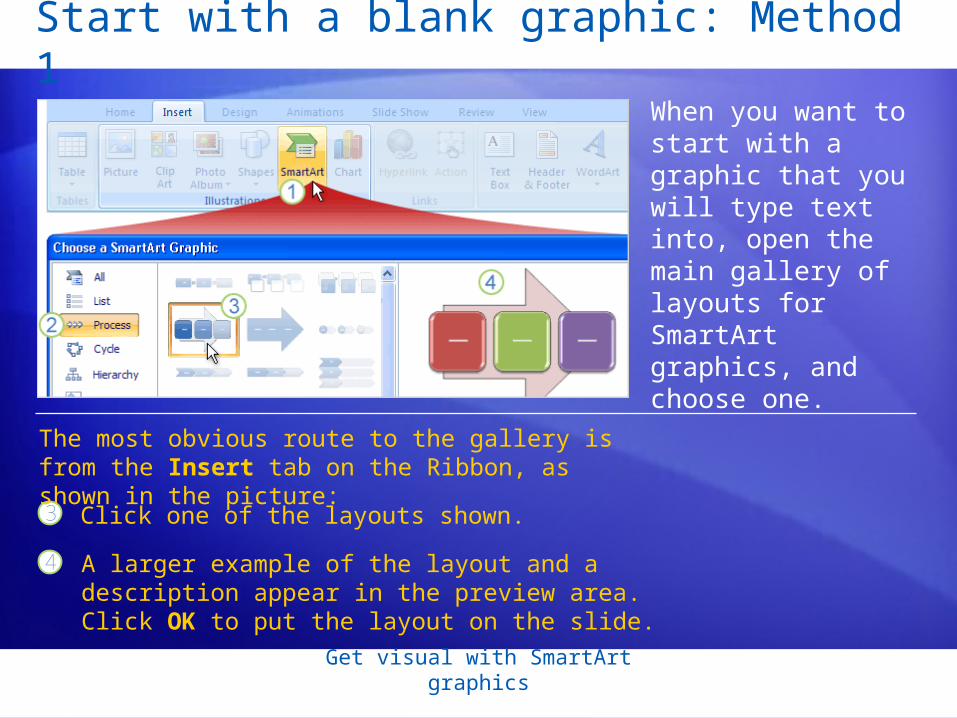
When you want to start with a graphic that you will type text into, open the main gallery of layouts for SmartArt graphics, and choose one.
3 Click one of the layouts shown.
The most obvious route to the gallery is from the Insert tab on the Ribbon, as shown in the picture:
4 A larger example of the layout and a description appear in the preview area. Click OK to put the layout on the slide.
Get visual with SmartArt graphics
Start with a blank graphic: Method 2
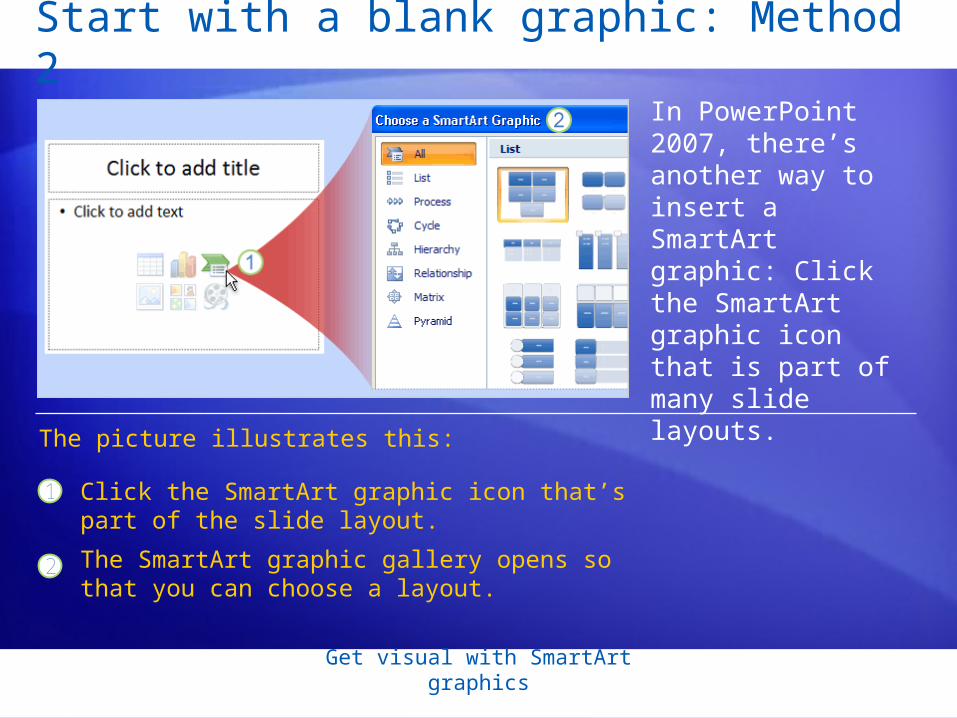
In PowerPoint 2007, there’s another way to insert a SmartArt graphic: Click the SmartArt graphic icon that is part of many slide layouts.
1
2
Click the SmartArt graphic icon that’s part of the slide layout.
The SmartArt graphic gallery opens so that you can choose a layout.
The picture illustrates this:
Get visual with SmartArt graphics
Start with a blank graphic: Method 2
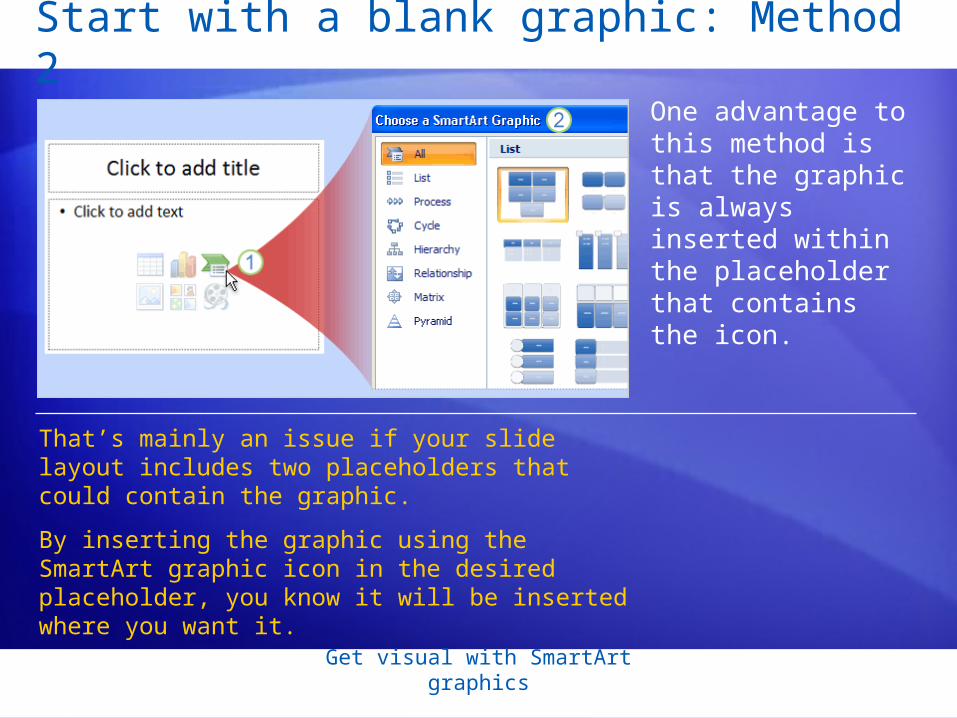
One advantage to this method is that the graphic is always inserted within the placeholder that contains the icon.
That’s mainly an issue if your slide layout includes two placeholders that could contain the graphic.
By inserting the graphic using the SmartArt graphic icon in the desired placeholder, you know it will be inserted where you want it.
Get visual with SmartArt graphics
Add text to a graphic
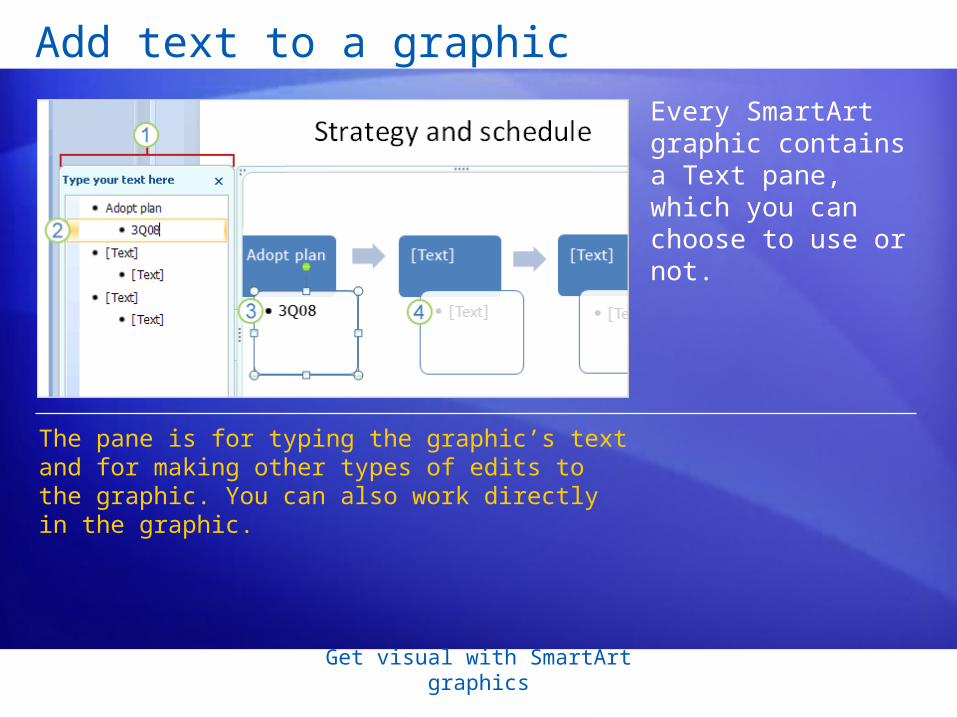
Every SmartArt graphic contains a Text pane, which you can choose to use or not.
The pane is for typing the graphic’s text and for making other types of edits to the graphic. You can also work directly in the graphic.
Get visual with SmartArt graphics
Add text to a graphic
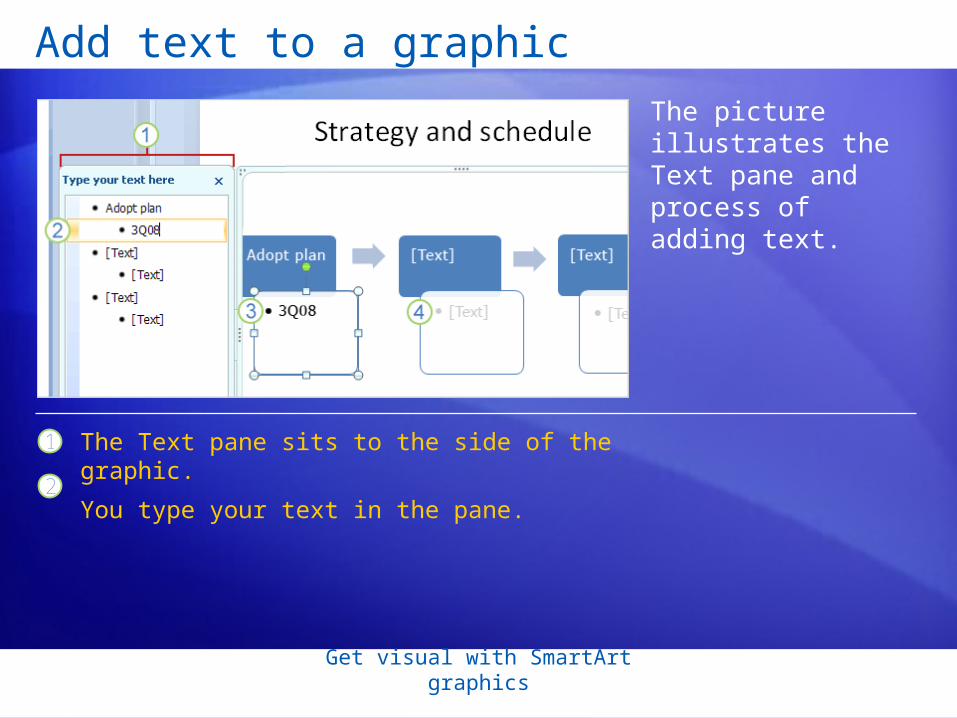
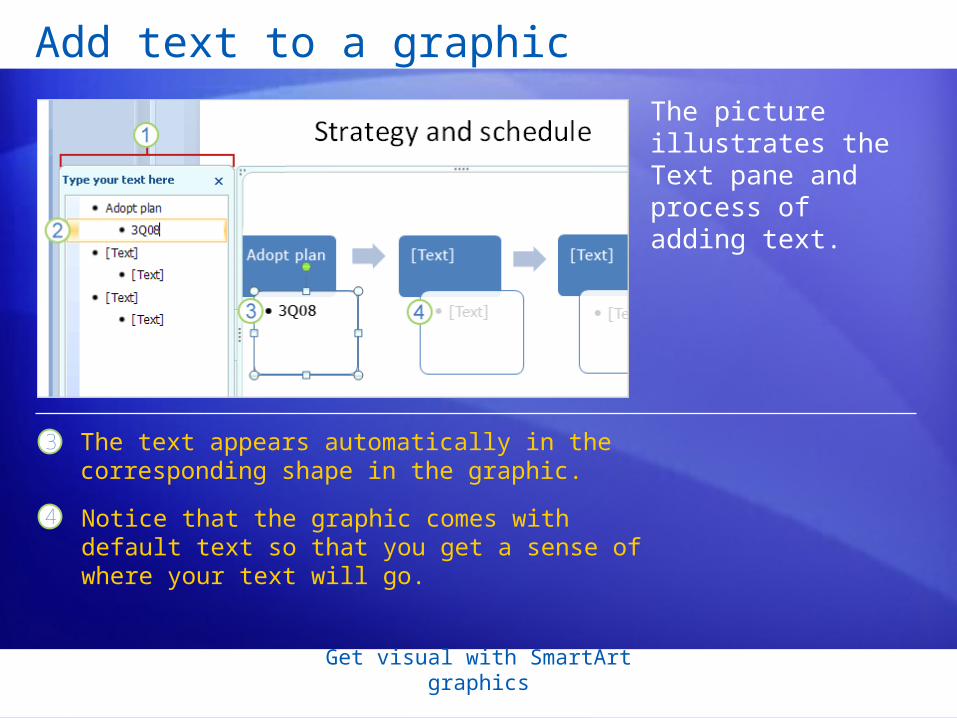
The picture illustrates the Text pane and process of adding text.
1
2
The Text pane sits to the side of the graphic.
You type your text in the pane.
Get visual with SmartArt graphics
Add text to a graphic
The picture illustrates the Text pane and process of adding text.
3 The text appears automatically in the corresponding shape in the graphic.
4 Notice that the graphic comes with default text so that you get a sense of where your text will go.
Get visual with SmartArt graphics
Add text to a graphic
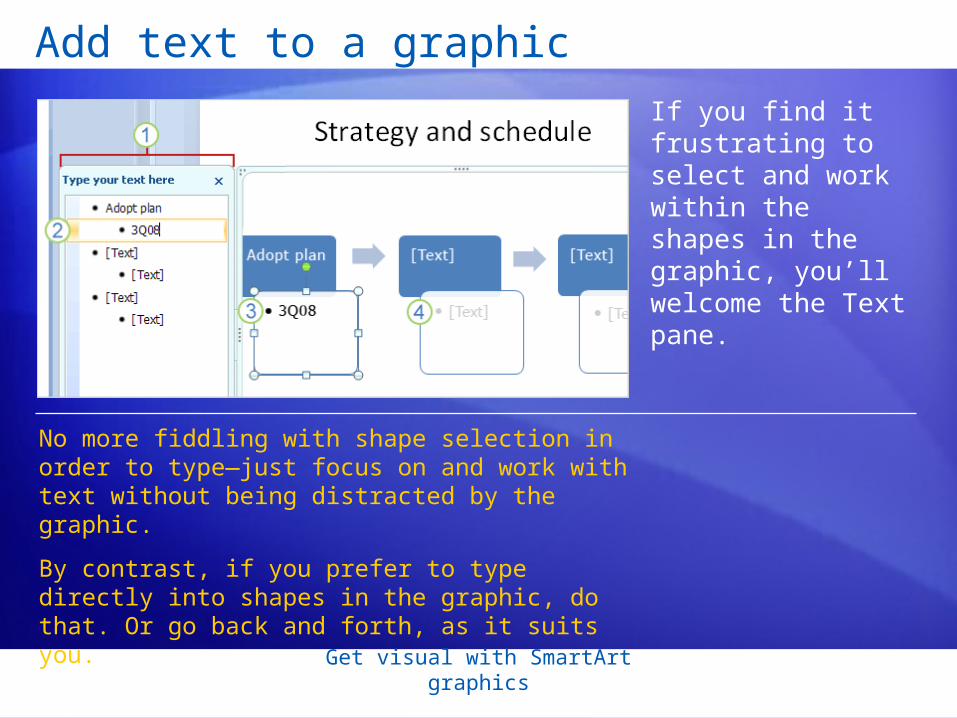
If you find it frustrating to select and work within the shapes in the graphic, you’ll welcome the Text pane.
No more fiddling with shape selection in order to type—just focus on and work with text without being distracted by the graphic.
By contrast, if you prefer to type directly into shapes in the graphic, do that. Or go back and forth, as it suits you.
Get visual with SmartArt graphics
Add text to a graphic
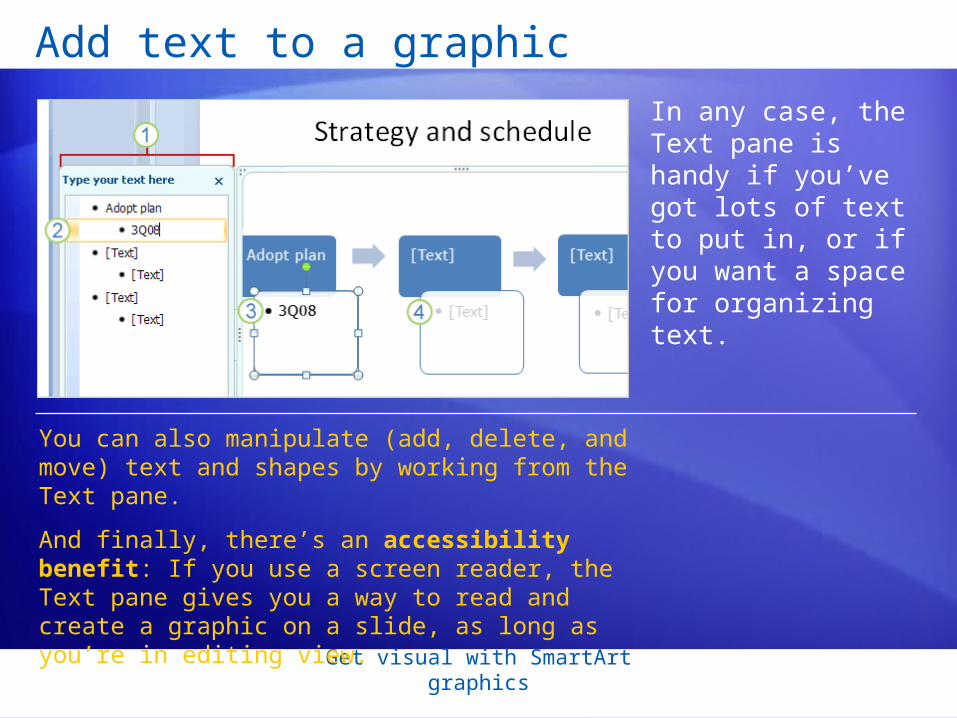
In any case, the Text pane is handy if you’ve got lots of text to put in, or if you want a space for organizing text.
You can also manipulate (add, delete, and move) text and shapes by working from the Text pane.
And finally, there’s an accessibility benefit: If you use a screen reader, the Text pane gives you a way to read and create a graphic on a slide, as long as you’re in editing view.

Get visual with SmartArt graphics
How text maps to shapes
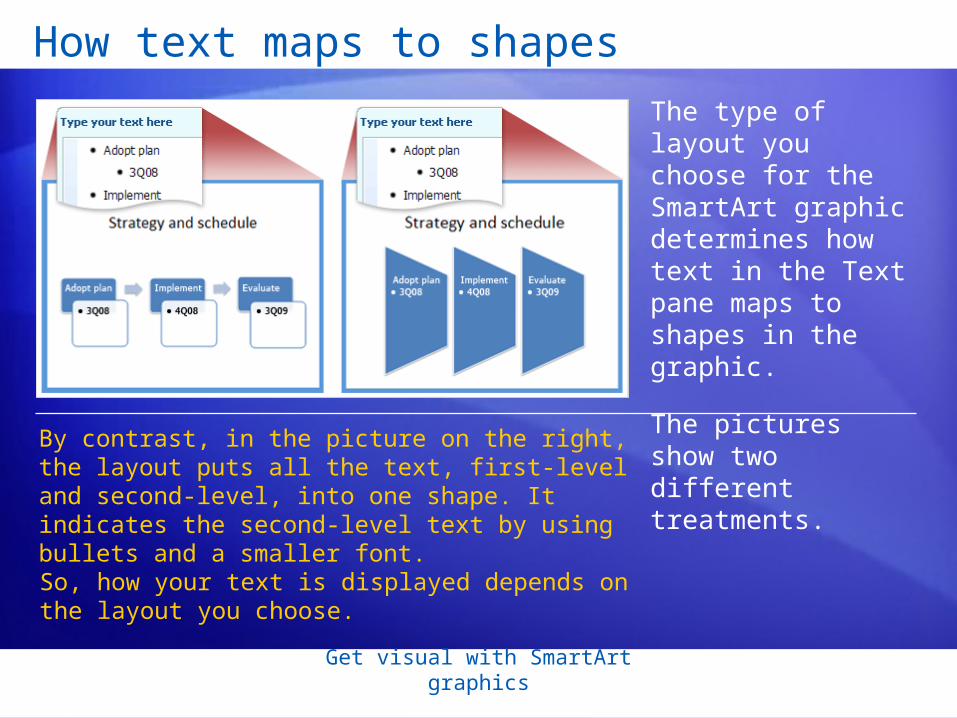
The type of layout you choose for the SmartArt graphic determines how text in the Text pane maps to shapes in the graphic.
The pictures show two different treatments.
On the left, the layout supports top-level text in one set of shapes, the primary ones that have the arrows between them.
The second-level text, indented in the Text pane, appears in the lower shapes, which are also slightly indented and include a bullet.
Get visual with SmartArt graphics
How text maps to shapes
The type of layout you choose for the SmartArt graphic determines how text in the Text pane maps to shapes in the graphic.
The pictures show two different treatments.
By contrast, in the picture on the right, the layout puts all the text, first-level and second-level, into one shape. It indicates the second-level text by using bullets and a smaller font.
So, how your text is displayed depends on the layout you choose.
Get visual with SmartArt graphics
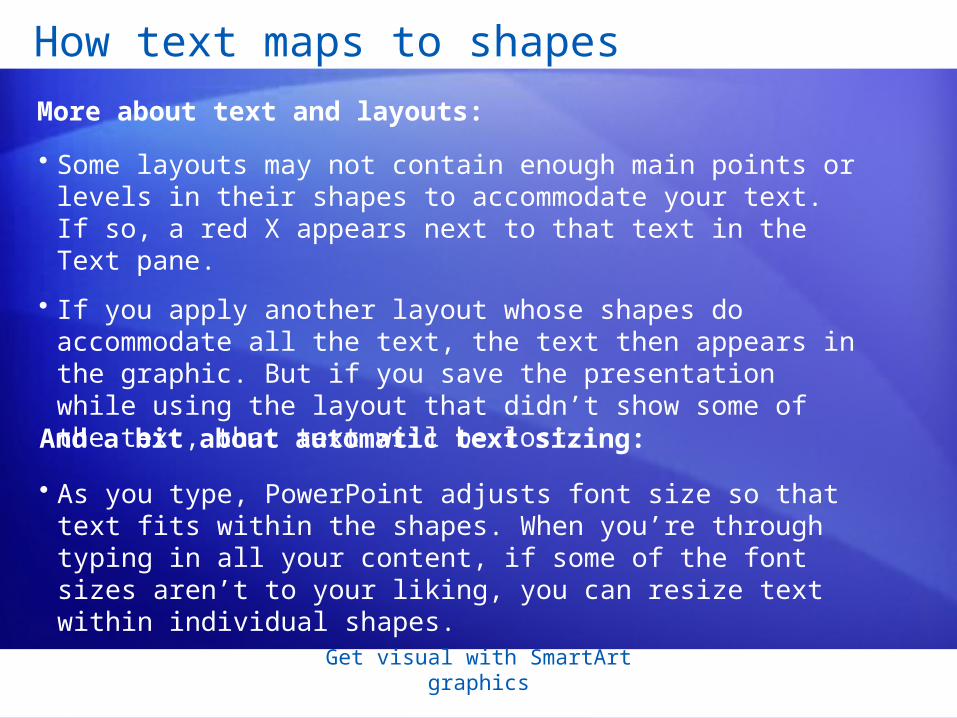
• Some layouts may not contain enough main points or levels in their shapes to accommodate your text. If so, a red X appears next to that text in the Text pane.
• If you apply another layout whose shapes do accommodate all the text, the text then appears in the graphic. But if you save the presentation while using the layout that didn’t show some of the text, that text will be lost.
How text maps to shapes
More about text and layouts:
And a bit about automatic text sizing:
• As you type, PowerPoint adjusts font size so that text fits within the shapes. When you’re through typing in all your content, if some of the font sizes aren’t to your liking, you can resize text within individual shapes.
Get visual with SmartArt graphics
Manipulating text and shapes
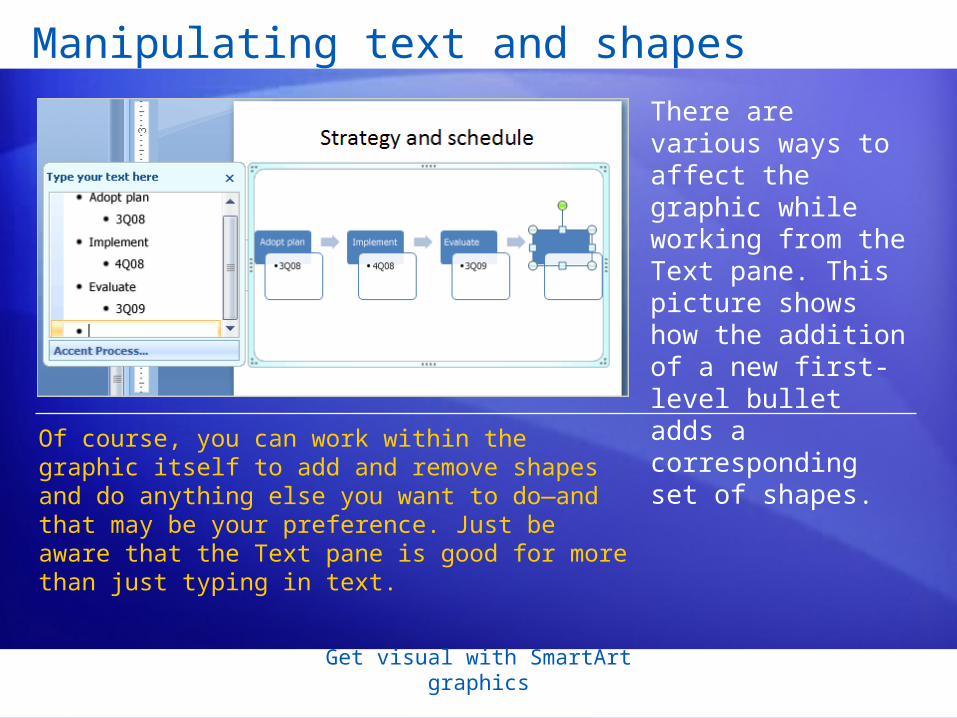
There are various ways to affect the graphic while working from the Text pane. This picture shows how the addition of a new first-level bullet adds a corresponding set of shapes.
Of course, you can work within the graphic itself to add and remove shapes and do anything else you want to do—and that may be your preference. Just be aware that the Text pane is good for more than just typing in text.
Get visual with SmartArt graphics
Try a different layout
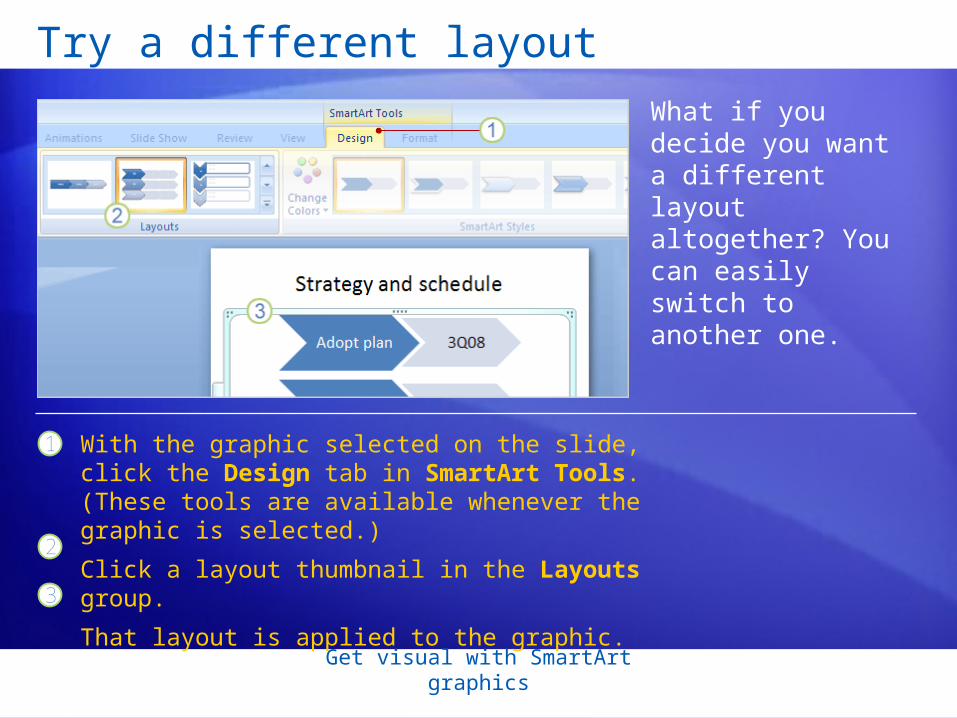
What if you decide you want a different layout altogether? You can easily switch to another one.
1
2
3
With the graphic selected on the slide, click the Design tab in SmartArt Tools. (These tools are available whenever the graphic is selected.)
Click a layout thumbnail in the Layouts group.
That layout is applied to the graphic.
Get visual with SmartArt graphics
Try a different layout
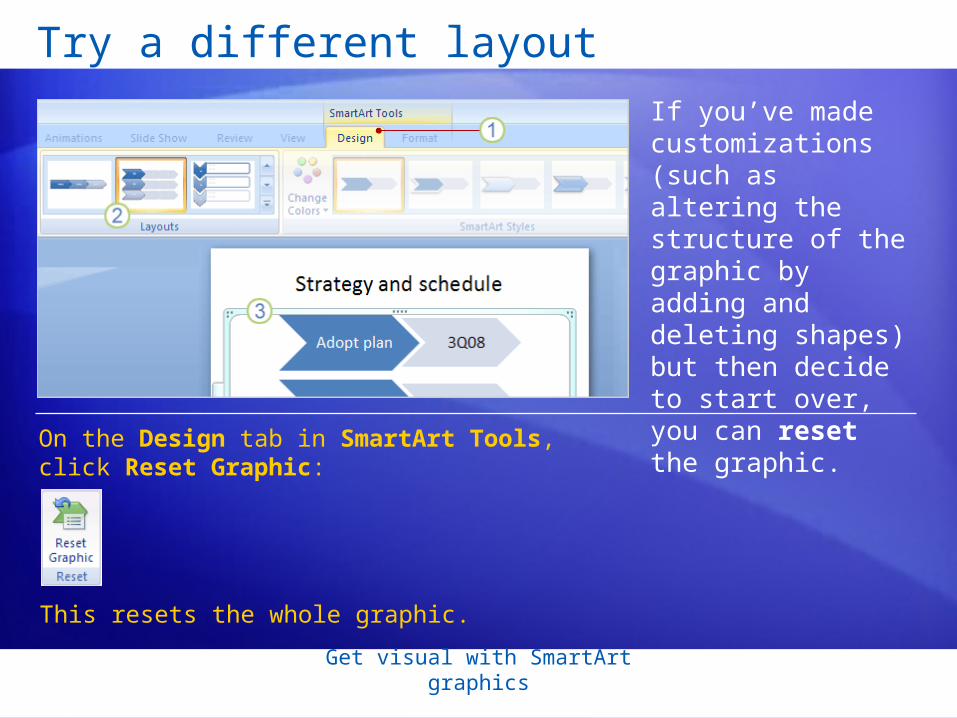
If you’ve made customizations (such as altering the structure of the graphic by adding and deleting shapes) but then decide to start over, you can reset the graphic.
On the Design tab in SmartArt Tools, click Reset Graphic:
This resets the whole graphic.