
FYP Report - VV-Good Index · FYP Report 2014 . Page 2. Page 3 University of Bath BSc Business...
170
Page 1 How does social and environmental impact performance data influence investors’ decision-making process in the pharmaceutical industry? FYP Team 2 FYP Report 2014
Transcript of FYP Report - VV-Good Index · FYP Report 2014 . Page 2. Page 3 University of Bath BSc Business...

Page 1
How does social and environmental impact performance
data influence investors’ decision-making process in the
pharmaceutical industry?
FYP Team 2
FYP Report
2014

Page 2

Page 3
University of Bath
BSc Business Administration
Final Year Project
A. Agudo-Moliner
J. S. Gibson
L. N. Thompson
M. Formoe
O. Idubor-Williams
Academic Advisor
Richard Fairchild
Vertigo Ventures Sponsors
Bokani Tshidzu
Laura Fedorciow
Word Count: 24,131
Commissioned by:

Page 4

Page 5
CONTENT

Page 6
CONTENTS
FIGURE LIST ................................................................................................................................. 8
TABLE LIST ................................................................................................................................... 9
GLOSSARY ................................................................................................................................. 10
I. EXECUTIVE SUMMARY ............................................................................................................ 12
II. ACKNOWLEDGEMENTS ........................................................................................................... 13
III. MEET THE TEAM .................................................................................................................... 14
CHAPTER 1: INTRODUCTION ....................................................................................................... 18 RESEARCH METHODS ............................................................................................................................. 20
SOURCING THE PROJECT ......................................................................................................................... 20 ABOUT OUR SPONSOR ........................................................................................................................... 20 SPONSOR RELATIONSHIP ........................................................................................................................ 21 RESEARCH OUTLINE ............................................................................................................................... 22
CHAPTER 2: CONTEXT ................................................................................................................. 24 PURPOSE STATEMENT ............................................................................................................................ 27 RESEARCH OBJECTIVE ............................................................................................................................ 28
CHAPTER 3: LITERATURE REVIEW ............................................................................................... 29 3.1 INTRODUCTION ............................................................................................................................... 30 3.2 DEFINING NON-FINANCIAL INFORMATION ........................................................................................... 30 3.3 DOING GOOD AND DOING WELL ....................................................................................................... 32 3.4 COMPANIES ACTING SUSTAINABLY ..................................................................................................... 38 3.5 INVESTORS ..................................................................................................................................... 44 3.6 SOCIALLY RESPONSIBLE INVESTMENT .................................................................................................. 46
CHAPTER 4: RESEARCH QUESTIONS ............................................................................................ 59 4.1 DOING GOOD AND DOING WELL ....................................................................................................... 60 4.2 COMPANIES ACTING SUSTAINABLE ..................................................................................................... 61 4.3 INVESTORS ..................................................................................................................................... 61 4.4 SOCIALLY RESPONSIBLE INVESTMENT .................................................................................................. 62 4.5 OVERVIEW OF RESEARCH QUESTIONS ................................................................................................. 64
CHAPTER 5: METHODOLOGY ...................................................................................................... 65 5.1 INTRODUCTION ............................................................................................................................... 66 5.2 RESEARCH PHILOSOPHY .................................................................................................................... 66 5.3 RESEARCH APPROACH ...................................................................................................................... 67 5.4 TIME HORIZON ............................................................................................................................... 67 5.5 RESEARCH DESIGN ........................................................................................................................... 68 5.6 RESEARCH STRATEGY ....................................................................................................................... 69 5.7 RESEARCH METHODS ....................................................................................................................... 72 5.8 LIMITATIONS ................................................................................................................................... 75
CHAPTER 6: QUANTITATIVE FINDINGS & ANALYSIS ..................................................................... 79

Page 7
6.1 RESULTS ........................................................................................................................................ 80 6.2 STATISTICAL ANALYSIS ...................................................................................................................... 87 6.3 QUALITATIVE ANALYSIS .................................................................................................................... 92 6.4 CONCLUSION .................................................................................................................................. 93
CHAPTER 7: QUALITATIVE FINDINGS & ANALYSIS ........................................................................ 95
7.1 DESCRIPTION........................................................................................................................ 96 7.2 RESEARCH QUESTION 1 .................................................................................................................... 97 7.3 RESEARCH QUESTION 2 .................................................................................................................. 105 7.4 RESEARCH QUESTION 3 .................................................................................................................. 117 7.5 RESEARCH QUESTION 4 .................................................................................................................. 124
CHAPTER 8: DISCUSSION .......................................................................................................... 129 8.1 ANSWERING THE RESEARCH QUESTIONS ........................................................................................... 130 8.2 FURTHER FINDINGS ........................................................................................................................ 134 8.3 ANSWERING THE RESEARCH OBJECTIVE ............................................................................................. 135
8.4 SRI GROWTH ................................................................................................................................ 136
CHAPTER 9: MANAGERIAL IMPLICATIONS ................................................................................. 139
9.1 INDUSTRY-SPECIFIC METRICS .............................................................................................. 140 9.2 SUGGESTIONS FOR FUTURE ANALYSIS ............................................................................................... 141 9.3 FUND INDEX ................................................................................................................................. 142 9.4 MEASURING MANAGEMENT AND GOVERNANCE................................................................................. 142 9.5 MULTIPLE SOURCES ....................................................................................................................... 142 9.6 BECOMING A SIGNATORY OF THE PRI ............................................................................................... 143
CHAPTER 10: ACADEMIC CONTRIBUTION .................................................................................. 145
CHAPTER 11: LIMITATIONS ....................................................................................................... 147
CHAPTER 12: FUTURE RESEARCH .............................................................................................. 151
CHAPTER 13: CONCLUSION ....................................................................................................... 153
CHAPTER 14: BIBLIOGRAPHY .................................................................................................... 155
CHAPTER 15: APPENDIX ........................................................................................................... 171

Page 8
FIGURE LIST
Figure 1 Sector reporting trends
Figure 2 PRI asset under management in trillions of U.S. Dollars
Figure 3 The research process
Figure 4 Binomial distribution graph
Figure 5 Multiple linear regression form
Figure 6 Multiple linear regression equation
Figure 7 Average investments
Figure 8 Coding Tree I – Level of interest
Figure 9 Coding Tree II – Value of NFI
Figure 10 Perceived and Actual Values of NFI
Figure 11 Coding Tree III – Use of NFI
Figure 12 Stages of NFI integration
Figure 13 Coding Tree IV – Sources of NFI
Figure 14 NFI growth model

Page 9
TABLE LIST
Table 1 Structure of research questions
Table 2 Research focus
Table 3 Quantitative research approach
Table 4 Research bias
Table 5 Age
Table 6 Nationality
Table 7 Investment data table
Table 8 Average investment allocation
Table 9 Company rankings
Table 10 Investment motives for average investment
Table 11 Sole investment results
Table 12 Sole investment analysis
Table 13 Binomial distribution parameters
Table 14 Binomial distribution analysis
Table 15 Investment motives

Page 10
GLOSSARY
CFP Corporate Financial Performance
CSP Corporate Social Performance
CSR Corporate Social Responsibility
EMH Efficient Market Hypothesis
ESG Environmental Social and Governance
FMCG Fast Moving Consumer Good
GRI Global Reporting Initiative
KPI Key Performance Indicator
NFI Non-Financial Information
NFP Non-Financial Performance
NGO Non-Governmental Organisation
PR Public Relations
PRI UN-supported Principles for Responsible Investment
R&D Research and Development
RQ Research Question
SASB Sustainability Accounting Standards Board
SME Small-Medium Enterprise
SRI Socially-Responsible Investment
UKSIF UK Sustainable Investment and Finance Association
UN United Nations
USSIF US Forum for Sustainable and Responsible Investment
VV Vertigo Ventures
WBCSD World Business Council for Sustainable Development

Page 11
PREFACE

Page 12
I. EXECUTIVE SUMMARY
We set out to investigate “how does social and environmental impact performance data
influence investors’ decision-making process in the pharmaceutical industry” on behalf of
our sponsor, Vertigo Ventures. In order to meet our research scope, we collected secondary
data which formed the basis for four research questions. This fragmented approach aimed
to incorporate all the important aspects related to our objective.
Primary data collection efforts were directed in line with the research questions. We
followed a strategy of triangulation as we combined the use of qualitative and quantitative
methods. Results were captured through interview coding and statistical analysis of a
survey.
We found that the interdependency of findings from our four research questions increased
the complexity of answering our research objective. In order to overcome this, we created a
growth model for socially responsible investment.
We predict that investors’ interest in responsible practices and sustainable companies will
continue to grow, depending on key actors. These include improvements of corporate
reporting standards and adoption of non-financial information into mainstream investing,
thus making successful integration an industry-wide benchmark.

Page 13
II. ACKNOWLEDGEMENTS
We would like to express our gratitude and appreciation to those who have helped us
during this process. This final report would not have been a success without the support and
contributions from the following:
Our sponsor, Vertigo Ventures, for their support, interest and commitment
throughout the project
Dr Richard Fairchild for his valuable feedback, enthusiasm and guidance throughout
Dr Ian Crawford for his initial supervision and direction during his temporary charge
Prof Brian Squire, Dr Gregory Schwartz, Dr Johanne Grosvold, Dr Jooyoung Jeon and
Michael Willis, for their valuable opinions and recommendations
Our questionnaire respondents for taking the time to contribute to our primary data
Our interviewees for their cooperation, insight and assistance in our research
Bath Alumni for distributing our survey

Page 14
III. MEET THE TEAM

Page 15

Page 16

Page 17
CHAPTER 1 INTRODUCTION

Page 18
INTRODUCTION
The financial crisis has been identified as a key instigator to the increased awareness of
companies’ impact on the society and environment in which they operate (UKSIF, 2013). The
deterioration of trust in the integrity of institutions, and corporate and political leaders was
one of the casualties of the financial crisis of 2008 (Leisinger, 2011). This led to an increase
in focus on risk management, corporate transparency and relationships between key actors
(Ceres, 2010; PRI, 2013b; Stewart, Berard & Fruscella, 2012). The European Commission
identified that “a new approach is needed to the balance between short-term profit
maximisation and sustainable value creation in the longer run” (PRI, 2013b, p.9).
“In the wake of the recent global financial crisis, various not-for-profit organisations have
emerged to heighten the crucial importance of identifying governance structures that can
accommodate social objectives as part of regular corporate life” (Walls, Berrone & Phan,
2012). Pressure for companies to act more sustainably has come from a variety
of stakeholders. Consumers and the general public have heightened expectations of firms’
behaviour, and their ability to act sustainably (Brønn & Vidaver-Cohen, 2009).
Aguilera et al. (2006) recognise that the ever-increasing presence of media and the
appearance of social networks have contributed to the growing awareness regarding
sustainability. Cacioppe, Forster & Fox (2008) further highlighted that “the need for
companies to become more ethical has been dramatically underlined in the public mind by
the numerous highly publicised collapses of US-based companies such as Enron, WorldCom

Page 19
and Tyco…” (p.682). As acknowledged by UKSIF (2010) “the 2008-9 financial crisis and
growing awareness of environmental risks have accelerated pressure for change” (p.2).
Figure 1 displays the increase in company sustainability reporting in different industries,
between 2008 and 2013 (KPMG, 2013). This indicates the repercussion of the financial crisis
as companies have reacted to the increase in expectations and demands from stakeholders.
Interestingly, despite the decreasing rate of reporting for some industries over the last two
years, the pharmaceutical industry has improved its performance since 2011 and seen an
exponential growth since 2008. This signifies an increase in overall impact awareness in this
sector.
Figure 1: Sector reporting trends
Image source: KPMG International Survey of Corporate Responsibility Reporting, 2013, p.27.

Page 20
RESEARCH MOTIVATION
Companies are becoming more aware of their impact on society and the environment, as
focus shifts to sustaining long-term performance. This is “set to increase and intensify as the
need to move to a truly sustainable economy is understood by companies’ and
organisations’ financiers, customers and other stakeholders” (GRI, 2013, p.3).
New developments around the global issue of corporate sustainability have fuelled our
interest within this area of research. The fragmented development of awareness, reporting
and integration within the field, highlighted an opportunity to expand on current literature.
SOURCING THE PROJECT
The varied interests of the group members combined with the practical challenge of our
academic exchange made finding a sponsor challenging. As a group, we were keen to secure
a project where we could offer meaningful academic and practical contributions. By working
with an SME, we felt our recommendations would create significant value for our sponsor.
ABOUT OUR SPONSOR
Vertigo Ventures specialises in providing tools for organisations to demonstrate social,
financial and environmental performance. Organisations use Vertigo Ventures’ cutting-edge
reporting tools to efficiently provide the most compelling and precise analysis of both the
breadth and depth of impact to their stakeholders, especially clients and funding bodies;
looking beyond the number of people affected by a project, to how their quality of life is

Page 21
changed. As a result, our clients maximise their engagement with key stakeholders, improve
their chances of securing finance and identify new income streams.
Vertigo Ventures’ tools are aligned with international reporting frameworks and build on
established models to be at the forefront of measuring intangibles. For example, the VV-
Good Index is the first impact benchmarking tool, developed with input from leaders of
global corporations and international bodies. The VV-Good Index most recently compared
the impact of global pharmaceutical companies, the results of which were reported in The
Guardian and the Financial Times.
Vertigo Ventures works with innovative clients including, RWE npower, the University of
Oxford, and Coventry University.
SPONSOR RELATIONSHIP
Our first point of contact with VV stemmed from a meeting Osas attended while on
placement at J.P. Morgan, where they delivered a company presentation on sustainability.
As we had a shared interest in this field, we contacted VV whilst on academic exchange at
Copenhagen Business School.
VV’s original project proposal was focused around establishing correlation and causation
between financial returns and social and environmental performance. We consulted
academics from the University of Bath to discuss the feasibility of this scope. From this initial
proposal, we negotiated a research scope that would satisfy both the client and the
University of Bath. This led us to explore the research objective of:

Page 22
“How does social and environmental impact performance data influence investors’
decision-making process in the pharmaceutical industry?”
RESEARCH OUTLINE
The purpose of this project was to effectively and accurately answer our research objective.
In order to do this, our project covered a detailed literature review which addressed the
most important aspects of theory and research around sustainability and socially
responsible investments. The literature review allowed the creation of four research
questions, which guided our efforts. Subsequently, we described how using the research
strategy of triangulation would help us answer our research questions. Through data
collection we gathered primary data which was subject to analysis. This resulted in a
discussion of findings, its managerial implications and recommendations to VV.

Page 23
CHAPTER 2 CONTEXT

Page 24
CHAPTER 2: CONTEXT
Milton Friedman (1970) argued that the ‘business of business is business’ and that firms’
only obligation, beyond legal requirements, is to maximise profits as efforts should focus on
maximising shareholders’ wealth. However, due to the financial crisis and recent scandals,
Friedman’s view is being further challenged.
The pharmaceutical industry has come under a lot of scrutiny recently regarding its
sustainability performance due to a series of scandals. In 2010, Johnson & Johnson was
fined USD 900 million as a result of product recalls and related plant slowdowns (Kane,
2012). In 2012, GlaxoSmithKline agreed to pay a fine of USD 3 billion to settle charges of
inappropriate promotion of antidepressants and failure to report safety data about a
diabetes drug (BBC, 2012; Kane, 2012). In addition, pharmaceutical companies, including Eli
Lilly, GSK, Merck, Novartis and Pfizer, were negatively affected by bribery and corruption
scandals in China (Jack & Waldmeir, 2013; Shobert, 2014).
As a result of negative media attention, the pharmaceutical industry has suffered significant
damages to its reputation. A recent survey carried out in the UK, by the University of
Cambridge and YouGov, established that the relationship between the public and the
pharmaceutical industry “suffers from a trust deficit. There is scepticism of the industry’s
motives and concern that its goals are misaligned with the public need” (YouGov Cambridge
Programme, 2013, para. 1). This was further supported in their findings as 74% of
participants believed pharmaceutical companies prioritise financial performance over public
health.

Page 25
“The first and foremost responsibility of any pharmaceutical company is to inform itself
about its impact on society's various needs and goals and to be sensitive to the demands of
so-called fair-minded stakeholders” (Leisinger, 2005, p.582). Therefore, the industry should
aspire to report on material environmental, social and governance factors that can affect
long-term value (Kane, 2012). Non-governmental organisations have developed frameworks
to aid this process, examples of which are the:
Global Reporting Initiative (GRI), which “promotes the use of sustainability reporting
as a way for organisations to become more sustainable and contribute to sustainable
development” (GRI, 2013)
Sustainability Accounting Standards Board (SASB) which engages in the “creation and
dissemination of sustainability accounting standards for use by publicly-listed
corporations in disclosing material sustainability issues for the benefit of investors
and the public” (SASB, 2014)
UK Sustainable Investment and Finance Association (UKSIF), a UK membership
association which promotes “responsible investment and other forms of finance that
support sustainable economic development, enhance quality of life and safeguard
the environment” (UKSIF, 2014)
US Forum for Sustainable and Responsible Investment (USSIF), a US membership
association that aims to “advance investment practices that consider environmental,
social and corporate governance criteria to generate long-term competitive financial
returns and positive societal impact” (USSIF, 2014b)

Page 26
World Business Council for Sustainable Development (WBCSD), “a CEO-led
organisation of forward-thinking companies that galvanises the global business
community to create a sustainable future for business, society and the environment”
(WBCSD, 2012)
In contrast to the organisations mentioned above, the PRI is an “international network for
investors... [that seek to] understand the implications of sustainability and... incorporate
these issues into their investment decision-making” (PRI, 2013a). As can be seen from Figure
2, the number of investors adopting responsible investment policies, as set by the PRI, has
steadily increased.
0
5
10
15
20
25
30
35
40
0
200
400
600
800
1000
1200
1400
Apr-06 Apr-07 Apr-08 Apr-09 Apr-10 Apr-11 Apr-12 Apr-13
Number of signatories Assets under management (US$ trillion)
Figure 2: PRI asset under management in trillions of U.S. dollars
No of signatories Assets under management
Image source: PRI, 2013a.

Page 27
With investors taking an increasing interest in environmental, social and governance issues,
companies need to acknowledge the importance of sustainability and report accordingly.
Companies should provide a more holistic view of their performance as it is becoming an
important part of investors’ decision-making criteria.
PURPOSE STATEMENT
The purpose of this triangulated study was to gain an understanding of investors’ decision-
making process. The study was split into a macro (societal) and micro (individual) focus
which was subject to further investigation. The macro-phase was a quantitative
investigation which addressed the relationship between social performance and financial
returns with respect to investment decisions in a student population. Information from this
research helped us establish the importance of social and environmental impact
performance data in investment decisions.
In-depth interviews were used for the qualitative micro-phase of the project. Findings
helped establish an understanding of how investors utilise social and environmental impact
performance data in investment decisions and where they obtain data. Professionals from
the financial industry, and other relevant industries, were identified as preferred
interviewees prior to the study. By using mixed methods to focus on the macro and micro
aspects of the research question, we were better able to understand the research topic.

Page 28
RESEARCH OBJECTIVE
Our research objective was to answer the following question provided by Vertigo Ventures:
“How does social and environmental impact performance data influence investors’
decision-making process in the pharmaceutical industry?”
To satisfy the objective of our study, our scope was limited to:
Establishing the extent to which investors are interested in social and environmental
impact performance data
Determining the value investors place on social and environmental impact
performance data
Ascertaining how investors use social and environmental impact performance data
to inform investment decisions
Understanding where investors obtain social and environmental impact performance
data from
Although we take the pharmaceutical industry into consideration, our research covers a
broader spectrum and can be applied to other industries.

Page 29
CHAPTER 3 LITERATURE REVIEW

Page 30
CHAPTER 3: LITERATURE REVIEW
3.1 INTRODUCTION
The aim of this chapter is to identify the current status of the industry and identify gaps for
future research within the boundaries of our given topic. We combine a company and
investor viewpoint on social and environmental impact performance data in order to gain a
holistic overview of the concept. Emerging from this chapter, we will formulate research
questions that will help us to answer our research objective.
3.2 DEFINING NON-FINANCIAL INFORMATION
Corporate social responsibility (CSR) “means something, but not always the same thing to
everybody” (Votaw, 1972, p.25).
Concepts such as ‘corporate sustainability’, ‘corporate social performance’ (CSP), ‘corporate
social responsibility’ (CSR), ‘environmental social governance’ (ESG), ‘sustainable
development’, and ‘triple bottom line’; have been developed and used interchangeably
when understanding the concept of working towards a more fair, ethical and transparent
way of doing business. The extensive list of definitions, contradictory statements and lack of
consensus has hindered the focus and applicability of these concepts (Banerjee, 2008;
Henderson, 2001; Okoye, 2009; Porter & Kramer, 2006; Steurer et al., 2005; Van Beurden &
Gössling, 2008; Wood & Jones, 1995).
To illustrate this, McWilliams & Siegel (2001) define CSR as “actions that appear to further
some social good, beyond the interests of the firm and that which is required by law”
Page 31
(p.117). In contrast, Khoury et al. (1999 cited in Dahlsrud, 2008, p.7) explicitly state that
“CSR is the overall relationship of the corporation with all of its stakeholders… Elements of
social responsibility include investment in community outreach, employee relations, creation
and maintenance of employment, environmental stewardship and financial performance”.
CSR is yet to be clearly defined within literature or the corporate world. Van Marrewijk
(2003) argued that concepts regarding CSR are presented with a bias towards specific
interests that suit the organisation. The lack of guidance around the area has led companies
to define the concept themselves through stakeholder engagement (Eccles et al., 2012). As a
consequence, CSR can be perceived as a legal requirement, an act of legitimacy, or purely a
philanthropic activity, depending on the firm’s evaluation (Okoye, 2009; Votaw, 1972).
Many non-profit organisations and committees have been established in recent years to
drive the awareness and support of sustainability on a global scale. Initiatives include but
are not limited to the GRI, PRI, SASB, and WBCSD. In addition, global actors such as the
United Nations and the European Commission have acknowledged the importance of
standardised reporting practices with regards to CSR and are actively supporting its
development.
The European Commission defined CSR as ‘‘a concept whereby companies integrate social
and environmental concerns in their business operations and in their interaction with their
stakeholders on a voluntary basis” (Commission of the European Communities, 2001, p.6).
According to Dahlsrud (2008), this is the most widely used definition in academia. However,
all-encompassing definitions, such as this, limit the applicability within firms and fail to
recognise specific characteristics for industries (Van Marrewijk, 2003). To add to the

Page 32
argument, Van Beurden & Gössling (2008) state that “CSR is not a variable and therefore [is]
impossible to measure” (p. 409).
Dahlsrud (2008) identified five dimensions which are common in CSR definitions:
environmental, social, economic, stakeholder and voluntariness. Since definitions in
literature lack consistency, we will use the term ‘non-financial information’ (NFI) to explicitly
focus on social and environmental impact performance data. This incorporates concepts
deemed valid, suitable and reliable and includes corporate social performance, ESG, CSR,
sustainability and triple bottom line.
3.3 DOING GOOD AND DOING WELL
The link between social and environmental performance and financial performance has
been researched extensively. In 1976, Merton posed the question “does the successful
business try first to profit or to serve?” (p.88). Scholars are still trying to conclude whether
companies can ‘do good and do well’ (Margolis, Elfenbein & Walsh, 2007; Porter & Kramer,
2006). Given the traditional economic view that the purpose of a company is to maximise
shareholders’ wealth (Friedman, 1962 cited in Ruf et al., 2001), the concept of corporate
sustainability may be seen as contradictory.
Since 1972, there have been over 167 studies linking social and financial performance
(Margolis, Elfenbein & Walsh, 2007). However, the social, environmental and financial
variables used in these studies have differed greatly thus generating varied results (Ruf et
al., 2001). The inconsistency of measurements has limited the comparability between
studies and any in-depth research within relationships (Margolis, Elfenbein & Walsh, 2007;

Page 33
McWilliams and Siegel, 2001; Porter & Kramer, 2006; Van Beurden & Gössling, 2008). As
such, the relationship can be argued to be negative, insignificant or positive, as there is lack
of consensus within the literature.
3.3.1 NEGATIVE RELATIONSHIP
Overall, there have been very few articles post-2000, establishing a negative relationship
between social and financial performance. However, Brammer, Brooks & Pavelin found, in
2006, a negative correlation between stock returns for UK listed companies and their
corporate social performance. They concluded that firms with higher social performance
scores achieved lower returns.
3.3.2 INSIGNIFICANT RELATIONSHIP
Griffin & Mahon (1997) reviewed research around the connection between sustainability
and financial performance over a 25 years period, between 1972 and 1997. Their findings
were inconclusive as the literature showed evidence to support both a negative and positive
relationship. In addition, McWilliams and Siegel (2000) found an insignificant relationship
between social and financial performance when important strategic attributes such as
research and development (R&D) were included in measurements.
3.3.3 POSITIVE RELATIONSHIP
Extensive academic reviews have evaluated the vast amount of literature surrounding this
topic and have recognised the positive relationship between NFI and financial performance.
Orlitzky, Schmidt & Rynes (2003) reviewed 52 articles, concluding that social and financial

Page 34
performance are positively correlated and their relationship is “bidirectional and
simultaneous” (p.470). However, only 18 articles reviewed were published post-1990,
highlighting a limitation in their conclusions as they failed to capture the significant
influence of the 1987 ‘Brundtland Report’1 (Van Beurden & Gössling, 2008). More recently,
meta-analyses conducted by Margolis, Elfenbein & Walsh (2007) and Van Beurden &
Gössling (2008) have further supported Orlitzky, Schmidt & Rynes’ argument, finding a
positive relationship between social and financial performance.
The strength of this positive relationship is dependent on the variables being measured.
Factors which play a role in establishing a significant correlation between social and financial
performance have been expanded on according to different theories.
FINANCIAL INDICATORS
The financial performance of a firm can be measured by market-based indicators, such as
share price, and accounting-based indicators, such as profitability. The degree to which
financial factors correlate with social performance is dependent on which indicators are
analysed (Griffin & Mahon, 1997). Orlitzky, Schmidt & Rynes (2003) identified that corporate
responsibility has a stronger correlation to accounting-based measures over market-based.
Contrary to this, Flammer (2013) found that the correlation is stronger with regards to
market-based indicators, with companies experiencing considerable rises in their share
price. However, Flammer (2013) also argues that this correlation is diminishing as
1 The Brundtland Report, also known as ‘Our Common Future’, was published in 1987 by the World
Commission on Environment and Development. It highlighted that global sustainability should be a vital factor for governments and businesses.

Page 35
shareholders’ reactions are weakening. Environmental responsibility is being considered to
be “a resource with decreasing marginal returns” (p.771).
REPUTATION & PHILANTHROPIC ACTIVITIES
According to Porter & Kramer (2006) “reputation is used by many companies to justify CSR
initiatives on the grounds that they will improve a company’s image, strengthen its brand,
enliven morale, and even raise the value of its stock” (p.3-4). Reputation is difficult to define
but is generally seen as an intangible asset valued by all stakeholders (Larking, 2003).
Negative implications can impede “losses, which in turn may deter customers and other
strategic partners” (Flammer, 2013, p.761).
Schnietz & Epstein (2005) found that companies with strong reputations for acting
sustainably can expect to be better protected against the risk of financial losses caused by
exogenous issues. This supports the argument that reputation, as an indicator of social
performance, has a stronger positive correlation to financial performance than other
measurements (Orlitzky, Schmidt & Rynes, 2003). Factors that affect reputation, such as
philanthropic activities or misdeeds have been argued to have a more significant effect than
other variables (Margolis, Elfenbein & Walsh, 2007).
R&D AND INNOVATION
The close link between social performance and the innovation of a firm can be attributed to
the necessity to develop knowledge and products in order to support sustainable activities
(Blanco, Guillamón-Saorín & Guiral, 2013; Hull & Rothenberg, 2008; McWilliams & Siegel,

Page 36
2000; Porter & Pavelin, 2008). It can also be argued that sustainable activities can indicate a
firm’s level of innovation (Blanco, Guillamón-Saorín & Guiral, 2013).
Blanco, Guillamón-Saorín & Guiral (2013) identified that innovation plays a mediating role in
the social and financial relationship. They suggested that innovation can influence a firm’s
social performance which will ultimately have a positive effect on the financial market-
based performance of the company.
Rodgers, Choy & Guiral (2013) explored the relationship between the innovation of a firm,
their CSR reputation and financial performance. When controlling innovation as a variable,
they concluded that the CSR reputation of a firm can enhance their financial health and
market value. This is reflective in both short-term accounting measurements and long-term
market measurements. Blanco, Guillamón-Saorín & Guiral (2013) argue that innovation
plays a strong mediating role in the relationship between social and financial performance;
as they found firms’ investments in innovation positively affect social performance.
R&D is a strong indicator of innovation, as the investment develops firm’s knowledge and
the innovation of processes and products (Luo & Bhattacharya, 2009; Rodgers, Choy &
Guiral, 2013). This has been acknowledged to positively affect the correlation between
social and financial performance (Luo & Bhattacharya, 2006; Schnietz & Epstein, 2005).
Guiral (2012) researched the role that R&D and social performance plays on lending
decisions. They found the lenders were hesitant towards R&D investments, “because of the
considerable time lag… and its questionable payoff” and more positive when allocating

Page 37
funds to social performance as the investment could “create cash flow to repay debt, or
lower risk…” (p.81).
INDUSTRY FOCUS
The validity and accuracy of research in this area can be improved by focusing on a single
industry (Chand & Fraser, 2006; Griffin & Mahon, 1997; Van Beurden & Gössling, 2008).
Simpson & Kohers (2002) found a positive correlation between accounting measurements
and social performance measurements specific to the commercial banking industry in
America. In researching the pharmaceutical industry, Turcsanyi and Sisaye (2013) found a
positive correlation between companies’ stock prices and product recalls. They concluded
that “when CSR is incorporated in business strategies of social and environmental
performance, it complements economic profitability objectives” (p.16). Hence, it can be
argued that the relationship is more accurately represented when indicators are industry
relevant.
LONG-TERM VALUE
Brammer, Millington & Cox (2004) identified that although significant responsible
investments are made by companies, the value creation will be accrued in the long-run.
Value creation can be associated with “better resource competitiveness, lower transaction
costs, employee quality and motivation, and customer goodwill” (Brammer, Millington &
Cox, 2004, p.29). Brammer and Millington (2008) further suggested that the relationship
between social and financial performance may be curvilinear. It takes time for social
performance to translate into higher financial returns and for the consistent application of a

Page 38
social strategy to have a positive pay-off. However, they also acknowledge that the
correlation is contingent upon a variety of contextual factors which include firm’s size,
industry environment and the proximity between these and the particular social initiatives
undertaken.
3.3.4 CONCLUSION
Mackey, Mackey & Barney (2007) argue that “efforts to examine the ‘overall’ correlation
between socially responsible activities and firm performance may be less interesting than
examining the relationship between the supply and demand conditions under which these
decisions are made and a firm’s market value” (p. 830).
Ultimately, the link between social and financial performance has been proven to have a
positive relationship by many academics. However, the difficulty in quantifying social
performance has led to a lack of consensus with regards to the degree of correlation. This
hinders the ability to further develop research in this area. Margolis, Elfenbein & Walsh
(2007) acknowledged “just how complex the reality of the CSP-CFP relationship may be, and
just how difficult it is to measure and assess that relationship” (p.24).
3.4 COMPANIES ACTING SUSTAINABLY
There are several factors which can influence a firm’s desire to act sustainably that can be
attributed to the positive relationship between social and financial performance. This report
will focus on three dominant areas within the literature: financial risk and reputation,
asymmetric information and the influence of stakeholders.

Page 39
3.4.1 FINANCIAL RISK AND REPUTATION
Reporting on ESG activities has been acknowledged to affect the reputation of a firm
(Bebbington, Larrinaga & Moneva, 2008; Friedman & Miles, 2002; Porter & Kramer, 2006)
and lower idiosyncratic risk (Luo & Bhattacharya, 2009). Fombrun, Gardberg & Barnett
(2000) recognised the difficulty in identifying the correlation between social and financial
performance. They suggested that “activities that generate CSP do not directly impact the
company’s financial performance, but instead affect the bottom line via its stock of
‘reputational capital’—the financial value of its intangible assets” (p.86).
It can be argued that a firm’s risk can be managed through sustainable performance
(Fombrun, Gardberg & Barnett, 2000; Godfrey, 2004; Godfrey, Merrill & Hansen, 2009;
Petersen & Vredenburg, 2009). Investments in social activities can help a firm “hedge
against down-side risk” (Fombrun, Gardberg & Barnett, 2000, p.102). Godfrey, Merrill &
Hansen (2009) identified the positive impact of social performance on a firm’s goodwill or
moral capital. It was argued that social performance does not increase financial
performance, but minimises risk as it acts as a form of insurance against negative events
(Godfrey, Merrill & Hansen, 2009; Petersen & Vredenburg, 2009).
Sustainable activities can positively impact the reputation of companies and their “ability to
attract resources, enhance its performance, and build competitive advantage” (Fombrun,
Gardberg & Barnett, 2000, p.85). They further add that social performance can reduce the
potential costs resulting from reputational damage.
Page 40
Murphy & McGrath (2013) argue that Legitimacy and Deterrence Theories influence a firm’s
sustainable actions by mitigating financial and reputational risks.
Deterrence Theory argues that financial implications, such as penalties and fines imposed by
society, will impact firms’ investments in ESG activities (Murphy & McGrath, 2013). This
relates to the theory of Transaction Cost Economics, which suggests that firms satisfy
stakeholders’ demands in order to avoid higher costs that result from non-compliance, such
as government regulations or union contracts (Ruf et al., 2001). This is supported by
Renneboog, Ter Horst & Zhang (2008) who proposed the ‘outperformance hypothesis’;
suggesting that sustainable companies will outperform unsustainable companies. Ultimately
firms make rational decisions about social performance based on a cost-benefit analysis,
where penalties are seen to be a cost (Murphy & McGrath, 2013).
The Legitimacy Theory involves firms undertaking legitimation activities to gain social
acceptance (Bebbington, Larrinaga & Moneva, 2008; Deegan & Gordon, 1996) which
includes greenwashing (Mahoney et al., 2012). According to Laufer (2003), greenwashing is
a way for firms to “creatively manage their reputations with the public, financial community
and regulators, so as to hide deviance, deflect attributions of fault, obscure the nature of the
problem or allegation, reattribute blame, ensure an entity’s reputation and finally, seek to
appear in a leadership position“ (p.255). Luo and Bhattacharya (2009) found that the impact
of ESG tends to be more significant in firms with higher use of advertising. Reservations
have been displayed by academics and various stakeholders, including consumers, on the
efficacy of social performance. For some firms, it becomes a publicity and reputation
exercise (Boesso, Kumar & Michelon, 2013).

Page 41
3.4.2 ASYMMETRIC INFORMATION
Agency Theory argues that aside from the common goals shared, ‘agents’ and their
managing counterpart, ‘principals’, will try to take advantage of existing information
asymmetry to defend their own interests, commonly referred to as an ‘agency cost’
(Shapiro, 2005). Friedman (1970) argued that firms who invest in CSR activities indicate an
issue with asymmetric information between the firm and their stakeholders. Due to the lack
of unanimity around social performance measurements, Jenson (2001) argues that as the
number of stakeholders increases, so will the agency costs. Without the control from
principals, managers (agents) can opportunistically engage in social performance to enhance
their utility and reputation as responsible managers at the cost of potential returns to the
firm or stakeholder (Brammer & Millington, 2008; Renneboog, Ter Horst & Zhang, 2008).
Asymmetric information can be minimised through the transparent disclosure of a firm’s
environmental and social activities to their stakeholders. “CSR signals a willingness to act
altruistically as opposed to purely agnostically” (Godfrey, Merrill & Hansen, 2009, p.427).
Through published sustainability reports, firms are able to signal their corporate
responsibility to stakeholders and society (Mahoney et al., 2012; Renneboog, Ter Horst &
Zhang, 2008).
3.4.3 STAKEHOLDER THEORY
Stakeholder Theory contradicts the neo-classical economic perspective that views firms as
“closed systems with their only concern being the satisfaction of their shareholders”
(Andriof, 2002, p.11). From a Stakeholder Theory perspective, a firm’s performance can be

Page 42
enhanced through identifying “groups and individuals that can affect, or are affected by, the
accomplishment of the business enterprise” (Freeman, 1984, p.25).
Freeman’s (1984) definition of stakeholders could incorporate a wide range of entities.
Gavare & Johansson (2010) highlighted the different stakeholders, creating primary and
secondary categories. Primary stakeholders involve parties that have “direct control of
essential means of support required by the organisation” (Gavare & Johansson, 2010, p.739).
This includes customers, managers, government, suppliers and shareholders. Secondary
stakeholders consist of NGOs, academics and fair-trade bodies, who are able to influence
primary stakeholders if deemed necessary.
Donaldson and Preston (1995) distinguished three branches of Stakeholder Theory:
descriptive, normative and instrumental. The descriptive approach to Stakeholder Theory
explains a specific firm’s behaviour, whereas the normative approach explains how firms
should behave in relation to moral principles, irrespective of the financial impact. The
instrumental approach attempts to establish the connection between stakeholder
management and performance measurements (Boesso, Kumar & Michelon, 2013; Brammer
& Millington, 2008). In relation to a firm’s social performance, research adopting the
instrumental approach is deemed most relevant to our project, as we focus on the
relationship between the social and financial performance with respect to stakeholders,
specifically investors.
Mitchell, Agle & Wood (1997) argued that the most important and influential stakeholders
are determined according to managers’ perception of their power, legitimacy and urgency.
Parent & Deephouse (2007) further developed this theory, suggesting that “power has the

Page 43
most effect on salience, followed by urgency and legitimacy” (p.19). Satisfying key
stakeholders can lead to a sustainable competitive advantage, according to Ruf et al. (2001)
who adopt a Resource-Based View on Stakeholder Theory.
McWilliams & Siegel (2001) argued that firms can gain a competitive advantage by acting
ethically, as they develop “lasting, productive relationships with these stakeholders” (p.
118). Epstein & Freedman (1994) suggested that this relationship could be strengthened
through fair disclosure of social activities. Trust between management and their owners,
was identified as a key element that emerged from satisfying stakeholders. “CSR, as a risk
mitigating strategy, signals competence, ethics and trustworthiness. It communicates
protected earnings and growth and seeks a diversity of investors that reduces share price
volatility. CSR is also believed to be a proxy for ethical, trustworthy corporate governance”
(Petersen & Vredenburg, 2009, p. 13).
Since the 1980s, Stakeholder Theory has developed to focus further on morality and ethics,
and more recently corporate social performance (Steurer et al., 2005). According to Wood
and Jones (1995), public policy, market and normative controls “can be related to the nature
of stakeholder expectations, experiences and evaluations of a firm’s behaviour, and so, can
inform a stakeholder theory of social corporate performance” (p.216).
3.4.4 CONCLUSION
Firms’ motives to act sustainably can be attributed to a number of different issues. As public
awareness increases, there is more pressure for firms to signal their ethical behaviour to
their stakeholders and society. Stakeholder Theory has been extensively attributed to the

Page 44
concept of CSR, as it is argued that satisfying key stakeholder demands can lead to
competitive advantage and the development of strong relationships and reputation. Acting
in a sustainable manner can also impact the long-term performance of a firm as it has been
argued to lower financial risk of non-compliance and reputational risk.
3.5 INVESTORS
As identified in the previous section, investors are key stakeholders that can influence a
firm’s behaviour. Different types of investors value the importance of NFI in various ways,
as they are known to have economic and non-economic goals (Kinder, 2005). According to
Lydenberg (2007), three different types of investors exist in the industry today: universal,
rational and social.
3.5.1 UNIVERSAL INVESTOR
Large companies, such as pension funds, insurance and private equity firms, have a stake in
a wide variety of asset classes, industries and companies (Lydenberg, 2007). This leads to
the view that their funds are universally invested in the entire economy (Hawley & Williams,
2000). These ‘universal investors’ focus on the economy as a whole, not just on one
particular investment or sector. As such, universal investors have a vested interest in the
health and long-term sustainability of the economy (Hawley & Williams, 2000; Lydenberg,
2007). They value the transparency and governance of a company and therefore show high
interest in the adoption of social and environmental activities. Due to their long-term
commitment, universal investors have the ability to influence and ‘aggressively challenge’
the management of their investee companies (Hebb, 2008).

Page 45
3.5.2 RATIONAL INVESTORS
Rational investors are categorised by the Modern Portfolio Theory, and focus on optimal
diversification, risk and returns, and alpha and beta ratios when making investment
decisions (Brammer, Millington & Cox, 2004; Hofmann, Hoelzl & Kirchler, 2008). According
to the Efficient Market Hypothesis (EMH) these investors rely on market prices as rational
benchmarks to determine return on investment (Lydenberg, 2007). Chan & Milne (1999)
found that analysts, bankers and accountants are more driven by client demand. According
to a study carried out by BIE in 1994 (cited in Deegan & Rankin, 1997, p.566), “issues
considered moral or emotional are not seen as part of the analysts’ remit, unless such issues
have identifiable financial consequences”.
3.5.3 SOCIAL INVESTORS
Social investors acknowledge the social and environmental performance of a corporation
within their investment decisions. A study by Iyer & Kashyap (2009) found that religiosity,
environmental attitudes and materialism were some of the key drivers influencing investors’
non-economic goals. However, they identified social investing efficacy to mediate the
effects of these drivers. It can be argued that social investors are the middle-ground
between universal and rational investors. This is because they are concerned with the
impact their investments have on society and the economy. However they are not driven to
favour NFI over financial returns by their size, as in the case of universal investors
(Lydenberg, 2007).

Page 46
Social investors, who are engaged with the impact of their investments, are said to
participate in socially responsible investing. In this respect, the term ‘investor’ can comprise
of private individuals; institutions such as NGOs or religious bodies; as well as investment
management firms (Responsible Investor, 2014).
3.6 SOCIALLY RESPONSIBLE INVESTMENT
3.6.1 DEFINITION
The term Socially Responsible Investment (SRI) is a relatively new concept which has seen
an increase in academic contributions (Benson & Humphrey, 2008). As SRI is yet to be
clearly defined in existing literature (Schueth, 2003; Richardson, 2008), investors and
academics use various terms to describe the same concept. These include ‘community
investing’, ‘ethical investing’, ‘green investing’, ‘impact investing’, ‘mission-related
investing’, ‘responsible investing’, ‘sustainable investing’, ‘socially responsible investing” and
‘values-based investing’ (Bugg-Levine & Emerson, 2011; Hofmann, Hoelzl & Kirchler, 2008;
Hudson, 2005; Lewis, 2001; Renneboog, Ter Horst & Zhang, 2008; Schueth, 2003; USSIF,
2014a).
For the purposes of this report, SRI will be defined as the process of integrating NFI into
financial analysis and the investment decision-making process. Investors that engage in SRI
look for companies that meet certain base standards of social and environmental
responsibility. They actively engage with companies to become responsible corporate
citizens and dedicate a portion of assets to community economic development (Henningsen,
2002; Sandberg, 2011; Sethi, 2005; Stewart, Berard & Fruscella, 2012). This report will not

Page 47
cover community economic development as it falls outside the scope of the research
objective.
3.6.2 APPROACHES
ESG INCORPORATION
Some socially responsible investors incorporate NFI into their investment decision process
alongside traditional financial analysis (Responsible Investor, 2008). Lydenberg (2007)
argued that this can be done in four different ways. ‘Full ESG Integration’ explicitly includes
an assessment of ESG risks and opportunities into all processes of investment analysis and
management. ‘Thematic Investing’ targets specific themes such as climate change, water
pollution and human rights. ‘Community Investing’ involves the direction of capital and
financial services to poor and underserved communities. Whereas ‘Screening’ utilises ESG
criteria to select or exclude investment prospects.
‘Negative Screening’ is the most widely used form of ESG incorporation. It involves avoiding
or divesting from companies with poor ESG practices, or from specific industries such as
weaponry or gambling that are deemed a-social or unethical, also widely known as ‘sin
stocks’ (Dillenburg, Greene & Erekson, 2003; Renneboog, Ter Horst & Zhang, 2008; Stewart,
Berard & Fruscella, 2012). Dillenburg, Greene & Erekson (2003) argued that the growth of
SRI has been partly driven by the “divestiture of tobacco stocks from huge state pension
funds” (p. 169).
‘Positive Screening’ involves proactively investing in companies with good ESG practices
using external rating criteria (IFAC, 2012; Renneboog, Ter Horst & Zhang, 2008). Negative

Page 48
and positive screenings are often referred to as the first and second generation of SRI
screens, respectively (Renneboog, Ter Horst & Zhang, 2008). The third generation, where
positive and negative screens are used simultaneously, is often termed as the ‘triple bottom
line’ – “due to its focus on People, Planet and Profit” (Renneboog, Ter Horst & Zhang, 2008,
p.1728). USSIF (2003) reported that 64 percent of US mutual funds, who use social
screening, apply at least five different screens, whilst only 18 percent use one.
SHAREHOLDER ENGAGEMENT
This is an integral principle to SRI, where investors communicate their concerns regarding
the sustainability of a company by applying pressure on management to improve issues
(Aguilera et al., 2006; BSR, 2009). Shareholders use these strategies to encourage
responsible business practices and improve disclosure and company policies (IFAC, 2012;
Lydenberg, 2007). Hebb (2008) identified that “it is the institutional investor coalitions that
have the greatest opportunity to influence and engage corporate management” (p.4). Lewis
& Mackenzie (2000) argued that investors will not invest in a poor performing company in
order to improve them, however should lobby to encourage change in a previously ethical
company.
For pension funds, being socially responsible is not “merely discretionary… [but] a necessary
imperative” (Sethi, 2005, p.99). Pension funds should therefore consider four factors when
making responsible investments: fiduciary responsibility, financial returns, the nature of the
investments, as well as their own increasing size and power (Sethi, 2005).

Page 49
More recently, Gond & Piani (2013) identified the positive impact of the PRI on facilitating
collective engagement between institutional investors.
3.6.3 TRENDS
The growing importance of incorporating NFI into decision making stands in stark contrast
to the observation that firms “only possess minimal ethical obligations above operating
within the law and maximising profits” (Friedman, 1970 cited in Hill et al., 2007, p.165). This
is highlighted by the increase in American ethical mutual fund products. In 1995, there were
55 SRI funds with USD 12 billion in assets under management; in 2012, this had increased to
333 funds, with assets of USD 640.5 billion (USSIF, 2014c).
Further evidence of this trend is the increasing use of third party data providers that focus
on social performance-related services, such as screening. Bloomberg states that the
number of publicly traded companies listed in its database and reporting ESG indicators
have increased by 75% (5,217 in 2011) since its launch in 2008; and a 50% increase in the
number of ESG users (2010-11) (BSR, 2012).
This immense growth is driven by a number of different factors, including a general increase
in concern regarding ethics in society, global warming, emissions trading and corporate
governance (BSR, 2009; PRI, 2013b; Renneboog, Ter Horst & Zhang, 2008; USSIF, 2014a).
There is also growing recognition that research and analysis of ESG factors are fundamental
in assessing the value and performance of investments over the medium and longer term
(PRI, 2013a). Heightened awareness of risk and risk management due to the global financial
crisis and legislation, such as the Kyoto Protocol, has brought the importance of NFI to the

Page 50
forefront of public concern (PRI, 2013b; Renneboog, Ter Horst & Zhang, 2008). According to
Cheah et al. (2011), who explored generational attitudes, SRI will continue to grow in
importance as management is put under increasing pressure to incorporate NFI in their
operations.
3.6.4 MOTIVES
According to Cropanzano et al. (2001) the factors that drive responsible investors’ interest in
SRI can be related to three fundamental human needs: ‘Instrumental’, the need for control;
‘Relational’, the need for belongingness; and ‘Morality-based’, the desire for a meaningful
existence.
INSTRUMENTAL MOTIVES
Research shows that instrumental motives, stemming from self-interest, are the strongest
drivers of interest in SRI (Hofmann, Hoelzl & Kirchler, 2008). Investors seek long-term
financial outperformance, as there is growing evidence of a positive correlation between
social and financial performance (Aguilera et al., 2006; Brønn & Vidaver-Cohen, 2009; BSR,
2009; Ingalls & Lehman, 2014). Investors’ instrumental motives relate to their need to
control their investments in terms of valuation, risk and quality management, and their
resilience to future challenges (Aguilera et al., 2006). A survey conducted by Novethic (2013)
found that “long-term risk management is set to become asset owners’ principal motive to
integrate ESG criteria into asset management” (p.5). Their interest in SRI can be linked to
the potential competitive advantage achieved through positive sustainability practices
(Aguilera et al., 2006).

Page 51
RELATIONAL MOTIVES
SRI can be driven by relational motives such as client demand, reputation and
greenwashing. Relational motives are defined as a concern for status and rank within
particular groups (Cropanzano et al., 2001). Beal, Goyen & Phillips (2005) advocate that SRI
activity is not wholly dependent on the expectation of financial returns, but also on the
emotional satisfaction these investments yield. They compared ethical and traditional
investment practices and found that “in addition to financial returns, the [ethical]
investment yields a flow of pleasure and even social status” (p.17).
MORALITY-BASED MOTIVES
Morality-based motives are driven by the awareness of corporate responsibility and
fiduciary duties managers have to their various stakeholders (Brønn & Vidaver-Cohen, 2009;
Richardson, 2008). For these investors, creating positive social or environmental impact is
an integral part of corporate mission statements, as well as personal values and goals. In
economic terms, this subset of investors seeks to minimise negative externalities and
enhance positive externalities (Sethi, 2005). This relates to the ongoing debate as to
whether it is possible to ‘do good and do well’. Jansson & Biel (2010) state that “most
ethical investors have a mixed portfolio where ethical or responsible investment is part of a
broader investment strategy that balances risk and return” (p.136). In essence, responsible
investors aim for strong financial performance, but also believe that these investments
should contribute to advancements in social and environmental practices (Haigh &
Hazelton, 2004).

Page 52
3.6.5 CHALLENGES
Although there is a rising awareness and adoption of sustainable practices, challenges exist
that hinder the ability to integrate NFI into mainstream investment.
EFFICIENT MARKET HYPOTHESIS (EMH)
According to the EMH Theory, ‘semi-strong form efficiency’ suggests that stock prices are
fully reflective of all public information available in security markets (Malkiel & Fama, 1970).
This traditional, rigid view of rational investors fails to include a sustainable dimension. This
is due to the difficulty in quantifying non-financial factors and determining the extent to
which NFI is reflected in share price (Juravle & Lewis, 2008). However, the theory has been
criticised as it ignores the role of cognitive biases of individuals, and assumes investors make
rational decisions (Malkiel, 2003).
FIDUCIARY DUTIES
There is a divergence of opinion with respect to the relationship between SRI and fiduciary
duties. Pension funds, a strong advocate of SRI, believe that fiduciary duties include making
responsible investments (Sethi, 2005). Hawley & Williams (2000) state that “fiduciary
institutions are in a unique position to develop and pursue policies of virtuous efficiency,
minimising negative externalities and encouraging positive outcomes” (p.239).
However, critics argue that focusing on ESG criteria when making investment decisions is an
irrational form of investing (Beal, Goyen & Phillips; 2005). According to Friedman (1962 cited
in Ruf et al., 2001, p.143), “corporate expenditures on social causes are a violation of

Page 53
management’s responsibility to shareholders, to the extent that the expenditures do not lead
to higher shareholder wealth”. Considering ESG factors violates managers' fiduciary duties
as it weakens incentives to pursue high risk-adjusted returns at the expense of maximising
shareholder wealth (Jansson & Biel, 2010; Juravle & Lewis, 2008; Renneboog, Ter Horst &
Zhang, 2008; Sethi, 2005).
According to Agency Theory, it could be argued that fiduciary duties should be determined
by the individual investors. This is also supported by Ruf et al. (2001) in their investigation of
Stakeholder Theory. “Top management (agents) is duty-bound to allocate resources to CSR-
related agendas consistent with views held by SRIs (principals). So the uptake of SRI and its
effect on fiduciary duty should be determined by principal agenda” (Cheah et al., 2011,
p.318). Therefore, if shareholders desire company management to act sustainably, it
becomes a fiduciary duty, and vice versa.
SHORT-TERMISM
Krehmeyer et al. (2006) defined short-termism as “the excessive focus of some corporate
leaders, investors, and analysts on short-term, quarterly earnings and a lack of attention to
the strategy, fundamentals and conventional approaches to long-term value creation” (p.3).
SRI is based on long-term value creation and requires planning and stakeholder engagement
(IFAC, 2012; Solomon & Solomon, 2006). This is in contradiction to the traditional passive
view of institutional investors who focus on short-term gains (Dillenburg, Greene & Erekson,
2003). Therefore, rational investors lack the motivation and incentive to pursue SRI (Jansson
& Biel, 2010; Juravle & Lewis, 2008).
Page 54
HERD BEHAVIOUR
When managers fail to utilise private information and instead follow the investment
decisions of others, it is known as ‘herd behaviour’ (Juravle & Lewis, 2008; Nofsinger & Sias,
1999; Scharfstein & Stein, 1990). Scharfstein & Stein (1990) suggests that herd behaviour is
a consequence of “rational attempts by managers to enhance their reputations as decision
makers” (p.478).
Herding can also result from ‘institutional isomorphism’. DiMaggio & Powell (1983)
advocate three mechanisms that can lead to herd behaviour. These are coercive, political
influence; mimetic, the response to uncertainty; and normative, which is associated with
professionalisation. Within the financial industry, uncertainty and competition can cause an
organisation to model itself after a perceived successful organisation within the industry.
Therefore, herd behaviour can act as both a driver and barrier to incorporating NFI into the
investment decision process.
DISCLOSURE AND REGULATION
Disclosure provides data about the firm’s impact on society and the environment, reflecting
the firm’s relationship with its stakeholders (Boesso, Kumar & Michelon, 2013; Epstein &
Freedman, 1994). “Nowadays, stakeholders are demanding the ‘giving of an ethical, social
or environmental account’ as well as a financial account” (Adams, 2004, p.732). This can be
a voluntary exercise, but for some industries it is mandatory. Székely and Knirsch (2005)
argue that “reporting on and communicating sustainability investments and achievements
helps demonstrate transparency and seriousness of intent” (p.631). However, the lack of

Page 55
universal standards of reporting makes it “difficult for companies to know exactly how to
measure and report on some dimension of sustainability performance” (Eccles et al., 2012,
p.65).
The veracity of sustainability reports is often questionable due to lack of consistent
reporting standards and independent external monitoring that is present in traditional
financial analysis (Eccles et al., 2012; Sethi, 2005). This presents a challenge for investors as
it is “difficult to obtain data on broad areas of corporate social and environmental
performance” (Sethi, 2005, p.107).
However, measures are being taken to improve and increase social and environmental
reporting standards universally. The GRI created the ‘G4 Guideline’ for company reporting.
This framework “enables greater organisational transparency and accountability” by
providing a “reporting system that provides metrics and methods for measuring and
reporting sustainability-related impacts and performance” (GRI, 2013).
For signatories of the UN-supported PRI, reporting on SRI is a mandatory requirement. The
PRI states that “…as institutional investors, we have a duty to act in the best long-term
interests of our beneficiaries. In this fiduciary role, we believe that environmental, social and
corporate governance (ESG) issues can affect the performance of investment portfolios” (PRI,
2013b, p.2). As of April 2013, the PRI had 1200 signatories, including both public and private
pension funds and investment managers with assets exceeding USD 35 trillion (PRI, 2013a).
Gurthie and Parker (1990 cited in Epstein & Freedman, 1994) advocate two models which
encourage companies’ disclosure practices. The ‘utility model’ states that information is

Page 56
only supplied in so far as corporate stakeholders demand it; whilst the ‘political economy
approach’ states that companies disclose only to “serve corporate political or ideological
goals” (p.95). With regards to the ‘political economy approach’, there is a risk of
greenwashing, making sustainability reporting “little more than public relation exercises”
(Chan & Milne, 1999, p.265).
To reduce the risk of greenwashing and increase the applicability of disclosure, it has been
argued that sustainability reporting should be industry specific. In 1994, Epstein and
Freedman recognised that it is imperative to look at social disclosures separately as their
importance is not homogenous. Eccles et al. (2012) and BSR (2009) expand on this view by
stating that industry-specific materiality should be measured according to which ESG factors
most impact a company’s ability to generate value.
Efforts are being made to create universal standards of reporting to improve comparability
and accuracy. However, evidence shows that industry-specific measures would be more
applicable as ESG factors have varying levels of relevance and impact on different industries.
“While not a panacea... developing sector-specific guidelines on what sustainability issues
are material to [each] sector and the Key Performance Indicators (KPIs) for reporting on
them would significantly improve the ability of companies to report on their ESG
performance” (Eccles et al., 2012, p.70).
3.6.6 CONCLUSION
The existing literature has indicated the increasing interest in SRI as funds and third party
data providers have grown over recent years. Screening has been identified as a main

Page 57
method of ESG adoption. However, as the industry develops, stakeholder engagement has
become more prevalent. The drivers for SRI adoption can mainly be attributed to pressure
from client demand; although self-interest can also play a key role (BSR, 2009). In order for
the industry to develop, challenges regarding investors’ behaviour, such as short-termism
and herd behaviour, need to be addressed. Regulation can encourage the progress of this
development, as well as the standardisation of disclosure within industries.

Page 58

Page 59
CHAPTER 4 RESEARCH QUESTIONS

Page 60
CHAPTER 4: RESEARCH QUESTIONS
As our aim was to identify “how does social and environmental impact performance data
influence investors’ decision-making process in the pharmaceutical industry” the literature
review was structured according to appropriate subtopics. This broadened our
understanding of the area and helped us identify gaps within existing literature, which we
aimed to cover through our research.
Overall, we found that current literature focuses on the company’s perspective of social
performance and its relationship to financial performance. As suggested by Mackey, Mackey
& Barney (2007), we focus on the driving forces behind the supply and demand of NFI by
specifically focusing on investors. Investors are integral to the success of a company, so it is
important to understand their perspective regarding corporate sustainability.
4.1 DOING GOOD AND DOING WELL
In the literature review we found numerous studies that indicate a positive correlation
between factors of social and financial performance. For the majority of these studies,
quantitative methods were used to prove a positive relationship between the two variables.
However, indicators varied to the extent that the strength of the correlation remains
unknown. Research can be traced back to the 1970s, but results are limited in applicability
to our research as the financial industry has developed.
In recent years, research in this area has grown, but the focus has been limited to
companies. Therefore, we focused on investors’ perspectives of this concept. This

Page 61
contributes to the literature by providing detailed qualitative data. We sought to
understand to what extent investors are influenced by the growing importance of NFI and
its role within investment decisions. This led us to our first research question:
RQ 1: To what extent are investors interested in non-financial information?
4.2 COMPANIES ACTING SUSTAINABLY
Companies incorporate sustainable practices to minimise the risk of damaging reputation as
well as the financial implications caused by regulation. Unfortunately, the risk of
greenwashing exists as companies attempt to improve goodwill. The literature identifies
two main obstacles for companies in this endeavour.
Agency and Stakeholder Theories both advocate that companies undertake sustainable
activities to satisfy demand from their shareholders. This could be to minimise agency costs
or retain current shareholders. Understanding that there is investor demand for NFI, it is
unknown to what extent it is considered valuable investment information. This is reflected
in our second research question:
RQ 2: What value does non-financial information provide investors with?
4.3 INVESTORS
Investors can be categorised as universal, rational or social, according to their economic and
non-economic goals. Pension funds, hedge funds, investment banks and private equity
funds all value NFI, depending on their agenda and exposure to market demands. The

Page 62
current literature fails to differentiate between the demands for NFI from various types of
investors.
The literature suggests that universal investors are adopting more responsible approaches
to investing, similar to practices found in SRI. Following the economic recession, public
scrutiny has increased and NFI has become more important to investors. We aimed to
understand how far this has developed and whether the categorisation of investors still
holds as practices become increasingly merged. We aimed to answer this through the first
research question:
RQ 1: To what extent are investors interested in non-financial information?
4.4 SOCIALLY RESPONSIBLE INVESTMENT
SRI is a relatively new concept in the financial industry involving the integration of NFI into
investment decision making. Our trend analysis found that there is an increase in SRI
practices as well as data availability. This could be due to investors placing more importance
on the impact of NFI. However, in order for SRI to advance, the industry needs to overcome
some difficult challenges. We found that it is essential for reporting on NFI to be improved;
investors need to shift focus from a short to long-term perspective and fiduciary duties
should accommodate the growing importance of NFI.
SRI-related literature takes a high-level view of trends within the industry, with particular
focus on social investors. To help answer our research objective, we investigated the

Page 63
utilisation of NFI in investment decisions by universal investors at a more granular level. The
third research question highlights the application of NFI in decision making:
RQ 3: How do investors use non-financial information to make investment decisions?
When comparing the literature review to the scope of our research objective, we identified
an area that remains relatively under-researched. Little information was available to build
an understanding of where investors obtain companies’ NFI. This aspect is relevant to our
research objective and contributes to the overall understanding of the research topic. It is
therefore necessary to investigate this area, as it forms the scope of our fourth research
question:
RQ 4: Where do investors gather non-financial information from?

Page 64
4.5 OVERVIEW OF RESEARCH QUESTIONS
Table 1 illustrates the process we followed to identify our research questions and the
subsequent method of collecting primary data.
Table 1: Structure of research questions
Define NFI Doing good and doing
well
Companies acting sustainable
Investors Socially
Responsible Investment
Literature Review
Negative Insignificant Positive
Asymmetric Info
Risk and Reputation
Stakeholder Theory
Social
Rational
Universal
Motives Trends Approaches Challenges
Adopting an investor perspective
Research Question
1. Extent of interest in NFI?
2. How much do investors value NFI?
1. Extent of interest in NFI?
3. How do they use NFI? 4. Source of NFI?
Research Method
Students Investors
Students
Investors
Students
Investors Investors

Page 65
CHAPTER 5 METHODOLOGY

Page 66
CHAPTER 5: METHODOLOGY
5.1 INTRODUCTION
This section aims to justify our rationale for how we answer our research questions. We
identified triangulation to be the most appropriate research approach as the simultaneous
utilisation of quantitative and qualitative research methods are viewed as complementary
rather than competitive (Jick, 1979).
5.2 RESEARCH PHILOSOPHY
Creswell (2009) notes that research philosophy needs to be identified because it can
“influence the practice of research” (p.5). Research philosophy guides how interviewers
interpret observations, question their surroundings and draw conclusions (Babbage &
Ronan, 2000). Without a distinct philosophical position, researchers are at risk of conducting
inappropriate research, which can diminish its validity and authority (Holden & Lynch,
2004).
Our proposed research philosophy is interpretivism which “advocates that it is necessary for
the researcher to understand differences between humans in our roles as social actors. This
emphasises the differences between conducting research among people rather than objects”
(Saunders, Lewis & Thornhill, 2009, p.116).
We followed an interpretivist philosophy because it focuses on human’s ability to assign
value and meaning to the world around them. Interpretivists believe that “research should

Page 67
be the interpretations or meanings that people bring to the social interactions that make up
society” (Chapman & McNeill, 2005, p.183). We agree with this philosophy as we see the
world as a socially constructed environment which is constantly under subjective scrutiny.
We acknowledge that people are open to change and that multiple views of reality exist
(Saunders, Lewis & Thornhill, 2009). Our project does not aim to challenge subjective views
but rather map people’s attitudes and beliefs according to the research questions.
5.3 RESEARCH APPROACH
Our project has taken a deductive research approach by using quantitative and qualitative
research methods to test research questions. The deductive approach “involves the
development of a theory that is subject to a rigorous test” (Saunders, Lewis & Thornhill,
2000, p.87). This research approach is highly structured, which makes replication plausible
and adds rigor to our project.
5.4 TIME HORIZON
A cross-sectional study is defined by Saunders, Lewis & Thornhill (2009), as conducting
research in present situations to gain a ‘snapshot’ of the research area at the current time.
By conducting a cross-sectional study, we were able to explore the importance of a range of
variables on our research questions. This differs from a longitudinal study which involves
monitoring the same variables over an extended period of time (Ghauri & Grønhaug, 2010).
A longitudinal study could add a different perspective; however, due to the finite timescale
and the nature of the project, we decided to conduct cross-sectional research.

Page 68
5.5 RESEARCH DESIGN
5.5.1 RESEARCH DESIGN FRAMEWORK
As “insights may be gained gradually, and may also be modified and/or changed over time”
(Ghauri & Grønhaug, 2010, p.29), we found the literature review to have significantly
shaped and guided our approach to research design. The continuous review of literature led
us to constantly develop the research questions and scrutinise our survey and interview
questions. This process is outlined in Figure 3.
Figure 3: The research process
Image source: Ghauri & Grønhaug, 2010, p 30

Page 69
However, it should be noted that “in reality, the [research] process is not so orderly and
sequential, and is rather messy” (Ghauri & Grønhaug, 2010, p.29). The model lacks feedback
loops, as our research design changed with the development of the literature review.
5.5.2 RESEARCH PURPOSE
By analysing existing literature, gaps in the scope of our research topic were discovered.
Since our project followed a deductive approach, adopting a descriptive research method
seemed logical as we aimed to accurately record human behaviour and beliefs. According to
Hair et al. (2011), the goal of adopting descriptive research is to accurately describe people
and scenarios.
5.6 RESEARCH STRATEGY
5.6.1 CHOOSING THE RESEARCH STRATEGY
To ensure a systematic approach, the scope of our research was divided into a macro and
micro-level in order to understand the topic (Table 2).
Research Focus Research Question
Macro 1. To what extent are investors interested in non-financial information? 2. What value does non-financial information provide investors with?
Micro 3. How do investors use non-financial information to make investment decisions? 4. Where do investors gather non-financial information from?
Table 2: Research focus

Page 70
The macro-level analysis focused on understanding societal attitudes and beliefs towards
the use of NFI in investment decisions. Whereas the micro-level specifically looked at what
value investors assign to NFI and where they obtain data.
In order to address societal attitudes and answer research questions 1 and 2, we aimed to
conduct a focus group. However, due to limitations, such as the timeframe and small
sample, it was decided that a survey would be more suitable. Quantitative research
methods, such as surveys, can be advantageous as “the reduction to a parsimonious set of
variables, tightly controlled through design or statistical analysis provides measures or
observations for testing a theory” (Creswell, 2009, p.145).
To capture the level of detail required to answer research questions 3 and 4, it was
appropriate to conduct in-depth interviews with a select group of individuals. By using semi-
structured interviews we were able to ask follow-up questions to ensure collection of rich
qualitative data.
Combining qualitative and quantitative research methods provided rigor and formed the
basis of our triangulation strategy. “The use of both quantitative and qualitative strategies in
the same study is a viable option to obtain complementary findings and to strengthen
research results” (Thurmond, 2001, p.257).
5.6.2 TRIANGULATION
Triangulation answers the same research question by combining different research methods
(Denzin, 1978). This approach can include “increasing confidence in research data, creating

Page 71
innovative ways of understanding a phenomenon, revealing unique findings, challenging or
integrating theories, and providing a clearer understanding of the problem” (Thurmond,
2001, p.254).
Triangulation can occur across multiple stages of the research process. According to
Thurmond (2001), data source triangulation can vary with respect to time, space and
person. We accomplished triangulation by ensuring our interview subjects had different
professional backgrounds.
Investigator triangulation is defined as “using more than one observer, interviewer, coder or
data analyst in the study” (Thurmond, 2001, p.254). This was achieved by having at least
two interviewers, as well as involving all team members in the analysis of the results.
Though disagreements exist regarding the scope of methodological triangulation, it is
repeatedly referred to in literature as a mixed method approach (Thurmond, 2001). By using
quantitative and qualitative research methods, our strategy fulfilled the general scope of
methodological triangulation.
When two or more methods are used to analyse research data, it is known as data-analysis
triangulation (Thurmond, 2001). By applying binomial and multiple linear regression analysis
to our results, we were able to achieve triangulation and validate our findings.

Page 72
5.7 RESEARCH METHODS
There is a vast amount of qualitative and quantitative research methods available to
researchers. Quantitative data is normally collected through surveys where answers are
close-ended and predetermined (Karlsson, 2009). Qualitative data can be collected through
a variety of ways, such as observations, interviews, documents and audio-visual materials
(Creswell, 2009).
5.7.1 STUDENT SURVEY
A survey was deemed the most suitable data collection method due to time constraints, a
limited budget, as well as our ability to analyse the variables. The aim was to measure
societal attitudes towards the use of NFI in investment decision making.
The survey was aimed at a variety of students from the University of Bath and contained
eight questions which included demographic, open-ended and closed-ended formats. The
survey variables, social and financial performance, were defined at the beginning of the
survey to limit misinterpretation from participants. This is particularly important as Forza
(2009, p.122) states that “if a question is not understood or is interpreted differently by
respondents, the researcher will get unreliable responses to the question, and these
responses will be biased.” Information presented to the respondents was based on the work
of van der Laan Smith et al. (2010), who used a hypothetical scenario in their survey
research. Prior to data collection, a pilot survey was completed by 10 students, the team
and our academic advisor. The final survey was adjusted according to the feedback received.

Page 73
5.7.2 STUDENT SURVEY: DATA COLLECTION
The survey software Survey Monkey was used to collect data. A link to the survey was
distributed online by our academic advisor and the team between 15 January and 9
February 2014. Upon closing the survey, our sample consisted of 279 respondents, in line
with standards set by University Protocol (University of Bath, 2009). The variables we tested
and their relevance to our research questions can be found in Table 3.
Variable Name Research Question Item on Survey (Appendix VII)
Dependent variable: Allocation of investment
2: What value does NFI provide investors with?
Question 5: Allocation of investment
Question 6: Ranking of investment
Independent variable: Social performance
1: To what extent are investors interested in NFI?
Question 7: Justification of investment
Question 8: Justification of chance to invest in only one company
Independent variable: Financial return
1: To what extent are investors interested in NFI?
Question 7: Justification of investment
Question 8: Justification of chance to invest in only one company
Table 3: Quantitative research approach

Page 74
5.7.3 INTERVIEW
In-depth semi-structured interviews allowed us to collect extensive data, which could not be
captured using other methods. Participants’ profession and experience ranged from fund
managers to academics. By consulting a variety of experts, we gained a holistic view of the
research topic.
Open-ended questions allowed the interview to be tailored to the participant’s area of
expertise, enabling us to capitalise on their knowledge. Although there were elements of
flexibility within our approach, consistency was achieved by ensuring the conversation
always remained relevant to the scope of our research. The questions were piloted by using
a survey. The reason for this was two-fold. Firstly, we wanted to ensure that the interview
questions were relevant. Secondly, we wanted to test the response rate for follow-up
interviews which influenced our approach to secure participants.
5.7.4. INTERVIEW: DATA COLLECTION
Interviews were secured through directly emailing companies of interest, as well as through
the networks of Vertigo Ventures, our academic advisor and the University of Bath Alumni.
Additionally, some interviews were secured through recommendations from participants.
Consequently, the participants formed a convenience sample, which could have affected the
level of bias. However, due to the nature of the project, other types of sampling would not
fulfil our participation criteria. In total, we conducted twelve interviews between 5 and 27
February 2014 via phone or face-to-face meetings, depending on the constraints of time and

Page 75
location. Every interview was recorded by phone and dictaphone to enable cross-
referencing, then transcribed by members of the team.
5.7.5 INTERPRETING THE DATA
In order to interpret our primary data, statistical analysis was applied to the quantitative
findings and manual coding was used to analyse the qualitative records.
5.8 LIMITATIONS
This section will outline the potential limitations of our research and explain how we
overcame or minimised their adverse effects.
5.8.1 RELIABILITY AND VALIDITY OF TRIANGULATION
Reliability is the consistency of techniques used for data collection which yield accurate,
replicable results (Hair et al., 2011). We increased reliability through the use of
triangulation; the combination of quantitative and qualitative research methods. However,
since our project was cross-sectional and focused on a specific period of time, replication is
threatened.
“Validity is the extent to which a construct measures what it is supposed to measure” (Hair
et al. 2011, p.238). This was achieved by conducting primary research which met the scope
of the research objective.

Page 76
5.8.2 BIAS
Upon reflection, we identified the biases that could have affected our research. Table 4
illustrates how we proceeded to minimise their impact.
Bias Risk Resolution
Participant bias Interpersonal barriers may have impacted disclosure
Provided participants with the option of anonymity; Transparent in our intention which created trust
Sample bias: Interviews Small sample of participants
Interviewees worked in different companies which ensured a variety of viewpoints
Sample bias: Survey Convenience sample, student population
Reached over 250 participants from different university departments which ensured reliable statistical analysis
Framing bias Wording of questions could be leading
Primarily used open-ended questions to allow participants to express their views
Observer bias Observers’ view could influence the interview process
Interviewer triangulation limited personal bias and improved credibility
Measurement bias Inaccurately measuring outcomes
Pilot testing both research methods ensured validity
Design bias
In triangulation, inaccuracy of one method might not reduce the inaccuracy of the other
Chose complementary research methods to support our macro/micro view
Analysis bias In triangulation the use of two research methods can lead researchers to emphasise the findings of one method over another
Applied two research questions to each research method
Table 4: Research bias

Page 77
5.8.3 ETHICS
Ethical considerations often arise in social research particularly in relation to the collection
and analysis of data (Bryman, 2012). Ethical issues cover a wide scope and can deal with
“communicating benefits and risks, protection of identity, privacy [and] obtaining informed
consent” (Karlsson, 2009, p.27). As ethical integrity is essential, we evaluated Bryman and
Bell (2007) ‘10 Principles of Research Ethics’ in relation to our project. Only two criteria
were identified as relevant: consent from participants and full anonymity. We overcame
these issues in the collection of both quantitative and qualitative data by inviting
participants to be involved and guaranteeing them anonymity.

Page 78

Page 79
CHAPTER 6 QUANTITATIVE FINDINGS & ANALYSIS
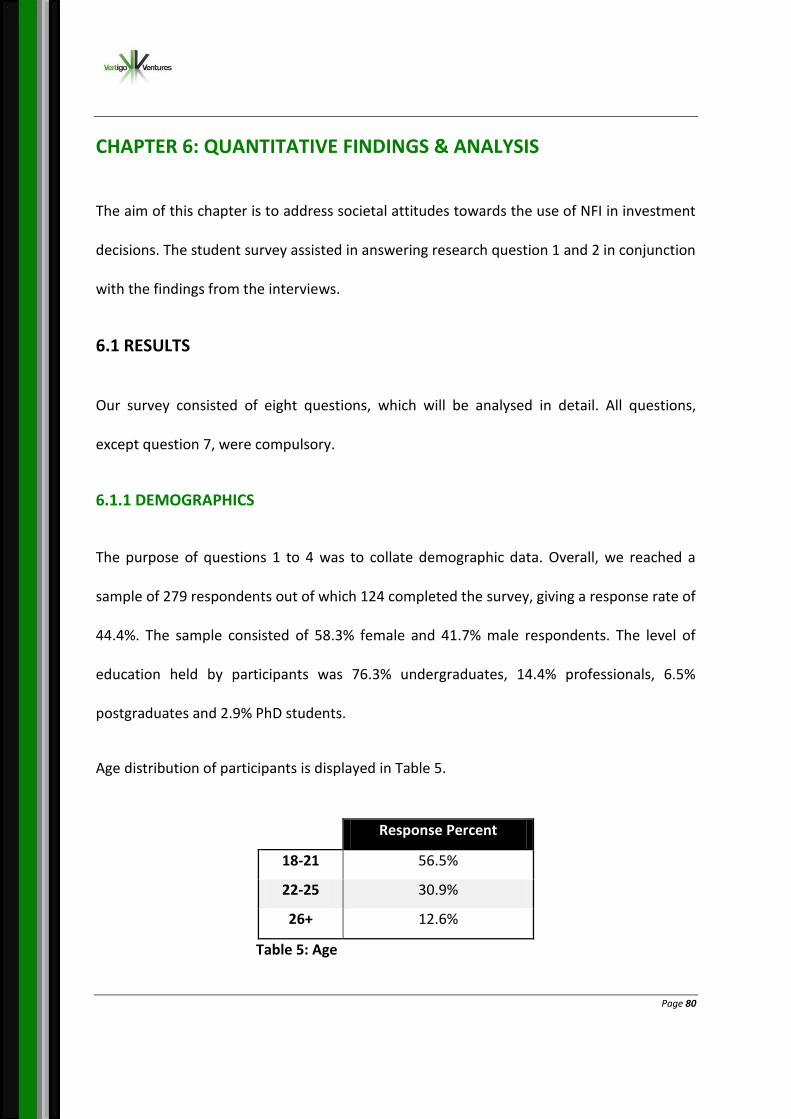
Page 80
CHAPTER 6: QUANTITATIVE FINDINGS & ANALYSIS
The aim of this chapter is to address societal attitudes towards the use of NFI in investment
decisions. The student survey assisted in answering research question 1 and 2 in conjunction
with the findings from the interviews.
6.1 RESULTS
Our survey consisted of eight questions, which will be analysed in detail. All questions,
except question 7, were compulsory.
6.1.1 DEMOGRAPHICS
The purpose of questions 1 to 4 was to collate demographic data. Overall, we reached a
sample of 279 respondents out of which 124 completed the survey, giving a response rate of
44.4%. The sample consisted of 58.3% female and 41.7% male respondents. The level of
education held by participants was 76.3% undergraduates, 14.4% professionals, 6.5%
postgraduates and 2.9% PhD students.
Age distribution of participants is displayed in Table 5.
Response Percent
18-21 56.5%
22-25 30.9%
26+ 12.6%
Table 5: Age

Page 81
Furthermore, respondents were asked to disclose their nationality by country. Responses
were grouped into continents, except for the United Kingdom. This is illustrated in Table 6.
Regions Response Percent
Africa 3.6%
Asia 10.8%
Europe (ex. UK) 27.7%
UK 53.2%
North America 1.8%
South America 1.8%
Oceania 1.1%
Table 6: Nationality
The terms used in the survey were defined prior to relevant questions. We defined financial
returns as “a company’s average share price appreciation over the last three years”. This
was given as a percentage, based on the expected rate of return. Social performance was
defined as “an average score from the last three years, based on various indicators such as
environmental compliance, labour practices and product responsibility”. This was measured
on a scale from 0 to 10; representing ‘no exercise’ to ‘full exercise’, respectively.
The definition of each term was presented next to a table of eight hypothetical
pharmaceutical companies, with their respective contrived financial return and social
performance scores (Table 7). These variables were constructed according to a study carried
out by van der Laan Smith et al. (2010), where findings were based on hypothetical

Page 82
parameters. The values attributed to financial returns and social performance scores are
artificial, but included a reasonable spectrum of possible settings.
Average financial return was 12.5% and the average social performance score was 5.1.
This table was used in the survey to answer questions 5 to 8.
6.1.2 ALLOCATION OF INVESTMENT
In question 5, respondents were requested to allocate £100 across the eight companies in
the portfolio shown in Table 7, using a ratio scale. Investment decisions were to be based on
a 5-year strategy. Participants were informed that investments could be distributed freely
between the eight companies and the allocation of funds could range from £0 and £100.
However, the whole allowance had to be invested.
Social Performance Financial Returns
Company 1 9 13%
Company 2 9 5%
Company 3 8 8%
Company 4 6 15%
Company 5 5 10%
Company 6 3 12%
Company 7 1 20%
Company 8 0 17%
Table 7: Investment data table

Page 83
Average funds allocated to each company are displayed in Table 8. The sum of the average
investments in the table does not equal 100, which will be explained in section 6.2.
It is evident from Table 8 that Companies 1, 4 and 7 attracted the highest levels of
investment from participants. This could be due to the above-average financial and social
performance of Companies 1 and 4. The popularity of Company 7 could be attributed to
having the highest financial return in the portfolio, despite scoring below average on social
performance.
6.1.3 RANKING OF INVESTMENT
In question 6, respondents were asked to rank the eight companies in terms of preference
on a scale of 1 to 8; 1 being the most preferred and 8 the least preferred investment. This
was measured using an ordinal scale. Results were produced as average ranking and
Social Performance Financial Returns Average Investments
Company 1 9 13% 35.97
Company 2 9 5% 4.55
Company 3 8 8% 6.75
Company 4 6 15% 22.62
Company 5 5 10% 4.76
Company 6 3 12% 4.46
Company 7 1 20% 24.13
Company 8 0 17% 9.01
Table 8: Average investment allocation

Page 84
majority ranking. Average ranking displays the mean, while majority ranking displays the
mode of responses, as shown in Table 9.
Social Performance Financial Returns Average Ranking Majority Ranking
Company 1 9 13% 2 1
Company 2 9 5% 6 8
Company 3 8 8% 5 7
Company 4 6 15% 2 2
Company 5 5 10% 5 6
Company 6 3 12% 6 5 / 6 *
Company 7 1 20% 4 1 / 7 *
Company 8 0 17% 6 8
* The majority rankings of Companies 6 and 7 are split between two rankings
Table 9: Company rankings
Similar to investment allocation, Companies 1, 4 and 7 were the most preferred as they had
the highest average rankings. As expected, Companies 1 and 4 had the highest majority
rankings.
Interestingly, the majority ranking of Company 7 was split as the same number of people
ranked it as their best and second-worst investment choice. This could indicate a divergence
of preference as Company 7 has a below-average social performance score but yields the
highest financial returns.

Page 85
6.1.4 REASON BEHIND INVESTMENT
In question 7, respondents were asked to explain the rationale behind their investment
decision in question 5. The number of respondents decreased from 124 to 105, as this
question was optional. Answers were quantified and categorised according to four recurring
themes: risk avoidance, achieving a balance between financial and social performance,
moral concern and maximising financial performance. Non-applicable answers were
categorised as other.
Table 10 shows that for the majority of respondents, it was important to strike a balance
between financial returns and social performance when allocating their funds in the
portfolio.
Risk Balance Moral Financial Other
Total Responses 14 41 14 29 7
% 13% 39% 13% 28% 7%
Table 10: Investment motives for average investment

Page 86
6.1.5 PREFERRED INVESTMENT
In question 8, respondents were asked to invest all their funds in a single company with
justification for their choice. Participants’ responses were quantified and are displayed in
Table 11. Unspecified responses were categorised as other.
Companies 1, 4 and 7 attracted the highest number of respondents. However, participants’
preferences towards Company 7 seem to have decreased compared to previous questions.
Answers to question 8 were also categorised according to themes. Interestingly, we found
the same themes recurring from question 7: risk avoidance, achieving a balance between
financial and social performance, moral concern and maximising financial performance. We
classified non-applicable answers as unspecified.
Social Performance Financial Returns Respondents
Company 1 9 13% 53
Company 2 9 5% 1
Company 3 8 8% 0
Company 4 6 15% 31
Company 5 5 10% 2
Company 6 3 12% 1
Company 7 1 20% 22
Company 8 0 17% 2
Other - - 12
Table 11: Sole investment results
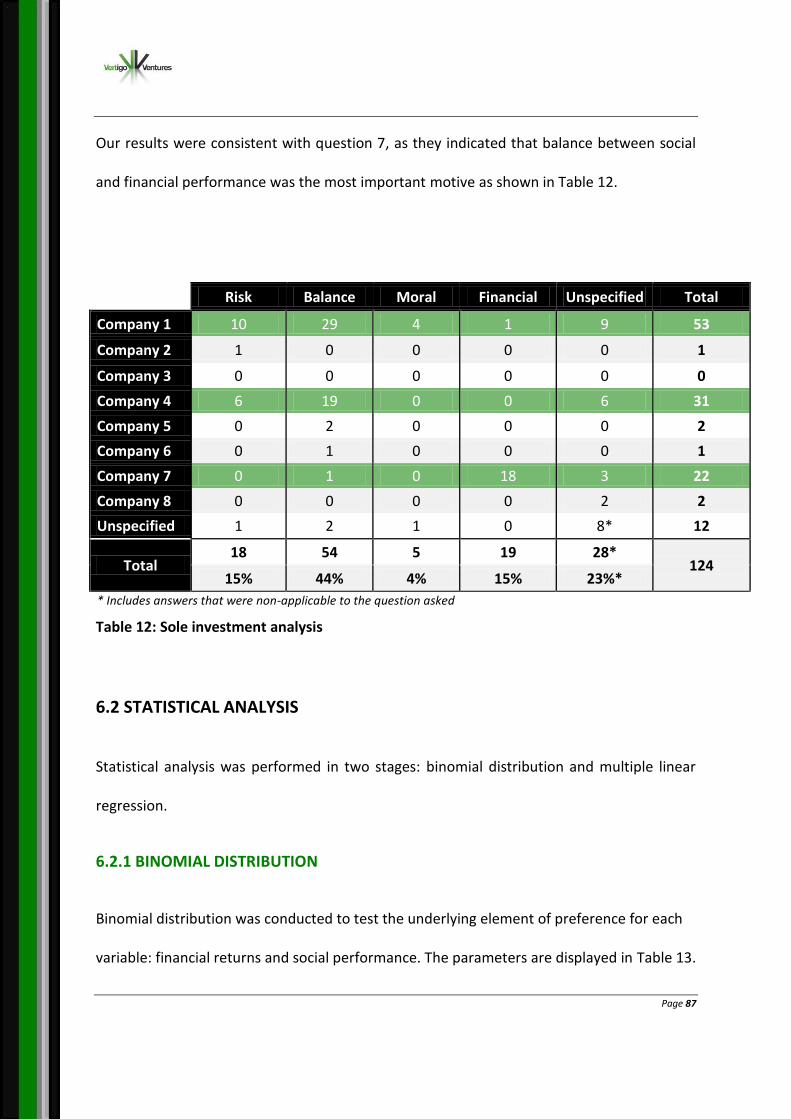
Page 87
Our results were consistent with question 7, as they indicated that balance between social
and financial performance was the most important motive as shown in Table 12.
Table 12: Sole investment analysis
6.2 STATISTICAL ANALYSIS
Statistical analysis was performed in two stages: binomial distribution and multiple linear
regression.
6.2.1 BINOMIAL DISTRIBUTION
Binomial distribution was conducted to test the underlying element of preference for each
variable: financial returns and social performance. The parameters are displayed in Table 13.
Risk Balance Moral Financial Unspecified Total
Company 1 10 29 4 1 9 53
Company 2 1 0 0 0 0 1
Company 3 0 0 0 0 0 0
Company 4 6 19 0 0 6 31
Company 5 0 2 0 0 0 2
Company 6 0 1 0 0 0 1
Company 7 0 1 0 18 3 22
Company 8 0 0 0 0 2 2
Unspecified 1 2 1 0 8* 12
Total 18 54 5 19 28*
124 15% 44% 4% 15% 23%*
* Includes answers that were non-applicable to the question asked

Page 88
The parameters were used to define the upper and lower limit of the binomial distribution
illustrated in Figure 4.
We proceeded to compare the binomial distribution to the average investments calculated
in question 5. This looked at the investment pattern and whether it was statistically
abnormal. If proven, this would indicate an underlying element of preference between
financial returns and social performance.
Symbol Value
n Trials 100
N Observations 8
p Probability 0.125
µ Mean 12.5
σ Standard Deviation 3.307
T Significance Level 0.05
Table 13: Binomial distribution parameters
Mean12.5
LowerLimit9.13
UpperLimit15.8
FigureX-BinomialDistribu onGraphFigure 4: Binomial distribution graph

Page 89
Financial
Returns
Social
Performance
Average
Investments Abnormality
Company 1 13 9 35.97 Higher 20.16
Company 2 5 9 4.55 Lower -4.64
Company 3 8 8 6.75 Lower -2.44
Company 4 15 6 22.62 Higher 6.81
Company 5 10 5 4.76 Lower -4.43
Company 6 12 3 4.46 Lower -4.73
Company 7 20 1 24.13 Higher 8.32
Company 8 17 0 9.01 Lower -0.18
Table 14: Binomial distribution analysis
As illustrated in Table 14, since all average investments were abnormal, there is an
underlying element of preference between financial returns and social performance. This
highlights the trade-off between the two variables. By indicating their preferences,
participants have shown that the two variables affect how they evaluate investment
prospects. This supports our argument, suggesting that NFI plays a significant role within
investors’ decision-making process.
6.2.2 MULTIPLE LINEAR REGRESSION
In the second stage of the analysis, a multiple linear regression was used to analyse the two
independent variables: financial returns and social performance. The form of the multiple
linear regression is described in Figure 5.
z = k + α x + β y
Figure 5: Multiple linear regression form

Page 90
It measures the independent variables’ impact on the dependent variable, the average
investment, where:
z = Predicted average investments
k = Intercept of the plot line
x = Financial returns
y = Social performance
α = Financial returns coefficient
β = Social performance coefficient
StatPlus was used to compute the regression for the multiple linear regression, as displayed
in Figure 6.
The applicability of the multiple linear regression was evaluated with respect to the R-
Squared, adjusted R-Squared and the statistical significance of α and β, by looking at the p-
value.
Both R-Squared values were used to interpret the extent to which the independent
variables can explain the variance of the dependent variable. The R-Squared value was
95.5% and the adjusted R-Squared value was 93.8%. This illustrates the high explanatory
power of the independent variables.
The p-values of α and β indicate the statistical significance of the independent variables on
the dependent variable. T represents the standard significance level at 0.05 (Table 13). The
z = - 52.91 + 3.619 x + 4.234 y
Figure 6: Multiple linear regression equation

Page 91
p-value was tested against T, and the significance levels of α and β were found to be less
than T at 0.00015 and 0.00034, respectively. They are significant outside the standard 95%
confidence interval and therefore influence the outcome of the dependent variable, average
investments.
The regression determines to what extent social and financial performance influence the
investment decision of participants. The individual significance of each variable is difficult to
estimate. However, as the coefficient of each independent variable in the multiple linear
regression is similar, it can be assumed that they have relatively equal influential power.
The influence of these variables is evident when looking at average investments of
participants (Figure 7). It is reasonable to suggest that the higher investments in Companies
1 and 4 are due to their above-average financial returns and social performance; and
Company 7 due to its high financial return.

Page 92
These analytical methods and subsequent results were verified by Dr Jooyoung Jeong at the
University of Bath on the 7th of March 2014.
6.3 QUALITATIVE ANALYSIS
Qualitative analysis was conducted to discover the motives behind investment decisions.
Surprisingly, when comparing the rationale for investment choices in questions 7 and 8,
there was a change in motive.
We expected the motives to remain unchanged for the two scenarios. However, it was
evident that when asked to invest their whole allowance in one company, participants’
desire for high financial returns became less significant, as illustrated in Table 15. This could
be attributed to various factors; however, we can assume that social performance plays a
more important role when investment diversification is limited.
0
1
2
3
4
5
6
7
8
9
10
0%
5%
10%
15%
20%
25%
30%
35%
40%
Company1 Company2 Company3 Company4 Company5 Company6 Company7 Company8
FinancialPerformance
SocialPerformance
AverageInvestments
Figure 7: Average investments

Page 93
6.4 CONCLUSION
The survey analysis showed that social performance is an important factor with respect to
investment decision-making. It was proven by binomial distribution and multiple linear
regression that the independent variables, financial returns and social performance, have an
impact on investment decisions. In addition to this, it was shown that there is a trade-off
between the two independent variables.
Participants seemed to be divided between which factor to focus on. The majority indicated
a preference for achieving either high financial returns or high social performance. However,
a large group of participants compromised by choosing Company 4 (Figure 7).
The most surprising finding was that more participants preferred Companies 1 and 4 to
Company 7 when asked to invest their whole allowance. The reason behind this shift in
focus can be deduced from the qualitative questions in the survey as social performance
plays an increasingly important factor when participants are unable to diversify.
Table 15: Investment motives
Risk Balance Moral Financial Other Total
Question 7 14 41 14 29 7
105 13% 39% 13% 28% 7%
Question 8 18 54 5 19 28
124 15% 44% 4% 15% 23%
Total 32 95 19 48 35
229 14% 41% 8% 21% 15%

Page 94
With respect to research question 1, “to what extent are investors interested in non-
financial information”, the survey analysis showed that both financial and social factors
influence investment decisions. It was further proven that a trade-off exists between the
independent variables.
When looking at research question 2, “what value does non-financial information provide
investors with” the majority of participants stated that risk aversion and striking a balance
between financial and social performance formed the basis of their investment decision.
This is further evidenced when the possibility of diversification is removed. The analysis of
the in-depth interviews with investors will provide a more detailed understanding of these
findings and further develop the analysis.

Page 95
CHAPTER 7 INTERVIEW FINDINGS & ANALYSIS

Page 96
CHAPTER 7: QUALITATIVE FINDINGS & ANALYSIS
In this chapter, we developed several coding trees based on our research questions, in order
to highlight relevant themes that emerge from interviewees’ responses. This enabled us to
identify key influences with respect to our research objective.
7.1 DESCRIPTION
We aimed to interview a wide range of representatives from different sectors of the
financial, pharmaceutical and research industries including one participant from the United
States. This helped us gain a holistic view and minimise bias in answering our research
objective. We interviewed twelve participants covering a wide range of professions:
Two Sustainability Consultants
Fund Manager
Fund Investor
Investor relations, private equity
Asset Manager
Relationship manager, ethical screening
Researcher, ethical investment management
Analyst, investment advisor (United States)
Director, pharmaceutical company
Academic
Financial industry expert
In our findings, we refer to investors as general investors, not specifically socially
responsible.

Page 97
We decided to use open-ended interview questions to allow for participants to talk freely
but also had a list of prompts to ensure that all aspects of the scope were covered
(Appendix IV).
In this manner, we structured both the interview questions and analysis of our qualitative
data around each research question.
7.2 RESEARCH QUESTION 1
“To what extent are investors interested in non-financial information?”
In this section, we focused on interviewees’ opinions and attitudes towards the importance
of NFI in the financial industry. By doing so, we were able to identify current and future
trends with respect to social performance of companies and the utilisation of this
information. Figure 8 below indicates the key areas that participants’ identified as areas of
interest and growth.
Figure 8: Coding Tree I – Level of Interest

Page 98
7.2.1 CURRENT TRENDS
INCREASE IN SRI
“[Ethical Funds] were definitely on everyone’s radar [in 2006], more people were launching
them, it was not necessarily a fashionable thing to do, but there was definitely a trend”
(Fund Investor).
Interest in NFI has grown and this is evident, in part, by the growing number of mutual fund
products which consider social performance criteria. In 1995, there were 55 SRI funds with
USD 12 billion in assets under management; in 2012, there were 333 funds, with assets
totalling USD 640.5 billion (USSIF, 2014c).
The size of the aforementioned ethical funds is relatively small compared to the overall
financial industry. Whilst social performance is now on investors’ agenda, this doesn’t
always translate to investor demand, as stated by a Fund Investor: “We do have an ethical
portfolio; we just don’t have any clients who use it at the moment”. They further pointed out
that “in the scheme of the whole universe, which is sort of 3,000 funds, these are pretty small
funds; which just goes to show that there isn’t a great deal of investor demand out there”
(Fund Investor).
“12 [mutual funds] to 569 in the space of 20 years, so that’s quite interesting. So this has
been a growing area and you can tell because we have work streams looking into this
area... it’s growing and will continue to grow” (Asset Manager).

Page 99
However, there are contrasting views on whether there are sufficient opportunities for
socially-minded investors. “Generally, market-wide, there is a growing sense of individual
investors and institutional investors that are socially minded. I just don’t know how many
vehicles exist to help yet” (Sustainability Consultant).
The overall growth in the area is positive; however, the source of this increasing interest is
unclear. There is activity from both the supply and demand side, but it is evident that ethical
funds have to perform well before investors indicate demand.
INCREASE IN DATA AVAILABILITY
In addition to the increase in SRI, there are a growing number of third party data providers
that focus on social performance-related services, such as screening. This information is in
demand by the financial industry as investors include NFI in their decision making.
“So we process a vast amount of research produced by anybody from academics to broker
dealers, investment banks who have large research departments broken down by industry…
and we have a pharmaceutical analyst internally. We use specialist third party research in
“I think now that the performance [of our ethical fund] has picked up and it’s the
strongest performing portfolio, it’s going to grab attention, for right or wrong reasons.
People do look at what’s performed strongly and what hasn’t, and I think this will be
picked up and people will be like ‘oh ethical portfolio has done really well maybe we
should be having a better look at this’” (Fund Investor).

Page 100
this space. So we subscribe to databases of screened ethical information. So pretty much
anything which exists in this space, we would use it... to help understand the risk and return
of investments.” (Asset Manager).
In general, investors have noticed that NFI has become more widely available, which
strongly indicates progression in the area.
“Unambiguously this has been a growth area. And you can see that in different ways. But
you can see that due to the growth in the amount of data available and index provision that
this has been getting bigger” (Asset Manager).
THE VALUE OF NFI
As found in the literature review, investments incorporating NFI are believed to be a strong
indicator of long-term performance (Brammer, Millington & Cox, 2004). Although there has
been a recent upswing in the use of NFI, it has always played a subtle part in investment
decisions.
“It’s always been there. In companies where there has been a divide in that sort of financial
and non-financial, I don’t think it’s never been there. NFI always flavours a business. You
have to have that element in a business” (Fund Manager).
There is a lack of consensus with regards to NFI and the ability to quantify its impact.
However, investors are beginning to acknowledge that a focus on NFI does not necessarily
equate to financial underperformance.

Page 101
“Looking at specific ESG data points, it’s not easy to quantify how those affect a company in
a positive or negative way. But if you look at all the managers and all investment
professionals that are integrating ESG data into their investment process and making
decisions based on that integration, it does not lead them to underperform benchmarks or
their peers. … for the most part, the evidence is suggesting they are in line” (Analyst).
INCREASE IN PUBLIC AWARENESS
According to our research, it could be speculated that the immediate impact of the
economic crisis forced investors to focus on retrieving investment losses and minimising risk
exposure, neglecting the importance of social performance (Leisinger, 2011).
Since the economic crisis, there has been an increase in public awareness and evaluation of
the risks of potential investments (Ceres, 2010). “Maybe it was a result of the banking crisis
when people became aware of ethics; it’s a massive, massive growth area” (Researcher).
In addition, people are increasingly more concerned about where their money is going.
“I think with the credit crisis everyone’s ethical concerns and considerations went out the
window. When everything else was going on, everyone sort of forgot that they were
ethical. But I suppose now we’re moving past the stage of panic, that it’s probably moving
more and more up people’s agendas again” (Fund Investor).

Page 102
“The next generation of people inheriting this money actually care about what good or bad it
does to the world, or a larger percentage of people are. And that’s a really big fundamental
shift in the way money will be allocated” (Analyst).
The combination of the economic crisis and increased public awareness has contributed to
the development of SRI.
7.2.2 FUTURE EXPECTATIONS
“We need to be thinking about having ethical funds in our portfolios, in our pensions,
because 40 years down the line, what we’re doing to the planet now might affect what type
of companies we are investing in” (Fund Investor).
Interviewees identified several topics, which are expected to influence the rate of adoption
of NFI. “It’s becoming a lot more accepted that ethical issues can actually have a significant
financial impact on companies” (Researcher).
INCREASE IN DEMAND
In line with the ‘Utility model’ advocated by Gurthie & Parker (1990 cited in Epstein &
Freeman, 1994), it is expected that the areas of SRI will continue to grow as a result of
increased stakeholder demand. “There’s growing interest from firms like us, there’s growing
interest from investors, from the actual companies. I think everything is growing in that
direction” (Analyst). As such, SRI is expected to become more integrated in mainstream
investment practices. “There is definitely a place for SRI. There’s a rising awareness of the

Page 103
negative impact of corporate entities, and managements will become more aware of it and
more transparent” (Financial Expert).
REPORTING STANDARDISATION
“Internationally it is very important because the investment community look at [reporting
standards] around the world. I see very positive signs of this being taken into people’s
hearts, the practice of reporting” (Academic).
Participants identified that the lack of reporting standards currently hinders the adoption of
NFI. Establishing global standards will help to drive the development. However, as standards
change, this will be a challenging goal to reach. “You’re looking at moving targets,
constantly. The standards of today would not be acceptable probably in 10 years tomorrow,
simply because they change” (Fund Manager).
As the environmental and social factors facing industries can vastly differ in materiality,
creating universal standards may fail to account for industry-specific factors, limiting the
accuracy of the measurement. “It is possible to create a framework that encompasses all
sectors; I just think it would be a bit more superficial” (Analyst).
INDUSTRY
The levels of uncertainty associated with SRI can lead to mimetic or normative institutional
isomorphism (DiMaggio & Powell, 1983). As a successful company integrates NFI into their
processes, it is expected that other institutions will follow. “The idea of all this reporting and
why companies spend money doing it is because they feel like they have to, especially if their

Page 104
competitors are doing it” (Academic). This can help drive the adoption of standardised NFI
reporting, but can also lead to herd behaviour (Juravle & Lewis, 2008).
7.2.3 CONCLUSION
Overall, our findings have indicated that investors’ are interested in NFI, reflected in the
recent growth of ethical mutual funds and third party data providers. Investors’ perceptions
on NFI are predicted to develop further as they acknowledge the positive impact of social
performance.
The future looks promising for the use of NFI in investment decisions, but it is difficult to
determine whether industry or regulatory bodies will drive the demand. It is best summed
up by one of our interviewees: “I can see there is scope for development in the future but the
“There is a slow progress, there is a desire to change direction, but it’ll only happen slowly.
Standards tend to follow in the vanguard because of information provided by the more
successful companies doing it well and then people taking those ideals around that
company and trying to generalise and create an environment that others understand and
say, ‘well we should be adopting those as well because it’s good for us, we can see a
successful business doing it’. I think that is going to get on far more quickly than the sort of
slightly overarching diffusion of UN statements that are made quite often” (Fund
Manager).

Page 105
unanswered question in my mind is, how far will the investment community take this?”
(Academic).
7.3 RESEARCH QUESTION 2
“What value does non-financial information provide investors with?”
In this section, we investigated the value of NFI and its impact on investment choices and
those making the investment decisions. In addition, we identified external factors that
impact the way in which investors value NFI. Figure 9 below displays the key themes that
arose from our interviews.
Figure 9: Coding Tree II – Value of NFI

Page 106
7.3.1 DIRECT INFLUENCES
RELATIONSHIP BETWEEN SOCIAL AND FINANCIAL PERFORMANCE
It cannot be denied that the role of investors is to achieve the best possible financial returns
for their clients (Friedman, 1962 cited in Ruf et al., 2001). The value that our interviewees
placed on NFI ultimately relates to their perception of the correlation between social and
financial performance.
Since 1972, there have been over 167 studies linking social and financial performance
(Margolis, Elfenbein & Walsh, 2007), but these studies lack consistent use of variables and
therefore results can be deemed ambiguous. In line with the literature, there is a lack of
consensus regarding the relationship between social and financial performance (McWilliams
and Siegel, 2001; Margolis, Elfenbein & Walsh, 2007; Porter & Kramer, 2006; Van Beurden &
Gössling, 2008). “We haven’t done any studies in-house for the kind of correlation between
ESG performance against financial performance, but there’s a few out there that show mixed
results about the correlation; some show more performance and others negative”
(Relationship Manager).
However, investors “that are applying an ethical overlay [have] started to see parallels
between companies who looked after ESG issues and those which in the long term were
making better returns on their money” (Relationship Manager). As identified by Lydenberg
(2007), NFI is not only used by social investors, as universal investors are also starting to
take notice. “You don’t have to be an ethical investor in the traditional sense to invest

Page 107
ethically anymore. Long-term returns are appearing to be linked to positive social and
environmental performance” (Relationship Manager).
Brammer, Millington & Cox (2004) identified that investments in social performance can
only be realised in the long term. Our research supports this view and also the hypothesis
suggested by Renneboog, Ter Horst & Zhang (2008) as investing responsibly has the
potential to outperform investments that do not take NFI into consideration.
Investors acknowledged that, “a company that runs purely on financial decisions is never
going to make it” (Fund Manager). Examples such as the BP oil spill in the Gulf of Mexico
have highlighted the negative effects of neglecting NFI. However, the market impact of
positive social responsibility is harder to quantify. “It is harder to understand when you’re
complying and everything is fine whether it is doing you any benefit in terms of absolute
share price. I think it definitely does benefit you in terms of performance of the company
which hopefully impacts on the share price eventually” (Director).
RISK
Investors acknowledge the value that NFI provides, with regards to indicating long-term
liabilities of potential investment decisions. “In terms of a risk perspective, if you don’t
“We certainly see a trend that companies that are operating responsibly and are taking
care, are in the long term at least outperforming those who aren’t paying any attention
to this” (Relationship Manager).

Page 108
address ESG issues properly then you’re going to compromise its ability to grow or its long-
term liability” (Investor Relations). Ultimately, NFI can highlight to investors potential event
risk specific to that company. “It gives us the ability to assess longer term risks, to get a
better understanding of management and their decision-making process in what kind of
event risk will unfold based on their competencies” (Analyst).
We found that specifically within the private equity market, the types of risk that investors
are exposed to can vary depending on the industry. Consequently, the value placed on NFI
in different sectors doesn’t differ, rather the “intrinsic risk and opportunities will be greater
in one sector versus another” (Investor Relations). This can relate to supply chain or
technology risks, which are prevalent in certain industries. Investors’ perceived value of NFI
is dependent on their willingness to be exposed to certain risks, which could impact the
value of an asset. This was especially relevant with regards to the healthcare industry. “We
haven’t invested in those kind of sectors because of a lot of technology risk is involved and
we prefer to have market risk if we have to” (Investor Relations). This supports the findings
which exist in current literature, suggesting that NFI can contribute to lowering idiosyncratic
risk. (Fombrun, Gardberg & Barnett, 2000; Godfrey, 2004; Godfrey, Merrill & Hansen, 2009;
Luo and Bhattacharya, 2009; Petersen & Vredenburg, 2009).
The impact of NFI on risk return calculation still remains unclear. “I think the jury is
completely out in terms of whether socially responsible investing is beneficial from a risk
return perspective” (Asset Manager). In order to understand the relationship, “you need to
make some predictions about how this social responsibility is priced” (Asset Manager). As

Page 109
identified in the literature review, semi-strong form of Efficient Market Hypothesis (EMH)
argues that market prices are reflective of all publicly disclosed information (Fama, 1970).
To assume that sustainable investments carry less risk, means that they are either highly
overpriced, or offer a lower rate of return. As such “if you want to argue that socially
responsible investing is a good investment strategy and will produce higher risk adjusted
rates of return, then somehow you have to believe the market is mispricing social
responsibility and the risks thereof” (Asset Manager). Ultimately, compared to the market,
SRI carries completely different exposure to risk.
REPUTATION
According to the literature, reputation has a stronger positive correlation to financial
performance than other measurements (Friedman & Miles, 2002; Bebbington, Larrinaga &
Moneva, 2008; Porter & Kramer, 2006). Although this was not explicitly stated by any
interview participants, its importance was undeniable. A director stated “any negative
publicity is often a trigger for people to sell your shares and that always drives your price
down”. It was also found that “if you are seen to be a company [where] these issues are
important... it helps you retain [and]...get good employees” (Director). As a result, although
this view might be seen as cynical, a high importance is placed on “reputational risk
management... [and] protective reputation” (Sustainability Consultant).
It can be argued that there are benefits of having a good reputation both financially and
non-financially. However, the lack of regulation, clear reporting standards and selective
disclosure in the market regarding NFI can lead to a high susceptibility to greenwashing

Page 110
(Eccles et al., 2012; Mahoney et al., 2012). In today’s environment where there is an
increasing demand for responsible investing “it’s a good marketing thing to say ‘we have
these portfolios and we also have an ethical fund’” (Fund Investor).
As most firms only reflect what they chose to disclose, it is challenging to determine a
company’s social performance from the standpoint of an external actor. This supports the
‘political economy model’ as companies act according to self-interest (Gurthie and Parker,
1990 cited in Epstein & Freedman, 1994). Participants acknowledge this barrier towards the
influence of NFI as one stated, companies with “poorer performances report more to try and
counterbalance it. They aren’t so good about telling you about values but they report on
their activities. So… there is a bit of gamesmanship”. Another identified the difference
between recycling “1 million bottles versus being responsible or accountable for the things
they actually say they do” (Sustainability Consultant).
An additional issue identified was the difficulty to quantify reputation. “Negative publicity is
not going to do any company any favours... [and] the upside is harder to measure than the
downside” (Director). As a result, it is essential to look at various factors such as “the
different steps of the company’s value-adding supply chain, its management policies,
whether the company’s product is of quality, whether the company abides to the local
legislations, internal audits, infrastructures, etc.” (Financial Expert).

Page 111
7.3.2 INDIRECT INFLUENCES
Moral concern, regulation and disclosure have been found to influence the way in which
investors perceive and value NFI.
MORAL CONCERN
An investor’s moral concern as well as that of their fund managers can influence the value
they place of NFI (Brønn & Vidaver-Cohen, 2009). Those involved in impact investing within
asset management firms are targeting more ethical companies and ignoring companies
involved in ‘sin stocks’ as “clients and investors feel good about it, [and] maybe... this has
some positive impact on return” (Asset Manager).
In some circumstances, the way NFI is perceived by investors “very much depends on the
underlying client” (Asset Manager). Private equity firms face increasing pressure from their
investors to act more responsibly. It is the “underlying pension funds, sovereign wealth
funds, insurance companies etc. who over the last 5 or 6 years have become increasingly
focused on ESG, both from a risk management perspective but also opportunity perspective”
(Investor Relations). This has also been validated by participants who identified their
influence and responsibility as investors.
“You do have quite a lot of power, when you invest, you can influence company
performance. So they are now beginning to ask questions that they would never have
asked before. But very often, I think that a lot of companies actually enjoy being asked
these questions and care beyond their share price and profit” (Sustainability Consultant).

Page 112
The pressure of moral concerns from individual investors and their clients seemed relatively
overlooked within existing literature, as most articles identified investors in their
‘traditional’ sense (Jansson & Biel, 2010; Juravle & Lewis, 2008; Renneboog, Ter Horst &
Zhang, 2008; Sethi, 2005). We found that internal pressure from fund managers and
company employees positively correlates with the internal value placed on NFI. An analyst
reflected that “half of [his team] are very focused on sustainability, so we’re the ones who
contributed to the formation of the [ethical] framework”. Individual morals and company
mission statements give evidence to the importance of NFI within a company.
This internal moral concern can be said to be more inherent in particular industries, as
“different industries face different issues” (Researcher). For example, in the pharmaceutical
and biomedical industry, where the main focus is to help patients, the whole “nature of
what [they] do is very much around corporate social responsibility...there are green
committees within these companies [where] employees volunteer to work with the company
to ensure that [they] are doing everything [they] can” (Director). An investment researcher
expanded on this, stating that within the pharmaceutical and cosmetics industries some
ethical “compliants will object to [animal testing] while others accept it for medical
purposes”.
“It is not just your shareholders [that care], it is the internal goodwill you generate by
making sure the company does what it can to comply...and does additional things where
possible” (Director).

Page 113
REGULATION
The role of regulation and legislation enforced by governments can act as a key driver in the
influence of NFI. Specifically, industry regulations add a level of expectation from investors
regarding the standard of NFI disclosure. “The [pharmaceutical] industry is so highly
regulated, there is an expectation they will report on certain issues. It’s probably not coming
from individual investors but institutional investors and from legislators – so middle and top
down demand. When things go wrong, the impact is perhaps bigger. So there is an
expectation they should be dealing with them appropriately and vigorously as well”
(Relationship Manager).
In addition, high regulation in the pharmaceutical industry requires them to “have a very
good conscience and awareness of [NFI] issues” (Director). This was further suggested within
the private equity industry, where it was acknowledged that companies in highly regulated
sectors are “pretty sophisticated and effective in how they address these issues” (Investor
Relations). Conversely, in heavy industries such as oil and gas, the importance of NFI takes
more of a Transaction Cost Economics view (Ruf et al., 2001) as the cost of implementing
sustainable practices might outweigh the benefits. “There’s more of a complex equation
between them trying to be very compliant and how much it might cost them to be
compliant” (Director).
Shareholders, as well as companies, are keen to comply with the guidelines and regulations
set by the UN and governments and disclose appropriately. Non-compliance could damage
their reputation and financial returns, highlighting the influence these bodies have on the

Page 114
perceived value of NFI, as they act as a deterrent (Murphy & McGrath, 2013). “Better to
take preventative action by doing something voluntarily rather than risk having a rule
imposed” (Academic).
However, as SRI remains a developing regulatory area, the potential for changes in law and
regulation were identified to add a level of complexity. “Any company you are buying on the
basis that it has a particular set of things which either violate or don’t violate some code of
ethics, puts you right in the area of changing regulation and policy” (Asset Manager).
Investors acknowledge that there is still scope of regulatory improvement regarding
companies’ reporting standards, in order to minimise the propensity to greenwash. “Until
you’ve got some kind of regulation and standardisation, companies will potentially play fast
and loose and basically use this information in a PR way” (Academic). The industry seems to
be moving in the right direction, as the Companies Act 2006 introduced a new requirement
where quoted companies will have to legally report on carbon usage in a standardised way
(UK Department of Environment, Food & Rural Affairs, 2014). Voluntary initiatives, such as
the UN-supported PRI, have helped increase the compliance of these regulations. “You have
to take your hat off to the UN and others who encouraged an element of that thinking”
(Fund Manager).
DISCLOSURE
A Sustainability Consultant raised a valuable question during the interviews by asking, “does
CSR actually do what it says it does?”

Page 115
It was found that the industry has been “very responsive to [disclosing] on a voluntary basis”
(Academic). This has largely been driven by pressure from internal compliance departments
and external stakeholders, such as regulatory bodies, who are “very keen to ensure that
companies are doing all they can to fully inform their investors” (Director). They specifically
focus on the disclosure of key areas such as director remuneration, carbon usage,
environmental performance and general corporate social responsibility (Director).
Disclosures on these issues were found to be important because “unless you’re a non-exec
of the company itself, you can only get a flavour for… [if they] use their resources in a way
that is efficient and friendly” (Fund Manager). High levels of disclosure will impact the value
of NFI as it helps to reduce issues of asymmetric information between shareholders and
firms (Godfrey, Merrill & Hansen, 2009; Renneboog, Ter Horst & Zhang, 2008).
In terms of industry-specific disclosure, a surprising finding was the general consensus
among interviewees that particular industries did not need to disclose more NFI than
others. Rather, individual companies are expected “to have a strong disclosure on the issues
most material to their sector or business. So for pharmaceuticals we would want to see
much greater disclosure on product recalls and product safety” (Analyst). Although industry-
specific reporting reduces the ability to compare NFI between sectors, investors are able to
access information material to their decision making (Eccles et al., 2012). It is important that
investors have access to “a framework which is sufficiently strong and sufficiently reflective
of what we need as a society, rather than what people tell you” (Sustainability Consultant).
Currently, different perspectives can be given on similar issues; hindering the accuracy of

Page 116
the value of NFI since “[there is no one] checking what they say they are doing is the truth”
(Relationship Manager).
It was highlighted that ethical funds need to disclose more than mainstream funds as “they
have to justify their screening process [and display] strict ethical criteria” (Fund Investor). A
fund investor highlighted that “if there was an ethical sector, then we would know at least
that everything has had to go through a due diligence process”. There needs to be a push
towards “standardised social measurement reporting” that can be integrated into financial
auditing resulting in “greater transparency and comparability of social performance data”
(Sustainability Consultant).
7.3.3 CONCLUDE
The value placed on NFI by investors has increased as they realise the positive correlation
between social and financial performance. NFI has become increasingly accepted to benefit
investors and their decision making, as it highlights firms’ idiosyncratic risk. This can
minimise a firm’s and their investor’s exposure to financial implications caused by non-
compliance to social and environmental practices. Furthermore, NFI of potential
Perceived Value of
NFI
Moral Concern
Regulations
Disclosure
Figure 10: Perceived and actual values of NFI
Page 117
investments can signal a positive reputation to investors. The reputational risk management
of investments will provide value to investors through minimising the financial impact of
damaging reputations.
Concerns and demands, internally from employees and externally through clients, have
increased the value of NFI. The role it plays within the industry is growing significantly,
especially as regulations have been implemented. The extent to which NFI can provide
additional value for investors is affected by the lack of standardisation of reporting, as the
risk of greenwashing remains.
7.4 RESEARCH QUESTION 3
“How do investors use non-financial information to make investment decisions?”
Lydenberg (2007) and Renneboog, Ter Horst & Zhang (2008) identified ESG incorporation,
such as screening and stakeholder engagement as key approaches to SRI. This was validated
through the interview process. We also found that investors use NFI for due diligence and
screening before making an investment decision, as well as for monitoring and collaboration
activities post-investment. The recurring themes resulting from our findings can be seen in
Figure 10.

Page 118
7.4.1 PRE-INVESTMENT
SCREENING
In line with the literature (Dillenburg, Greene & Erekson, 2003), screening is “unambiguously
part of the investment calculus” (Asset Manager). Although the type of screening is not
usually very dissimilar for different asset classes, we found that the screening criteria differ
between fund managers and institutional or individual investors. Funds generally have a
formalised process where they look at “fund size, how long the fund has been going [and]
track record. Cost is [also] an important thing, particularly at the moment, in this
environment” (Fund Investor). For asset managers, however, the screening criteria “very
much depend on the level of interest of the client” (Researcher).
“A classic type of mandate in this space is that a client will come along and say, ‘we don’t
want you to invest in any type of defence companies, or tobacco companies or companies
Figure 101: Coding Tree III – Use of NFI
Page 119
that violate any number of ethical restrictions that we seek to identify’” (Asset Manager).
This constitutes a form of negative screening as identified by Renneboog, Ter Horst & Zhang
(2008), which is the “most common form of socially responsible investing” (Asset Manager).
However, movements are increasing towards third generation screening (Renneboog, Ter
Horst & Zhang, 2008), as investors use multiple criteria. They typically look at performance
measures which include “activity-based things like investing in tobacco and social
performance issues like human rights, so employees’ relations, [and] environmental
management” (Researcher). This enables investors to establish positive and negative
screening criteria, which help them deduce where to invest and how to monitor their funds.
DUE DILIGENCE
It must be noted that financial performance ultimately plays an important role in the pre-
investment decision process. “If there are loss makers in my portfolios, I’m not going to
invest in them – although some fund managers do put a few in their bottle as they will turn
into profitable businesses” (Fund Manager).
However due diligence was identified by our participants as a crucial process whereby
investors are “always judging the company on its financial and its non-financial information
and how it conducts itself” (Fund Manager). As an emerging area of importance, the
academic literature remains under-researched.
Investors identify due diligence as a means to work out if they “can add value to the
business, how [they] would do that, what does the management look like, what’s the market

Page 120
opportunities [and] where’s the risk around the business” (Investor Relations). This is done
to ensure they choose “the best fund to fit into [their] asset allocation” in terms of the “right
performance, process, track record, everything” (Fund Investor). The importance of this
process has increased as investors acknowledge the necessity to focus longer term.
Participants identified trust in management as a key influencing factor (Petersen &
Vredenburg, 2009). This is a relatively underdeveloped area of literature with regards to SRI.
A fund investor stated that if they had two funds they couldn’t distinguish between in terms
of social and financial performance, then they would look at who “has the best track record
of generating returns for the process that they’re operating”. This was seen to be a good
indication of the future success of the company, as investors looked for “honest people...
[who are] able to run a business that is investable in” (Fund Manager).
To ensure that their ethical criteria match those of their beneficiaries, many investors and
companies develop a process or framework within their “investment activity such that [they]
could be more systematic and that essentially requires the investment teams, when they
look at an opportunity, to explicitly discuss at one stage of the process...what the issues are
around target companies, ESG activities or issues” (Investor Relations).
Some investors develop internal ratings in conjunction with the due diligence process. NFI is
quantified to generate a sustainability score.

Page 121
NFI is used pre-investment to provide investors with a holistic view of potential investments.
Integrating this in the decision-making process allows them to identify potential
opportunities and risks, which cannot be identified through traditional financial analysis.
7.4.2 POST-INVESTMENT
The role that NFI plays after the initial investment decision can be integral in monitoring the
performance of a firm in the long term.
LONG-TERM STRATEGY
“We’re definitely not short term. If we take a position in a company it’s because we think
that company is going to do well and that’s the kind of approach taken by the whole of us,
not just us from the ethical side” (Researcher).
NFI can be used to justify financial decisions over time as “the more data available [for
investors]...the more that they will incorporate [NFI] over time; it’s not usually a light bulb
moment, it’s just a drag of information” (Fund Manager).
The purpose of NFI post-investment is to help investors judge a company’s performance and
future predictions. As summarised by a fund manager, they use NFI to assess “what [a
“The goal for us is to have everything in that analysis be additive to the traditional
[financial] analysis. There’s no overlap and you want only issues or matrices that would
be material to credit quality, either over the short-term or long-term” (Analyst).

Page 122
company has] done, how they’ve done it and how they’ve gone about producing those
profits. Has it been done in a way that gives them good scope to continue the progress or did
it take an absolute effort for them to get to that point and it’s going to take them an awful
effort just to sustain that kind of delivery to keep them growing”.
SHAREHOLDER ENGAGEMENT
Shareholder engagement comprises of investors communicating their concerns regarding
the sustainability of a portfolio company to the management and applying pressure, as a
shareholder, to improve issues (Lewis & Mackenzie, 2000,). Shareholder pressure illustrates
the extent to which they care about certain issues and involves the use of “shareholder
rights to lobby” (Sustainability Consultant). “It’s very much a part of our approach to
responsible investing. If we can facilitate change for the better through our holdings then it
should be done on behalf of our clients” (Researcher).
Investors can help to implement the ideas and visions that their invested companies have.
Successful collaboration, “the coming together of dynamic thinking and financial nose [has
the ability to] create and not necessarily destroy” (Fund Manager). In addition, there is also a
movement towards collaboration with other investment groups. The PRI has established an
electronic clearing house which facilitates collaborative engagement projects. “It’s a good
way to engage with investors who are all concerned about a particular issue and coming
together to share resources” (Researcher).

Page 123
We found that the level of engagement varies depending on the significance of the
investment and the issues and risks that investors are exposed to. Auditing or ‘formal
monitoring processes’ are undertaken on a systematic basis, in order for investors to
understand “exactly what's going on in the company, how it's performing compared to
various targets, what progress are [they] making…[and to] clarify and define exactly what
steps we feel we need to take with specific regards to ESG” (Investor Relations).
Communication can take on more informal formats, such as phone calls or face-to-face
meetings. “We look at a fund and [if] the performance has perhaps been a bit iffy, we ring
them up and say ‘what’s going on?’” (Fund Investor). Strong relationships with company
representatives help facilitate the review of their activities.
7.4.3 CONCLUDE
The methods of integrating NFI into the decision-making process have developed to involve
various methods. The role of negative screening was highly noted within literature
(Dillenburg, Greene & Erekson, 2003; Renneboog, Ter Horst & Zhang, 2008; Stewart, Berard
& Fruscella, 2012). This process has developed to incorporate both positive and negative
criteria, reflecting a more holistic view. Most interviewees mentioned that no standard
criteria have been developed, as it is mostly client driven. Instead, incorporating NFI in due
Initial Screening
Due Diligence
Investment Decision
Investment Monitoring
Shareholder Engagement
Figure 12: Stages of NFI integration

Page 124
diligence processes has developed and become a significant factor within investment
decisions, valued as additive material to traditional financial analysis.
Post-investment, there is an emphasis on long-term collaboration and stakeholder
engagement, as investors monitor the development of NFI. We found that trust in
management is an important factor investors use in their due diligence analysis and long-
term engagement. Investors are acknowledging the role and influence they carry, and the
capacity to change and improve companies in the long term.
7.5 RESEARCH QUESTION 4
“Where do investors gather non-financial information from?”
We found that there is a gap in existing literature regarding the methods through which
investors gather NFI. To date, most academic papers have focused on the relationship
between social and financial performance and not on a granular level, such as how NFI is
gathered.
Our findings established that investors use an array of sources to capture the information
they require (Figure 13). Most NFI is gathered from public sources, largely for legal reasons
as one interviewee stated that “there are laws which preclude the use of private
information” (Asset Manager).

Page 125
7.5.1 PUBLIC INFORMATION
Interviewees stated that it is essential to use a myriad of reliable sources to cross-reference
information, as they are found to be useful for different issues. As stated by a relationship
manager, they “look for contradictory evidence from NGOs, government reports, journals
and even blogs. Compiling all of that, looking at the information, taking into account any
bias which may come from a particular source and then making sure it’s all balanced
appropriately”.
7.5.2 COMPANIES AND FUNDS
The disclosure of information has also increased as reports are now available online and on
corporate websites. “You can do a lot of work now on the web that you never used to be
Figure 13: Coding Tree IV – Sources of NFI

Page 126
able to do” (Fund Manager). The accessibility of this information has also increased through
the consolidation of online reports.
Companies’ annual financial and sustainability reports voluntarily disclose NFI. It is possible
to get information directly from the company or fund which can be “anything from that
short one-page summary to a highly interesting 10-15 page document” (Researcher).
However, in order to get a full picture of a company’s ESG activities, it is sometimes
required to communicate with the firm in question directly.
“We will on occasion contact them if we feel there might be an issue that hasn’t been fully
covered or seems to have a disparity with previous years of reporting. We try and balance it,
so as much information we get from companies themselves, we’ll try and look for their
critical perspective as well, so it balances out” (Asset Manager). A fund manager reiterated
this point by stating “it can be quite difficult. You can only get a feel by constantly seeing a
company, getting to understand it for a longer term to get a feel of its practices” (Fund
Manager). This suggests that published NFI has a limited degree of utility, and investors can
obtain a more in-depth understanding through directly contacting the company in question.
7.5.3 SPECIALIST RESEARCH
Various institutions offer specialist research, some of which require a subscription or fee,
and others come as an additional free service to existing clients. Well-established research
providers, such as Bloomberg, MSCI and Financial Express Analytics, as well as specialist SRI
research houses, are frequently used by investors. These research providers integrate ESG

Page 127
issues into the financial analysis. Investment advisors “aggregate all [the data], score it and
then add a subjective in-house component of a scoring model” (Analyst).
Within large asset management firms, internal research departments are broken down by
industry and “spend their life processing [ESG] information to help [investors] understand
the risk and return of companies” (Asset Manager).
Increasingly, fund managers are dedicating internal work streams to ESG issues. By
committing more resources to these areas, knowledge is increasing and the networks of
information available to investors are becoming more comprehensive and sophisticated.
The issue and the extent to which it is disclosed determines the amount of research
required. Initiatives, such as Carbon Exposure Project, have helped “standardise and
normalise carbon enforcing. You find that [the] quality and range of data is far better now
than it was five years ago” (Researcher). Specific industries, such as chemicals, may require
additional consultancy support from external advisors who provide specialist knowledge
which exceeds the capacity of general research analysts.
“They’ve got networks across those sectors that have a lot of professional experience so
they will have some knowledge themselves which will help them reach an initial view”
(Fund Manager).

Page 128
7.5.4 CONCLUDE
The number of SRI data providers has increased over recent years in line with demand from
stakeholders. Reports from NGOs, governments and journals are often used in conjunction
with corporate reports, in order to provide a more holistic view. In addition, dedicated
teams within institutions are being established to support these methods as they can
capitalise on existing networks and knowledge.
A demand for third party data providers remains, as they can offer additional, specialist
research. Ultimately investors require different levels of information and these can be
gathered from various sources. The importance of cross-referencing was prevalent in our
findings as interviewees acknowledge the importance of being mindful of using corporate
reports in isolation, due to issues such as greenwashing.

Page 129
DISCUSSION TITLE PAGE
CHAPTER 8 DISCUSSION

Page 130
DISCUSSION
In order to meet our research objective, “how does social and environmental impact
performance data influence investors’ decision-making process in the pharmaceutical
industry” we answered four key questions, which incorporated all aspects of our scope.
8.1 ANSWERING THE RESEARCH QUESTIONS
“To what extent are investors interested in non-financial information?”
From the literature review we identified growing evidence to prove a positive correlation
between a firm’s social and financial performance (Margolis, Elfenbein & Walsh, 2007;
Orlitzky, Schmidt & Rynes, 2003; Van Beurden & Gössling, 2008). In conjunction, investors
are becoming more aware of the long-term impact of their decisions on society. This seems
to be driven by the long-lasting effects of the recent financial crisis and increased public
scrutiny (Boesso, Kumar & Michelon, 2013; PRI, 2013b).
Findings from of our interviews supported this argument as participants acknowledged the
growing use of NFI within the financial industry. They indicated an awareness of the
emergence of mutual funds and third party data providers, as well as the growing demand
from their stakeholders and clients. Furthermore, it can be deduced from the interviews
that this trend is set to continue. As regulation and transparency in reporting develops, the
mind-set of investors will develop and the ability to further integrate this concept into
mainstream investing will increase.

Page 131
The results from our student survey identified a trade-off between social and financial
performance. Participants were given a hypothetical investment scenario where the
majority chose to focus on one of the two independent variables. This finding correlated
with the qualitative analysis, supporting the argument that investors are interested in NFI.
“What value does non-financial information provide investors with?”
We can deduce from the interviews, that though investors are predominantly focused on
gaining the best return for their clients, integrating NFI into their decision-making process is
important. By doing so, investors are able to manage long-term financial and reputational
risk. This supports the argument that investors’ motives are instrumental, as they focus on
the long-term performance of their investments (Cropanzano et al, 2001; Hofmann, Hoelzl &
Kirchler, 2008).
Liabilities and exposed risks of potential investments can be highlighted through the analysis
of NFI. This perception of NFI was supported through the literature (Fombrun, Gardberg &
Barnett, 2000; Murphy & McGrath, 2013), as well as indicated within the survey and
interviews. When survey participants were asked to invest all their funds in one company,
the amount invested in firms with high social performance increased, as it became a more
important factor. We can deduce that by reducing an investor’s ability to diversify, firms
who indicate stronger social performance will be preferred. This could be associated with
the perceived riskiness of a-social companies. This suggests the significant value placed on
NFI as it helps indicate long-term liabilities of firms.

Page 132
The literature review acknowledged regulation and disclosure as challenges associated with
increased adoption of SRI (Eccles et al., 2012; Sethi, 2005). Through qualitative research, we
identified regulatory requirements as a key driver which impacts how NFI is valued. The risk
of financial implications from non-compliance has increased investors’ valuation of NFI. This
is further influenced by the moral concern of investors and their clients (Brønn & Vidaver-
Cohen, 2009; Richardson, 2008), as people are becoming increasingly aware of firms’ impact
on society and the environment. Consequently, the demand and perceived importance of
NFI has been driven by clients and managers, as well as personal morality-based motives.
Our research showed that investors value NFI, but preferences vary according to motives.
This further supports the argument that the practices of social investors are merging with
universal investors (Lydenberg, 2007). Private equity firms have arguably been ahead of the
trend with the adoption of NFI, as fund managers and asset management firms gain
momentum.
“How do investors use non-financial information to make investment decisions?”
There are many ways in which NFI can be incorporated into investment decision-making;
screening being the most common (Lydenberg, 2007; Renneboog, Ter Horst & Zhang, 2008;
Stewart, Berard & Fruscella, 2012). A combination of positive and negative screens enables
investors to assess potential investments based on pre-determined criteria. This was a
recurring theme within our findings as interview participants stated that screening was used
to decide which companies and industries to invest in.

Page 133
However, what was arguably more significant was the importance of NFI in due diligence
processes. It enables investors to conduct thorough evaluation of a company’s financial and
non-financial performance, pre-investment. It also provided a mechanism through which
they can evaluate the quality of management and ensure that the ethical and financial
objectives of both parties match.
NFI was recognised to play a different role post-investment. Participants validated our
findings in existing literature, expressing that investors use NFI to indicate the long-term
strategies of a firm through minimising asymmetric information and monitoring firms’
performance. Interestingly, we found evidence of shareholder engagement as investors
increase communication and collaboration with firms, using their inherent power to lobby
management on pertinent issues.
“Where do investors gather non-financial information from?”
The high level research that currently exists within literature on SRI and sustainability fails to
identify specific details such as where investors obtain NFI. It can be assumed that corporate
annual reports will disclose adequate information, but as the importance placed on NFI
increases, the demand for objective information has grown.
From our findings, we can deduce that investors require information from a variety of public
and paid-for sources. Interviewees recognised an increase in availability of data from
internal and external sources, which has acted in response to growth in the industry.
However, the lack of universal standards of disclosure and reporting makes it difficult to

Page 134
quantify NFI. This allows room for subjectivity, creating discrepancies between sources.
Therefore it is integral for investors to cross-reference information in order to gain a holistic
view and minimise the risk of corporate greenwashing.
8.2 FURTHER FINDINGS
A prominent theme which emerged in both the student survey and interviews, but was not
apparent in the literature review, was the increasing sensitivity of the younger generation to
sustainability. Cheah et al. (2011) explored generational attitudes and found that younger
socially responsible investors are more likely to place the same level of importance on
financial and non-financial performance. Our student survey confirmed this as participants’
indicated interest in both social performance and financial returns. Although a trade-off
existed between the two independent variables, it was important to achieve a balance. As
such, we can infer that future investors have the potential to further develop SRI and
increase pressure on companies to act in a more ethical and transparent manner.
Another unexpected theme that arose from our research was that of trust in management.
Although trust is a prominent area of research regarding the financial industry, literature is
limited with respect to SRI and sustainability. Petersen & Vredenburg (2009) identified the
potential to increase trust and relationships between management and investors. Our
findings highlighted that trust is beneficial for investors, as it indicates that management is
acting in their best interest and allocating resources consistent with their investment views.
This serves to minimise agency costs as alluded to by Brammer & Millington (2008), Cheah
et al. (2011) and Renneboog, Ter Horst & Zhang (2008).

Page 135
8.3 ANSWERING THE RESEARCH OBJECTIVE
The objective of this research was to answer the following question:
“How does social and environmental impact performance data influence investor’s
decision-making process in the pharmaceutical industry?”
In order to do this, we limited our scope to the following statements which formed the basis
of our research questions:
Establish the extent to which investors are interested in social and environmental
impact performance data
Determine the value investors place on social and environmental impact
performance data
Ascertain how investors use social and environmental impact performance data to
inform investment decisions
Understand where investors obtain social and environmental impact performance
data from
Our initial focus on the pharmaceutical industry was complementary to the metrics
developed by Vertigo Ventures. The VV-Good Index focuses on pharmaceutical companies,
due to the rise in data available as a result of the increase in corporate reporting.
Page 136
The lack of universal standards within SRI limited our ability to differentiate between
industries, in both primary and secondary research. Consequently, this impacted the scope
of our project, as we found that our research can be applied to more than one industry.
Due to the broad nature of our research objective, it was difficult to draw a concise
conclusion because of the complexity and interdependency of factors. To illustrate the
relationship between our key findings we developed the ‘SRI Growth Model’. We focused on
NFI, in the context of SRI, as there is growing potential for mainstream investors to integrate
this practice. Our model represents a virtuous circle highlighting the vital stages required for
SRI growth (Figure 14).
8.4 SRI GROWTH MODEL
According to the model, the growth of SRI (1) will influence investors to acknowledge the
positive relationship between NFI and financial performance of corporations (2). The
strength of this correlation can be determined by its potential to lower financial and
reputational risk. Underlying influences such as moral concern and the impact from
economic cycles can also affect this perception (2a).
The model assumes a discrepancy between perceived and actual value of NFI. As the gap
diminishes, demand for NFI among investors will increase (3). As a market response, an
increase in the number of third party research providers will generate growth and data
availability (3a). These developments will increase investors’ motivation to integrate NFI
into traditional financial processes, as they have acknowledged its potential value.

Page 137
Consequently, both investors and external actors can affect the level of integration of NFI
(4).
Investors can integrate NFI in the pre-investment due diligence process and shareholder
engagement (4a). The additional benefits yielded from integration will affect the degree to
which investors deem NFI important (5). Positive financial returns of a responsible
investment can signal to investors the benefit of integrating NFI (6). The success of actors
will lead to herd behaviour, as other investors imitate their behaviour (6a), thus stimulating
further growth in the industry (1).
This cycle is self-reinforcing, stimulating growth as SRI spreads throughout mainstream
investing. External actors, such as governments (1a), have the potential to accelerate this
growth. The development of industry-specific reporting standards and increased regulation
regarding disclosure will increase the value of NFI and further encourage the adoption of
SRI. The sustained growth of SRI will have positive implications on the behaviour of
companies (1b). Investors have the capacity to influence and apply pressure to management
regarding adequate disclosure and transparency of their activities. As engagement
increases, relationships between the two parties can develop as trust builds, further
reducing the risk of corporate greenwashing.
As SRI develops, the influence of social and environmental impact performance data will
play an increasingly important role in investment decisions. Overall, all these stages have an
influence on the growth rate of SRI and will eventually lead to adoption within mainstream
investing.

Page 138
Figure 14: SRI growth model
Exte
rnal
act
ors
Det
erm
inan
ts
Inte
rdep
end
ent
rela
tio
nsh
ip
SRI G
RO
WTH
MO
DEL

Page 139
CHAPTER 9 MANAGERIAL IMPLICATIONS

Page 140
CHAPTER 9: MANAGERIAL IMPLICATIONS
The influence of NFI in investment decisions has increased in recent years. Our goal was to
explore this trend and provide Vertigo Ventures with an insight into how investors use NFI
when making investment decisions. The VV-Good Index is designed to quantify, compare
and rank a company’s financial, social and environmental performance. This chapter
identifies some key findings that arose from our research. These can be used to help
develop their metrics to match investor’s demands, as well as highlight areas for future
attention.
9.1 INDUSTRY-SPECIFIC METRICS
In both academic literature and our findings, it was expressed that there is a need for an
industry-specific metrics, which takes into account the materiality of ESG in specific sectors.
However, there is a lack of development in this direction as current reporting standards fail
to recognise the importance of materiality. For example, product recalls and animal testing
are imperative issues within the pharmaceutical industry, but won’t be applicable to the
banking sector. As such, pharmaceutical companies might find it more important to disclose
on these factors, as the impact of non-compliance with industry regulation could have
significant impact on investors.
The VV-Good Index attempts to standardise measurements across industries and create
benchmarks to promote comparability. Despite comparability of industries being a desirable

Page 141
goal, we recommend that VV acknowledge the materiality of industry-specific issues in their
index. This will increase the validity and recognition of their metrics.
9.2 SUGGESTIONS FOR FUTURE ANALYSIS
Our research found that investors do not expect pharmaceutical companies to disclose
more non-financial information than firms in other industries. Since the pharmaceutical
industry is highly controlled and regulated, shareholders expect companies to comply and
disclose to a satisfactory standard. We recommend VV apply the VV-Good Index to an
industry where control and regulation is not as strongly imposed.
Furthermore, patents have allowed pharmaceutical companies to establish a drug
monopoly. Consequently consumers cannot easily differentiate between branded drugs. By
applying the metrics to industries where performance is strongly dependent on consumer
demand and where NFI reporting is not a legal requirement, the index can display how the
significance of disclosure varies and thus its impact on financial performance.
An industry this could be applied to is the FMCG sector, which comprises of large
corporations such as P&G, Unilever, Kraft and Nestlé. Due to their size, they are constantly
exposed to public scrutiny. Through analysing the level of corporate disclosure, VV can
acknowledge the role that NFI plays in industries where negative PR can have immediate,
damaging effects on revenue and reputation.

Page 142
9.3 FUND INDEX
It was acknowledged by one participant that an index would be a useful tool to assist in the
investment decisions made by fund investors. Therefore, we would also recommend that VV
consider the possibility to extend their metrics to include funds, particularly those who
claim to be ethical. Since ethical funds have clear investment standards, VV will be able to
analyse portfolio sustainability and performance more easily and compare funds based on
these variables.
9.4 MEASURING MANAGEMENT AND GOVERNANCE
In our interviews, investors expressed the importance of trust in management as an
indicator for long-term performance. Measures such as management reaction time to
internal and external issues, and completion rate of sustainability projects, could be judged
on a performance basis. This dimension could add valuable, ‘difficult-to-find’ information to
the metrics. Incorporating this area enables the VV-Good Index to provide a more holistic
evaluation of a company’s performance.
9.5 MULTIPLE SOURCES
Interviewees highlighted the necessity to obtain NFI from various sources. We found that
for screening companies in particular, cross-referencing sources ensured an objective view
of the company’s performance. Therefore, we recommend that VV cross-reference data
sourced from corporate annual reports with other data sources to increase the reliability
and accuracy of their calculations. Furthermore, there are opportunities for VV to

Page 143
collaborate with other consultancy firms within the industry. For example, the PRI hosts an
engagement forum for members where they can collaborate ideas.
9.6 BECOMING A SIGNATORY OF THE PRI
The PRI has had significant influence on investors’ awareness of the importance of SRI and
has highlighted the need for standardised reporting. As an SME, membership can offer great
opportunities for VV to build awareness around their services. It would also enable VV to
expand their client portfolio to a global market. Since the PRI does not rank members based
on performance, the VV-Good Index could be of interest to other members within the
financial industry, as it provides an additional service.

Page 144

Page 145
CHAPTER 10 ACADEMIC CONTRIBUTION

Page 146
CHAPTER 10: ACADEMIC CONTRIBUTION
Our project explored “how does social and environmental impact performance data
influence investors’ decision-making process in the pharmaceutical industry”. Our research
has developed on previous studies by focusing on investors’ perspective, as well as using
qualitative research methods in conjunction with quantitative.
In current literature there is a limited amount of research, which takes an investor
perspective on our research topic. There is a substantial amount of research available
regarding companies acting sustainably and the effects of interaction between firms and
shareholders. Our research adds to existing literature by trying to understand the research
topic specifically from investors’ viewpoint.
Present literature tends to use pure quantitative research in order to investigate research
questions, whereas our utilisation of a triangulated research strategy provides more
detailed information for analysis. By using qualitative methods we were able to collect rich
information that pure quantitative methods could not collect effectively. However, by
combining the two methods we were also able to add rigor to our research.
Few other academic inputs have taken an alternative perspective to a company view, and
used qualitative methods to gain detail insights. By capturing investors’ perspective in our
investigation we moved to the research frontier. Overall, our contribution to the current
literature on the topic of investors and the use of NFI is significant.

Page 147
CHAPTER 11 LIMITATIONS

Page 148
CHAPTER 11: LIMITATIONS
GENERALISABILITY
Despite taking measures to enable the generalisability of our results, limitations that could
not have been foreseen restricted our ability to do so. Most of these limitations are due to
time constraints.
Firstly, we acknowledge that the time constraint was a known factor and since our research
was cross-sectional in nature we cannot guarantee that future studies will yield similar
results.
Secondly, with respect to the in-depth interviews, the time constraint affected our ability to
recruit investors. This was particularly the case for pension funds and NGOs. As a
consequence of having a limited number of participants, the degree to which they represent
the financial industry is limited. However, we attempted to restrict the effect of these issues
by asking open-ended questions to all participants, capitalising on their knowledge.
In the student survey the convenience sample used cannot be generalised further than to
the student population of the University of Bath. However, by ensuring an adequate
number of participants, our data analysis was statistically significant. As such, we were able
to show a trade-off between variables. Overall, our findings should not be generalised
beyond this paper, but reflects a representation of current societal attitudes.

Page 149
VALIDITY
With respect to the validity of our findings, the number of institutions represented in our
sample resulted in a limited view of the use of NFI according to asset classes. As a
consequence, our understanding of factors that can affect how investors use NFI could be
biased. To avoid drawing conclusions based on the opinion of one interviewee, we
consulted literature and identified similar arguments from other participants.
The student survey did not mention the underlying risk factor that could be associated with
below-average social performance scores. Risk is a traditional decision-making factor in
investments and should therefore have been accounted for in the table given to
participants. However, by limiting the influence on investment decisions to two factors, it
enabled us to clearly see the impact of each variable.
FRAMING
We recognise that the table displayed in our survey could have affected the validity of the
responses. It can be argued that by placing social performance before financial returns in
descending order, participants were lead to perceive that the company with the highest
social performance was their preferred investment. If we were able to replicate the study,
given the adequate resources, we would distribute surveys with the tables reversed or
values in ascending order. This would improve validity by diminishing the potential of
framing bias.

Page 150
ACCURACY
It should be noted that part of our statistical data analysis of the student survey was based
on the average investment allocations. By using averages, there is a risk of outliers skewing
the data, making it inaccurate. However, data representation without using the average
score for each company in some questions would have made it impossible to analyse the
results.
PHARMACEUTICAL INDUSTRY
The initial focus of our research project was the pharmaceutical industry. We aimed to apply
industry specificity by including interview participants from the industry as well as through
the use of existing literature. This proved to be challenging. Firstly, although extensive
literature covers CSR, philanthropy and charitable donations; pharmaceutical-specific
literature in the area of sustainability is underdeveloped. Therefore we found it difficult to
obtain relevant secondary data.
Secondly, we were only able to recruit one interviewee from the pharmaceutical
industry. Unfortunately, we found a high level of unwillingness to disclose information
beyond published sustainability reports, limiting the number of participants from this field.
To overcome this, we asked all participants their views on the pharmaceutical industry and
their expectations regarding non-financial information and reporting standards.

Page 151
CHAPTER 12 FUTURE RESEARCH

Page 152
CHAPTER 12: FUTURE RESEARCH
Our project has opened up many interesting avenues. We have therefore identified and
proposed the following areas for future research:
Exploring national and/or cultural differences to see how investors use NFI to inform
their investment decisions in a global context
Conducting a longitudinal study to establish a trend. As NFI becomes increasingly
prominent in the investment community, the use of longitudinal studies could be
utilised to monitor attitudes over time, differing by generation and economic cycle
Analysing the relationship between disclosure and NFI, as well its varying aspects
across different industries
Focusing on trust in relation to management. We found that investors are becoming
increasingly concerned with the quality of their investee’s management, and
consider the potential long-term financial cost of poor management in their
decision-making process

Page 153
CHAPTER 13 CONCLUSION

Page 154
CHAPTER 13: CONCLUSION
Our research objective, “how does social and environmental impact performance data
influence investors’ decision-making process in the pharmaceutical industry” allowed us to
explore a relatively new area of academic literature. We investigated investors’ perception
and adoption of NFI within decision-making processes, providing insight into some of the
underlying dynamics of the financial industry.
By collecting primary data from a range of suitable participants, four research questions
specific to the scope of our project were answered. We generated detailed information with
a macro and micro focus on investors’ behaviour surrounding NFI and sustainability.
Investors’ perceptions on the importance of NFI and the ways they integrate it into their
investment decisions highlighted how the industry has grown and developed since the wake
of the economic crisis.
Our findings contributed to the overall research objective requested by our sponsor, Vertigo
Ventures. Significant themes and findings provided a descriptive, detailed and up-to-date
‘snapshot’ of the current financial industry, as well as key findings and areas for
development directly related to their business capabilities. Subsequently, we were able to
suggest implications that would reflect the demands of investors.
In addition to satisfying our sponsor’s requirements, we also contributed to academic
research, presenting a current and detailed view on a growing area of literature. Overall, our
project has provided a substantial contribution to understanding investor’s use of NFI in
decision making and its potential implications for the future.

Page 155
CHAPTER 14 BIBLIOGRAPHY

Page 156
1. Adams, C. A. (2004). The Ethical, Social and Environmental Reporting-Performance
Portrayal Gap. Accounting, Auditing and Accountability Journal , 17 (5), 731-757.
2. Aguilera, R. V., Williams, C. A., Conley, J. M., & Rupp, D. E. (2006). Corporate
Governance and Social Responsibility: a comparative analysis of the UK and the US.
Corporate Governance: And International Review , 14 (3), 147-158.
3. AnalystSoft. (2009). StatPlus, 5.8.2.0. (AnalystSoft, Producer, & AnalystSoft)
4. Andriof, J. (2002). Unfolding Stakeholder Thinking: Theory, Responsibility and
Engagement (1st Edition ed.). (G. Publishing, Ed.) Sheffield, Great Britain: Greenleaf
Publishing.
5. Babbage, D., & Ronan, K. (2000). Philosophical Worldview and Personality Factors in
Traditional and Social Scientists: Studying the World In Our Own Image. Personality
and Individual Differences , 28 (2), 405-420.
6. Banerjee, S. B. (2008). Corporate Social Responsibility: The Good, the Bad and the
Ugly. Critical Sociology , 34 (1), 51-79.
7. BBC. (2012, July 2). US & Canada - GlaxoSmithKline to Pay $3bn in US Drug Fraud
Scandal. (BBC, Producer, & BBC) Retrieved December 29, 2013 from BBC News:
www.bbc.co.uk/news/world-us-canada-18673220
8. Beal, D. J., Goyen, M., & Phillips, P. (2005). Why Do We Invest Ethically? Journal of
Investing , 14 (3), 66-77.
9. Bebbington, J., Larrinaga, C., & Moneva, J. M. (2008). Corporate social reporting and
reputation risk management. Accounting, Auditing & Accountability Journal , 21 (3),
337-361.
10. Benson, K., & Humphrey, J. (2008). Social Responsible Investment Funds: Investor
Reaction to Current and Past Returns. Journal of Banking & Finance , 32 (9), 1850-
1859.
11. Blanco, B., Guillamón-Saorín, E., & Guiral, A. (2013). Do Non-socially Responsible
Companies Achieve Legitimacy Through Socially Responsible Actions? The Mediating
Effect of Innovation. Journal of Business Ethics , 117 (1), 67-83.

Page 157
12. Boesso, G., Kumar, K., & Michelon, G. (2013). Descriptive, Instrumental and Strategic
Approaches to Corporate Social Responsibility. Accounting, Auditing and
Accountability Journal , 26 (3), 399-422.
13. Brønn, P. S., & Vidaver-Cohen, D. (2009). Corporate motives for social initiative:
legitimacy, sustainability, or the Bottom line? Journal of Business Ethics , 87 (1), 91-
109.
14. Brammer, S., & Millington, A. (2008). Does it Pay to be Different? An Analysis of the
Relationship between Corporate Social and Financial Performance. Strategic
Management Journal , 29 (1), 1325-1343.
15. Brammer, S., Brooks, C., & Pavelin, S. (2006). Corporate Social Performance and
Stock Performance Returns: UK Evidence from Disaggregate Measures. Financial
Management , 35 (3), 97-116.
16. Brammer, S., Millington, A., & Cox, P. (2004). An Empirical Examination of
Institutional Investors' Preferences for Corporate Social Performance. Journal of
Business Ethics , 52 (1), 27-43.
17. Bryman, A. (2012). Social Research Methods (4th Edition ed.). (O. U. Press, Ed.)
Oxford: Oxford University Press.
18. Bryman, A., & Bell, E. (2007). Business Research Methods (2nd Edition ed.). (O. U.
Press, Ed.) Oxford: Oxford University Press.
19. BSR. (2009). ESG in the Mainstream: The Role for Companies and Investors in
Environmental, Social and Governance Integration. BSR. New York: BSR.
20. BSR. (2012). Trends in ESG Integration in Investments: Summary of the Lateste
Research and Recommendations to Attract Long-Term Investors. BSR. New York: BSR.
21. Bugg-Levine, A., & Emerson, J. (2011). Impact Investing: Transforming How We Make
Money While Making a Difference. innovations , 6 (3), 9-18.
22. Cacioppe, R., Forster, N., & Fox, M. (2008). A Survey of Managers’ Perceptions of
Corporate Ethics and Social Responsibility and Actions That May Affect Companies’
Success. Journal of Business Ethics , 62 (3), 681-700.

Page 158
23. CERES. (2010, March). The 21st Century Corporation: The Ceres Roadmap for
Sustainability. Retrieved February 15, 2014 from CERES:
http://www.ceres.org/resources/reports/ceres-roadmap-to-sustainability-2010/view
24. Chan, C. C., & Milne, M. J. (1999). Investor Reactions to Corporate Environmental
Saints and Sinners: an Experimental Analysis. Accounting and Business Research , 29
(4), 265-279.
25. Chand, M., & Fraser, S. (2006). The relationship between corporate social
performance and corporate financial performance: Industry type as a boundary
condition. The Business Review , 5 (1), 240-245.
26. Chapman, S., & McNeill, P. (2005). Research Methods (3rd Edition ed.). (Routledge,
Ed.) Oxon, Great Britain: Routledge.
27. Cheah, E.-T., Jamali, D., Johnson, J. E., & Sung, M.-C. (2011). Drivers of Corporate
Social Responsibility Attitudes: The Demography of Socially Responsible Investors.
Journal of Management , 22 (2), 305-323.
28. Commission of the European Communities. (2001, July 18). Green Paper: Promoting
a European framework for Corporate Social Responsibility. Retrieved December 27,
2013 from EUR-Lex: European Union Law: http://eur-
lex.europa.eu/LexUriServ/site/en/com/2001/com2001_0366en01.pdf
29. Creswell, J. (2009). Research Design (3rd Edition ed.). (S. Publication, Ed.) London:
SAGE Publication.
30. Cropanzano, R., Byrne, Z. S., Bobocel, D. R., & Rupp, D. E. (2001). Moral virtues,
fairness heuristics, social entities, and other denizens of organizational justice.
Journal of Vocational Behavior , 1 (58), 164-209.
31. Dahlsrud, A. (2008). How Corporate Social Responsibility is Defined: an Analysis of 37
Definitions. Corporate Social Responsibility and Environmental Management , 15 (1),
1-13.
32. Deegan, C., & Gordon, B. (1996). A Study of the Environmental Disclosure Practices
of Australians Corporations. Accounting & Business Research , 26 (3), 187-199.
33. Deegan, C., & Rankin, M. (1996). Do Australian Companies Report Environmental
News Objectively? Accounting, Auditing & Accountability Journal , 9 (2), 50-67.

Page 159
34. Denzin, N. K. (1978). The research act: A theoretical introduction to sociological
methods (2nd Edition ed.). (McGraw-Hill, Ed.) New York: McGraw-Hill.
35. Dillenburg, S., Green, T., & Erekson, H. (2003). Approaching Socially Responsible
investment with a Comprehensive Rating Scheme: Total Social Impact. Journal of
Business Ethics , 43 (3), 167-177.
36. DiMaggio, P. J., & Powell, W. W. (1983). The Iron Cage Revisited: Institutional
Isomorphism and Collective Rationality in Organizational Fields. American
Sociological Review , 48 (2), 147-160.
37. Donaldson, T., & Preston, L. E. (1995). The Stakeholder Theory of the Corporation:
Concepts, Evidence and Implications. The Academy of Management Review , 20 (1),
65-91.
38. Eccles, R. G., Krzus, M., Rogers, J., & Serafeim, G. (2012). The Need for Sector-Specific
Materiality and Sustainability Reporting Standards. Journal of Applied Corporate
Finance , 24 (2), 65-71.
39. Epstein, M., & Freedman, M. (1994). Social Disclosure and the Individual Investor.
Accounting, Auditing & Accountability Journal , 7 (4), 94-109.
40. Flammer, C. (2013). Corporate Social Responsibility and Shareholder Reaction: The
Environmental Awareness of Investors. Academy of Management Journal , 56 (3),
758–781.
41. Fombrun, C., Gardberg, N. A., & Barnett, M. L. (2000). Opportunity Platforms and
Safety Nets: Corporate Citizenship and Reputational Risk. Business and Society
Review , 105, 85–106.
42. Forza, C. (2009). Survey. In C. Karlsson, & C. Karlsson (Ed.), Researching Operations
Management (pp. 84-161). Great Britain: Routledge.
43. Freeman, R. E. (1984). Strategic Management: A Stakeholder Approach (1st Edition
ed.). (Pitman, Ed.) Boston, USA: Pitman.
44. Friedman, A. L., & Miles, S. (2002). Developing Stakeholder Theory. Journal of
Management Studies , 39 (1), 1-21.
45. Friedman, M. (1970, September 13). The Social Responsibility of Business is to
Increase its Profits. New York Times Magazine , p. 1.

Page 160
46. Gavare, R., & Johansson, P. (2010). Management for Sustainability: A Stakeholder
Theory. Total Quality Management & Business Excellence , 21 (7), 737-744.
47. Ghauri, P., & Grønhaug, K. (2010). Research Methods in Business Studies (4th Edition
ed.). (Pearson, Ed.) Great Britain: Pearson.
48. Godfrey, P. C. (2004). The Relationship Between Corporate Philanthropy and
Shareholder Wealth: A Risk Management Perspective. Academy of Management
Review , 30 (4), 777-798.
49. Godfrey, P. C., Merrill, C. B., & Hansen, J. M. (2009). The relationship between
corporate social responsibility and shareholder value: an empirical test of the risk
management hypothesis. Strategic Management Journal , 30 (4), 425-445.
50. Gond, J. P., & Piani, V. (2013). Enabling Institutional Investors’ Collective Action The
Role of the Principles for Responsible Investment Initiative. Business & Society , 52
(1), 64-104.
51. GRI. (2013). G4 Sustainability Reporting Guidelines. Retrieved November 20, 2013
from GRI: www.globalreporting.org/resourcelibrary/GRIG4-Part1-Reporting-
Principles-and-Standard-Disclosures.pdf
52. GRI. (2013). Information - About GRI, 2013. (GRI, Producer, & GRI) Retrieved
February 5, 2014 from GRI: www.globalreporting.org/Information/about-
gri/Pages/default.aspx
53. Griffin, J. J., & Mahon, J. F. (1997). The Corporate Social Performance and Corporate
Financial Performance Debate. Business and Society , 36 (1), 5-31.
54. Guiral, A. (2012). Corporate Social Performance, Innovation Intensity, and Financial
Performance: Evidence from Lending Decisions. Behavioral Research in Accounting ,
24 (2), 65-85.
55. Haigh, M., & Hazelton, J. (2004). Financial Markets: A Tool for Social Responsibility?
Journal of Business Ethics , 52 (1), 59-71.
56. Hair, J., Celsi, M., Money, A., Samouel, P., & Page, M. (2011). Essentials of Business
Research Methods (2nd Edition ed.). (I. M.E. Sharpe, Ed.) New York, USA: M.E.
Sharpe, Inc.

Page 161
57. Hawley, J. P., & Williams, A. T. (2000). The Rise of Fiduciary Capitalism: How
Institutional Investors Can Make Corporate America More Democratic. Retrieved
March 13, 2014 from Google Books: books.google.co.uk/books?id=ks2-
iqwXd5AC&printsec=frontcover&dq=The+Rise+of+Fiduciary+Capitalism&hl=en&sa=X
&ei=51MjU8XpB8uVhQes7ID4DQ&ved=0CDIQ6AEwAA#v=onepage&q=The%20Rise%
20of%20Fiduciary%20Capitalism&f=false
58. Hebb, T. (2008). No Small Change: Pension Funds and Corporate Engagement. (C. U.
Press, Ed.) New York, USA: Cornell University Press.
59. Henderson, D. (2001). Misguided Virtue: False notions of corporate social
responsibility (1st ed.). London: Institute of Economic Affairs.
60. Henningsen, C. (2002). Investing as if the World Really Mattered. Corporate
Environmental Strategy , 9 (2), 163-171.
61. Hill, R. P., Ainscough, T., Shank, T., & Manullang, D. (2007). Corporate Social
Responsibility and Socially Responsible Investing: A Global Perspective. Journal of
Business Ethics , 70 (2), 165-174.
62. Hofmann, E., Hoelzl, E., & Kirchler, E. (2008). A Comparison of Models Describing the
impact or moral Decision Making on Investment Decisions. Journal of Business
Ethics , 82 (1), 171-187.
63. Holden, M., & Lynch, P. (2004). Choosing the Appropriate Methodology:
Understanding Research Philosophy. The Marketing Review , 4 (4), 397-409.
64. Hudson, R. (2005). Ethical Investing. Business Ethics Quarterly , 15 (4), 641-657.
65. Hull, C. E., & Rothenberg, S. (2008). Firm Performance: The Interactions of Corporate
Social Performance with innovation and industry differentiation. Strategic
Management Journal , 29 (7), 781-789.
66. IFAC. (2012). Investor Demand for Environmental, Social and Governance Disclosures:
Implications for Professional Accountants in Business. IFAC. New York: IFAC.
67. Ingalls, A., & Lehman, K. (2014). Approaching Sustainable Fixed Income: ESG
Integration, Investments, Engagement & Customisation. (R. Investor, Ed.) RI Insight -
Fixed Income: ESG in the World's Largest Asset Class (3), 15-17.
Page 162
68. Iyer, E. S., & Kashyap, R. K. (2009). Noneconomic Goals of Investors. Journal of
Consumer Behaviour , 8 (1), 225-237.
69. Jack, A., & Waldmeir, P. (2013, September 23). Bribery Claims Infect Drug Companies'
Dealings in China. (T. F. Ltd., Producer, & The Financial Times Ltd.) Retrieved
December 30, 2013 from Financial Times: www.ft.com/cms/s/0/93990558-2156-
11e3-a92a-00144feab7de.html
70. Jansson, M., & Biel, A. (2010). Motives to Engage in Sustainable Investment: a
Comparison Between Institutional and Private Investors. Sustainable Development ,
19 (1), 135-142.
71. Jensen, M. (2001). Value Maximization, Stakeholder Theory, and the Corporate
Objective Function. Journal of Applied Corporate Finance , 14 (3), 8-21.
72. Jick, T. (1979). Mixing Qualitative and Quantitative Methods: Triangulation in Action.
Administrative Science Quarterly , 24 (1), 602-611.
73. Juravle, C., & Lewis, A. (2008). Identifying Impediments to SRI in Europe: a Review of
the Practitioner and Academic Literature. Business Ethics: A European Review , 17
(3), 285-310.
74. Kane, E. (2012). Pharmaceuticals - Research Briefing Prepared for the Sustainability
Accounting Standards Board Industry Working Groups. Retrieved November 7, 2013
from SASB: www.sasb.org/wp-content/uploads/2012/11/Pharmaceuticals-Industry-
Brief-Website-Sample.pdf
75. Karlsson, C. (2009). Researching Operations Management. (Routledge, Ed.) Great
Britain: Routledge.
76. Kinder, P. D. (2005). "Socially Responsible Investing": An Evolving Concept in a
Changing World. KLD. Boston: KLD.
77. KPMG International Cooperative. (2013). The KPMG Survey of Corporate
Responsibility Reporting 2013. Retrieved November 25, 2013 from KPMG:
www.kpmg.com/Global/en/IssuesAndInsights/ArticlesPublications/corporate-
responsibility/Documents/corporate-responsibility-reporting-survey-2013.pdf
78. Krehmeyer, D., Orsagh, M., & Schacht, K. N. (2006). Breaking the Short-Term Cycle:
Discussion and Recommendations on How Corporate Leaders, Asset Managers,
Investors, and Analysts Can Refocus on Long-Term Value. CFA Centre for Financial

Page 163
Market Integrity and the Business Institute for Corporate Ethics Symposium Series on
Short-Termism , 1-18.
79. Larkin, J. (2003). Strategic Reputation Risk Management. (Palgrave, Ed.) Great
Britain: Palgrave.
80. Laufer. (2003). Social Accountability and Corporate Greenwashing. Journal of
Business Ethics , 43 (3), 253-261.
81. Laufer, W. S. (2003). Social Accountability and Corporate Greenwashing. Journal of
Business Ethics , 43 (3), 253-261.
82. Leisinger, K. M. (2011). Corporate Responsibility for Pharmaceutical Corporations. In
C. Crouch, C. Maclean, & O. U. Press (Ed.), The responsible corporation in a global
economy (pp. 95-115). Oxford: Oxford University Press.
83. Leisinger, K. M. (2005). The Corporate Social Responsibility of the Pharmaceutical
Industry: Idealism without Illusion and Realism without Resignation. Business Ethics
Quarterly , 15 (4), 577-594.
84. Lewis, A. (2001). A Focus Group Study of the Motivation to Invest: ‘Ethical/Green’
and ‘Ordinary’ Investors Compared. The Journal of Socio-Economics , 30 (4), 331-341.
85. Lewis, A., & McKenzie, C. (2000). Support for Investor Activism Among U.K. Ethical
Investors. Journal of Business Ethics , 24 (1), 215-222.
86. Luo, X., & Bhattacharya, C. B. (2009). The Debate over Doing Good: Corporate Social
Performance, Strategic Marketing Levers, and Firm-Idiosyncratic Risk. Journal of
Marketing , 73 (1), 198–213.
87. Luo, X., & Bhattacharya, C. (2006). Corporate Social Responsibility, Customer
Satisfaction, and Market Value. Journal of Marketing , 70 (4), 1-18.
88. Lydenberg, S. (2007). Universal Investors and Socially Responsible Investors: A Tale
of Emerging Affinities. Corporate Governance: An International Review , 15 (3), 467-
477.
89. Mackey, A., Mackey, T. B., & Barney, J. B. (2007). Corporate Social Responsibility and
Firm Performance: Investor Preferences and Corporate Strategies. Academy of
Management Review , 32 (3), 817–835.

Page 164
90. Mahoney, K., Alexander, M. A., Thompson, G., Barsugli, J. J., & Scott, J. D. (2012).
Changes in hail and flood risk in high-resolution simulations over Colorado's
mountains. Nature Climate Change , 2 (1), 125-131.
91. Malkiel, B. G. (2003). The efficient market hypothesis and its critics. Journal Of
Economic Perspectives , 17 (1), 59-82.
92. Malkiel, B. G., & Fama, E. F. (1970). Efficient Capital Markets: A Review of Theory and
Empirical Work. The Journal of Finance , 25 (2), 383-417.
93. Margolis, J. D., Elfenbein, H. A., & Walsh, J. P. (2007). ‘Does it Pay to be Good? A
Meta-Analysis and Redirection of Research on the Relationship Between Corporate
Social and Financial Performance’. Retrieved December 2, 2013 from Unpublished
Manuscript:
stakeholder.bu.edu/docs/walsh,%20jim%20does%20it%20pay%20to%20be%20good
94. McWilliams, A., & Siegel, D. (2000). Corporate Social Performance and Financial
Performance: Correlation or Misspecification? Strategic Journal Management , 21
(5), 603-609.
95. McWilliams, A., & Siegel, D. (2001). Corporate Social Responsibility: A Theory of the
Firm Perspective. The Academy of Management Review , 26 (1), 117-127.
96. Merton, R. K. (1976). Sociological Ambivalence and Other Essays. (S. a. Schuster, Ed.)
New York, USA: Macmillan Publishing Co., Inc.
97. Mitchell, R. K., Agle, B. R., & Wood, D. J. (1997). Toward a Theory of Stakeholder
Identification and Salience: Defining the prinsiple of Who and What Really Counts.
The Academy of Management Review , 22 (4), 853-886.
98. Murphy, D., & McGrath, D. (2013). ESG Reporting: Class Actions, Deterrence, and
Avoidance. Sustainability Accounting Management and Policy Journal , 4 (3), 216-
235.
99. Nofsinger, J. R., & Sias, R. (1999). Herding and Feedback Trading by Institutional and
Individual Investors. The Journal of Finance , 54 (6), 2263-2295.
100. Novethic. (2013). ESG Strategies of European Asset Owners: From Theory to Practice.
Novethic. Paris: Novethic.

Page 165
101. Okoye, A. (2009). Theorising Corporate Social Responsibility as an Essentially
Contested Concept: Is a Definition Necessary. Journal of Business Ethics , 89 (1), 613-
627.
102. Orlitzky, M., Schmidt, F. L., & Rynes, S. L. (2003). Corporate Social and Financial
Performance: A Meta-Analysis. Organisation Studies , 24 (3), 403–441.
103. Parent, M., & Deephouse, D. L. (2007). A Case Studyof Stakeholder Identification and
Prioritization by Managers. Journal of Business Ethics , 75 (1), 1-23.
104. Pavelin, S., & Porter, L. A. (2008). The Corporate Social Performance Content of
Innovation in the U.K. Journal of Business Ethics , 80 (4), 711-725.
105. Petersen, L. H., & Vredenburg, H. (2009). Morals or Economics? Institutional Investor
Preferences for Corporate Socail Responsibility. Journal of Business Ethics , 90 (1), 1-
14.
106. Porter, M. E., & Kramer, M. R. (2006). Strategy & Society: The Link Between
Competitive Advantage and Corporate Social Responsibilty. Harvard Business
Review , 84 (12), 78-92.
107. PRI. (2013a). About PRI. (PRI, Producer, & PRI) Retrieved February 11, 2014 from PRI:
http://www.unpri.org/about-pri/about-pri/
108. PRI. (2013b). Building the Capacity of Investment Actors to use Environmental, Social
and Governance (ESG) Information. Retrieved February 11, 2014 from PRI:
d2m27378y09r06.cloudfront.net/viewer/?file=wp-
content/uploads/Capacity_Building_2013.pdf
109. Renneboog, L., Ter Horst, J., & Zhang, C. (2008). Social Responsible Investments:
Institutional Aspects, Performance, and Investor Behavior. Journal of Banking and
Finance , 32 (9), 1723-1742.
110. Responible Investor. (2008). Integrating ESG Into Mainstream Portfolios. Responsible
Investor. London: Response Global Media Ltd.
111. Responsible Investor. (2014). RI Insight - Fixed Income: ESG in the World's Largest
Asset Class. Responsible Investor. London: Response Global Media Ltd.
112. Richardson, B. J. (2008). Putting Ethics into Environmental Law: Fiduciary Duties for
Ethical Investment. Osgoode Hall Law Journal , 46 (2), 243-291.

Page 166
113. Rodgers, W., Choy, H. L., & Guiral, A. (2013). Do Investors Value a Firm's
Commitment to Social Activities? Journal of Business Ethics , 114 (1), 607-623.
114. Ruf, B. M., Muralidhar, K., Brown, R. M., Janney, J. J., & Paul, K. (2001). An Empirical
Investigation of the Relationship Between Change in Corporate Social Performance
and Financial Performance: A Stakeholder Theory Perspective. Journal of Business
Ethics , 32 (2), 143-156.
115. Sandberg, J. (2011). Socially Responsible Investment and Fiduciary Duty: Putting the
Freshfields Report into Perspective. Journal of Business Ethics , 101 (1), 143-162.
116. SASB. (2014). Vision and Mission, 2014. (SASB, Producer, & SASB) Retrieved February
15, 2014 from SASB: www.sasb.org/sasb/vision-mission/
117. Saunders, M., Lewis, P., & Thornhill, A. (2000). Research Methods for Business
Students (2nd Edition ed.). (F. T. Hall, Ed.) Harlow, Great Britain: Financial
Times/Prentice Hall.
118. Saunders, M., Lewis, P., & Thornhill, A. (2009). Research Methods for Business
Students (5th Edition ed.). (F. T. Hall, Ed.) Harlow, Great Britain: Financial
Times/Prentice Hall.
119. Scharfstein, D. S., & Stein, J. C. (1990). Herd Behaviour and Investment. American
Economic Association , 80 (3), 465-479.
120. Schnietz, K. E., & Epstein, M. J. (2005). Exploring the Financial Value of a reputation
for Corporate Social Responsibility During a Crisis. Corporate Reputation Review , 7
(4), 327-345.
121. Schueth, S. (2003). Socially Responsible Investing in the United States. Journal of
Business Ethics , 43 (3), 89-194.
122. Sethi, S. P. (2005). Investing in Socially Responsible Companies is a Must for public
Pension Funds: Because There Is No Better Alternative. Journal of Business Ethics , 56
(2), 99-129.
123. Shapiro, S. P. (2005). Agency Theory. Annual Review of Sociology , 31 (1), 263–284.
124. Shobert, B. (2014, January 6). Pharma's Wild Ride In China, 2014. (F. LLC, Producer, &
Forbes LLC) Retrieved March 2, 2014 from Forbes:

Page 167
http://www.forbes.com/sites/benjaminshobert/2014/01/06/pharmas-wild-ride-in-
china/
125. Simpson, W. G., & Kohers, T. (2002). The Link Between Corporate Social and
Financial Performance: Evidence from the Banking Industry. Journal of Business
Ethics , 35 (1), 97-109.
126. Solomon, J. F., & Solomon, A. (2006). Private sScial, Ethical and Environmental
Disclosure. Accounting, Auditing & Accountability Journal , 19 (4), 564-591.
127. Steurer, R., Langer, M. E., Konrad, A., & Martinuzzi, A. (2005). Corporations,
Stakeholders and Sustainable Development I: A Theoretical Exploration of Business-
Society Relations. Journal of Business Ethics , 61 (3), 263-281.
128. Stewart, G., Berard, S., & Fruscella, E. (2012, Third Quarter). Trends in
Environmental, Social and Governance Investing. BNY Mellon Thought Leadership
Series , 2-17.
129. Survey Monkey Inc. (2014). Home. Retrieved January 15, 2014 from Survey Monkey:
www.surveymonkey.com/home/
130. Székely, F., & Knirsch, M. (2005). Responsible Leadership and Corporate Social
Responsibility: Metrics for Sustainable Performance. European Management
Journal , 23 (6), 628-647.
131. Thurmond, V. A. (2001). The Point of Triangulation. Journal of Nursing Scholarship ,
33 (3), 253-258.
132. Turcsanyi, J., & Sisaye, S. (2013). Corporate Social Responsibility and its Link to
Financial Performance: Application to Johnson & Johnson, a Pharmaceutical
Company. World Journal of Science , 10 (1), 4-18.
133. UK Department for Environment, Food & Rural Affairs. (2014). Measuring and
reporting environmental impacts: guidance for businesses, 2.0. (F. &. UK Department
for Environment, Producer, & UK Department for Environment, Food & Rural Affairs)
Retrieved March 3, 2014 from Department for Environment, Food & Rural Affairs:
www.gov.uk/measuring-and-reporting-environmental-impacts-guidance-for-
businesses
134. UKSIF. (2014). About UKSIF - Our Mission, 2014. (UKSIF, Producer, & UKSIF) Retrieved
February 20, 2014 from UKSIF: http://uksif.org/about-uksif/our-mission/
Page 168
135. UKSIF. (2010). Focused on the Future. Retrieved November 20, 2013 from UKSIF:
http://uksif.org/wp-
content/uploads/2012/10/UKSIF_Focused_on_the_Future_Report_June_20101.pdf
136. UKSIF. (2013). The Future of Investment: Impact Investing. UKSIF. London: UKSIF.
137. University of Bath. (2009). Protocol for the Surveying of Students. University of Bath,
School of Management. Bath: University of Bath.
138. USSIF. (2014b). About Us, 2014. (USSIF, Producer, & USSIF) Retrieved February 11,
2014 from USSIF: www.ussif.org/about
139. USSIF. (2003). Report on Socially Responsible Investing Trends in the United States.
USSIF. New York: USSIF.
140. USSIF. (2014c). SRI Basics, 2014. (USSIF, Producer, & USSIF) Retrieved February 11,
2014 from USSIF: http://www.ussif.org/sribasics
141. USSIF. (2014a). Unleashing the potential of US foundation endowments: Using
responsible investment to strengthen endowment oversight and enhance impact.
USSIF. New York: USSIF.
142. Van Beurden, P., & Gossling, T. (2008). The Worth of Values - A Literature Review on
the Relation Between Corporate Social and Financial Performance. Journal of
Business Ethics , 82 (1), 407-424.
143. van der Laan Smith, J., Adhikari, A., Tondkar, R. H., & Andrews, R. L. (2010). The
impact of corporate social disclosure on investment behavior: A cross-national study.
Journal of Accounting and Public Policy , 29 (2), 177-192.
144. Van Marrewijk, M. (2003). Concepts and Definitions of CSR and Corporate
Sustainability: Between Agency and Communion. Journal of Business Ethics , 44 (3),
95-105.
145. Vertigo Ventures Ltd. (2012a). About Us - Our Clients, 2012. (The Webmistress Ltd.)
Retrieved March 10, 2014 from Vertigo Ventures:
www.vertigoventures.com/aboutus/our-clients/
146. Vertigo Ventures Ltd. (2012b). About Us - Who We Are, 2012. (The Webmistress Ltd.)
Retrieved March 10, 2014 from Vertigo Ventures:
www.vertigoventures.com/aboutus/

Page 169
147. Vertigo Ventures Ltd. (2012c). VV-Good Index, 2012. (The Webmistress Ltd.)
Retrieved March 10, 2014 from Vertigo Ventures: www.vertigoventures.com/vv-
good-index/
148. Votaw, D. (1972). Genius Becomes Rare: A Comment on the Doctrine of Social
Responsibility Pt. I. California Management Review , 15 (2), 25.
149. Walls, J. L., Berrone, P., & Phan, P. H. (2012). Corporate Governance and
Environmental Performance: Is there really a link? Strategic Management Journal ,
33 (1), 885-913.
150. WBCSD. (2012). About. (WBCSD, Producer, & WBCSD) Retrieved January 29, 2014
from WBCSD: http://www.wbcsd.org/about.aspx
151. Wood, D. J., & Jones, R. E. (1995). Stakeholder Mismatching: A theoretical problem in
Empirical Research on Corporate Social Performance. The International Journal of
Organisational Analysis , 3 (3), 229-267.
152. YouGov - Cambridge Programme. (2013, September). Public Opinion and the
Evolving State - Annual Forum. Retrieved February 25, 2014 from YouGov:
http://d25d2506sfb94s.cloudfront.net/cumulus_uploads/document/7pwt5tbrgl/You
Gov-Cambridge_2013_Pharma.pdf

Page 170


