From Nano to Macro San Francisco, CA, USA, April 7-11, 2013
4
AUTOMATICNORMAL-ABNORMAL VIDEO FRAME CLASSIFICATION FOR COLONOSCOPY Siyamalan Manivannan ? Ruixuan Wang ? Emanuele Trucco ? Adrian Hood † ? CVIP Computer Vision and Image Processing group, School of Computing, University of Dundee, UK † Leeds Institute of Molecular Medicine, University of Leeds, UK ABSTRACT Two novel schemes are proposed to represent intermediate-scale features for normal-abnormal classification of colonoscopy images. The first scheme works on the full-resolution image, the second on a multi-scale pyramid space. Both schemes support any feature descriptor; here we use multi-resolution local binary patterns which outperformed other features reported in the literature in our com- parative experiments. We also compared experimentally two types of features not previously used in colonoscopy image classification, bag of features and sparse coding, each with and without spatial pyramid matching (SPM). We find that SPM improves performance, therefore supporting the importance of intermediate-scale features as in the proposed schemes for classification. Within normal-abnormal frame classification, we show that our representational schemes out- performs other features reported in the literature in leave-N-out tests with a database of 2100 colonoscopy images. 1. INTRODUCTION More than one million new colorectal cancer cases are diagnosed yearly worldwide. It is the second leading cause of cancer death in the world and the third most common cancer in the UK [1]. Colonoscopy remains the gold standard for colorectal cancer screen- ing, because of its high sensitivity (> 90%) and high specificity (> 94%) for small lesions (< 1.0 cm). Adenoma detection rate (ADR), in terms of lesion detection, is a surrogate marker of quality of colonoscopy [2]. A reliable image processing system detecting abnormalities (including polyps, cancer, ulcers, bleeding, tumors, and Crohn disease) in colonoscopy videos would be a useful tool in improving ADR. Here, we concentrate on normal-abnormal frame classification, a challenging task as abnormalities in colon vary in size, type, color, and shape (Figure 1). Most work on automatic abnormality detection and frame clas- sification for colonoscopy images analysis (henceforth CIA) applies standard classification techniques like support vector machines or artificial neural network. Various visual features are adopted, includ- ing texture, color, shape, and combinations thereof. Such features are limited in several aspects. Almost all CIA papers compute statis- tics of local features (e.g., local binary patterns or intensity for each pixel) over the whole image, which may fail to capture the shape or contour information which often appears at intermediate-scale image regions. Concatenated color histograms and MPEG-7 edge histograms [3] obtained from non-overlapping image regions have been used to capture intermediate-scale shape information, but they also encode spatial (location) information largely irrelevant with colonoscopy images, as lesions appear in arbitrary locations. This paper proposes two novel representational schemes which capture statistics of intermediate-scale features in addition to statis- Fig. 1. Some images from our database. Top: normal images. Bot- tom: abnormal images. tics of local features, disregarding spatial information of features in the image, leading to accuracy improvements in normal-abnormal frame classification. Texture features such as those based on local binary patterns (LBP), texture spectrum (TS), and gray level co-occurrence matri- ces (GLCM) are used at a single resolution in the colonoscopy lit- erature. Using a set of comparative experiments, this paper shows that multi-resolution LBP features (mLBP), providing a richer local description and reportedly robust to noise and illumination changes [4], improve performance in normal-abnormal frame classification compared to the features proposed in the literature [5, 6, 7, 8, 9, 10]. State-of-the-art feature representations developed in computer vision, such as bag of words (BOW), sparse coding (SC), and their extensions [11, 12, 13], have not been applied to CIA. This paper evaluates the performance of these schemes with a dataset of 2100 colonoscopy images. In particular, by experimentally evaluating these features with and without the integration of spatial pyramids information, additional evidence is provided that intermediate-scale feature information can improve accuracy in normal-abnormal clas- sification. Last but not least, this paper further improves classifica- tion efficiency by a simple and efficient feature selection algorithm, the F-score. 2. RELATED WORK Texture, color, shape, and their combinations have been used for lesion detection and frame classification in CIA. Statistical measures (e.g., contrast, energy) from gray level co- occurrence matrices (GLCM) in frequency or spatial domain are of- ten a basis to generate more complex texture features, although these statistics can also be directly used, e.g., for detection of precancer- ous polyps [5]. A widely used GLCM-based feature is color wavelet 2013 IEEE 10th International Symposium on Biomedical Imaging: From Nano to Macro San Francisco, CA, USA, April 7-11, 2013 978-1-4673-6454-6/13/$31.00 ©2013 IEEE 640
Transcript of From Nano to Macro San Francisco, CA, USA, April 7-11, 2013
AUTOMATIC NORMAL-ABNORMAL VIDEO FRAME CLASSIFICATIONFOR COLONOSCOPY
Siyamalan Manivannan? Ruixuan Wang? Emanuele Trucco? Adrian Hood†
? CVIP Computer Vision and Image Processing group, School of Computing, University of Dundee, UK†Leeds Institute of Molecular Medicine, University of Leeds, UK
ABSTRACT
Two novel schemes are proposed to represent intermediate-scalefeatures for normal-abnormal classification of colonoscopy images.The first scheme works on the full-resolution image, the secondon a multi-scale pyramid space. Both schemes support any featuredescriptor; here we use multi-resolution local binary patterns whichoutperformed other features reported in the literature in our com-parative experiments. We also compared experimentally two typesof features not previously used in colonoscopy image classification,bag of features and sparse coding, each with and without spatialpyramid matching (SPM). We find that SPM improves performance,therefore supporting the importance of intermediate-scale features asin the proposed schemes for classification. Within normal-abnormalframe classification, we show that our representational schemes out-performs other features reported in the literature in leave-N-out testswith a database of 2100 colonoscopy images.
1. INTRODUCTION
More than one million new colorectal cancer cases are diagnosedyearly worldwide. It is the second leading cause of cancer deathin the world and the third most common cancer in the UK [1].Colonoscopy remains the gold standard for colorectal cancer screen-ing, because of its high sensitivity (> 90%) and high specificity(> 94%) for small lesions (< 1.0 cm). Adenoma detection rate(ADR), in terms of lesion detection, is a surrogate marker of qualityof colonoscopy [2]. A reliable image processing system detectingabnormalities (including polyps, cancer, ulcers, bleeding, tumors,and Crohn disease) in colonoscopy videos would be a useful tool inimproving ADR. Here, we concentrate on normal-abnormal frameclassification, a challenging task as abnormalities in colon vary insize, type, color, and shape (Figure 1).
Most work on automatic abnormality detection and frame clas-sification for colonoscopy images analysis (henceforth CIA) appliesstandard classification techniques like support vector machines orartificial neural network. Various visual features are adopted, includ-ing texture, color, shape, and combinations thereof. Such featuresare limited in several aspects. Almost all CIA papers compute statis-tics of local features (e.g., local binary patterns or intensity for eachpixel) over the whole image, which may fail to capture the shapeor contour information which often appears at intermediate-scaleimage regions. Concatenated color histograms and MPEG-7 edgehistograms [3] obtained from non-overlapping image regions havebeen used to capture intermediate-scale shape information, but theyalso encode spatial (location) information largely irrelevant withcolonoscopy images, as lesions appear in arbitrary locations.
This paper proposes two novel representational schemes whichcapture statistics of intermediate-scale features in addition to statis-
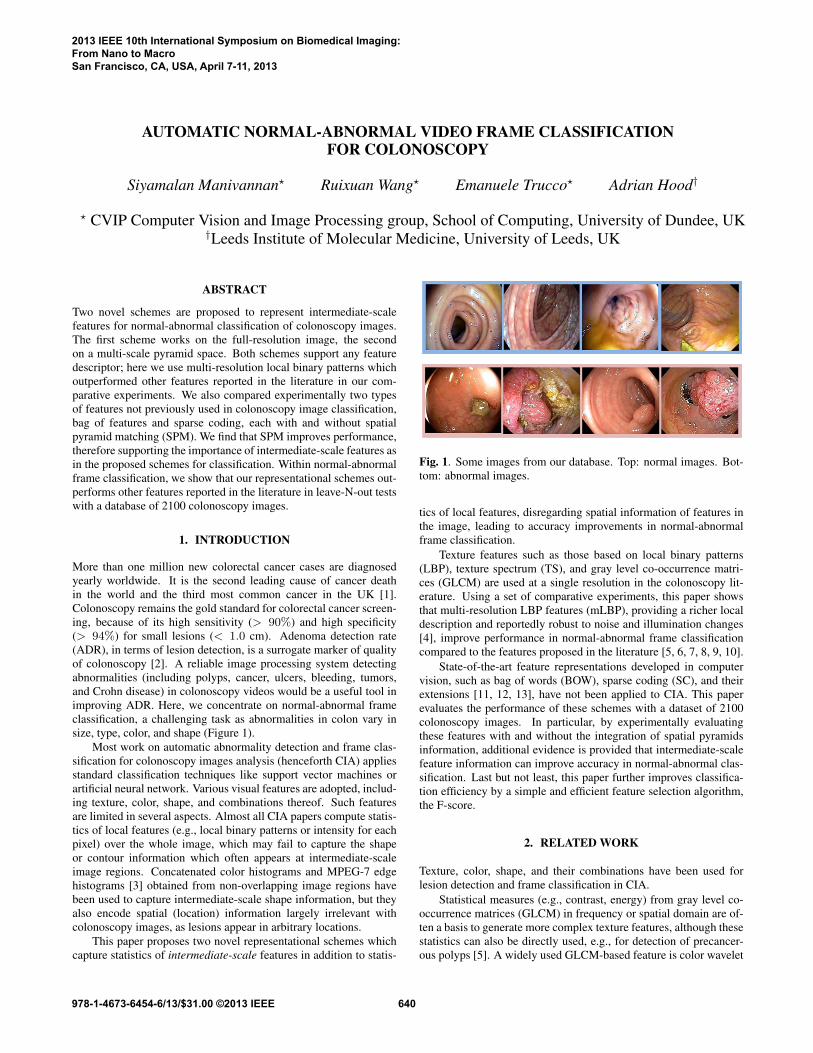
Fig. 1. Some images from our database. Top: normal images. Bot-tom: abnormal images.
tics of local features, disregarding spatial information of features inthe image, leading to accuracy improvements in normal-abnormalframe classification.
Texture features such as those based on local binary patterns(LBP), texture spectrum (TS), and gray level co-occurrence matri-ces (GLCM) are used at a single resolution in the colonoscopy lit-erature. Using a set of comparative experiments, this paper showsthat multi-resolution LBP features (mLBP), providing a richer localdescription and reportedly robust to noise and illumination changes[4], improve performance in normal-abnormal frame classificationcompared to the features proposed in the literature [5, 6, 7, 8, 9, 10].
State-of-the-art feature representations developed in computervision, such as bag of words (BOW), sparse coding (SC), and theirextensions [11, 12, 13], have not been applied to CIA. This paperevaluates the performance of these schemes with a dataset of 2100colonoscopy images. In particular, by experimentally evaluatingthese features with and without the integration of spatial pyramidsinformation, additional evidence is provided that intermediate-scalefeature information can improve accuracy in normal-abnormal clas-sification. Last but not least, this paper further improves classifica-tion efficiency by a simple and efficient feature selection algorithm,the F-score.
2. RELATED WORK
Texture, color, shape, and their combinations have been used forlesion detection and frame classification in CIA.
Statistical measures (e.g., contrast, energy) from gray level co-occurrence matrices (GLCM) in frequency or spatial domain are of-ten a basis to generate more complex texture features, although thesestatistics can also be directly used, e.g., for detection of precancer-ous polyps [5]. A widely used GLCM-based feature is color wavelet
2013 IEEE 10th International Symposium on Biomedical Imaging:From Nano to MacroSan Francisco, CA, USA, April 7-11, 2013
978-1-4673-6454-6/13/$31.00 ©2013 IEEE 640
covariance (CWC) [6, 7]. In essence, entries in a CWC capture thecovariance of statistical measures of co-occurrence of wavelet coef-ficients between color channels [6]. CWC has been used to detectpolyps [6] and to classify images from wireless capsule endoscopy(WCE) into 5 different categories (normal, bleeding, ulcer, polypsand unclassified defects) [7]. CWC-related measures have been usedto detect colorectal lesions [5].
Statistics of LBP (e.g., histograms) have also been used as tex-ture features in colonosopcy image analysis. LBP [14] describesthe local texture around each pixel by comparing and thresholdingthe neighbouring pixels with respect to the central pixel. LBP-basedstatistics have been used for polyp detection [15] and bleeding detec-tion [8]. A comparative study showed that GLCM-based and LBP-based features performed equally well for polyp detection [16] . Inaddition, similar to LBP, texture spectra (TS) features have been usedto classify WCE images [9].
Color is a salient feature for bleeding detection. Histograms orother statistics of color in different color spaces (e.g., RGB or HSV)have been reported for bleeding detection in WCE images, e.g., in[17]. Color histograms have also been used for colonoscopy frameclassification, reportedly performing better than CWC features forclassifying frames as informative (e.g., with folds, lumen, abnormal-ities) or non-informative (e.g., with poor quality due to turbidity),and as containing bleeding or not [10].
Color and texture features are often combined together forcolonoscopy image analysis. The combination of intensity his-togram and TS-based features from each color channel has beenreported to perform very well for WCE normal-abnormal imageclassification in [18], but on a very small dataset. Color histogramswere also combined with the statistics of discrete wavelet transfor-mations (DWT) to detect lesions in a multiple-scale framework [19],and with LBP-based histograms to detect bleeding [8].
Shape-based image features have also been reported in en-doscopic image analysis, e.g., ellipses approximating contours forpolyps detection [20]. Edge orientation histograms as part of MPEG-7 visual descriptors, together with color and texture features such asdominant color and homogeneous texture, have recently been usedfor Crohn disease classification [3].
3. METHODOLOGY
Our normal-abnormal frame classification method consists of threesteps: feature extraction, feature selection and classification. Afterfeature extraction (Sections 3.1, 3.2), a feature selection method, theF-Score [21], is applied to identify the most discriminative features.Finally, these features are used for training an SVM classifier. Thissection focuses on feature extraction. We introduce two differentmethods, based respectively on image patches and scale-space, toencode statistical features at intermediate-scale image regions.
3.1. Patch-based method
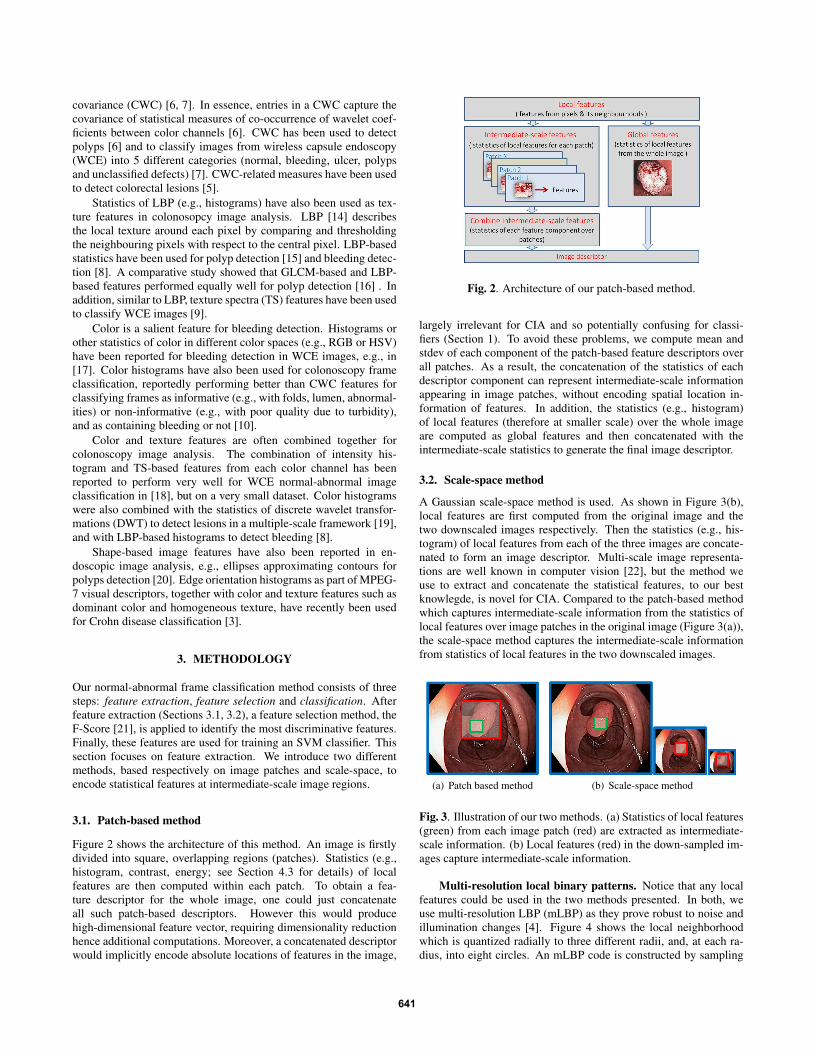
Figure 2 shows the architecture of this method. An image is firstlydivided into square, overlapping regions (patches). Statistics (e.g.,histogram, contrast, energy; see Section 4.3 for details) of localfeatures are then computed within each patch. To obtain a fea-ture descriptor for the whole image, one could just concatenateall such patch-based descriptors. However this would producehigh-dimensional feature vector, requiring dimensionality reductionhence additional computations. Moreover, a concatenated descriptorwould implicitly encode absolute locations of features in the image,
Fig. 2. Architecture of our patch-based method.
largely irrelevant for CIA and so potentially confusing for classi-fiers (Section 1). To avoid these problems, we compute mean andstdev of each component of the patch-based feature descriptors overall patches. As a result, the concatenation of the statistics of eachdescriptor component can represent intermediate-scale informationappearing in image patches, without encoding spatial location in-formation of features. In addition, the statistics (e.g., histogram)of local features (therefore at smaller scale) over the whole imageare computed as global features and then concatenated with theintermediate-scale statistics to generate the final image descriptor.
3.2. Scale-space method
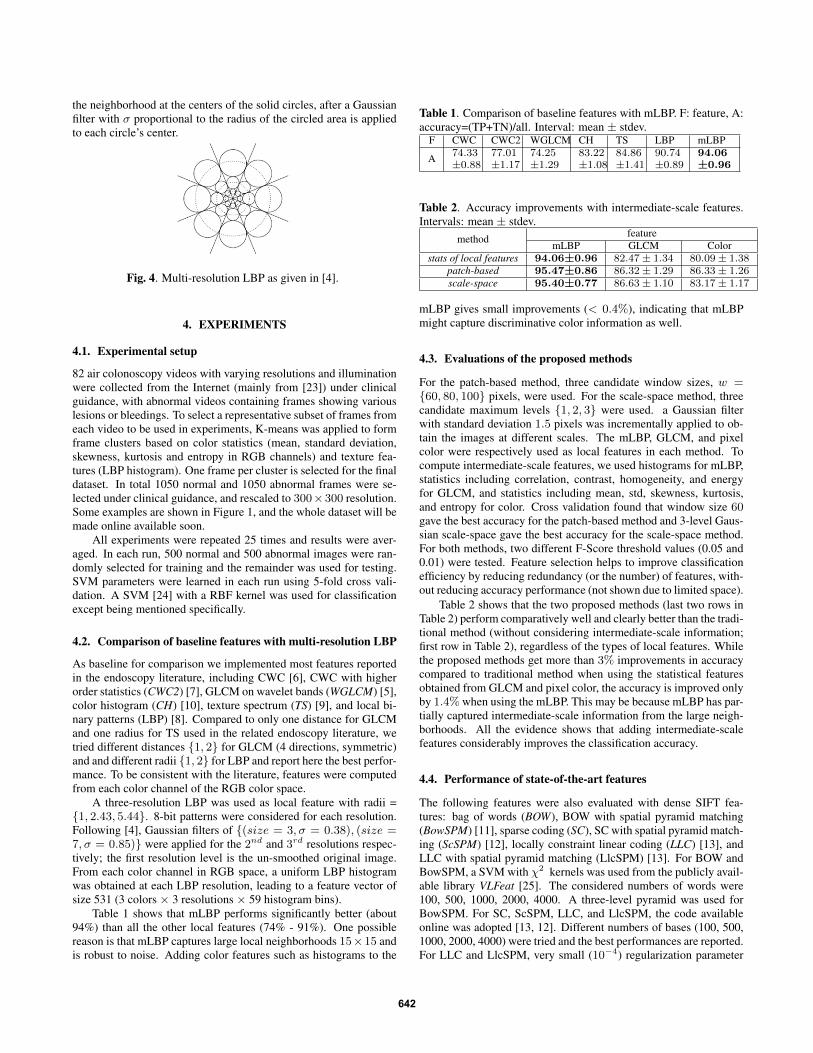
A Gaussian scale-space method is used. As shown in Figure 3(b),local features are first computed from the original image and thetwo downscaled images respectively. Then the statistics (e.g., his-togram) of local features from each of the three images are concate-nated to form an image descriptor. Multi-scale image representa-tions are well known in computer vision [22], but the method weuse to extract and concatenate the statistical features, to our bestknowlegde, is novel for CIA. Compared to the patch-based methodwhich captures intermediate-scale information from the statistics oflocal features over image patches in the original image (Figure 3(a)),the scale-space method captures the intermediate-scale informationfrom statistics of local features in the two downscaled images.
(a) Patch based method (b) Scale-space method
Fig. 3. Illustration of our two methods. (a) Statistics of local features(green) from each image patch (red) are extracted as intermediate-scale information. (b) Local features (red) in the down-sampled im-ages capture intermediate-scale information.
Multi-resolution local binary patterns. Notice that any localfeatures could be used in the two methods presented. In both, weuse multi-resolution LBP (mLBP) as they prove robust to noise andillumination changes [4]. Figure 4 shows the local neighborhoodwhich is quantized radially to three different radii, and, at each ra-dius, into eight circles. An mLBP code is constructed by sampling
641
the neighborhood at the centers of the solid circles, after a Gaussianfilter with σ proportional to the radius of the circled area is appliedto each circle’s center.
Fig. 4. Multi-resolution LBP as given in [4].
4. EXPERIMENTS
4.1. Experimental setup
82 air colonoscopy videos with varying resolutions and illuminationwere collected from the Internet (mainly from [23]) under clinicalguidance, with abnormal videos containing frames showing variouslesions or bleedings. To select a representative subset of frames fromeach video to be used in experiments, K-means was applied to formframe clusters based on color statistics (mean, standard deviation,skewness, kurtosis and entropy in RGB channels) and texture fea-tures (LBP histogram). One frame per cluster is selected for the finaldataset. In total 1050 normal and 1050 abnormal frames were se-lected under clinical guidance, and rescaled to 300×300 resolution.Some examples are shown in Figure 1, and the whole dataset will bemade online available soon.
All experiments were repeated 25 times and results were aver-aged. In each run, 500 normal and 500 abnormal images were ran-domly selected for training and the remainder was used for testing.SVM parameters were learned in each run using 5-fold cross vali-dation. A SVM [24] with a RBF kernel was used for classificationexcept being mentioned specifically.
4.2. Comparison of baseline features with multi-resolution LBP
As baseline for comparison we implemented most features reportedin the endoscopy literature, including CWC [6], CWC with higherorder statistics (CWC2) [7], GLCM on wavelet bands (WGLCM) [5],color histogram (CH) [10], texture spectrum (TS) [9], and local bi-nary patterns (LBP) [8]. Compared to only one distance for GLCMand one radius for TS used in the related endoscopy literature, wetried different distances {1, 2} for GLCM (4 directions, symmetric)and and different radii {1, 2} for LBP and report here the best perfor-mance. To be consistent with the literature, features were computedfrom each color channel of the RGB color space.
A three-resolution LBP was used as local feature with radii ={1, 2.43, 5.44}. 8-bit patterns were considered for each resolution.Following [4], Gaussian filters of {(size = 3, σ = 0.38), (size =7, σ = 0.85)} were applied for the 2nd and 3rd resolutions respec-tively; the first resolution level is the un-smoothed original image.From each color channel in RGB space, a uniform LBP histogramwas obtained at each LBP resolution, leading to a feature vector ofsize 531 (3 colors × 3 resolutions × 59 histogram bins).
Table 1 shows that mLBP performs significantly better (about94%) than all the other local features (74% - 91%). One possiblereason is that mLBP captures large local neighborhoods 15×15 andis robust to noise. Adding color features such as histograms to the
Table 1. Comparison of baseline features with mLBP. F: feature, A:accuracy=(TP+TN)/all. Interval: mean ± stdev.
F CWC CWC2 WGLCM CH TS LBP mLBP
A 74.33 77.01 74.25 83.22 84.86 90.74 94.06±0.88 ±1.17 ±1.29 ±1.08 ±1.41 ±0.89 ±0.96
Table 2. Accuracy improvements with intermediate-scale features.Intervals: mean ± stdev.
method featuremLBP GLCM Color
stats of local features 94.06±0.96 82.47± 1.34 80.09± 1.38patch-based 95.47±0.86 86.32± 1.29 86.33± 1.26scale-space 95.40±0.77 86.63± 1.10 83.17± 1.17
mLBP gives small improvements (< 0.4%), indicating that mLBPmight capture discriminative color information as well.
4.3. Evaluations of the proposed methods
For the patch-based method, three candidate window sizes, w ={60, 80, 100} pixels, were used. For the scale-space method, threecandidate maximum levels {1, 2, 3} were used. a Gaussian filterwith standard deviation 1.5 pixels was incrementally applied to ob-tain the images at different scales. The mLBP, GLCM, and pixelcolor were respectively used as local features in each method. Tocompute intermediate-scale features, we used histograms for mLBP,statistics including correlation, contrast, homogeneity, and energyfor GLCM, and statistics including mean, std, skewness, kurtosis,and entropy for color. Cross validation found that window size 60gave the best accuracy for the patch-based method and 3-level Gaus-sian scale-space gave the best accuracy for the scale-space method.For both methods, two different F-Score threshold values (0.05 and0.01) were tested. Feature selection helps to improve classificationefficiency by reducing redundancy (or the number) of features, with-out reducing accuracy performance (not shown due to limited space).
Table 2 shows that the two proposed methods (last two rows inTable 2) perform comparatively well and clearly better than the tradi-tional method (without considering intermediate-scale information;first row in Table 2), regardless of the types of local features. Whilethe proposed methods get more than 3% improvements in accuracycompared to traditional method when using the statistical featuresobtained from GLCM and pixel color, the accuracy is improved onlyby 1.4% when using the mLBP. This may be because mLBP has par-tially captured intermediate-scale information from the large neigh-borhoods. All the evidence shows that adding intermediate-scalefeatures considerably improves the classification accuracy.
4.4. Performance of state-of-the-art features
The following features were also evaluated with dense SIFT fea-tures: bag of words (BOW), BOW with spatial pyramid matching(BowSPM) [11], sparse coding (SC), SC with spatial pyramid match-ing (ScSPM) [12], locally constraint linear coding (LLC) [13], andLLC with spatial pyramid matching (LlcSPM) [13]. For BOW andBowSPM, a SVM with χ2 kernels was used from the publicly avail-able library VLFeat [25]. The considered numbers of words were100, 500, 1000, 2000, 4000. A three-level pyramid was used forBowSPM. For SC, ScSPM, LLC, and LlcSPM, the code availableonline was adopted [13, 12]. Different numbers of bases (100, 500,1000, 2000, 4000) were tried and the best performances are reported.For LLC and LlcSPM, very small (10−4) regularization parameter
642
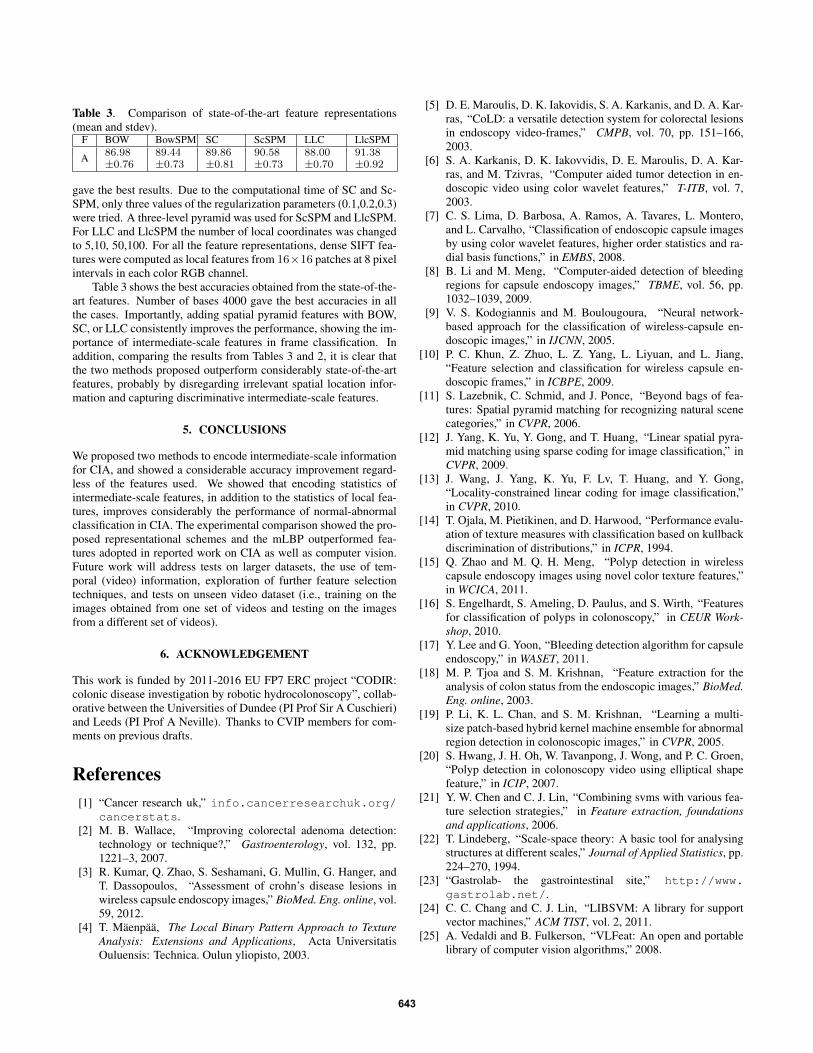
Table 3. Comparison of state-of-the-art feature representations(mean and stdev).
F BOW BowSPM SC ScSPM LLC LlcSPM
A 86.98 89.44 89.86 90.58 88.00 91.38±0.76 ±0.73 ±0.81 ±0.73 ±0.70 ±0.92
gave the best results. Due to the computational time of SC and Sc-SPM, only three values of the regularization parameters (0.1,0.2,0.3)were tried. A three-level pyramid was used for ScSPM and LlcSPM.For LLC and LlcSPM the number of local coordinates was changedto 5,10, 50,100. For all the feature representations, dense SIFT fea-tures were computed as local features from 16×16 patches at 8 pixelintervals in each color RGB channel.
Table 3 shows the best accuracies obtained from the state-of-the-art features. Number of bases 4000 gave the best accuracies in allthe cases. Importantly, adding spatial pyramid features with BOW,SC, or LLC consistently improves the performance, showing the im-portance of intermediate-scale features in frame classification. Inaddition, comparing the results from Tables 3 and 2, it is clear thatthe two methods proposed outperform considerably state-of-the-artfeatures, probably by disregarding irrelevant spatial location infor-mation and capturing discriminative intermediate-scale features.
5. CONCLUSIONS
We proposed two methods to encode intermediate-scale informationfor CIA, and showed a considerable accuracy improvement regard-less of the features used. We showed that encoding statistics ofintermediate-scale features, in addition to the statistics of local fea-tures, improves considerably the performance of normal-abnormalclassification in CIA. The experimental comparison showed the pro-posed representational schemes and the mLBP outperformed fea-tures adopted in reported work on CIA as well as computer vision.Future work will address tests on larger datasets, the use of tem-poral (video) information, exploration of further feature selectiontechniques, and tests on unseen video dataset (i.e., training on theimages obtained from one set of videos and testing on the imagesfrom a different set of videos).
6. ACKNOWLEDGEMENT
This work is funded by 2011-2016 EU FP7 ERC project “CODIR:colonic disease investigation by robotic hydrocolonoscopy”, collab-orative between the Universities of Dundee (PI Prof Sir A Cuschieri)and Leeds (PI Prof A Neville). Thanks to CVIP members for com-ments on previous drafts.
References[1] “Cancer research uk,” info.cancerresearchuk.org/
cancerstats.[2] M. B. Wallace, “Improving colorectal adenoma detection:
technology or technique?,” Gastroenterology, vol. 132, pp.1221–3, 2007.
[3] R. Kumar, Q. Zhao, S. Seshamani, G. Mullin, G. Hanger, andT. Dassopoulos, “Assessment of crohn’s disease lesions inwireless capsule endoscopy images,” BioMed. Eng. online, vol.59, 2012.
[4] T. Maenpaa, The Local Binary Pattern Approach to TextureAnalysis: Extensions and Applications, Acta UniversitatisOuluensis: Technica. Oulun yliopisto, 2003.
[5] D. E. Maroulis, D. K. Iakovidis, S. A. Karkanis, and D. A. Kar-ras, “CoLD: a versatile detection system for colorectal lesionsin endoscopy video-frames,” CMPB, vol. 70, pp. 151–166,2003.
[6] S. A. Karkanis, D. K. Iakovvidis, D. E. Maroulis, D. A. Kar-ras, and M. Tzivras, “Computer aided tumor detection in en-doscopic video using color wavelet features,” T-ITB, vol. 7,2003.
[7] C. S. Lima, D. Barbosa, A. Ramos, A. Tavares, L. Montero,and L. Carvalho, “Classification of endoscopic capsule imagesby using color wavelet features, higher order statistics and ra-dial basis functions,” in EMBS, 2008.
[8] B. Li and M. Meng, “Computer-aided detection of bleedingregions for capsule endoscopy images,” TBME, vol. 56, pp.1032–1039, 2009.
[9] V. S. Kodogiannis and M. Boulougoura, “Neural network-based approach for the classification of wireless-capsule en-doscopic images,” in IJCNN, 2005.
[10] P. C. Khun, Z. Zhuo, L. Z. Yang, L. Liyuan, and L. Jiang,“Feature selection and classification for wireless capsule en-doscopic frames,” in ICBPE, 2009.
[11] S. Lazebnik, C. Schmid, and J. Ponce, “Beyond bags of fea-tures: Spatial pyramid matching for recognizing natural scenecategories,” in CVPR, 2006.
[12] J. Yang, K. Yu, Y. Gong, and T. Huang, “Linear spatial pyra-mid matching using sparse coding for image classification,” inCVPR, 2009.
[13] J. Wang, J. Yang, K. Yu, F. Lv, T. Huang, and Y. Gong,“Locality-constrained linear coding for image classification,”in CVPR, 2010.
[14] T. Ojala, M. Pietikinen, and D. Harwood, “Performance evalu-ation of texture measures with classification based on kullbackdiscrimination of distributions,” in ICPR, 1994.
[15] Q. Zhao and M. Q. H. Meng, “Polyp detection in wirelesscapsule endoscopy images using novel color texture features,”in WCICA, 2011.
[16] S. Engelhardt, S. Ameling, D. Paulus, and S. Wirth, “Featuresfor classification of polyps in colonoscopy,” in CEUR Work-shop, 2010.
[17] Y. Lee and G. Yoon, “Bleeding detection algorithm for capsuleendoscopy,” in WASET, 2011.
[18] M. P. Tjoa and S. M. Krishnan, “Feature extraction for theanalysis of colon status from the endoscopic images,” BioMed.Eng. online, 2003.
[19] P. Li, K. L. Chan, and S. M. Krishnan, “Learning a multi-size patch-based hybrid kernel machine ensemble for abnormalregion detection in colonoscopic images,” in CVPR, 2005.
[20] S. Hwang, J. H. Oh, W. Tavanpong, J. Wong, and P. C. Groen,“Polyp detection in colonoscopy video using elliptical shapefeature,” in ICIP, 2007.
[21] Y. W. Chen and C. J. Lin, “Combining svms with various fea-ture selection strategies,” in Feature extraction, foundationsand applications, 2006.
[22] T. Lindeberg, “Scale-space theory: A basic tool for analysingstructures at different scales,” Journal of Applied Statistics, pp.224–270, 1994.
[23] “Gastrolab- the gastrointestinal site,” http://www.gastrolab.net/.
[24] C. C. Chang and C. J. Lin, “LIBSVM: A library for supportvector machines,” ACM TIST, vol. 2, 2011.
[25] A. Vedaldi and B. Fulkerson, “VLFeat: An open and portablelibrary of computer vision algorithms,” 2008.
643


![From Nano to Macro San Francisco, CA, USA, April 7-11, 2013wangruixuan/files/ISBI2013.pdfcovariance (CWC) [6, 7]. In essence, entries in a CWC capture the covariance of statistical](https://static.fdocuments.us/doc/165x107/60720000ace8fe76d2022b7e/from-nano-to-macro-san-francisco-ca-usa-april-7-11-2013-wangruixuanfiles-covariance.jpg)