
Fish Outlook 2015-2024 and 2030 -...
39
Fish Outlook 2015-2024 and 2030 Ad Hoc Expert Meeting on Trade in Sustainable Fisheries- Stefania Vannuccini
Transcript of Fish Outlook 2015-2024 and 2030 -...
Fish Outlook 2015-2024 and 2030
Ad Hoc Expert Meeting on Trade in Sustainable Fisheries- Stefania Vannuccini
Outline
• Background
• Fishery outlook
– OECD-FAO Agricultural Outlook 2015-2024
– IFPRI-WB-FAO Fish to 2030

Before starting... let’s reflect
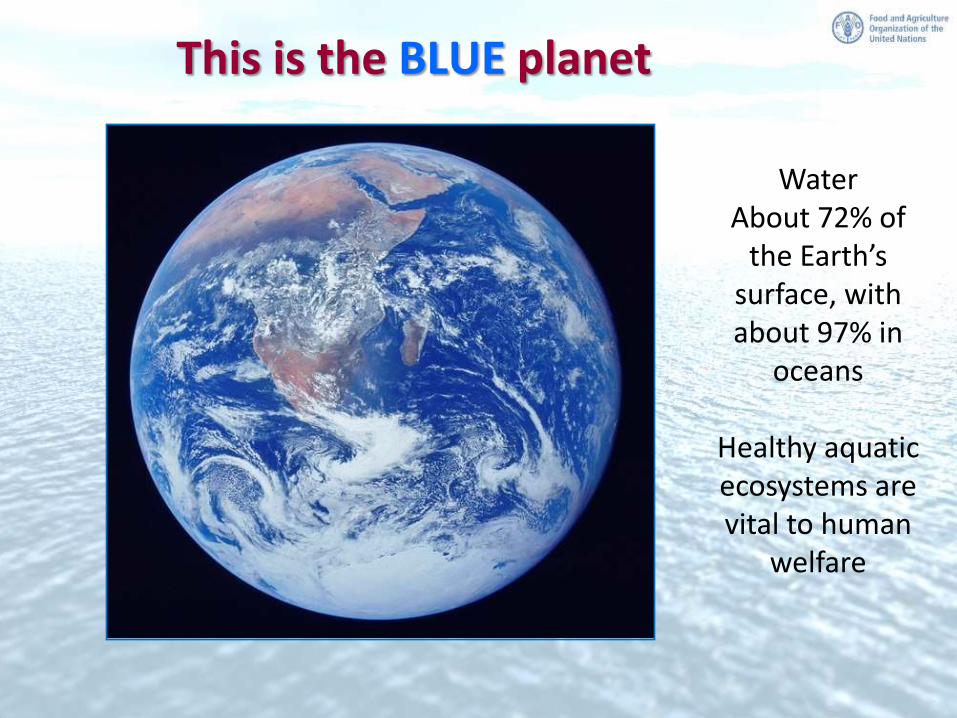
This is the BLUE planet
Water About 72% of
the Earth’s surface, with about 97% in
oceans
Healthy aquatic ecosystems are vital to human
welfare
What OCEANS/WATER give to us
All kinds of Provisioning, Regulating, Cultural and Supporting
services
• Fish and plants as a source of protein and micronutrients (food) • Pharmaceutical compounds (medical cures) • Fixation of atmospheric carbon by algae • Regulation of the climate and weather trends • Provide mass transportation routes • Provide pleasure and wellbeing (recreation) •And much more…
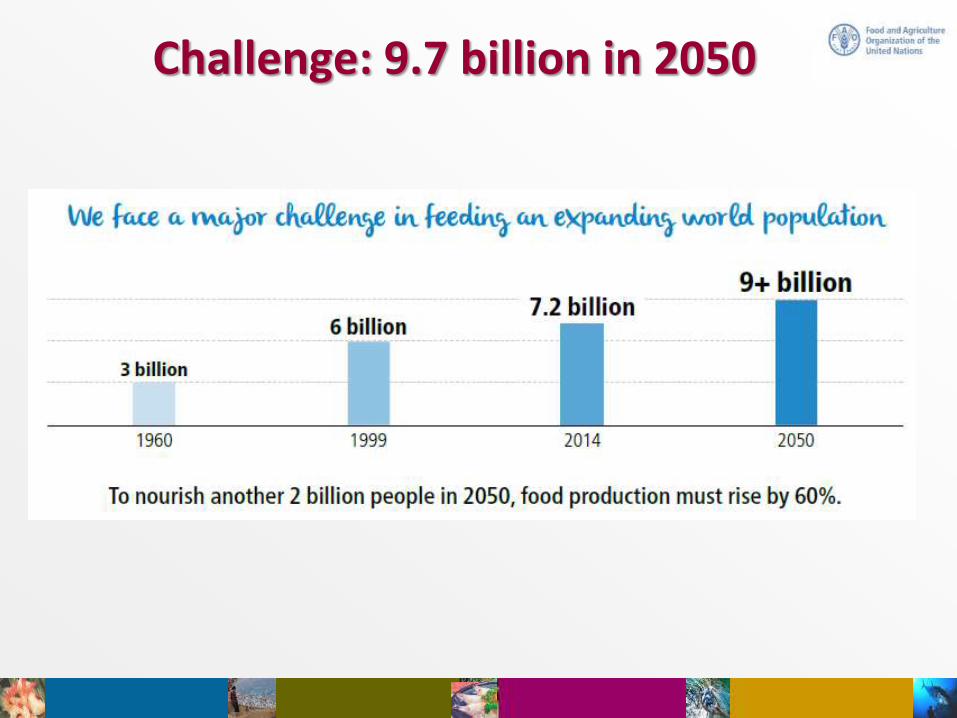
Challenge: 9.7 billion in 2050
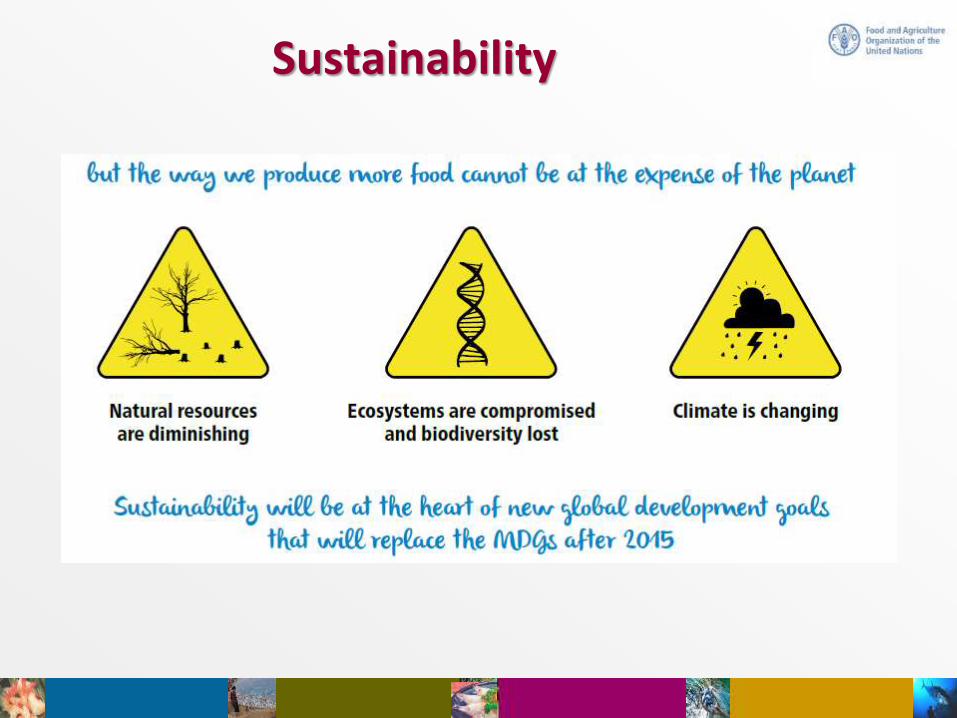
Sustainability
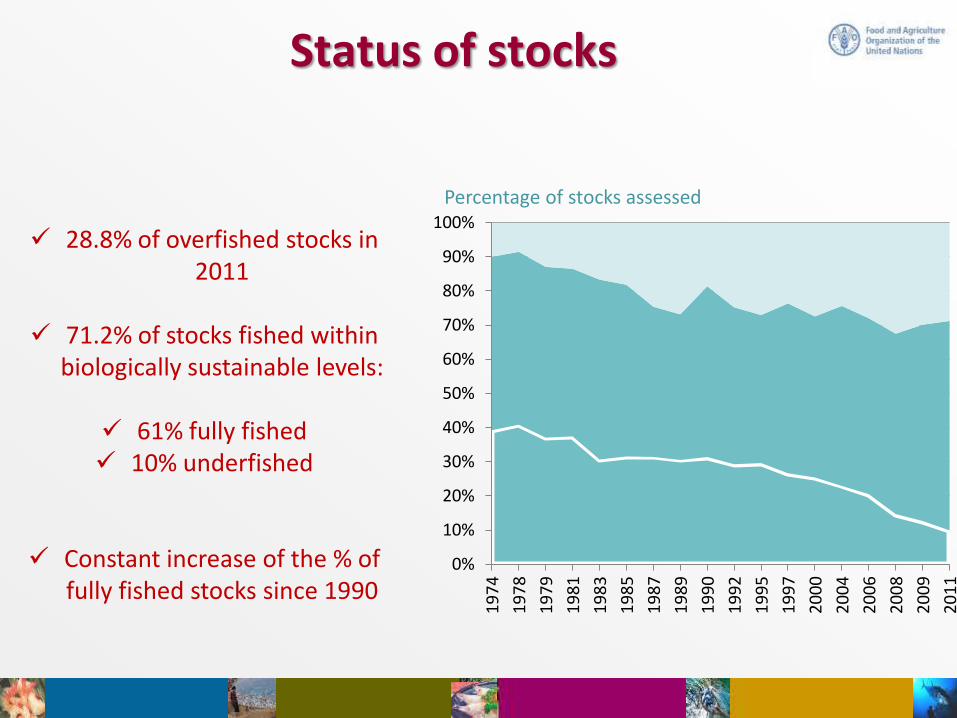
Status of stocks
28.8% of overfished stocks in 2011
71.2% of stocks fished within
biologically sustainable levels:
61% fully fished 10% underfished
Constant increase of the % of fully fished stocks since 1990
0%
10%
20%
30%
40%
50%
60%
70%
80%
90%
100%
19
74
19
78
19
79
19
81
19
83
19
85
19
87
19
89
19
90
19
92
19
95
19
97
20
00
20
04
20
06
20
08
20
09
20
11
Percentage of stocks assessed
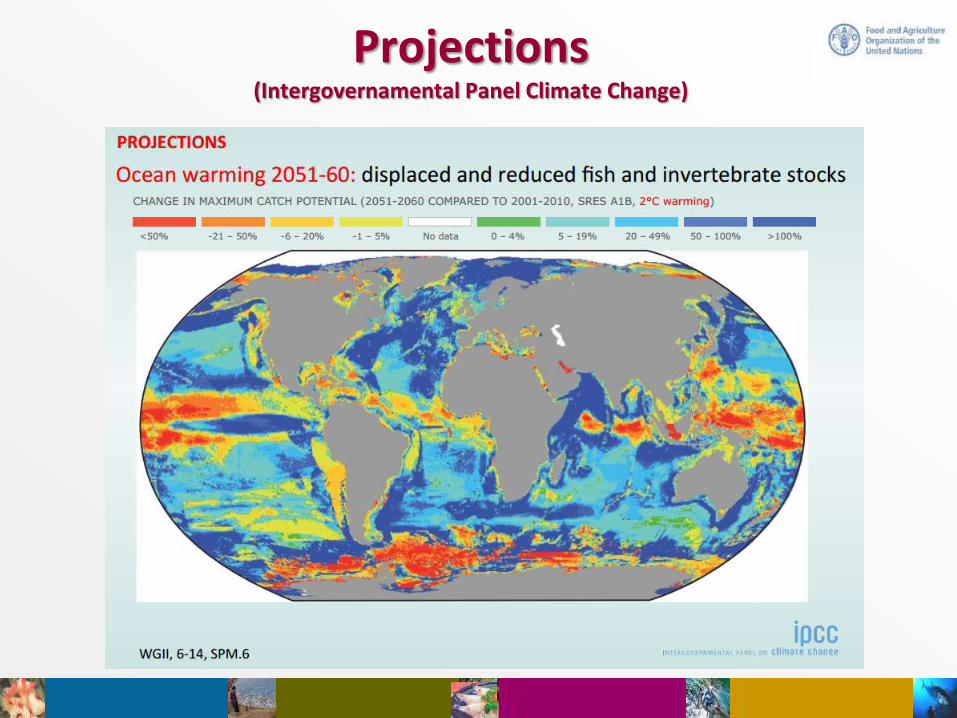
Projections (Intergovernamental Panel Climate Change)

?
The future ahead of us
Outlook models
• Understanding on perspectives of developments
• Lack of specific outlook model for the fisheries and aquaculture sector
• Importance to draw fisheries outlook in integration with agriculture models
Two recent outcomes
• FAO fish model, being published in the yearly OECD-FAO Agricultural Outlook publication since 2011
• IFPRI’s IMPACT MODEL with results published into the recent World Bank “Fish to 2030: prospects for fisheries and aquaculture” publication.
Results
• Projections and not forecast
• Likely paths of development and constraints in fishery and aquaculture supply and demand
• Determine regional vulnerabilities, changes in comparative advantage, price effects, and potential adaptation strategies in the sector
• Medium/longer outlook
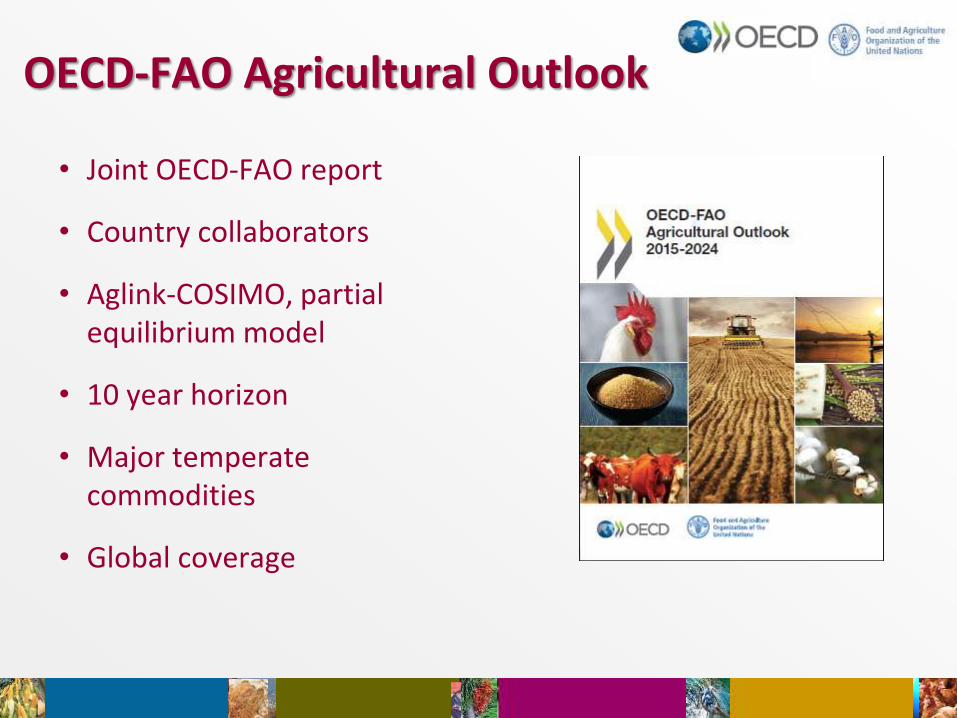
OECD-FAO Agricultural Outlook
• Joint OECD-FAO report
• Country collaborators
• Aglink-COSIMO, partial equilibrium model
• 10 year horizon
• Major temperate commodities
• Global coverage
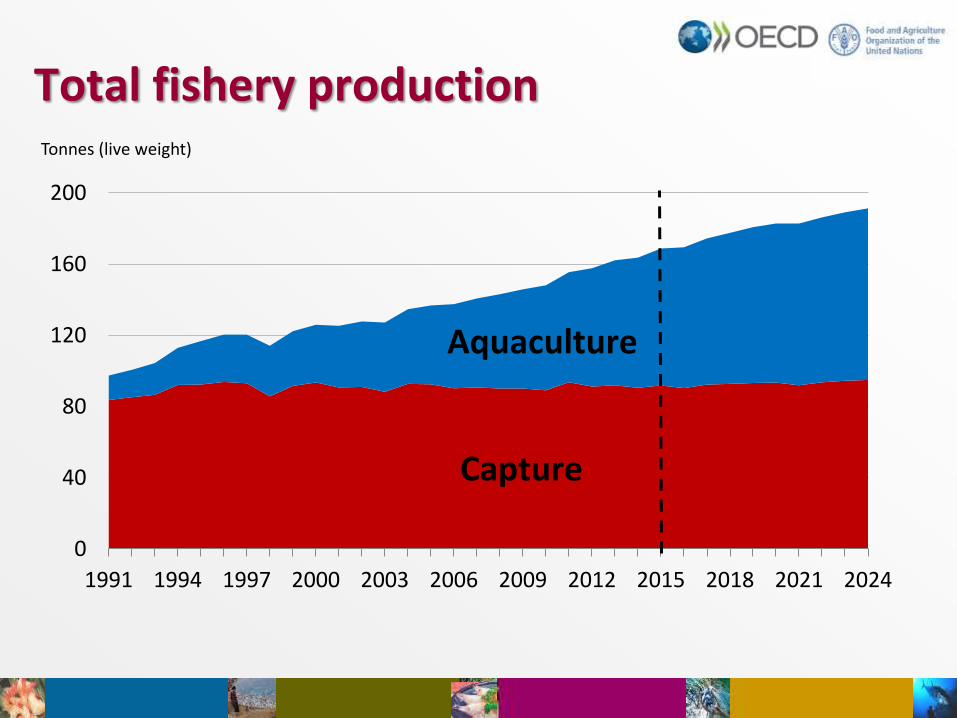
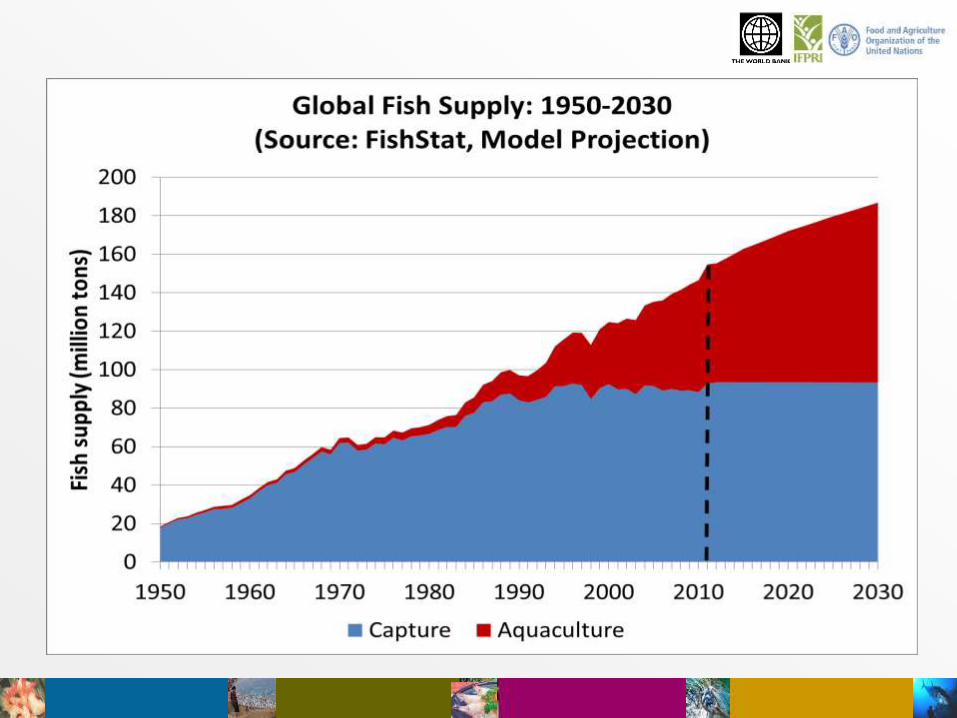
0
40
80
120
160
200
1991 1994 1997 2000 2003 2006 2009 2012 2015 2018 2021 2024
Capture
Aquaculture
Total fishery production Tonnes (live weight)
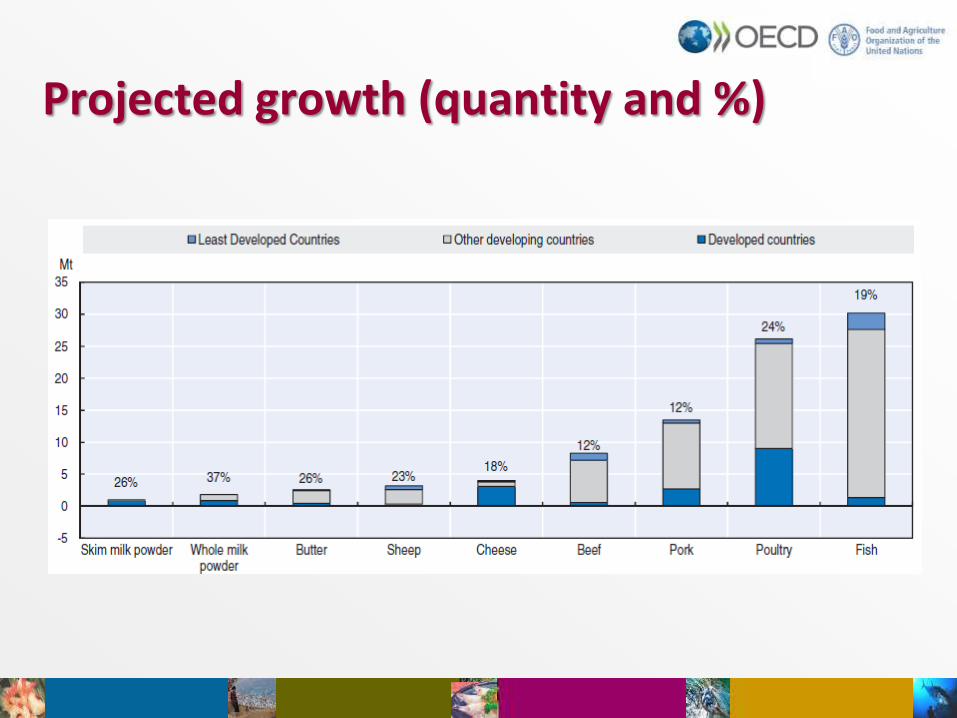
Projected growth (quantity and %)
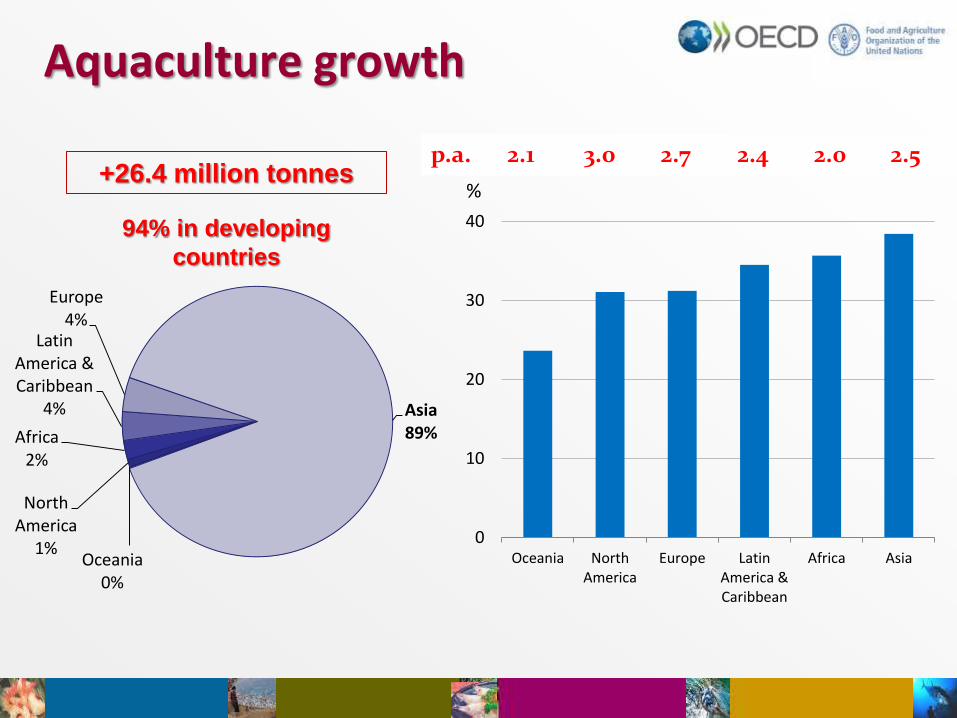
Aquaculture growth
% +26.4 million tonnes
Oceania 0%
North America
1%
Africa 2%
Latin America & Caribbean
4%
Europe 4%
Asia 89%
0
10
20
30
40
Oceania NorthAmerica
Europe LatinAmerica &Caribbean
Africa Asia
94% in developing
countries
p.a. 2.1 3.0 2.7 2.4 2.0 2.5
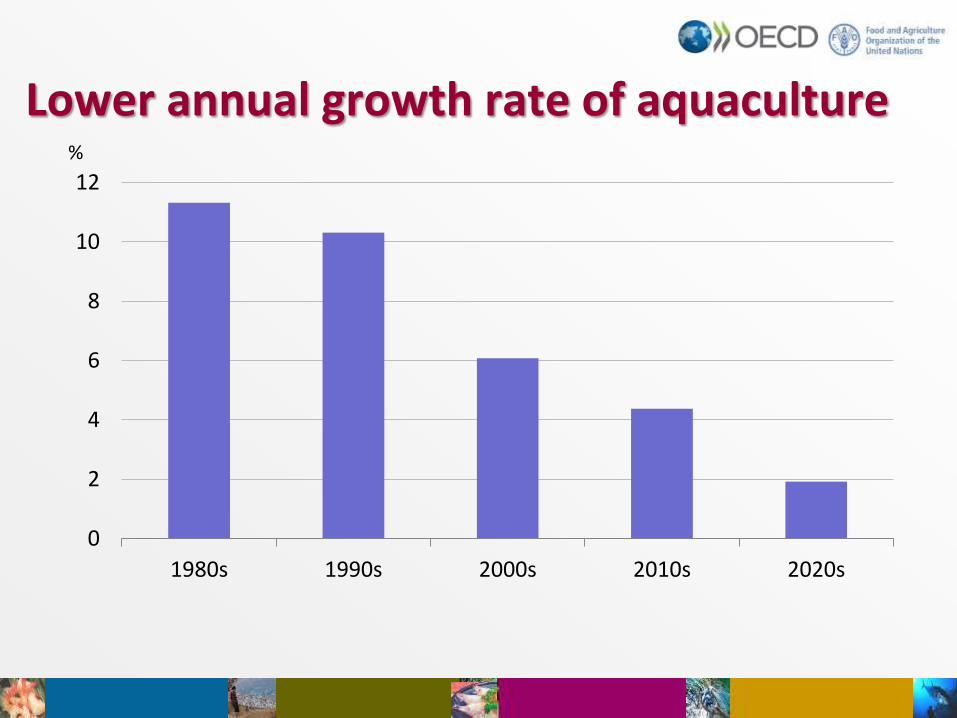
Lower annual growth rate of aquaculture
0
2
4
6
8
10
12
1980s 1990s 2000s 2010s 2020s
%
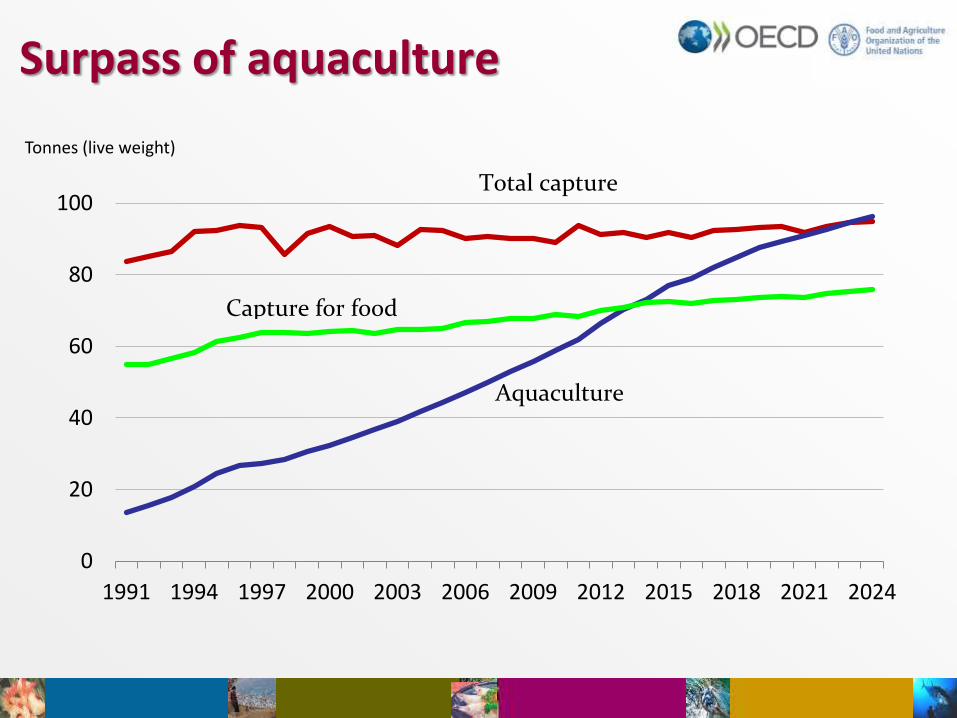
Surpass of aquaculture
0
20
40
60
80
100
1991 1994 1997 2000 2003 2006 2009 2012 2015 2018 2021 2024
Total capture
Capture for food
Aquaculture
Tonnes (live weight)
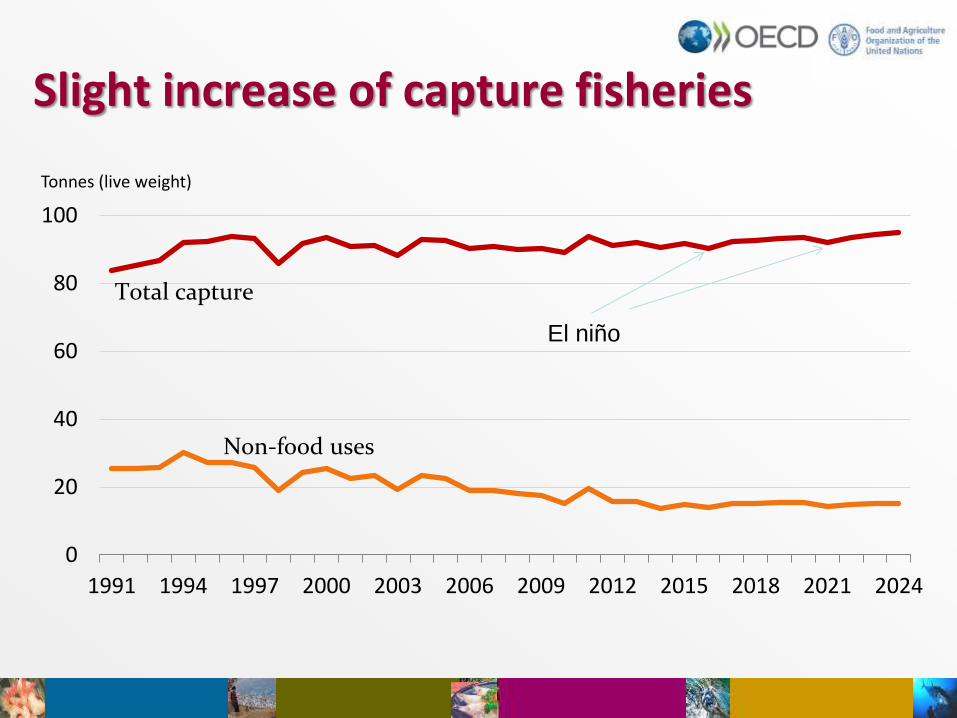
Slight increase of capture fisheries
0
20
40
60
80
100
1991 1994 1997 2000 2003 2006 2009 2012 2015 2018 2021 2024
Non-food uses
Total capture
El niño
Tonnes (live weight)
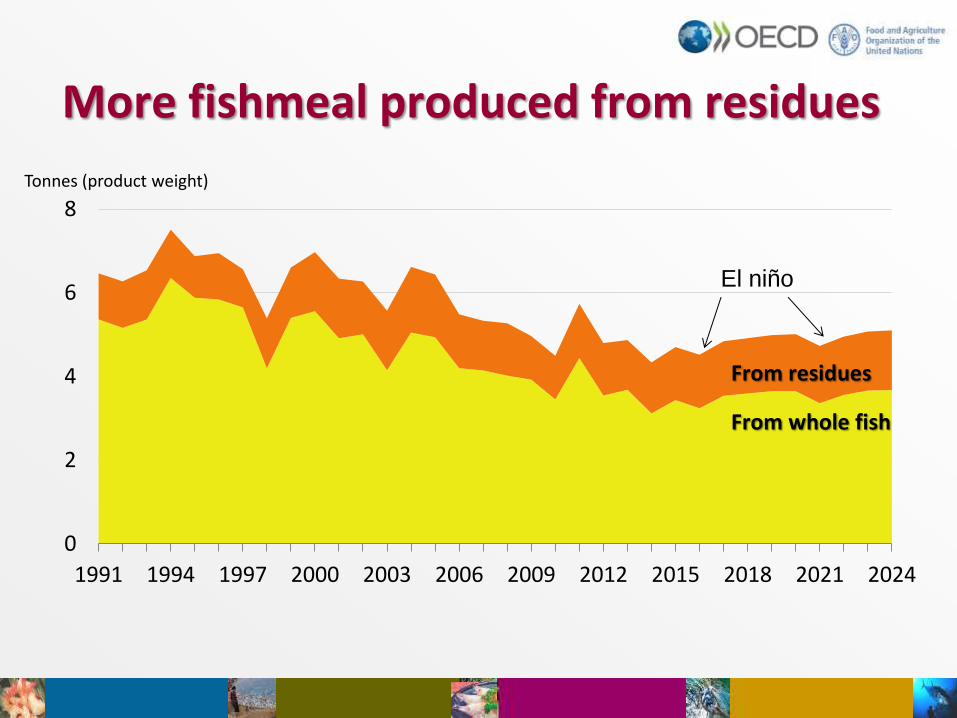
More fishmeal produced from residues
El niño
0
2
4
6
8
1991 1994 1997 2000 2003 2006 2009 2012 2015 2018 2021 2024
From residues
From whole fish
Tonnes (product weight)
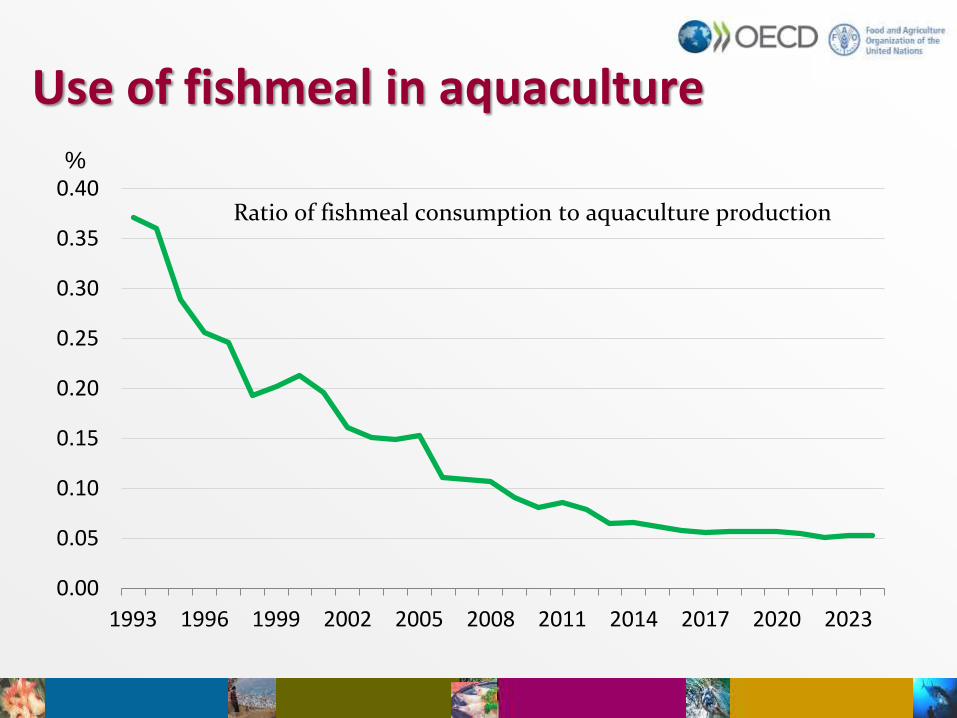
Use of fishmeal in aquaculture
0.00
0.05
0.10
0.15
0.20
0.25
0.30
0.35
0.40
1993 1996 1999 2002 2005 2008 2011 2014 2017 2020 2023
Ratio of fishmeal consumption to aquaculture production
%
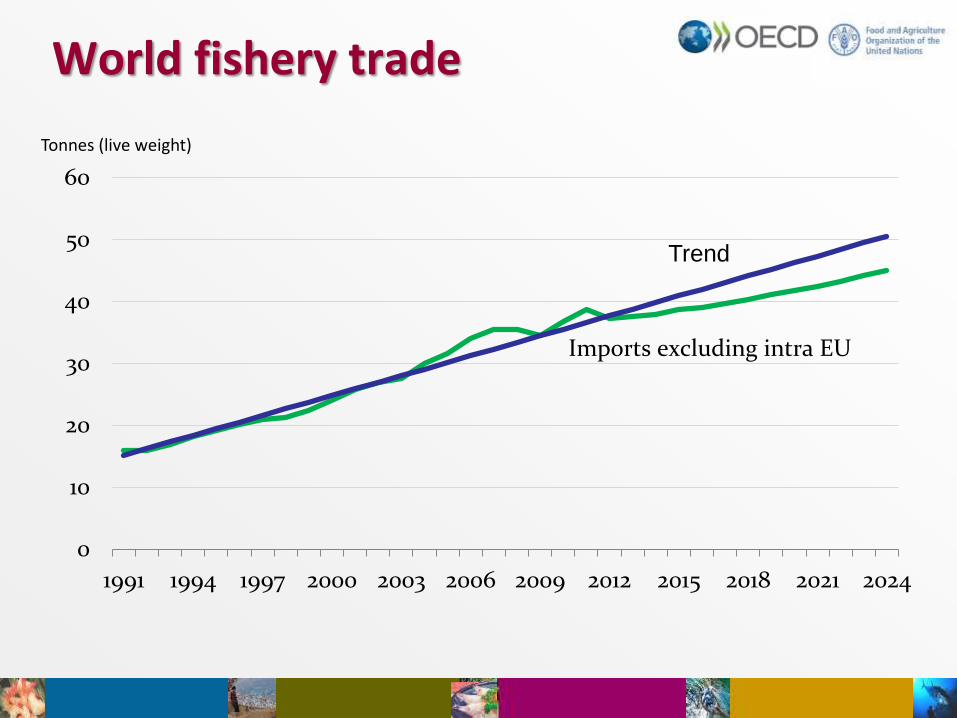
World fishery trade
0
10
20
30
40
50
60
1991 1994 1997 2000 2003 2006 2009 2012 2015 2018 2021 2024
Imports excluding intra EU
Trend
Tonnes (live weight)
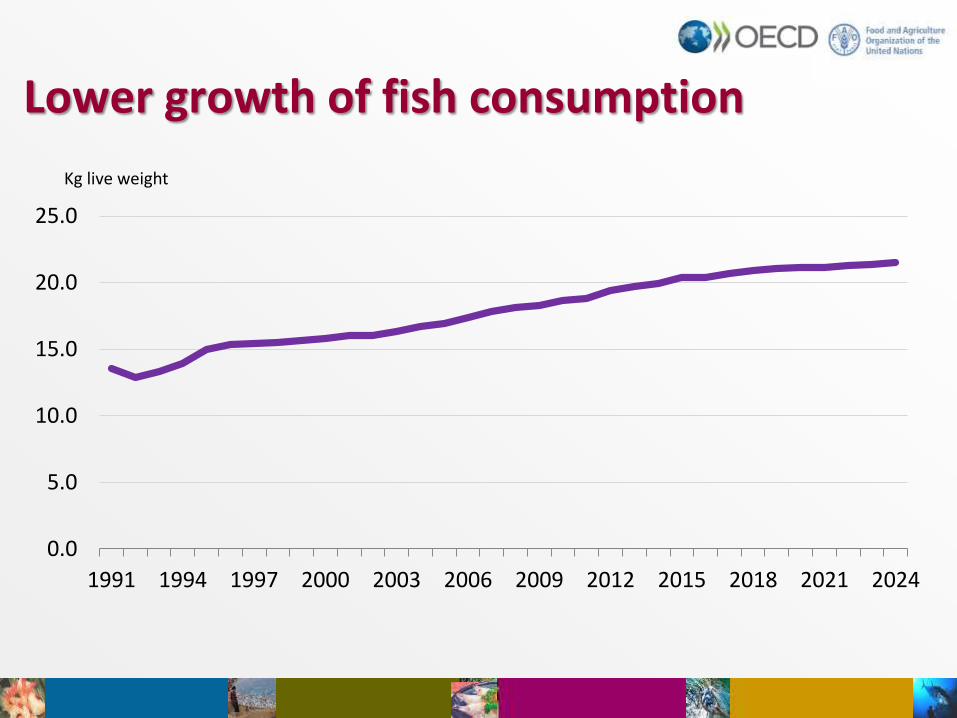
Lower growth of fish consumption
0.0
5.0
10.0
15.0
20.0
25.0
1991 1994 1997 2000 2003 2006 2009 2012 2015 2018 2021 2024
Kg live weight
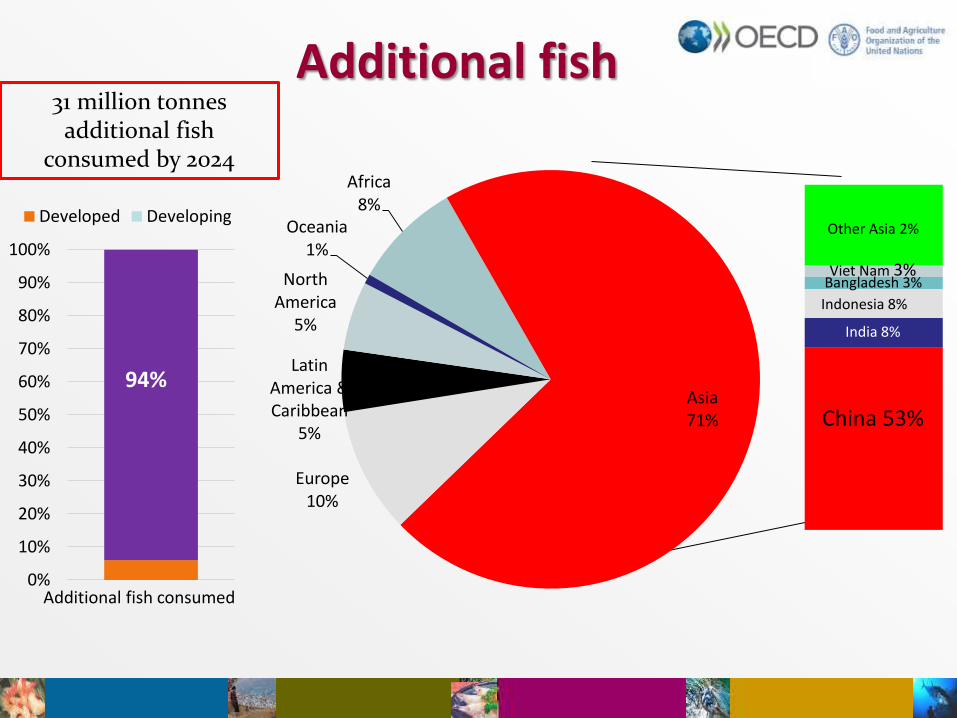
Additional fish 31 million tonnes
additional fish consumed by 2024
83%
0%
10%
20%
30%
40%
50%
60%
70%
80%
90%
100%
Developed Developing
Additional fish consumed
94%
Africa 8%
Asia 71%
Europe 10%
Latin America & Caribbean
5%
North America
5%
Oceania 1%
China 53%
India 8%
Indonesia 8%
Bangladesh 3% Viet Nam 3%
Other Asia 2%
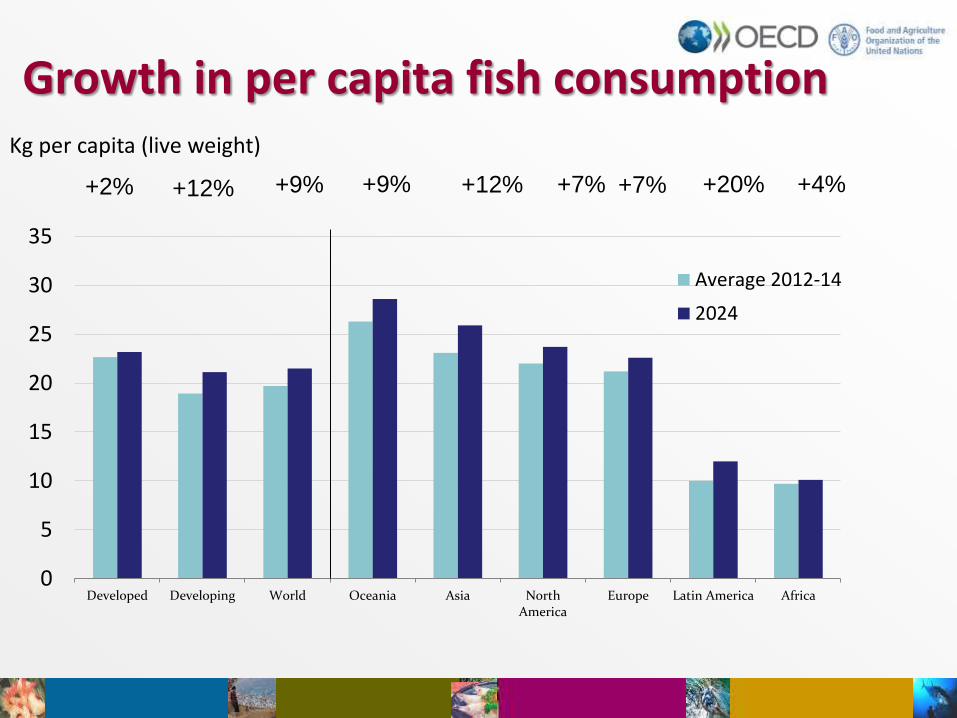
Growth in per capita fish consumption Kg per capita (live weight)
+2% +12% +9% +12% +7% +20% +4%
0
5
10
15
20
25
30
35
Developed Developing World Oceania Asia NorthAmerica
Europe Latin America Africa
Average 2012-14
2024
+9% +7%
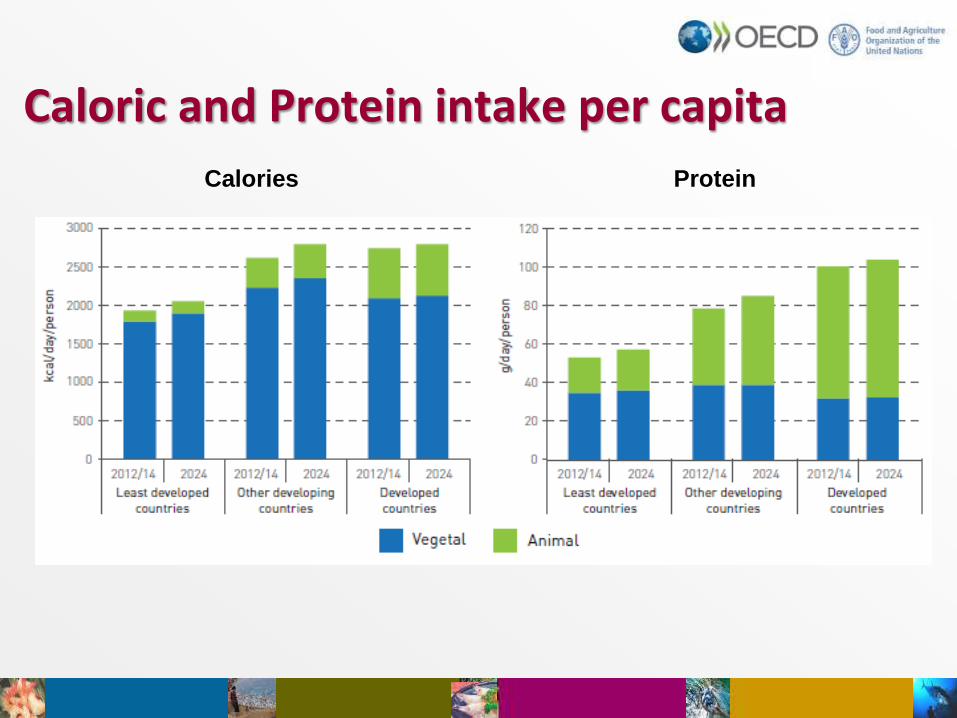
Caloric and Protein intake per capita
Calories Protein
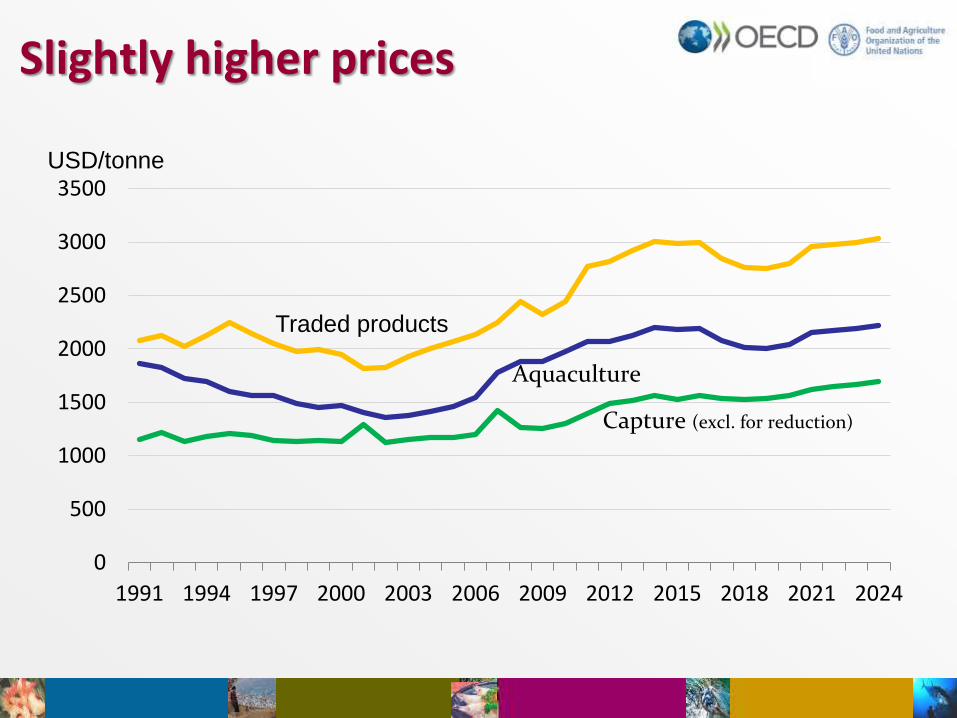
Slightly higher prices
0
500
1000
1500
2000
2500
3000
3500
1991 1994 1997 2000 2003 2006 2009 2012 2015 2018 2021 2024
Aquaculture
Capture (excl. for reduction)
Traded products
USD/tonne
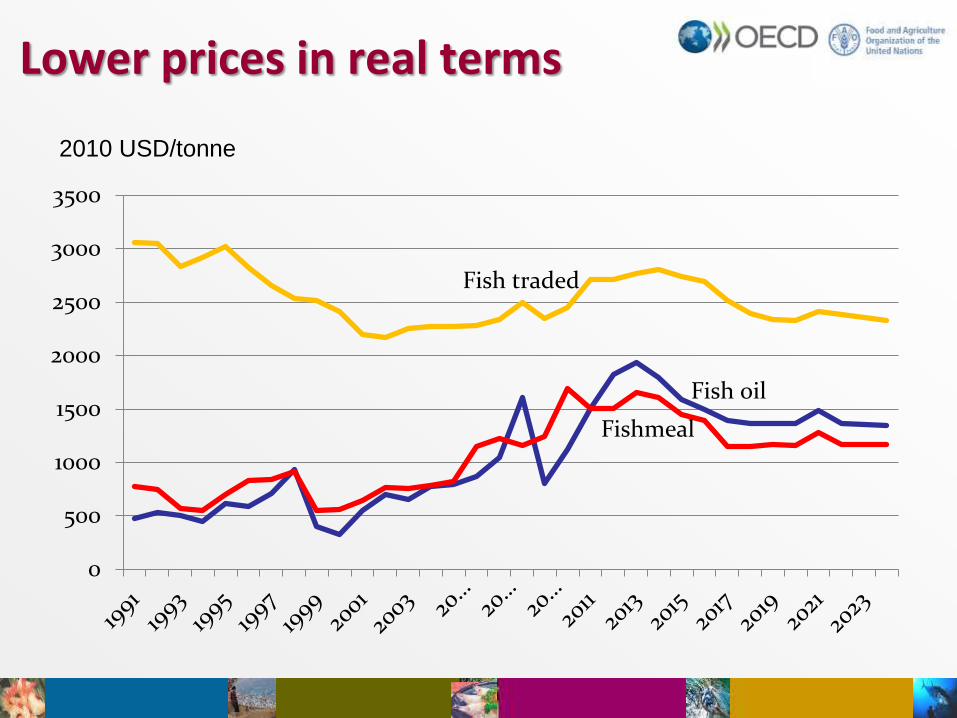
Lower prices in real terms
0
500
1000
1500
2000
2500
3000
3500
Fish traded
Fishmeal
Fish oil
2010 USD/tonne
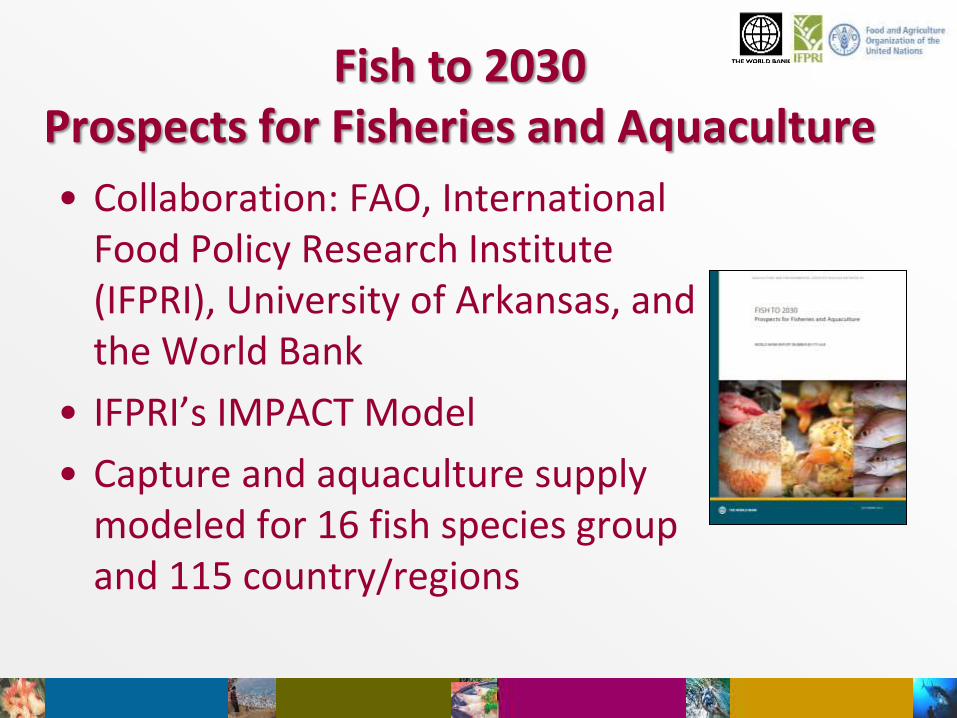
Fish to 2030 Prospects for Fisheries and Aquaculture
• Collaboration: FAO, International Food Policy Research Institute (IFPRI), University of Arkansas, and the World Bank
• IFPRI’s IMPACT Model
• Capture and aquaculture supply modeled for 16 fish species group and 115 country/regions
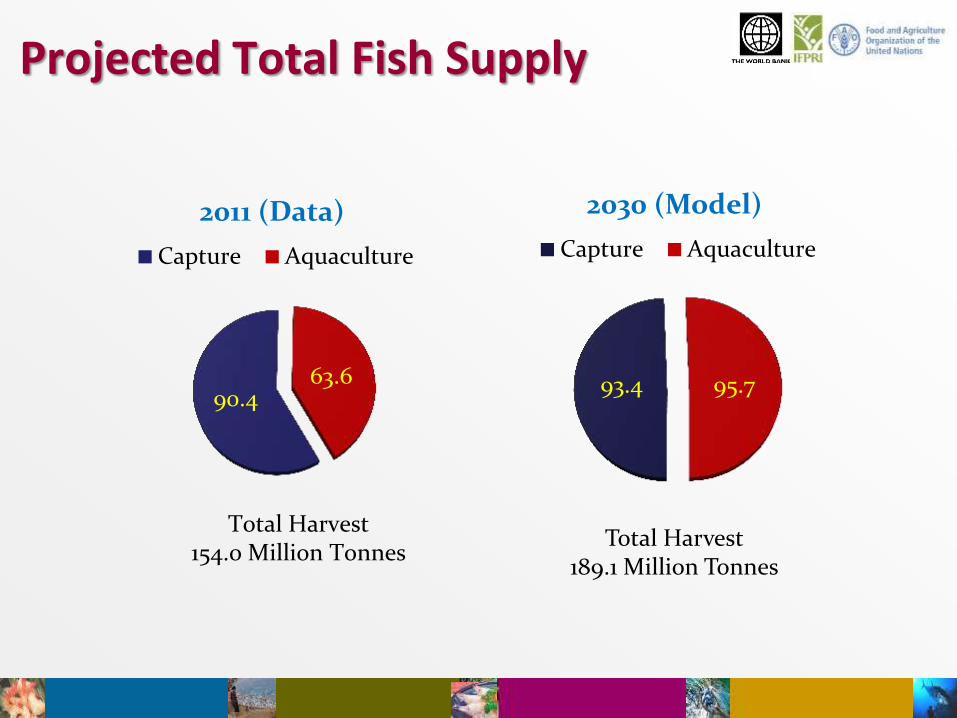
Projected Total Fish Supply
90.4 63.6
2011 (Data)
Capture Aquaculture
Total Harvest 154.0 Million Tonnes
93.4 95.7
2030 (Model)
Capture Aquaculture
Total Harvest 189.1 Million Tonnes
Aquaculture Growth
2030 (Model)
• Approx. 50% of total harvest
• Approx. 62% of fish for direct human consumption
• Aquaculture 2010-2030 62% in 20 yrs
• Total supply (capture + aquaculture) 2010-2030 24% in 20 yrs
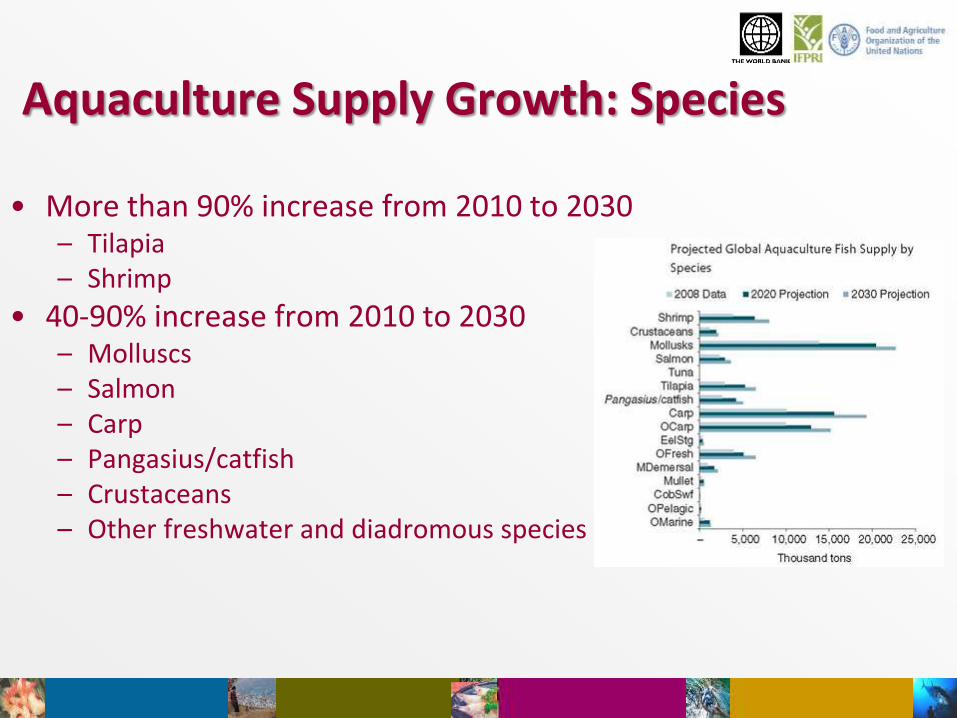
• More than 90% increase from 2010 to 2030 – Tilapia – Shrimp
• 40-90% increase from 2010 to 2030 – Molluscs – Salmon – Carp – Pangasius/catfish – Crustaceans – Other freshwater and diadromous species
Aquaculture Supply Growth: Species
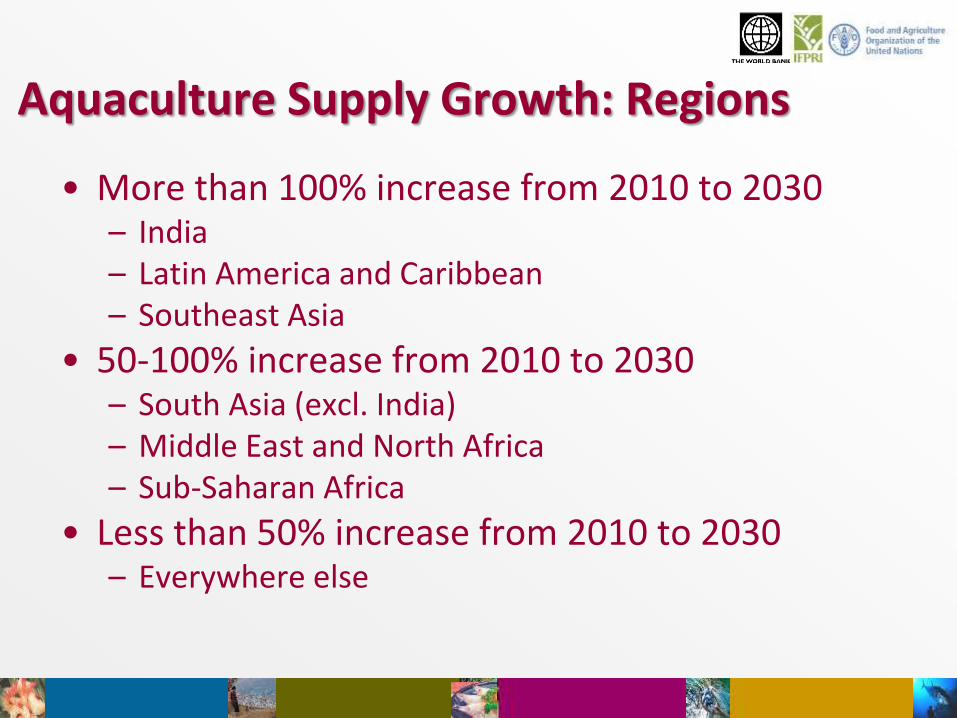
• More than 100% increase from 2010 to 2030 – India – Latin America and Caribbean – Southeast Asia
• 50-100% increase from 2010 to 2030 – South Asia (excl. India) – Middle East and North Africa – Sub-Saharan Africa
• Less than 50% increase from 2010 to 2030 – Everywhere else
Aquaculture Supply Growth: Regions
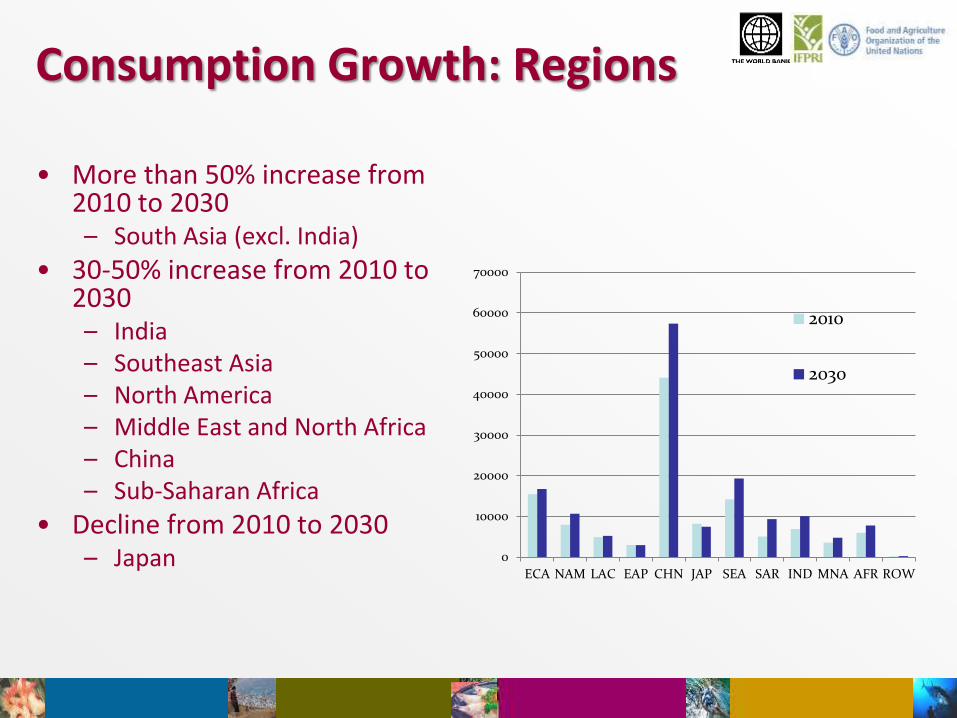
• More than 50% increase from 2010 to 2030 – South Asia (excl. India)
• 30-50% increase from 2010 to 2030 – India – Southeast Asia – North America – Middle East and North Africa – China – Sub-Saharan Africa
• Decline from 2010 to 2030 – Japan
Consumption Growth: Regions
0
10000
20000
30000
40000
50000
60000
70000
ECA NAM LAC EAP CHN JAP SEA SAR IND MNA AFR ROW
2010
2030
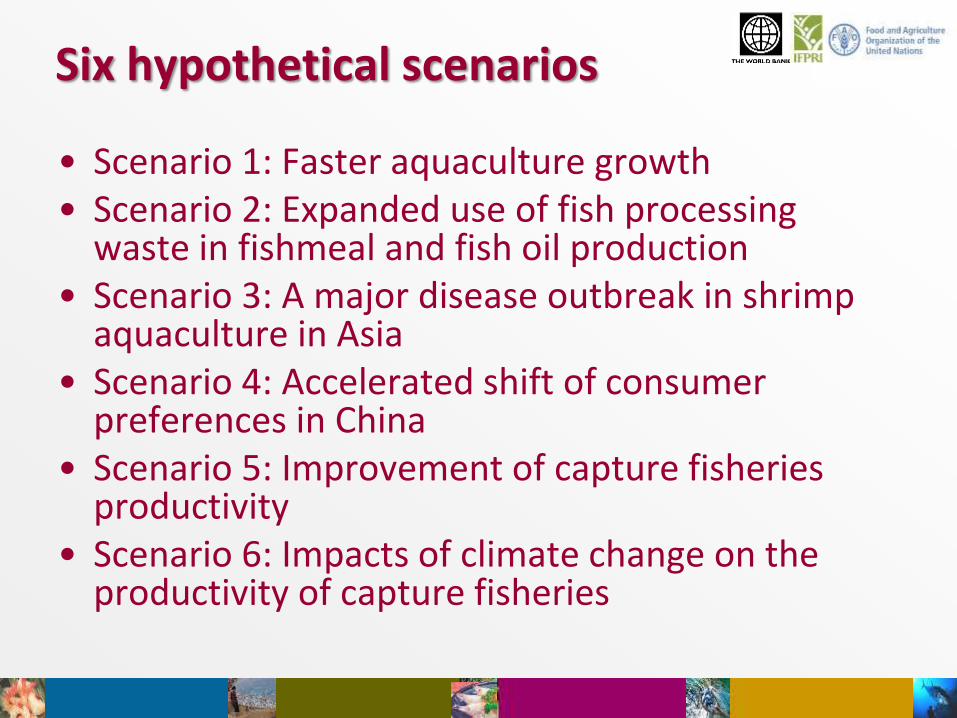
• Scenario 1: Faster aquaculture growth • Scenario 2: Expanded use of fish processing
waste in fishmeal and fish oil production • Scenario 3: A major disease outbreak in shrimp
aquaculture in Asia • Scenario 4: Accelerated shift of consumer
preferences in China • Scenario 5: Improvement of capture fisheries
productivity • Scenario 6: Impacts of climate change on the
productivity of capture fisheries
Six hypothetical scenarios
Overall conclusion
• Major growth in production from aquaculture • Projections indicate a continuous rise in demand for
fish and fishery products, with growing trade and consumption
• Differentiation of consumption, opening of new markets
• Risk of increase of costs of production • Too high prices in the market will risk the effect of
substitution with other emerging commodities • Need to long-term resource conservation and
effective management of resources as well as of aquaculture
OECD-FAO Agricultural Outlook: http://www.agri-outlook.org/
Fish to 2030:
http://www.fao.org/docrep/019/i3640e/i3640e.pdf


