
First Bancshares, Inc. - Stockmens Bank
48
First Bancshares, Inc. Annual Report December 31, 201
Transcript of First Bancshares, Inc. - Stockmens Bank

First Bancshares, Inc.
Annual ReportDecember 31, 201

TABLE OF CONTENTS
Page
Letter to Shareholders ......................................................................................... 1 Business of the Company .................................................................................... 3 Selected Consolidated Financial Information ..................................................... 4 Independent Auditor’s Report on the Consolidated Financial Statements ......... 6 Consolidated Financial Statements ..................................................................... 7 Notes to Consolidated Financial Statements ....................................................... 12 Common Stock Information ............................................................................... 40 Directors and Executive Officers. ....................................................................... 41 Corporate Information ........................................................................................ 42

This Page Intentionally Left Blank

1
Letter to Shareholders
Dear Fellow Shareholders:
I am pleased to report that First Bancshares had another strong year as detailed in the accompanying 2016 Annual Report. During 2016 our loan portfolio increased $12.3 million, or 9.8%, as we converted lower yielding cash and cash equivalents into higher yielding loans. As a result of the hard work of our lending personnel, our prospects for continued loan growth are favorable and we have a very strong loan pipeline
We are particularly pleased that we were able to increase our loan portfolio while maintaining very strong asset quality through consistent prudent underwriting standards. Nonperforming loans at December 31, 2016 were $246,000, or 0.18% of net loans, compared to $697,000 in nonperforming loans or 0.56% of net loans at December 31, 2015.
The extended period of low interest rates has put pressure on our net interest income which is the difference between the income we receive on our earning assets and the expense we pay on our interest bearing liabilities. In spite of this pressure, our net interest income increased $405,000, or 7.25%, primarily as a result of the income we received on our larger loan portfolio. We continue to monitor our expenses and proactively seek opportunities to reduce them. During 2016 we consolidated our two branch offices in Marshfield, Missouri into one branch. We believe this consolidation will help us reduce occupancy and equipment expenses in future periods.
As a result of the increase in loans, excellent credit quality and reasonable expense control, net income exceeded $1.2 million or $0.75 per share. Net income was $3.1 million, or $2.00 per share, for 2015 but that included a $2.4 million recovery of the deferred tax asset as compared to a $454,000 recovery of the deferred tax asset during 2016. Income before taxes was $714,000 in 2016 compared to $703,000 for 2015.
We continue to find new opportunities in the marketplace, with quality companies and other customers preferring to do business with a community bank. With eight locations and access to innovative mobile solutions, it is now easier than ever to do business with First Home Bank. Our commitment to our customers and to continuously evolving our organization to meet their needs is central to our framework for creating long-term value for our shareholders.
We are optimistic for the coming year based on the improving and growing economy and a political atmosphere that promises to be business-friendly and with the possible repeal of some of the restrictions that have been so costly to community banks. Responsible management, consistency in our delivery and first-class service are key elements to sustaining success in a complex and competitive industry.
We look forward to seeing you at our Annual Shareholders Meeting on Friday, April 21, 2017 at 1:00 p.m Central Time, at the DoubleTree Hotel located at 2431 N. Glenstone, Springfield, Missouri. In

2
connection with that Meeting, you should have received with this Annual Report, via mail or electronically from your broker, your First Bancshares’ proxy materials and notice of our annual shareholder meeting. We are asking you to vote on the three proposals. Voting is easy and can be done via return mail, telephone or online; those details are provided in the materials you received. If you need information regarding the proxy materials or the Annual Meeting, please contact Shannon Peterson, Executive Secretary, at (417) 547-7232 or [email protected].
We are proud of our accomplishments and financial results and particularly the long term value we
have been able to continue to create for our shareholders, as we strive to meet our customers’ financial needs. Thank you for your ongoing support of our Company. Sincerely,
R. Bradley Weaver Chairman, President and Chief Executive Officer
3
Business of the Company First Bancshares, Inc. (“Company”), a Missouri corporation, was incorporated on September 30, 1993 for the purpose of becoming the savings and loan holding company for First Home Savings Bank (“Bank”) upon the conversion of First Home from a Missouri mutual to a Missouri stock savings and loan association. The mutual to stock conversion was completed on December 22, 1993. Effective January 22, 2014, the Bank changed its charter from a Missouri chartered stock savings and loan association to a Missouri chartered, non-member commercial bank. As part of the charter change, the Bank changed its corporate title to “First Home Bank.” In connection with the Bank’s charter change, the Company became a bank holding company, subject to regulation by the Federal Reserve Bank of St. Louis. Effective November 26, 2014, the Company and the Bank changed their fiscal year ends from June 30 to December 31. This change in fiscal year end was completed to align the financial reporting periods for the Company and the Bank with regulatory reporting periods concurrent with the Company’s reorganization to a bank holding company and the Bank’s charter conversion to a commercial bank that occurred on January 22, 2014. The Company is not engaged in any significant business activity other than holding the stock of the Bank. Accordingly, the information set forth in the report, including the consolidated financial statements and related data, applies primarily to the Bank. First Home Bank is a Missouri-chartered, non-member commercial bank organized in 1911. The Bank is regulated by the Missouri Department of Finance and the Federal Deposit Insurance Corporation (“FDIC”). The Bank’s deposits are insured up to applicable limits by the FDIC. The Bank is also a member of the Federal Home Loan Bank (“FHLB”) System. The Bank conducts its business from its home office in Mountain Grove and seven full service branch facilities in Marshfield, Ava, Kissee Mills, Gainesville, Sparta, Crane and Springfield, Missouri. The Bank provides its customers with a full array of community banking services and is primarily engaged in the business of attracting deposits from, and making loans to, the general public, including individuals and businesses. The Bank originates real estate loans, including one-to-four family residential mortgage loans, multi-family residential loans, commercial real estate loans, agricultural real estate loans and home equity loans, as well as, non-real estate loans, including commercial business, agricultural business and consumer loans. The Bank also invests in mortgage-back securities, United States Government and agency securities and other assets. At December 31, 2016, the Company had total consolidated assets of $219.5 million and consolidated stockholders’ equity of $19.8 million.
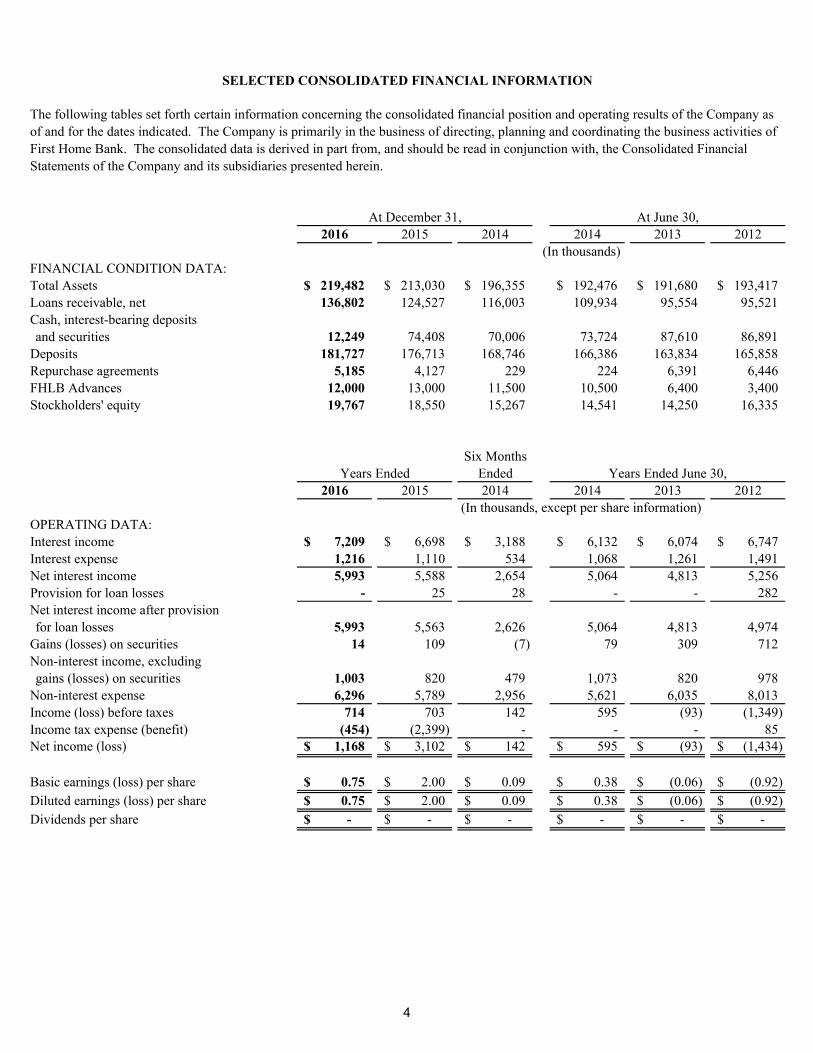
2016 2015 2014 2014 2013 2012
FINANCIAL CONDITION DATA:Total Assets 219,482$ 213,030$ 196,355$ 192,476$ 191,680$ 193,417$ Loans receivable, net 136,802 124,527 116,003 109,934 95,554 95,521 Cash, interest-bearing depositsand securities 12,249 74,408 70,006 73,724 87,610 86,891
Deposits 181,727 176,713 168,746 166,386 163,834 165,858 Repurchase agreements 5,185 4,127 229 224 6,391 6,446 FHLB Advances 12,000 13,000 11,500 10,500 6,400 3,400 Stockholders' equity 19,767 18,550 15,267 14,541 14,250 16,335
Six MonthsEnded
2016 2015 2014 2014 2013 2012
OPERATING DATA:Interest income 7,209$ 6,698$ 3,188$ 6,132$ 6,074$ 6,747$ Interest expense 1,216 1,110 534 1,068 1,261 1,491 Net interest income 5,993 5,588 2,654 5,064 4,813 5,256 Provision for loan losses - 25 28 - - 282 Net interest income after provisionfor loan losses 5,993 5,563 2,626 5,064 4,813 4,974
Gains (losses) on securities 14 109 (7) 79 309 712 Non-interest income, excludinggains (losses) on securities 1,003 820 479 1,073 820 978
Non-interest expense 6,296 5,789 2,956 5,621 6,035 8,013 Income (loss) before taxes 714 703 142 595 (93) (1,349) Income tax expense (benefit) (454) (2,399) - - - 85 Net income (loss) 1,168$ 3,102$ 142$ 595$ (93)$ (1,434)$
Basic earnings (loss) per share 0.75$ 2.00$ 0.09$ 0.38$ (0.06)$ (0.92)$ Diluted earnings (loss) per share 0.75$ 2.00$ 0.09$ 0.38$ (0.06)$ (0.92)$ Dividends per share -$ -$ -$ -$ -$ -$
SELECTED CONSOLIDATED FINANCIAL INFORMATION
The following tables set forth certain information concerning the consolidated financial position and operating results of the Company as of and for the dates indicated. The Company is primarily in the business of directing, planning and coordinating the business activities of First Home Bank. The consolidated data is derived in part from, and should be read in conjunction with, the Consolidated Financial Statements of the Company and its subsidiaries presented herein.
At June 30,
(In thousands)
(In thousands, except per share information)
Years Ended June 30,
At December 31,
Years Ended
4
Six MonthsEnded
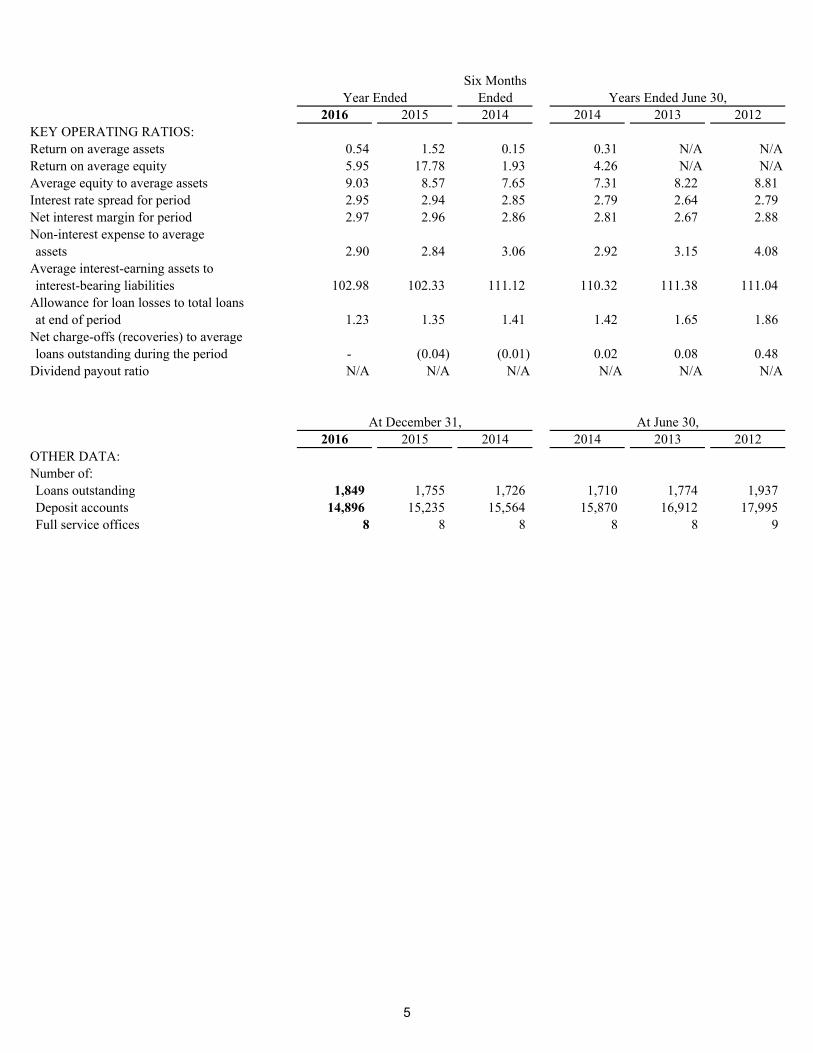
2016 2015 2014 2014 2013 2012KEY OPERATING RATIOS:Return on average assets 0.54 1.52 0.15 0.31 N/A N/AReturn on average equity 5.95 17.78 1.93 4.26 N/A N/AAverage equity to average assets 9.03 8.57 7.65 7.31 8.22 8.81 Interest rate spread for period 2.95 2.94 2.85 2.79 2.64 2.79 Net interest margin for period 2.97 2.96 2.86 2.81 2.67 2.88 Non-interest expense to averageassets 2.90 2.84 3.06 2.92 3.15 4.08
Average interest-earning assets tointerest-bearing liabilities 102.98 102.33 111.12 110.32 111.38 111.04
Allowance for loan losses to total loansat end of period 1.23 1.35 1.41 1.42 1.65 1.86
Net charge-offs (recoveries) to averageloans outstanding during the period - (0.04) (0.01) 0.02 0.08 0.48
Dividend payout ratio N/A N/A N/A N/A N/A N/A
2016 2015 2014 2014 2013 2012OTHER DATA:Number of:Loans outstanding 1,849 1,755 1,726 1,710 1,774 1,937 Deposit accounts 14,896 15,235 15,564 15,870 16,912 17,995 Full service offices 8 8 8 8 8 9
Years Ended June 30,
At June 30,
Year Ended
At December 31,
5
Independent Auditor’s Report
To the Board of Directors First Bancshares, Inc. and Subsidiaries Mountain Grove, Missouri
Report on the Financial StatementsWe have audited the accompanying consolidated financial statements of First Bancshares, Inc. and Subsidiaries, which comprise the consolidated balance sheets as of December 31, 2016 and 2015; the related consolidated statements of operations, comprehensive income, stockholders’ equity and cash flows for the years then ended; and the related notes to the consolidated financial statements (collectively, the financial statements).
Management’s Responsibility for the Financial Statements Management is responsible for the preparation and fair presentation of these financial statements in accordance with accounting principles generally accepted in the United States of America; this includes the design, implementation and maintenance of internal control relevant to the preparation and fair presentation of financial statements that are free from material misstatement, whether due to fraud or error.
Auditor’s Responsibility Our responsibility is to express an opinion on these financial statements based on our audits. We conducted our audits in accordance with auditing standards generally accepted in the United States of America. Those standards require that we plan and perform the audit to obtain reasonable assurance about whether the financial statements are free of material misstatement.
An audit involves performing procedures to obtain audit evidence about the amounts and disclosures in the financial statements. The procedures selected depend on the auditor’s judgment, including the assessment of the risks of material misstatement of the financial statements, whether due to fraud or error. In making those risk assessments, the auditor considers internal control relevant to the entity’s preparation and fair presentation of the financial statements in order to design audit procedures that are appropriate in the circumstances, but not for the purpose of expressing an opinion on the effectiveness of the entity’s internal control. Accordingly, we express no such opinion. An audit also includes evaluating the appropriateness of accounting policies used and the reasonableness of significant accounting estimates made by management, as well as evaluating the overall presentation of the financial statements.
We believe that the audit evidence we have obtained is sufficient and appropriate to provide a basis for our audit opinion.
OpinionIn our opinion, the financial statements referred to above present fairly, in all material respects, the financial position of First Bancshares, Inc. and Subsidiaries as of December 31, 2016 and 2015, and the results of their operations and their cash flows for the years then ended in accordance with accounting principles generally accepted in the United States of America.
Kansas City, Missouri February 24, 2017
6
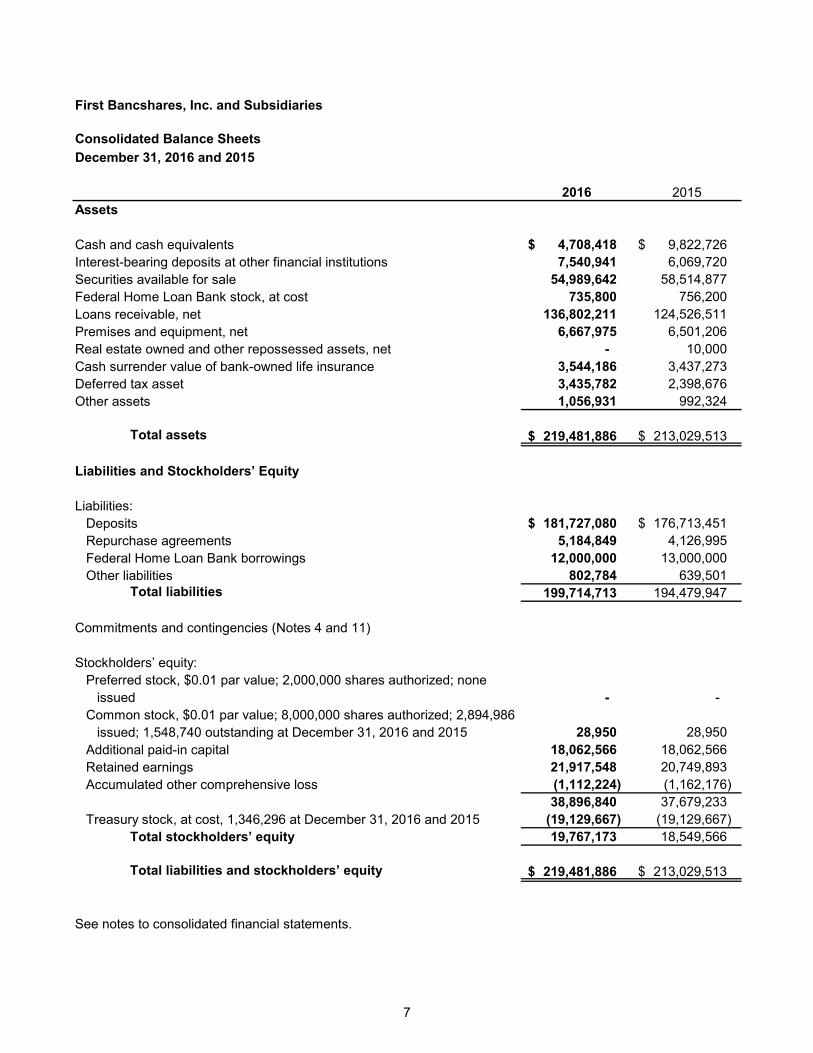
First Bancshares, Inc. and Subsidiaries
Consolidated Balance SheetsDecember 31, 2016 and 2015
2016 2015Assets
Cash and cash equivalents 4,708,418 $ 9,822,726 $Interest-bearing deposits at other financial institutions 7,540,941 6,069,720 Securities available for sale 54,989,642 58,514,877 Federal Home Loan Bank stock, at cost 735,800 756,200 Loans receivable, net 136,802,211 124,526,511 Premises and equipment, net 6,667,975 6,501,206 Real estate owned and other repossessed assets, net - 10,000 Cash surrender value of bank-owned life insurance 3,544,186 3,437,273 Deferred tax asset 3,435,782 2,398,676 Other assets 1,056,931 992,324
Total assets 219,481,886 $ 213,029,513 $
Liabilities and Stockholders’ Equity
Liabilities:Deposits 181,727,080 $ 176,713,451 $Repurchase agreements 5,184,849 4,126,995 Federal Home Loan Bank borrowings 12,000,000 13,000,000 Other liabilities 802,784 639,501
Total liabilities 199,714,713 194,479,947
Commitments and contingencies (Notes 4 and 11)
Stockholders’ equity:Preferred stock, $0.01 par value; 2,000,000 shares authorized; none
issued - - Common stock, $0.01 par value; 8,000,000 shares authorized; 2,894,986
issued; 1,548,740 outstanding at December 31, 2016 and 2015 28,950 28,950 Additional paid-in capital 18,062,566 18,062,566 Retained earnings 21,917,548 20,749,893 Accumulated other comprehensive loss (1,112,224) (1,162,176)
38,896,840 37,679,233 Treasury stock, at cost, 1,346,296 at December 31, 2016 and 2015 (19,129,667) (19,129,667)
Total stockholders’ equity 19,767,173 18,549,566
Total liabilities and stockholders’ equity 219,481,886 $ 213,029,513 $
See notes to consolidated financial statements.
7
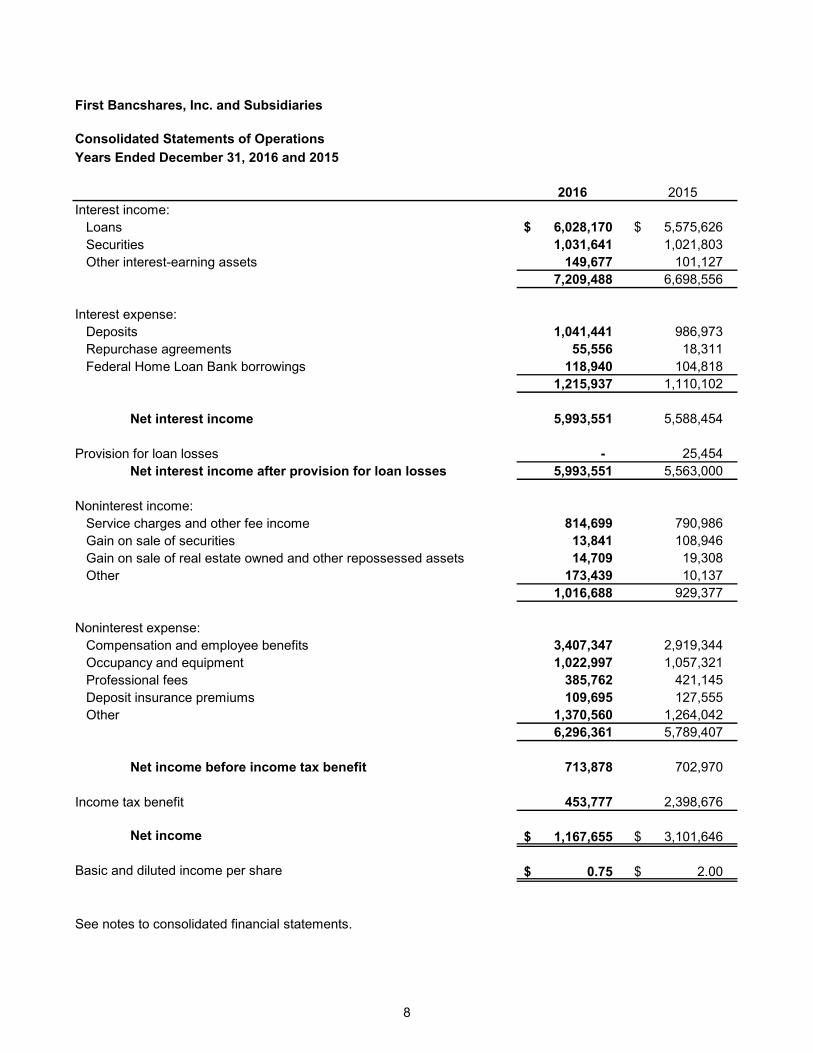
First Bancshares, Inc. and Subsidiaries
Consolidated Statements of OperationsYears Ended December 31, 2016 and 2015
2016 2015Interest income:
Loans 6,028,170 $ 5,575,626 $ Securities 1,031,641 1,021,803 Other interest-earning assets 149,677 101,127
7,209,488 6,698,556
Interest expense:Deposits 1,041,441 986,973 Repurchase agreements 55,556 18,311 Federal Home Loan Bank borrowings 118,940 104,818
1,215,937 1,110,102
Net interest income 5,993,551 5,588,454
Provision for loan losses - 25,454 Net interest income after provision for loan losses 5,993,551 5,563,000
Noninterest income:Service charges and other fee income 814,699 790,986 Gain on sale of securities 13,841 108,946 Gain on sale of real estate owned and other repossessed assets 14,709 19,308 Other 173,439 10,137
1,016,688 929,377
Noninterest expense:Compensation and employee benefits 3,407,347 2,919,344 Occupancy and equipment 1,022,997 1,057,321 Professional fees 385,762 421,145 Deposit insurance premiums 109,695 127,555 Other 1,370,560 1,264,042
6,296,361 5,789,407
Net income before income tax benefit 713,878 702,970
Income tax benefit 453,777 2,398,676
Net income 1,167,655 $ 3,101,646 $
Basic and diluted income per share 0.75$ 2.00 $
See notes to consolidated financial statements.
8
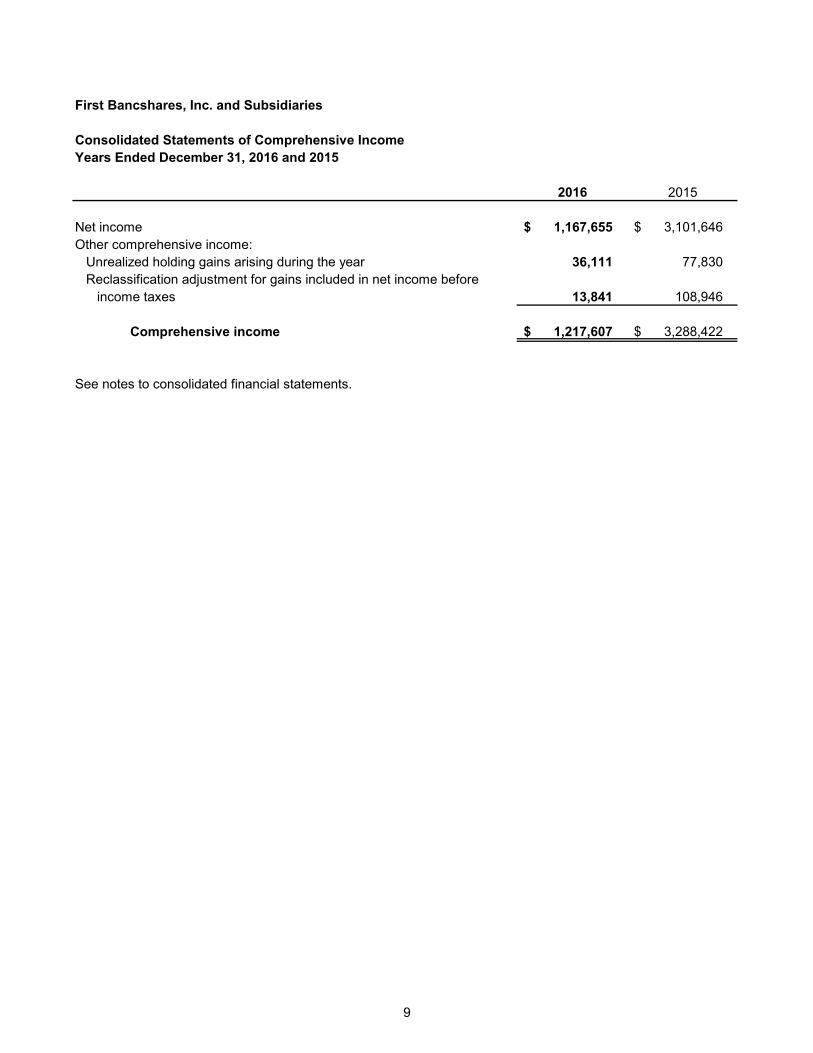
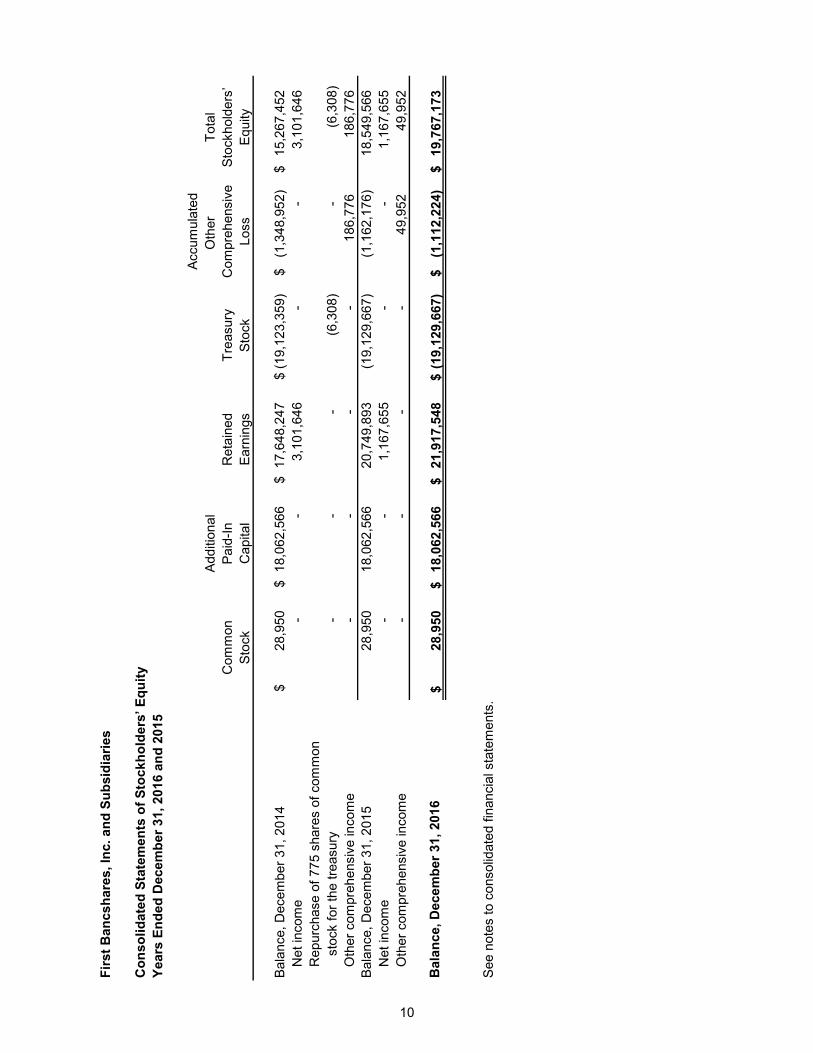
First Bancshares, Inc. and Subsidiaries
Consolidated Statements of Comprehensive IncomeYears Ended December 31, 2016 and 2015
2016 2015
Net income 1,167,655 $ 3,101,646 $ Other comprehensive income:
Unrealized holding gains arising during the year 36,111 77,830 Reclassification adjustment for gains included in net income before
income taxes 13,841 108,946
Comprehensive income 1,217,607 $ 3,288,422 $
See notes to consolidated financial statements.
9
Firs
t Ban
csha
res,
Inc.
and
Sub
sidi
arie
s
Con
solid
ated
Sta
tem
ents
of S
tock
hold
ers’
Equ
ityYe
ars
Ende
d D
ecem
ber 3
1, 2
016
and
2015
Accu
mul
ated
Addi
tiona
lO
ther
To
tal
Com
mon
Paid
-InR
etai
ned
Trea
sury
Com
preh
ensi
veSt
ockh
olde
rs’
Stoc
kC
apita
lEa
rnin
gsSt
ock
Loss
Equi
ty
Bala
nce,
Dec
embe
r 31,
201
428
,950
$
18,0
62,5
66
$
17,6
48,2
47
$
(19,
123,
359)
$
(1
,348
,952
) $
15
,267
,452
$
Net
inco
me
-
-
3,1
01,6
46
-
-
3,1
01,6
46
Rep
urch
ase
of 7
75 s
hare
s of
com
mon
st
ock
for t
he tr
easu
ry-
-
-
(6
,308
)
-
(6,3
08)
O
ther
com
preh
ensi
ve in
com
e-
-
-
-
18
6,77
6
186
,776
Bala
nce,
Dec
embe
r 31,
201
528
,950
18
,062
,566
20
,749
,893
(1
9,12
9,66
7)
(1,1
62,1
76)
18,
549,
566
N
et in
com
e -
-
1
,167
,655
-
-
1
,167
,655
O
ther
com
preh
ensi
ve in
com
e-
-
-
-
4
9,95
2
49,
952
Bal
ance
, Dec
embe
r 31,
201
628
,950
$
18,0
62,5
66
$
21,9
17,5
48
$
(19,
129,
667)
$
(1
,112
,224
) $
19
,767
,173
$
See
note
s to
con
solid
ated
fina
ncia
l sta
tem
ents
.
10
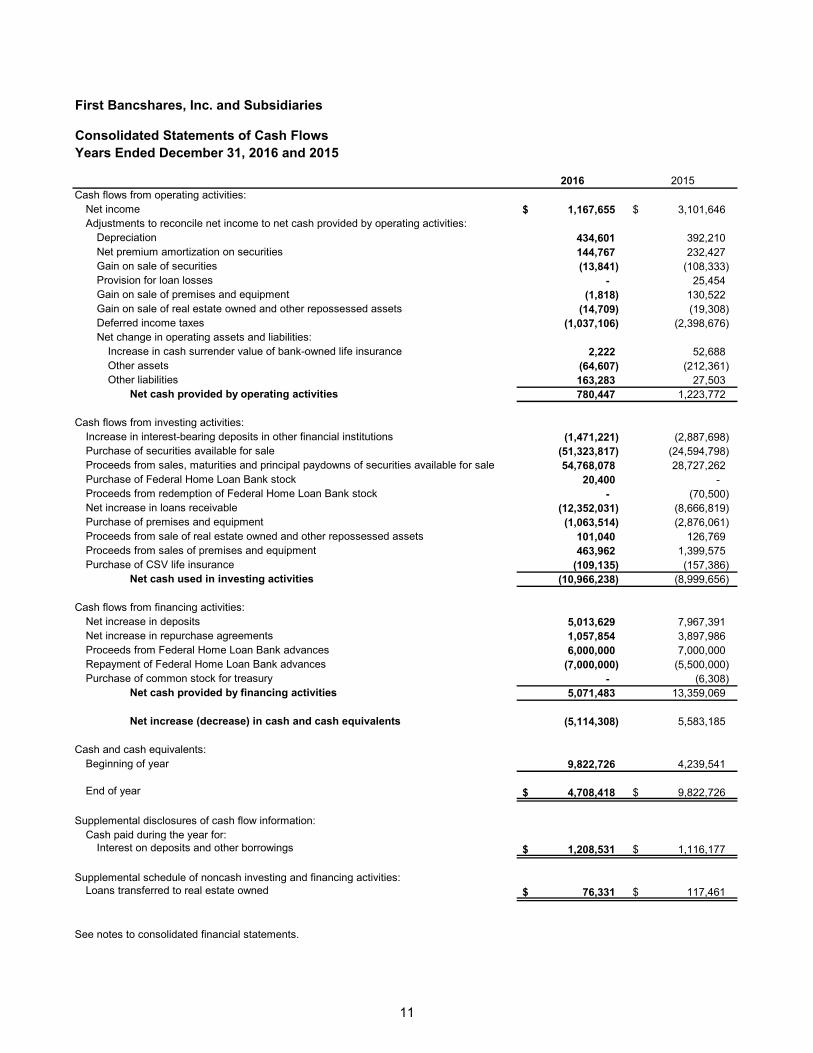
First Bancshares, Inc. and Subsidiaries
Consolidated Statements of Cash FlowsYears Ended December 31, 2016 and 2015
2016 2015Cash flows from operating activities:
Net income 1,167,655 $ 3,101,646 $ Adjustments to reconcile net income to net cash provided by operating activities:
Depreciation 434,601 392,210 Net premium amortization on securities 144,767 232,427 Gain on sale of securities (13,841) (108,333) Provision for loan losses - 25,454 Gain on sale of premises and equipment (1,818) 130,522 Gain on sale of real estate owned and other repossessed assets (14,709) (19,308) Deferred income taxes (1,037,106) (2,398,676) Net change in operating assets and liabilities:
Increase in cash surrender value of bank-owned life insurance 2,222 52,688 Other assets (64,607) (212,361) Other liabilities 163,283 27,503
Net cash provided by operating activities 780,447 1,223,772
Cash flows from investing activities:Increase in interest-bearing deposits in other financial institutions (1,471,221) (2,887,698) Purchase of securities available for sale (51,323,817) (24,594,798) Proceeds from sales, maturities and principal paydowns of securities available for sale 54,768,078 28,727,262 Purchase of Federal Home Loan Bank stock 20,400 - Proceeds from redemption of Federal Home Loan Bank stock - (70,500) Net increase in loans receivable (12,352,031) (8,666,819) Purchase of premises and equipment (1,063,514) (2,876,061) Proceeds from sale of real estate owned and other repossessed assets 101,040 126,769 Proceeds from sales of premises and equipment 463,962 1,399,575 Purchase of CSV life insurance (109,135) (157,386)
Net cash used in investing activities (10,966,238) (8,999,656)
Cash flows from financing activities:Net increase in deposits 5,013,629 7,967,391 Net increase in repurchase agreements 1,057,854 3,897,986 Proceeds from Federal Home Loan Bank advances 6,000,000 7,000,000 Repayment of Federal Home Loan Bank advances (7,000,000) (5,500,000) Purchase of common stock for treasury - (6,308)
Net cash provided by financing activities 5,071,483 13,359,069
Net increase (decrease) in cash and cash equivalents (5,114,308) 5,583,185
Cash and cash equivalents:Beginning of year 9,822,726 4,239,541
End of year 4,708,418 $ 9,822,726 $
Supplemental disclosures of cash flow information:Cash paid during the year for:
Interest on deposits and other borrowings 1,208,531 $ 1,116,177 $
Supplemental schedule of noncash investing and financing activities:Loans transferred to real estate owned 76,331 $ 117,461 $
See notes to consolidated financial statements.
11
First Bancshares, Inc. and Subsidiaries
Notes to Consolidated Financial Statements
Note 1. Summary of Significant Accounting Policies
Nature of operations: First Bancshares, Inc., a Missouri corporation (the Company), is the holding company for First Home Bank (the Bank). The Bank is primarily engaged in providing a full range of banking and mortgage services to individual and corporate customers in southern Missouri. On January 22, 2014, the Bank completed a charter conversion to a Missouri chartered nonmember commercial bank from a Missouri chartered stock nonmember thrift and changed its title from First Home Savings Bank to First Home Bank. The Company and Bank are also subject to the regulation by certain federal and state agencies and undergo periodic examinations by those regulatory authorities.
Principles of consolidation: The accompanying consolidated financial statements include the accounts of the Company and its wholly owned subsidiaries, the Bank and the wholly owned subsidiaries of the Bank and Fybar Service Corporation. In consolidation, all significant intercompany balances and transactions have been eliminated.
Use of estimates: In preparing the consolidated financial statements in conformity with accounting principles generally accepted in the United States of America, management is required to make estimates and assumptions that affect the reported amounts of assets and liabilities and disclosure of contingent assets and liabilities as of the date of the consolidated balance sheet and reported amounts of revenues and expenses during the reporting period. Actual results could differ from those estimates. Material estimates that are particularly susceptible to significant change in the near term relate to the determination of the fair value of financial instruments, the allowance for loan losses, and the valuation allowance on deferred income tax assets.
Concentrations of credit risk: Most of the Company’s lending activity occurs within the state of Missouri, including 11 counties surrounding one of the largest metropolitan areas in the state of Missouri, Springfield, as well as other markets. The majority of the Company’s loan portfolio consists of residential real estate, commercial, and commercial real estate loans. As of December 31, 2016 and 2015, there were no concentrations of loans related to any single industry in excess of 10 percent of total loans.
Cash and cash equivalents: For purposes of the consolidated statements of cash flows, cash consists of cash on hand and deposits with other financial institutions. Cash equivalents include highly liquid instruments with an original maturity of three months or less. Cash flows from interest-bearing deposits in other financial institutions, loans, deposits, and retail repurchase agreements are reported net.
Securities: All securities are designated as available-for-sale, a designation which provides the Company with certain flexibility in managing its investment portfolio. Such securities are reported at fair value with unrealized gains and losses excluded from income and reported net of applicable income taxes as a component of comprehensive income.
Interest income on securities is recognized on the interest method according to the terms of the security. Gains or losses on sales of securities are recognized in operations at the time of sale and are determined by the difference between the net sales proceeds and the cost of the securities using the specific-identification method, adjusted for any unamortized premiums or discounts. Premiums or discounts are amortized or accreted to income using the interest method over the period to maturity.
12
First Bancshares, Inc. and Subsidiaries
Notes to Consolidated Financial Statements
Note 1. Summary of Significant Accounting Policies (Continued) Declines in the fair value of equity securities below their amortized cost basis that are deemed to be other-than-temporary impairment losses are reflected as realized losses in the consolidated statements of operations. To determine if an other-than-temporary impairment exists on an equity security, the Company considers (a) the length of time and the extent to which the fair value has been less than cost, (b) the financial condition and near-term prospects of the issuer, (c) the intent and ability of the Company to retain its investment in the issuer for a period of time sufficient to allow for an anticipated recovery in fair value and (d) the current market conditions. To determine if an other-than-temporary impairment exists on a debt security, the Company first determines if (a) it intends to sell the security or (b) it is more likely than not that it will be required to sell the security before its anticipated recovery. If either of the conditions is met, the Company will recognize an other-than-temporary impairment in earnings equal to the difference between the fair value of the security and its adjusted cost basis. If neither of the conditions is met, the Company determines (a) the amount of the impairment related to credit loss and (b) the amount of the impairment due to all other factors. The difference between the present values of the cash flows expected to be collected and the amortized cost basis is the credit loss. The amount of the credit loss is included in the consolidated statements of operations as an other-than-temporary impairment on securities and is an adjustment to the cost basis of the security. The portion of the total impairment that is related to all other factors is included in other comprehensive income.
Federal Home Loan Bank stock: The Bank, as a member of the Federal Home Loan Bank (FHLB) system, is required to maintain an investment in capital stock of the FHLB of Des Moines. The stock does not have a readily determinable fair market value and, as such, is carried at cost and evaluated for impairment annually. There have been no other-than-temporary impairments recorded on this security.
Loans receivable: Loans receivable are stated at the amount of unpaid principal, reduced by an allowance for loan losses. Direct loan origination fees and costs are generally being deferred and the net amounts amortized as an adjustment of the related loan’s yield. The Company generally amortizes these amounts over the contractual life. Direct loan origination fees and costs related to loans sold to unrelated third parties are recognized as income or expense in the current consolidated statement of operations. Commitment fees based upon a percentage of customers’ unused lines of credit and fees related to standby letters of credit are not significant to the consolidated financial statements.
The Company’s portfolio segments and classes are as follows:
Real estate: Residential Commercial
LandConsumerCommercial
Generally, for all classes of loans, loans are considered past due if the required principal and interest payments have not been received as of the date such payments were due. Loans are placed on nonaccrual status when, in management’s opinion, the borrower may be unable to meet payment obligations as they become due, as well as when required by regulatory provisions, which is generally when loans become 90 days past due. Loans may be placed on nonaccrual status regardless of whether or not such loans are considered past due. When interest accrual is discontinued, all unpaid accrued interest is reversed. Interest income is subsequently recognized only to the extent cash payments are received in excess of principal due. Loans are returned to accrual status when all the principal and interest amounts contractually due are brought current and future payments are reasonably assured.
13
First Bancshares, Inc. and Subsidiaries
Notes to Consolidated Financial Statements
Note 1. Summary of Significant Accounting Policies (Continued)
Troubled debt restructures: A troubled debt restructuring exists when the Company, for economic or legal reasons related to the borrower’s financial difficulties, grants a concession (either imposed by court order, law, or agreement between the borrower and the Company) to the borrower that it would not otherwise consider. These concessions could include forgiveness of principal, extension of maturity dates, and reduction of stated interest rates or accrued interest. The Company is attempting to maximize its recovery of the balances of the loans through these various concessionary restructurings. See Note 3 for disclosure of the Company’s troubled debt restructurings.
Allowance for loan losses: For all classes of loans, the allowance for loan losses is maintained at the level considered adequate by management of the Company to provide for losses that are probable. The allowance is increased by provisions charged to operating expense and reduced by net charge-offs. In determining the adequacy of the allowance balance, the Company makes continuous evaluations of the loan portfolio and related off-balance-sheet commitments, considers current economic conditions, historical loan loss experience, review of specific problem loans and other factors.
A discussion of the risk characteristics and the allowance for loan losses by each loan class follows:
For real estate and land loans, the Company focuses on real estate developers, investors and owner occupants in its recognized trade area. The Company provides term loans to finance the acquisition of real estate and lines of credit to finance land acquisition and development and construction of one- to four- family residential and commercial properties. The Company finances various types of real estate, including nonresidential and residential owner occupied, land acquisition and development, and nonresidential, nonowner occupied properties. It is the Company’s policy that prudently underwritten real estate loans should reflect all relevant credit factors and approval is based on the following:
The capacity of the borrower, or income from the underlying property, to adequately service the debt The value of the mortgaged property The overall creditworthiness of the borrower and borrower’s liquidity The level of equity invested in the property Historic and projected cash flow data, including interest and vacancy rates and sensitivity analysis, if
investment property related Any secondary sources of repayment
Commercial and commercial real estate loans are underwritten after evaluating and understanding the borrower’s ability to operate profitably and prudently expand its business. Underwriting standards are designed to promote relationship banking rather than transactional banking. Once it is determined that the borrower’s management possesses sound ethics and solid business acumen, the Company’s management examines current and projected cash flows to determine the ability of the borrower to repay their obligations as agreed. Commercial loans are primarily made based on the identified cash flows of the borrower and secondarily on the underlying collateral provided by the borrower. The cash flows of borrowers, however, may not be as expected and the collateral securing these loans may fluctuate in value. Most commercial loans are secured by the assets being financed, including business equipment loans, farm equipment loans and cattle loans and may incorporate a personal guarantee; however, some short-term loans may be made on an unsecured basis. In the case of loans secured by accounts receivable, the availability of funds for the repayment of these loans may be substantially dependent on the ability of the borrower to collect amounts due from its customers.
14
First Bancshares, Inc. and Subsidiaries
Notes to Consolidated Financial Statements
Note 1. Summary of Significant Accounting Policies (Continued) The Company originates consumer loans utilizing a computer-based credit scoring analysis to supplement the underwriting process. To monitor and manage consumer loan risk, policies and procedures are developed and modified, as needed. This activity, coupled with relatively small loan amounts that are spread across many individual borrowers, minimizes risk. Additionally, trend and outlook reports are reviewed by management on a regular basis. Underwriting standards for home equity loans are heavily influenced by statutory requirements, which include, but are not limited to, a maximum loan-to-value, collection remedies, the total aggregate balance to one borrower and documentation requirements.
In some instances for all loans, it may be appropriate to originate or purchase loans that are exceptions to the guidelines and limits established within the lending policy described above and below. In general, exceptions to the lending policy do not significantly deviate from the guidelines and limits established within the lending policy and, if there are exceptions, they are clearly noted as such and specifically identified in loan approval documents.
The allowance for estimated losses on loans consists of specific and general components.
The specific component relates to loans that are classified as impaired, as defined below. For those loans that are classified as impaired, an allowance is established when the discounted cash flows (or collateral value or observable market price) of the impaired loan is lower than the carrying value of that loan.
A loan is considered impaired when, based on current information and events, it is probable that the Company will be unable to collect the scheduled payments of principal or interest when due according to the contractual terms of the loan agreement. Factors considered by management in determining impairment include payment status, collateral value, and the probability of collecting scheduled principal and interest payments when due. Loans that experience insignificant payment delays and payment shortfalls generally are not classified as impaired. Management determines the significance of payment delays and payment shortfalls on a case-by-case basis, taking into consideration all of the circumstances surrounding the loan and the borrower, including the length of the delay, the reasons for the delay, the borrower’s prior payment record and the amount of the shortfall in relation to the principal and interest owed. Impairment is measured on a case-by-case basis by either the present value of expected future cash flows discounted at the loan’s effective interest rate, the loan’s observable market price, or the fair value of the collateral if the loan is collateral dependent.
The general component consists of quantitative and qualitative factors and covers nonimpaired loans. The quantitative factors are based on historical charge-off experience and expected loss given default derived from the Company’s internal risk rating process. See below for a detailed description of the Company’s internal risk rating scale. The qualitative factors are determined based on an assessment of internal and/or external influences on credit quality that are not fully reflected in the historical loss or risk rating data.
For all loans, the Company utilizes the following internal risk rating scale:
Grade 1: This risk grading is generally reserved for credits fully secured by deposits at the Bank.
Grade 2: These are well established borrowers operating in a reasonably stable industry that may be only moderately affected by the business cycle. Management, owners and guarantors have unquestioned character, as demonstrated by repeated performance. Elements of strength are present in such areas as liquidity, stability of margins and cash flows, diversity of assets, and lack of dependence on one type of business. The total credit relationship is less than $500,000.
15
First Bancshares, Inc. and Subsidiaries
Notes to Consolidated Financial Statements
Note 1. Summary of Significant Accounting Policies (Continued)
Grade 3: This grade includes loans that are “pass grade” loans to borrowers of acceptable credit quality and risk. These borrowers have satisfactory asset quality and liquidity, adequate debt capacity and coverage, and good management in critical positions.
Grade 4: This grade includes loans that require “increased management attention.” These borrowers generally have limited additional debt capacity and modest coverage and average or below average asset quality, margins and market share.
Grade 5: A special mention asset has potential weaknesses that deserve management’s close attention. If left uncorrected, these potential weaknesses may result in deterioration of the repayment prospects for the asset or in the institution’s credit position at some future date. Assets that could be included in the special mention category include those that have developed minor credit weaknesses since origination, as well as those that were originated with such weaknesses. This includes loans the institution is unable to properly supervise because of an inadequate loan agreement, inadequate control over collateral (when such control is necessary to effect full repayment of the loan), or when a loan is made with significant deviations from prudent lending practices.
Grade 6: A “substandard” asset is inadequately protected by the current net worth and/or paying capacity of the obligor or by the collateral pledged, if any. Assets so classified must have a well-defined weakness, or weaknesses that jeopardize the liquidation of the debt. They are characterized by the distinct possibility that the institution will sustain some loss if the deficiencies are not corrected.
Assets classified as substandard may be characterized by one or a combination of the following weaknesses:
The primary source of repayment is gone or severely impaired and the institution may have to rely upon the secondary source.
The asset is (or was) a loan or an investment that is nonperforming or nonearning. A loss may not seem likely, but sufficient problems have arisen to cause the Bank to go
to extraordinary lengths to protect its position in order to maintain a high probability of repayment.
The obligors are unable to generate enough cash flow to reduce their debts. There is a material deterioration in collateral value (if the collateral is expected to be a
primary source of repayment). Flaws in security agreement or lien documentation leave the Bank in a subordinated or
unsecured position when the collateral is likely to be needed for the repayment of the loan.
Grade 7: An asset classified “doubtful” has all the weaknesses inherent in one classified substandard with the added characteristic that the weaknesses make collection or liquidation in full, on the basis of currently known facts, conditions and values, highly questionable and improbable. The likelihood of a loss on an asset or portion of an asset classified doubtful is high. Its classification as loss is not appropriate, however, because pending events are expected to materially reduce the amount of loss.
16
First Bancshares, Inc. and Subsidiaries
Notes to Consolidated Financial Statements
Note 1. Summary of Significant Accounting Policies (Continued)
Grade 8: An asset, or portion thereof, classified “loss” is considered uncollectible and of such little value that its continuance on the institution’s books as an asset, without establishment of a specific valuation allowance or charge-off, is not warranted. This classification does not necessarily mean that an asset has no recovery or salvage value, but rather, there is much doubt about whether, how much, or when the recovery would occur. As such, it is not practical or desirable to defer the write-off.
The Company employs independent, outside consultants who review and validate the credit risk program on a periodic basis. The review consists of a sample of commercial and real estate loans and includes a selection of borrowing relationships over $250,000 and selected criticized loans. Results of these reviews are presented to management and the Board of Directors. The loan review process complements and reinforces the risk identification and assessment decisions made by lenders and credit personnel, as well as the Company’s policies and procedures.
The Company provides many types of consumer and other loans, including motor vehicle, home improvement, home equity and small personal loans. The lending policy addresses specific credit guidelines by consumer loan type.
For residential real estate loans, consumer and other loans, these large groups of smaller balance homogenous loans are collectively evaluated for impairment, unless the loan has been restructured as a troubled debt restructuring, in which case the loan would be specifically evaluated for impairment. The Company applies a quantitative factor based on historical charge-off experience in total for each of these segments.
Troubled debt restructures are considered impaired loans and are subject to the same allowance methodology as described above for impaired loans by portfolio segment.
Credit-related financial instruments: Financial instruments include off-balance-sheet credit instruments, such as commitments to make loans and commercial letters of credit, issued to meet customer financing needs. The face amount for these items represents the exposure to loss before considering customer collateral or ability to repay. Such financial instruments are recorded when they are funded.
Cash surrender value of bank-owned life insurance: The Company has purchased life insurance policies on certain key executives. Bank-owned life insurance is recorded at its cash surrender value, or the amount that can be realized upon surrender of the policy.
Premises and equipment, net: Premises and equipment are stated at cost less accumulated depreciation. Land is carried at cost. Depreciation is computed principally on a straight-line basis over the estimated useful lives of the related assets. Additions, major replacements and improvements are added to the respective asset balance at cost. Maintenance, repairs and minor replacements are charged directly to expense as incurred. Buildings and investment real estate have estimated useful lives ranging from 15 to 40 years. All other assets have estimated useful lives ranging from three to 10 years with improvements being depreciated over the remaining estimated life of the related asset.
Real estate owned and repossessed assets: Real estate acquired through foreclosure is initially recorded at fair value, less estimated costs to sell, establishing a new cost basis. If the fair value less costs to sell is less than the respective loan balance, a charge against the allowance for loan losses is recorded upon property acquisition. Declines in property value subsequent to acquisition are charged to operations. Holding costs are expensed as incurred.
17
First Bancshares, Inc. and Subsidiaries
Notes to Consolidated Financial Statements
Note 1. Summary of Significant Accounting Policies (Continued)
Transfers of financial assets: Transfers of financial assets are accounted for as sales only when control over the assets has been surrendered. Control over transferred assets is deemed to be surrendered when (1) the assets have been isolated from the Company, (2) the transferee obtains the right to pledge or exchange the assets it received, and no condition both constrains the transferee from taking advantage of its right to pledge or exchange and provides more than a modest benefit to the transferor and (3) the Company does not maintain effective control over the transferred assets through an agreement to repurchase them before their maturity or the ability to unilaterally cause the holder to return specific assets.
Impairment of long-lived assets: Long-lived assets, including property and equipment, are reviewed for impairment whenever events or changes in circumstances indicate the carrying amount of an asset may not be recoverable. If such assets are considered to be impaired, the impairment to be recognized is measured by the amount by which the carrying amount of the assets exceeds the fair value of the assets.
Repurchase agreements: The Company has entered into sales of securities under agreements to repurchase. The amounts deposited under these agreements represent short-term borrowings and are reflected as a liability in the consolidated balance sheets. Securities held in safekeeping are pledged to the depositors under a written custodial agreement that explicitly recognizes the depositors’ interest in the securities. Securities sold under agreements to repurchase generally mature within one day to 12 months from the transaction date.
Income taxes: The Company files its tax return on a consolidated basis with its subsidiaries. The entities follow the direct reimbursement method of accounting for income taxes under which income taxes or credits that result from the subsidiaries’ inclusion on the consolidated tax return are paid to or received from the parent company.
Deferred taxes are determined using the liability (or balance sheet) method whereby deferred tax assets are recognized for deductible temporary differences and operating loss and tax credit carry-forwards, and deferred tax liabilities are recognized for taxable temporary differences. Temporary differences are the differences between the reported amounts of assets and liabilities and their tax bases. Deferred tax assets are reduced by a valuation allowance when, in the opinion of management, it is more likely than not that some portion or all of the deferred tax assets will not be realized. Deferred tax assets and liabilities are adjusted for the effects of changes in tax laws and rates on the date of enactment.
The Company accounts for uncertainty in income taxes, which addresses the determination of whether tax benefits claimed or expected to be claimed on a tax return should be recorded in the financial statements. Under this guidance, the Company may recognize the tax benefit from an uncertain tax position only if it is more likely than not that the tax position will be sustained on examination by taxing authorities, based on the technical merits of the position. The tax benefits recognized in the financial statements from such a position are measured based on the largest benefit that has a greater than 50 percent likelihood of being realized upon ultimate settlement. The guidance on accounting for uncertainty in income taxes also addresses derecognition, classification, interest and penalties on income taxes, and accounting in interim periods. The Company recognizes interest and penalties on income taxes as a component of income tax expense. The Company has not accrued any additional income taxes due to uncertain tax positions.
Revenue recognition: Deposit account transaction fees and other ancillary noninterest income related to the Bank’s deposit and lending activities are recognized as services are performed.
Stock-based compensation: The Company records any stock-based employee compensation cost using the fair value method. No stock options have been granted since 2007.
18
First Bancshares, Inc. and Subsidiaries
Notes to Consolidated Financial Statements
Note 1. Summary of Significant Accounting Policies (Continued)
Comprehensive income: Comprehensive income consists of net income and other comprehensive income. For the Company, other comprehensive income consists entirely of unrealized gains (losses) on securities available for sale, net of deferred taxes and realized gains and losses in sales of securities.
Subsequent events: The Company has evaluated all subsequent events through February 24, 2017, the date that the consolidated financial statements were available to be issued.
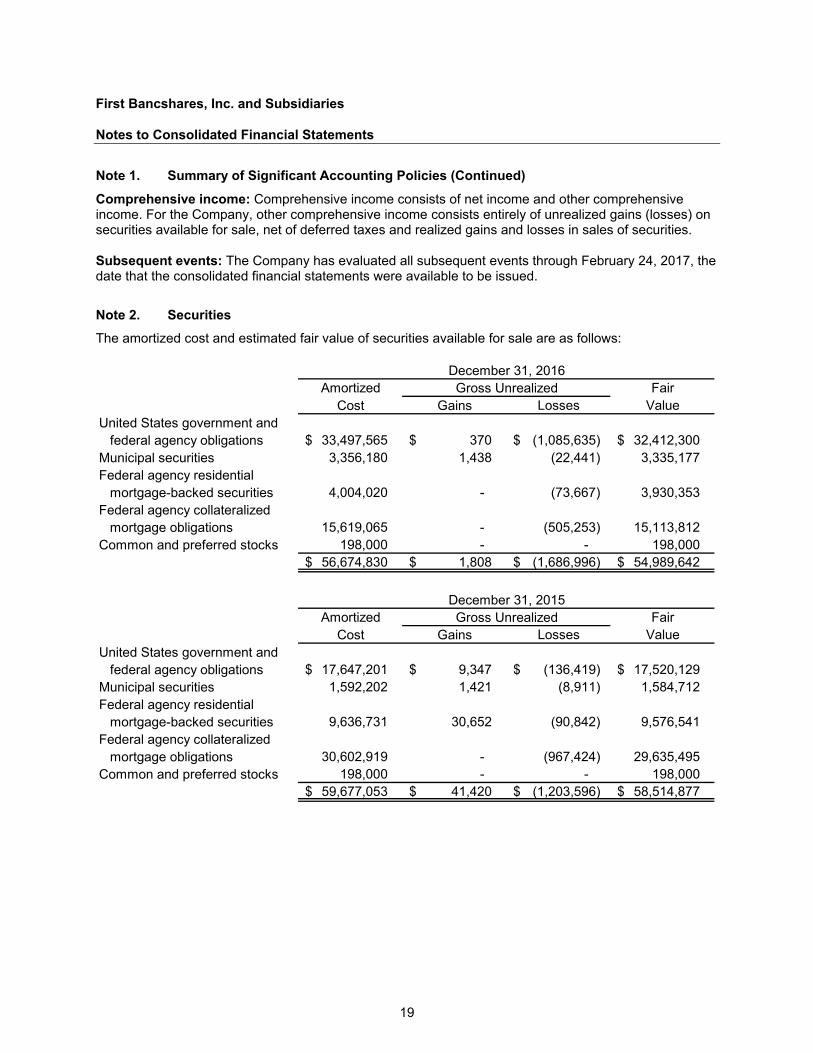
Note 2. Securities The amortized cost and estimated fair value of securities available for sale are as follows:
Amortized FairCost Gains Losses Value
United States government and federal agency obligations 33,497,565 $ 370 $ (1,085,635) $ 32,412,300 $
Municipal securities 3,356,180 1,438 (22,441) 3,335,177 Federal agency residential
mortgage-backed securities 4,004,020 - (73,667) 3,930,353 Federal agency collateralized
mortgage obligations 15,619,065 - (505,253) 15,113,812 Common and preferred stocks 198,000 - - 198,000
56,674,830 $ 1,808 $ (1,686,996) $ 54,989,642 $
Amortized FairCost Gains Losses Value
United States government and federal agency obligations 17,647,201 $ 9,347 $ (136,419) $ 17,520,129 $
Municipal securities 1,592,202 1,421 (8,911) 1,584,712 Federal agency residential
mortgage-backed securities 9,636,731 30,652 (90,842) 9,576,541 Federal agency collateralized
mortgage obligations 30,602,919 - (967,424) 29,635,495 Common and preferred stocks 198,000 - - 198,000
59,677,053 $ 41,420 $ (1,203,596) $ 58,514,877 $
Gross Unrealized
Gross Unrealized
December 31, 2016
December 31, 2015
19
First Bancshares, Inc. and Subsidiaries
Notes to Consolidated Financial Statements
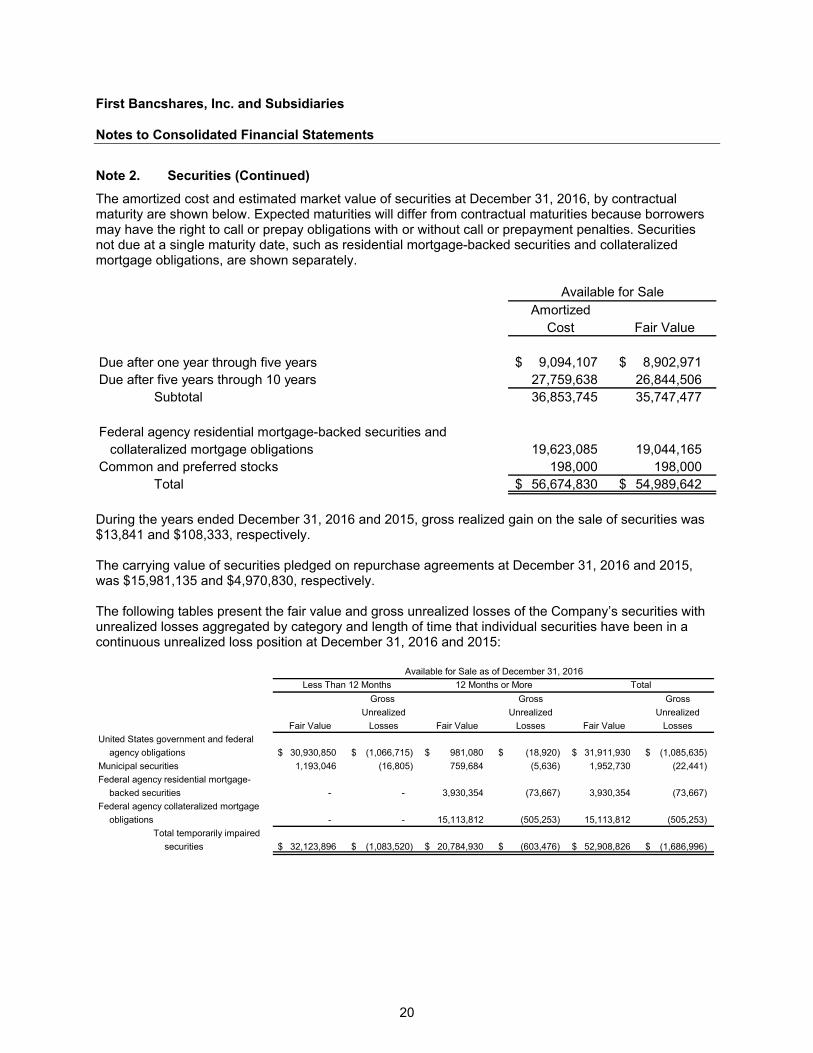
Note 2. Securities (Continued) The amortized cost and estimated market value of securities at December 31, 2016, by contractual maturity are shown below. Expected maturities will differ from contractual maturities because borrowers may have the right to call or prepay obligations with or without call or prepayment penalties. Securities not due at a single maturity date, such as residential mortgage-backed securities and collateralized mortgage obligations, are shown separately.
AmortizedCost Fair Value
Due after one year through five years 9,094,107 $ 8,902,971 $ Due after five years through 10 years 27,759,638 26,844,506
Subtotal 36,853,745 35,747,477
Federal agency residential mortgage-backed securities and collateralized mortgage obligations 19,623,085 19,044,165
Common and preferred stocks 198,000 198,000 Total 56,674,830 $ 54,989,642 $
Available for Sale
During the years ended December 31, 2016 and 2015, gross realized gain on the sale of securities was $13,841 and $108,333, respectively.
The carrying value of securities pledged on repurchase agreements at December 31, 2016 and 2015, was $15,981,135 and $4,970,830, respectively.
The following tables present the fair value and gross unrealized losses of the Company’s securities with unrealized losses aggregated by category and length of time that individual securities have been in a continuous unrealized loss position at December 31, 2016 and 2015:
Gross Gross GrossUnrealized Unrealized Unrealized
Fair Value Losses Fair Value Losses Fair Value LossesUnited States government and federal
agency obligations 30,930,850 $ (1,066,715) $ 981,080 $ (18,920) $ 31,911,930 $ (1,085,635) $Municipal securities 1,193,046 (16,805) 759,684 (5,636) 1,952,730 (22,441) Federal agency residential mortgage-
backed securities - - 3,930,354 (73,667) 3,930,354 (73,667) Federal agency collateralized mortgage
obligations - - 15,113,812 (505,253) 15,113,812 (505,253) Total temporarily impaired
securities 32,123,896 $ (1,083,520) $ 20,784,930 $ (603,476) $ 52,908,826 $ (1,686,996) $
Available for Sale as of December 31, 2016Less Than 12 Months 12 Months or More Total
20
First Bancshares, Inc. and Subsidiaries
Notes to Consolidated Financial Statements
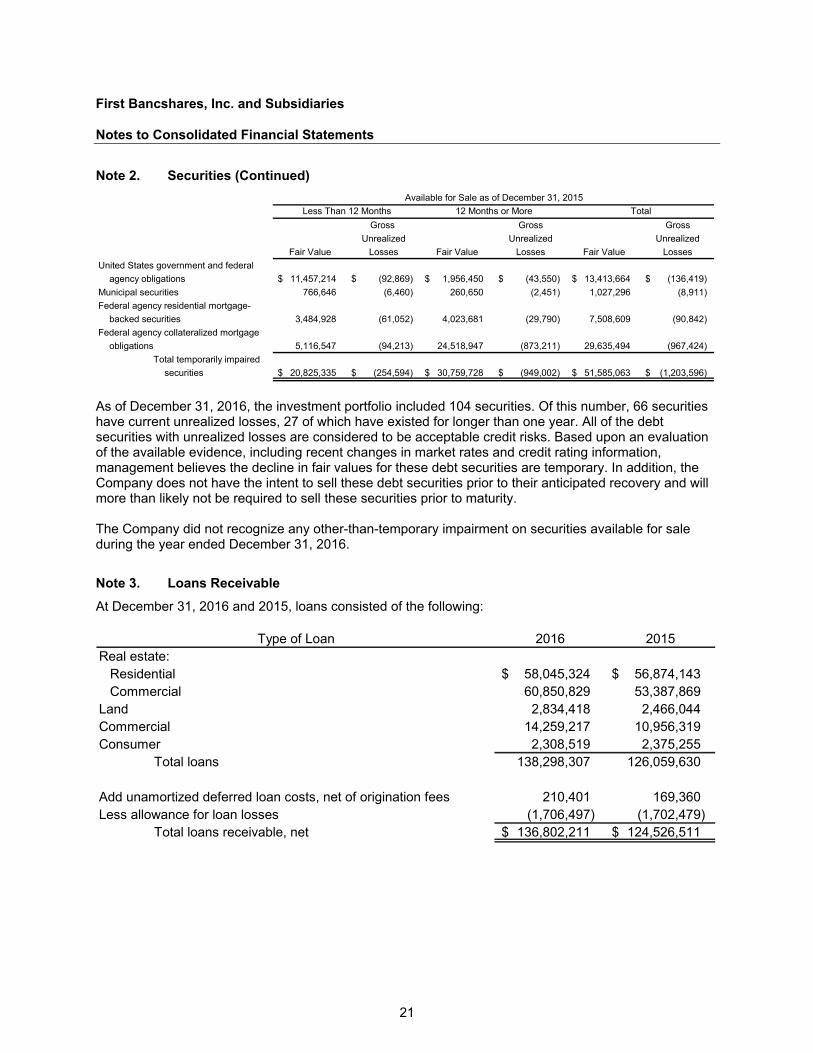
Note 2. Securities (Continued)
Gross Gross GrossUnrealized Unrealized Unrealized
Fair Value Losses Fair Value Losses Fair Value LossesUnited States government and federal
agency obligations 11,457,214 $ (92,869) $ 1,956,450 $ (43,550) $ 13,413,664 $ (136,419) $Municipal securities 766,646 (6,460) 260,650 (2,451) 1,027,296 (8,911) Federal agency residential mortgage-
backed securities 3,484,928 (61,052) 4,023,681 (29,790) 7,508,609 (90,842) Federal agency collateralized mortgage
obligations 5,116,547 (94,213) 24,518,947 (873,211) 29,635,494 (967,424) Total temporarily impaired
securities 20,825,335 $ (254,594) $ 30,759,728 $ (949,002) $ 51,585,063 $ (1,203,596) $
Available for Sale as of December 31, 2015Less Than 12 Months 12 Months or More Total
As of December 31, 2016, the investment portfolio included 104 securities. Of this number, 66 securities have current unrealized losses, 27 of which have existed for longer than one year. All of the debt securities with unrealized losses are considered to be acceptable credit risks. Based upon an evaluation of the available evidence, including recent changes in market rates and credit rating information, management believes the decline in fair values for these debt securities are temporary. In addition, the Company does not have the intent to sell these debt securities prior to their anticipated recovery and will more than likely not be required to sell these securities prior to maturity.
The Company did not recognize any other-than-temporary impairment on securities available for sale during the year ended December 31, 2016.
Note 3. Loans Receivable At December 31, 2016 and 2015, loans consisted of the following:
Type of Loan 2016 2015Real estate:
Residential 58,045,324 $ 56,874,143 $ Commercial 60,850,829 53,387,869
Land 2,834,418 2,466,044 Commercial 14,259,217 10,956,319 Consumer 2,308,519 2,375,255
Total loans 138,298,307 126,059,630
Add unamortized deferred loan costs, net of origination fees 210,401 169,360 Less allowance for loan losses (1,706,497) (1,702,479)
Total loans receivable, net 136,802,211 $ 124,526,511 $
21
First Bancshares, Inc. and Subsidiaries
Notes to Consolidated Financial Statements
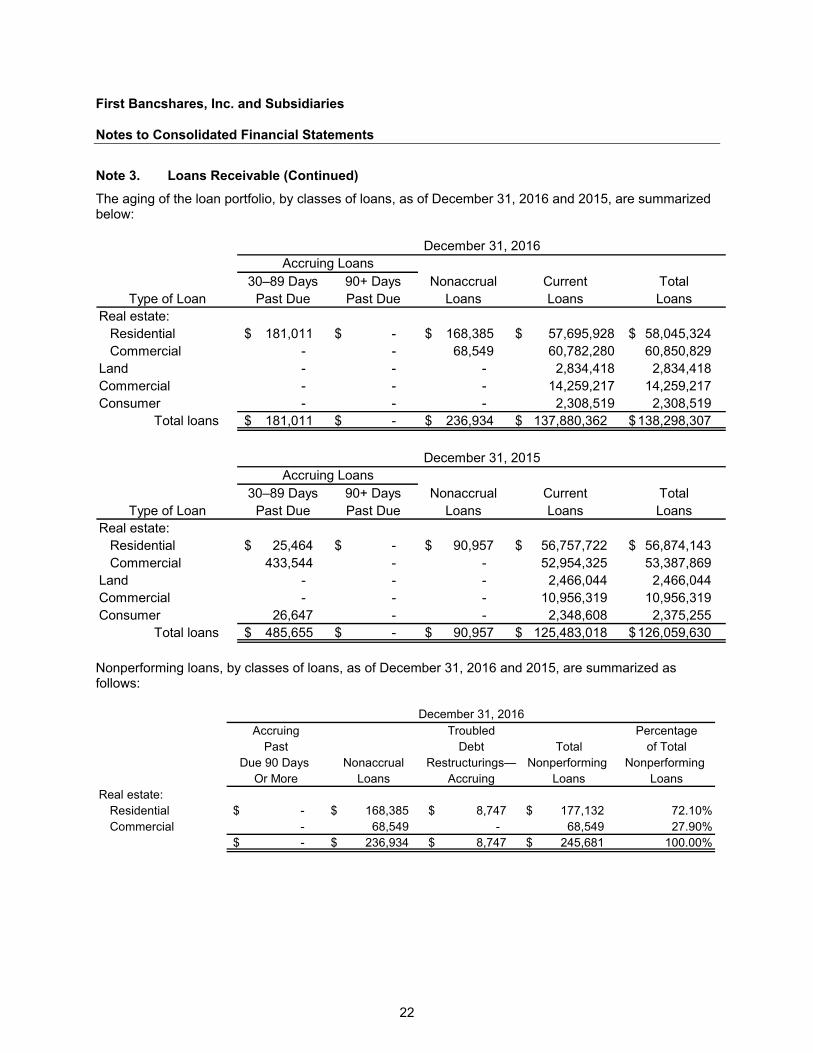
Note 3. Loans Receivable (Continued) The aging of the loan portfolio, by classes of loans, as of December 31, 2016 and 2015, are summarized below:
30–89 Days 90+ Days Nonaccrual Current TotalType of Loan Past Due Past Due Loans Loans Loans
Real estate:Residential 181,011 $ -$ 168,385 $ 57,695,928$ 58,045,324 $Commercial - - 68,549 60,782,280 60,850,829
Land - - - 2,834,418 2,834,418 Commercial - - - 14,259,217 14,259,217 Consumer - - - 2,308,519 2,308,519
Total loans 181,011 $ -$ 236,934 $ 137,880,362 $ 138,298,307 $
30–89 Days 90+ Days Nonaccrual Current TotalType of Loan Past Due Past Due Loans Loans Loans
Real estate:Residential 25,464 $ -$ 90,957 $ 56,757,722 $ 56,874,143 $Commercial 433,544 - - 52,954,325 53,387,869
Land - - - 2,466,044 2,466,044 Commercial - - - 10,956,319 10,956,319 Consumer 26,647 - - 2,348,608 2,375,255
Total loans 485,655 $ -$ 90,957 $ 125,483,018 $ 126,059,630 $
Accruing Loans
Accruing LoansDecember 31, 2016
December 31, 2015
Nonperforming loans, by classes of loans, as of December 31, 2016 and 2015, are summarized as follows:
Accruing Troubled PercentagePast Debt Total of Total
Due 90 Days Nonaccrual Restructurings— Nonperforming Nonperforming Or More Loans Accruing Loans Loans
Real estate:Residential -$ 168,385 $ 8,747 $ 177,132 $ 72.10%Commercial - 68,549 - 68,549 27.90%
-$ 236,934 $ 8,747 $ 245,681 $ 100.00%
December 31, 2016
22
First Bancshares, Inc. and Subsidiaries
Notes to Consolidated Financial Statements
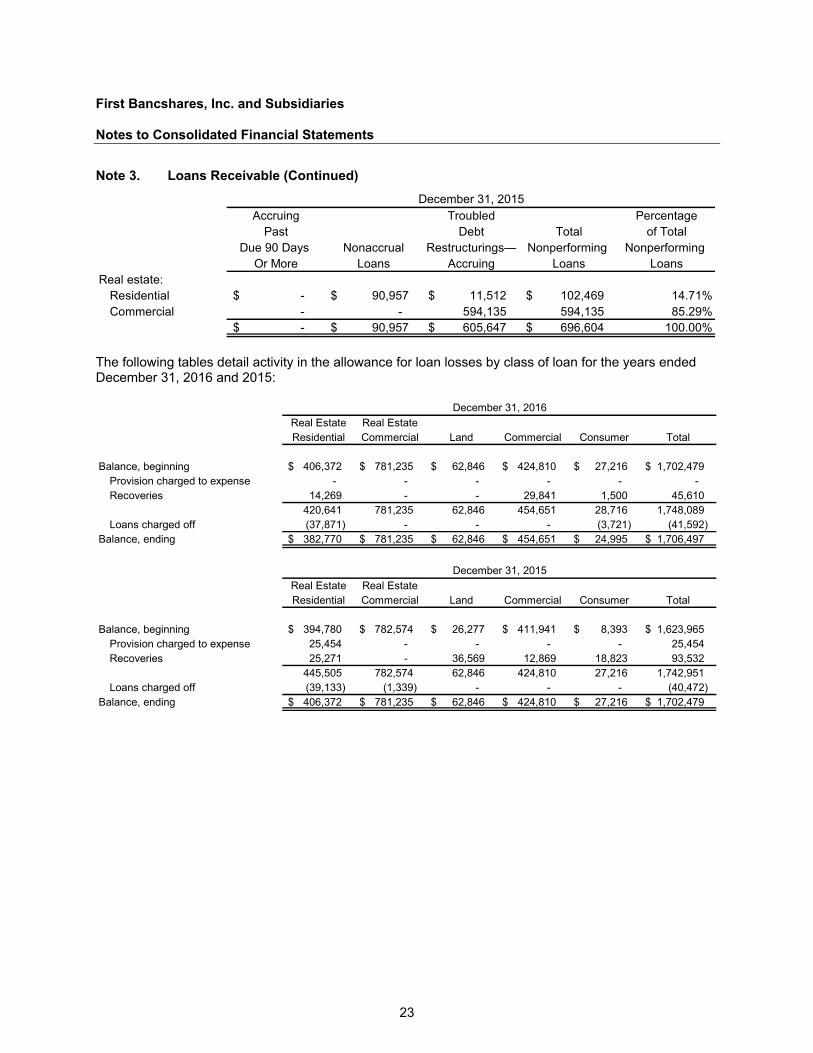
Note 3. Loans Receivable (Continued)
Accruing Troubled PercentagePast Debt Total of Total
Due 90 Days Nonaccrual Restructurings— Nonperforming Nonperforming Or More Loans Accruing Loans Loans
Real estate:Residential -$ 90,957 $ 11,512 $ 102,469 $ 14.71%Commercial - - 594,135 594,135 85.29%
-$ 90,957 $ 605,647 $ 696,604 $ 100.00%
December 31, 2015
The following tables detail activity in the allowance for loan losses by class of loan for the years ended December 31, 2016 and 2015:
Real Estate Real EstateResidential Commercial Land Commercial Consumer Total
Balance, beginning 406,372 $ 781,235 $ 62,846 $ 424,810 $ 27,216 $ 1,702,479 $ Provision charged to expense - - - - - -Recoveries 14,269 - - 29,841 1,500 45,610
420,641 781,235 62,846 454,651 28,716 1,748,089 Loans charged off (37,871) - - - (3,721) (41,592)
Balance, ending 382,770 $ 781,235 $ 62,846 $ 454,651 $ 24,995 $ 1,706,497 $
Real Estate Real EstateResidential Commercial Land Commercial Consumer Total
Balance, beginning 394,780 $ 782,574 $ 26,277 $ 411,941 $ 8,393 $ 1,623,965 $ Provision charged to expense 25,454 - - - - 25,454 Recoveries 25,271 - 36,569 12,869 18,823 93,532
445,505 782,574 62,846 424,810 27,216 1,742,951 Loans charged off (39,133) (1,339) - - - (40,472)
Balance, ending 406,372 $ 781,235 $ 62,846 $ 424,810 $ 27,216 $ 1,702,479 $
December 31, 2016
December 31, 2015
23
First Bancshares, Inc. and Subsidiaries
Notes to Consolidated Financial Statements
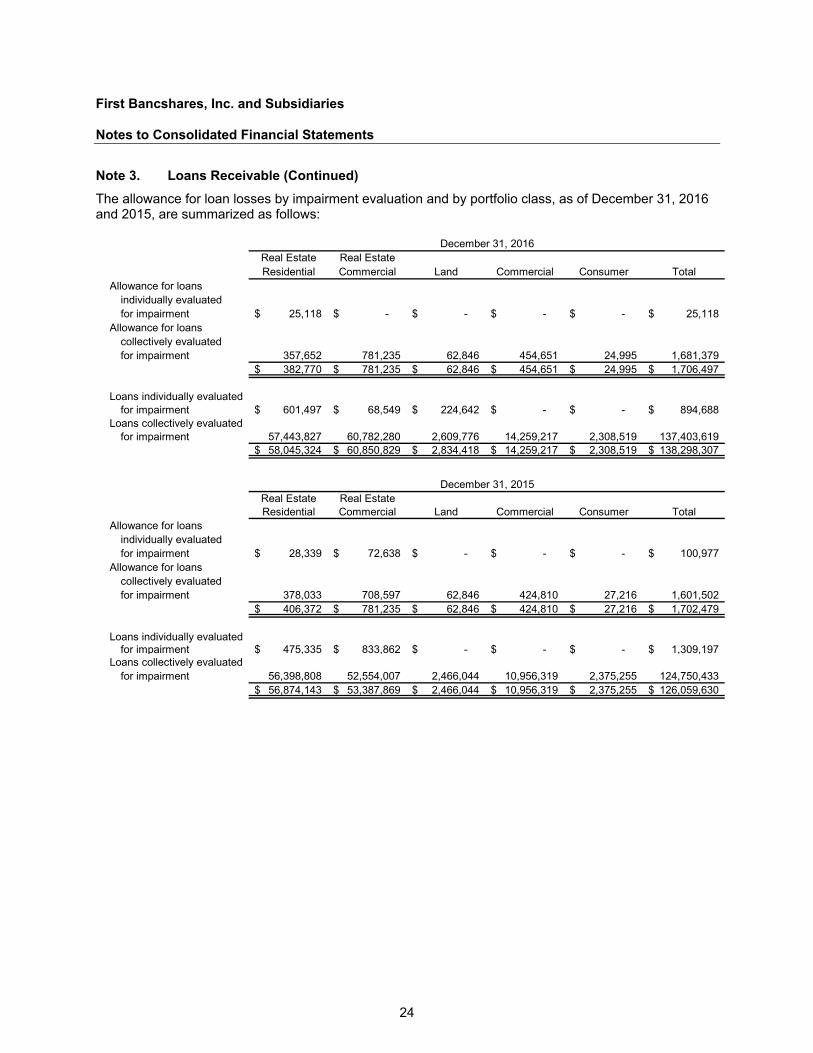
Note 3. Loans Receivable (Continued) The allowance for loan losses by impairment evaluation and by portfolio class, as of December 31, 2016 and 2015, are summarized as follows:
Real Estate Real EstateResidential Commercial Land Commercial Consumer Total
Allowance for loansindividually evaluatedfor impairment 25,118$ -$ -$ -$ -$ 25,118$
Allowance for loanscollectively evaluatedfor impairment 357,652 781,235 62,846 454,651 24,995 1,681,379
382,770$ 781,235$ 62,846$ 454,651$ 24,995$ 1,706,497$
Loans individually evaluatedfor impairment 601,497$ 68,549$ 224,642$ -$ -$ 894,688$
Loans collectively evaluatedfor impairment 57,443,827 60,782,280 2,609,776 14,259,217 2,308,519 137,403,619
58,045,324$ 60,850,829$ 2,834,418$ 14,259,217$ 2,308,519$ 138,298,307$
December 31, 2016
Real Estate Real EstateResidential Commercial Land Commercial Consumer Total
Allowance for loansindividually evaluatedfor impairment 28,339$ 72,638$ -$ -$ -$ 100,977$
Allowance for loanscollectively evaluatedfor impairment 378,033 708,597 62,846 424,810 27,216 1,601,502
406,372$ 781,235$ 62,846$ 424,810$ 27,216$ 1,702,479$
Loans individually evaluatedfor impairment 475,335$ 833,862$ -$ -$ -$ 1,309,197$
Loans collectively evaluatedfor impairment 56,398,808 52,554,007 2,466,044 10,956,319 2,375,255 124,750,433
56,874,143$ 53,387,869$ 2,466,044$ 10,956,319$ 2,375,255$ 126,059,630$
December 31, 2015
24
First Bancshares, Inc. and Subsidiaries
Notes to Consolidated Financial Statements
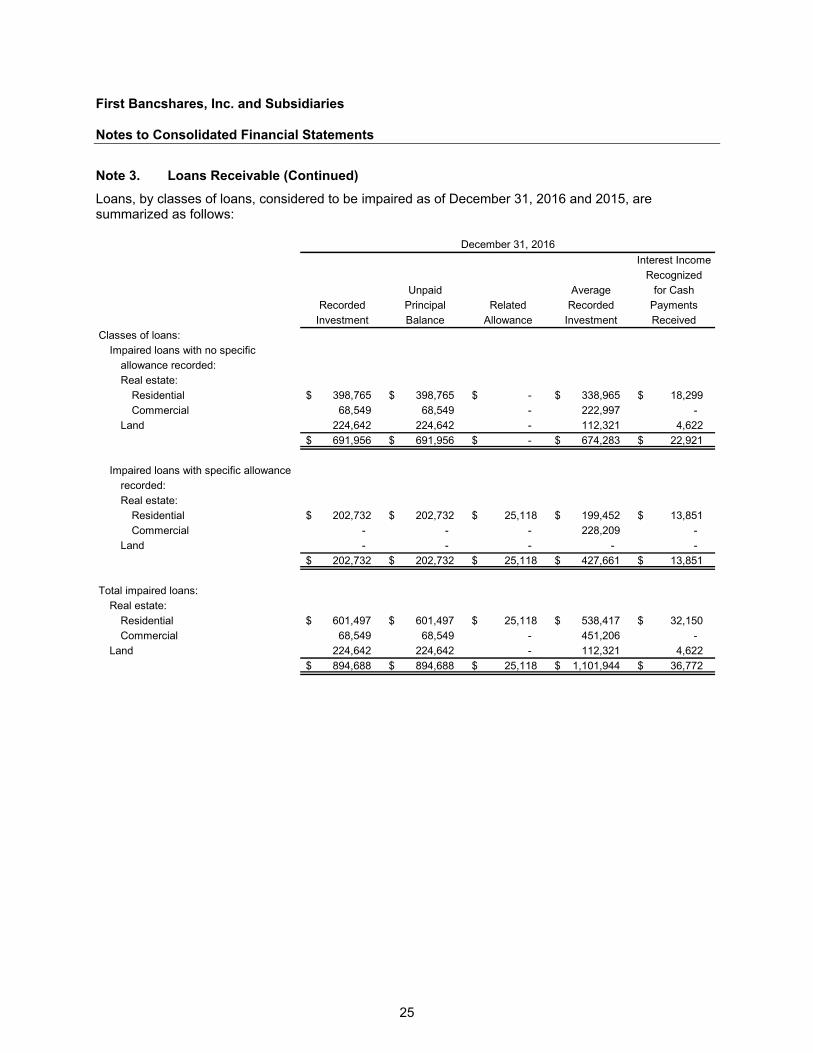
Note 3. Loans Receivable (Continued) Loans, by classes of loans, considered to be impaired as of December 31, 2016 and 2015, are summarized as follows:
Interest IncomeRecognized
Unpaid Average for CashRecorded Principal Related Recorded Payments
Investment Balance Allowance Investment ReceivedClasses of loans:
Impaired loans with no specific allowance recorded:Real estate:
Residential 398,765 $ 398,765 $ -$ 338,965 $ 18,299 $Commercial 68,549 68,549 - 222,997 -
Land 224,642 224,642 - 112,321 4,622 691,956 $ 691,956 $ -$ 674,283 $ 22,921 $
Impaired loans with specific allowancerecorded:Real estate:
Residential 202,732 $ 202,732 $ 25,118 $ 199,452 $ 13,851 $Commercial - - - 228,209 -
Land - - - - - 202,732 $ 202,732 $ 25,118 $ 427,661 $ 13,851 $
Total impaired loans:Real estate:
Residential 601,497 $ 601,497 $ 25,118 $ 538,417 $ 32,150 $Commercial 68,549 68,549 - 451,206 -
Land 224,642 224,642 - 112,321 4,622 894,688 $ 894,688 $ 25,118 $ 1,101,944 $ 36,772 $
December 31, 2016
25
First Bancshares, Inc. and Subsidiaries
Notes to Consolidated Financial Statements
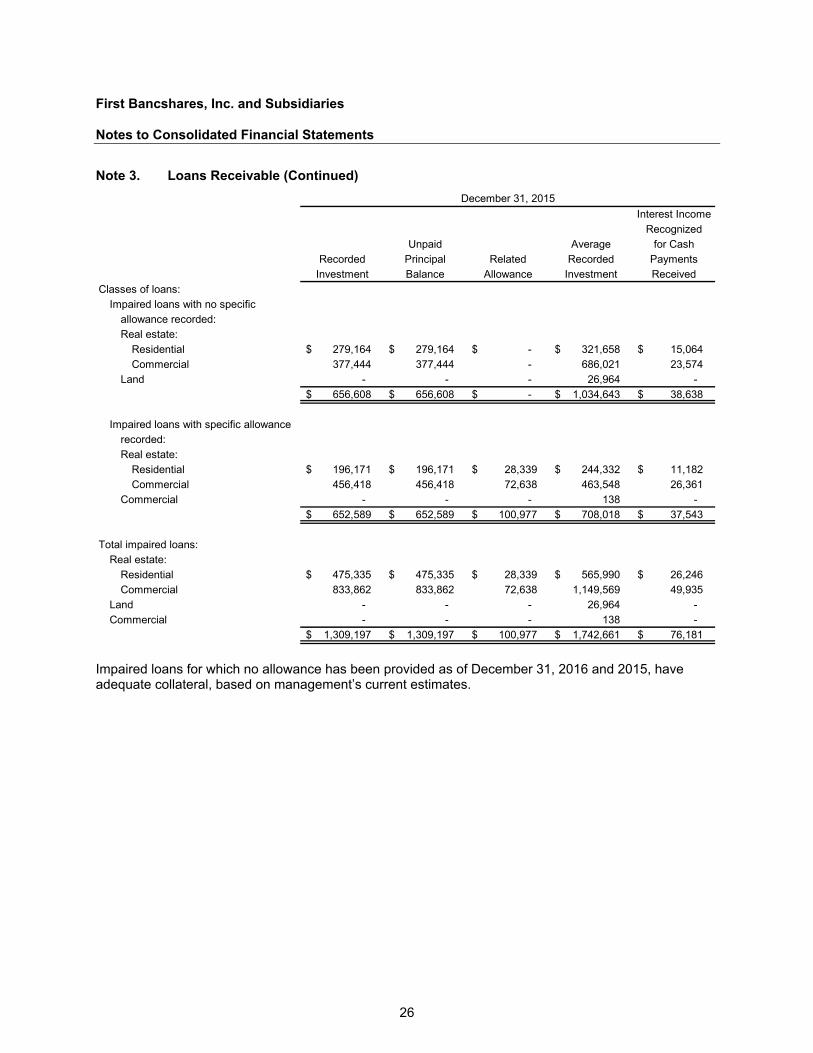
Note 3. Loans Receivable (Continued)
Interest IncomeRecognized
Unpaid Average for CashRecorded Principal Related Recorded Payments
Investment Balance Allowance Investment ReceivedClasses of loans:
Impaired loans with no specific allowance recorded:Real estate:
Residential 279,164 $ 279,164 $ -$ 321,658 $ 15,064 $Commercial 377,444 377,444 - 686,021 23,574
Land - - - 26,964 - 656,608 $ 656,608 $ -$ 1,034,643 $ 38,638 $
Impaired loans with specific allowancerecorded:Real estate:
Residential 196,171 $ 196,171 $ 28,339 $ 244,332 $ 11,182 $Commercial 456,418 456,418 72,638 463,548 26,361
Commercial - - - 138 - 652,589 $ 652,589 $ 100,977 $ 708,018 $ 37,543 $
Total impaired loans:Real estate:
Residential 475,335 $ 475,335 $ 28,339 $ 565,990 $ 26,246 $Commercial 833,862 833,862 72,638 1,149,569 49,935
Land - - - 26,964 - Commercial - - - 138 -
1,309,197 $ 1,309,197 $ 100,977 $ 1,742,661 $ 76,181 $
December 31, 2015
Impaired loans for which no allowance has been provided as of December 31, 2016 and 2015, have adequate collateral, based on management’s current estimates.
26
First Bancshares, Inc. and Subsidiaries
Notes to Consolidated Financial Statements
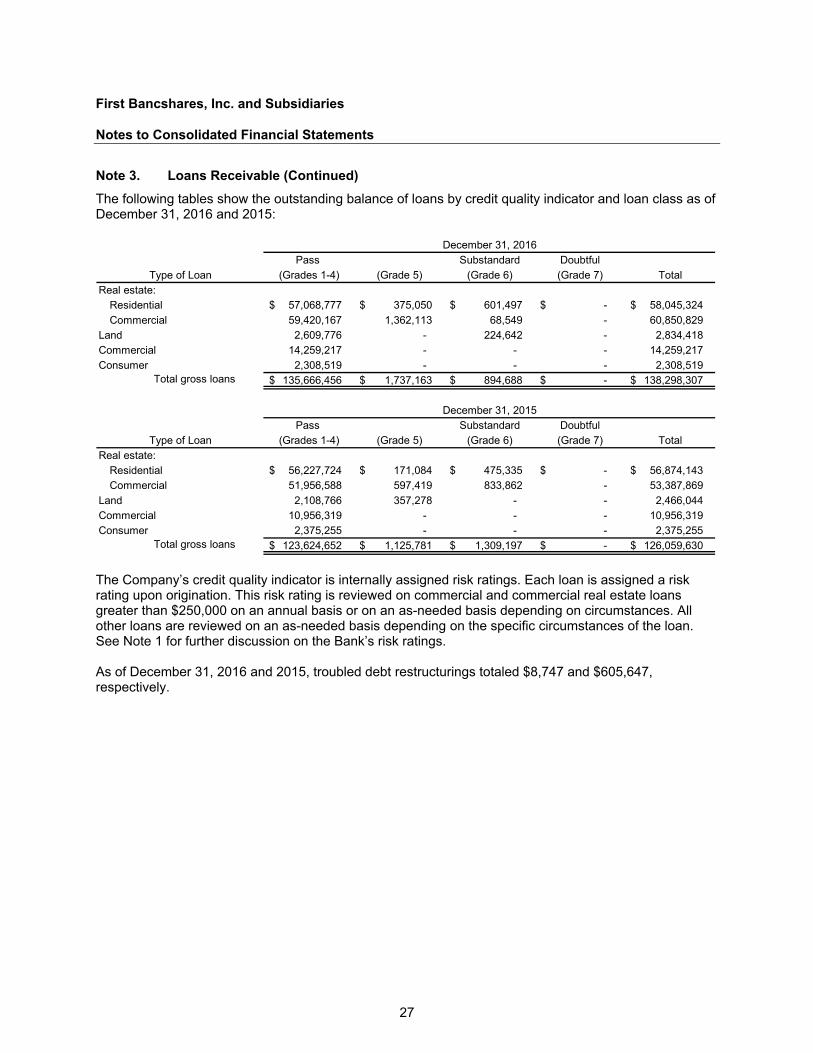
Note 3. Loans Receivable (Continued) The following tables show the outstanding balance of loans by credit quality indicator and loan class as of December 31, 2016 and 2015:
Pass Substandard DoubtfulType of Loan (Grades 1-4) (Grade 5) (Grade 6) (Grade 7) Total
Real estate:Residential 57,068,777 $ 375,050 $ 601,497 $ -$ 58,045,324 $ Commercial 59,420,167 1,362,113 68,549 - 60,850,829
Land 2,609,776 - 224,642 - 2,834,418 Commercial 14,259,217 - - - 14,259,217 Consumer 2,308,519 - - - 2,308,519
Total gross loans 135,666,456 $ 1,737,163 $ 894,688 $ -$ 138,298,307 $
Pass Substandard DoubtfulType of Loan (Grades 1-4) (Grade 5) (Grade 6) (Grade 7) Total
Real estate:Residential 56,227,724 $ 171,084 $ 475,335 $ -$ 56,874,143 $ Commercial 51,956,588 597,419 833,862 - 53,387,869
Land 2,108,766 357,278 - - 2,466,044 Commercial 10,956,319 - - - 10,956,319 Consumer 2,375,255 - - - 2,375,255
Total gross loans 123,624,652 $ 1,125,781 $ 1,309,197 $ -$ 126,059,630 $
December 31, 2016
December 31, 2015
The Company’s credit quality indicator is internally assigned risk ratings. Each loan is assigned a risk rating upon origination. This risk rating is reviewed on commercial and commercial real estate loans greater than $250,000 on an annual basis or on an as-needed basis depending on circumstances. All other loans are reviewed on an as-needed basis depending on the specific circumstances of the loan. See Note 1 for further discussion on the Bank’s risk ratings.
As of December 31, 2016 and 2015, troubled debt restructurings totaled $8,747 and $605,647, respectively.
27
First Bancshares, Inc. and Subsidiaries
Notes to Consolidated Financial Statements
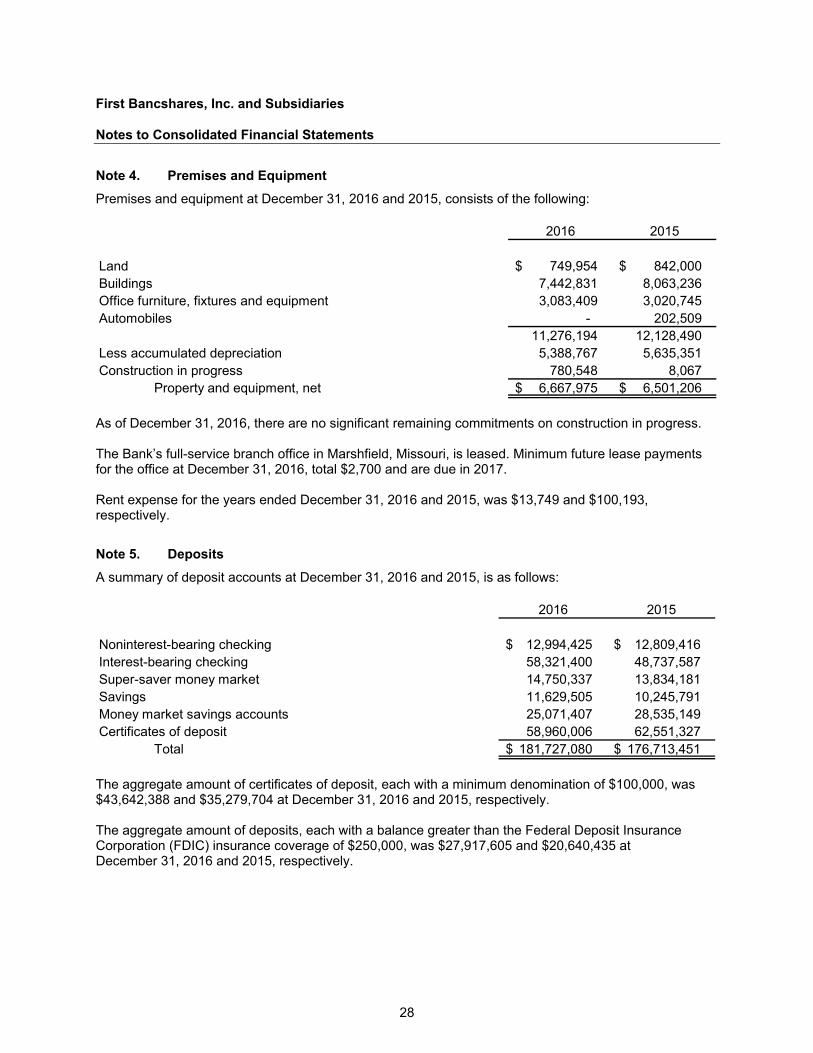
Note 4. Premises and Equipment Premises and equipment at December 31, 2016 and 2015, consists of the following:
2016 2015
Land 749,954 $ 842,000 $ Buildings 7,442,831 8,063,236 Office furniture, fixtures and equipment 3,083,409 3,020,745 Automobiles - 202,509
11,276,194 12,128,490 Less accumulated depreciation 5,388,767 5,635,351 Construction in progress 780,548 8,067
Property and equipment, net 6,667,975 $ 6,501,206 $
As of December 31, 2016, there are no significant remaining commitments on construction in progress.
The Bank’s full-service branch office in Marshfield, Missouri, is leased. Minimum future lease payments for the office at December 31, 2016, total $2,700 and are due in 2017.
Rent expense for the years ended December 31, 2016 and 2015, was $13,749 and $100,193, respectively.
Note 5. Deposits A summary of deposit accounts at December 31, 2016 and 2015, is as follows:
2016 2015
Noninterest-bearing checking 12,994,425 $ 12,809,416 $ Interest-bearing checking 58,321,400 48,737,587 Super-saver money market 14,750,337 13,834,181 Savings 11,629,505 10,245,791 Money market savings accounts 25,071,407 28,535,149 Certificates of deposit 58,960,006 62,551,327
Total 181,727,080 $ 176,713,451 $
The aggregate amount of certificates of deposit, each with a minimum denomination of $100,000, was $43,642,388 and $35,279,704 at December 31, 2016 and 2015, respectively.
The aggregate amount of deposits, each with a balance greater than the Federal Deposit Insurance Corporation (FDIC) insurance coverage of $250,000, was $27,917,605 and $20,640,435 at December 31, 2016 and 2015, respectively.
28
First Bancshares, Inc. and Subsidiaries
Notes to Consolidated Financial Statements
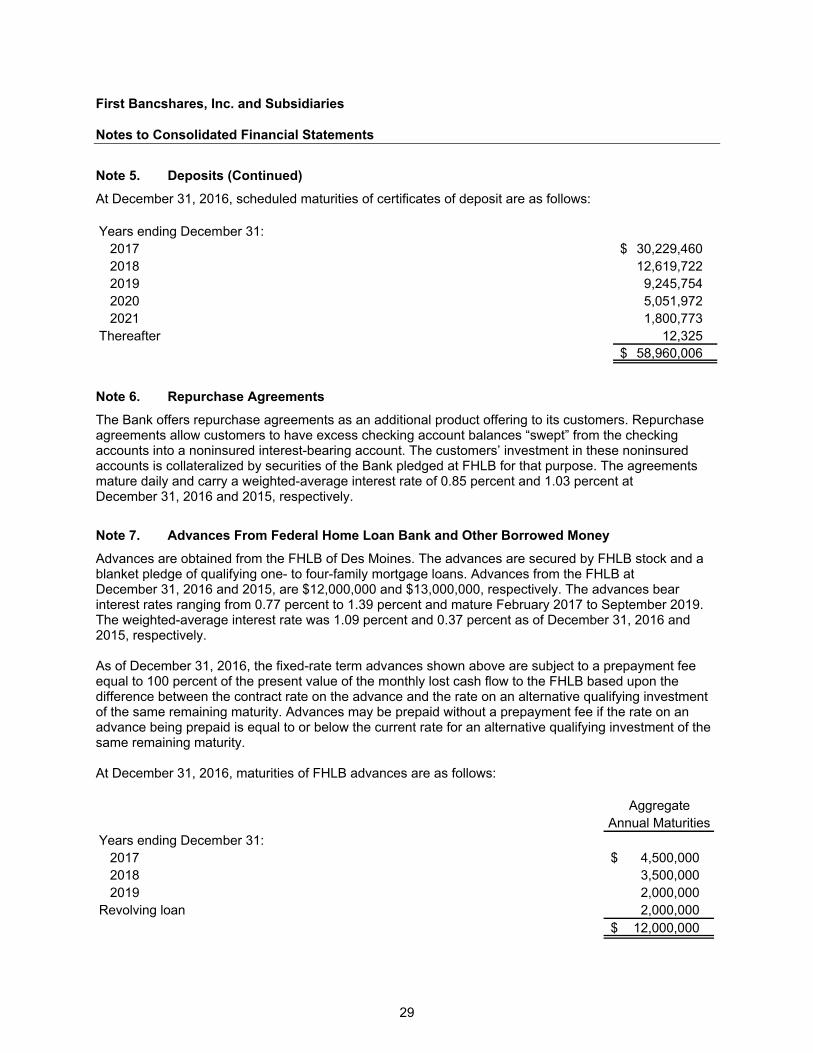
Note 5. Deposits (Continued) At December 31, 2016, scheduled maturities of certificates of deposit are as follows:
Years ending December 31:2017 30,229,460 $2018 12,619,722 2019 9,245,754 2020 5,051,972 2021 1,800,773
Thereafter 12,325 58,960,006 $
Note 6. Repurchase Agreements The Bank offers repurchase agreements as an additional product offering to its customers. Repurchase agreements allow customers to have excess checking account balances “swept” from the checking accounts into a noninsured interest-bearing account. The customers’ investment in these noninsured accounts is collateralized by securities of the Bank pledged at FHLB for that purpose. The agreements mature daily and carry a weighted-average interest rate of 0.85 percent and 1.03 percent at December 31, 2016 and 2015, respectively.
Note 7. Advances From Federal Home Loan Bank and Other Borrowed Money Advances are obtained from the FHLB of Des Moines. The advances are secured by FHLB stock and a blanket pledge of qualifying one- to four-family mortgage loans. Advances from the FHLB at December 31, 2016 and 2015, are $12,000,000 and $13,000,000, respectively. The advances bear interest rates ranging from 0.77 percent to 1.39 percent and mature February 2017 to September 2019. The weighted-average interest rate was 1.09 percent and 0.37 percent as of December 31, 2016 and 2015, respectively.
As of December 31, 2016, the fixed-rate term advances shown above are subject to a prepayment fee equal to 100 percent of the present value of the monthly lost cash flow to the FHLB based upon the difference between the contract rate on the advance and the rate on an alternative qualifying investment of the same remaining maturity. Advances may be prepaid without a prepayment fee if the rate on an advance being prepaid is equal to or below the current rate for an alternative qualifying investment of the same remaining maturity.
At December 31, 2016, maturities of FHLB advances are as follows:
AggregateAnnual Maturities
Years ending December 31:2017 4,500,000 $2018 3,500,000 2019 2,000,000
Revolving loan 2,000,000 12,000,000 $
29
First Bancshares, Inc. and Subsidiaries
Notes to Consolidated Financial Statements
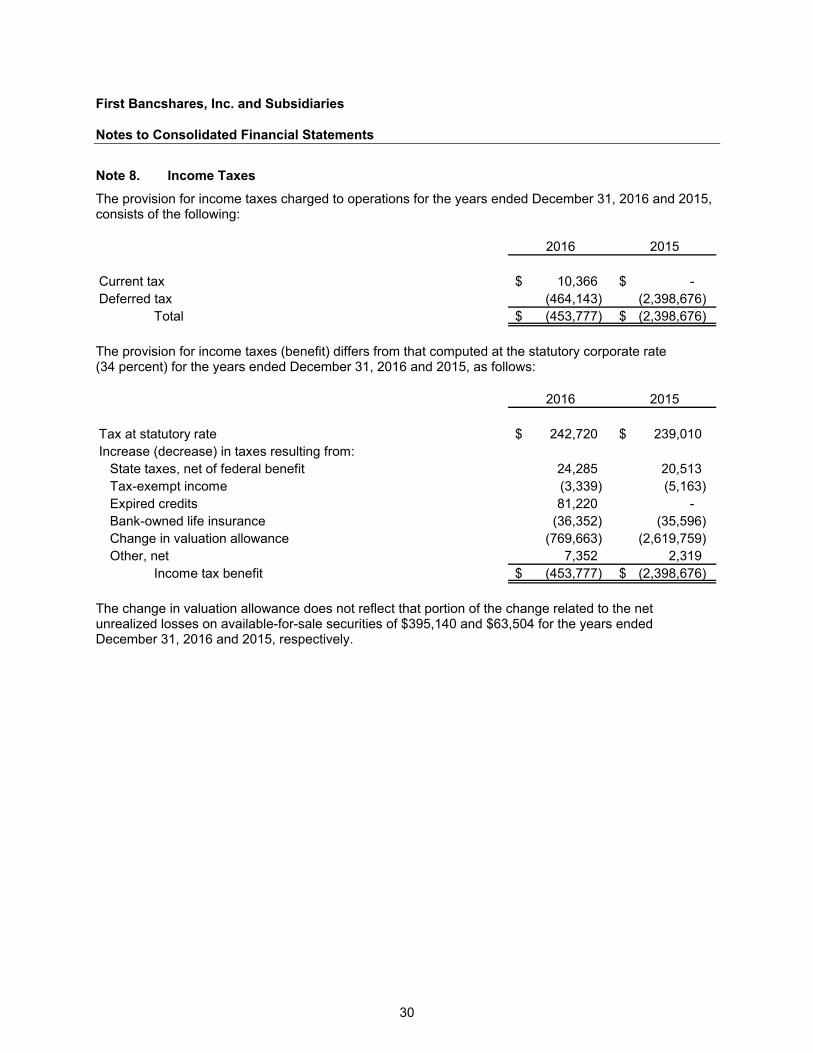
Note 8. Income Taxes The provision for income taxes charged to operations for the years ended December 31, 2016 and 2015, consists of the following:
2016 2015
Current tax 10,366 $ -$ Deferred tax (464,143) (2,398,676)
Total (453,777) $ (2,398,676) $
The provision for income taxes (benefit) differs from that computed at the statutory corporate rate (34 percent) for the years ended December 31, 2016 and 2015, as follows:
2016 2015
Tax at statutory rate 242,720 $ 239,010 $ Increase (decrease) in taxes resulting from:
State taxes, net of federal benefit 24,285 20,513 Tax-exempt income (3,339) (5,163) Expired credits 81,220 - Bank-owned life insurance (36,352) (35,596) Change in valuation allowance (769,663) (2,619,759) Other, net 7,352 2,319
Income tax benefit (453,777) $ (2,398,676) $
The change in valuation allowance does not reflect that portion of the change related to the net unrealized losses on available-for-sale securities of $395,140 and $63,504 for the years ended December 31, 2016 and 2015, respectively.
30
First Bancshares, Inc. and Subsidiaries
Notes to Consolidated Financial Statements
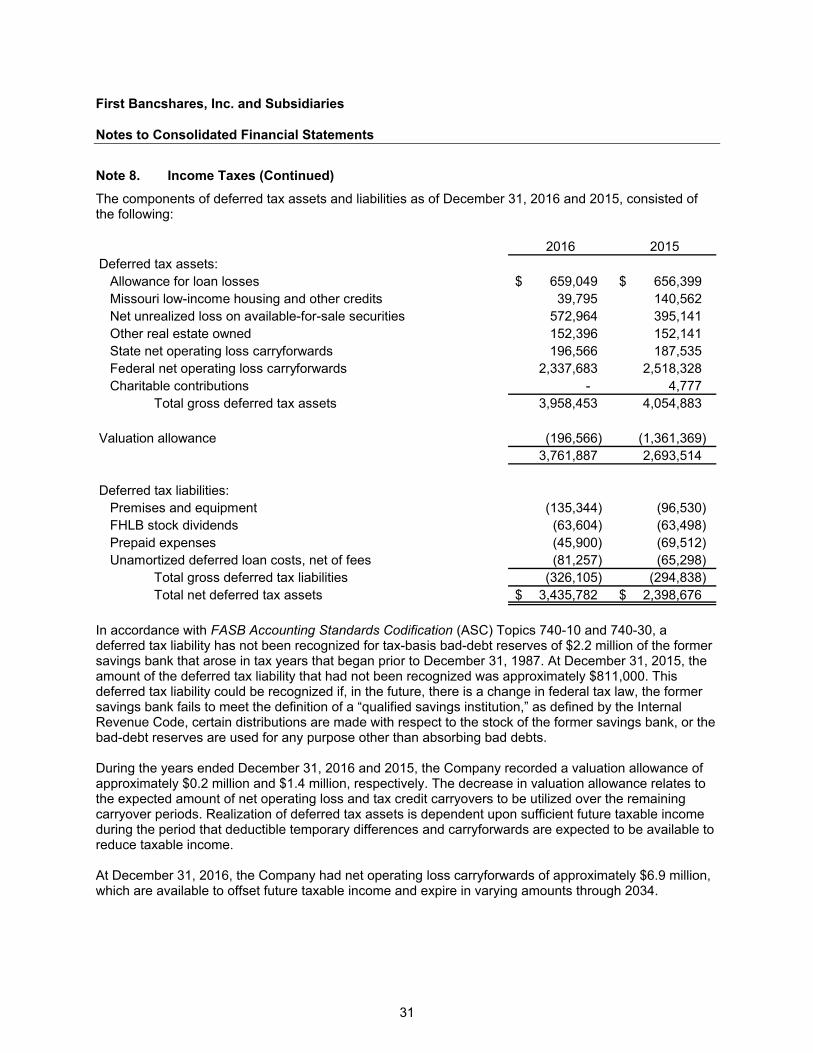
Note 8. Income Taxes (Continued) The components of deferred tax assets and liabilities as of December 31, 2016 and 2015, consisted of the following:
2016 2015Deferred tax assets:
Allowance for loan losses 659,049 $ 656,399 $ Missouri low-income housing and other credits 39,795 140,562 Net unrealized loss on available-for-sale securities 572,964 395,141 Other real estate owned 152,396 152,141 State net operating loss carryforwards 196,566 187,535 Federal net operating loss carryforwards 2,337,683 2,518,328 Charitable contributions - 4,777
Total gross deferred tax assets 3,958,453 4,054,883
Valuation allowance (196,566) (1,361,369) 3,761,887 2,693,514
Deferred tax liabilities:Premises and equipment (135,344) (96,530) FHLB stock dividends (63,604) (63,498) Prepaid expenses (45,900) (69,512) Unamortized deferred loan costs, net of fees (81,257) (65,298)
Total gross deferred tax liabilities (326,105) (294,838) Total net deferred tax assets 3,435,782 $ 2,398,676 $
In accordance with FASB Accounting Standards Codification (ASC) Topics 740-10 and 740-30, a deferred tax liability has not been recognized for tax-basis bad-debt reserves of $2.2 million of the former savings bank that arose in tax years that began prior to December 31, 1987. At December 31, 2015, the amount of the deferred tax liability that had not been recognized was approximately $811,000. This deferred tax liability could be recognized if, in the future, there is a change in federal tax law, the former savings bank fails to meet the definition of a “qualified savings institution,” as defined by the Internal Revenue Code, certain distributions are made with respect to the stock of the former savings bank, or the bad-debt reserves are used for any purpose other than absorbing bad debts.
During the years ended December 31, 2016 and 2015, the Company recorded a valuation allowance of approximately $0.2 million and $1.4 million, respectively. The decrease in valuation allowance relates to the expected amount of net operating loss and tax credit carryovers to be utilized over the remaining carryover periods. Realization of deferred tax assets is dependent upon sufficient future taxable income during the period that deductible temporary differences and carryforwards are expected to be available to reduce taxable income.
At December 31, 2016, the Company had net operating loss carryforwards of approximately $6.9 million, which are available to offset future taxable income and expire in varying amounts through 2034.
31
First Bancshares, Inc. and Subsidiaries
Notes to Consolidated Financial Statements
Note 9. Employee Benefit Plans The Bank had participated in a multiple-employer defined benefit pension plan covering substantially all employees. In fiscal 2006, the Bank opted to freeze the plan. Participants in the plan became entitled to their vested benefits at the date it was frozen. The Bank limited its future obligations to the funding amount required by the annual actuarial evaluation of the plan and administrative costs. No participants will be added to the plan. Pension expense for the years ended December 31, 2016 and 2015, was approximately $112,977 and $150,955, respectively. This plan is not subject to the requirements of ASC Topics 715 and 958.
The First Home Bank Employee Stock Ownership and 401(k) Plan covers all employees that are age 21 and have completed six months of service. The Company makes contributions on a matching basis 100 percent on the first 3 percent of employee deferrals and 50 percent on the next 2 percent of employee deferrals. Expense for the employee stock ownership and 401(k) plan for the years ended December 31, 2016 and 2015, was $73,211 and $70,158, respectively.
Compensation expense for stock-based awards is recorded over the vesting period at the fair values of the award at the time of the grant. The recording of such compensation began on July 1, 2006, for shares not yet vested as of that date and for all new grants subsequent to that date. The exercise price of options granted under the Company’s incentive plans is equal to the fair market value of the underlying stock at the grant date. The Company assumes no projected forfeiture rates on its stock-based compensation.
The Company’s 2004 Stock Option and Incentive Plan has authorized the grant of options to certain officers, employees and directors for up to 100,000 shares of the Company’s common stock. All options granted have 10-year terms and vest and become exercisable ratably over five years following the date of grant. The plan was approved by shareholders in October 2004. At December 31, 2016, there were 78,000 shares of stock available for grant under the plan.
The Company’s 2004 Management Recognition Plan has authorized the award of shares to certain officers, employees and directors for up to 50,000 shares of the Company’s common stock. All shares awarded will have a restricted period to be determined by the Company’s Compensation Committee. The restricted period shall not be less than three years if the award is time based, or not less than one year if performance based. The plan was approved by shareholders in October 2004. No shares have been issued from this plan.
No options were granted during the years ended December 31, 2016 and 2015. The last options were granted in fiscal 2007.
32
First Bancshares, Inc. and Subsidiaries
Notes to Consolidated Financial Statements
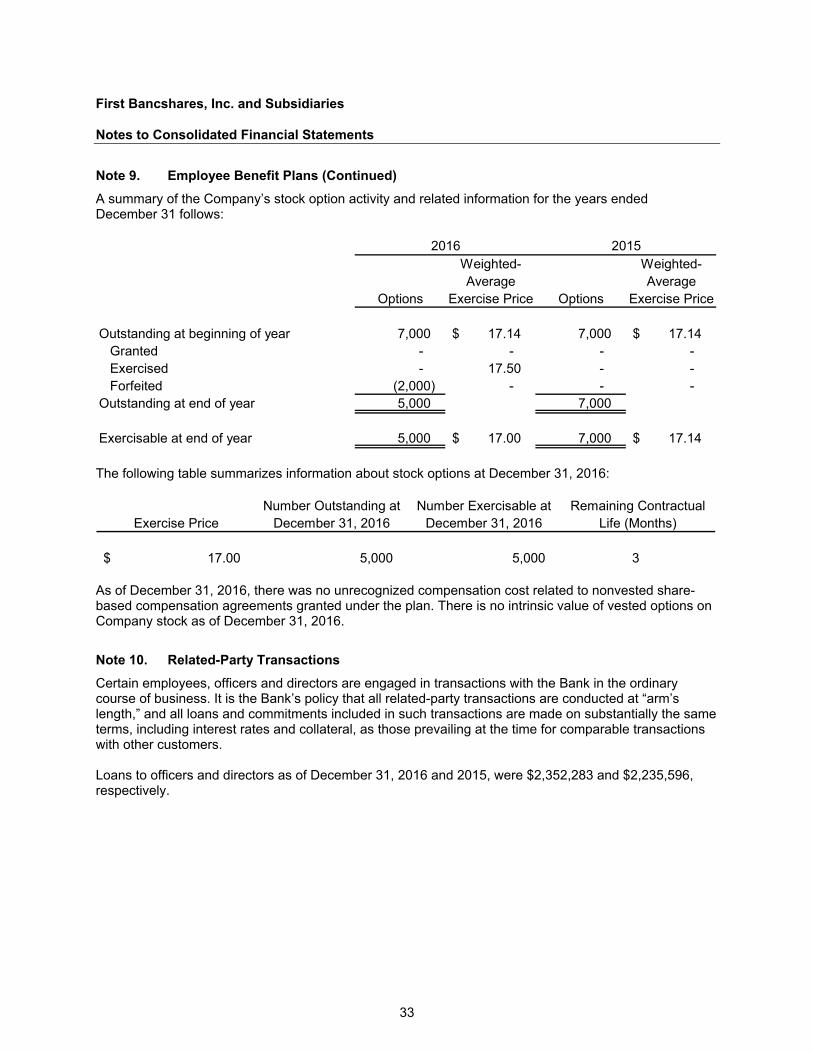
Note 9. Employee Benefit Plans (Continued) A summary of the Company’s stock option activity and related information for the years ended December 31 follows:
Weighted- Weighted-Average Average
Options Exercise Price Options Exercise Price
Outstanding at beginning of year 7,000 17.14 $ 7,000 17.14 $Granted - - - - Exercised - 17.50 - - Forfeited (2,000) - - -
Outstanding at end of year 5,000 7,000
Exercisable at end of year 5,000 17.00 $ 7,000 17.14 $
2016 2015
The following table summarizes information about stock options at December 31, 2016:
Number Outstanding at Number Exercisable at Remaining ContractualExercise Price December 31, 2016 December 31, 2016 Life (Months)
17.00$ 5,000 5,000 3
As of December 31, 2016, there was no unrecognized compensation cost related to nonvested share-based compensation agreements granted under the plan. There is no intrinsic value of vested options on Company stock as of December 31, 2016.
Note 10. Related-Party Transactions Certain employees, officers and directors are engaged in transactions with the Bank in the ordinary course of business. It is the Bank’s policy that all related-party transactions are conducted at “arm’s length,” and all loans and commitments included in such transactions are made on substantially the same terms, including interest rates and collateral, as those prevailing at the time for comparable transactions with other customers.
Loans to officers and directors as of December 31, 2016 and 2015, were $2,352,283 and $2,235,596, respectively.
33
First Bancshares, Inc. and Subsidiaries
Notes to Consolidated Financial Statements
Note 11. Commitments and Contingencies In the ordinary course of business, the Bank has various outstanding commitments that are not reflected in the accompanying consolidated financial statements. The principal commitments of the Bank are as follows:
Letters of credit: Outstanding standby letters of credit were approximately $11,000 at December 31, 2016 and 2015.
Loan commitments: The Bank had outstanding firm commitments to originate loans of approximately $5,737,000 and $2,795,000 at December 31, 2016 and 2015, respectively.
Lines of credit: The unused portion of lines of credit was approximately $12,907,000 and $12,996,000 at December 31, 2016 and 2015, respectively.
Commitments to extend credit are agreements to lend to a customer as long as there is no violation of any condition established in the contract. Commitments generally have fixed expiration dates or other termination clauses and may require payment of a fee. Since many of the commitments are expected to expire without being drawn upon, the total commitment amounts do not necessarily represent future cash requirements. The Company evaluates each customer’s creditworthiness on a case-by-case basis. The amount of collateral obtained, if deemed necessary by the Company upon extension of credit, is based on management’s credit evaluation of the party. Collateral held varies, but may include accounts receivable, crops, livestock, inventory, property and equipment, residential and commercial real estate as well as income-producing commercial properties.
Standby letters of credit are conditional commitments issued by the Company to guarantee the performance of a customer to a third party. Those guarantees are primarily issued to support public and private borrowing arrangements, including commercial paper, bond financing and similar transactions.
None of the guarantees extend longer than one year. The credit risk involved in issuing letters of credit is essentially the same as that involved in extending loan facilities to customers. Collateral held varies as specified above and is required in instances which the Company deems necessary. All of the standby letters of credit outstanding at December 31, 2016, were collateralized. No amounts were recorded as liabilities for the year ended December 31, 2016 or 2015, for the Company’s potential obligations under these guarantees.
In the normal course of business, the Company is involved in various legal proceedings. In the opinion of management, any liability resulting from such proceedings would not have a material adverse effect on the Company’s consolidated financial statements.
Note 12. Regulatory Matters The Bank is subject to various regulatory capital requirements administered by its primary federal regulator, the FDIC. Failure to meet the minimum regulatory capital requirements can initiate certain mandatory and possible additional discretionary actions by regulators that, if undertaken, could have a direct material effect on the Bank and the consolidated financial statements. Under the regulatory capital adequacy guidelines and the regulatory framework for prompt corrective action, the Bank must meet specific capital guidelines involving quantitative measures of the Bank’s assets, liabilities and certain off-balance-sheet items as calculated under regulatory accounting practices. The Bank’s capital amounts and classification under the prompt corrective action guidelines are also subject to qualitative judgments by the regulators about components, risk weightings and other factors.
34
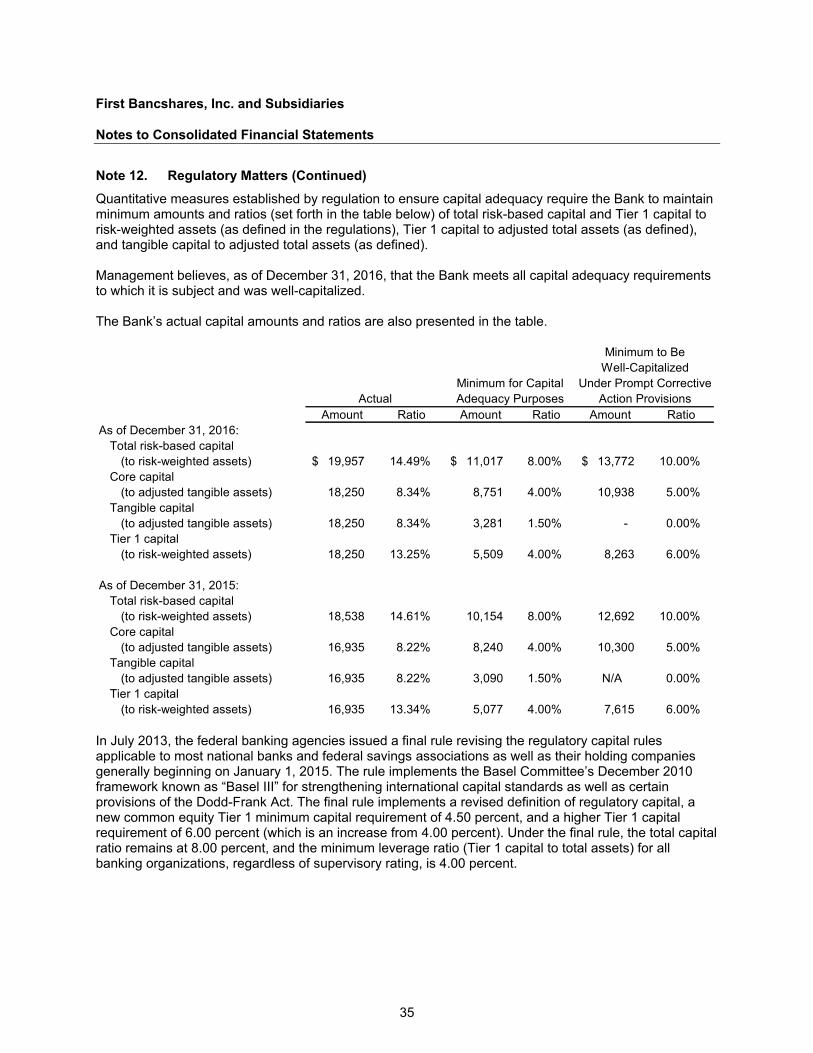
First Bancshares, Inc. and Subsidiaries
Notes to Consolidated Financial Statements
Note 12. Regulatory Matters (Continued) Quantitative measures established by regulation to ensure capital adequacy require the Bank to maintain minimum amounts and ratios (set forth in the table below) of total risk-based capital and Tier 1 capital to risk-weighted assets (as defined in the regulations), Tier 1 capital to adjusted total assets (as defined), and tangible capital to adjusted total assets (as defined).
Management believes, as of December 31, 2016, that the Bank meets all capital adequacy requirements to which it is subject and was well-capitalized.
The Bank’s actual capital amounts and ratios are also presented in the table.
Amount Ratio Amount Ratio Amount RatioAs of December 31, 2016:
Total risk-based capital(to risk-weighted assets) 19,957 $ 14.49% 11,017 $ 8.00% 13,772 $ 10.00%
Core capital(to adjusted tangible assets) 18,250 8.34% 8,751 4.00% 10,938 5.00%
Tangible capital(to adjusted tangible assets) 18,250 8.34% 3,281 1.50% - 0.00%
Tier 1 capital(to risk-weighted assets) 18,250 13.25% 5,509 4.00% 8,263 6.00%
As of December 31, 2015:Total risk-based capital
(to risk-weighted assets) 18,538 14.61% 10,154 8.00% 12,692 10.00%Core capital
(to adjusted tangible assets) 16,935 8.22% 8,240 4.00% 10,300 5.00%Tangible capital
(to adjusted tangible assets) 16,935 8.22% 3,090 1.50% N/A 0.00%Tier 1 capital
(to risk-weighted assets) 16,935 13.34% 5,077 4.00% 7,615 6.00%
Actual
Minimum to BeWell-Capitalized
Under Prompt CorrectiveAction Provisions
Minimum for CapitalAdequacy Purposes
In July 2013, the federal banking agencies issued a final rule revising the regulatory capital rules applicable to most national banks and federal savings associations as well as their holding companies generally beginning on January 1, 2015. The rule implements the Basel Committee’s December 2010 framework known as “Basel III” for strengthening international capital standards as well as certain provisions of the Dodd-Frank Act. The final rule implements a revised definition of regulatory capital, a new common equity Tier 1 minimum capital requirement of 4.50 percent, and a higher Tier 1 capital requirement of 6.00 percent (which is an increase from 4.00 percent). Under the final rule, the total capital ratio remains at 8.00 percent, and the minimum leverage ratio (Tier 1 capital to total assets) for all banking organizations, regardless of supervisory rating, is 4.00 percent.
35
First Bancshares, Inc. and Subsidiaries
Notes to Consolidated Financial Statements
Note 12. Regulatory Matters (Continued) Additionally, under the final rule, in order to avoid limitations on capital distributions, including dividend payments and certain discretionary bonus payments to executive officers, a banking organization must hold a capital conservation buffer composed of common equity Tier 1 capital above its minimum risk-based capital requirements. The buffer is measured relative to risk-weighted assets. The final rule also enhances risk sensitivity and addresses weaknesses identified by the regulators over recent years with the measure of risk-weighted assets, including through new measures of creditworthiness to replace references to credit ratings, consistent with the requirements of the Dodd-Frank Act.
Except for the largest internationally active banking organizations (which are subject to the “advanced approaches” provisions of the final rule), the new minimum capital requirements generally became effective for all banking organizations on January 1, 2015, whereas the capital conservation buffer and the deductions from common equity Tier 1 capital phase in over time, beginning on January 1, 2016. Similarly, nonqualifying capital instruments phase out over time.
Note 13. Fair Value Measurements Accounting guidance on fair value measurements defines fair value, establishes a framework for measuring fair value using a hierarchy system and requires disclosure of fair value measurements. The hierarchy is intended to maximize the use of observable inputs and minimize the use of unobservable inputs and includes three levels based on upon the valuation techniques used. The three levels are as follows:
Level 1: Quoted prices (unadjusted) for identical assets or liabilities in active markets that the entity has the ability to access as of the measurement date
Level 2: Significant observable inputs other than the Level 1 prices such as quoted prices for similar assets or liabilities; quoted prices in markets that are not active; or other inputs that are observable or can be corroborated by observable market data
Level 3: Significant unobservable inputs that reflect a reporting entity’s own assumptions about the assumptions that market participants would use in pricing an asset or liability
A description of the valuation methodologies used for assets measured at fair value, as well as the general classification of such instruments pursuant to the valuation hierarchy, is set forth below.
Assets recorded at fair value on a recurring basis: A description of the valuation methodologies used for assets measured at fair value on a recurring basis, as well as the general classification of such instruments pursuant to the valuation hierarchy, is set forth below.
Securities available for sale: Where quoted prices are available in an active market, securities are classified within Level 1 of the valuation hierarchy. Level 1 securities would include highly liquid government bonds and exchange-traded equities. If quoted market prices are not available, then fair values are estimated by using pricing models, quoted prices of securities with similar characteristics, or discounted cash flows. Level 2 securities would include U.S. agency securities, mortgage-backed agency securities, obligations of states and political subdivisions and certain corporate, asset-backed and other securities. In certain cases where there is limited activity of less transparency around the input to the valuation, securities are classified within Level 3 of the valuation hierarchy.
36
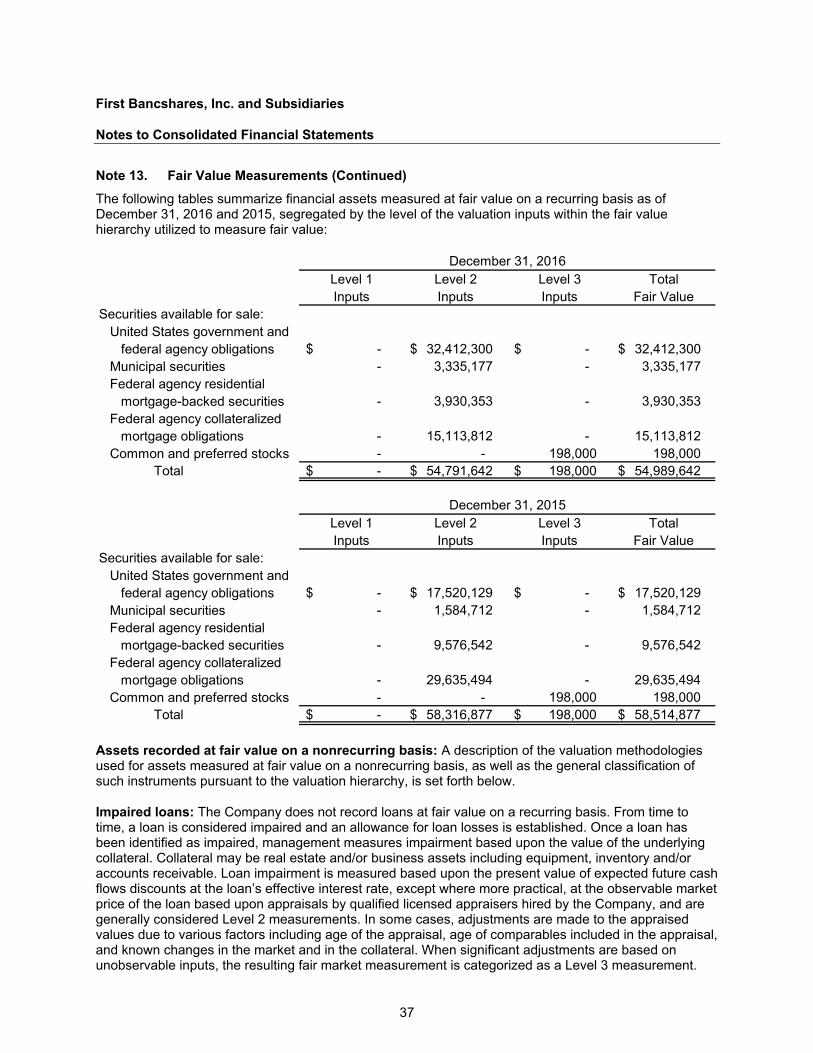
First Bancshares, Inc. and Subsidiaries
Notes to Consolidated Financial Statements
Note 13. Fair Value Measurements (Continued) The following tables summarize financial assets measured at fair value on a recurring basis as of December 31, 2016 and 2015, segregated by the level of the valuation inputs within the fair value hierarchy utilized to measure fair value:
Level 1 Level 2 Level 3 TotalInputs Inputs Inputs Fair Value
Securities available for sale:United States government and
federal agency obligations -$ 32,412,300 $ -$ 32,412,300 $Municipal securities - 3,335,177 - 3,335,177 Federal agency residential
mortgage-backed securities - 3,930,353 - 3,930,353 Federal agency collateralized
mortgage obligations - 15,113,812 - 15,113,812 Common and preferred stocks - - 198,000 198,000
Total -$ 54,791,642 $ 198,000 $ 54,989,642 $
Level 1 Level 2 Level 3 TotalInputs Inputs Inputs Fair Value
Securities available for sale:United States government and
federal agency obligations -$ 17,520,129 $ -$ 17,520,129 $Municipal securities - 1,584,712 - 1,584,712 Federal agency residential
mortgage-backed securities - 9,576,542 - 9,576,542 Federal agency collateralized
mortgage obligations - 29,635,494 - 29,635,494 Common and preferred stocks - - 198,000 198,000
Total -$ 58,316,877 $ 198,000 $ 58,514,877 $
December 31, 2016
December 31, 2015
Assets recorded at fair value on a nonrecurring basis: A description of the valuation methodologies used for assets measured at fair value on a nonrecurring basis, as well as the general classification of such instruments pursuant to the valuation hierarchy, is set forth below.
Impaired loans: The Company does not record loans at fair value on a recurring basis. From time to time, a loan is considered impaired and an allowance for loan losses is established. Once a loan has been identified as impaired, management measures impairment based upon the value of the underlying collateral. Collateral may be real estate and/or business assets including equipment, inventory and/or accounts receivable. Loan impairment is measured based upon the present value of expected future cash flows discounts at the loan’s effective interest rate, except where more practical, at the observable market price of the loan based upon appraisals by qualified licensed appraisers hired by the Company, and are generally considered Level 2 measurements. In some cases, adjustments are made to the appraised values due to various factors including age of the appraisal, age of comparables included in the appraisal, and known changes in the market and in the collateral. When significant adjustments are based on unobservable inputs, the resulting fair market measurement is categorized as a Level 3 measurement.
37
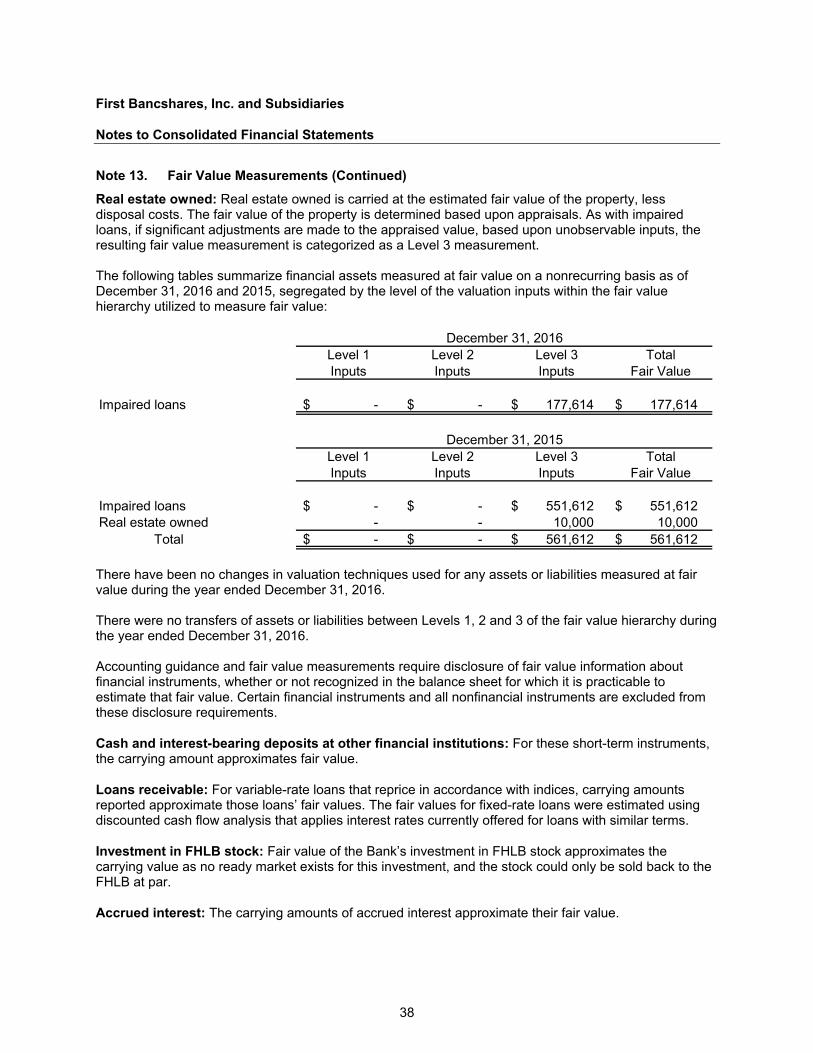
First Bancshares, Inc. and Subsidiaries
Notes to Consolidated Financial Statements
Note 13. Fair Value Measurements (Continued)
Real estate owned: Real estate owned is carried at the estimated fair value of the property, less disposal costs. The fair value of the property is determined based upon appraisals. As with impaired loans, if significant adjustments are made to the appraised value, based upon unobservable inputs, the resulting fair value measurement is categorized as a Level 3 measurement.
The following tables summarize financial assets measured at fair value on a nonrecurring basis as of December 31, 2016 and 2015, segregated by the level of the valuation inputs within the fair value hierarchy utilized to measure fair value:
Level 1 Level 2 Level 3 TotalInputs Inputs Inputs Fair Value
Impaired loans -$ -$ 177,614 $ 177,614 $
Level 1 Level 2 Level 3 TotalInputs Inputs Inputs Fair Value
Impaired loans -$ -$ 551,612 $ 551,612 $ Real estate owned - - 10,000 10,000
Total -$ -$ 561,612 $ 561,612 $
December 31, 2016
December 31, 2015
There have been no changes in valuation techniques used for any assets or liabilities measured at fair value during the year ended December 31, 2016.
There were no transfers of assets or liabilities between Levels 1, 2 and 3 of the fair value hierarchy during the year ended December 31, 2016.
Accounting guidance and fair value measurements require disclosure of fair value information about financial instruments, whether or not recognized in the balance sheet for which it is practicable to estimate that fair value. Certain financial instruments and all nonfinancial instruments are excluded from these disclosure requirements.
Cash and interest-bearing deposits at other financial institutions: For these short-term instruments, the carrying amount approximates fair value.
Loans receivable: For variable-rate loans that reprice in accordance with indices, carrying amounts reported approximate those loans’ fair values. The fair values for fixed-rate loans were estimated using discounted cash flow analysis that applies interest rates currently offered for loans with similar terms.
Investment in FHLB stock: Fair value of the Bank’s investment in FHLB stock approximates the carrying value as no ready market exists for this investment, and the stock could only be sold back to the FHLB at par.
Accrued interest: The carrying amounts of accrued interest approximate their fair value.
38
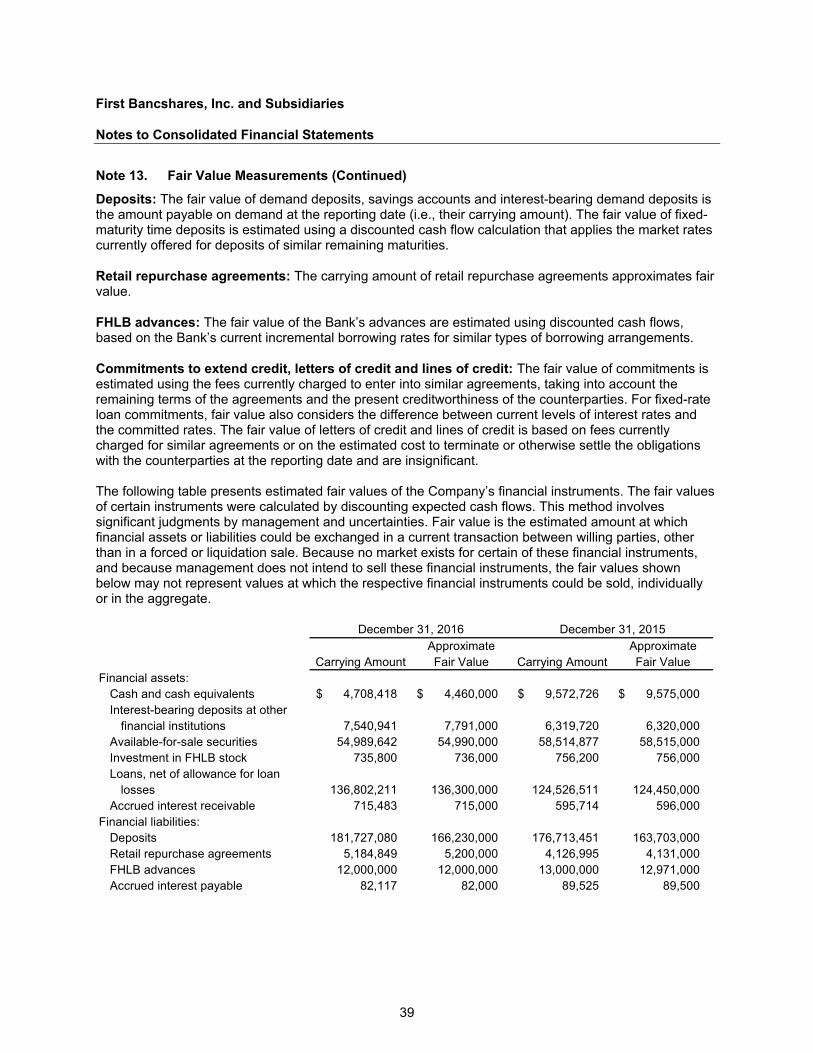
First Bancshares, Inc. and Subsidiaries
Notes to Consolidated Financial Statements
Note 13. Fair Value Measurements (Continued)
Deposits: The fair value of demand deposits, savings accounts and interest-bearing demand deposits is the amount payable on demand at the reporting date (i.e., their carrying amount). The fair value of fixed- maturity time deposits is estimated using a discounted cash flow calculation that applies the market rates currently offered for deposits of similar remaining maturities.
Retail repurchase agreements: The carrying amount of retail repurchase agreements approximates fair value.
FHLB advances: The fair value of the Bank’s advances are estimated using discounted cash flows, based on the Bank’s current incremental borrowing rates for similar types of borrowing arrangements.
Commitments to extend credit, letters of credit and lines of credit: The fair value of commitments is estimated using the fees currently charged to enter into similar agreements, taking into account the remaining terms of the agreements and the present creditworthiness of the counterparties. For fixed-rate loan commitments, fair value also considers the difference between current levels of interest rates and the committed rates. The fair value of letters of credit and lines of credit is based on fees currently charged for similar agreements or on the estimated cost to terminate or otherwise settle the obligations with the counterparties at the reporting date and are insignificant.
The following table presents estimated fair values of the Company’s financial instruments. The fair values of certain instruments were calculated by discounting expected cash flows. This method involves significant judgments by management and uncertainties. Fair value is the estimated amount at which financial assets or liabilities could be exchanged in a current transaction between willing parties, other than in a forced or liquidation sale. Because no market exists for certain of these financial instruments, and because management does not intend to sell these financial instruments, the fair values shown below may not represent values at which the respective financial instruments could be sold, individually or in the aggregate.
Approximate ApproximateCarrying Amount Fair Value Carrying Amount Fair Value
Financial assets:Cash and cash equivalents 4,708,418 $ 4,460,000 $ 9,572,726 $ 9,575,000 $ Interest-bearing deposits at other
financial institutions 7,540,941 7,791,000 6,319,720 6,320,000 Available-for-sale securities 54,989,642 54,990,000 58,514,877 58,515,000 Investment in FHLB stock 735,800 736,000 756,200 756,000 Loans, net of allowance for loan
losses 136,802,211 136,300,000 124,526,511 124,450,000 Accrued interest receivable 715,483 715,000 595,714 596,000
Financial liabilities:Deposits 181,727,080 166,230,000 176,713,451 163,703,000 Retail repurchase agreements 5,184,849 5,200,000 4,126,995 4,131,000 FHLB advances 12,000,000 12,000,000 13,000,000 12,971,000 Accrued interest payable 82,117 82,000 89,525 89,500
December 31, 2016 December 31, 2015
39
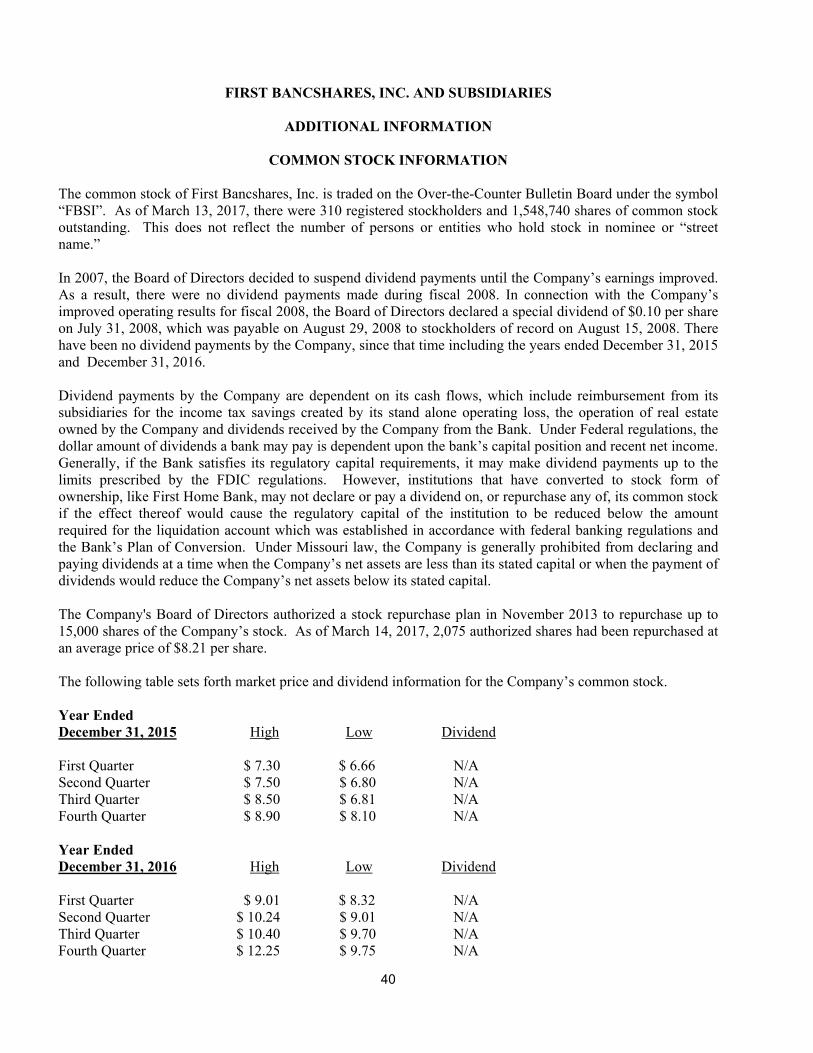
40
FIRST BANCSHARES, INC. AND SUBSIDIARIES
ADDITIONAL INFORMATION
COMMON STOCK INFORMATION The common stock of First Bancshares, Inc. is traded on the Over-the-Counter Bulletin Board under the symbol “FBSI”. As of March 13, 2017, there were 310 registered stockholders and 1,548,740 shares of common stock outstanding. This does not reflect the number of persons or entities who hold stock in nominee or “street name.” In 2007, the Board of Directors decided to suspend dividend payments until the Company’s earnings improved. As a result, there were no dividend payments made during fiscal 2008. In connection with the Company’s improved operating results for fiscal 2008, the Board of Directors declared a special dividend of $0.10 per share on July 31, 2008, which was payable on August 29, 2008 to stockholders of record on August 15, 2008. There have been no dividend payments by the Company, since that time including the years ended December 31, 2015 and December 31, 2016. Dividend payments by the Company are dependent on its cash flows, which include reimbursement from its subsidiaries for the income tax savings created by its stand alone operating loss, the operation of real estate owned by the Company and dividends received by the Company from the Bank. Under Federal regulations, the dollar amount of dividends a bank may pay is dependent upon the bank’s capital position and recent net income. Generally, if the Bank satisfies its regulatory capital requirements, it may make dividend payments up to the limits prescribed by the FDIC regulations. However, institutions that have converted to stock form of ownership, like First Home Bank, may not declare or pay a dividend on, or repurchase any of, its common stock if the effect thereof would cause the regulatory capital of the institution to be reduced below the amount required for the liquidation account which was established in accordance with federal banking regulations and the Bank’s Plan of Conversion. Under Missouri law, the Company is generally prohibited from declaring and paying dividends at a time when the Company’s net assets are less than its stated capital or when the payment of dividends would reduce the Company’s net assets below its stated capital. The Company's Board of Directors authorized a stock repurchase plan in November 2013 to repurchase up to 15,000 shares of the Company’s stock. As of March 14, 2017, 2,075 authorized shares had been repurchased at an average price of $8.21 per share. The following table sets forth market price and dividend information for the Company’s common stock. Year Ended December 31, 2015 High Low Dividend First Quarter $ 7.30 $ 6.66 N/A Second Quarter $ 7.50 $ 6.80 N/A Third Quarter $ 8.50 $ 6.81 N/A Fourth Quarter $ 8.90 $ 8.10 N/A Year Ended December 31, 2016 High Low Dividend First Quarter $ 9.01 $ 8.32 N/A Second Quarter $ 10.24 $ 9.01 N/A Third Quarter $ 10.40 $ 9.70 N/A Fourth Quarter $ 12.25 $ 9.75 N/A

41
DIRECTORS AND EXECUTIVE OFFICERS
FIRST BANCSHARES, INC. FIRST HOME BANK DIRECTORS: DIRECTORS: R. Bradley Weaver, R. Bradley Weaver, Chairman, President, and Chairman, President, and Chief Executive Officer Chief Executive Officer Thomas M. Sutherland Thomas M. Sutherland One of the owners and operators of Sutherlands One of the owners and operators of Sutherlands Home Improvement Centers group of stores Home Improvement Centers group of stores D. Mitch Ashlock D. Mitch Ashlock Chairman, President and Chief Executive Officer Chairman, President and Chief Executive Officer First Federal Savings and Loan Bank of Olathe First Federal Savings and Loan Bank of Olathe Billy E. Hixon Billy E. Hixon Retired partner National CPA firm of Retired partner National CPA firm of BKD, LLP BKD, LLP Robert J. Breidenthal, Jr. Robert J. Breidenthal, Jr. Director Director Security Bank of Kansas City Security Bank of Kansas City John G. Moody John G. Moody Attorney at Law Attorney at Law Pointer Law Office Pointer Law Office Mark E. Gardner Mark E. Gardner President President Gardner Capital Gardner Capital Bradley M. Segebarth Bradley M. Segebarth Chief Operating Officer Chief Operating Officer Lebanon Auto Transport Lebanon Auto Transport Robert M. Alexander Robert M. Alexander Chairman, CEO and principal stockholder Chairman, CEO and principal stockholder Stockmens Bank and State Bank of Bartley Stockmens Bank and State Bank of Bartley OFFICERS: OFFICERS: R. Bradley Weaver R. Bradley Weaver Chairman, President, and Chief Executive Officer Chairman, President, and Chief Executive Officer Jeffrey C. Palmer Joseph E. James Executive Vice President and Chief Financial Officer Executive Vice President and Senior Lending Officer Shannon Peterson Jeffrey C. Palmer Corporate Secretary Executive Vice President and Chief Financial Officer Shannon Peterson Corporate Secretary

42
CORPORATE INFORMATION
CORPORATE HEADQUARTERS: TRANSFER AGENT: 142 East First Street Computershare P.O. Box 777 P.O. Box 43078 Mountain Grove, Missouri 65711 Providence, RI 02940 (800) 942-5909 INDEPENDENT AUDITORS: RSM US, LLP COMMON STOCK: Kansas City, Missouri Traded on the Over-the-Counter Bulletin OTCQB Symbol: FstBksh: FBSI GENERAL COUNSEL: Millington, Glass, Love & Young Springfield, Missouri SPECIAL COUNSEL: Breyer & Associates PC McLean, Virginia
ANNUAL MEETING The Annual Meeting of Stockholders will be held Friday, April 21, 2017, at 1:00 p.m., Central Time, at the
DoubleTree Hotel located at 2431N. Glenstone, Springfield, Missouri.


First Home Bank
is a wholly owned subsidiary of
First Bancshares, Inc.
With 8 convenient locations to
serve the area residents of
south central Missouri.
First Bancshares, Inc.P.O. Box 777
Mountain Grove, MO 65711
Phone: 417-926-5151Fax: 417-926-4362
www.fhsb.com