UNITED BANCSHARES, INC. 2014 ANNUAL REPORT
80
UNITED BANCSHARES, INC. 2014 ANNUAL REPORT
Transcript of UNITED BANCSHARES, INC. 2014 ANNUAL REPORT

U N I T E D B A N C S H A R E S , I N C .
2 0 1 4 A N N U A L R E P O R T

OUR MISSION
The primary mission of United Bank of Philadelphia, a commercial
bank, is to deliver excellent customer service at a profit and to
make United Bank of Philadelphia the “hometown” bank of choice.
Our goal is to foster community development by providing quality
personalized comprehensive banking services to businesses and
individuals in the Greater Philadelphia region, with a special
sensitivity to blacks, hispanics, asians and women.
About the cover: Urban Affairs Coalition summer interns with President and CEO, Evelyn Smalls.(From left) Ousmane Sow, Tierra Slater, Ciani Ross, Evelyn Smalls, Shyfierah Werts-Emerson, Darius Thai, Ahmand Williams and Shantel Perez
TABLE OF CONTENTS
Message from the President and CEO 5
#SoMuchMoreThanBanking 6
Leadership Team 8
Board of Directors 9
Management’s Discussion and Analysis 11
Report of Independent Registered Public Accounting Firm 35
Financial Statements 40
Small Business Products and Services 77
Corporate Information 78


2 0 1 4 A N N U A L R E P O R T 5
Dear Friends,
Over two decades ago, each of you played a pivotal role in the formation of the United Bank of Philadelphia (the “Bank”). You chose to invest in a Vision to create a minority-owned community bank that would be Mission-driven for the purpose of ensuring that the minority communities have access to affordable banking products that would improve their economic conditions. Inherent in this Mission-driven organization was that this Bank would dedicate itself to transformational work which is “so much more than banking.”
The beginning years set the stage for this transformational journey by gathering deposits from persons who became first time bank account holders. Parents and grandparents opened savings accounts for their children and grandchildren with college in mind; eighteen years later these savings propelled many students into college. The faith community and not for profit sector benefitted from this Bank’s interest and knowledge about the presence and stability these institutions brought to the communities. Extensions of credit expanded and or rehabbed properties increasing their capacity to offer more holistic programming bridging economic, educational and service gaps. And yes, they created and retained jobs in the process. While the Bank’s past is important, the Board of Directors and management had to develop a new business model re-engineering the institution as a “business bank” and we are beginning to see improved results coming into view.
With entrepreneurship on the rise in this region, more opportunities are abounding for small businesses. This Bank is prepared to utilize its expertise as a “small business” to ensure that access to capital is available to increase the retention and sustainability of these businesses. It is extremely important for this Bank to quantify outcomes and impact. We see impact through these small businesses that create and retain jobs. We also see the altruistic nature of business owners who reach back to train and teach persons in the communities. Armed with enhanced skills and capacity families are able to thrive and not just survive. The youth continue to be important to us. We were privileged to have 7 talented interns who were introduced to commercial lending who in turn, wowed us with their talent in a variety of disciplines while making a huge impact… “so much more than interns.”
Finally, just as you expanded your Vision in the beginning to become investors and supporters, we ask that you look beyond the obvious returns and see the countless dollars your Bank has extended over the years; how lives have been transformed and the increased number of persons participating in the financial mainstream away from predators; you, our valued shareholders, provided the seeding for this enterprise and we hope that you can see more clearly your remarkable role in “so much more than banking.”
Sincerely,
Evelyn F. SmallsPresident and Chief Executive Officer
Sincerely,
L. Armstead Edwards Chairman, Board of Directors

6 U N I T E D B A N C S H A R E S , I N C .
#SoMuchMoreThanBanking.. .it’s shaping the future
In collaboration with the Urban Affairs Coalition, United Bank of Philadelphia provided internships to seven of the City of Philadelphia’s brightest students who not only received a crash course in commercial lending but experience that will help shape their future.
TeamworkCommunication
Leadership Service

2 0 1 4 A N N U A L R E P O R T 7
#SoMuchMoreThanBanking.. .it’s Transformational
Sherman McLeod (right) and business partner Don Jackson bought the Berean Institute for $2.2 million and are renovating it to add welding classes in the former gym.
United Bank of Philadelphia’s SBA financing for this project serves as the catalyst for economic development and job creation. The City of Philadelphia has one of the highest poverty rates in the country that will abated by the restoration of light “blue collar” trades that provide meaningful livable wages. With over 100 welding machines, PTTI will be the largest training center in the country and graduate more than 2,000 technicians annually.
“Give a man a fish and you feed him for a day;teach a man to fish and you feed him for a lifetime.”
PHILADELPHIA TECHNICIAN TRAINING INSTITUTE
“Berean’s legacy in job training to continue after state sells it to PTTI”
Philly.com, August 28, 2015

8 U N I T E D B A N C S H A R E S , I N C .
LEADERSHIP TEAM
Evelyn F. SmallsPresident
Chief Executive Officer
Coston CobbsSenior Vice PresidentLending and Credit
Administration
Brenda M. Hudson-NelsonExecutive Vice President Chief Financial Officer
Dimitria DavenportVice President
Community Bankingand Compliance Officer

2 0 1 4 A N N U A L R E P O R T 9
BOARD OF DIRECTORS
L. Armstead EdwardsChairman
President & CEOEdwards Entertainment
Reverend William B. MooreVice Chairman
Pastor, Tenth Memorial Baptist Church
Marionette Y. FrazierSecretary
Retired Partner/Co-founderJohn Frazier, Inc.
Joseph T. DrennanTreasurer
Retired Chief Financial OfficerUniversal Capital Management, Inc.
Bernard E. AndersonEconomist
David R. BrightRetired Executive Vice
PresidentMeridian Bancorp
Evelyn F. SmallsPresident & CEOUnited Bank of
Philadelphia
Ernest L. WrightPresident
Ernest L. Wright Construction Company
10 U N I T E D B A N C S H A R E S , I N C .
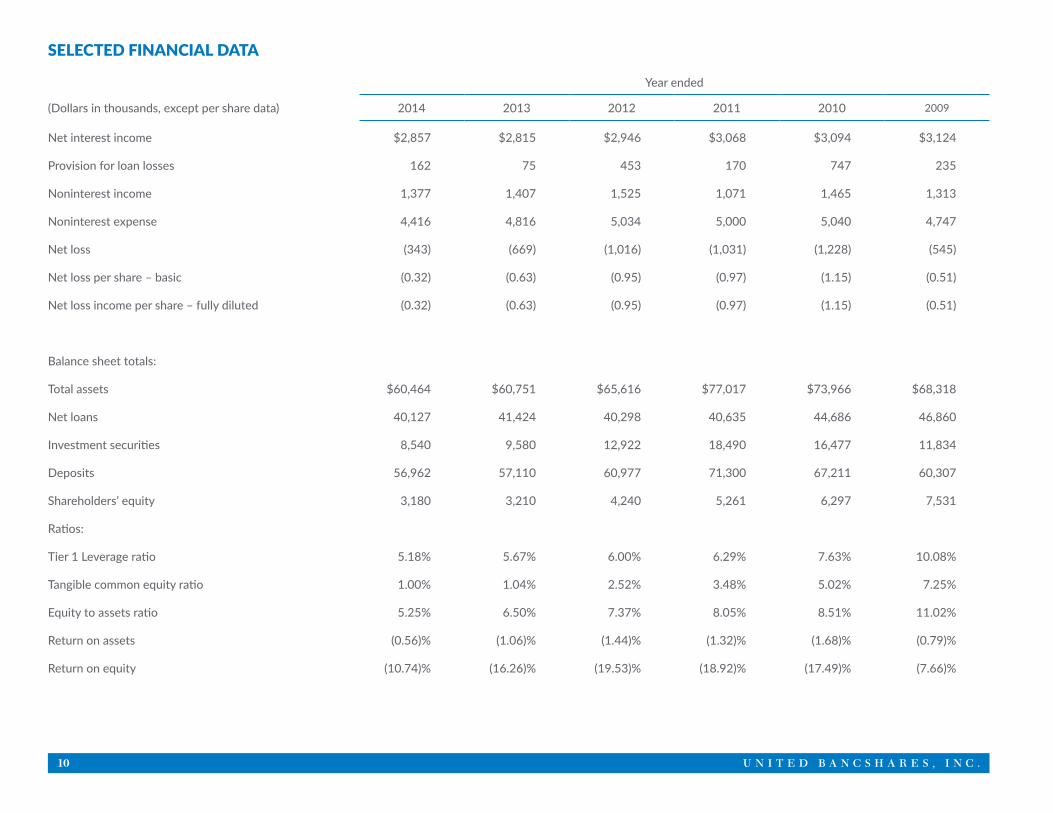
SELECTED FINANCIAL DATA
Year ended
(Dollars in thousands, except per share data) 2014 2013 2012 2011 2010 2009
Net interest income $2,857 $2,815 $2,946 $3,068 $3,094 $3,124
Provision for loan losses 162 75 453 170 747 235
Noninterest income 1,377 1,407 1,525 1,071 1,465 1,313
Noninterest expense 4,416 4,816 5,034 5,000 5,040 4,747
Net loss (343) (669) (1,016) (1,031) (1,228) (545)
Net loss per share – basic (0.32) (0.63) (0.95) (0.97) (1.15) (0.51)
Net loss income per share – fully diluted (0.32) (0.63) (0.95) (0.97) (1.15) (0.51)
Balance sheet totals:
Total assets $60,464 $60,751 $65,616 $77,017 $73,966 $68,318
Net loans 40,127 41,424 40,298 40,635 44,686 46,860
Investment securities 8,540 9,580 12,922 18,490 16,477 11,834
Deposits 56,962 57,110 60,977 71,300 67,211 60,307
Shareholders’ equity 3,180 3,210 4,240 5,261 6,297 7,531
Ratios:
Tier 1 Leverage ratio 5.18% 5.67% 6.00% 6.29% 7.63% 10.08%
Tangible common equity ratio 1.00% 1.04% 2.52% 3.48% 5.02% 7.25%
Equity to assets ratio 5.25% 6.50% 7.37% 8.05% 8.51% 11.02%
Return on assets (0.56)% (1.06)% (1.44)% (1.32)% (1.68)% (0.79)%
Return on equity (10.74)% (16.26)% (19.53)% (18.92)% (17.49)% (7.66)%
2 0 1 4 A N N U A L R E P O R T 11
MANAGEMENT’S DISCUSSION AND ANALYSIS OF FINANCIAL CONDITION AND RESULTS OF OPERATIONSBecause UBS is a bank holding company for the Bank, the financial statements in this report are prepared on a consolidated basis to include the accounts of UBS and the Bank. The purpose of this discussion is to focus on information about the Bank’s financial condition and results of operations, which is not otherwise apparent from the consolidated financial statements included in this annual report. This discussion and analysis should be read in conjunction with the financial statements presented elsewhere in this report.
Critical Accounting Policies
Allowance for Loan LossesThe allowance for loan losses is established as losses are estimated to have occurred through a provision for loan losses. Loans that are determined to be uncollectible are charged against the allowance, and subsequent recoveries, if any, are credited to the allowance. When evaluating the adequacy of the allowance, an assessment of the loan portfolio will typically include changes in the composition and volume of the loan portfolio, overall portfolio quality and past loss experience, review of spe-cific problem loans, current economic conditions which may affect borrowers’ ability to repay, and other factors which may warrant current recognition. Such periodic assessments may, in management’s judgment, require the Bank to recognize additions or reductions to the allowance.
Various regulatory agencies periodically review the adequacy of the Bank’s allowance for loan losses as an integral part of their examination process. Such agencies may require the Bank to recognize additions or reductions to the allowance based on their evaluation of information available to them at the time of their examination. It is reasonably possible that the above factors may change significantly and, therefore, affect management’s determination of the allowance for loan losses in the near term.
A loan is considered impaired when, based on current information and events, it is probable that the Bank will be unable to collect the scheduled payments of principal or interest when due according to the contractual terms of the loan agreement. Factors considered by management in determining impairment include payment status, collateral value, and the probability of collecting scheduled principal and interest payments when due. Loans that experience insignificant payment delays and payment shortfalls generally are not classified as impaired. Management determines the significance of payment delays and payment shortfalls on a case–by–case basis, taking into consideration all of the circumstances surrounding the loan and the borrower, including the length of the delay, the reasons for the delay, the borrower’s prior payment record, and the amount of the shortfall in relation to the principal and interest owed.
Impairment is measured on a loan by loan basis for commercial loans by either the present value of expected future cash flows discounted at the loans effective interest rate, the loan’s obtainable market price, or the fair value of the collateral if the loan is collateral dependent. Large groups of smaller balance homogeneous loans are collectively evaluated for impairment. Accordingly, the Bank does not separately identify individual consumer and residential loans for impairment disclosures. (Refer to Note 1 and Note 4 of the notes to financial statements.)
Executive BriefUnited Bank of Philadelphia is the only African American–owned and controlled community development financial institution headquartered in Philadelphia. Man-agement continues to seek to maximize the Bank’s “community bank” competitive advantage by leveraging its strategic partnerships and relationships to increase market penetration and to help ensure that the communities it serves have full access to financial products and services.
The Company reported a net loss of approximately $343,000 ($0.32 per common share) for the year ended December 31, 2014 compared to a net loss of approximately $669,000 ($0.63 per common share) for the year ended December 31, 2013. The improvement in operating results is primarily related to increased noninterest income from the Bank’s SBA loan activity. Management is committed to further improving the Company’s operating performance by implementing more effective strategies to achieve and sustain profitability, augment capital, and manage loan and other real estate portfolios. The following actions are crucial to enhancing the Company’s
12 U N I T E D B A N C S H A R E S , I N C .
future financial performance:
Increase Capital. The critical importance of establishing and maintaining capital levels to support the Bank’s risk profile and growth is understood; however, capital continues to decline as a result of operating losses. To meet the requirements of the Consent Orders, and to address going concern audit opinion, a concentrated effort will be made to stabilize and strengthen the Bank’s capital by the following:
1. Core Profitability from Bank operations—Core profitability is essential to stop the erosion of capital. Refer to the Earnings Enhancement discussion below.
2. External equity investments—Potential investors will be sought in 2015 to generate a minimum investment of $2 million.
3. US Treasury CDFI Fund—The Bank is a CDFI and may have the ability to utilize programs of the U.S. Treasury’s CDFI Fund to supplement capital. CDFI programs were created to support FDIC–insured financial institutions, like the Bank, around the country that are dedicated to financing and supporting com-munity and economic development activities. These programs complement the community development activities of insured depository institutions (i.e., banks and thrifts) by providing financial incentives to expand investments in CDFIs and to increase lending, investment, and service activities within economically distressed communities. Although the Bank may have qualifying activity, the Consent Order and Going Concern audit opinion may serve as an impediment to potential funding opportunities. Utilization of this strategy will be deferred until there is improvement in the Bank’s regulatory and financial status.
Manage asset quality to minimize credit losses and reduce collection costs. Asset quality trends showed some volatility during 2014 with a reduction in the level of delinquencies but an increase in the Bank’s total classified assets. Management will seek to make progress during 2015 by enhancing its pre–screening, under-writing and customer relationship management practices. Proactive monitoring of the loan portfolio and prudent credit administration practices are essential to the identification of emerging problem credits. Asset Quality Committee meetings will continue to be held on a bi–weekly basis to review existing and emerging problems as well as develop/confirm loss mitigation strategies. In conjunction with its regulatory orders, management has developed a Classified Asset Reduction Plan that is being utilized to manage the level of non–performing assets. Forbearance, foreclosure and/or other appropriate collection methods will be used as necessary and may result in increased loan and collection expense.
Earnings enhancement plan. Management seeks to increase noninterest income and further reduce noninterest expense to achieve core earnings. The primary strategy is to increase SBA loan originations and sales of the guaranteed portion in the secondary market for a gain. During 2014, noninterest income totaling approx-imately $665,000 was recognized utilizing this strategy. The pipeline of SBA loans was in excess of $10 million at December 31, 2014 and continues to grow.
Year–to year improvement continues to be made in reducing and controlling noninterest expense; however, the Bank’s noninterest expense remains elevated when compared to its peer group. The Bank continues to incur a higher level of professional service fees (audit and legal) because of its SEC filing requirements as a result of having in excess of 1,200 shareholders. Loan collection and expenses related to other real estate continue to be elevated as a result of efforts to reduce classified assets and delinquencies. While there has been some improvement in noninterest expense, management will continue to seek further savings and efficiencies, where possible.
Another challenge to increased earnings is the restriction on asset growth because of the Bank’s current capital levels; however, the Bank’s net interest margin has remained a significant strength. The low cost of funds and shift in asset allocation to higher yielding loans instead of investments and Federal Funds Sold are the con-tributing factors. Management will continue to balance asset growth with capital adequacy requirements.
2 0 1 4 A N N U A L R E P O R T 13
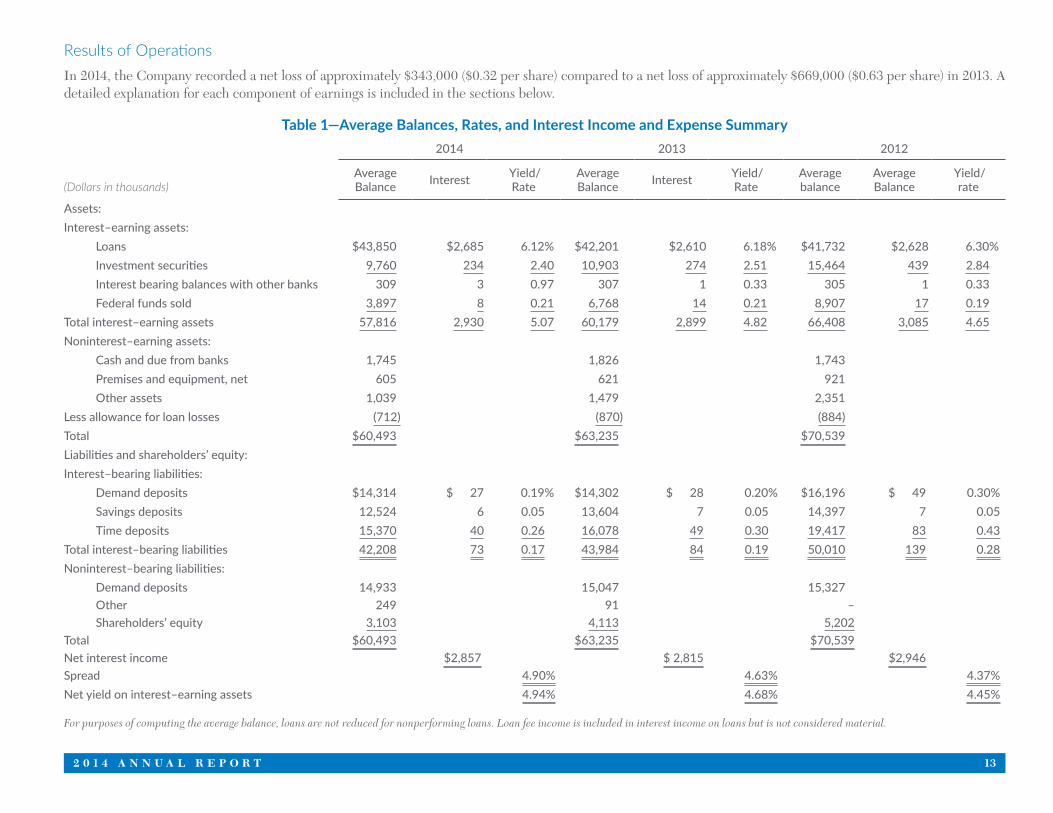
Results of OperationsIn 2014, the Company recorded a net loss of approximately $343,000 ($0.32 per share) compared to a net loss of approximately $669,000 ($0.63 per share) in 2013. A detailed explanation for each component of earnings is included in the sections below.
Table 1—Average Balances, Rates, and Interest Income and Expense Summary2014 2013 2012
(Dollars in thousands)AverageBalance Interest Yield/
RateAverageBalance Interest Yield/
RateAveragebalance
AverageBalance
Yield/rate
Assets:Interest–earning assets: Loans $43,850 $2,685 6.12% $42,201 $2,610 6.18% $41,732 $2,628 6.30% Investment securities 9,760 234 2.40 10,903 274 2.51 15,464 439 2.84 Interest bearing balances with other banks 309 3 0.97 307 1 0.33 305 1 0.33 Federal funds sold 3,897 8 0.21 6,768 14 0.21 8,907 17 0.19Total interest–earning assets 57,816 2,930 5.07 60,179 2,899 4.82 66,408 3,085 4.65Noninterest–earning assets: Cash and due from banks 1,745 1,826 1,743 Premises and equipment, net 605 621 921 Other assets 1,039 1,479 2,351Less allowance for loan losses (712) (870) (884)Total $60,493 $63,235 $70,539Liabilities and shareholders’ equity:Interest–bearing liabilities: Demand deposits $14,314 $ 27 0.19% $14,302 $ 28 0.20% $16,196 $ 49 0.30% Savings deposits 12,524 6 0.05 13,604 7 0.05 14,397 7 0.05 Time deposits 15,370 40 0.26 16,078 49 0.30 19,417 83 0.43Total interest–bearing liabilities 42,208 73 0.17 43,984 84 0.19 50,010 139 0.28Noninterest–bearing liabilities: Demand deposits 14,933 15,047 15,327 Other 249 91 – Shareholders’ equity 3,103 4,113 5,202Total $60,493 $63,235 $70,539Net interest income $2,857 $ 2,815 $2,946Spread 4.90% 4.63% 4.37%Net yield on interest–earning assets 4.94% 4.68% 4.45%
For purposes of computing the average balance, loans are not reduced for nonperforming loans. Loan fee income is included in interest income on loans but is not considered material.
14 U N I T E D B A N C S H A R E S , I N C .
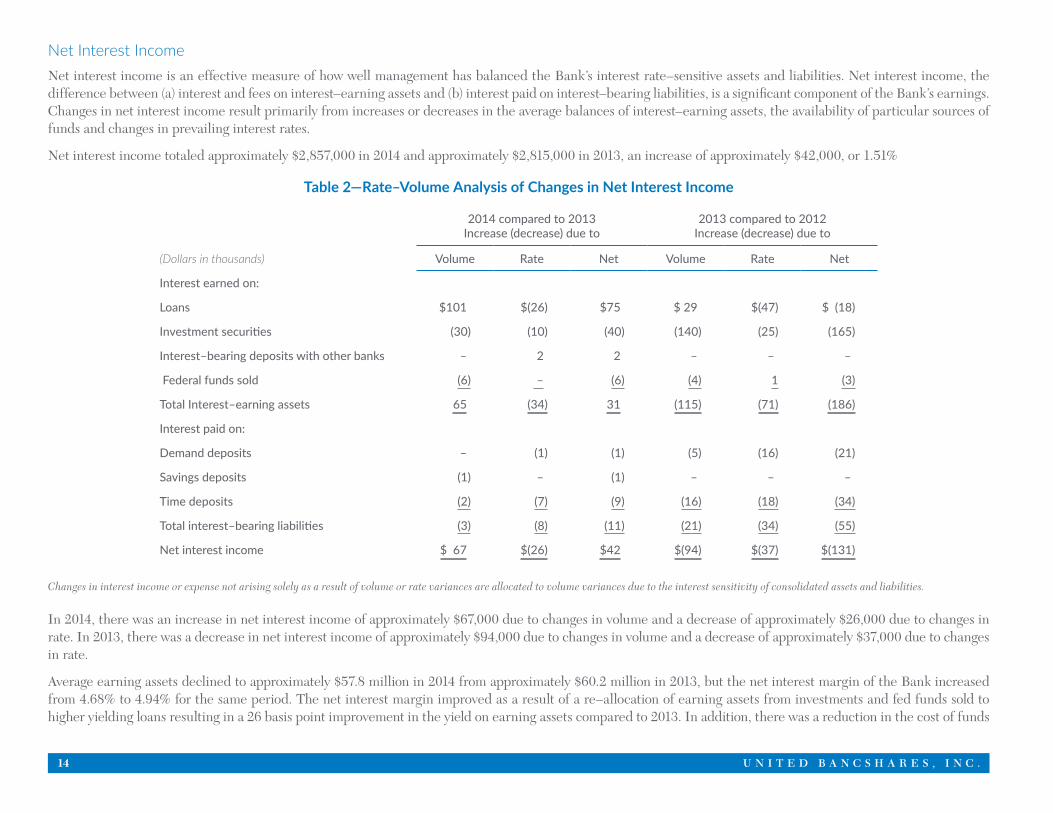
Net Interest IncomeNet interest income is an effective measure of how well management has balanced the Bank’s interest rate–sensitive assets and liabilities. Net interest income, the difference between (a) interest and fees on interest–earning assets and (b) interest paid on interest–bearing liabilities, is a significant component of the Bank’s earnings. Changes in net interest income result primarily from increases or decreases in the average balances of interest–earning assets, the availability of particular sources of funds and changes in prevailing interest rates.
Net interest income totaled approximately $2,857,000 in 2014 and approximately $2,815,000 in 2013, an increase of approximately $42,000, or 1.51%
Table 2—Rate–Volume Analysis of Changes in Net Interest Income
2014 compared to 2013Increase (decrease) due to
2013 compared to 2012Increase (decrease) due to
(Dollars in thousands) Volume Rate Net Volume Rate Net
Interest earned on:
Loans $101 $(26) $75 $ 29 $(47) $ (18)
Investment securities (30) (10) (40) (140) (25) (165)
Interest–bearing deposits with other banks – 2 2 – – –
Federal funds sold (6) – (6) (4) 1 (3)
Total Interest–earning assets 65 (34) 31 (115) (71) (186)
Interest paid on:
Demand deposits – (1) (1) (5) (16) (21)
Savings deposits (1) – (1) – – –
Time deposits (2) (7) (9) (16) (18) (34)
Total interest–bearing liabilities (3) (8) (11) (21) (34) (55)
Net interest income $ 67 $(26) $42 $(94) $(37) $(131)
Changes in interest income or expense not arising solely as a result of volume or rate variances are allocated to volume variances due to the interest sensitivity of consolidated assets and liabilities.
In 2014, there was an increase in net interest income of approximately $67,000 due to changes in volume and a decrease of approximately $26,000 due to changes in rate. In 2013, there was a decrease in net interest income of approximately $94,000 due to changes in volume and a decrease of approximately $37,000 due to changes in rate.
Average earning assets declined to approximately $57.8 million in 2014 from approximately $60.2 million in 2013, but the net interest margin of the Bank increased from 4.68% to 4.94% for the same period. The net interest margin improved as a result of a re–allocation of earning assets from investments and fed funds sold to higher yielding loans resulting in a 26 basis point improvement in the yield on earning assets compared to 2013. In addition, there was a reduction in the cost of funds
2 0 1 4 A N N U A L R E P O R T 15
generated by rate reductions made on the Bank’s deposit products to follow market conditions. The cost of interest–bearing liabilities fell 2 basis points in 2014 com-pared to 2013 as a result of the continued low interest rate environment. Deposit rates have relatively “bottomed–out”; therefore, there is little room to make further downward adjustments.
Provision for Loan LossesThe provision for loan losses is based on management’s estimate of the amount needed to maintain an adequate allowance for loan losses. This estimate is based on the review of the loan portfolio, the level of net loan losses, past loan loss experience, the general economic outlook and other factors management feels are appropriate.
The provision for loan losses charged against earnings in 2014 was $162,000 compared to $75,000 in 2013. The Bank’s provision is based on a review and analysis of the loan portfolio, and is therefore subject to fluctuation based on qualitative factors like delinquency trends, charge–offs, economic conditions, concentrations, etc. Management monitors its credit quality closely by working with borrowers in an effort to identify and control credit risk. Systematic provisions are made to the al-lowance for loan losses to cover probable loan losses in the portfolio. The higher level of provision in 2014 primarily relates to one loan in the Bank’s commercial and industrial portfolio for which a $75,000 specific reserve was allocated. Based on its analysis, management believes the level of the allowance for loan losses is adequate as of December 31, 2014. Refer to the Allowance for Loan Loss section below for further discussion/analysis of the Bank’s credit quality.
Noninterest IncomeNoninterest income decreased approximately $30,000, or 2.14%, compared to 2013. The decrease was primarily related to the sale of investment securities in 2013 for which a gain of approximately $378,000 was recognized; however, somewhat offsetting this reduction in 2014 were realized gains and fair value adjustments related to SBA loans. In conjunction with its SBA loan origination strategy, the Bank recognized a net gain of approximately $228,000 on the sale of the guaranteed portion of SBA loans in 2014. In addition, the Bank originated SBA loans that were held–for–sale at December 31, 2014 and 2013. These loans are accounted for at fair value under ASC 825, Financial Instruments; and therefore a net fair value increase of approximately $353,000 was recognized during 2014 compared to $154,000 in 2013. Management will seek to continue to increase its SBA loan volume and related gains on sales as a means to enhance earnings.
The customer service fee component of noninterest income reflects the volume of transactional and other accounts handled by the Bank and includes such fees and charges as low balance account charges, overdrafts, account analysis, and other customer service fees. During 2014, customer service fees decreased approximately $18,000, or 4.39%, compared to 2013 primarily as a result of a lower level of activity fees (overdraft, low balance, etc.) on deposit accounts and lower debit card usage fees.
During 2014, surcharge income on the Bank’s ATM network declined approximately $105,000, or 40.41%, compared to 2013. The decline is related to the expiration and non–renewal of the Bank’s ATM contract with Rite Aid that resulted in the removal of ATMs from stores in July 2013. The Bank is actively seeking to place machines in other high volume locations. Also, consistent with trends in the industry, ATM usage has declined as consumers continue to move to electronic payment methods utilizing debit and credit cards versus cash. Methods to reduce cost and increase revenues associated with the ATM network continue to be evaluated in-cluding consolidation of EFT processing with the Bank’s core data processing provider in 2014 and the implementation of a more cost effective wireless network communication system.
Since 2002, the Bank has served as arranger/agent for loan syndications for several major corporations throughout the country. In this capacity, the Bank arranges back–up lines/letters of credit with other minority banks for which it receives agent/administrative fees. In both 2014 and 2013, these fees totaled approximately $153,000. The Bank serves as agent/arranger for two facilities. Fees on these facilities are received annually for the administration of the credit facilities.
In 2014, the Bank sold securities with a book value totaling approximately $910,000, for which a gain of approximately $6,000 was recognized. In 2013, the Bank sold securities with a book value totaling approximately $7.4 million, for which a gain of approximately $378,000 was recognized.
16 U N I T E D B A N C S H A R E S , I N C .
Noninterest ExpenseNoninterest expense decreased approximately $400,000, or 8.31%, in 2014 compared to 2013.
Salaries and benefits increased approximately $54,000, or 3.45%, in 2014 compared to 2013. In August 2013, as required by the Consent Orders, a senior lending officer was hired to support the Bank’s business development and credit administration function. In addition, the Bank’s insurance expense increased approximately $24,000, or 14.23%, during 2014 compared to 2013 as a result of increased personnel utilization and a general increase in the cost of medical insurance. Management will continue to review the organizational structure to maximize efficiencies and increase utilization/productivity.
Occupancy and equipment expense increased approximately $8,000, or 0.85%, in 2014 compared to 2013. The increase for is primarily related to increased real estate taxes in 2014 as well as depreciation expense on new ADA compliant ATM machines purchased in late 2013.
Marketing and public relations expense decreased approximately $13,000, or 12.37%, in 2014 compared to 2013 as a result of a shift to direct marketing and business development efforts instead of radio and print ads. In addition, in 2013, the Company used a public relations/marketing consultant to support the shift in strategy away from consumer banking to business banking.
Professional services expense decreased approximately $27,000, or 7.97%, in 2014 compared to 2013. In 2013, the Bank incurred approximately $25,000 in executive search consulting fees in conjunction with the hiring of a senior lending officer in August 2013.
Data processing expenses are a result of management’s decision to outsource a majority of its data processing operations to third party processors. Such expenses are reflective of the high level of accounts being serviced for which the Bank is charged a per account charge by processors. The Bank experiences a higher level of data processing expenses relative to its peer group because of the nature of its deposit base––low average balance and high transaction volume. In addition, the Bank uses outside loan servicing companies to service its mortgage, credit card, and student loan portfolios. To better serve its customers, the Bank also has an ATM network larger than its peer group for which it pays processing fees. Data processing expenses decreased approximately $34,000, or 7.48%, in 2014 compared to 2013 as a result of the consolidation of the Bank’s EFT vendor with its core processor.
Loan and collection expenses increased approximately $44,000, or 42.73%, in 2014 compared to 2013. During 2014, the Bank incurred an increased level of collec-tion–related legal fees related foreclosure/collection activity.
Other real estate expense decreased approximately $191,000, or 90.27%, in 2014 compared to 2013. In 2013, the valuation allowance expense related to other real estate properties was approximately $157,000. The valuation allowance in 2014 declined to approximately $13,000 because of property sales and value stabilization.
Federal deposit insurance premiums increased approximately $4,000, or 2.74%, in 2014 compared to 2013. Assessments are based on many factors including the Bank’s deposit size and composition and its current regulatory ratings. Although deposit levels declined in 2014 compared to 2013, the assessments increased as a result of the Bank’s regulatory evaluation and Consent Orders. Refer to “Federal Deposit Insurance Assessments” above).
In 2013, the Bank completed the amortization of a core deposit intangible that resulted for which it recorded an amortization expense of $180,000 included in other non–interest expense annually. There was no core deposit amortization expense in 2014.
All other expenses are reflective of the general cost to do business and compete in the current regulatory environment and maintain adequate insurance coverage.
2 0 1 4 A N N U A L R E P O R T 17
FINANCIAL CONDITION
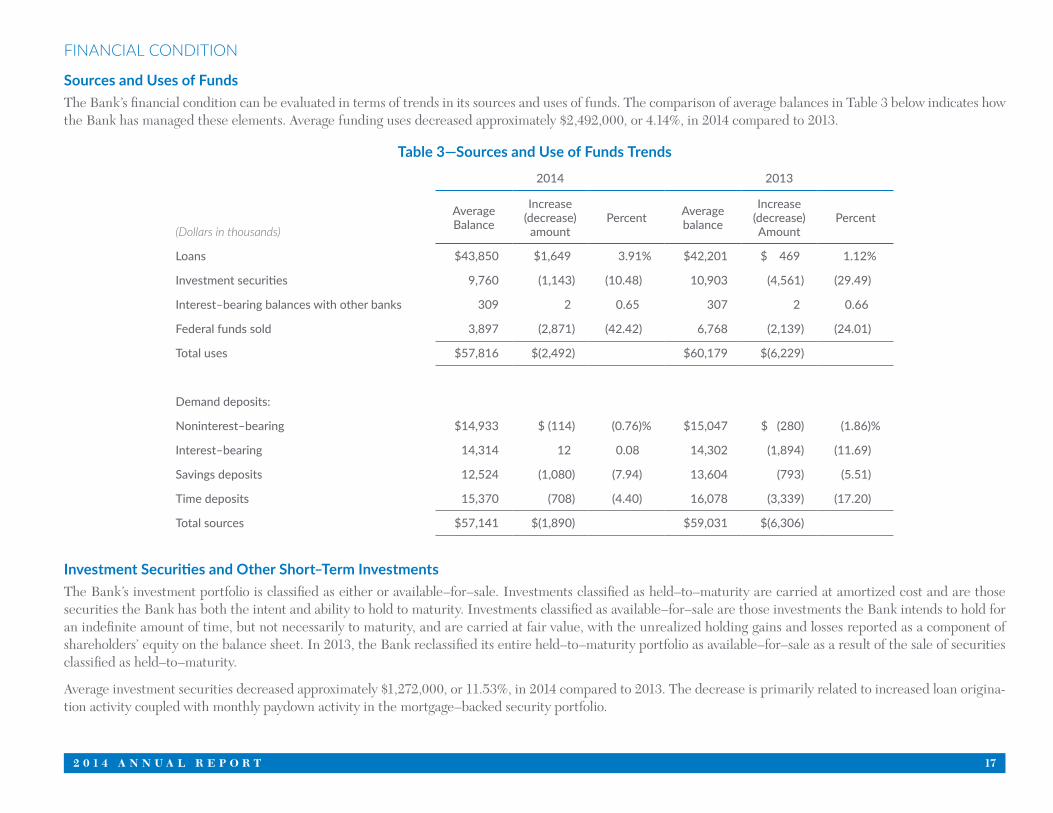
Sources and Uses of FundsThe Bank’s financial condition can be evaluated in terms of trends in its sources and uses of funds. The comparison of average balances in Table 3 below indicates how the Bank has managed these elements. Average funding uses decreased approximately $2,492,000, or 4.14%, in 2014 compared to 2013.
Table 3—Sources and Use of Funds Trends
2014 2013
(Dollars in thousands)
AverageBalance
Increase(decrease)
amountPercent Average
balance
Increase(decrease)Amount
Percent
Loans $43,850 $1,649 3.91% $42,201 $ 469 1.12%
Investment securities 9,760 (1,143) (10.48) 10,903 (4,561) (29.49)
Interest–bearing balances with other banks 309 2 0.65 307 2 0.66
Federal funds sold 3,897 (2,871) (42.42) 6,768 (2,139) (24.01)
Total uses $57,816 $(2,492) $60,179 $(6,229)
Demand deposits:
Noninterest–bearing $14,933 $ (114) (0.76)% $15,047 $ (280) (1.86)%
Interest–bearing 14,314 12 0.08 14,302 (1,894) (11.69)
Savings deposits 12,524 (1,080) (7.94) 13,604 (793) (5.51)
Time deposits 15,370 (708) (4.40) 16,078 (3,339) (17.20)
Total sources $57,141 $(1,890) $59,031 $(6,306)
Investment Securities and Other Short–Term InvestmentsThe Bank’s investment portfolio is classified as either or available–for–sale. Investments classified as held–to–maturity are carried at amortized cost and are those securities the Bank has both the intent and ability to hold to maturity. Investments classified as available–for–sale are those investments the Bank intends to hold for an indefinite amount of time, but not necessarily to maturity, and are carried at fair value, with the unrealized holding gains and losses reported as a component of shareholders’ equity on the balance sheet. In 2013, the Bank reclassified its entire held–to–maturity portfolio as available–for–sale as a result of the sale of securities classified as held–to–maturity.
Average investment securities decreased approximately $1,272,000, or 11.53%, in 2014 compared to 2013. The decrease is primarily related to increased loan origina-tion activity coupled with monthly paydown activity in the mortgage–backed security portfolio.
18 U N I T E D B A N C S H A R E S , I N C .
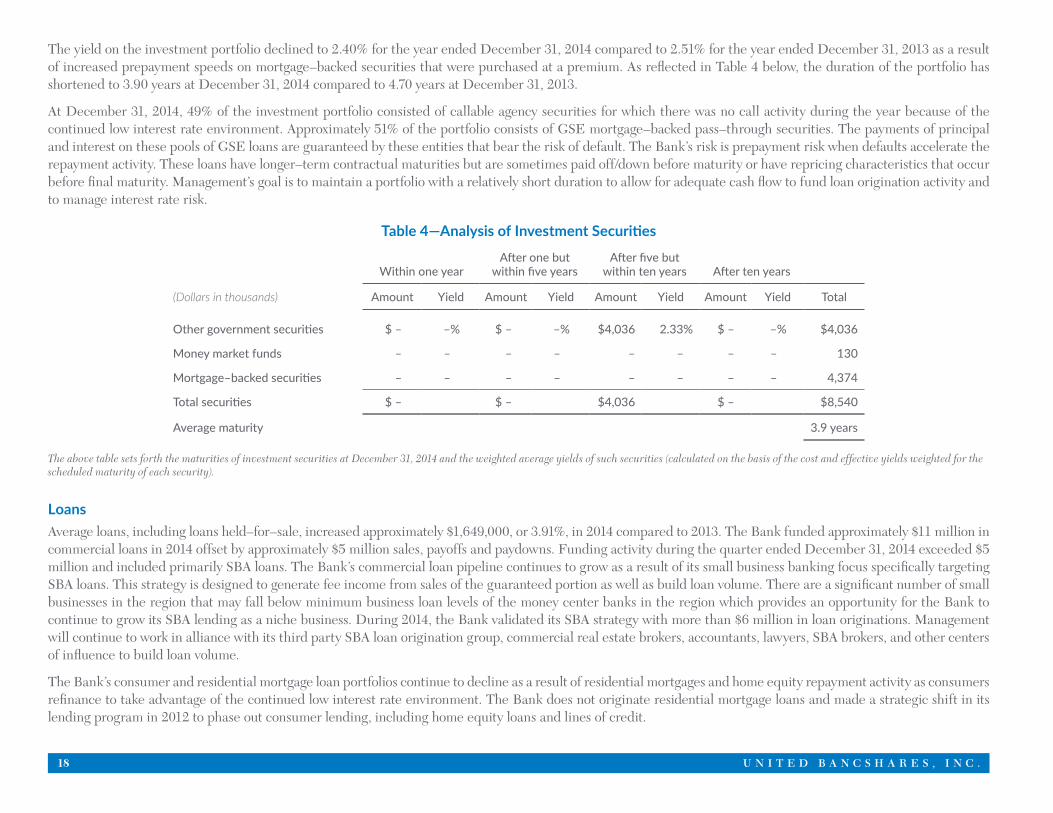
The yield on the investment portfolio declined to 2.40% for the year ended December 31, 2014 compared to 2.51% for the year ended December 31, 2013 as a result of increased prepayment speeds on mortgage–backed securities that were purchased at a premium. As reflected in Table 4 below, the duration of the portfolio has shortened to 3.90 years at December 31, 2014 compared to 4.70 years at December 31, 2013.
At December 31, 2014, 49% of the investment portfolio consisted of callable agency securities for which there was no call activity during the year because of the continued low interest rate environment. Approximately 51% of the portfolio consists of GSE mortgage–backed pass–through securities. The payments of principal and interest on these pools of GSE loans are guaranteed by these entities that bear the risk of default. The Bank’s risk is prepayment risk when defaults accelerate the repayment activity. These loans have longer–term contractual maturities but are sometimes paid off/down before maturity or have repricing characteristics that occur before final maturity. Management’s goal is to maintain a portfolio with a relatively short duration to allow for adequate cash flow to fund loan origination activity and to manage interest rate risk.
Table 4—Analysis of Investment Securities
Within one yearAfter one but
within five yearsAfter five but
within ten years After ten years
(Dollars in thousands) Amount Yield Amount Yield Amount Yield Amount Yield Total
Other government securities $ – –% $ – –% $4,036 2.33% $ – –% $4,036
Money market funds – – – – – – – – 130
Mortgage–backed securities – – – – – – – – 4,374
Total securities $ – $ – $4,036 $ – $8,540
Average maturity 3.9 years
The above table sets forth the maturities of investment securities at December 31, 2014 and the weighted average yields of such securities (calculated on the basis of the cost and effective yields weighted for the scheduled maturity of each security).
LoansAverage loans, including loans held–for–sale, increased approximately $1,649,000, or 3.91%, in 2014 compared to 2013. The Bank funded approximately $11 million in commercial loans in 2014 offset by approximately $5 million sales, payoffs and paydowns. Funding activity during the quarter ended December 31, 2014 exceeded $5 million and included primarily SBA loans. The Bank’s commercial loan pipeline continues to grow as a result of its small business banking focus specifically targeting SBA loans. This strategy is designed to generate fee income from sales of the guaranteed portion as well as build loan volume. There are a significant number of small businesses in the region that may fall below minimum business loan levels of the money center banks in the region which provides an opportunity for the Bank to continue to grow its SBA lending as a niche business. During 2014, the Bank validated its SBA strategy with more than $6 million in loan originations. Management will continue to work in alliance with its third party SBA loan origination group, commercial real estate brokers, accountants, lawyers, SBA brokers, and other centers of influence to build loan volume.
The Bank’s consumer and residential mortgage loan portfolios continue to decline as a result of residential mortgages and home equity repayment activity as consumers refinance to take advantage of the continued low interest rate environment. The Bank does not originate residential mortgage loans and made a strategic shift in its lending program in 2012 to phase out consumer lending, including home equity loans and lines of credit.
2 0 1 4 A N N U A L R E P O R T 19
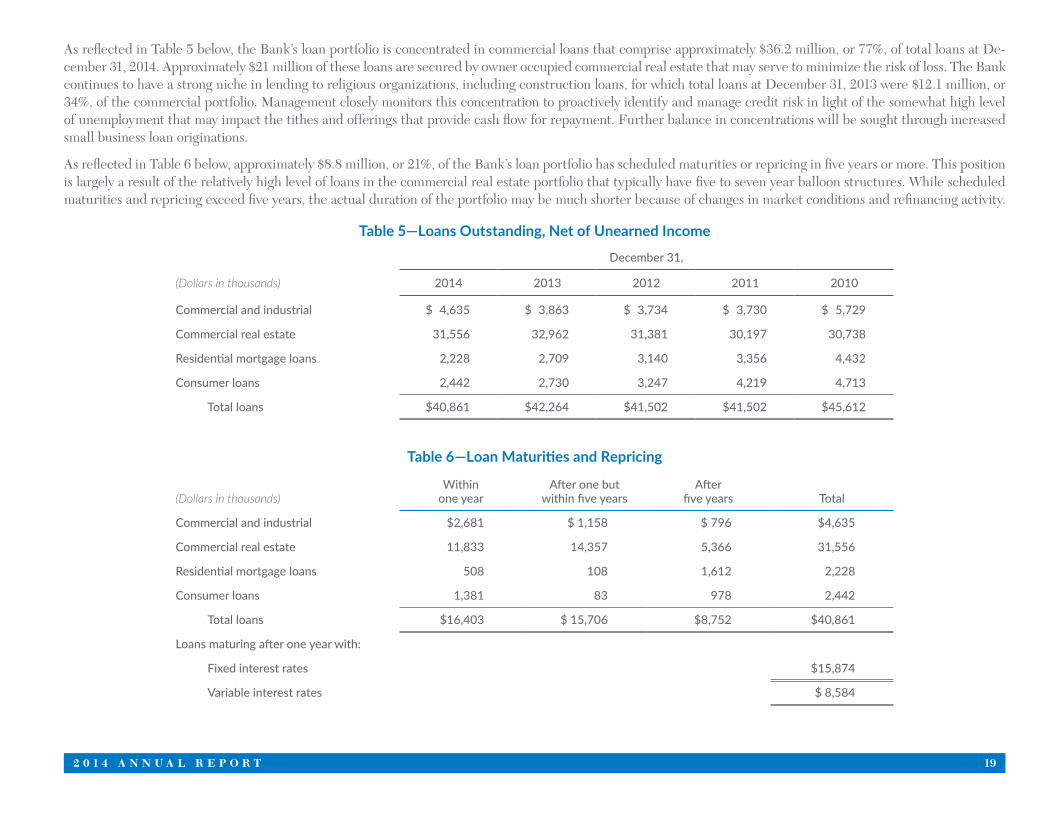
As reflected in Table 5 below, the Bank’s loan portfolio is concentrated in commercial loans that comprise approximately $36.2 million, or 77%, of total loans at De-cember 31, 2014. Approximately $21 million of these loans are secured by owner occupied commercial real estate that may serve to minimize the risk of loss. The Bank continues to have a strong niche in lending to religious organizations, including construction loans, for which total loans at December 31, 2013 were $12.1 million, or 34%, of the commercial portfolio. Management closely monitors this concentration to proactively identify and manage credit risk in light of the somewhat high level of unemployment that may impact the tithes and offerings that provide cash flow for repayment. Further balance in concentrations will be sought through increased small business loan originations.
As reflected in Table 6 below, approximately $8.8 million, or 21%, of the Bank’s loan portfolio has scheduled maturities or repricing in five years or more. This position is largely a result of the relatively high level of loans in the commercial real estate portfolio that typically have five to seven year balloon structures. While scheduled maturities and repricing exceed five years, the actual duration of the portfolio may be much shorter because of changes in market conditions and refinancing activity.
Table 5—Loans Outstanding, Net of Unearned Income
December 31,
(Dollars in thousands) 2014 2013 2012 2011 2010
Commercial and industrial $ 4,635 $ 3,863 $ 3,734 $ 3,730 $ 5,729
Commercial real estate 31,556 32,962 31,381 30,197 30,738
Residential mortgage loans 2,228 2,709 3,140 3,356 4,432
Consumer loans 2,442 2,730 3,247 4,219 4,713
Total loans $40,861 $42,264 $41,502 $41,502 $45,612
Table 6—Loan Maturities and Repricing
(Dollars in thousands)Within
one yearAfter one but
within five yearsAfter
five years Total
Commercial and industrial $2,681 $ 1,158 $ 796 $4,635
Commercial real estate 11,833 14,357 5,366 31,556
Residential mortgage loans 508 108 1,612 2,228
Consumer loans 1,381 83 978 2,442
Total loans $16,403 $ 15,706 $8,752 $40,861
Loans maturing after one year with:
Fixed interest rates $15,874
Variable interest rates $ 8,584
20 U N I T E D B A N C S H A R E S , I N C .
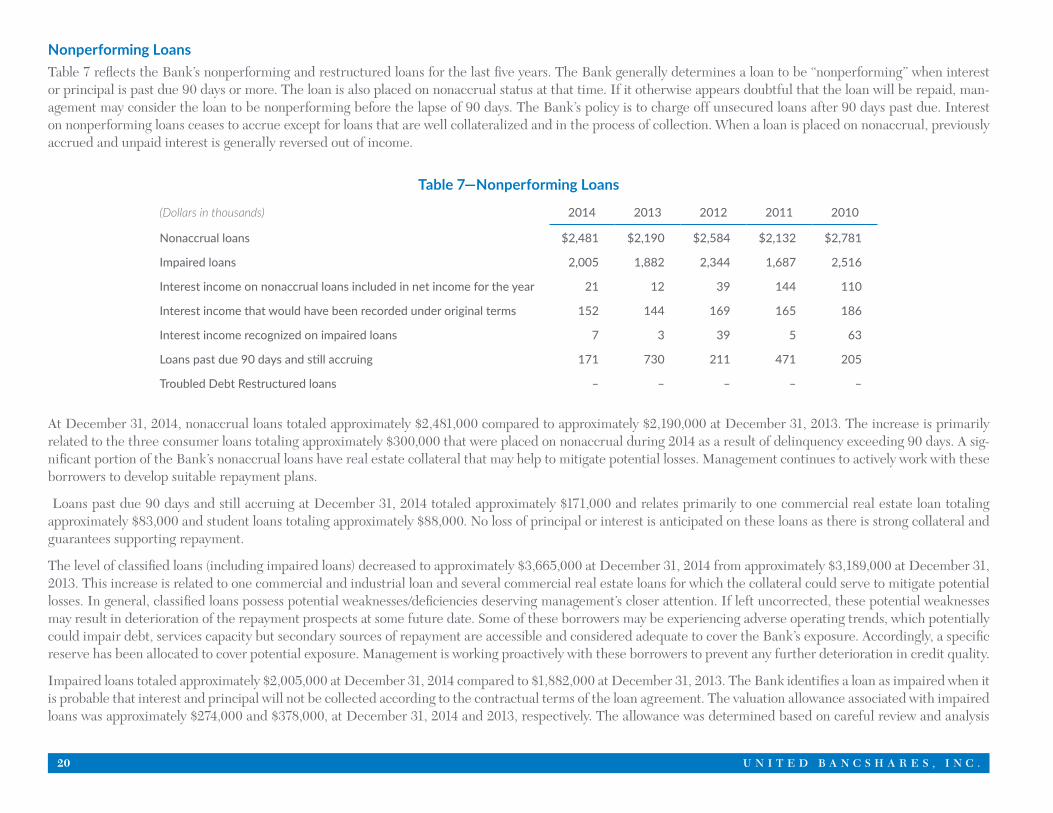
Nonperforming LoansTable 7 reflects the Bank’s nonperforming and restructured loans for the last five years. The Bank generally determines a loan to be “nonperforming” when interest or principal is past due 90 days or more. The loan is also placed on nonaccrual status at that time. If it otherwise appears doubtful that the loan will be repaid, man-agement may consider the loan to be nonperforming before the lapse of 90 days. The Bank’s policy is to charge off unsecured loans after 90 days past due. Interest on nonperforming loans ceases to accrue except for loans that are well collateralized and in the process of collection. When a loan is placed on nonaccrual, previously accrued and unpaid interest is generally reversed out of income.
Table 7—Nonperforming Loans
(Dollars in thousands) 2014 2013 2012 2011 2010
Nonaccrual loans $2,481 $2,190 $2,584 $2,132 $2,781
Impaired loans 2,005 1,882 2,344 1,687 2,516
Interest income on nonaccrual loans included in net income for the year 21 12 39 144 110
Interest income that would have been recorded under original terms 152 144 169 165 186
Interest income recognized on impaired loans 7 3 39 5 63
Loans past due 90 days and still accruing 171 730 211 471 205
Troubled Debt Restructured loans – – – – –
At December 31, 2014, nonaccrual loans totaled approximately $2,481,000 compared to approximately $2,190,000 at December 31, 2013. The increase is primarily related to the three consumer loans totaling approximately $300,000 that were placed on nonaccrual during 2014 as a result of delinquency exceeding 90 days. A sig-nificant portion of the Bank’s nonaccrual loans have real estate collateral that may help to mitigate potential losses. Management continues to actively work with these borrowers to develop suitable repayment plans.
Loans past due 90 days and still accruing at December 31, 2014 totaled approximately $171,000 and relates primarily to one commercial real estate loan totaling approximately $83,000 and student loans totaling approximately $88,000. No loss of principal or interest is anticipated on these loans as there is strong collateral and guarantees supporting repayment.
The level of classified loans (including impaired loans) decreased to approximately $3,665,000 at December 31, 2014 from approximately $3,189,000 at December 31, 2013. This increase is related to one commercial and industrial loan and several commercial real estate loans for which the collateral could serve to mitigate potential losses. In general, classified loans possess potential weaknesses/deficiencies deserving management’s closer attention. If left uncorrected, these potential weaknesses may result in deterioration of the repayment prospects at some future date. Some of these borrowers may be experiencing adverse operating trends, which potentially could impair debt, services capacity but secondary sources of repayment are accessible and considered adequate to cover the Bank’s exposure. Accordingly, a specific reserve has been allocated to cover potential exposure. Management is working proactively with these borrowers to prevent any further deterioration in credit quality.
Impaired loans totaled approximately $2,005,000 at December 31, 2014 compared to $1,882,000 at December 31, 2013. The Bank identifies a loan as impaired when it is probable that interest and principal will not be collected according to the contractual terms of the loan agreement. The valuation allowance associated with impaired loans was approximately $274,000 and $378,000, at December 31, 2014 and 2013, respectively. The allowance was determined based on careful review and analysis
2 0 1 4 A N N U A L R E P O R T 21
including collateral liquidation values and/or guarantees and is deemed adequate to cover shortfalls in loan repayment The increase in impaired loans is attributable to the transfer of one commercial real estate loan totaling approximately $368,000 and one commercial and industrial loan totaling approximately $75,000 during 2014. These transfers were offset by a $253,000 partial charge–off of one loan because of a decline in collateral value for which a specific reserve had been previously allo-cated. The reduction in specific reserves during 2014 is related to this charge–off. Management is working aggressively to resolve the potential credit risk associated with its impaired loans by detailing specific payment requirements including the sale of underlying collateral or obtaining take–out financing.
The commercial loan portfolio of the Bank has a concentration in loans made to religious organizations. From inception, the Bank has received support in the form of investments and deposits and has developed strong relationships with the Philadelphia region’s religious community. Loans made to these organizations are primarily for expansion and repair of church facilities. At December 31, 2014 and 2013, loans to religious organizations represented approximately $520,000 and $629,000, re-spectively, of total impaired loans. The improvement during 2014 is related to the upgrade of one loan totaling approximately $86,000 for which consistent payments have been made. Management works closely with its attorneys and the leadership of these organizations in an attempt to develop suitable repayment plans to avoid foreclosure. In general, loans to religious organizations are being monitored closely to proactively identify potential weaknesses in this area of high concentration.
The Bank grants commercial loans to customers primarily located in Philadelphia County, Pennsylvania and surrounding counties in the Delaware Valley. Although the Bank has a diversified loan portfolio, its debtors’ ability to honor their contracts is influenced by the region’s economy.
Interest income recognized on impaired loans during the year ended December 31, 2014 and 2013 was approximately $7,000 and $3,000, respectively. The Bank rec-ognizes income on impaired loans under the cash basis when the loans are both current and the collateral on the loan is sufficient to cover the outstanding obligation to the Bank. If these factors do not exist, the Bank will not recognize income on such loans.
The Bank may modify or restructure the terms of certain loans to provide relief to borrowers. Troubled debt restructurings (“TDRs”). TDRs occur when a creditor, for economic or legal reasons related to a debtor’s financial condition, grants a concession to the debtor that it would not otherwise consider, such as a below market interest rate, extending the maturity of a loan, or a combination of both. The Company made modifications to certain loans in its commercial loan portfolio that includ-ed the term out of lines of credit to begin the amortization of principal. The terms of these loans do not include any financial concessions and are consistent with the current market. Management reviews all loan modifications to determine whether the modification qualifies as a troubled debt restructuring (i.e. whether the creditor has been granted a concession or is experiencing financial difficulties). Based on this review and evaluation, none of the loans modified during 2014 and 2013 met the criteria of a troubled debt restructuring. The Company had no loans classified as TDRs troubled debt restructurings at December 31, 2014 and 2013.
Allowance for Loan Losses The determination of the allowance for loan losses involves a higher degree of judgment and complexity than its other significant accounting policies. The allowance is the accumulation of three components that are calculated based on various independent methodologies that are based on management’s estimates. The three com-ponents are as follows:
• Specific Loan Evaluation Component – Includes the specific evaluation of impaired loans.
• Historical Charge–Off Component – Applies a rolling, eight–quarter historical charge–off rate to all pools of non–classified loans.
• Qualitative Factors Component – The loan portfolio is broken down into multiple homogenous sub classifications, upon which multiple factors (such as delin-quency trends, economic conditions, concentrations, growth/volume trends, and management/staff ability) are evaluated, resulting in an allowance amount for each of the sub classifications. The sum of these amounts comprises the Qualitative Factors Component.
All of these factors may be susceptible to significant change. In 2014, management reduced the qualitative factor from “high” to “moderate” related to the economy as there continues to be improvement in the economic conditions in the region. The average historical loss factor for commercial and industrial loans increased as a result
22 U N I T E D B A N C S H A R E S , I N C .
of the $253,000 charge–off during 2014. With the exception of this segment, the average eight rolling quarter net loss factors have declined during the year as a result of a lower level of net charge–offs in 2014. To the extent actual outcomes differ from management’s estimates, additional provisions for loan losses may be required that would adversely impact earnings in future periods. Management believes that the allowance for loan losses is adequate at December 31, 2014. While available information is used to recognize losses on loans, future additions may be necessary based on changes in economic conditions. In addition, various regulatory agencies, as an integral part of their examination process, periodically review the Bank’s allowance for loan losses. Such agencies may require the Bank to recognize additions to the allowance based on their judgments of information available to them at the time of the examination. (Refer to Note 4 of the financial statements for further details on the allowance for loan losses.)
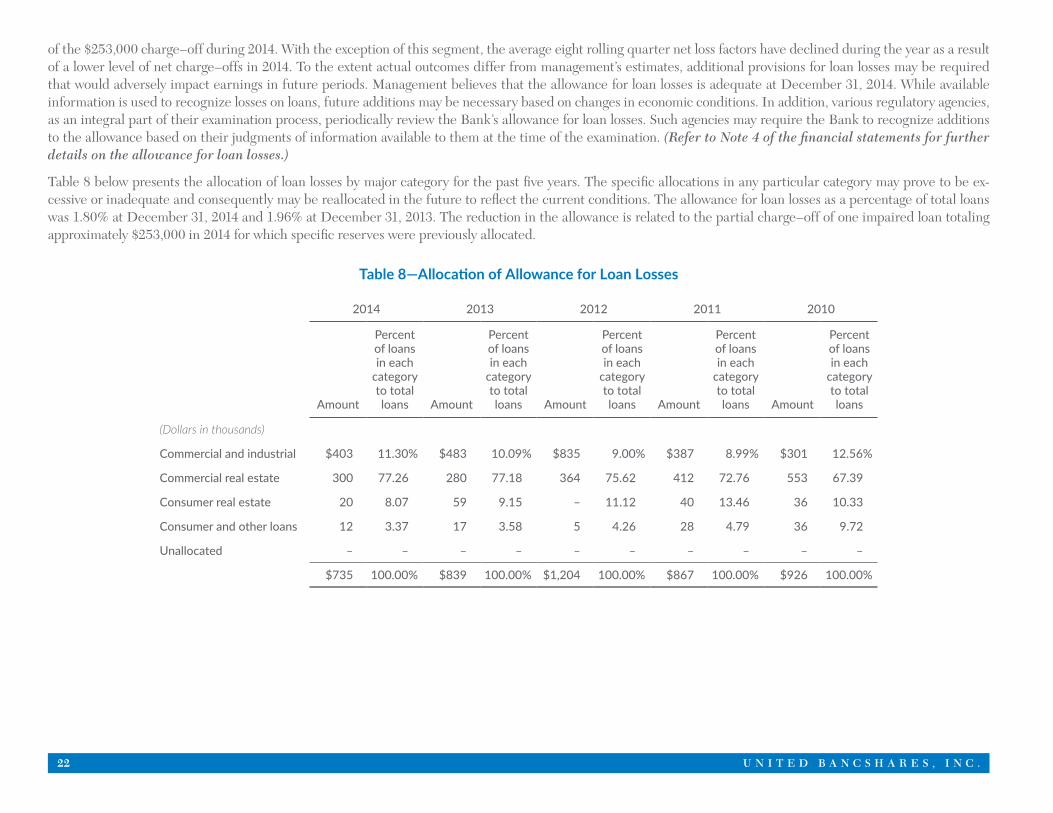
Table 8 below presents the allocation of loan losses by major category for the past five years. The specific allocations in any particular category may prove to be ex-cessive or inadequate and consequently may be reallocated in the future to reflect the current conditions. The allowance for loan losses as a percentage of total loans was 1.80% at December 31, 2014 and 1.96% at December 31, 2013. The reduction in the allowance is related to the partial charge–off of one impaired loan totaling approximately $253,000 in 2014 for which specific reserves were previously allocated.
Table 8—Allocation of Allowance for Loan Losses
2014 2013 2012 2011 2010
Amount
Percentof loansin each
categoryto total loans Amount
Percentof loansin each
category to total loans Amount
Percentof loansin each
category to total loans Amount
Percentof loansin each
category to total loans Amount
Percentof loansin each
category to total loans
(Dollars in thousands)
Commercial and industrial $403 11.30% $483 10.09% $835 9.00% $387 8.99% $301 12.56%
Commercial real estate 300 77.26 280 77.18 364 75.62 412 72.76 553 67.39
Consumer real estate 20 8.07 59 9.15 – 11.12 40 13.46 36 10.33
Consumer and other loans 12 3.37 17 3.58 5 4.26 28 4.79 36 9.72
Unallocated – – – – – – – – – –
$735 100.00% $839 100.00% $1,204 100.00% $867 100.00% $926 100.00%
2 0 1 4 A N N U A L R E P O R T 23
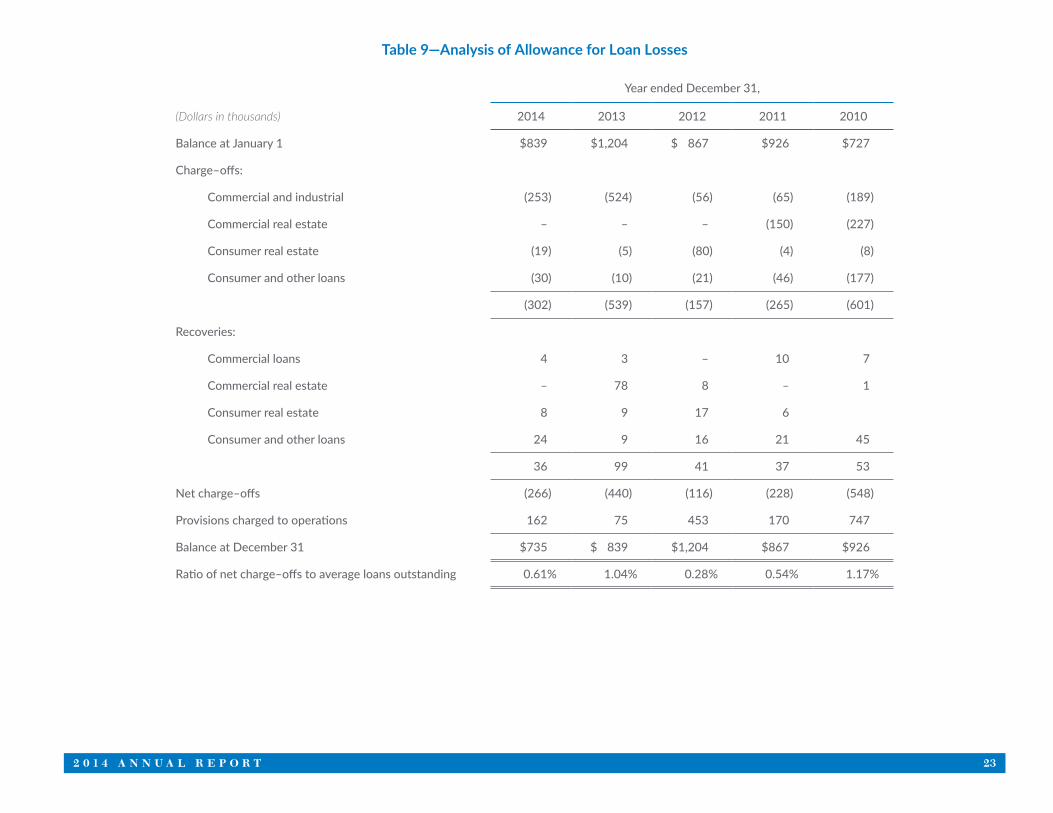
Table 9—Analysis of Allowance for Loan Losses
Year ended December 31,
(Dollars in thousands) 2014 2013 2012 2011 2010
Balance at January 1 $839 $1,204 $ 867 $926 $727
Charge–offs:
Commercial and industrial (253) (524) (56) (65) (189)
Commercial real estate – – – (150) (227)
Consumer real estate (19) (5) (80) (4) (8)
Consumer and other loans (30) (10) (21) (46) (177)
(302) (539) (157) (265) (601)
Recoveries:
Commercial loans 4 3 – 10 7
Commercial real estate – 78 8 – 1
Consumer real estate 8 9 17 6
Consumer and other loans 24 9 16 21 45
36 99 41 37 53
Net charge–offs (266) (440) (116) (228) (548)
Provisions charged to operations 162 75 453 170 747
Balance at December 31 $735 $ 839 $1,204 $867 $926
Ratio of net charge–offs to average loans outstanding 0.61% 1.04% 0.28% 0.54% 1.17%
24 U N I T E D B A N C S H A R E S , I N C .
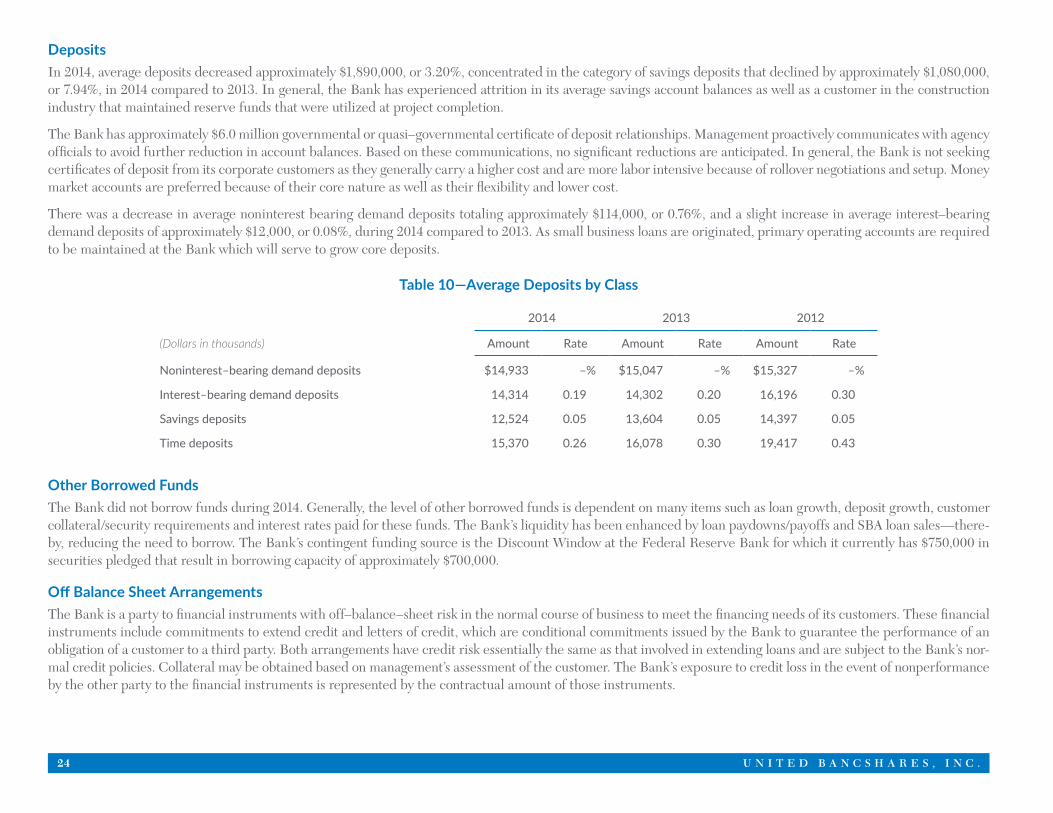
DepositsIn 2014, average deposits decreased approximately $1,890,000, or 3.20%, concentrated in the category of savings deposits that declined by approximately $1,080,000, or 7.94%, in 2014 compared to 2013. In general, the Bank has experienced attrition in its average savings account balances as well as a customer in the construction industry that maintained reserve funds that were utilized at project completion.
The Bank has approximately $6.0 million governmental or quasi–governmental certificate of deposit relationships. Management proactively communicates with agency officials to avoid further reduction in account balances. Based on these communications, no significant reductions are anticipated. In general, the Bank is not seeking certificates of deposit from its corporate customers as they generally carry a higher cost and are more labor intensive because of rollover negotiations and setup. Money market accounts are preferred because of their core nature as well as their flexibility and lower cost.
There was a decrease in average noninterest bearing demand deposits totaling approximately $114,000, or 0.76%, and a slight increase in average interest–bearing demand deposits of approximately $12,000, or 0.08%, during 2014 compared to 2013. As small business loans are originated, primary operating accounts are required to be maintained at the Bank which will serve to grow core deposits.
Table 10—Average Deposits by Class
2014 2013 2012
(Dollars in thousands) Amount Rate Amount Rate Amount Rate
Noninterest–bearing demand deposits $14,933 –% $15,047 –% $15,327 –%
Interest–bearing demand deposits 14,314 0.19 14,302 0.20 16,196 0.30
Savings deposits 12,524 0.05 13,604 0.05 14,397 0.05
Time deposits 15,370 0.26 16,078 0.30 19,417 0.43
Other Borrowed FundsThe Bank did not borrow funds during 2014. Generally, the level of other borrowed funds is dependent on many items such as loan growth, deposit growth, customer collateral/security requirements and interest rates paid for these funds. The Bank’s liquidity has been enhanced by loan paydowns/payoffs and SBA loan sales—there-by, reducing the need to borrow. The Bank’s contingent funding source is the Discount Window at the Federal Reserve Bank for which it currently has $750,000 in securities pledged that result in borrowing capacity of approximately $700,000.
Off Balance Sheet ArrangementsThe Bank is a party to financial instruments with off–balance–sheet risk in the normal course of business to meet the financing needs of its customers. These financial instruments include commitments to extend credit and letters of credit, which are conditional commitments issued by the Bank to guarantee the performance of an obligation of a customer to a third party. Both arrangements have credit risk essentially the same as that involved in extending loans and are subject to the Bank’s nor-mal credit policies. Collateral may be obtained based on management’s assessment of the customer. The Bank’s exposure to credit loss in the event of nonperformance by the other party to the financial instruments is represented by the contractual amount of those instruments.
2 0 1 4 A N N U A L R E P O R T 25
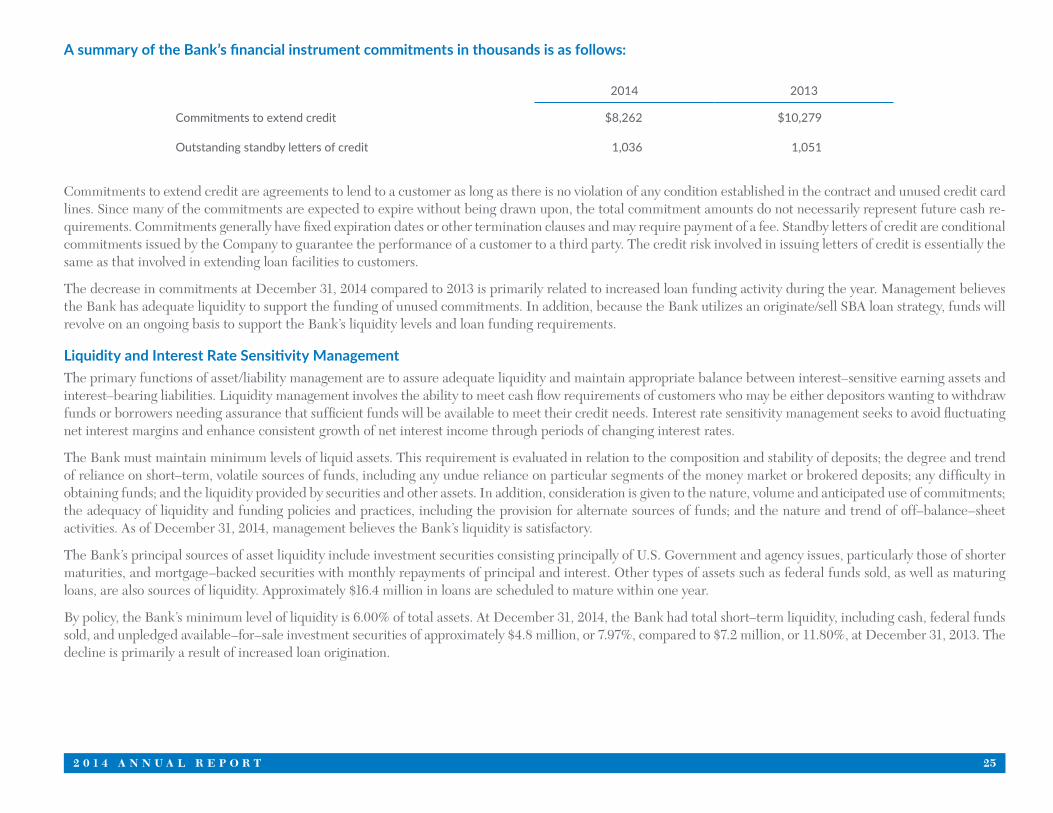
A summary of the Bank’s financial instrument commitments in thousands is as follows:
2014 2013
Commitments to extend credit $8,262 $10,279
Outstanding standby letters of credit 1,036 1,051
Commitments to extend credit are agreements to lend to a customer as long as there is no violation of any condition established in the contract and unused credit card lines. Since many of the commitments are expected to expire without being drawn upon, the total commitment amounts do not necessarily represent future cash re-quirements. Commitments generally have fixed expiration dates or other termination clauses and may require payment of a fee. Standby letters of credit are conditional commitments issued by the Company to guarantee the performance of a customer to a third party. The credit risk involved in issuing letters of credit is essentially the same as that involved in extending loan facilities to customers.
The decrease in commitments at December 31, 2014 compared to 2013 is primarily related to increased loan funding activity during the year. Management believes the Bank has adequate liquidity to support the funding of unused commitments. In addition, because the Bank utilizes an originate/sell SBA loan strategy, funds will revolve on an ongoing basis to support the Bank’s liquidity levels and loan funding requirements.
Liquidity and Interest Rate Sensitivity ManagementThe primary functions of asset/liability management are to assure adequate liquidity and maintain appropriate balance between interest–sensitive earning assets and interest–bearing liabilities. Liquidity management involves the ability to meet cash flow requirements of customers who may be either depositors wanting to withdraw funds or borrowers needing assurance that sufficient funds will be available to meet their credit needs. Interest rate sensitivity management seeks to avoid fluctuating net interest margins and enhance consistent growth of net interest income through periods of changing interest rates.
The Bank must maintain minimum levels of liquid assets. This requirement is evaluated in relation to the composition and stability of deposits; the degree and trend of reliance on short–term, volatile sources of funds, including any undue reliance on particular segments of the money market or brokered deposits; any difficulty in obtaining funds; and the liquidity provided by securities and other assets. In addition, consideration is given to the nature, volume and anticipated use of commitments; the adequacy of liquidity and funding policies and practices, including the provision for alternate sources of funds; and the nature and trend of off–balance–sheet activities. As of December 31, 2014, management believes the Bank’s liquidity is satisfactory.
The Bank’s principal sources of asset liquidity include investment securities consisting principally of U.S. Government and agency issues, particularly those of shorter maturities, and mortgage–backed securities with monthly repayments of principal and interest. Other types of assets such as federal funds sold, as well as maturing loans, are also sources of liquidity. Approximately $16.4 million in loans are scheduled to mature within one year.
By policy, the Bank’s minimum level of liquidity is 6.00% of total assets. At December 31, 2014, the Bank had total short–term liquidity, including cash, federal funds sold, and unpledged available–for–sale investment securities of approximately $4.8 million, or 7.97%, compared to $7.2 million, or 11.80%, at December 31, 2013. The decline is primarily a result of increased loan origination.
26 U N I T E D B A N C S H A R E S , I N C .
The Bank’s entire securities portfolio is classified as available–for–sale of which approximately 81% are pledged as collateral for deposits of governmental/quasi–gov-ernmental agencies as well as the Discount Window at the Federal Reserve Bank. Therefore, they are restricted from use to fund loans or to meet other liquidity requirements. To ensure the ongoing adequacy of liquidity, the following strategies will be utilized in order of priority:
• Seek additional non–public deposits from new and existing private sector customers
• Sell participations of existing commercial credits to other financial institutions
While management continues to seek additional non–public core deposits to support ongoing loan demand, liquidity levels have been adequate. As a result, it was not necessary to sell loan participations to other institutions.
The Bank’s contingent funding sources include the Discount Window at the Federal Reserve Bank for which it currently has $750,000 in securities pledged that result in borrowing capacity of approximately $700,000.
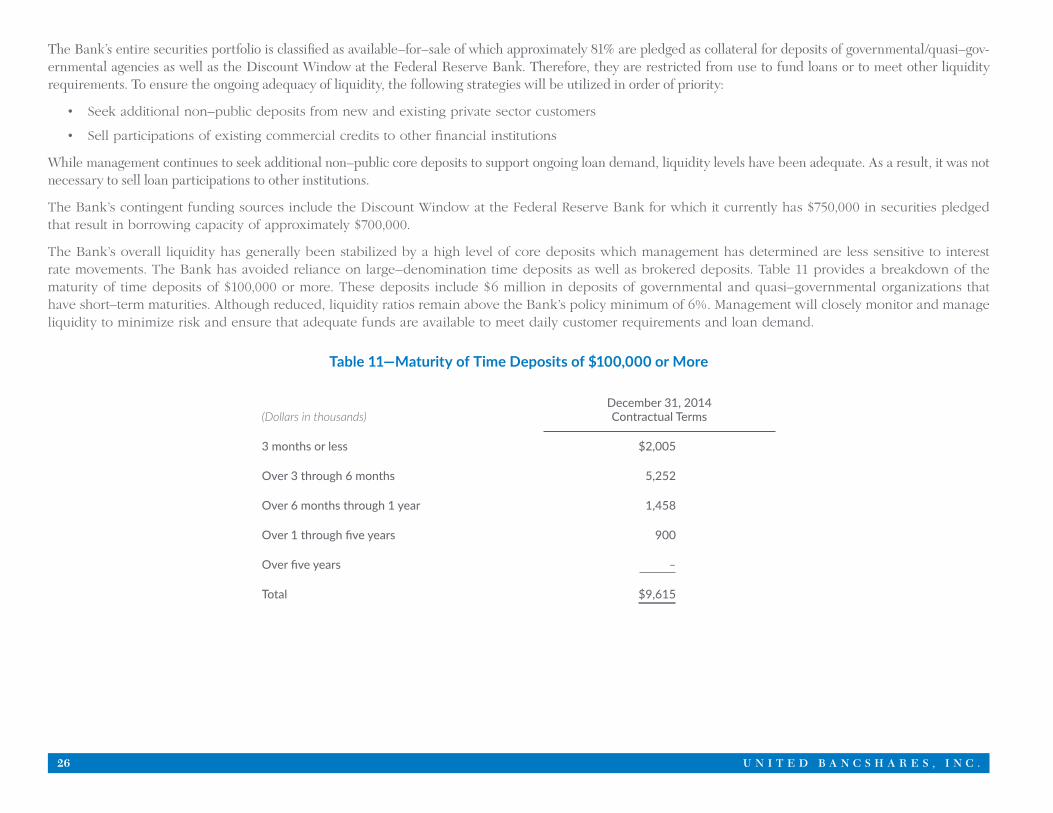
The Bank’s overall liquidity has generally been stabilized by a high level of core deposits which management has determined are less sensitive to interest rate movements. The Bank has avoided reliance on large–denomination time deposits as well as brokered deposits. Table 11 provides a breakdown of the maturity of time deposits of $100,000 or more. These deposits include $6 million in deposits of governmental and quasi–governmental organizations that have short–term maturities. Although reduced, liquidity ratios remain above the Bank’s policy minimum of 6%. Management will closely monitor and manage liquidity to minimize risk and ensure that adequate funds are available to meet daily customer requirements and loan demand.
Table 11—Maturity of Time Deposits of $100,000 or More
(Dollars in thousands)December 31, 2014 Contractual Terms
3 months or less $2,005
Over 3 through 6 months 5,252
Over 6 months through 1 year 1,458
Over 1 through five years 900
Over five years –
Total $9,615
2 0 1 4 A N N U A L R E P O R T 27
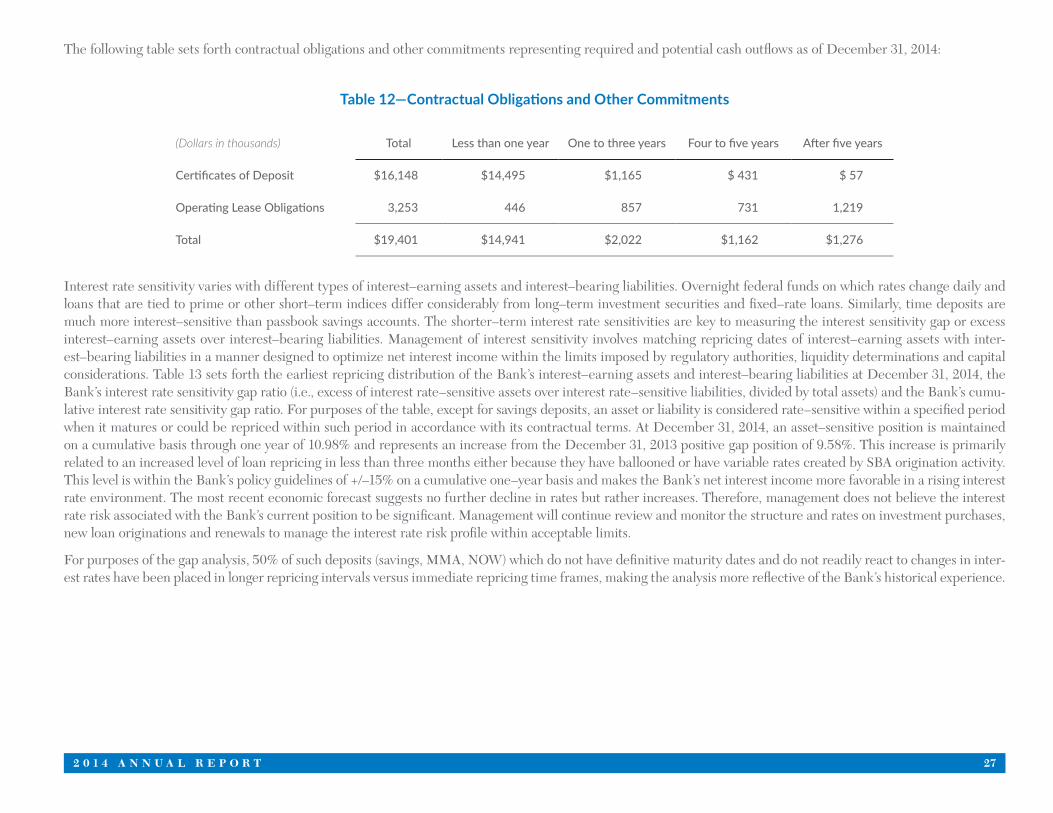
The following table sets forth contractual obligations and other commitments representing required and potential cash outflows as of December 31, 2014:
Table 12—Contractual Obligations and Other Commitments
(Dollars in thousands) Total Less than one year One to three years Four to five years After five years
Certificates of Deposit $16,148 $14,495 $1,165 $ 431 $ 57
Operating Lease Obligations 3,253 446 857 731 1,219
Total $19,401 $14,941 $2,022 $1,162 $1,276
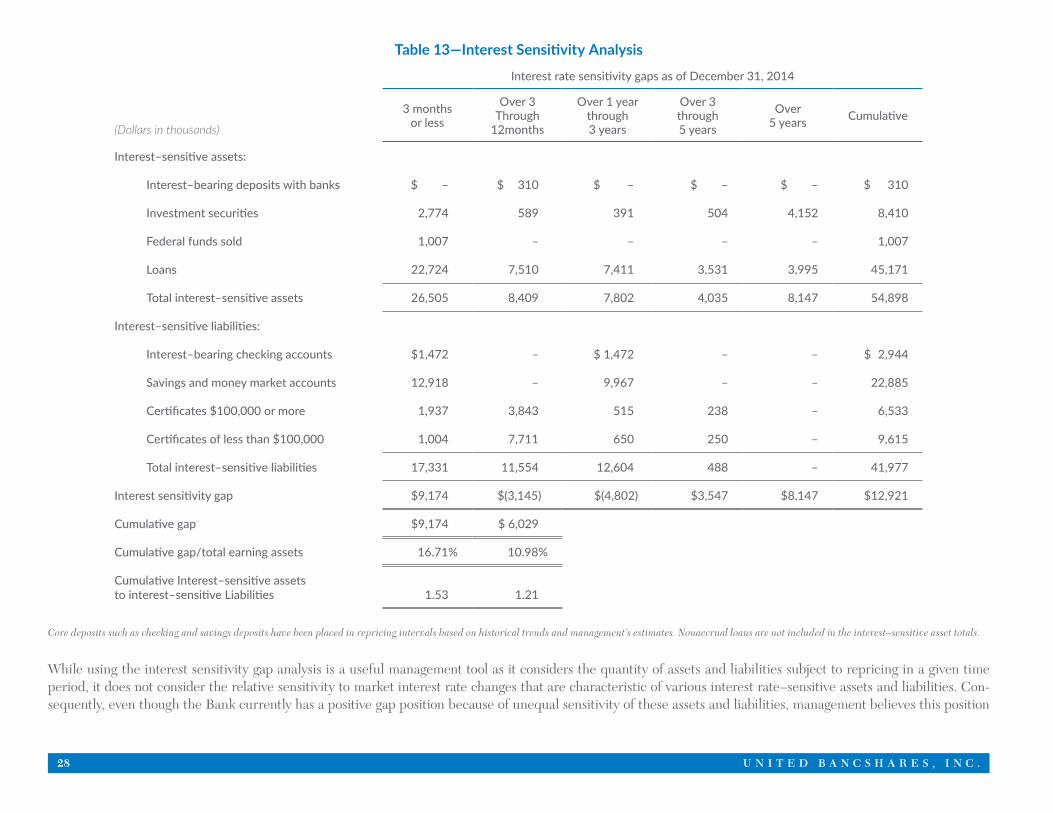
Interest rate sensitivity varies with different types of interest–earning assets and interest–bearing liabilities. Overnight federal funds on which rates change daily and loans that are tied to prime or other short–term indices differ considerably from long–term investment securities and fixed–rate loans. Similarly, time deposits are much more interest–sensitive than passbook savings accounts. The shorter–term interest rate sensitivities are key to measuring the interest sensitivity gap or excess interest–earning assets over interest–bearing liabilities. Management of interest sensitivity involves matching repricing dates of interest–earning assets with inter-est–bearing liabilities in a manner designed to optimize net interest income within the limits imposed by regulatory authorities, liquidity determinations and capital considerations. Table 13 sets forth the earliest repricing distribution of the Bank’s interest–earning assets and interest–bearing liabilities at December 31, 2014, the Bank’s interest rate sensitivity gap ratio (i.e., excess of interest rate–sensitive assets over interest rate–sensitive liabilities, divided by total assets) and the Bank’s cumu-lative interest rate sensitivity gap ratio. For purposes of the table, except for savings deposits, an asset or liability is considered rate–sensitive within a specified period when it matures or could be repriced within such period in accordance with its contractual terms. At December 31, 2014, an asset–sensitive position is maintained on a cumulative basis through one year of 10.98% and represents an increase from the December 31, 2013 positive gap position of 9.58%. This increase is primarily related to an increased level of loan repricing in less than three months either because they have ballooned or have variable rates created by SBA origination activity. This level is within the Bank’s policy guidelines of +/–15% on a cumulative one–year basis and makes the Bank’s net interest income more favorable in a rising interest rate environment. The most recent economic forecast suggests no further decline in rates but rather increases. Therefore, management does not believe the interest rate risk associated with the Bank’s current position to be significant. Management will continue review and monitor the structure and rates on investment purchases, new loan originations and renewals to manage the interest rate risk profile within acceptable limits.
For purposes of the gap analysis, 50% of such deposits (savings, MMA, NOW) which do not have definitive maturity dates and do not readily react to changes in inter-est rates have been placed in longer repricing intervals versus immediate repricing time frames, making the analysis more reflective of the Bank’s historical experience.
28 U N I T E D B A N C S H A R E S , I N C .
Table 13—Interest Sensitivity Analysis
Interest rate sensitivity gaps as of December 31, 2014
(Dollars in thousands)
3 months or less
Over 3Through
12months
Over 1 year through3 years
Over 3 through 5 years
Over5 years Cumulative
Interest–sensitive assets:
Interest–bearing deposits with banks $ – $ 310 $ – $ – $ – $ 310
Investment securities 2,774 589 391 504 4,152 8,410
Federal funds sold 1,007 – – – – 1,007
Loans 22,724 7,510 7,411 3,531 3,995 45,171
Total interest–sensitive assets 26,505 8,409 7,802 4,035 8,147 54,898
Interest–sensitive liabilities:
Interest–bearing checking accounts $1,472 – $ 1,472 – – $ 2,944
Savings and money market accounts 12,918 – 9,967 – – 22,885
Certificates $100,000 or more 1,937 3,843 515 238 – 6,533
Certificates of less than $100,000 1,004 7,711 650 250 – 9,615
Total interest–sensitive liabilities 17,331 11,554 12,604 488 – 41,977
Interest sensitivity gap $9,174 $(3,145) $(4,802) $3,547 $8,147 $12,921
Cumulative gap $9,174 $ 6,029
Cumulative gap/total earning assets 16.71% 10.98%
Cumulative Interest–sensitive assets to interest–sensitive Liabilities 1.53 1.21
Core deposits such as checking and savings deposits have been placed in repricing intervals based on historical trends and management’s estimates. Nonaccrual loans are not included in the interest–sensitive asset totals.
While using the interest sensitivity gap analysis is a useful management tool as it considers the quantity of assets and liabilities subject to repricing in a given time period, it does not consider the relative sensitivity to market interest rate changes that are characteristic of various interest rate–sensitive assets and liabilities. Con-sequently, even though the Bank currently has a positive gap position because of unequal sensitivity of these assets and liabilities, management believes this position
2 0 1 4 A N N U A L R E P O R T 29
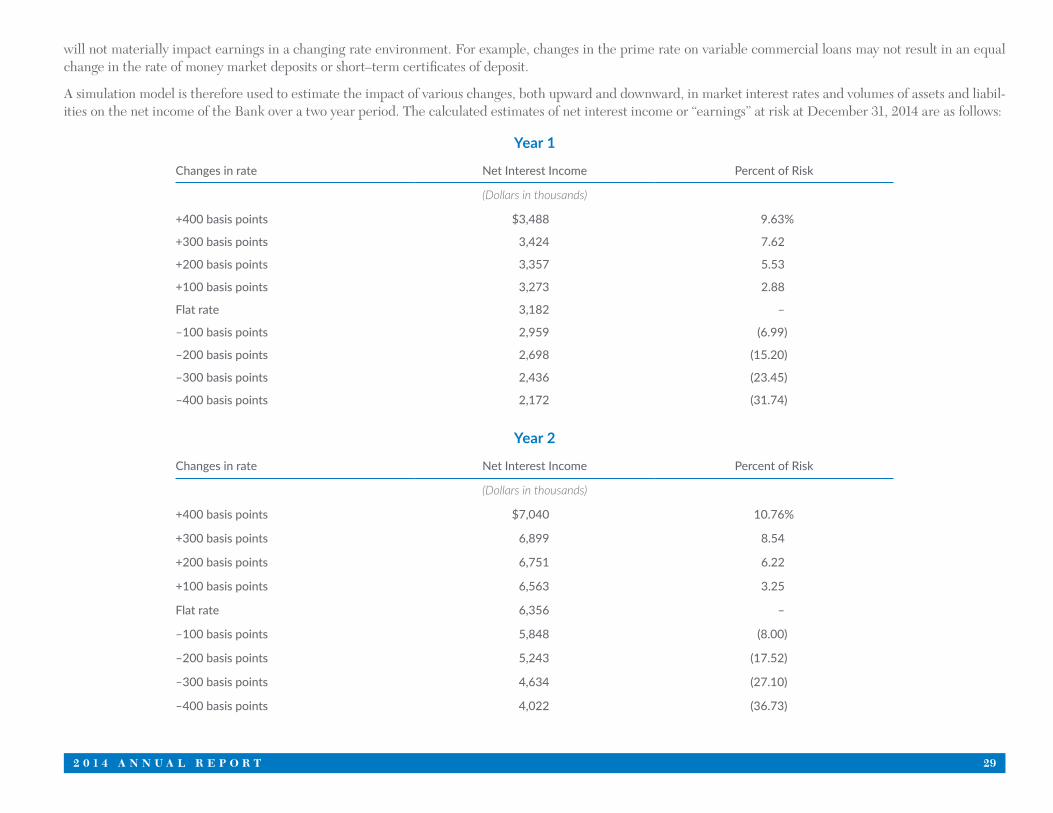
will not materially impact earnings in a changing rate environment. For example, changes in the prime rate on variable commercial loans may not result in an equal change in the rate of money market deposits or short–term certificates of deposit.
A simulation model is therefore used to estimate the impact of various changes, both upward and downward, in market interest rates and volumes of assets and liabil-ities on the net income of the Bank over a two year period. The calculated estimates of net interest income or “earnings” at risk at December 31, 2014 are as follows:
Year 1
Changes in rate Net Interest Income Percent of Risk
(Dollars in thousands)
+400 basis points
+300 basis points
+200 basis points
+100 basis points
Flat rate
–100 basis points
–200 basis points
–300 basis points
–400 basis points
$3,488
3,424
3,357
3,273
3,182
2,959
2,698
2,436
2,172
9.63%
7.62
5.53
2.88
–
(6.99)
(15.20)
(23.45)
(31.74)
Year 2
Changes in rate Net Interest Income Percent of Risk
(Dollars in thousands)
+400 basis points
+300 basis points
+200 basis points
+100 basis points
Flat rate
–100 basis points
–200 basis points
–300 basis points
–400 basis points
$7,040
6,899
6,751
6,563
6,356
5,848
5,243
4,634
4,022
10.76%
8.54
6.22
3.25
–
(8.00)
(17.52)
(27.10)
(36.73)
30 U N I T E D B A N C S H A R E S , I N C .
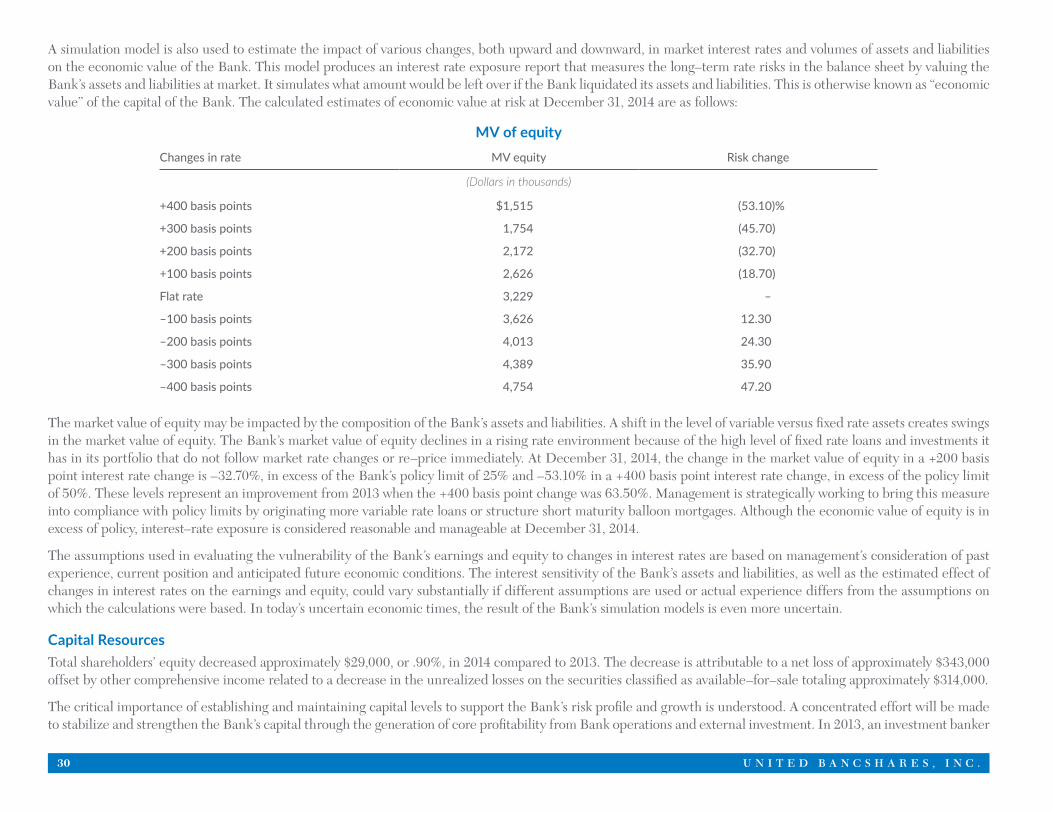
A simulation model is also used to estimate the impact of various changes, both upward and downward, in market interest rates and volumes of assets and liabilities on the economic value of the Bank. This model produces an interest rate exposure report that measures the long–term rate risks in the balance sheet by valuing the Bank’s assets and liabilities at market. It simulates what amount would be left over if the Bank liquidated its assets and liabilities. This is otherwise known as “economic value” of the capital of the Bank. The calculated estimates of economic value at risk at December 31, 2014 are as follows:
MV of equityChanges in rate MV equity Risk change
(Dollars in thousands)
+400 basis points
+300 basis points
+200 basis points
+100 basis points
Flat rate
–100 basis points
–200 basis points
–300 basis points
–400 basis points
$1,515
1,754
2,172
2,626
3,229
3,626
4,013
4,389
4,754
(53.10)%
(45.70)
(32.70)
(18.70)
–
12.30
24.30
35.90
47.20
The market value of equity may be impacted by the composition of the Bank’s assets and liabilities. A shift in the level of variable versus fixed rate assets creates swings in the market value of equity. The Bank’s market value of equity declines in a rising rate environment because of the high level of fixed rate loans and investments it has in its portfolio that do not follow market rate changes or re–price immediately. At December 31, 2014, the change in the market value of equity in a +200 basis point interest rate change is –32.70%, in excess of the Bank’s policy limit of 25% and –53.10% in a +400 basis point interest rate change, in excess of the policy limit of 50%. These levels represent an improvement from 2013 when the +400 basis point change was 63.50%. Management is strategically working to bring this measure into compliance with policy limits by originating more variable rate loans or structure short maturity balloon mortgages. Although the economic value of equity is in excess of policy, interest–rate exposure is considered reasonable and manageable at December 31, 2014.
The assumptions used in evaluating the vulnerability of the Bank’s earnings and equity to changes in interest rates are based on management’s consideration of past experience, current position and anticipated future economic conditions. The interest sensitivity of the Bank’s assets and liabilities, as well as the estimated effect of changes in interest rates on the earnings and equity, could vary substantially if different assumptions are used or actual experience differs from the assumptions on which the calculations were based. In today’s uncertain economic times, the result of the Bank’s simulation models is even more uncertain.
Capital ResourcesTotal shareholders’ equity decreased approximately $29,000, or .90%, in 2014 compared to 2013. The decrease is attributable to a net loss of approximately $343,000 offset by other comprehensive income related to a decrease in the unrealized losses on the securities classified as available–for–sale totaling approximately $314,000.
The critical importance of establishing and maintaining capital levels to support the Bank’s risk profile and growth is understood. A concentrated effort will be made to stabilize and strengthen the Bank’s capital through the generation of core profitability from Bank operations and external investment. In 2013, an investment banker
2 0 1 4 A N N U A L R E P O R T 31
was engaged to assist with raising a minimum investment of $2 million. Although the Bank has approximately $750,000 in commitments from several financial insti-tutions in the region, the timing of the investment is uncertain.
Federal and state banking laws impose on financial institutions such as UBS and the Bank certain minimum requirements for capital adequacies. The Company and the Bank are each generally required to maintain a minimum ratio of total capital to risk rated assets of 8%. At least half of the total capital must be composed of “Tier I Capital” which is defined as common equity, retained earnings and qualified perpetual preferred stock, less certain intangibles. The remainder may consist of “Tier II Capital” which is defined as specific subordinated debt, some hybrid capital instruments and other qualifying preferred stock and a limited amount of loan loss allowance. Also, federal banking regulatory agencies have established minimum leverage capital requirements for banking organizations. Under these requirements, banking organizations must maintain a minimum of Tier I Capital to adjusted average quarterly assets equal to 3% to 5%, subject to bank regulatory evaluation of an organization’s overall safety and soundness. Under the federal banking regulations, a financial institution would be deemed to “adequately capitalized” or better if it exceeds the minimum federal regulatory capital requirements. A financial institution would be deemed “undercapitalized” if it fails to meet the minimum capital requirements and significantly undercapitalized if it has a total risk based capital ratio that is less than 6%, Tier I risk based capital ratio is less than 3%, or a leverage ratio that is less than 3% and “critically undercapitalized” if the institution has a ratio of tangible equity to total assets that is equal to less than 2%. UBS and the Bank are “well–capitalized” for regulatory capital purposes based upon the most recent notification under regulatory framework for prompt corrective action.
On January 31, 2012, the Bank entered into a Consent Order with its primary regulators that requires the development of a written capital plan (“Capital Plan”) that details the manner in which the Bank will meet and maintain a Leverage Ratio of at least 8.50% and a Total Risk–Based Capital Ratio of at least 12.50%. At a minimum, the Capital Plan must include specific benchmark Leverage Ratios and Total Risk–Based Capital Ratios to be met at each calendar quarter–end, until the required capital levels are achieved.
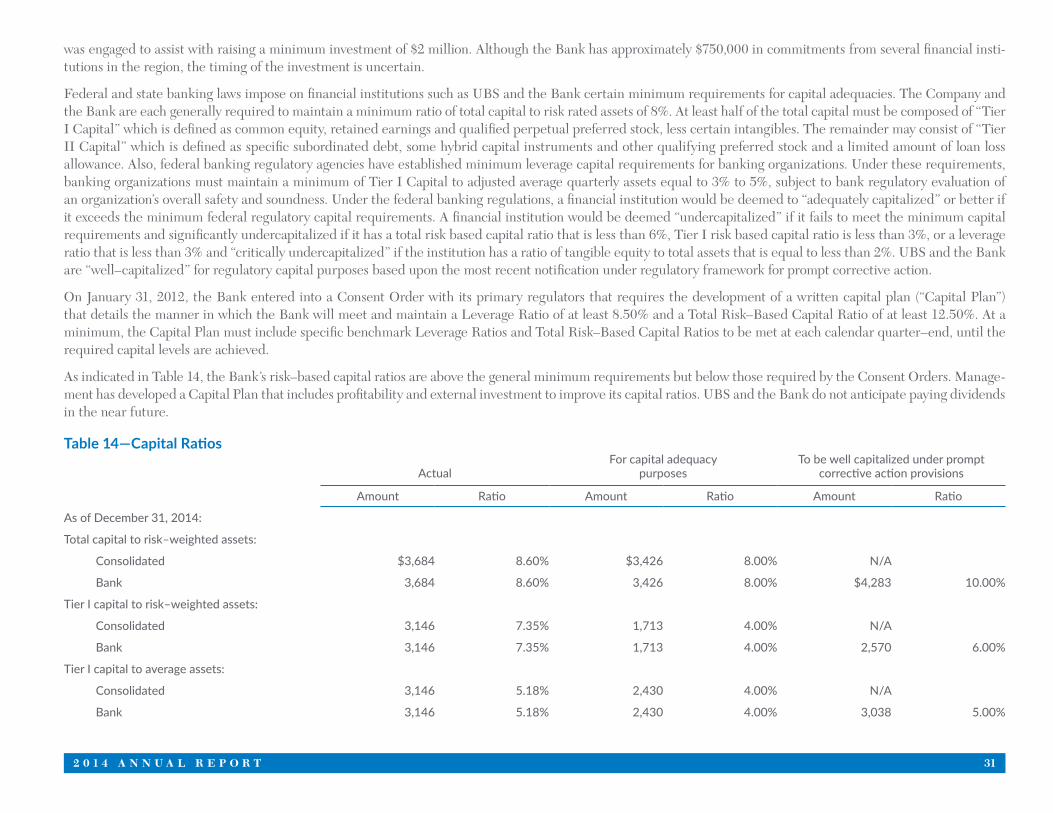
As indicated in Table 14, the Bank’s risk–based capital ratios are above the general minimum requirements but below those required by the Consent Orders. Manage-ment has developed a Capital Plan that includes profitability and external investment to improve its capital ratios. UBS and the Bank do not anticipate paying dividends in the near future.
Table 14—Capital Ratios
ActualFor capital adequacy
purposesTo be well capitalized under prompt
corrective action provisions
Amount Ratio Amount Ratio Amount Ratio
As of December 31, 2014:
Total capital to risk–weighted assets:
Consolidated $3,684 8.60% $3,426 8.00% N/A
Bank 3,684 8.60% 3,426 8.00% $4,283 10.00%
Tier I capital to risk–weighted assets:
Consolidated 3,146 7.35% 1,713 4.00% N/A
Bank 3,146 7.35% 1,713 4.00% 2,570 6.00%
Tier I capital to average assets:
Consolidated 3,146 5.18% 2,430 4.00% N/A
Bank 3,146 5.18% 2,430 4.00% 3,038 5.00%


AU D I T E D
F I N A N C I A L
S TAT E M E N T S


Report of Independent Registered Public Accounting Firm
To the Board of Directors and Shareholders United Bancshares, Inc. and Subsidiary
We have audited the consolidated balance sheets of United Bancshares, Inc. and Subsidiary (the “Company”) as of December 31, 2014 and 2013 and the related con-solidated statements of operations and comprehensive loss, changes in shareholders’ equity, and cash flows for the years then ended.
We conducted our audits in accordance with the standards of the Public Company Accounting Oversight Board (United States). Those standards require that we plan and perform the audit to obtain reasonable assurance about whether the financial statements are free of material misstatement. The Company is not required to have, nor were we engaged to perform, an audit of its internal control over financial reporting. Our audits included consideration of internal control over financial reporting as a basis for designing audit procedures that are appropriate in the circumstances, but not for the purpose of expressing an opinion on the effectiveness of the Compa-ny’s internal control over financial reporting. Accordingly, we express no such opinion. An audit includes examining, on a test basis, evidence supporting the amounts and disclosures in the financial statements, assessing the accounting principles used and significant estimates made by management, as well as evaluating the overall financial statement presentation. We believe that our audits provide a reasonable basis for our opinion.
In our opinion, the consolidated financial statements referred to above present fairly, in all material respects, the financial position of United Bancshares, Inc. and Sub-sidiary as of December 31, 2014 and 2013, and the results of their operations and their cash flows for the years then ended, in conformity with U.S. generally accepted accounting principles.
The accompanying consolidated financial statements have been prepared assuming that the Company will continue as a going concern. As discussed in Note 13 to the consolidated financial statements, at December 31, 2014, the Company’s regulatory capital amounts and ratios are below the required levels stipulated with Consent Orders between the Company and its regulators under the regulatory framework for prompt corrective action. Failure to meet the capital requirements exposes the Company to regulatory sanctions that may include restrictions on operations and growth, mandatory asset disposition, and seizure of the Company. These matters raise substantial doubt about the ability of the Company to continue as a going concern. The accompanying consolidated financial statements do not include any adjustments that would be necessary should the Company be unable to continue as a going concern.
Blue Bell, Pennsylvania June 26, 2015
36 U N I T E D B A N C S H A R E S , I N C .
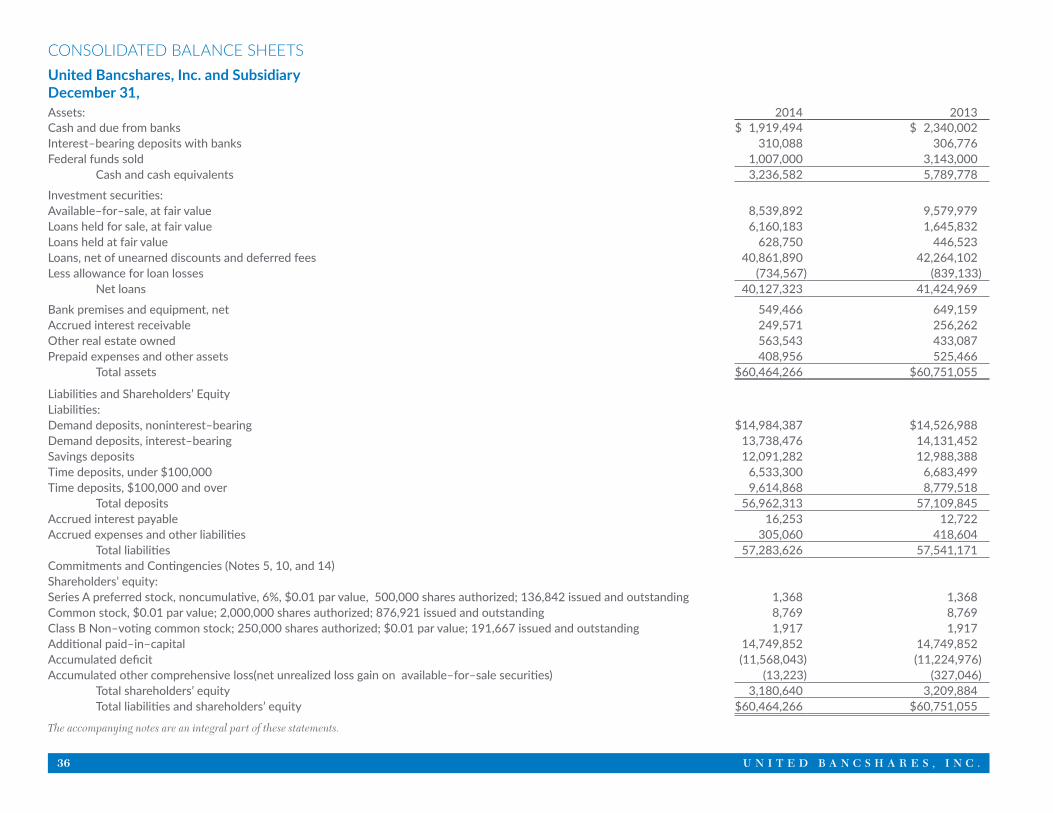
CONSOLIDATED BALANCE SHEETSUnited Bancshares, Inc. and Subsidiary December 31, Assets: 2014 2013Cash and due from banks $ 1,919,494 $ 2,340,002Interest–bearing deposits with banks 310,088 306,776Federal funds sold 1,007,000 3,143,000 Cash and cash equivalents 3,236,582 5,789,778
Investment securities:Available–for–sale, at fair value 8,539,892 9,579,979Loans held for sale, at fair value 6,160,183 1,645,832Loans held at fair value 628,750 446,523Loans, net of unearned discounts and deferred fees 40,861,890 42,264,102Less allowance for loan losses (734,567) (839,133) Net loans 40,127,323 41,424,969
Bank premises and equipment, net 549,466 649,159Accrued interest receivable 249,571 256,262Other real estate owned 563,543 433,087Prepaid expenses and other assets 408,956 525,466 Total assets $60,464,266 $60,751,055
Liabilities and Shareholders’ EquityLiabilities:Demand deposits, noninterest–bearing $14,984,387 $14,526,988Demand deposits, interest–bearing 13,738,476 14,131,452Savings deposits 12,091,282 12,988,388Time deposits, under $100,000 6,533,300 6,683,499Time deposits, $100,000 and over 9,614,868 8,779,518 Total deposits 56,962,313 57,109,845Accrued interest payable 16,253 12,722Accrued expenses and other liabilities 305,060 418,604 Total liabilities 57,283,626 57,541,171Commitments and Contingencies (Notes 5, 10, and 14)Shareholders’ equity:Series A preferred stock, noncumulative, 6%, $0.01 par value, 500,000 shares authorized; 136,842 issued and outstanding 1,368 1,368Common stock, $0.01 par value; 2,000,000 shares authorized; 876,921 issued and outstanding 8,769 8,769Class B Non–voting common stock; 250,000 shares authorized; $0.01 par value; 191,667 issued and outstanding 1,917 1,917Additional paid–in–capital 14,749,852 14,749,852Accumulated deficit (11,568,043) (11,224,976)Accumulated other comprehensive loss(net unrealized loss gain on available–for–sale securities) (13,223) (327,046) Total shareholders’ equity 3,180,640 3,209,884 Total liabilities and shareholders’ equity $60,464,266 $60,751,055
The accompanying notes are an integral part of these statements.
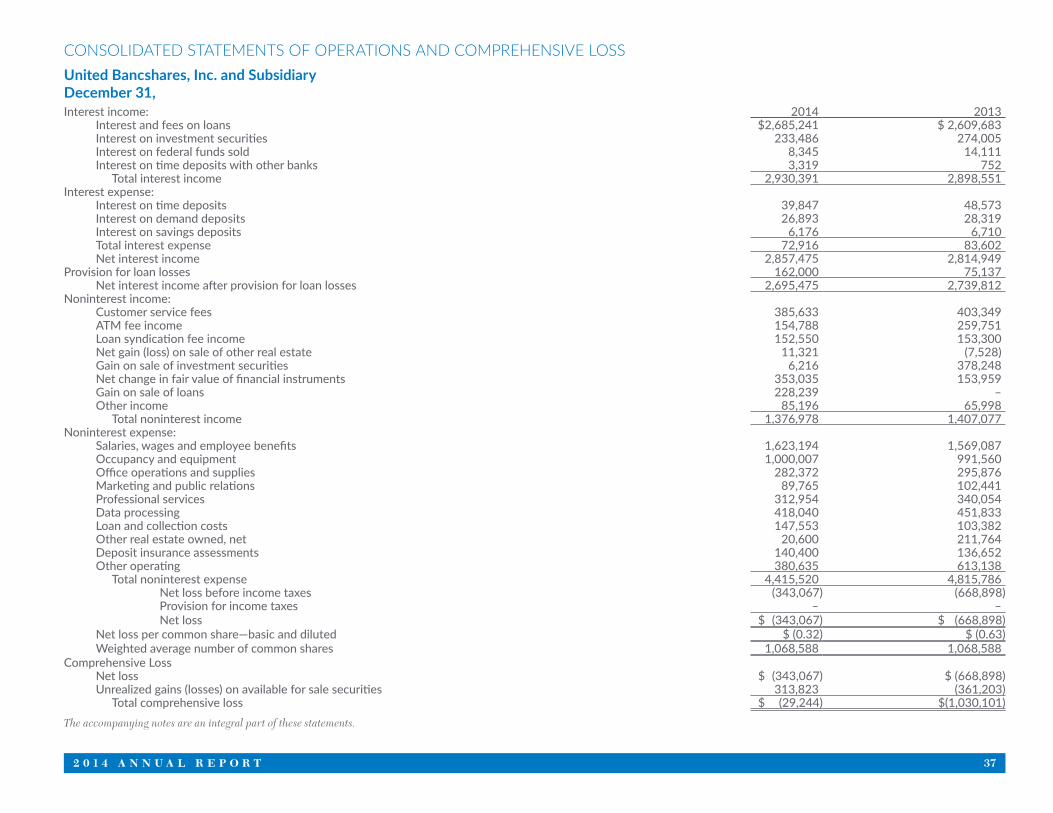
2 0 1 4 A N N U A L R E P O R T 37
CONSOLIDATED STATEMENTS OF OPERATIONS AND COMPREHENSIVE LOSSUnited Bancshares, Inc. and Subsidiary December 31, Interest income: 2014 2013 Interest and fees on loans $2,685,241 $ 2,609,683 Interest on investment securities 233,486 274,005 Interest on federal funds sold 8,345 14,111 Interest on time deposits with other banks 3,319 752 Total interest income 2,930,391 2,898,551Interest expense: Interest on time deposits 39,847 48,573 Interest on demand deposits 26,893 28,319 Interest on savings deposits 6,176 6,710 Total interest expense 72,916 83,602 Net interest income 2,857,475 2,814,949Provision for loan losses 162,000 75,137 Net interest income after provision for loan losses 2,695,475 2,739,812Noninterest income: Customer service fees 385,633 403,349 ATM fee income 154,788 259,751 Loan syndication fee income 152,550 153,300 Net gain (loss) on sale of other real estate 11,321 (7,528) Gain on sale of investment securities 6,216 378,248 Net change in fair value of financial instruments 353,035 153,959 Gain on sale of loans 228,239 – Other income 85,196 65,998 Total noninterest income 1,376,978 1,407,077Noninterest expense: Salaries, wages and employee benefits 1,623,194 1,569,087 Occupancy and equipment 1,000,007 991,560 Office operations and supplies 282,372 295,876 Marketing and public relations 89,765 102,441 Professional services 312,954 340,054 Data processing 418,040 451,833 Loan and collection costs 147,553 103,382 Other real estate owned, net 20,600 211,764 Deposit insurance assessments 140,400 136,652 Other operating 380,635 613,138 Total noninterest expense 4,415,520 4,815,786 Net loss before income taxes (343,067) (668,898) Provision for income taxes – – Net loss $ (343,067) $ (668,898) Net loss per common share—basic and diluted $ (0.32) $ (0.63) Weighted average number of common shares 1,068,588 1,068,588Comprehensive Loss Net loss $ (343,067) $ (668,898) Unrealized gains (losses) on available for sale securities 313,823 (361,203) Total comprehensive loss $ (29,244) $(1,030,101)The accompanying notes are an integral part of these statements.
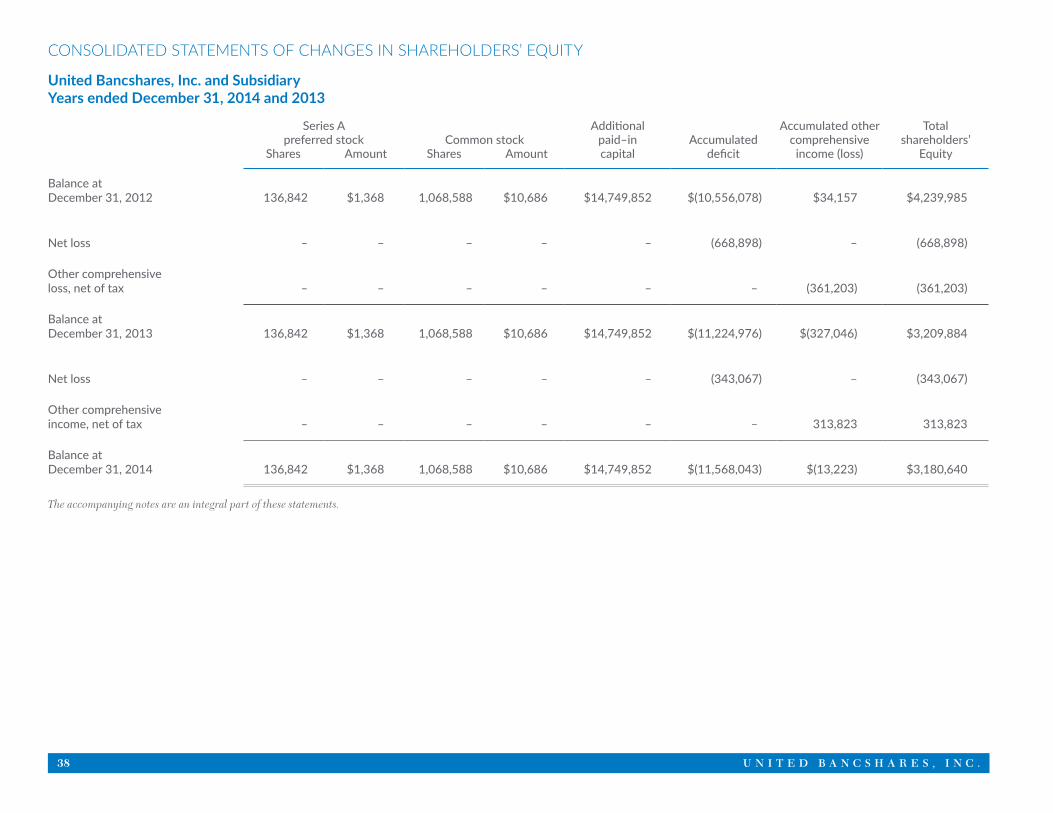
38 U N I T E D B A N C S H A R E S , I N C .
CONSOLIDATED STATEMENTS OF CHANGES IN SHAREHOLDERS’ EQUITY
United Bancshares, Inc. and Subsidiary Years ended December 31, 2014 and 2013
Series A preferred stock
Shares AmountCommon stock
Shares Amount
Additionalpaid–incapital
Accumulateddeficit
Accumulated othercomprehensive
income (loss)
Totalshareholders’
Equity
Balance at December 31, 2012 136,842 $1,368 1,068,588 $10,686 $14,749,852 $(10,556,078) $34,157 $4,239,985
Net loss – – – – – (668,898) – (668,898)
Other comprehensive loss, net of tax – – – – – – (361,203) (361,203)
Balance at December 31, 2013 136,842 $1,368 1,068,588 $10,686 $14,749,852 $(11,224,976) $(327,046) $3,209,884
Net loss – – – – – (343,067) – (343,067)
Other comprehensive income, net of tax – – – – – – 313,823 313,823
Balance at December 31, 2014 136,842 $1,368 1,068,588 $10,686 $14,749,852 $(11,568,043) $(13,223) $3,180,640
The accompanying notes are an integral part of these statements.
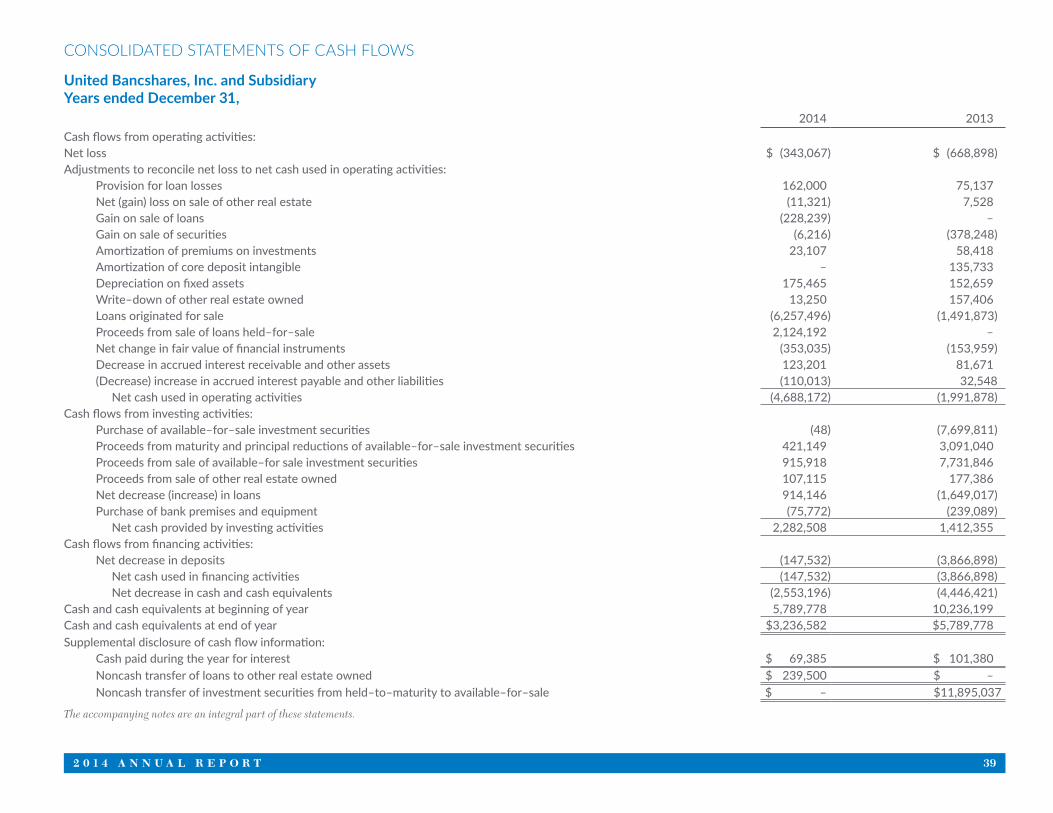
2 0 1 4 A N N U A L R E P O R T 39
CONSOLIDATED STATEMENTS OF CASH FLOWS
United Bancshares, Inc. and Subsidiary Years ended December 31,
2014 2013Cash flows from operating activities:Net loss $ (343,067) $ (668,898)Adjustments to reconcile net loss to net cash used in operating activities: Provision for loan losses 162,000 75,137 Net (gain) loss on sale of other real estate (11,321) 7,528 Gain on sale of loans (228,239) – Gain on sale of securities (6,216) (378,248) Amortization of premiums on investments 23,107 58,418 Amortization of core deposit intangible – 135,733 Depreciation on fixed assets 175,465 152,659 Write–down of other real estate owned 13,250 157,406 Loans originated for sale (6,257,496) (1,491,873) Proceeds from sale of loans held–for–sale 2,124,192 – Net change in fair value of financial instruments (353,035) (153,959) Decrease in accrued interest receivable and other assets 123,201 81,671 (Decrease) increase in accrued interest payable and other liabilities (110,013) 32,548 Net cash used in operating activities (4,688,172) (1,991,878)Cash flows from investing activities: Purchase of available–for–sale investment securities (48) (7,699,811) Proceeds from maturity and principal reductions of available–for–sale investment securities 421,149 3,091,040 Proceeds from sale of available–for sale investment securities 915,918 7,731,846 Proceeds from sale of other real estate owned 107,115 177,386 Net decrease (increase) in loans 914,146 (1,649,017) Purchase of bank premises and equipment (75,772) (239,089) Net cash provided by investing activities 2,282,508 1,412,355Cash flows from financing activities: Net decrease in deposits (147,532) (3,866,898) Net cash used in financing activities (147,532) (3,866,898) Net decrease in cash and cash equivalents (2,553,196) (4,446,421)Cash and cash equivalents at beginning of year 5,789,778 10,236,199Cash and cash equivalents at end of year $3,236,582 $5,789,778Supplemental disclosure of cash flow information: Cash paid during the year for interest $ 69,385 $ 101,380 Noncash transfer of loans to other real estate owned $ 239,500 $ – Noncash transfer of investment securities from held–to–maturity to available–for–sale $ – $11,895,037
The accompanying notes are an integral part of these statements.
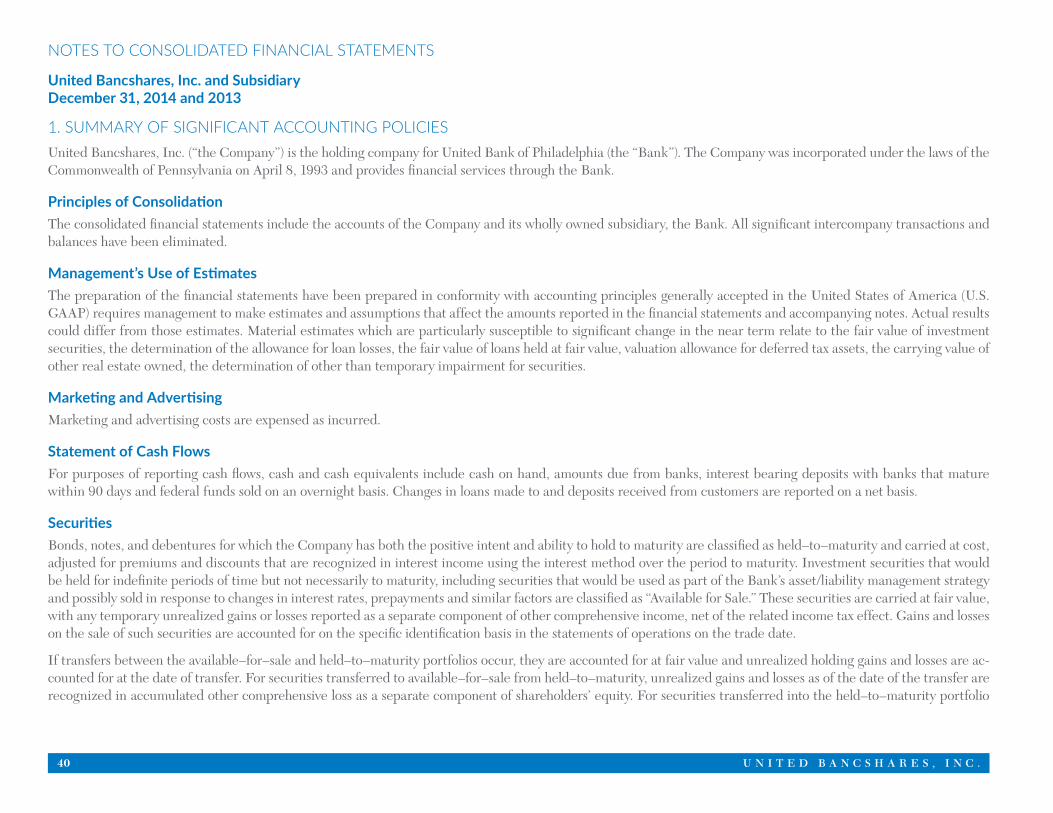
40 U N I T E D B A N C S H A R E S , I N C .
NOTES TO CONSOLIDATED FINANCIAL STATEMENTS
United Bancshares, Inc. and Subsidiary December 31, 2014 and 2013
1. SUMMARY OF SIGNIFICANT ACCOUNTING POLICIESUnited Bancshares, Inc. (“the Company”) is the holding company for United Bank of Philadelphia (the “Bank”). The Company was incorporated under the laws of the Commonwealth of Pennsylvania on April 8, 1993 and provides financial services through the Bank.
Principles of ConsolidationThe consolidated financial statements include the accounts of the Company and its wholly owned subsidiary, the Bank. All significant intercompany transactions and balances have been eliminated.
Management’s Use of EstimatesThe preparation of the financial statements have been prepared in conformity with accounting principles generally accepted in the United States of America (U.S. GAAP) requires management to make estimates and assumptions that affect the amounts reported in the financial statements and accompanying notes. Actual results could differ from those estimates. Material estimates which are particularly susceptible to significant change in the near term relate to the fair value of investment securities, the determination of the allowance for loan losses, the fair value of loans held at fair value, valuation allowance for deferred tax assets, the carrying value of other real estate owned, the determination of other than temporary impairment for securities.
Marketing and AdvertisingMarketing and advertising costs are expensed as incurred.
Statement of Cash FlowsFor purposes of reporting cash flows, cash and cash equivalents include cash on hand, amounts due from banks, interest bearing deposits with banks that mature within 90 days and federal funds sold on an overnight basis. Changes in loans made to and deposits received from customers are reported on a net basis.
Securities Bonds, notes, and debentures for which the Company has both the positive intent and ability to hold to maturity are classified as held–to–maturity and carried at cost, adjusted for premiums and discounts that are recognized in interest income using the interest method over the period to maturity. Investment securities that would be held for indefinite periods of time but not necessarily to maturity, including securities that would be used as part of the Bank’s asset/liability management strategy and possibly sold in response to changes in interest rates, prepayments and similar factors are classified as “Available for Sale.” These securities are carried at fair value, with any temporary unrealized gains or losses reported as a separate component of other comprehensive income, net of the related income tax effect. Gains and losses on the sale of such securities are accounted for on the specific identification basis in the statements of operations on the trade date.
If transfers between the available–for–sale and held–to–maturity portfolios occur, they are accounted for at fair value and unrealized holding gains and losses are ac-counted for at the date of transfer. For securities transferred to available–for–sale from held–to–maturity, unrealized gains and losses as of the date of the transfer are recognized in accumulated other comprehensive loss as a separate component of shareholders’ equity. For securities transferred into the held–to–maturity portfolio
2 0 1 4 A N N U A L R E P O R T 41
from available–for–sale, unrealized gains and losses as of the date of the transfer continue to be reported in accumulated other comprehensive loss, and are amortized over the remaining life of the security as an adjustment to its yield, consistent with amortization of the premium or accretion of the discount.
Management evaluates securities for other–than–temporary impairment at least on a quarterly basis, and more frequently when economic or market concern war-rants such evaluation. Declines in the fair value of individual debt securities below their cost that are deemed to be other than temporary result in write–downs of the individual securities to their fair value. Debt securities that are deemed to be other–than–temporarily impaired are reflected in earnings as realized losses to the extent impairment is related to credit losses. The amount of the impairment for debt securities related to other factors is recognized in other comprehensive income. In evaluating whether impairment is temporary or other–than–temporary, management first considers whether the Bank intends to sell the security or it is more–like-ly–than–not that the Bank will be required to sell the security prior to recovery. In these circumstances, the loss is determined to be other–than–temporary and the difference between the security’s fair value and its amortized cost is reflected as a loss in the statement of operations. If management does not intend to sell the security and likely will not be required to sell the security prior to forecasted recovery, management evaluates whether it expects to recover the entire amortized cost of the debt security or if there is a credit loss. In evaluating whether there is a credit loss, management considers various qualitative factors which include (1) the length of time and the extent to which the fair value has been less than cost, (2) the reasons for the decline in the fair value, and (3) the financial position and access to capital of the issuer, including the current and future impact of any specific events. If, based on an analysis of these factors, management concludes that there is a credit loss, then management calculates the expected cash flows and records a loss in earnings equal to the difference between the amortized cost of the debt security and the expected present value of cash flows. The portion of the decline in fair value that is due to factors other than credit loss is recognized in other comprehensive income. No investment securities held by the Bank as of December 31, 2013 and 2012 were subjected to a write–down due to credit related other–than–temporary impair-ment. Interest income from securities adjusted for the amortization of premiums and accretion of discounts is recognized in interest income using the interest method over the contractual lives of the related securities. Realized gains and losses, determined using the amortized cost value of the specific securities sold, are included in noninterest income in the statement of operations.
Transfers of Financial AssetsTransfers of financial assets are accounted for as sales when all the components meet the definition of a participating interest and when control over the assets has been surrendered. A participating interest generally represents (1) a proportionate (pro rata) ownership interest in an entire financial assets, (2) a relationship where from the date of transfer all cash flows received from the entire financial asset are divided proportionately among the participating interest holders in an amount equal to their share of ownership, (3) the priority of cash flows has certain characteristics, including no reduction in priority, subordination of interest, or recourse to the transferor other than standard representation or warranties, and (4) no party has the right to pledge or exchange the entire financial asset unless all participating interest holders agree to pledge or exchange the entire financial asset. Control over transferred assets is deemed to be surrendered when (1) the assets have been isolated from the Bank, (2) the transferee obtains the right (free of conditions that constrain it from taking advantage of that right) to pledge or exchange the transferred assets, and (3) the Bank does not maintain effective control over the transferred assets through an agreement to repurchase them before their maturity.
Loans Held for SaleFrom time to time, the Bank originates SBA loans for which the guaranteed portion is intended to be sold within a short period of time in the secondary market. These loans are classified as held–for–sale and carried at estimated fair value based on a loan–by–loan valuation using actual market bids in accordance with the irrevocable option permitted under Accounting Standards Codification (“ASC”) 825–10–25 Financial Instruments. For the years ended December 31, 2014 and 2013, the Bank recorded a net change in fair value of financial instruments totaling approximately $438,000 and $154,000, respectively, related to the SBA loans held for sale and the retained un–guaranteed portion of SBA loans held by the Bank and carried at fair value.
42 U N I T E D B A N C S H A R E S , I N C .
Loans Held at Fair Value From time to time, the Bank originates SBA loans for which the un–guaranteed portion is retained after the guaranteed portion is sold in the secondary market. Management has elected to carry these loans at fair value. Fair value of these loans is estimated based on the present value of future cashflows for each asset based on their unique characteristics, market–based assumptions for prepayment speeds, discount rates, default and voluntary prepayments as well as assumptions for losses and recoveries.
LoansThe Bank has both the positive intent and ability to hold the majority of its loans to maturity. These loans are stated at the amount of unpaid principal, reduced by net unearned discount and an allowance for loan losses. Interest income on loans is recognized as earned based on contractual interest rates applied to daily principal amounts outstanding and accretion of discount. It is the Bank’s policy to discontinue the accrual of interest income when a default of principal or interest exists for a period of 90 days except when, in management’s judgment, the loan is well collateralized and in the process of collection. Interest received on nonaccrual loans is either applied against principal or reported as interest income according to management’s judgment as to collectability of principal. When interest accruals are discontinued, unpaid accrued interest previously credited to income is reversed and the loan is classified as impaired.
Non–accrual and Past Due LoansLoans are considered past due if the required principal and interest payments have not been received 30 days as of the date such payments were due. The Bank generally places a loan on non–accrual status when interest or principal is past due 90 days or more. If it otherwise appears doubtful that the loan will be repaid, management may place the loan on nonaccrual status before the lapse of 90 days. Loans are returned to accrual status when all the principal and interest amounts contractually due are brought current and future payments are reasonably assured.
Unearned discounts are amortized over the weighted average maturity of the related mortgage loan portfolio. Loan origination and commitment fees and certain direct loan origination costs are deferred, and the net amount is amortized as an adjustment of the related loan’s yield. The Bank is amortizing these amounts over the contractual life of the loan.
For purchased loans, the discount remaining after the loan loss allocation is being amortized over the remaining life of the purchased loans using the interest method.
Allowance for Loan LossesThe allowance for loan losses is established as losses are estimated to have occurred through a provision for loan losses. Loans that are determined to be uncollect-ible are charged against the allowance account, and subsequent recoveries, if any, are credited to the allowance. When evaluating the adequacy of the allowance, an assessment of the loan portfolio will typically include changes in the composition and volume of the loan portfolio, overall portfolio quality and past loss experience, review of specific problem loans, current economic conditions which may affect borrowers’ ability to repay, and other factors which may warrant current recognition. Such periodic assessments may, in management’s judgment, require the Bank to recognize additions or reductions to the allowance.
Various regulatory agencies periodically review the adequacy of the Bank’s allowance for loan losses as an integral part of their examination process. Such agencies may require the Bank to recognize additions or reductions to the allowance based on their evaluation of information available to them at the time of their examination. It is reasonably possible that the above factors may change significantly and, therefore, affects management’s determination of the allowance for loan losses in the near term.
The allowance consists of specific and general components. The specific component relates to loans that are classified as impaired. For those loans that are classified as impaired, an allowance is established when the discounted cash flows (or collateral value or observable market price) of the impaired loan is lower than the carrying
2 0 1 4 A N N U A L R E P O R T 43
value of that loan. The general component covers non–impaired loans and is based on historical charge–off experience, other qualitative factors, and adjustments made to the allowance for pools of loans after an assessment of internal or external influences on credit quality that are not fully reflected in the historical loss or risk rating data. The Bank does not allocate reserves for unfunded commitments to fund lines of credit.
A loan is considered impaired when, based on current information and events, it is probable that the Bank will be unable to collect the scheduled payments of princi-pal or interest when due according to the contractual terms of the loan agreement. Factors considered by management in determining impairment include payment status, collateral value, and the probability of collecting scheduled principal and interest payments when due. Loans that experience insignificant payment delays and payment shortfalls generally are not classified as impaired. Management determines the significance of payment delays and payment shortfalls on a case–by–case basis, taking into consideration all of the circumstances surrounding the loan and the borrower, including the length of the delay, the reasons for the delay, the borrower’s prior payment record, and the amount of the shortfall in relation to the principal and interest owed. The Bank will identify and assess loans that may be impaired through any of the following processes:
• During regularly scheduled meetings of the Asset Quality Committee
• During regular reviews of the delinquency report
• During the course of routine account servicing, annual review, or credit file update
• Upon receipt of verifiable evidence of a material reduction in the value of collateral to a level that creates a less than desirable loan–to–value ratio
Impairment is measured on a loan by loan basis for commercial loans by either the present value of expected future cash flows discounted at the loan’s effective interest rate, the loan’s obtainable market price, or the fair value of the collateral if the loan is collateral dependent.
Large groups of smaller, homogeneous loans, including consumer installment and home equity loans, 1–4 family residential mortgages, and student loans are evaluated collectively for impairment. Accordingly, the Bank does not separately identify individual consumer and residential loans for impairment disclosures.
Bank Premises and EquipmentBank premises and equipment are stated at cost less accumulated depreciation. Depreciation is computed on the straight–line method over the estimated useful lives of the assets. Amortization of leasehold improvements is computed over the shorter of the related lease term or the useful life of the assets.
Income TaxesThe liability method is used in accounting for income taxes. Deferred tax assets and liabilities are determined based on differences between financial reporting and tax bases of assets and liabilities and are measured using the enacted tax rates and laws that will be in effect when the differences are expected to reverse. Deferred tax assets are reduced by a valuation allowance when, in the opinion of management, it is more likely than not that some portion or all of the deferred tax assets will not be realized. Deferred tax assets and liabilities are adjusted for the effects of changes in tax laws and rates on the date of enactment. Realization of deferred tax assets is dependent on generating sufficient taxable income in the future.
When tax returns are filed, it is highly certain that some positions taken would be sustained upon examination by the taxing authorities, while others are subject to uncertainty about the merits of the position taken or the amount of the position that ultimately would be sustained. The benefit of a tax position is recognized in the financial statements in the period during which, based on all available evidence, management believes it is more–likely–than not that the position will be sustained upon examination, including the resolution of appeals or litigation processes, if any. The evaluation of a tax position taken is considered by itself and not offset or ag-gregated with other positions. Tax positions that meet the more–likely–than not recognition threshold are measured as the largest amount of tax benefit that is more than 50 percent likely of being realized upon settlement with the applicable taxing authority. The portion of benefits associated with tax positions taken that exceeds

44 U N I T E D B A N C S H A R E S , I N C .
the amount measured as described above is reflected as a liability for unrecognized tax benefits in the accompanying balance sheet along with any associated interest and penalties that would be payable to the taxing authorities upon examination. It is the Bank’s policy to recognize interest and penalties related to unrecognized tax liabilities within income tax expense in the statement of operations.
The Bank does not have an accrual for uncertain tax positions as of December 31, 2014 or 2013, as deductions taken and benefits accrued are based on widely under-stood administrative practices and procedures and are based on clear and unambiguous tax law.
Loss Per Share (“EPS”)Basic EPS excludes dilution and is computed by dividing income (loss) available to common shareholders by the weighted average common shares outstanding during the period. Diluted EPS takes into account the potential dilution that could occur if securities or other contracts to issue common stock were exercised and converted into common stock.
Off–Balance–Sheet Financial InstrumentsIn the ordinary course of business, the Bank has entered into off–balance–sheet financial instruments consisting of commitments to extend credit and letters of credit. Such financial instruments are recorded in the financial statements when they become payable.
Intangible Assets On September 24, 1999, the Bank acquired four branches from First Union Corporation with deposits totaling $31.5 million. As a result of the acquisition, the Bank recorded a core deposit intangible of $2,449,488. The core deposit intangible was amortized over 14 years.
Amortization of the intangible totaled approximately $136,000 for the year ended December 31, 2013 and was fully amortized. Intangible assets are reviewed for pos-sible impairment when events or changed circumstances may affect the underlying basis of the net asset. Such reviews include an analysis of current results and take into consideration the discounted value of projected operating cash flows. No impairment has been recognized.
Other Real Estate OwnedReal estate properties acquired through, or in lieu of, loan foreclosure are to be sold and are initially recorded at fair value, net of estimated cost to sell, at the date of foreclosure, establishing a new cost basis. After foreclosure, valuations are periodically performed by management, and the real estate is carried at the lower of carry-ing amount or fair value less the cost to sell. Revenue and expenses from operations and changes in valuation allowance are charged to operations.
SegmentsThe Company has one reportable segment, “Community Banking.” All of the Company’s activities are interrelated, and each activity is dependent and assessed based on how each of the activities of the Company supports the other. For example, commercial lending is dependent upon the ability of the Bank to fund it with retail deposits and other borrowings and to manage interest rate and credit risk. This situation is also similar for consumer and residential mortgage lending. Accordingly, all significant operating decisions are based upon analysis of the Company as one operating segment or unit.
ReclassificationsCertain reclassifications have been made to the prior years’ financial statements to conform to the 2014 presentation, with no impact on earnings or shareholders’ equity.
2 0 1 4 A N N U A L R E P O R T 45
Comprehensive Income (Loss)Comprehensive income (loss) includes net income (loss) as well as certain other items that result in a change to equity during the period. The components of other comprehensive loss are as follows:
December 31, 2014
(in 000’s) Before Tax Amount Tax Expense Net of Tax Amount
Unrealized income on securities:
Unrealized holding income arising during period $ 475 $(157) $ 318
Less: reclassification adjustment for gains realized in net income (7) 3 (4)
Other comprehensive income, net $ 468 $(154) $ 314
December 31, 2013
Before Tax Amount Tax Benefit Net of Tax Amount
Unrealized loss on securities
Unrealized holding loss arising during period $(161) $53 $(108)
Less: reclassification adjustment for gains realized in net loss (378) 125 (253)
Other comprehensive loss, net $(539) $ 178 $(361)
Recent Accounting PronouncementsASU 2013–11, Presentation of an Unrecognized Tax Benefit When a Net Operating Loss Carryforward, a Similar Tax Loss, or a Tax Credit Carryforward Exists. The amendments in ASU 2013–11 include explicit guidance on the financial statement presentation of an unrecognized tax benefit when a net operating loss carryforward, a similar tax loss, or a tax credit carryforward exists. The amendments in this Update are expected to reduce diversity in practice by providing guidance on the presen-tation of unrecognized tax benefits and will better reflect the manner in which an entity would settle at the reporting date any additional income taxes that would result from the disallowance of a tax position when net operating loss carryforwards, similar tax losses, or tax credit carryforwards exist. The amendments in this Update are effective for fiscal years, and interim periods within those years, beginning after December 15, 2013. The adoption of this guidance in 2014 did not have any effect on the Company’s financial statements.
ASU 2014–04, Receivables — Troubled Debt Restructurings by Creditors (Subtopic 310–40): Reclassification of Residential Real Estate Collateralized Consumer Mortgage Loans Upon Foreclosure. ASU 2014–04 clarifies that an in substance repossession or foreclosure occurs and a creditor is considered to have received phys-ical possession of residential real estate property collateralizing a consumer mortgage loan, upon either (a) the creditor obtaining legal title to residential real estate property upon completion of a foreclosure or (b) the borrower conveying all interest in the residential real estate property to the creditor to satisfy that loan though completion of a deed in lieu of foreclosure or through a similar legal agreement. The amendments require interim and annual disclosure of both the amount of the foreclosed residential real estate property held by the creditor and the recorded investment in consumer mortgage loans collateralized by residential real estate prop-erty that are in the process of foreclosure. This guidance is effective for annual periods, and interim periods within those annual periods, beginning after December 15, 2014. The Company is currently evaluating the impact of this amendment.
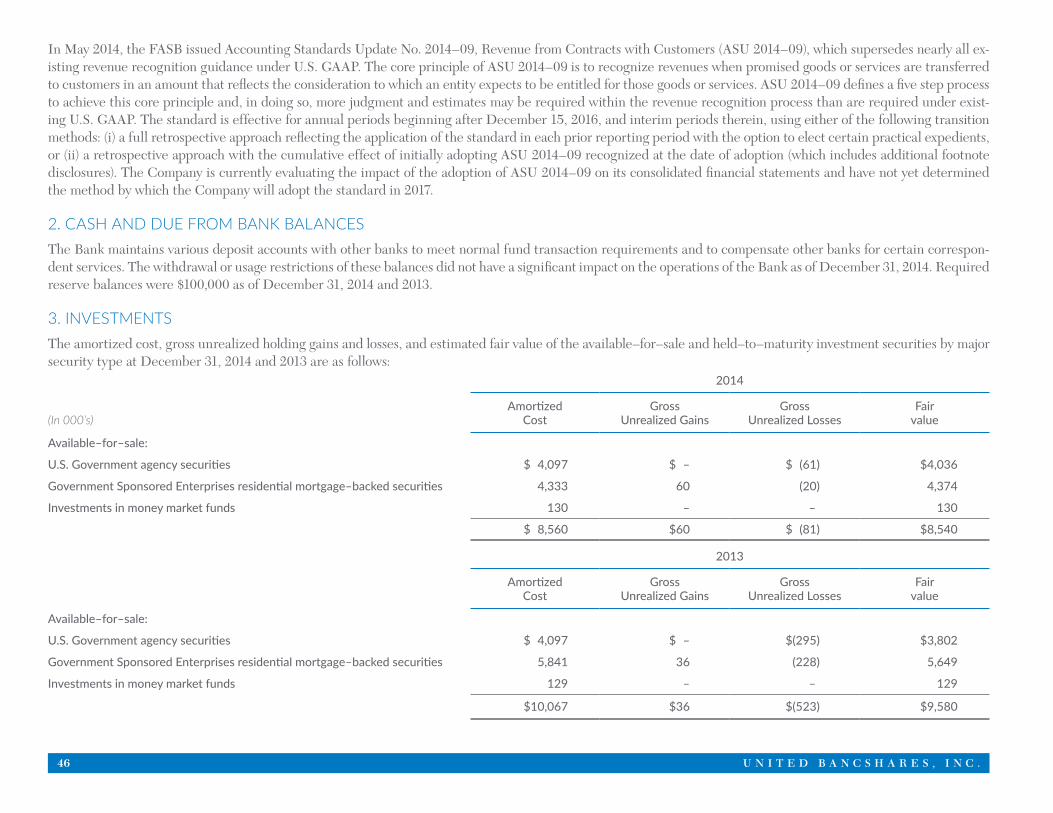
46 U N I T E D B A N C S H A R E S , I N C .
In May 2014, the FASB issued Accounting Standards Update No. 2014–09, Revenue from Contracts with Customers (ASU 2014–09), which supersedes nearly all ex-isting revenue recognition guidance under U.S. GAAP. The core principle of ASU 2014–09 is to recognize revenues when promised goods or services are transferred to customers in an amount that reflects the consideration to which an entity expects to be entitled for those goods or services. ASU 2014–09 defines a five step process to achieve this core principle and, in doing so, more judgment and estimates may be required within the revenue recognition process than are required under exist-ing U.S. GAAP. The standard is effective for annual periods beginning after December 15, 2016, and interim periods therein, using either of the following transition methods: (i) a full retrospective approach reflecting the application of the standard in each prior reporting period with the option to elect certain practical expedients, or (ii) a retrospective approach with the cumulative effect of initially adopting ASU 2014–09 recognized at the date of adoption (which includes additional footnote disclosures). The Company is currently evaluating the impact of the adoption of ASU 2014–09 on its consolidated financial statements and have not yet determined the method by which the Company will adopt the standard in 2017.
2. CASH AND DUE FROM BANK BALANCESThe Bank maintains various deposit accounts with other banks to meet normal fund transaction requirements and to compensate other banks for certain correspon-dent services. The withdrawal or usage restrictions of these balances did not have a significant impact on the operations of the Bank as of December 31, 2014. Required reserve balances were $100,000 as of December 31, 2014 and 2013.
3. INVESTMENTSThe amortized cost, gross unrealized holding gains and losses, and estimated fair value of the available–for–sale and held–to–maturity investment securities by major security type at December 31, 2014 and 2013 are as follows:
2014
(In 000’s)Amortized
CostGross
Unrealized GainsGross
Unrealized LossesFair
value
Available–for–sale:
U.S. Government agency securities $ 4,097 $ – $ (61) $4,036
Government Sponsored Enterprises residential mortgage–backed securities 4,333 60 (20) 4,374
Investments in money market funds 130 – – 130
$ 8,560 $60 $ (81) $8,540
2013
AmortizedCost
Gross Unrealized Gains
Gross Unrealized Losses
Fairvalue
Available–for–sale:
U.S. Government agency securities $ 4,097 $ – $(295) $3,802
Government Sponsored Enterprises residential mortgage–backed securities 5,841 36 (228) 5,649
Investments in money market funds 129 – – 129
$10,067 $36 $(523) $9,580
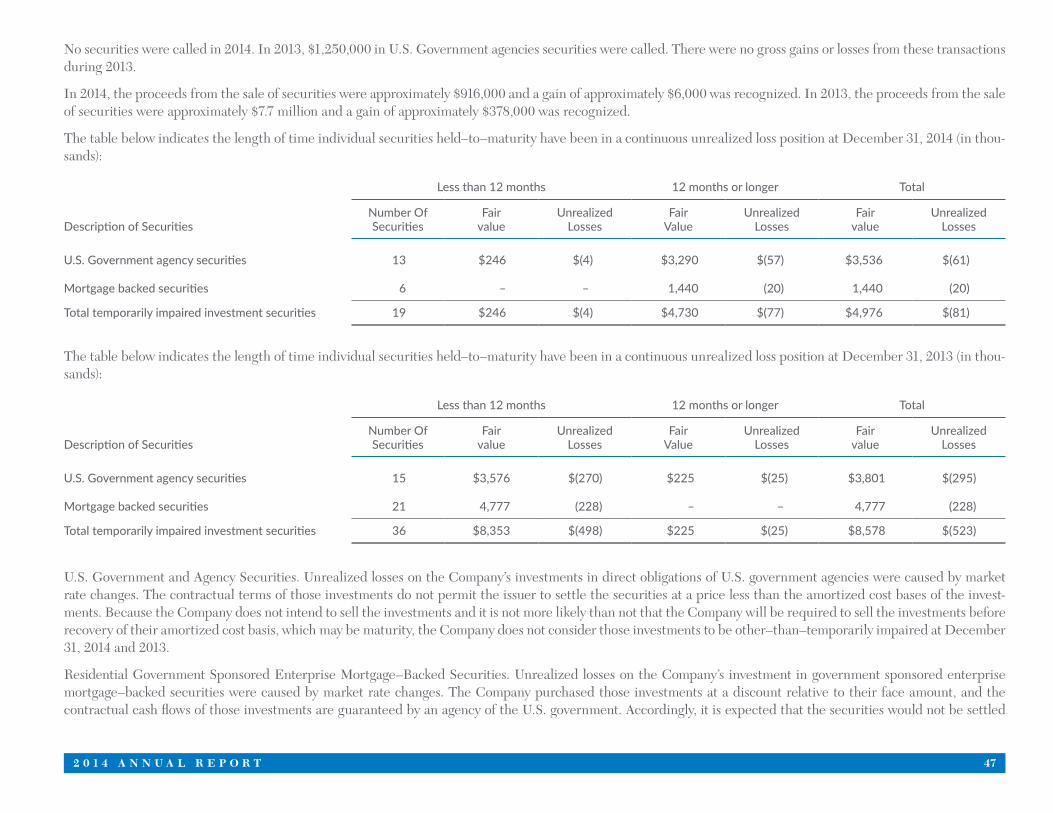
2 0 1 4 A N N U A L R E P O R T 47
No securities were called in 2014. In 2013, $1,250,000 in U.S. Government agencies securities were called. There were no gross gains or losses from these transactions during 2013.
In 2014, the proceeds from the sale of securities were approximately $916,000 and a gain of approximately $6,000 was recognized. In 2013, the proceeds from the sale of securities were approximately $7.7 million and a gain of approximately $378,000 was recognized.
The table below indicates the length of time individual securities held–to–maturity have been in a continuous unrealized loss position at December 31, 2014 (in thou-sands):
Less than 12 months 12 months or longer Total
Description of SecuritiesNumber OfSecurities
Fairvalue
UnrealizedLosses
FairValue
UnrealizedLosses
Fairvalue
UnrealizedLosses
U.S. Government agency securities 13 $246 $(4) $3,290 $(57) $3,536 $(61)
Mortgage backed securities 6 – – 1,440 (20) 1,440 (20)
Total temporarily impaired investment securities 19 $246 $(4) $4,730 $(77) $4,976 $(81)
The table below indicates the length of time individual securities held–to–maturity have been in a continuous unrealized loss position at December 31, 2013 (in thou-sands):
Less than 12 months 12 months or longer Total
Description of SecuritiesNumber OfSecurities
Fairvalue
UnrealizedLosses
FairValue
UnrealizedLosses
Fairvalue
UnrealizedLosses
U.S. Government agency securities 15 $3,576 $(270) $225 $(25) $3,801 $(295)
Mortgage backed securities 21 4,777 (228) – – 4,777 (228)
Total temporarily impaired investment securities 36 $8,353 $(498) $225 $(25) $8,578 $(523)
U.S. Government and Agency Securities. Unrealized losses on the Company’s investments in direct obligations of U.S. government agencies were caused by market rate changes. The contractual terms of those investments do not permit the issuer to settle the securities at a price less than the amortized cost bases of the invest-ments. Because the Company does not intend to sell the investments and it is not more likely than not that the Company will be required to sell the investments before recovery of their amortized cost basis, which may be maturity, the Company does not consider those investments to be other–than–temporarily impaired at December 31, 2014 and 2013.
Residential Government Sponsored Enterprise Mortgage–Backed Securities. Unrealized losses on the Company’s investment in government sponsored enterprise mortgage–backed securities were caused by market rate changes. The Company purchased those investments at a discount relative to their face amount, and the contractual cash flows of those investments are guaranteed by an agency of the U.S. government. Accordingly, it is expected that the securities would not be settled
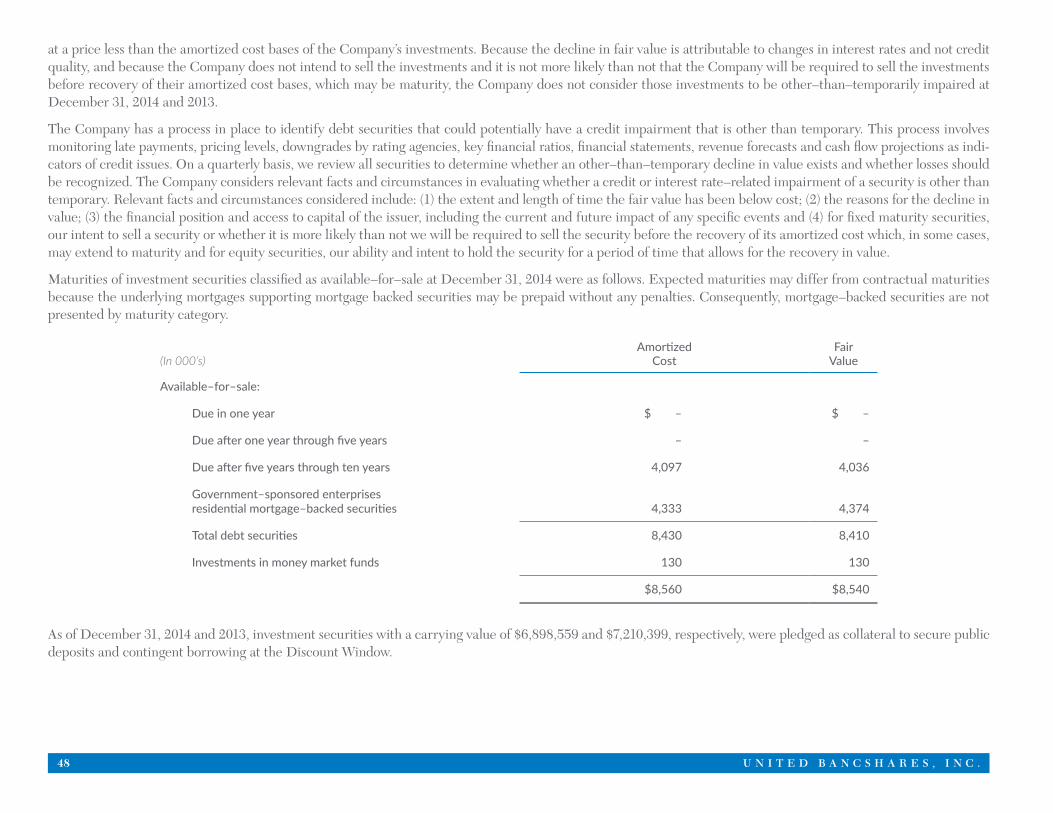
48 U N I T E D B A N C S H A R E S , I N C .
at a price less than the amortized cost bases of the Company’s investments. Because the decline in fair value is attributable to changes in interest rates and not credit quality, and because the Company does not intend to sell the investments and it is not more likely than not that the Company will be required to sell the investments before recovery of their amortized cost bases, which may be maturity, the Company does not consider those investments to be other–than–temporarily impaired at December 31, 2014 and 2013.
The Company has a process in place to identify debt securities that could potentially have a credit impairment that is other than temporary. This process involves monitoring late payments, pricing levels, downgrades by rating agencies, key financial ratios, financial statements, revenue forecasts and cash flow projections as indi-cators of credit issues. On a quarterly basis, we review all securities to determine whether an other–than–temporary decline in value exists and whether losses should be recognized. The Company considers relevant facts and circumstances in evaluating whether a credit or interest rate–related impairment of a security is other than temporary. Relevant facts and circumstances considered include: (1) the extent and length of time the fair value has been below cost; (2) the reasons for the decline in value; (3) the financial position and access to capital of the issuer, including the current and future impact of any specific events and (4) for fixed maturity securities, our intent to sell a security or whether it is more likely than not we will be required to sell the security before the recovery of its amortized cost which, in some cases, may extend to maturity and for equity securities, our ability and intent to hold the security for a period of time that allows for the recovery in value.
Maturities of investment securities classified as available–for–sale at December 31, 2014 were as follows. Expected maturities may differ from contractual maturities because the underlying mortgages supporting mortgage backed securities may be prepaid without any penalties. Consequently, mortgage–backed securities are not presented by maturity category.
(In 000’s)Amortized
CostFair
Value
Available–for–sale:
Due in one year $ – $ –
Due after one year through five years – –
Due after five years through ten years 4,097 4,036
Government–sponsored enterprises residential mortgage–backed securities 4,333 4,374
Total debt securities 8,430 8,410
Investments in money market funds 130 130
$8,560 $8,540
As of December 31, 2014 and 2013, investment securities with a carrying value of $6,898,559 and $7,210,399, respectively, were pledged as collateral to secure public deposits and contingent borrowing at the Discount Window.
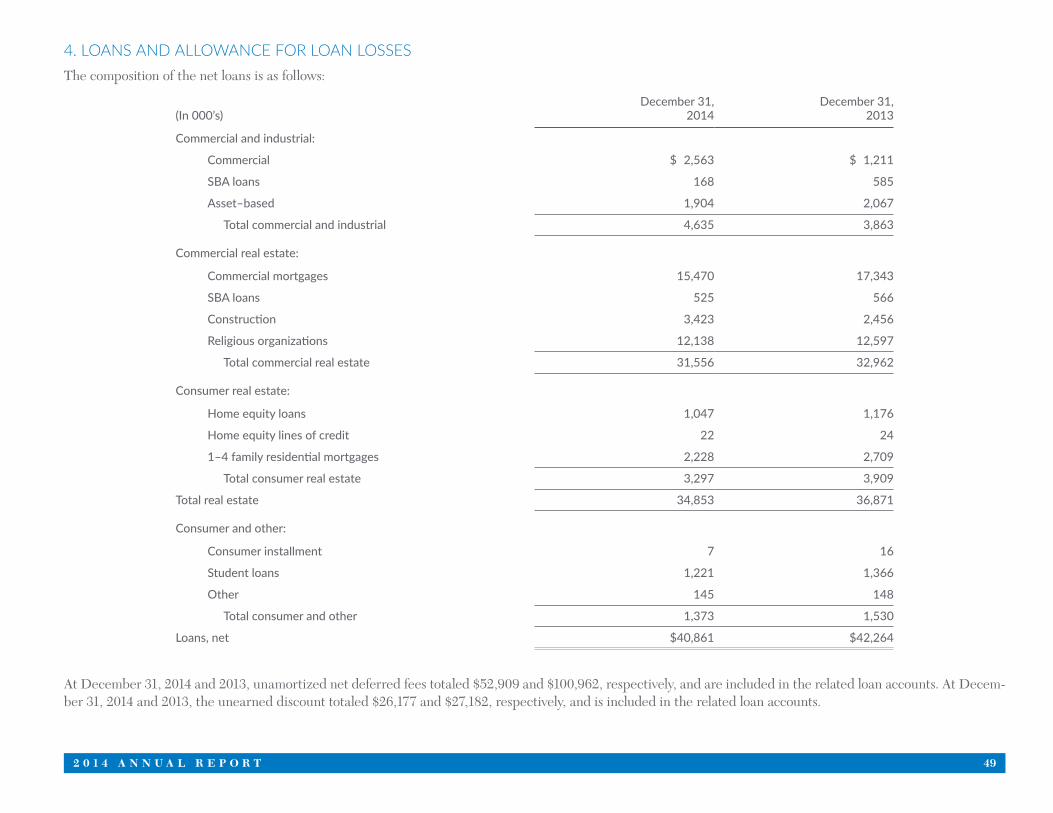
2 0 1 4 A N N U A L R E P O R T 49
4. LOANS AND ALLOWANCE FOR LOAN LOSSESThe composition of the net loans is as follows:
(In 000’s)December 31,
2014December 31,
2013
Commercial and industrial:
Commercial $ 2,563 $ 1,211
SBA loans 168 585
Asset–based 1,904 2,067
Total commercial and industrial 4,635 3,863
Commercial real estate:
Commercial mortgages 15,470 17,343
SBA loans 525 566
Construction 3,423 2,456
Religious organizations 12,138 12,597
Total commercial real estate 31,556 32,962
Consumer real estate:
Home equity loans 1,047 1,176
Home equity lines of credit 22 24
1–4 family residential mortgages 2,228 2,709
Total consumer real estate 3,297 3,909
Total real estate 34,853 36,871
Consumer and other:
Consumer installment 7 16
Student loans 1,221 1,366
Other 145 148
Total consumer and other 1,373 1,530
Loans, net $40,861 $42,264
At December 31, 2014 and 2013, unamortized net deferred fees totaled $52,909 and $100,962, respectively, and are included in the related loan accounts. At Decem-ber 31, 2014 and 2013, the unearned discount totaled $26,177 and $27,182, respectively, and is included in the related loan accounts.
50 U N I T E D B A N C S H A R E S , I N C .
Loan Origination/Risk Management. The Bank has lending policies and procedures in place to maximize loan income within an acceptable level of risk. Manage-ment reviews and approves these policies and procedures on a regular basis. A reporting system supplements the review process by providing management with peri-odic reports related to loan origination, asset quality, concentrations of credit, loan delinquencies and non–performing and emerging problem loans. Diversification in the portfolio is a means of managing risk with fluctuations in economic conditions.
Commercial and industrial loans are underwritten after evaluating and understanding the borrower’s ability to operate prudently to service the projected debt. Once it is determined that the borrower’s management possesses sound ethics and solid business acumen, the Bank’s management examines current and projected cash flows to determine the ability of the borrower to repay their obligations as agreed. Commercial and industrial loans are primarily based on the identified cash flows of the borrower and secondarily on the underlying collateral provided by the borrower. The cash flows of borrowers, however, may not be as expected and collateral securing these loans may fluctuate in value. Most commercial and industrial loans are secured by the assets being financed or other business assets such as accounts receivable. The Bank may also seek credit enhancements for commercial and industrial loans from the Small Business Administration, Department of Transportation or other available programs. Generally, the Bank utilizes an advance formula for loans secured by eligible accounts receivable and other available programs to mitigate risk.
Commercial real estate loans are subject to underwriting standards and processes similar to commercial and industrial loans. These loans are viewed as cash flow loans first and secondarily as loans secured by real estate. Commercial real estate loans typically have higher principal amounts and the repayment of these loans is dependent on the successful operation of property securing the loan or business conducted on the property securing the loan. Commercial real estate loans may be more adversely affected by conditions in the real estate markets or in the general economy. The Bank tracks the level of owner occupied versus non–owner occupied loans. Typically, owner–occupied real estate loans represent less risk for the Bank.
The Bank’s commercial real estate loans are largely concentrated in loans to religious organizations. These loans are generally made to these organizations are primar-ily for expansion and repair of church facilities (construction loans). The source of repayment is viewed as cash flow from tithes and offerings and secondarily as loans secured by real estate.
The Bank’s construction lending has primarily involved lending for construction of commercial properties although the Bank does lend funds for construction of sin-gle–family residences. Construction loans are underwritten utilizing feasibility studies, independent appraisals, analysis of lease rates, and the financial analysis of the developers and property owners. Construction loans are generally based upon estimates of costs and value associated with the complete project. These estimates can be inaccurate. Construction loans often involve the disbursement of substantial funds with repayment substantially dependent on the success of the ultimate project. Loan proceeds are disbursed during the construction phase according to a draw schedule based on the stage of completion. Construction projects are inspected by contracted inspectors or bank personnel. These loans are considered to have higher risks than other real estate loans due to their ultimate repayment being sensitive to interest rate changes, regulations of real property, general economic conditions and the availability of long–term financing.
Consumer loans are underwritten after an analysis of the borrower’s past and present financial information including credit score, personal financial statements, tax returns and other information deemed necessary to calculate debt service ratios that determine the ability of a borrower to repay the loan. Minimum debt service ratios have been established by policy. Underwriting standards for home equity loans are also heavily influenced by statutory requirements, which include, but are not limited to, a maximum loan–to–value percentage of 80% and documentation requirements.
The Bank performs an annual loan review by an independent third party firm that reviews and validates the credit risk program. The results of these reviews are pre-sented to the board and management. The loan review process reinforces the risk identification and assessment decisions made by lenders and credit administration personnel, as well as the Bank’s policies and procedures.
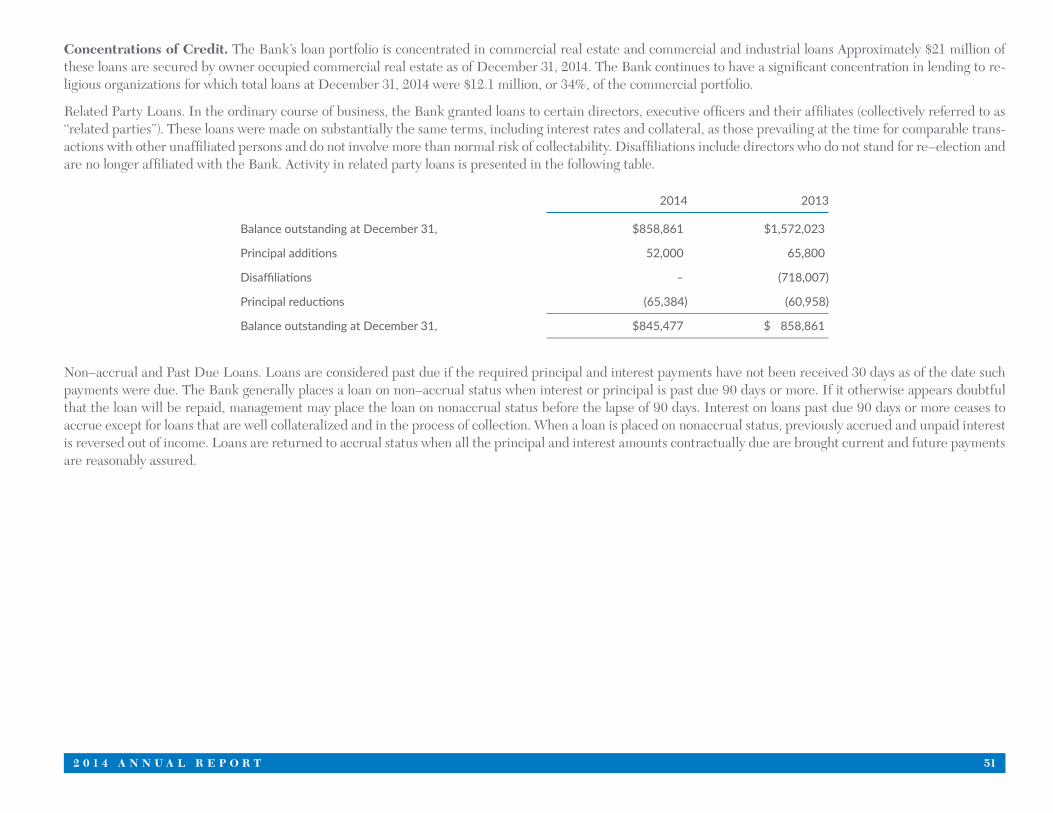
2 0 1 4 A N N U A L R E P O R T 51
Concentrations of Credit. The Bank’s loan portfolio is concentrated in commercial real estate and commercial and industrial loans Approximately $21 million of these loans are secured by owner occupied commercial real estate as of December 31, 2014. The Bank continues to have a significant concentration in lending to re-ligious organizations for which total loans at December 31, 2014 were $12.1 million, or 34%, of the commercial portfolio.
Related Party Loans. In the ordinary course of business, the Bank granted loans to certain directors, executive officers and their affiliates (collectively referred to as “related parties”). These loans were made on substantially the same terms, including interest rates and collateral, as those prevailing at the time for comparable trans-actions with other unaffiliated persons and do not involve more than normal risk of collectability. Disaffiliations include directors who do not stand for re–election and are no longer affiliated with the Bank. Activity in related party loans is presented in the following table.
2014 2013
Balance outstanding at December 31, $858,861 $1,572,023
Principal additions 52,000 65,800
Disaffiliations – (718,007)
Principal reductions (65,384) (60,958)
Balance outstanding at December 31, $845,477 $ 858,861
Non–accrual and Past Due Loans. Loans are considered past due if the required principal and interest payments have not been received 30 days as of the date such payments were due. The Bank generally places a loan on non–accrual status when interest or principal is past due 90 days or more. If it otherwise appears doubtful that the loan will be repaid, management may place the loan on nonaccrual status before the lapse of 90 days. Interest on loans past due 90 days or more ceases to accrue except for loans that are well collateralized and in the process of collection. When a loan is placed on nonaccrual status, previously accrued and unpaid interest is reversed out of income. Loans are returned to accrual status when all the principal and interest amounts contractually due are brought current and future payments are reasonably assured.
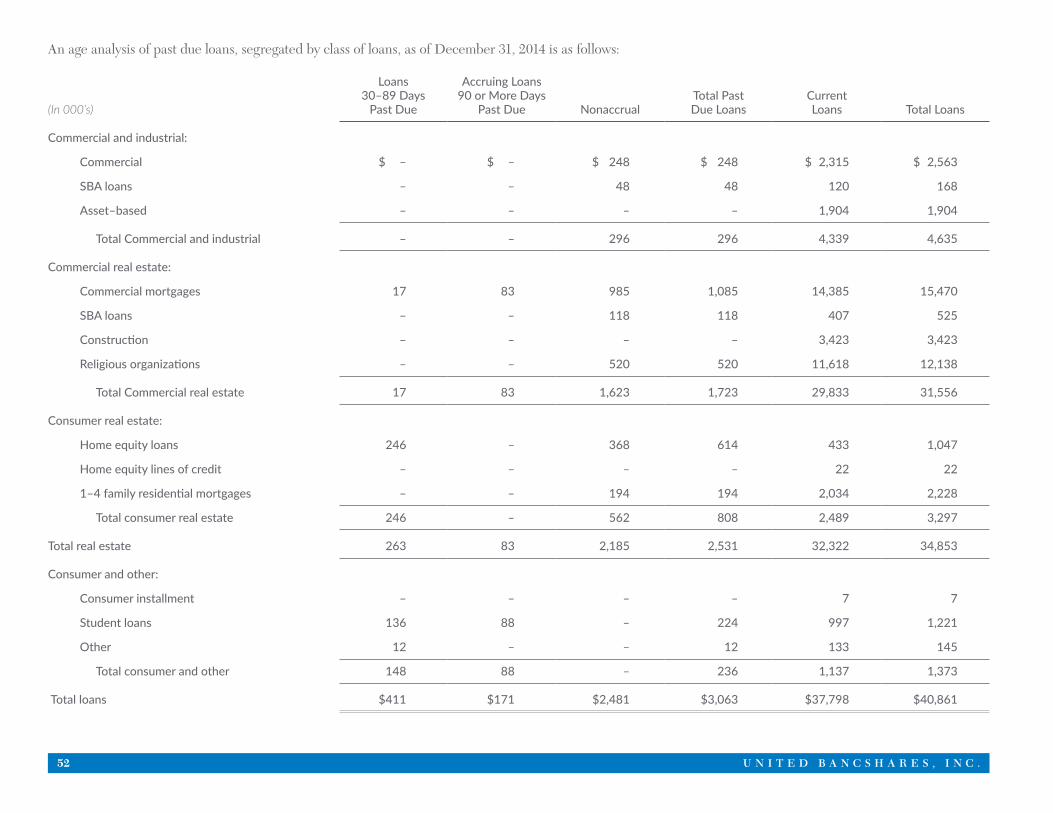
52 U N I T E D B A N C S H A R E S , I N C .
An age analysis of past due loans, segregated by class of loans, as of December 31, 2014 is as follows:
(In 000’s)
Loans30–89 Days
Past Due
Accruing Loans 90 or More Days
Past Due
NonaccrualTotal PastDue Loans
Current Loans Total Loans
Commercial and industrial:
Commercial $ – $ – $ 248 $ 248 $ 2,315 $ 2,563
SBA loans – – 48 48 120 168
Asset–based – – – – 1,904 1,904
Total Commercial and industrial – – 296 296 4,339 4,635
Commercial real estate:
Commercial mortgages 17 83 985 1,085 14,385 15,470
SBA loans – – 118 118 407 525
Construction – – – – 3,423 3,423
Religious organizations – – 520 520 11,618 12,138
Total Commercial real estate 17 83 1,623 1,723 29,833 31,556
Consumer real estate:
Home equity loans 246 – 368 614 433 1,047
Home equity lines of credit – – – – 22 22
1–4 family residential mortgages – – 194 194 2,034 2,228
Total consumer real estate 246 – 562 808 2,489 3,297
Total real estate 263 83 2,185 2,531 32,322 34,853
Consumer and other:
Consumer installment – – – – 7 7
Student loans 136 88 – 224 997 1,221
Other 12 – – 12 133 145
Total consumer and other 148 88 – 236 1,137 1,373
Total loans $411 $171 $2,481 $3,063 $37,798 $40,861
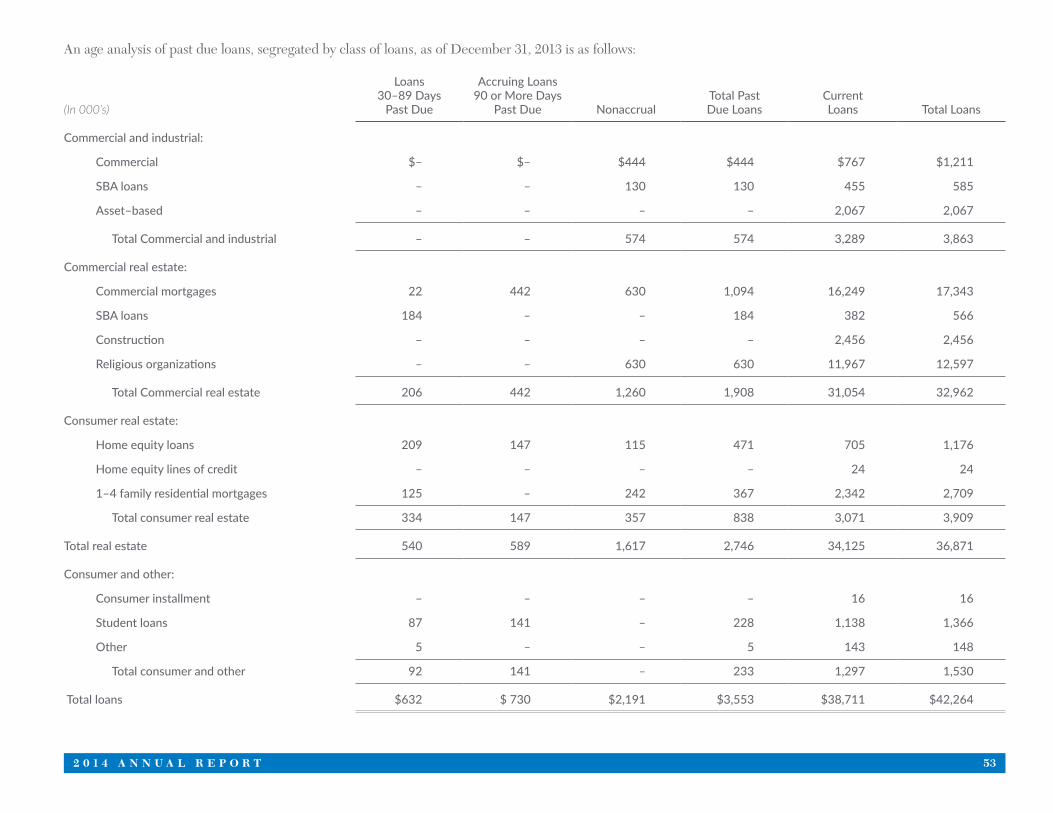
2 0 1 4 A N N U A L R E P O R T 53
An age analysis of past due loans, segregated by class of loans, as of December 31, 2013 is as follows:
(In 000’s)
Loans30–89 Days
Past Due
Accruing Loans 90 or More Days
Past Due
NonaccrualTotal PastDue Loans
Current Loans Total Loans
Commercial and industrial:
Commercial $– $– $444 $444 $767 $1,211
SBA loans – – 130 130 455 585
Asset–based – – – – 2,067 2,067
Total Commercial and industrial – – 574 574 3,289 3,863
Commercial real estate:
Commercial mortgages 22 442 630 1,094 16,249 17,343
SBA loans 184 – – 184 382 566
Construction – – – – 2,456 2,456
Religious organizations – – 630 630 11,967 12,597
Total Commercial real estate 206 442 1,260 1,908 31,054 32,962
Consumer real estate:
Home equity loans 209 147 115 471 705 1,176
Home equity lines of credit – – – – 24 24
1–4 family residential mortgages 125 – 242 367 2,342 2,709
Total consumer real estate 334 147 357 838 3,071 3,909
Total real estate 540 589 1,617 2,746 34,125 36,871
Consumer and other:
Consumer installment – – – – 16 16
Student loans 87 141 – 228 1,138 1,366
Other 5 – – 5 143 148
Total consumer and other 92 141 – 233 1,297 1,530
Total loans $632 $ 730 $2,191 $3,553 $38,711 $42,264
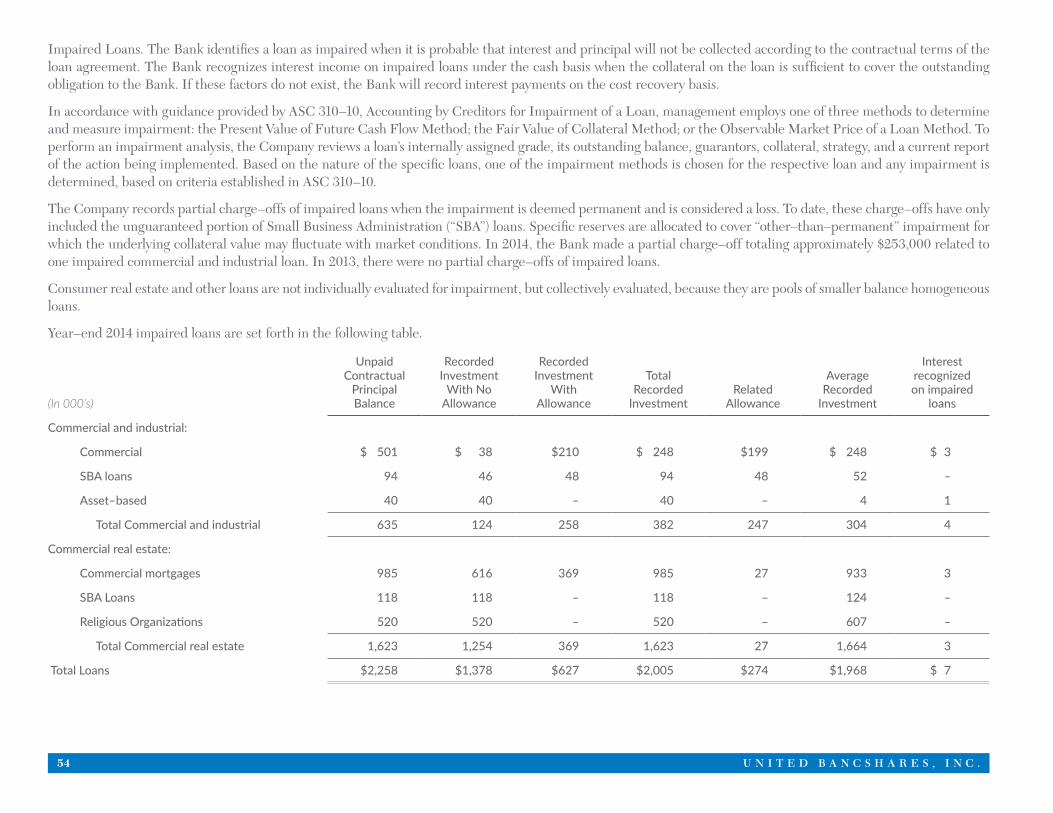
54 U N I T E D B A N C S H A R E S , I N C .
Impaired Loans. The Bank identifies a loan as impaired when it is probable that interest and principal will not be collected according to the contractual terms of the loan agreement. The Bank recognizes interest income on impaired loans under the cash basis when the collateral on the loan is sufficient to cover the outstanding obligation to the Bank. If these factors do not exist, the Bank will record interest payments on the cost recovery basis.
In accordance with guidance provided by ASC 310–10, Accounting by Creditors for Impairment of a Loan, management employs one of three methods to determine and measure impairment: the Present Value of Future Cash Flow Method; the Fair Value of Collateral Method; or the Observable Market Price of a Loan Method. To perform an impairment analysis, the Company reviews a loan’s internally assigned grade, its outstanding balance, guarantors, collateral, strategy, and a current report of the action being implemented. Based on the nature of the specific loans, one of the impairment methods is chosen for the respective loan and any impairment is determined, based on criteria established in ASC 310–10.
The Company records partial charge–offs of impaired loans when the impairment is deemed permanent and is considered a loss. To date, these charge–offs have only included the unguaranteed portion of Small Business Administration (“SBA”) loans. Specific reserves are allocated to cover “other–than–permanent” impairment for which the underlying collateral value may fluctuate with market conditions. In 2014, the Bank made a partial charge–off totaling approximately $253,000 related to one impaired commercial and industrial loan. In 2013, there were no partial charge–offs of impaired loans.
Consumer real estate and other loans are not individually evaluated for impairment, but collectively evaluated, because they are pools of smaller balance homogeneous loans.
Year–end 2014 impaired loans are set forth in the following table.
(In 000’s)
UnpaidContractual
PrincipalBalance
RecordedInvestment
With NoAllowance
RecordedInvestment
WithAllowance
Total Recorded
InvestmentRelated
Allowance
Average Recorded
Investment
Interest recognizedon impaired
loans
Commercial and industrial:
Commercial $ 501 $ 38 $210 $ 248 $199 $ 248 $ 3
SBA loans 94 46 48 94 48 52 –
Asset–based 40 40 – 40 – 4 1
Total Commercial and industrial 635 124 258 382 247 304 4
Commercial real estate:
Commercial mortgages 985 616 369 985 27 933 3
SBA Loans 118 118 – 118 – 124 –
Religious Organizations 520 520 – 520 – 607 –
Total Commercial real estate 1,623 1,254 369 1,623 27 1,664 3
Total Loans $2,258 $1,378 $627 $2,005 $274 $1,968 $ 7
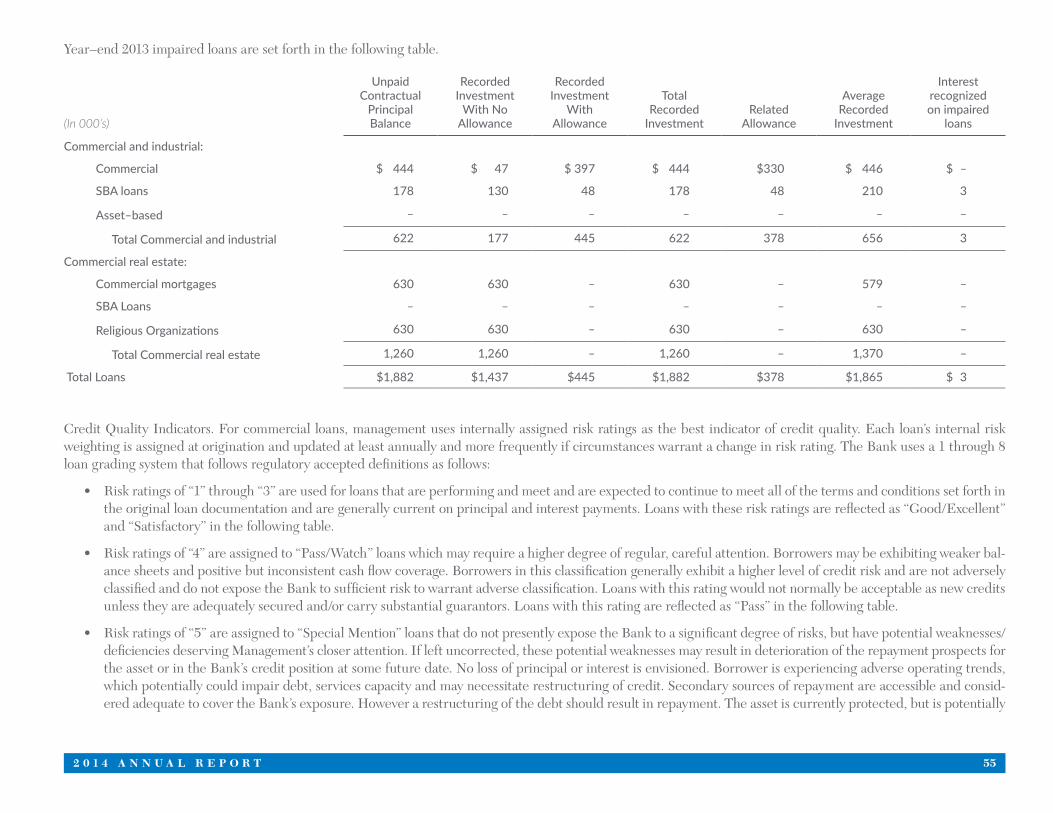
2 0 1 4 A N N U A L R E P O R T 55
Year–end 2013 impaired loans are set forth in the following table.
(In 000’s)
UnpaidContractual
PrincipalBalance
RecordedInvestment
With NoAllowance
RecordedInvestment
WithAllowance
Total Recorded
InvestmentRelated
Allowance
Average Recorded
Investment
Interest recognizedon impaired
loans
Commercial and industrial:
Commercial $ 444 $ 47 $ 397 $ 444 $330 $ 446 $ –
SBA loans 178 130 48 178 48 210 3
Asset–based – – – – – – –
Total Commercial and industrial 622 177 445 622 378 656 3
Commercial real estate:
Commercial mortgages 630 630 – 630 – 579 –
SBA Loans – – – – – – –
Religious Organizations 630 630 – 630 – 630 –
Total Commercial real estate 1,260 1,260 – 1,260 – 1,370 –
Total Loans $1,882 $1,437 $445 $1,882 $378 $1,865 $ 3
Credit Quality Indicators. For commercial loans, management uses internally assigned risk ratings as the best indicator of credit quality. Each loan’s internal risk weighting is assigned at origination and updated at least annually and more frequently if circumstances warrant a change in risk rating. The Bank uses a 1 through 8 loan grading system that follows regulatory accepted definitions as follows:
• Risk ratings of “1” through “3” are used for loans that are performing and meet and are expected to continue to meet all of the terms and conditions set forth in the original loan documentation and are generally current on principal and interest payments. Loans with these risk ratings are reflected as “Good/Excellent” and “Satisfactory” in the following table.
• Risk ratings of “4” are assigned to “Pass/Watch” loans which may require a higher degree of regular, careful attention. Borrowers may be exhibiting weaker bal-ance sheets and positive but inconsistent cash flow coverage. Borrowers in this classification generally exhibit a higher level of credit risk and are not adversely classified and do not expose the Bank to sufficient risk to warrant adverse classification. Loans with this rating would not normally be acceptable as new credits unless they are adequately secured and/or carry substantial guarantors. Loans with this rating are reflected as “Pass” in the following table.
• Risk ratings of “5” are assigned to “Special Mention” loans that do not presently expose the Bank to a significant degree of risks, but have potential weaknesses/deficiencies deserving Management’s closer attention. If left uncorrected, these potential weaknesses may result in deterioration of the repayment prospects for the asset or in the Bank’s credit position at some future date. No loss of principal or interest is envisioned. Borrower is experiencing adverse operating trends, which potentially could impair debt, services capacity and may necessitate restructuring of credit. Secondary sources of repayment are accessible and consid-ered adequate to cover the Bank’s exposure. However a restructuring of the debt should result in repayment. The asset is currently protected, but is potentially
56 U N I T E D B A N C S H A R E S , I N C .
weak. This category may include credits with inadequate loan agreements, control over the collateral or an unbalanced position in the balance sheet which has not reached a point where the liquidation is jeopardized but exceptions are considered material. These borrowers would have limited ability to obtain credit elsewhere.
• Risk ratings of “6” are assigned to ‘Substandard” loans which are inadequately protected by the current net worth and paying capacity of the obligor or of the collateral pledged, if any. Assets must have a well–defined weakness. They are characterized by the distinct possibility that some loss is possible if the deficien-cies are not corrected. The borrower’s recent performance indicated an inability to repay the debt, even if restructured. Primary source of repayment is gone or severely impaired and the Bank may have to rely upon the secondary source. Secondary sources of repayment (e.g., guarantors and collateral) should be ade-quate for a full recovery. Flaws in documentation may leave the bank in a subordinated or unsecured position when the collateral is needed for the repayment.
• Risk ratings of “7” are assigned to “Doubtful” loans which have all the weaknesses inherent in those classified “Substandard” with the added characteristic that the weakness makes the collection or liquidation in full, on the basis of current existing facts, conditions, and values, highly questionable and improbable. The borrower’s recent performance indicates an inability to repay the debt. Recovery from secondary sources is uncertain. The possibility of a loss is extremely high, but because of certain important and reasonably– specific pending factors, its classification as a loss is deferred.
• Risk rating of “8” are assigned to “Loss” loans which are considered non–collectible and do not warrant classification as active assets. They are recommended for charge–off if attempts to recover will be long term in nature. This classification does not mean that an asset has no recovery or salvage value, but rather, that it is not practical or desirable to defer writing off the loss, although a future recovery may be possible. Loss should always be taken in the period in which they surface and are identified as non–collectible as a result there is no tabular presentation.
For consumer and residential mortgage loans, management uses performing versus nonperforming as the best indicator of credit quality. Nonperforming loans consist of loans that are not accruing interest (nonaccrual loans) as a result of principal or interest being in default for a period of 90 days or more or when the ability to collect principal and interest according to contractual terms is in doubt. These credit quality indicators are updated on an ongoing basis. A loan is placed on nonaccrual status as soon as management believes there is doubt as to the ultimate ability to collect interest on a loan.
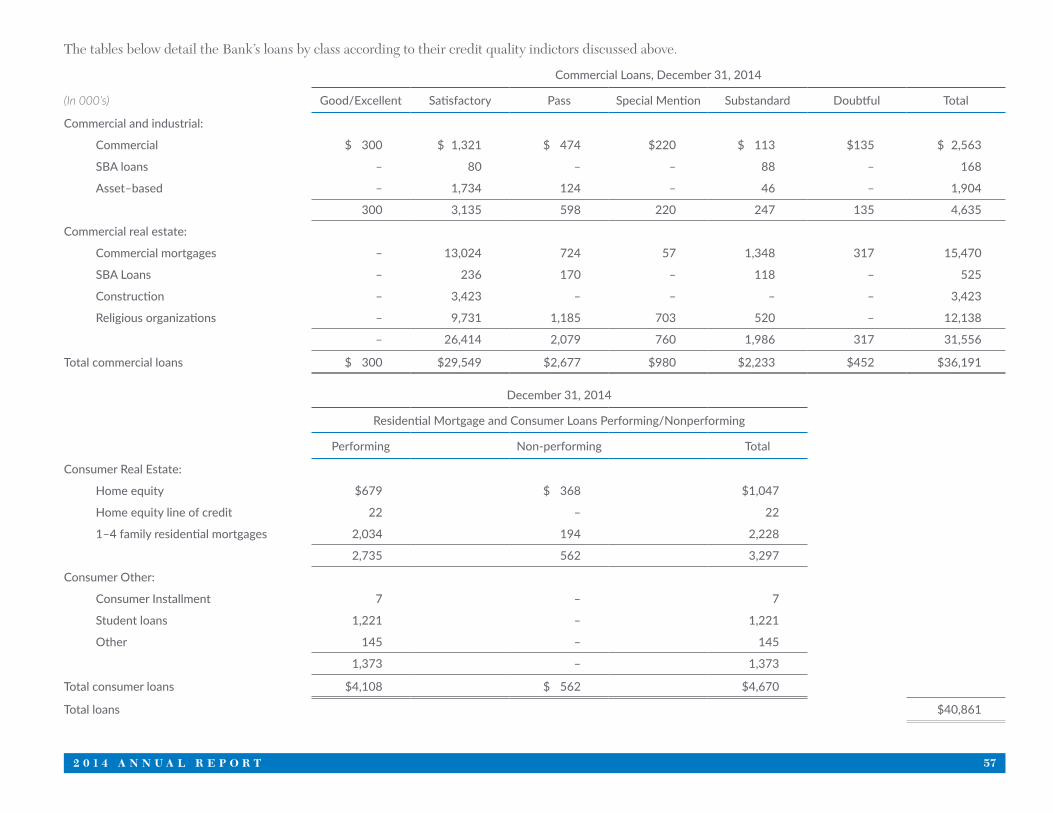
2 0 1 4 A N N U A L R E P O R T 57
The tables below detail the Bank’s loans by class according to their credit quality indictors discussed above.
Commercial Loans, December 31, 2014
(In 000’s) Good/Excellent Satisfactory Pass Special Mention Substandard Doubtful Total
Commercial and industrial:
Commercial $ 300 $ 1,321 $ 474 $220 $ 113 $135 $ 2,563
SBA loans – 80 – – 88 – 168
Asset–based – 1,734 124 – 46 – 1,904
300 3,135 598 220 247 135 4,635
Commercial real estate:
Commercial mortgages – 13,024 724 57 1,348 317 15,470
SBA Loans – 236 170 – 118 – 525
Construction – 3,423 – – – – 3,423
Religious organizations – 9,731 1,185 703 520 – 12,138
– 26,414 2,079 760 1,986 317 31,556
Total commercial loans $ 300 $29,549 $2,677 $980 $2,233 $452 $36,191
December 31, 2014
Residential Mortgage and Consumer Loans Performing/Nonperforming
Performing Non-performing Total
Consumer Real Estate:
Home equity $679 $ 368 $1,047
Home equity line of credit 22 – 22
1–4 family residential mortgages 2,034 194 2,228
2,735 562 3,297
Consumer Other:
Consumer Installment 7 – 7
Student loans 1,221 – 1,221
Other 145 – 145
1,373 – 1,373
Total consumer loans $4,108 $ 562 $4,670
Total loans $40,861
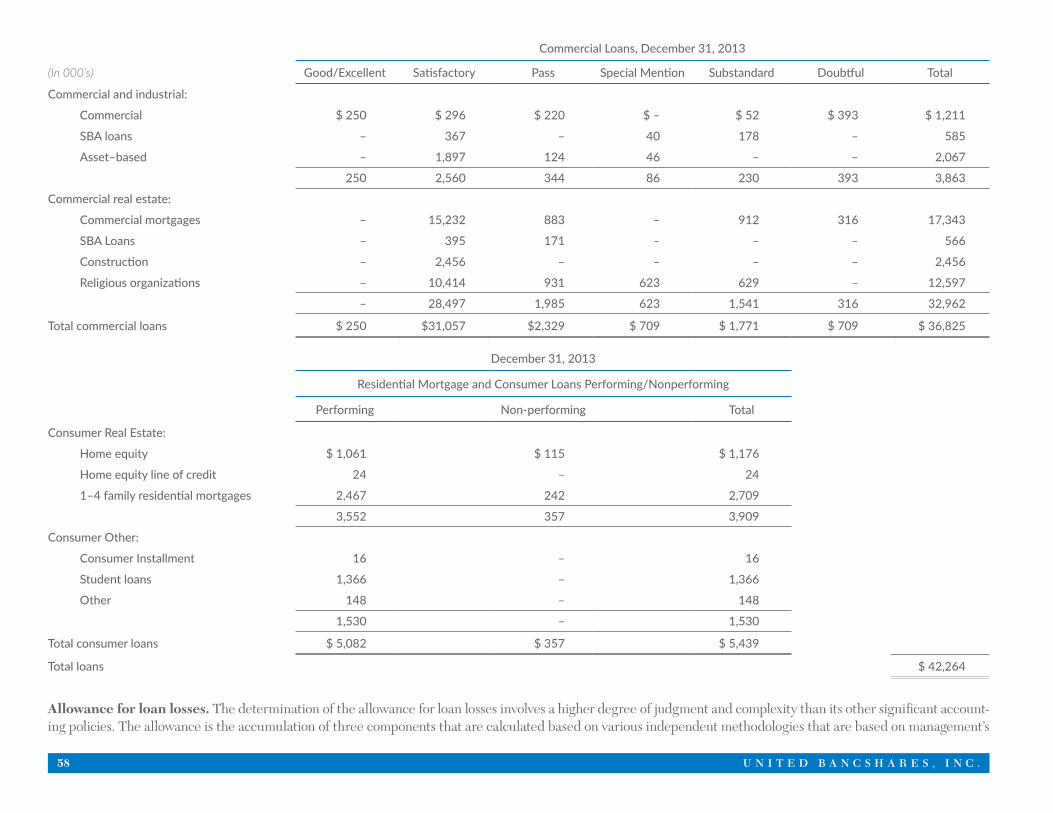
58 U N I T E D B A N C S H A R E S , I N C .
Commercial Loans, December 31, 2013
(In 000’s) Good/Excellent Satisfactory Pass Special Mention Substandard Doubtful Total
Commercial and industrial:
Commercial $ 250 $ 296 $ 220 $ – $ 52 $ 393 $ 1,211
SBA loans – 367 – 40 178 – 585
Asset–based – 1,897 124 46 – – 2,067
250 2,560 344 86 230 393 3,863
Commercial real estate:
Commercial mortgages – 15,232 883 – 912 316 17,343
SBA Loans – 395 171 – – – 566
Construction – 2,456 – – – – 2,456
Religious organizations – 10,414 931 623 629 – 12,597
– 28,497 1,985 623 1,541 316 32,962
Total commercial loans $ 250 $31,057 $2,329 $ 709 $ 1,771 $ 709 $ 36,825
December 31, 2013
Residential Mortgage and Consumer Loans Performing/Nonperforming
Performing Non-performing Total
Consumer Real Estate:
Home equity $ 1,061 $ 115 $ 1,176
Home equity line of credit 24 – 24
1–4 family residential mortgages 2,467 242 2,709
3,552 357 3,909
Consumer Other:
Consumer Installment 16 – 16
Student loans 1,366 – 1,366
Other 148 – 148
1,530 – 1,530
Total consumer loans $ 5,082 $ 357 $ 5,439
Total loans $ 42,264
Allowance for loan losses. The determination of the allowance for loan losses involves a higher degree of judgment and complexity than its other significant account-ing policies. The allowance is the accumulation of three components that are calculated based on various independent methodologies that are based on management’s
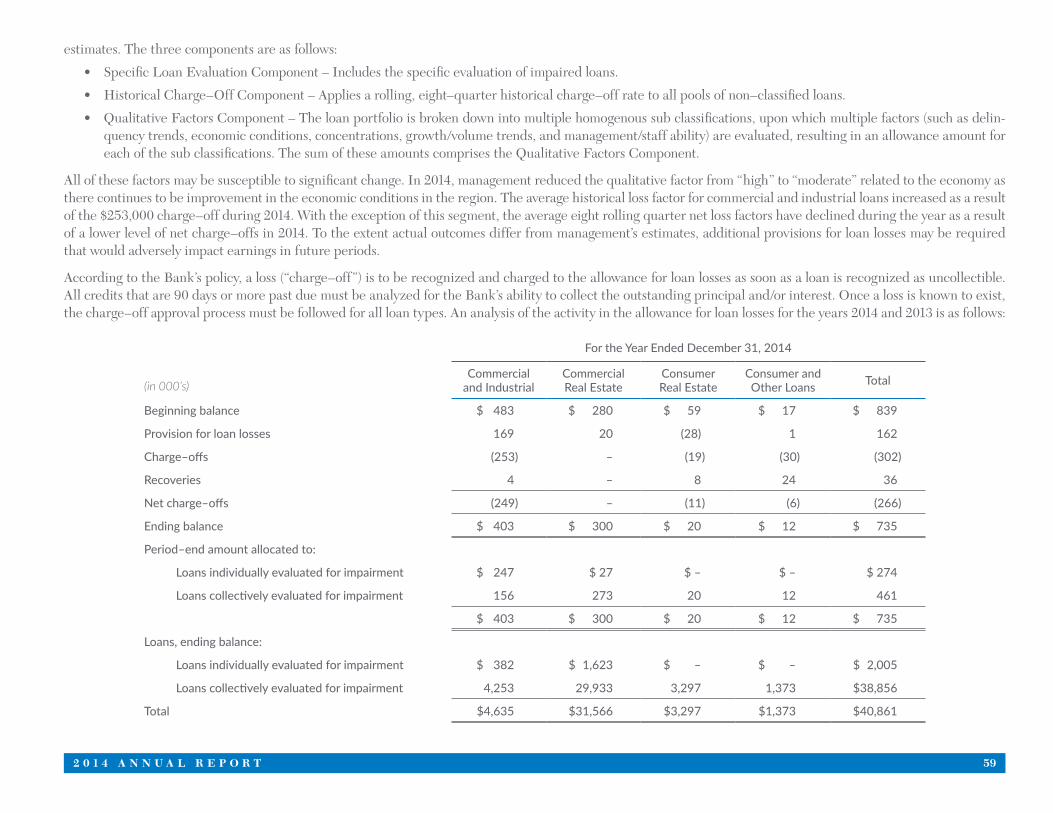
2 0 1 4 A N N U A L R E P O R T 59
estimates. The three components are as follows:
• Specific Loan Evaluation Component – Includes the specific evaluation of impaired loans.
• Historical Charge–Off Component – Applies a rolling, eight–quarter historical charge–off rate to all pools of non–classified loans.
• Qualitative Factors Component – The loan portfolio is broken down into multiple homogenous sub classifications, upon which multiple factors (such as delin-quency trends, economic conditions, concentrations, growth/volume trends, and management/staff ability) are evaluated, resulting in an allowance amount for each of the sub classifications. The sum of these amounts comprises the Qualitative Factors Component.
All of these factors may be susceptible to significant change. In 2014, management reduced the qualitative factor from “high” to “moderate” related to the economy as there continues to be improvement in the economic conditions in the region. The average historical loss factor for commercial and industrial loans increased as a result of the $253,000 charge–off during 2014. With the exception of this segment, the average eight rolling quarter net loss factors have declined during the year as a result of a lower level of net charge–offs in 2014. To the extent actual outcomes differ from management’s estimates, additional provisions for loan losses may be required that would adversely impact earnings in future periods.
According to the Bank’s policy, a loss (“charge–off”) is to be recognized and charged to the allowance for loan losses as soon as a loan is recognized as uncollectible. All credits that are 90 days or more past due must be analyzed for the Bank’s ability to collect the outstanding principal and/or interest. Once a loss is known to exist, the charge–off approval process must be followed for all loan types. An analysis of the activity in the allowance for loan losses for the years 2014 and 2013 is as follows:
For the Year Ended December 31, 2014
(in 000’s)Commercial
and IndustrialCommercial Real Estate
Consumer Real Estate
Consumer and Other Loans Total
Beginning balance $ 483 $ 280 $ 59 $ 17 $ 839
Provision for loan losses 169 20 (28) 1 162
Charge–offs (253) – (19) (30) (302)
Recoveries 4 – 8 24 36
Net charge–offs (249) – (11) (6) (266)
Ending balance $ 403 $ 300 $ 20 $ 12 $ 735
Period–end amount allocated to:
Loans individually evaluated for impairment $ 247 $ 27 $ – $ – $ 274
Loans collectively evaluated for impairment 156 273 20 12 461
$ 403 $ 300 $ 20 $ 12 $ 735
Loans, ending balance:
Loans individually evaluated for impairment $ 382 $ 1,623 $ – $ – $ 2,005
Loans collectively evaluated for impairment 4,253 29,933 3,297 1,373 $38,856
Total $4,635 $31,566 $3,297 $1,373 $40,861
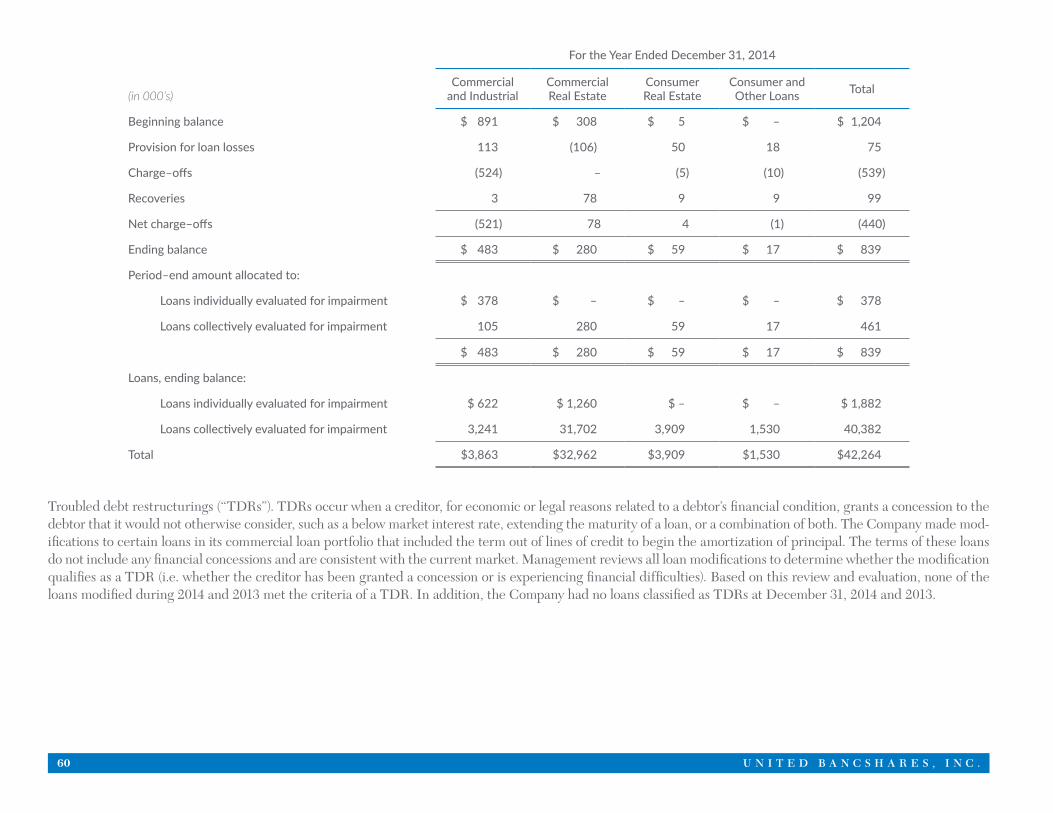
60 U N I T E D B A N C S H A R E S , I N C .
For the Year Ended December 31, 2014
(in 000’s)Commercial
and IndustrialCommercial Real Estate
Consumer Real Estate
Consumer and Other Loans Total
Beginning balance $ 891 $ 308 $ 5 $ – $ 1,204
Provision for loan losses 113 (106) 50 18 75
Charge–offs (524) – (5) (10) (539)
Recoveries 3 78 9 9 99
Net charge–offs (521) 78 4 (1) (440)
Ending balance $ 483 $ 280 $ 59 $ 17 $ 839
Period–end amount allocated to:
Loans individually evaluated for impairment $ 378 $ – $ – $ – $ 378
Loans collectively evaluated for impairment 105 280 59 17 461
$ 483 $ 280 $ 59 $ 17 $ 839
Loans, ending balance:
Loans individually evaluated for impairment $ 622 $ 1,260 $ – $ – $ 1,882
Loans collectively evaluated for impairment 3,241 31,702 3,909 1,530 40,382
Total $3,863 $32,962 $3,909 $1,530 $42,264
Troubled debt restructurings (“TDRs”). TDRs occur when a creditor, for economic or legal reasons related to a debtor’s financial condition, grants a concession to the debtor that it would not otherwise consider, such as a below market interest rate, extending the maturity of a loan, or a combination of both. The Company made mod-ifications to certain loans in its commercial loan portfolio that included the term out of lines of credit to begin the amortization of principal. The terms of these loans do not include any financial concessions and are consistent with the current market. Management reviews all loan modifications to determine whether the modification qualifies as a TDR (i.e. whether the creditor has been granted a concession or is experiencing financial difficulties). Based on this review and evaluation, none of the loans modified during 2014 and 2013 met the criteria of a TDR. In addition, the Company had no loans classified as TDRs at December 31, 2014 and 2013.
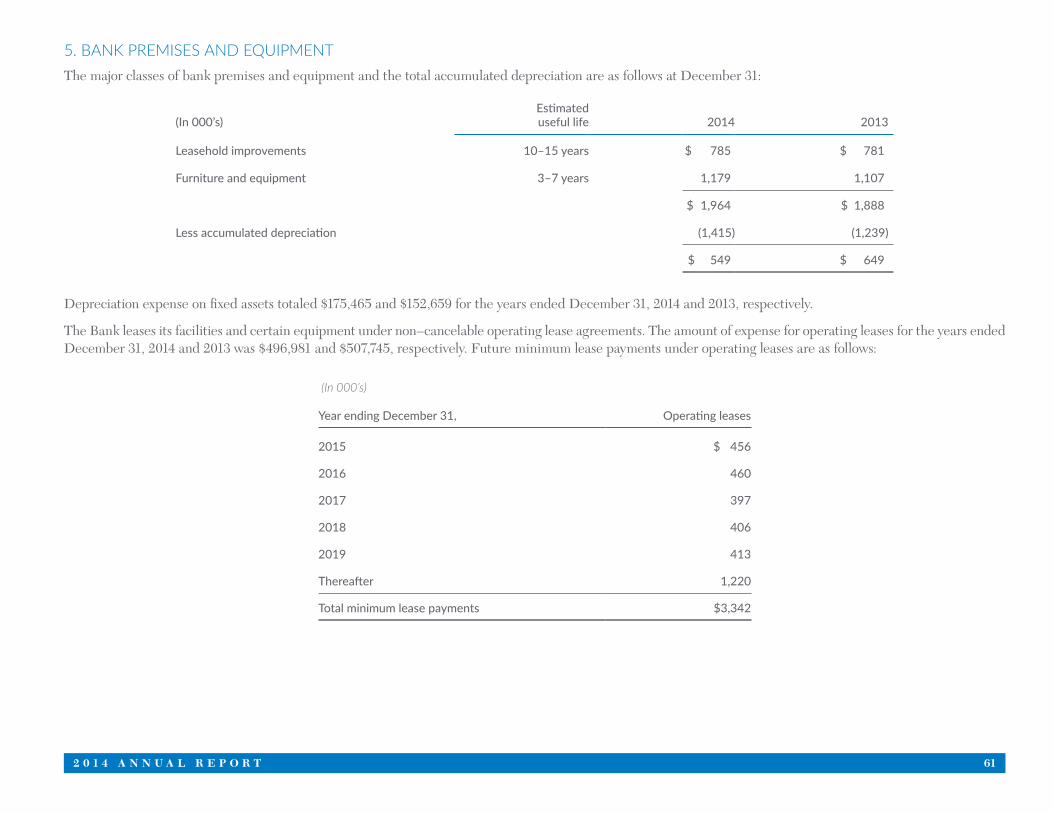
2 0 1 4 A N N U A L R E P O R T 61
5. BANK PREMISES AND EQUIPMENTThe major classes of bank premises and equipment and the total accumulated depreciation are as follows at December 31:
(In 000’s)Estimateduseful life 2014 2013
Leasehold improvements 10–15 years $ 785 $ 781
Furniture and equipment 3–7 years 1,179 1,107
$ 1,964 $ 1,888
Less accumulated depreciation (1,415) (1,239)
$ 549 $ 649
Depreciation expense on fixed assets totaled $175,465 and $152,659 for the years ended December 31, 2014 and 2013, respectively.
The Bank leases its facilities and certain equipment under non–cancelable operating lease agreements. The amount of expense for operating leases for the years ended December 31, 2014 and 2013 was $496,981 and $507,745, respectively. Future minimum lease payments under operating leases are as follows:
(In 000’s)
Year ending December 31, Operating leases
2015 $ 456
2016 460
2017 397
2018 406
2019 413
Thereafter 1,220
Total minimum lease payments $3,342
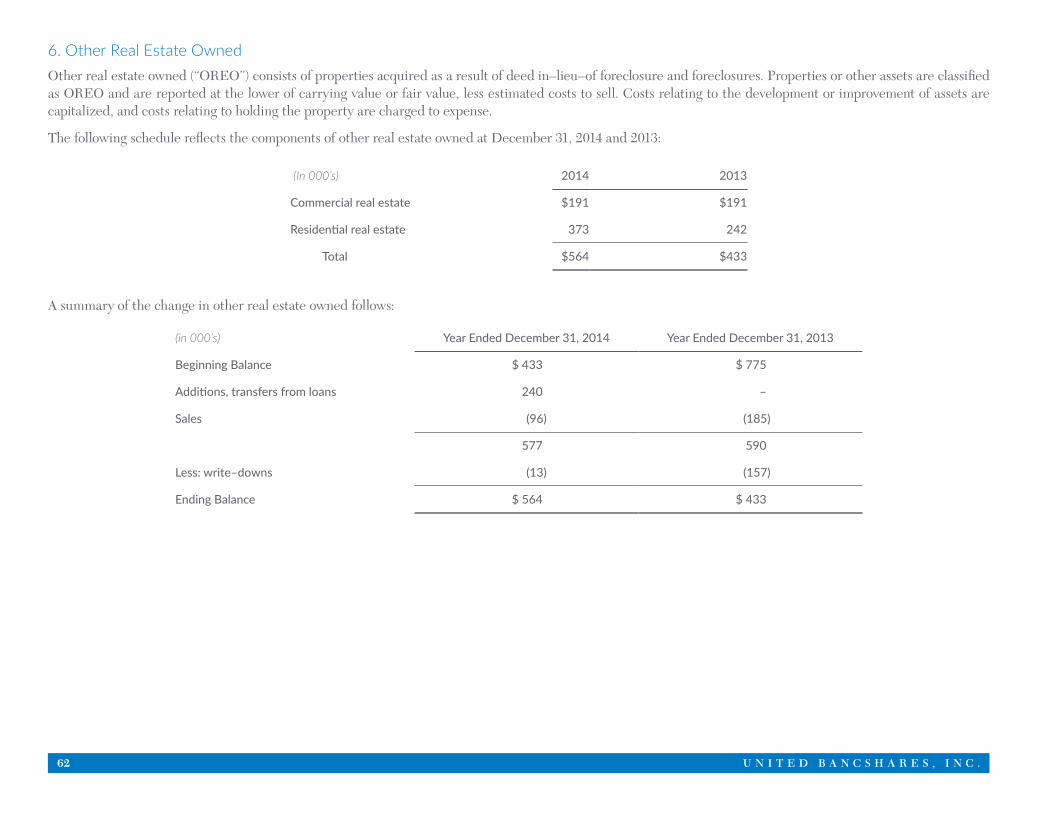
62 U N I T E D B A N C S H A R E S , I N C .
6. Other Real Estate OwnedOther real estate owned (“OREO”) consists of properties acquired as a result of deed in–lieu–of foreclosure and foreclosures. Properties or other assets are classified as OREO and are reported at the lower of carrying value or fair value, less estimated costs to sell. Costs relating to the development or improvement of assets are capitalized, and costs relating to holding the property are charged to expense.
The following schedule reflects the components of other real estate owned at December 31, 2014 and 2013:
(In 000’s) 2014 2013
Commercial real estate $191 $191
Residential real estate 373 242
Total $564 $433
A summary of the change in other real estate owned follows:
(in 000’s) Year Ended December 31, 2014 Year Ended December 31, 2013
Beginning Balance $ 433 $ 775
Additions, transfers from loans 240 –
Sales (96) (185)
577 590
Less: write–downs (13) (157)
Ending Balance $ 564 $ 433
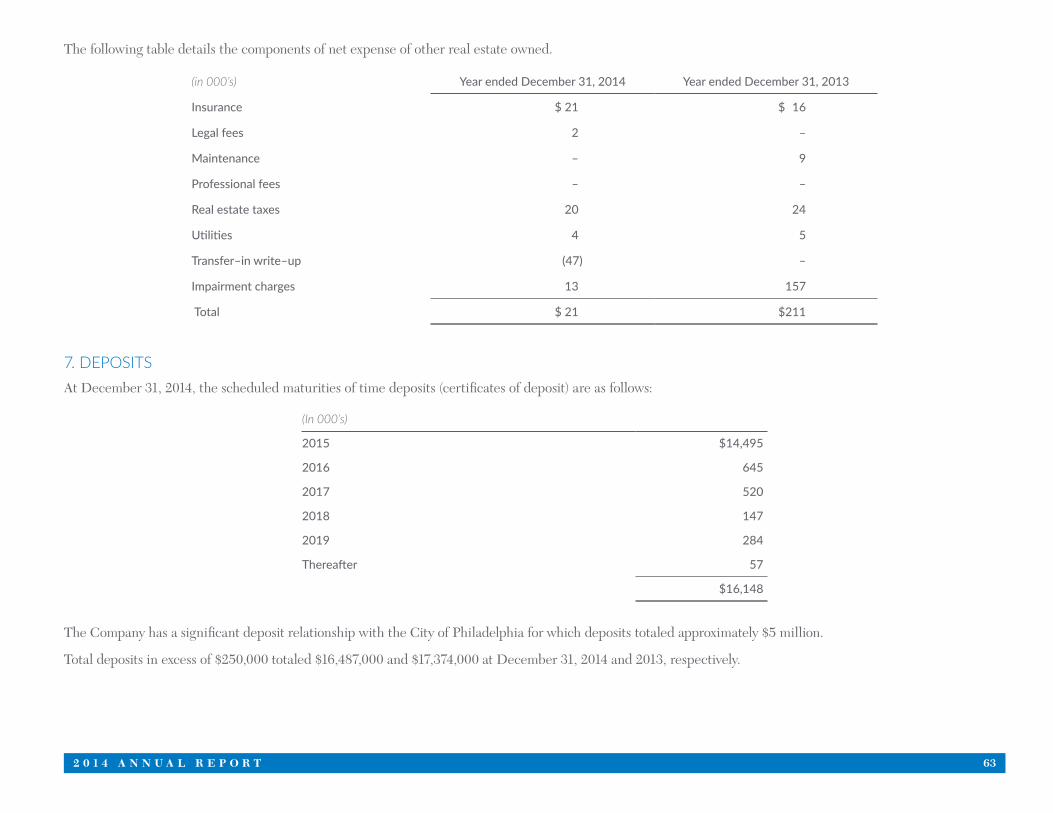
2 0 1 4 A N N U A L R E P O R T 63
The following table details the components of net expense of other real estate owned.
(in 000’s) Year ended December 31, 2014 Year ended December 31, 2013
Insurance $ 21 $ 16
Legal fees 2 –
Maintenance – 9
Professional fees – –
Real estate taxes 20 24
Utilities 4 5
Transfer–in write–up (47) –
Impairment charges 13 157
Total $ 21 $211
7. DEPOSITSAt December 31, 2014, the scheduled maturities of time deposits (certificates of deposit) are as follows:
(In 000’s)
2015 $14,495
2016 645
2017 520
2018 147
2019 284
Thereafter 57
$16,148
The Company has a significant deposit relationship with the City of Philadelphia for which deposits totaled approximately $5 million.
Total deposits in excess of $250,000 totaled $16,487,000 and $17,374,000 at December 31, 2014 and 2013, respectively.
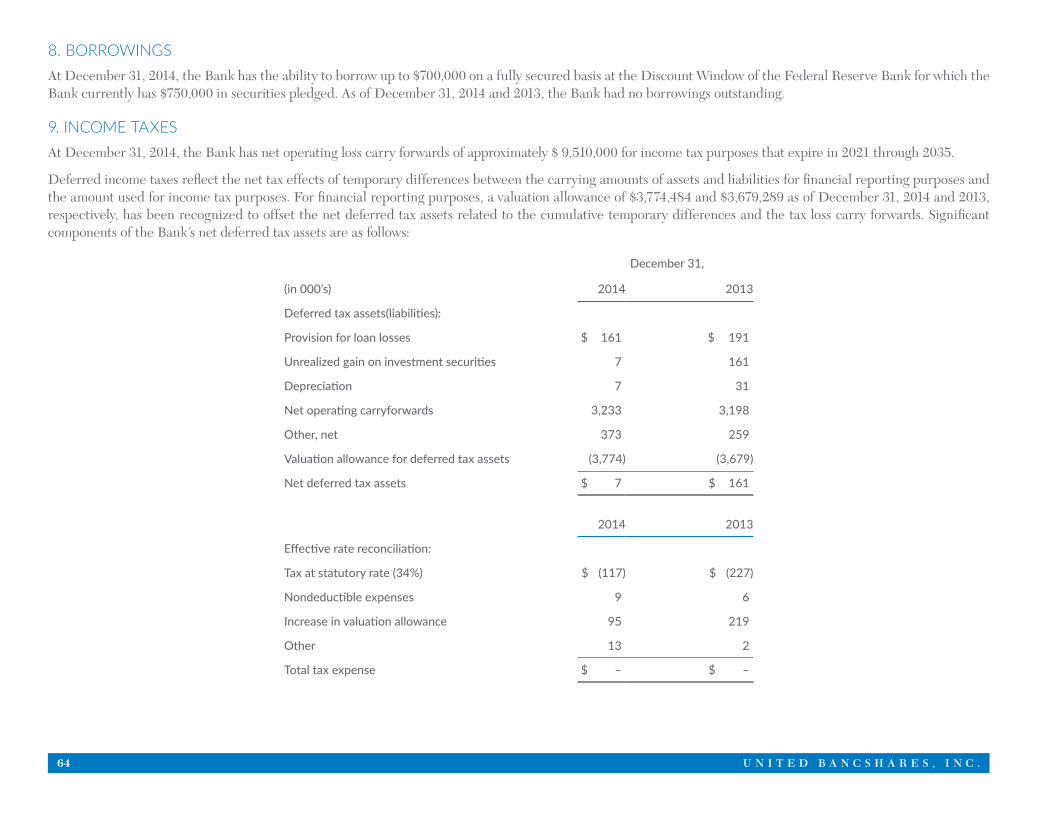
64 U N I T E D B A N C S H A R E S , I N C .
8. BORROWINGSAt December 31, 2014, the Bank has the ability to borrow up to $700,000 on a fully secured basis at the Discount Window of the Federal Reserve Bank for which the Bank currently has $750,000 in securities pledged. As of December 31, 2014 and 2013, the Bank had no borrowings outstanding.
9. INCOME TAXESAt December 31, 2014, the Bank has net operating loss carry forwards of approximately $ 9,510,000 for income tax purposes that expire in 2021 through 2035.
Deferred income taxes reflect the net tax effects of temporary differences between the carrying amounts of assets and liabilities for financial reporting purposes and the amount used for income tax purposes. For financial reporting purposes, a valuation allowance of $3,774,484 and $3,679,289 as of December 31, 2014 and 2013, respectively, has been recognized to offset the net deferred tax assets related to the cumulative temporary differences and the tax loss carry forwards. Significant components of the Bank’s net deferred tax assets are as follows:
December 31,
(in 000’s) 2014 2013
Deferred tax assets(liabilities):
Provision for loan losses $ 161 $ 191
Unrealized gain on investment securities 7 161
Depreciation 7 31
Net operating carryforwards 3,233 3,198
Other, net 373 259
Valuation allowance for deferred tax assets (3,774) (3,679)
Net deferred tax assets $ 7 $ 161
2014 2013
Effective rate reconciliation:
Tax at statutory rate (34%) $ (117) $ (227)
Nondeductible expenses 9 6
Increase in valuation allowance 95 219
Other 13 2
Total tax expense $ – $ –
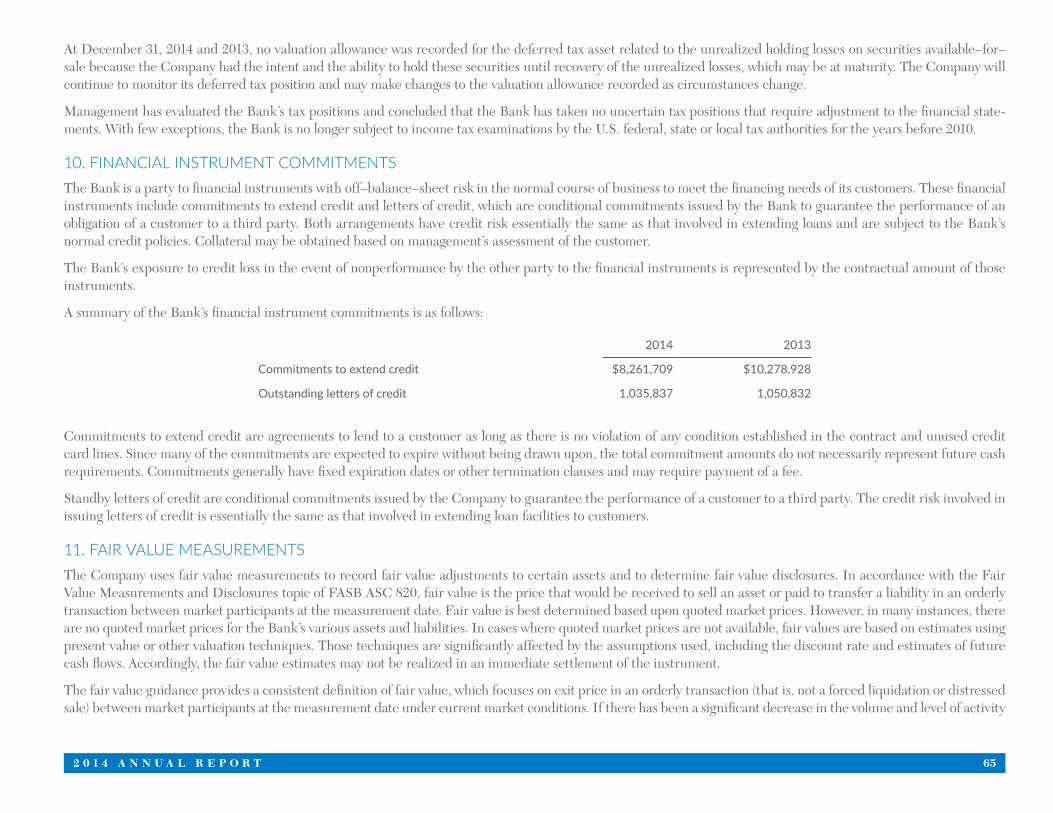
2 0 1 4 A N N U A L R E P O R T 65
At December 31, 2014 and 2013, no valuation allowance was recorded for the deferred tax asset related to the unrealized holding losses on securities available–for–sale because the Company had the intent and the ability to hold these securities until recovery of the unrealized losses, which may be at maturity. The Company will continue to monitor its deferred tax position and may make changes to the valuation allowance recorded as circumstances change.
Management has evaluated the Bank’s tax positions and concluded that the Bank has taken no uncertain tax positions that require adjustment to the financial state-ments. With few exceptions, the Bank is no longer subject to income tax examinations by the U.S. federal, state or local tax authorities for the years before 2010.
10. FINANCIAL INSTRUMENT COMMITMENTSThe Bank is a party to financial instruments with off–balance–sheet risk in the normal course of business to meet the financing needs of its customers. These financial instruments include commitments to extend credit and letters of credit, which are conditional commitments issued by the Bank to guarantee the performance of an obligation of a customer to a third party. Both arrangements have credit risk essentially the same as that involved in extending loans and are subject to the Bank’s normal credit policies. Collateral may be obtained based on management’s assessment of the customer.
The Bank’s exposure to credit loss in the event of nonperformance by the other party to the financial instruments is represented by the contractual amount of those instruments.
A summary of the Bank’s financial instrument commitments is as follows:
2014 2013
Commitments to extend credit $8,261,709 $10,278,928
Outstanding letters of credit 1,035,837 1,050,832
Commitments to extend credit are agreements to lend to a customer as long as there is no violation of any condition established in the contract and unused credit card lines. Since many of the commitments are expected to expire without being drawn upon, the total commitment amounts do not necessarily represent future cash requirements. Commitments generally have fixed expiration dates or other termination clauses and may require payment of a fee.
Standby letters of credit are conditional commitments issued by the Company to guarantee the performance of a customer to a third party. The credit risk involved in issuing letters of credit is essentially the same as that involved in extending loan facilities to customers.
11. FAIR VALUE MEASUREMENTS The Company uses fair value measurements to record fair value adjustments to certain assets and to determine fair value disclosures. In accordance with the Fair Value Measurements and Disclosures topic of FASB ASC 820, fair value is the price that would be received to sell an asset or paid to transfer a liability in an orderly transaction between market participants at the measurement date. Fair value is best determined based upon quoted market prices. However, in many instances, there are no quoted market prices for the Bank’s various assets and liabilities. In cases where quoted market prices are not available, fair values are based on estimates using present value or other valuation techniques. Those techniques are significantly affected by the assumptions used, including the discount rate and estimates of future cash flows. Accordingly, the fair value estimates may not be realized in an immediate settlement of the instrument.
The fair value guidance provides a consistent definition of fair value, which focuses on exit price in an orderly transaction (that is, not a forced liquidation or distressed sale) between market participants at the measurement date under current market conditions. If there has been a significant decrease in the volume and level of activity

66 U N I T E D B A N C S H A R E S , I N C .
for the asset or liability, a change in valuation technique or the use of multiple valuation techniques may be appropriate. In such instances, determining the price at which willing market participants would transact at the measurement date under current market conditions depends on the facts and circumstances and requires the use of significant judgment. The fair value is a reasonable point within the range that is most representative of fair value under current market conditions. In accor-dance with this guidance, the Company groups its assets and liabilities carried or disclosed at fair value in three levels as follows:
Level 1 • Unadjusted quoted prices in active markets that are accessible at the measurement date for identical, unrestricted assets or liabilities.
Level 2 Inputs• Quoted prices for similar assets or liabilities in active markets.
• Quoted prices for identical or similar assets or liabilities in markets that are not active.
• Inputs other than quoted prices that are observable, either directly or indirectly, for the term of the asset or liability (e.g., interest rates, yield curves, credit risks, prepayment speeds or volatilities) or “market corroborated inputs.”
Level 3 Inputs• Prices or valuation techniques that require inputs that are both unobservable (i.e. supported by little or no market activity) and that are significant to the fair
value of the assets or liabilities.
• These assets and liabilities include financial instruments whose value is determined using pricing models, discounted cash flow methodologies, or similar tech-niques, as well as instruments for which the determination of fair value requires significant management judgment or estimation.
An asset’s or liability’s financial categorization within the valuation hierarchy is based on the lowest level of input that is significant to the fair value measurement.
Fair Value on a Recurring BasisSecurities Available for Sale: Where quoted prices are available in an active market, securities would be classified within Level 1 of the valuation hierarchy. Level 1 securities include money market funds. If quoted market prices are not available, then fair values are estimated by using pricing models, quoted prices of securities with similar characteristics, or discounted cash flow. Level 2 securities include U.S. agency securities and agency mortgage backed securities. In certain cases where there is limited activity or less transparency around inputs to the valuation, securities are classified within Level 3 of the valuation hierarchy.
Loans Held for Sale. Fair values are estimated by using actual quoted market bids on a loan by loan basis.
Loans Held at Fair Value. Fair values are estimated based on the present value of future cashflows for each asset based on their unique characteristics, market–based assumptions for prepayment speeds, discount rates, default and voluntary prepayments as well as assumptions for losses and recoveries.
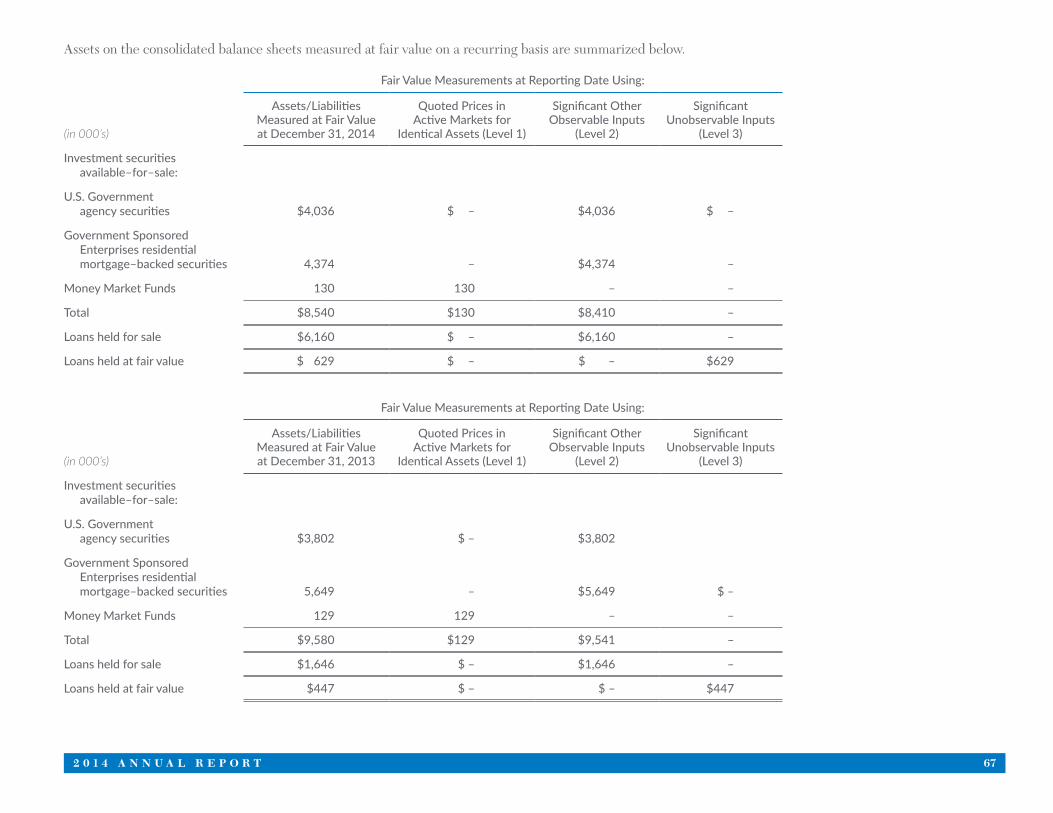
2 0 1 4 A N N U A L R E P O R T 67
Assets on the consolidated balance sheets measured at fair value on a recurring basis are summarized below.
Fair Value Measurements at Reporting Date Using:
(in 000’s)
Assets/LiabilitiesMeasured at Fair Valueat December 31, 2014
Quoted Prices inActive Markets for
Identical Assets (Level 1)
Significant Other Observable Inputs
(Level 2)
Significant Unobservable Inputs
(Level 3)
Investment securities available–for–sale:
U.S. Government agency securities $4,036 $ – $4,036 $ –
Government Sponsored Enterprises residential mortgage–backed securities 4,374 – $4,374 –
Money Market Funds 130 130 – –
Total $8,540 $130 $8,410 –
Loans held for sale $6,160 $ – $6,160 –
Loans held at fair value $ 629 $ – $ – $629
Fair Value Measurements at Reporting Date Using:
(in 000’s)
Assets/LiabilitiesMeasured at Fair Valueat December 31, 2013
Quoted Prices inActive Markets for
Identical Assets (Level 1)
Significant Other Observable Inputs
(Level 2)
Significant Unobservable Inputs
(Level 3)
Investment securities available–for–sale:
U.S. Government agency securities $3,802 $ – $3,802
Government Sponsored Enterprises residential mortgage–backed securities 5,649 – $5,649 $ –
Money Market Funds 129 129 – –
Total $9,580 $129 $9,541 –
Loans held for sale $1,646 $ – $1,646 –
Loans held at fair value $447 $ – $ – $447
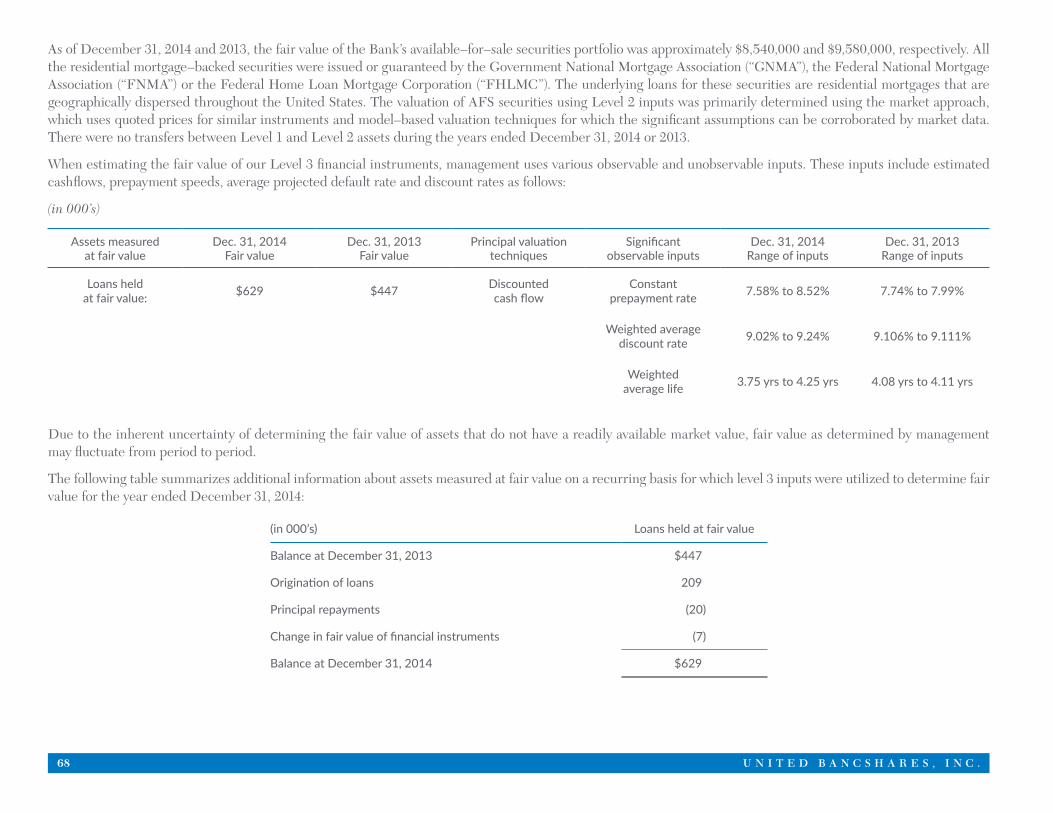
68 U N I T E D B A N C S H A R E S , I N C .
As of December 31, 2014 and 2013, the fair value of the Bank’s available–for–sale securities portfolio was approximately $8,540,000 and $9,580,000, respectively. All the residential mortgage–backed securities were issued or guaranteed by the Government National Mortgage Association (“GNMA”), the Federal National Mortgage Association (“FNMA”) or the Federal Home Loan Mortgage Corporation (“FHLMC”). The underlying loans for these securities are residential mortgages that are geographically dispersed throughout the United States. The valuation of AFS securities using Level 2 inputs was primarily determined using the market approach, which uses quoted prices for similar instruments and model–based valuation techniques for which the significant assumptions can be corroborated by market data. There were no transfers between Level 1 and Level 2 assets during the years ended December 31, 2014 or 2013.
When estimating the fair value of our Level 3 financial instruments, management uses various observable and unobservable inputs. These inputs include estimated cashflows, prepayment speeds, average projected default rate and discount rates as follows:
(in 000’s)
Assets measured at fair value
Dec. 31, 2014Fair value
Dec. 31, 2013Fair value
Principal valuation techniques
Significant observable inputs
Dec. 31, 2014Range of inputs
Dec. 31, 2013Range of inputs
Loans held at fair value: $629 $447 Discounted
cash flowConstant
prepayment rate 7.58% to 8.52% 7.74% to 7.99%
Weighted average discount rate 9.02% to 9.24% 9.106% to 9.111%
Weighted average life 3.75 yrs to 4.25 yrs 4.08 yrs to 4.11 yrs
Due to the inherent uncertainty of determining the fair value of assets that do not have a readily available market value, fair value as determined by management may fluctuate from period to period.
The following table summarizes additional information about assets measured at fair value on a recurring basis for which level 3 inputs were utilized to determine fair value for the year ended December 31, 2014:
(in 000’s) Loans held at fair value
Balance at December 31, 2013 $447
Origination of loans 209
Principal repayments (20)
Change in fair value of financial instruments (7)
Balance at December 31, 2014 $629
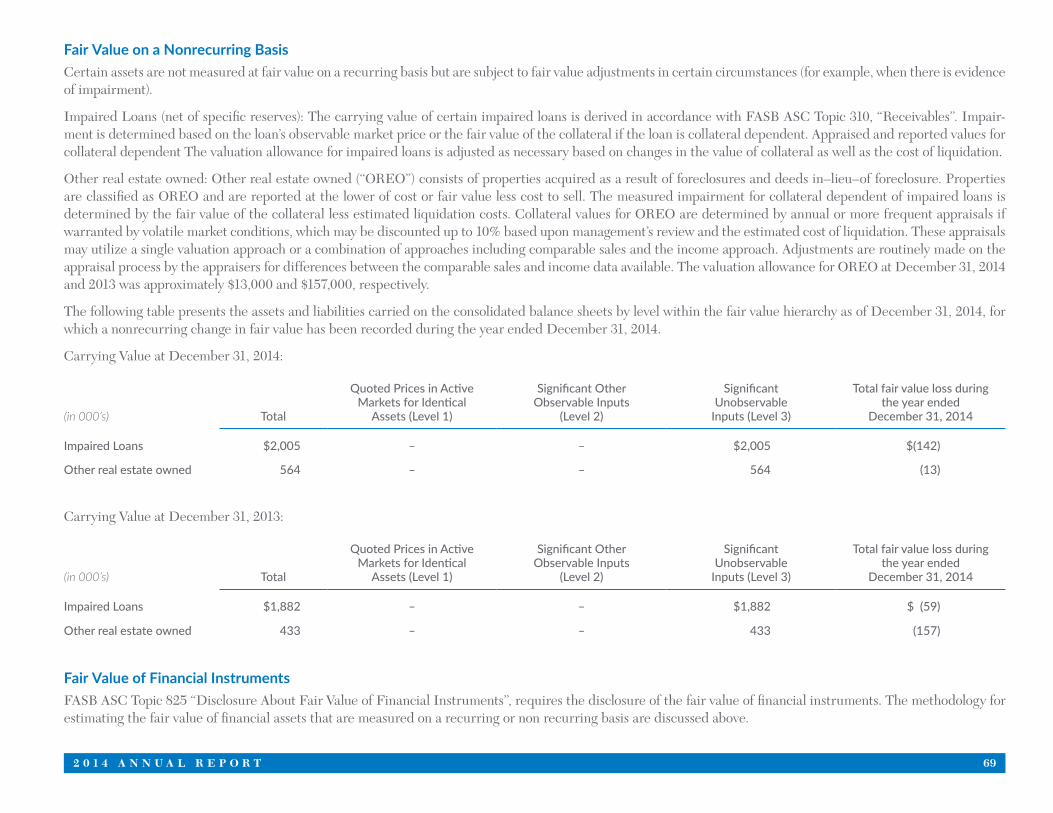
2 0 1 4 A N N U A L R E P O R T 69
Fair Value on a Nonrecurring BasisCertain assets are not measured at fair value on a recurring basis but are subject to fair value adjustments in certain circumstances (for example, when there is evidence of impairment).
Impaired Loans (net of specific reserves): The carrying value of certain impaired loans is derived in accordance with FASB ASC Topic 310, “Receivables”. Impair-ment is determined based on the loan’s observable market price or the fair value of the collateral if the loan is collateral dependent. Appraised and reported values for collateral dependent The valuation allowance for impaired loans is adjusted as necessary based on changes in the value of collateral as well as the cost of liquidation.
Other real estate owned: Other real estate owned (“OREO”) consists of properties acquired as a result of foreclosures and deeds in–lieu–of foreclosure. Properties are classified as OREO and are reported at the lower of cost or fair value less cost to sell. The measured impairment for collateral dependent of impaired loans is determined by the fair value of the collateral less estimated liquidation costs. Collateral values for OREO are determined by annual or more frequent appraisals if warranted by volatile market conditions, which may be discounted up to 10% based upon management’s review and the estimated cost of liquidation. These appraisals may utilize a single valuation approach or a combination of approaches including comparable sales and the income approach. Adjustments are routinely made on the appraisal process by the appraisers for differences between the comparable sales and income data available. The valuation allowance for OREO at December 31, 2014 and 2013 was approximately $13,000 and $157,000, respectively.
The following table presents the assets and liabilities carried on the consolidated balance sheets by level within the fair value hierarchy as of December 31, 2014, for which a nonrecurring change in fair value has been recorded during the year ended December 31, 2014.
Carrying Value at December 31, 2014:
(in 000’s) Total
Quoted Prices in Active Markets for Identical
Assets (Level 1)
Significant Other Observable Inputs
(Level 2)
SignificantUnobservable
Inputs (Level 3)
Total fair value loss duringthe year ended
December 31, 2014
Impaired Loans
Other real estate owned
$2,005
564
–
–
–
–
$2,005
564
$(142)
(13)
Carrying Value at December 31, 2013:
(in 000’s) Total
Quoted Prices in Active Markets for Identical
Assets (Level 1)
Significant Other Observable Inputs
(Level 2)
SignificantUnobservable
Inputs (Level 3)
Total fair value loss duringthe year ended
December 31, 2014
Impaired Loans $1,882 – – $1,882 $ (59)
Other real estate owned 433 – – 433 (157)
Fair Value of Financial InstrumentsFASB ASC Topic 825 “Disclosure About Fair Value of Financial Instruments”, requires the disclosure of the fair value of financial instruments. The methodology for estimating the fair value of financial assets that are measured on a recurring or non recurring basis are discussed above.
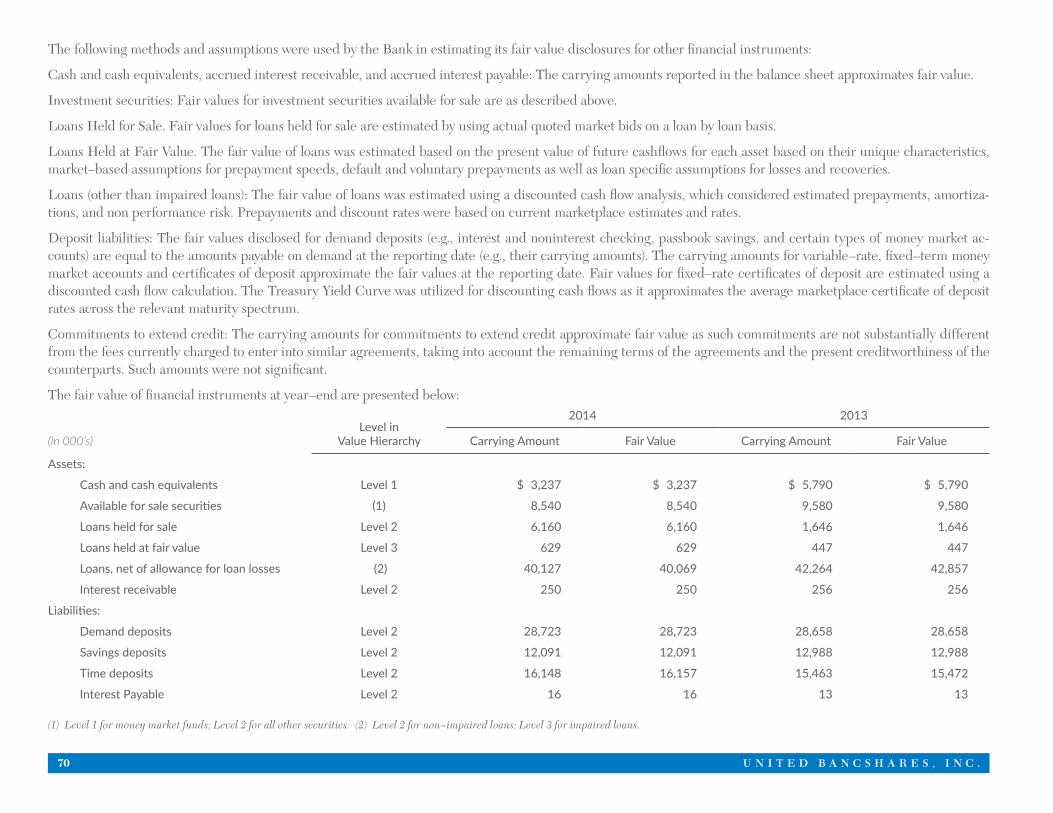
70 U N I T E D B A N C S H A R E S , I N C .
The following methods and assumptions were used by the Bank in estimating its fair value disclosures for other financial instruments:
Cash and cash equivalents, accrued interest receivable, and accrued interest payable: The carrying amounts reported in the balance sheet approximates fair value.
Investment securities: Fair values for investment securities available for sale are as described above.
Loans Held for Sale. Fair values for loans held for sale are estimated by using actual quoted market bids on a loan by loan basis.
Loans Held at Fair Value. The fair value of loans was estimated based on the present value of future cashflows for each asset based on their unique characteristics, market–based assumptions for prepayment speeds, default and voluntary prepayments as well as loan specific assumptions for losses and recoveries.
Loans (other than impaired loans): The fair value of loans was estimated using a discounted cash flow analysis, which considered estimated prepayments, amortiza-tions, and non performance risk. Prepayments and discount rates were based on current marketplace estimates and rates.
Deposit liabilities: The fair values disclosed for demand deposits (e.g., interest and noninterest checking, passbook savings, and certain types of money market ac-counts) are equal to the amounts payable on demand at the reporting date (e.g., their carrying amounts). The carrying amounts for variable–rate, fixed–term money market accounts and certificates of deposit approximate the fair values at the reporting date. Fair values for fixed–rate certificates of deposit are estimated using a discounted cash flow calculation. The Treasury Yield Curve was utilized for discounting cash flows as it approximates the average marketplace certificate of deposit rates across the relevant maturity spectrum.
Commitments to extend credit: The carrying amounts for commitments to extend credit approximate fair value as such commitments are not substantially different from the fees currently charged to enter into similar agreements, taking into account the remaining terms of the agreements and the present creditworthiness of the counterparts. Such amounts were not significant.
The fair value of financial instruments at year–end are presented below:
(in 000’s)Level in
Value Hierarchy
2014 2013
Carrying Amount Fair Value Carrying Amount Fair Value
Assets:
Cash and cash equivalents Level 1 $ 3,237 $ 3,237 $ 5,790 $ 5,790
Available for sale securities (1) 8,540 8,540 9,580 9,580
Loans held for sale Level 2 6,160 6,160 1,646 1,646
Loans held at fair value Level 3 629 629 447 447
Loans, net of allowance for loan losses (2) 40,127 40,069 42,264 42,857
Interest receivable Level 2 250 250 256 256
Liabilities:
Demand deposits Level 2 28,723 28,723 28,658 28,658
Savings deposits Level 2 12,091 12,091 12,988 12,988
Time deposits Level 2 16,148 16,157 15,463 15,472
Interest Payable Level 2 16 16 13 13
(1) Level 1 for money market funds; Level 2 for all other securities. (2) Level 2 for non–impaired loans; Level 3 for impaired loans.
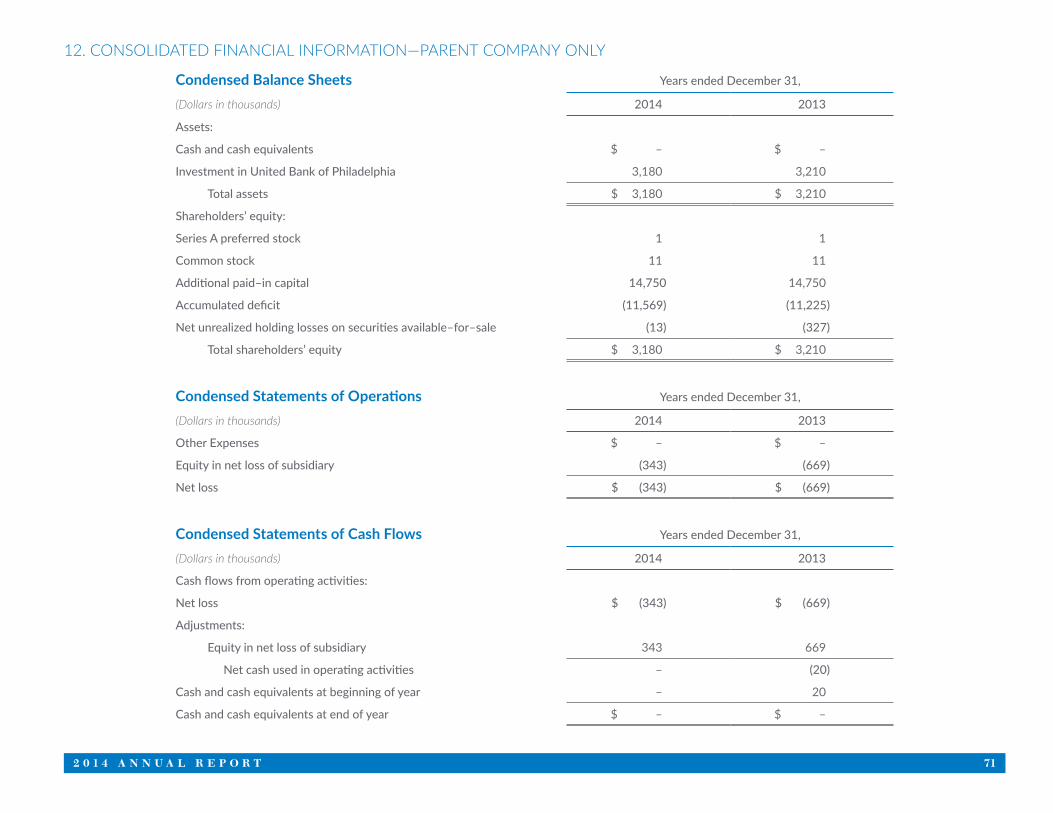
2 0 1 4 A N N U A L R E P O R T 71
12. CONSOLIDATED FINANCIAL INFORMATION—PARENT COMPANY ONLY
Condensed Balance Sheets Years ended December 31,
(Dollars in thousands) 2014 2013
Assets:
Cash and cash equivalents $ – $ –
Investment in United Bank of Philadelphia 3,180 3,210
Total assets $ 3,180 $ 3,210
Shareholders’ equity:
Series A preferred stock 1 1
Common stock 11 11
Additional paid–in capital 14,750 14,750
Accumulated deficit (11,569) (11,225)
Net unrealized holding losses on securities available–for–sale (13) (327)
Total shareholders’ equity $ 3,180 $ 3,210
Condensed Statements of Operations Years ended December 31,
(Dollars in thousands) 2014 2013
Other Expenses $ – $ –
Equity in net loss of subsidiary (343) (669)
Net loss $ (343) $ (669)
Condensed Statements of Cash Flows Years ended December 31,
(Dollars in thousands) 2014 2013
Cash flows from operating activities:
Net loss $ (343) $ (669)
Adjustments:
Equity in net loss of subsidiary 343 669
Net cash used in operating activities – (20)
Cash and cash equivalents at beginning of year – 20
Cash and cash equivalents at end of year $ – $ –
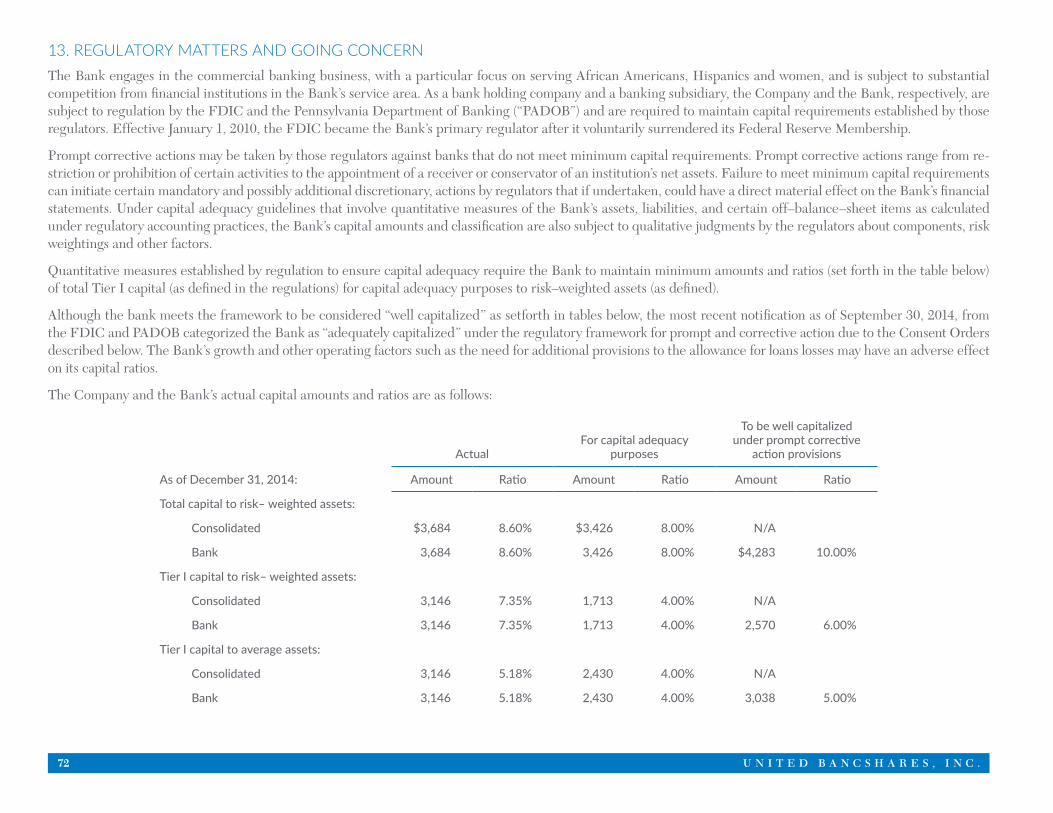
72 U N I T E D B A N C S H A R E S , I N C .
13. REGULATORY MATTERS AND GOING CONCERNThe Bank engages in the commercial banking business, with a particular focus on serving African Americans, Hispanics and women, and is subject to substantial competition from financial institutions in the Bank’s service area. As a bank holding company and a banking subsidiary, the Company and the Bank, respectively, are subject to regulation by the FDIC and the Pennsylvania Department of Banking (“PADOB”) and are required to maintain capital requirements established by those regulators. Effective January 1, 2010, the FDIC became the Bank’s primary regulator after it voluntarily surrendered its Federal Reserve Membership.
Prompt corrective actions may be taken by those regulators against banks that do not meet minimum capital requirements. Prompt corrective actions range from re-striction or prohibition of certain activities to the appointment of a receiver or conservator of an institution’s net assets. Failure to meet minimum capital requirements can initiate certain mandatory and possibly additional discretionary, actions by regulators that if undertaken, could have a direct material effect on the Bank’s financial statements. Under capital adequacy guidelines that involve quantitative measures of the Bank’s assets, liabilities, and certain off–balance–sheet items as calculated under regulatory accounting practices, the Bank’s capital amounts and classification are also subject to qualitative judgments by the regulators about components, risk weightings and other factors.
Quantitative measures established by regulation to ensure capital adequacy require the Bank to maintain minimum amounts and ratios (set forth in the table below) of total Tier I capital (as defined in the regulations) for capital adequacy purposes to risk–weighted assets (as defined).
Although the bank meets the framework to be considered “well capitalized” as setforth in tables below, the most recent notification as of September 30, 2014, from the FDIC and PADOB categorized the Bank as “adequately capitalized” under the regulatory framework for prompt and corrective action due to the Consent Orders described below. The Bank’s growth and other operating factors such as the need for additional provisions to the allowance for loans losses may have an adverse effect on its capital ratios.
The Company and the Bank’s actual capital amounts and ratios are as follows:
ActualFor capital adequacy
purposes
To be well capitalized under prompt corrective
action provisions
As of December 31, 2014: Amount Ratio Amount Ratio Amount Ratio
Total capital to risk– weighted assets:
Consolidated $3,684 8.60% $3,426 8.00% N/A
Bank 3,684 8.60% 3,426 8.00% $4,283 10.00%
Tier I capital to risk– weighted assets:
Consolidated 3,146 7.35% 1,713 4.00% N/A
Bank 3,146 7.35% 1,713 4.00% 2,570 6.00%
Tier I capital to average assets:
Consolidated 3,146 5.18% 2,430 4.00% N/A
Bank 3,146 5.18% 2,430 4.00% 3,038 5.00%
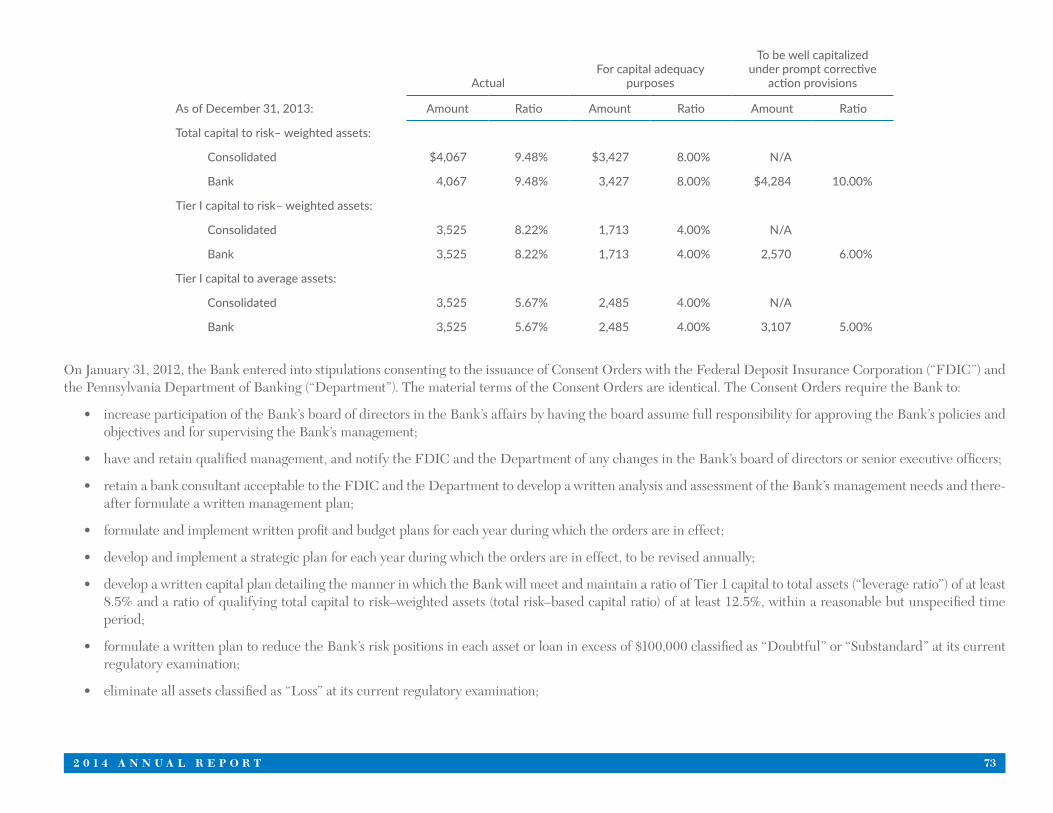
2 0 1 4 A N N U A L R E P O R T 73
ActualFor capital adequacy
purposes
To be well capitalized under prompt corrective
action provisions
As of December 31, 2013: Amount Ratio Amount Ratio Amount Ratio
Total capital to risk– weighted assets:
Consolidated $4,067 9.48% $3,427 8.00% N/A
Bank 4,067 9.48% 3,427 8.00% $4,284 10.00%
Tier I capital to risk– weighted assets:
Consolidated 3,525 8.22% 1,713 4.00% N/A
Bank 3,525 8.22% 1,713 4.00% 2,570 6.00%
Tier I capital to average assets:
Consolidated 3,525 5.67% 2,485 4.00% N/A
Bank 3,525 5.67% 2,485 4.00% 3,107 5.00%
On January 31, 2012, the Bank entered into stipulations consenting to the issuance of Consent Orders with the Federal Deposit Insurance Corporation (“FDIC”) and the Pennsylvania Department of Banking (“Department”). The material terms of the Consent Orders are identical. The Consent Orders require the Bank to:
• increase participation of the Bank’s board of directors in the Bank’s affairs by having the board assume full responsibility for approving the Bank’s policies and objectives and for supervising the Bank’s management;
• have and retain qualified management, and notify the FDIC and the Department of any changes in the Bank’s board of directors or senior executive officers;
• retain a bank consultant acceptable to the FDIC and the Department to develop a written analysis and assessment of the Bank’s management needs and there-after formulate a written management plan;
• formulate and implement written profit and budget plans for each year during which the orders are in effect;
• develop and implement a strategic plan for each year during which the orders are in effect, to be revised annually;
• develop a written capital plan detailing the manner in which the Bank will meet and maintain a ratio of Tier 1 capital to total assets (“leverage ratio”) of at least 8.5% and a ratio of qualifying total capital to risk–weighted assets (total risk–based capital ratio) of at least 12.5%, within a reasonable but unspecified time period;
• formulate a written plan to reduce the Bank’s risk positions in each asset or loan in excess of $100,000 classified as “Doubtful” or “Substandard” at its current regulatory examination;
• eliminate all assets classified as “Loss” at its current regulatory examination;
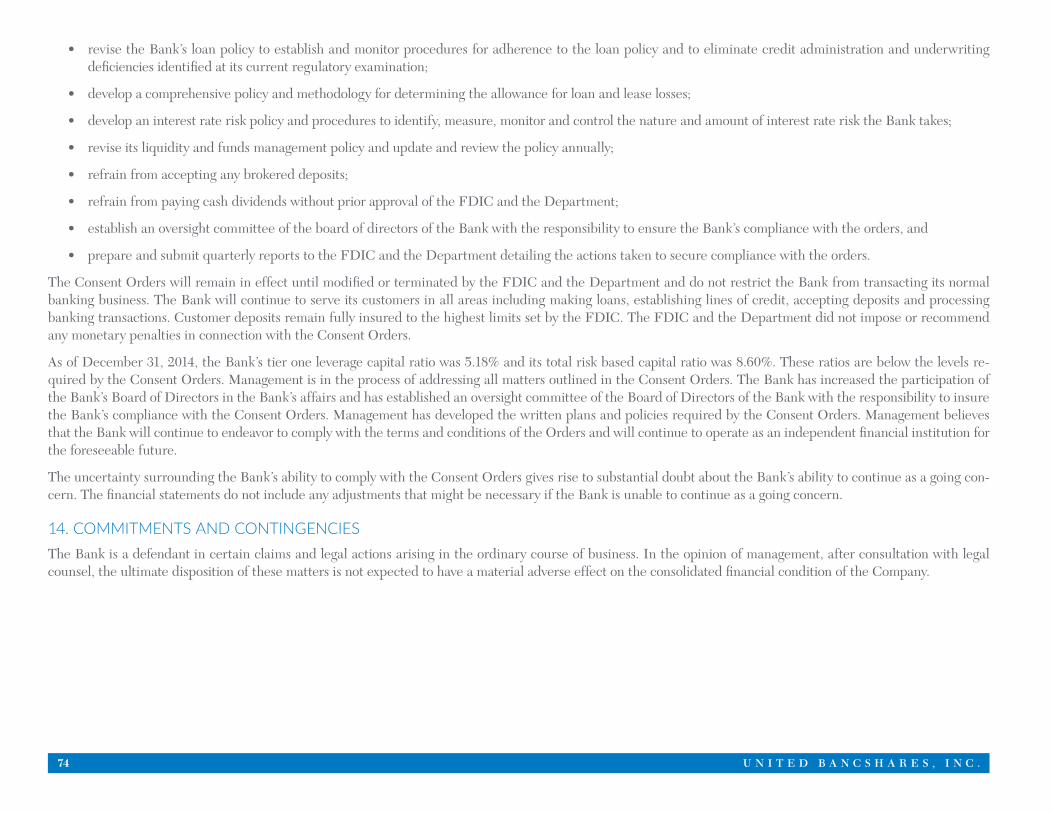
74 U N I T E D B A N C S H A R E S , I N C .
• revise the Bank’s loan policy to establish and monitor procedures for adherence to the loan policy and to eliminate credit administration and underwriting deficiencies identified at its current regulatory examination;
• develop a comprehensive policy and methodology for determining the allowance for loan and lease losses;
• develop an interest rate risk policy and procedures to identify, measure, monitor and control the nature and amount of interest rate risk the Bank takes;
• revise its liquidity and funds management policy and update and review the policy annually;
• refrain from accepting any brokered deposits;
• refrain from paying cash dividends without prior approval of the FDIC and the Department;
• establish an oversight committee of the board of directors of the Bank with the responsibility to ensure the Bank’s compliance with the orders, and
• prepare and submit quarterly reports to the FDIC and the Department detailing the actions taken to secure compliance with the orders.
The Consent Orders will remain in effect until modified or terminated by the FDIC and the Department and do not restrict the Bank from transacting its normal banking business. The Bank will continue to serve its customers in all areas including making loans, establishing lines of credit, accepting deposits and processing banking transactions. Customer deposits remain fully insured to the highest limits set by the FDIC. The FDIC and the Department did not impose or recommend any monetary penalties in connection with the Consent Orders.
As of December 31, 2014, the Bank’s tier one leverage capital ratio was 5.18% and its total risk based capital ratio was 8.60%. These ratios are below the levels re-quired by the Consent Orders. Management is in the process of addressing all matters outlined in the Consent Orders. The Bank has increased the participation of the Bank’s Board of Directors in the Bank’s affairs and has established an oversight committee of the Board of Directors of the Bank with the responsibility to insure the Bank’s compliance with the Consent Orders. Management has developed the written plans and policies required by the Consent Orders. Management believes that the Bank will continue to endeavor to comply with the terms and conditions of the Orders and will continue to operate as an independent financial institution for the foreseeable future.
The uncertainty surrounding the Bank’s ability to comply with the Consent Orders gives rise to substantial doubt about the Bank’s ability to continue as a going con-cern. The financial statements do not include any adjustments that might be necessary if the Bank is unable to continue as a going concern.
14. COMMITMENTS AND CONTINGENCIESThe Bank is a defendant in certain claims and legal actions arising in the ordinary course of business. In the opinion of management, after consultation with legal counsel, the ultimate disposition of these matters is not expected to have a material adverse effect on the consolidated financial condition of the Company.
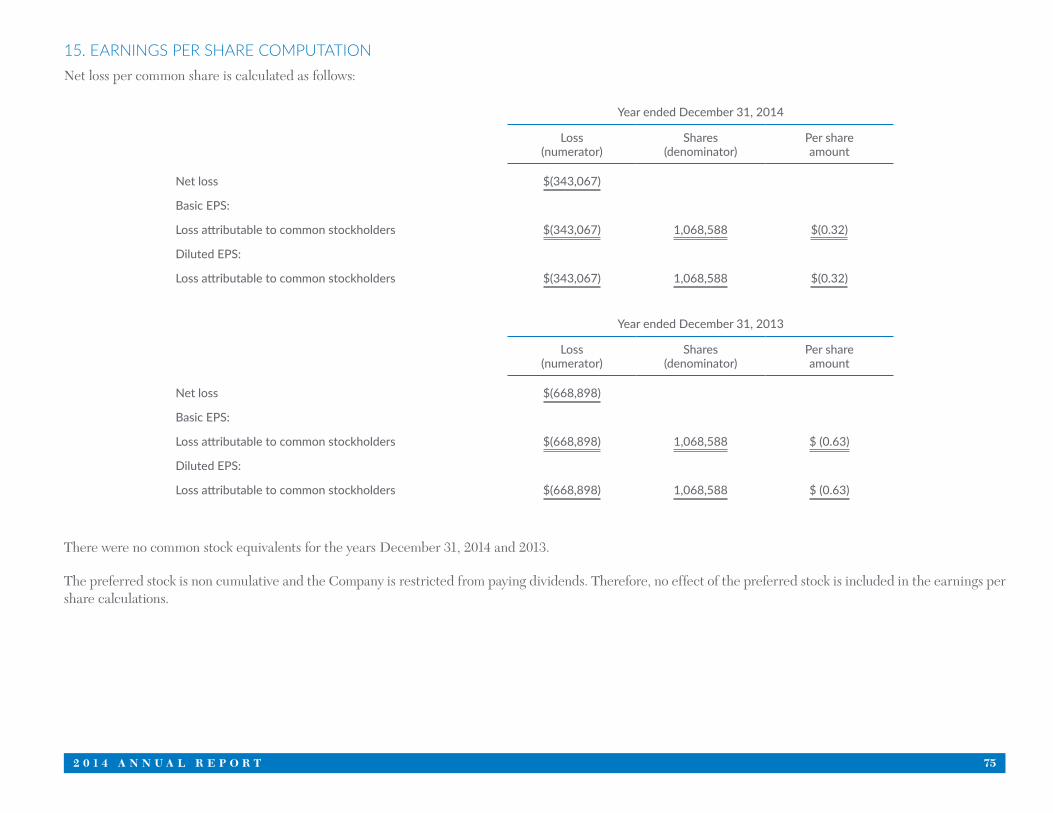
2 0 1 4 A N N U A L R E P O R T 75
15. EARNINGS PER SHARE COMPUTATIONNet loss per common share is calculated as follows:
Year ended December 31, 2014
Loss(numerator)
Shares(denominator)
Per shareamount
Net loss $(343,067)
Basic EPS:
Loss attributable to common stockholders $(343,067) 1,068,588 $(0.32)
Diluted EPS:
Loss attributable to common stockholders $(343,067) 1,068,588 $(0.32)
Year ended December 31, 2013
Loss(numerator)
Shares(denominator)
Per shareamount
Net loss $(668,898)
Basic EPS:
Loss attributable to common stockholders $(668,898) 1,068,588 $ (0.63)
Diluted EPS:
Loss attributable to common stockholders $(668,898) 1,068,588 $ (0.63)
There were no common stock equivalents for the years December 31, 2014 and 2013.
The preferred stock is non cumulative and the Company is restricted from paying dividends. Therefore, no effect of the preferred stock is included in the earnings per share calculations.
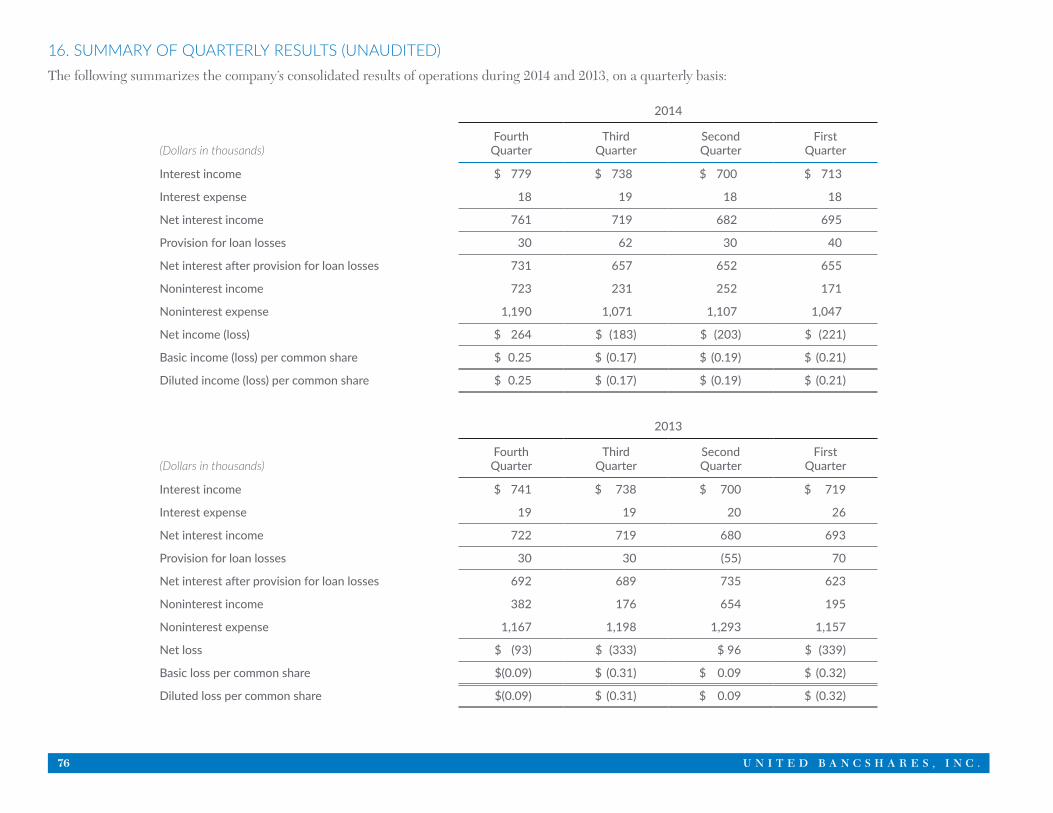
76 U N I T E D B A N C S H A R E S , I N C .
16. SUMMARY OF QUARTERLY RESULTS (UNAUDITED)The following summarizes the company’s consolidated results of operations during 2014 and 2013, on a quarterly basis:
2014
(Dollars in thousands)Fourth
QuarterThird
QuarterSecondQuarter
FirstQuarter
Interest income $ 779 $ 738 $ 700 $ 713
Interest expense 18 19 18 18
Net interest income 761 719 682 695
Provision for loan losses 30 62 30 40
Net interest after provision for loan losses 731 657 652 655
Noninterest income 723 231 252 171
Noninterest expense 1,190 1,071 1,107 1,047
Net income (loss) $ 264 $ (183) $ (203) $ (221)
Basic income (loss) per common share $ 0.25 $ (0.17) $ (0.19) $ (0.21)
Diluted income (loss) per common share $ 0.25 $ (0.17) $ (0.19) $ (0.21)
2013
(Dollars in thousands)Fourth
QuarterThird
QuarterSecondQuarter
FirstQuarter
Interest income $ 741 $ 738 $ 700 $ 719
Interest expense 19 19 20 26
Net interest income 722 719 680 693
Provision for loan losses 30 30 (55) 70
Net interest after provision for loan losses 692 689 735 623
Noninterest income 382 176 654 195
Noninterest expense 1,167 1,198 1,293 1,157
Net loss $ (93) $ (333) $ 96 $ (339)
Basic loss per common share $(0.09) $ (0.31) $ 0.09 $ (0.32)
Diluted loss per common share $(0.09) $ (0.31) $ 0.09 $ (0.32)
2 0 1 4 A N N U A L R E P O R T 77
SMALL BUSINESS PRODUCTS AND SERVICES
Small Business LendingUnited Bank of Philadelphia’s commercial loan clients are as diverse as the City of Philadelphia that we call home. They represent a multitude of industries ranging from large enterprises with complex financials and substantial payrolls to entrepreneurs just beginning their journeys—and everything in between.
We offer:• A team that understands the important role of a bank to the success of small businesses
• A consultative approach
• An efficient application process
• Competitive rates and fees
We specialize in Small Business Administration (“SBA”) loans that are designed for new and emerging businesses with limited capital and collateral. These loans are guaranteed up to 75% by the government. If your business is independently owned and meets size criteria for number of employees, average annual receipts and/or business asset size, an SBA loan may be of interest to you. A range of programs including 7A and 504 loans with amounts up to $2,500,000 are available.
Types of financing:• Working Capital
• Commercial Mortgages
• Term Loans
• Lines of credit
Other small business products and services• Affordable deposit account products including checking, savings, and certificates of deposit
• Electrronic banking (eStatements)
• Remote deposit capture
• Merchant Services
For more information, stop in any of our conveniently located branches or call 215-351-4600.
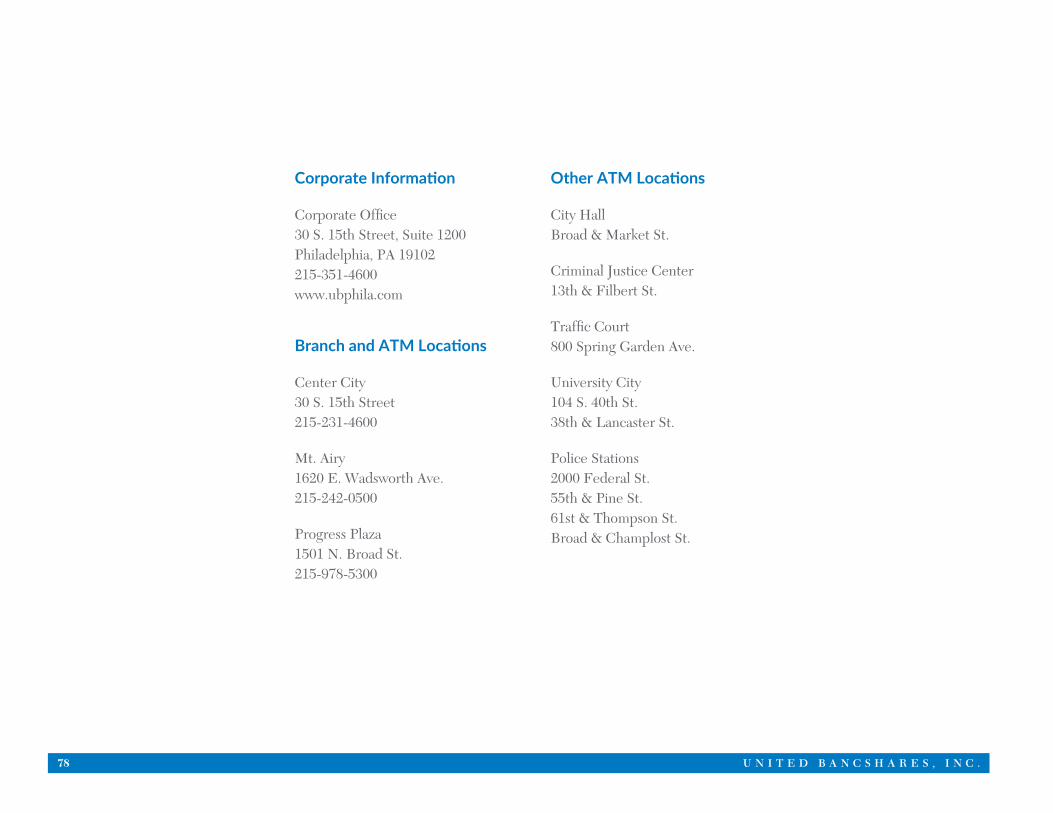
78 U N I T E D B A N C S H A R E S , I N C .
Corporate Information
Corporate Office 30 S. 15th Street, Suite 1200 Philadelphia, PA 19102 215-351-4600 www.ubphila.com
Branch and ATM Locations
Center City 30 S. 15th Street 215-231-4600
Mt. Airy 1620 E. Wadsworth Ave. 215-242-0500
Progress Plaza 1501 N. Broad St. 215-978-5300
Other ATM Locations
City Hall Broad & Market St.
Criminal Justice Center 13th & Filbert St.
Traffic Court 800 Spring Garden Ave.
University City 104 S. 40th St. 38th & Lancaster St.
Police Stations 2000 Federal St. 55th & Pine St. 61st & Thompson St. Broad & Champlost St.


Corporate Headquarters 30 South 15th Street
Philadelphia, PA 19102
215-351-4600 www.ubphila.com
#SoMuchMoreThanBanking
© 2015 United Bank of Philadelphia, all rights reserved. The “UB” logo and “So Much More Than Banking” are marks of United Bank of Philadelphia.