Finance - Faculty Directoryfaculty.som.yale.edu/zhiwuchen/EmergingMarkets/Peregrine plus... ·...
46
Finance McGraw-Hill Primis ISBN: 0-390-33917-2 Text: Emerging Financial Markets Beim-Calomiris Course: Emerging Market Finance MGT 648 Instructor: Prof. Zhiwu Chen Yale University School of Management McGraw-Hill/Irwin =>?
Transcript of Finance - Faculty Directoryfaculty.som.yale.edu/zhiwuchen/EmergingMarkets/Peregrine plus... ·...
Finance
McGraw−Hill Primis
ISBN: 0−390−33917−2
Text: Emerging Financial MarketsBeim−Calomiris
Course:Emerging Market FinanceMGT 648
Instructor:Prof. Zhiwu Chen
Yale UniversitySchool of Management
McGraw-Hill/Irwin���
Finance
http://www.mhhe.com/primis/online/Copyright ©2003 by The McGraw−Hill Companies, Inc. All rights reserved. Printed in the United States of America. Except as permitted under the United States Copyright Act of 1976, no part of this publication may be reproduced or distributed in any form or by any means, or stored in a database or retrieval system, without prior written permission of the publisher. This McGraw−Hill Primis text may include materials submitted to McGraw−Hill for publication by the instructor of this course. The instructor is solely responsible for the editorial content of such materials.
111 FINA ISBN: 0−390−33917−2
This book was printed on recycled paper.
Finance
Contents
Beim−Calomiris • Emerging Financial Markets
5. Information and Control 1
Case: Gazprom 1
9. Building Financial Institutions 22
Case: Peregrine Investments 22
iii


Beim−Calomiris: Emerging Financial Markets
5. Information and Control Case: Gazprom 1© The McGraw−Hill Companies, 2001
Gazprom*
Introduction
James Bolden, executive vice president of Mobaco, one of the world's largest integrated oilcompanies, was sitting in his suite at the Metropol Hotel in Moscow. He had a complex decision to make.At the time, in the fall of 1997, Mobaco had beaten all the competitors in the "New Big Game" and was onthe verge of formally announcing an alliance with Gazprom, the world's largest gas company. However,several issues remained outstanding and had to be resolved quite soon; the deal took more than a year tomaterialize and the patience of the Russian partners, not used to such long periods of negotiations, wasstarting to wane.
In order to conclude the alliance, Mr. Bolden had to agree to make a large cash investment inGazprom. The amount of this investment had been settled at $1.2 billion, but the actual Gazprom securitiesthat Mobaco would acquire were yet to be negotiated. Mobaco's first preference was for a bond with arelatively short term. While Gazprom would agree to a bond, its term would have to be 10 years and theinterest rate could be no more than 8%. Under Mobaco's capital budgeting procedures, an investment asrisky as this would have to earn an expected return of at least 15%. This suggested that a conversionprivilege or warrants on Gazprom's stock would have to be added.
Gazprom's stock was publicly traded, but its price varied significantly, depending on whether theshares were traded domestically or internationally, and Mr. Bolden was having difficulty reconciling eitherprice with his own discounted cash flow analysis. These value differences were troubling, and Mr. Boldenwas trying to decide where they came from. Did they reflect different information or different interpretationof the limited information available? Were they somehow a product of Russia’s unusual economy? IfMobaco were to invest in Gazprom's stock, it first had to establish a valuation that would be acceptable forboth parties. Furthermore, Russian law prohibited foreigners from owning more than 9% of Gazprom. Withexisting foreign ownership at approximately 4% and more foreign issues contemplated, both Mobaco andGazprom had to be careful not to overstep the legal limit.
Russia
With a land area of 16.9 million square kilometers, Russia is by far the world's largest country ingeographic extent. It covers nine time zones and stretches from arctic regions of the north to the sub-tropicalclimate of the Black Sea. Its population was 147 million people in 1997. Russia had been the centralcomponent of the Soviet Union, the world's primary advocate of communism and a major military power,which was formed in 1917 and was dissolved in 1991.
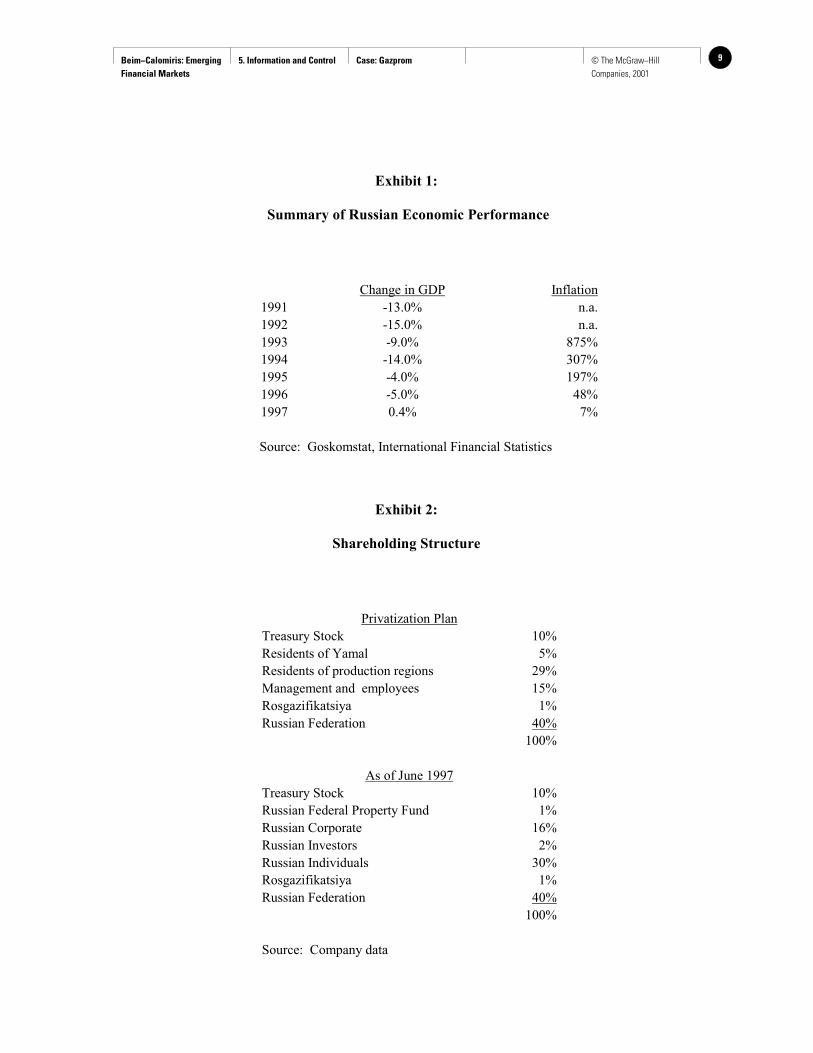
Following the collapse of the Soviet Union, Russia suffered one of the most severe economicdepressions any country has known in the twentieth century. In several years, the entire population saw itssavings disappear in a whirlwind of hyperinflation, while the formerly command-controlled industriesstarted to disintegrate. Exhibit 1 shows the collapse of GDP and the inflation, which finally seemed to havecome under control in 1997.
* This case was written by Alexei Evgenev and Professor David O. Beim of Columbia Business School. Copyright 2001 by the McGraw-Hill Companies, Inc. All rights reserved.
Beim−Calomiris: Emerging Financial Markets
5. Information and Control Case: Gazprom2 © The McGraw−Hill Companies, 2001
As the regime changed from communist to quasi-democratic, the old industries found themselves indire need of reorganization. The formerly state-owned enterprises were saddled with huge socialinfrastructures: hospitals, housing, etc. that were not easy to abandon because they functioned as thesociety's only social safety net. Yet there were no more guaranteed state orders, and budgets were being cuteverywhere. Some ambitious people left to start their own small businesses. Organized criminal groupsmoved into a vacuum of power and controlled some of the enterprises. Productive equipment was mostlyoutdated and uneconomical. The Russian military, which funded by some estimates more than half ofRussia’s industrial production and a huge part of its science, saw its budget decrease by 90% in just fiveyears.
Furthermore, in the new Russian economy internal payments were gridlocked, and no one seemed topay their bills. Barter arrangements were becoming the dominant form of trade. Intercompany debts werenot settled, and taxes were accrued but rarely paid. Increasingly, workers were not being paid either.Companies reported net income but no one seemed to have sufficient cash. Market reforms appeared tohave been made; yet markets were not functioning normally. This extraordinary system was analyzed in animportant article by Gaddy and Ickes published in 1998 in Foreign Affairs entitled "Russia's VirtualEconomy" which can be obtained from www.foreignaffairs.org.
However, one part of the old system had a potential to survive and even prosper in the newenvironment: natural resources, in particular oil and gas. The Soviet Union had been dependent on oil andgas for hard currency earnings throughout the 1970s and 1980s, and the situation had changed little in the1990s. With approximately half of its hard currency revenues coming from the oil and gas sector, theRussian economy was highly dependent on natural resource production. So however pessimistic one mightbe about the Russian economy, one could find Gazprom an interesting opportunity.
Gazprom
Gazprom was Russia's largest enterprise and the world's largest gas producing and exportingcompany. It traced its roots to 1943 when Glavgazprom was set up to build a pipeline from Saratov toMoscow. However, its importance was minimal until 1961 when the Punga field in Western Siberia wasdiscovered and the region was established as the world's richest gas area. In 1963 the Urengoi field wasdiscovered with initial proved reserves of 6,700 billion cubic meters (bcm). Since these gas fields werelocated in very remote areas with harsh climatic conditions, the scope and complexity of the exploiting themwere unprecedented.
In 1965 the Soviet Ministry of Gas Industry was established and absorbed Glavgazprom. Severalyears later, Russia started exporting gas to Eastern and Western Europe. This business grew at a rapid pacefor almost three decades, developing new fields, laying new pipes and entering new markets. In August1989 the state enterprise Gazprom was established, based on the former Ministry of Gas Industry. In June1992 a Presidential Decree confirmed Gazprom's rights to virtually all western Siberian gas reserves. InNovember 1992 a decree on incorporation and ownership of gas industry assets followed. Finally inFebruary 1993 the Russian joint stock company Gazprom was established and in April 1994 its privatizationbegan.
Russian privatization was voucher-based, with each eligible citizen receiving a voucher book thatcould then be used for bidding in privatization auctions. Privatization was heavily tilted in favor of insiders,i.e. the managers and workers in the privatized enterprises. The Russian Ministry of Finance approvedGazprom’s privatization in May 1993. Under the plan, 40% of the company was left under state ownership,of which 35% was held in trust by Gazprom's management. Another 28% of the stock was sold in closedauctions to residents of Gazprom's production areas in proportion to the value of fixed assets located there.A further 15% of Gazprom's stock was sold at closed auctions to workers and management at a discountprice, while Gazprom acquired 10% at par value for subsequent sale to investors. Finally, 5% was sold in a

Beim−Calomiris: Emerging Financial Markets
5. Information and Control Case: Gazprom 3© The McGraw−Hill Companies, 2001
closed cash auction to residents of northern Russia, 1% was transferred to the charter capital ofRosgazifikatsiya and 1% was sold on Vladivostok Stock Exchange.
Thus in the course of two years almost 60% of the company's stock was transferred from state tolargely insider private ownership. Exhibit 2 shows the initial distribution of shares and also the ratherdifferent distribution that prevailed as of June 1997. From 1994 onward Gazprom was aggressive ininternational markets, setting up a number of joint ventures for exploration, production and distribution bothdomestically and internationally. It initiated reorganization and ambitious maintenance and upgradingprograms. At the same time it integrated both vertically and horizontally and diversified into some unrelatedareas.
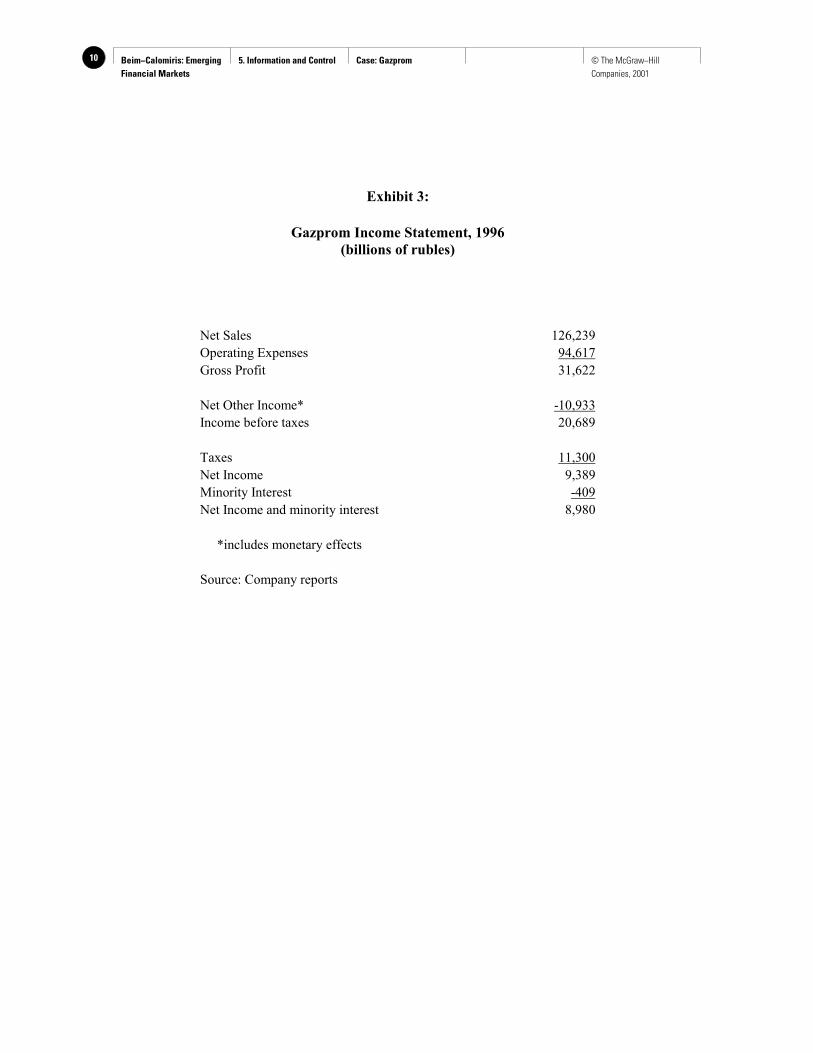
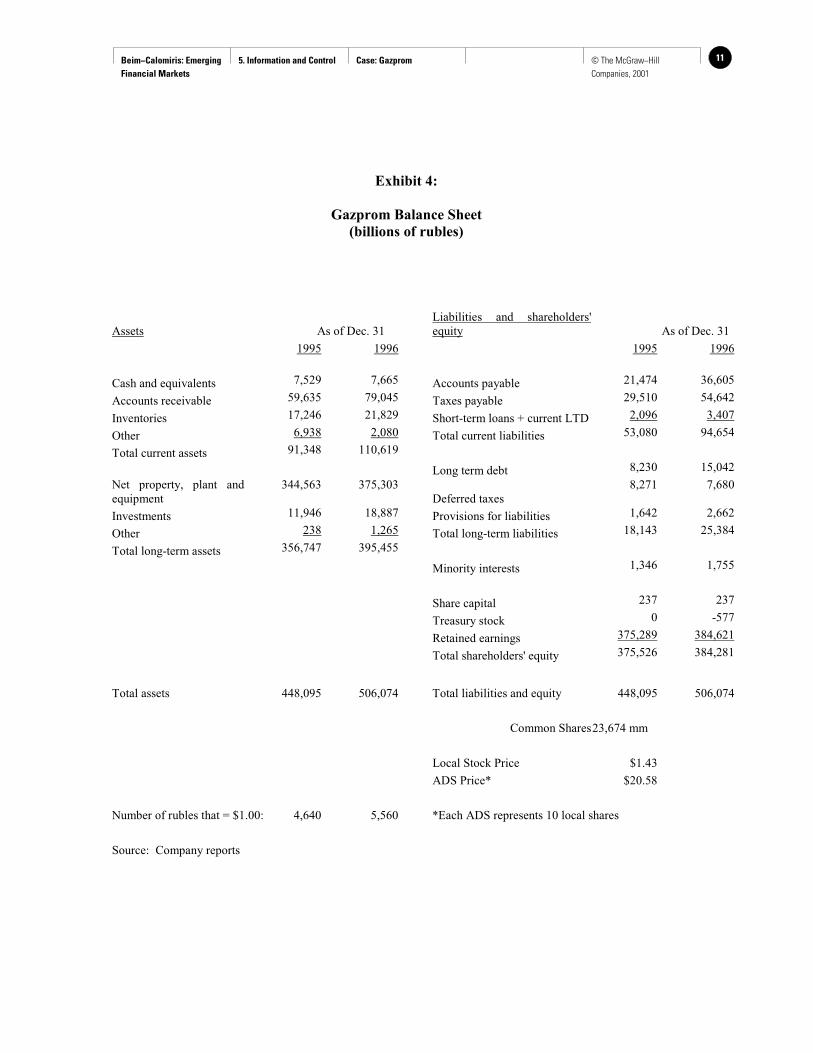
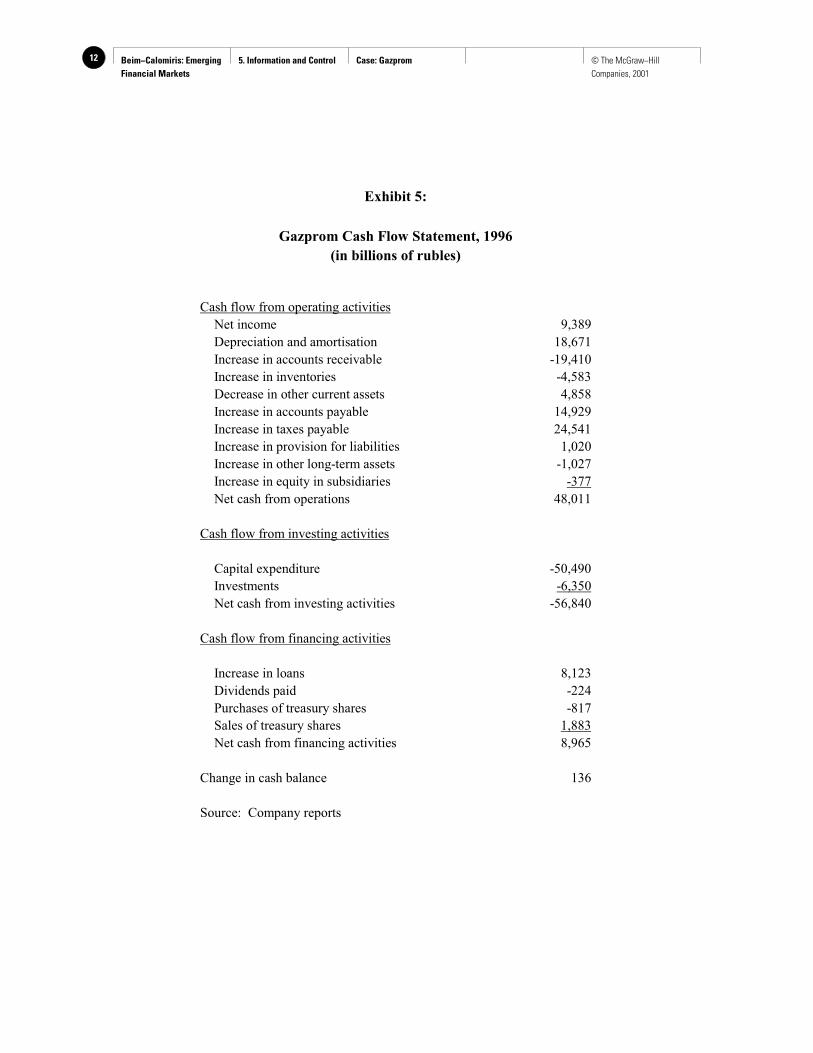
In the course of the difficult transition period, Gazprom was quite successful. It remained aprofitable company, accounting for 5.6% of Russia's GDP and 20% of the federal budget collection. Itweathered the economic downturn quite well, with gas production falling from its peak in 1991 by only 7%compared to oil production, which fell by 45% from its peak in 1987. Exhibits 3, 4 and 5 show the incomestatement, balance sheet and cash flow statements of Gazprom for 1996.
Gazprom stock
Following the privatization, Gazprom's stock was almost totally illiquid. This was a result ofextremely strict trading rules that were established in an attempt to control the secondary market. Foreignownership was capped at 9% and any acquisitions by foreigners required the written permission ofGazprom. In addition to that, Gazprom asserted the pre-emptive right to purchase any of its shares offeredin the secondary market. Anyone wishing to sell Gazprom stock had to offer it to Gazprom first. After that,Gazprom could exercise its right and purchase the stock within 30 days, otherwise the shareholder was freeto sell the stock within 90 days at a price no lower than the price which it offered to Gazprom. Thesemeasures effectively dried up the secondary market for Gazprom's shares. There were, of course, waysaround these rules; for instance one could create a dummy holding corporation, which then could be resold.
In a restrictive environment with a weak legal structure in place, a flurry of semi-legal activityoccurred. To bring the “gray market” under control and to gain access to foreign investors, a moreorganized trading system was needed. In March 1996 Gazprom authorized the newly-formed FederalSecurities Corporation to start conducting regular auctions. This had an immediate effect on stock's liquidityand dramatically increased its price (from Rb 407 (US$ 0.08) in March 1996 to Rb 3,750 (US$ 0.65) in May1997).
This also resulted in some interesting arbitrage opportunities. Since most of the auctions took placein Moscow and most of the stock was held by employees of Gazprom and residents of remote productionareas, an enterprising individual could get onto a train, take a 5 day ride, fly a helicopter to the productionareas beyond the Polar Circle and trade Gazprom's stock for a couple of bottles of vodka. Upon return toMoscow, the stock could be resold at a significant premium. This continued until most of the stock wastransferred from the people originally meant to hold it to arms-length investors. Gazprom also bought backsome of its stock at low prices.
In October 1996 a new chapter was opened in Gazprom's market development with the successfulplacement of its shares in the form of American Depositary Shares (ADS). The global offering was threetimes over-subscribed, even though it was priced at 300% premium to the local shares. A total of 27.3million ADS (each representing 10 shares) were sold after a 15% green-shoe option was exercised. Largeinternational investors acquired most of the ADS. Over time, the premium of ADS over local sharesfluctuated between 50% and 500%. Even though Gazprom claimed that ADS represented the same class aslocal shares, effectively two classes of shares were created since investors never were able to change theform of their investments.
Beim−Calomiris: Emerging Financial Markets
5. Information and Control Case: Gazprom4 © The McGraw−Hill Companies, 2001
Some investors attempted to profit from the arbitrage opportunity. The most notable example wasHong Kong-based Regent Pacific, which tried to set up an offshore fund of $200 million called Regent Gazfor investing in Gazprom's local shares. This drew an immediate and fierce reaction from Gazprom'smanagement, resulting in the eventual dissolution of the fund. To quote an American fund manager based inMoscow, who preferred to remain anonymous: “Nobody wants to mess with Gazprom. If they blacklistyou, you will never be able to get a piece of their business. That's not something you want to do”.Following numerous arbitrage attempts, Gazprom sent a further signal that its strict trading rules would beenforced. This further increased the premium in the ADS price.
Gazprom's markets
Gazprom sold its gas in four different markets: (1) the Russian internal market, (2) the countries ofthe former Soviet Union (FSU), (3) Central Europe and (4) Western Europe. In 1996 the breakdown ofsales was as follows: 304 bcm were sold to domestic consumers, 73 bcm were sold to FSU countries, 48bcm were sold to Central European countries, while 75 bcm were sold to the Western European markets.
While largest in terms of volume, the Russian internal market was less significant in terms ofrevenues. The government set domestic prices at a fraction of the world price. During the late 1990s,domestic gas prices were increased from ridiculously low to merely somewhat low. Exhibit 6 shows theevolution of gas prices in the European, Russian industrial and Russian residential markets.
But more important than price was the problem of non-payment and barter. Only 75-80% of thecompany’s sales were paid for in any form, and only 20% were paid in cash. The rest was paid for in heavymachinery, pipes, oil, paper, beer and other products. Gazprom accepted accounts receivable which it thencancelled against its accounts payable to the same customer. Gazprom had to create trading companies tofacilitate disposal of the products it received in payment. It even created a special subsidiary,Mezhregiongaz, exclusively responsible for monitoring domestic supplies and directly dealing with thecustomers. One has to note, however, that by the Russian standards a 75-80% collection rate for anindustrial company was excellent; others managed to get only 20-30%. This was a result of Gazprom'scontrol of the pipelines, as it could cut off at least the smaller of the non-paying customers or reduce theirgas supply at will.
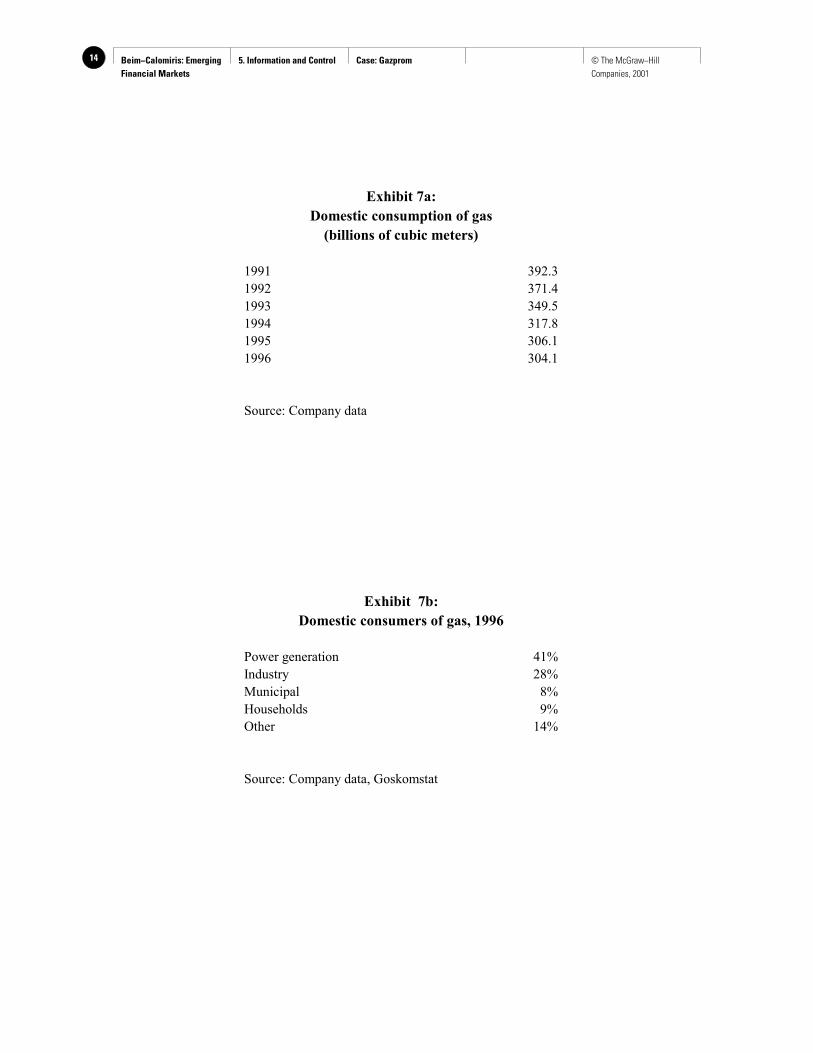
On the other hand, Gazprom still had close links with the government and had a "moral obligation"to supply ailing Russian industry. The privatized oil companies were not as heavily controlled and coulddivert more of their production to exports. The domestic oil price therefore bore a much strongerresemblance to the world price. This price imbalance led to excessive consumption of gas: the share of gasin nation's energy balance grew from 40% in 1986 to 52% in 1995, the highest gas utilization rate in theworld. Total domestic consumption of gas is shown by year and by category of user in Exhibit 7.
Gazprom's largest debtor was the state. This is not surprising, since more than 40% of Gazprom'sdomestic gas was used for power generation, which was state-owned, and public finances were in shambles.Gazprom could not easily cut the large state plants off and the government was in no hurry to pay off itsdebts. To make matters worse, the state insisted on Gazprom paying its tax bills on time and refused to netthem against government obligations.
Central Europe was Gazprom's first export market, with exports to Czechoslovakia commencing in1967. However, for 30 years gas had been supplied to this region at significantly discounted prices,effectively subsidizing socialist regimes and their inefficient economies. It was expected that this would endin the 1990s as the countries of the region started their transition to a market economy. However, since gasplayed such a large role in their energy and industrial policies and the infrastructure was already in place, itwas virtually impossible for them to switch in the short term from Gazprom to another gas provider or to analternative fuel. Gazprom's export pipeline went through the countries of Central Europe, and the marginalcost of adding local customers was negligible, while building an alternative pipeline would have been
Beim−Calomiris: Emerging Financial Markets
5. Information and Control Case: Gazprom 5© The McGraw−Hill Companies, 2001
prohibitively expensive. Gazprom's exports to Central Europe and its joint ventures and subsidiaries inCentral Europe are shown in Exhibits 8 and 9.
Due to restructuring in the economy, gas demand in Central Europe fell somewhat, but thenrecovered as some of the transition economies began to overcome their problems. During the period ofdownturn, though, Gazprom bought into local gas distribution systems, further strengthening its grip on themarket. The old subsidized supply contracts expired in 1998, allowing Gazprom to charge Central Europeancountries the full market price. Revenues from this market were therefore expected to grow by about 30-40% in the late 1990s.
Western Europe had been Gazprom's main source of hard currency revenues for 20 years. In theSoviet times, revenues earned on the export markets were typically used for acquiring technology andbuilding up the infrastructure ("gas for pipes"). The volume of trade reached a very respectable 75 bcm in1996, making Gazprom the biggest gas exporter in Europe. Gazprom sold its gas to six Western Europeancountries: Austria, Finland, France, Germany, Italy and Switzerland, plus Turkey.
Gazprom had been developing Western European markets very aggressively, selling more gas to itsexisting customers and acquiring new customers along the way. Gazprom was reported to be close toclosing more long-term contracts with Greece, the Benelux countries, Sweden and Spain. The companyincreased its long term contract portfolio from 1,450 bcm on January 1 1996 to 2,188 bcm as of January 11997. These long-term contracts had a remaining duration of between 12 and 21 years. Gazprom's contractswere typical for the European market, having such features as no rights for re-export, a take-or-pay clauseand no unilateral termination right. The gas price was set according to a formula that reflected current andpast gas prices for the period, as well as the price of a pre-negotiated set of competing oil products. With theincreasing popularity of gas and intensifying competition for gas supply, these formulas would probablymove more firmly toward market prices fully equivalent to oil. Gazprom's exports to Western Europe andits joint ventures and subsidiaries in Western Europe are shown in Exhibits 10 and 11.
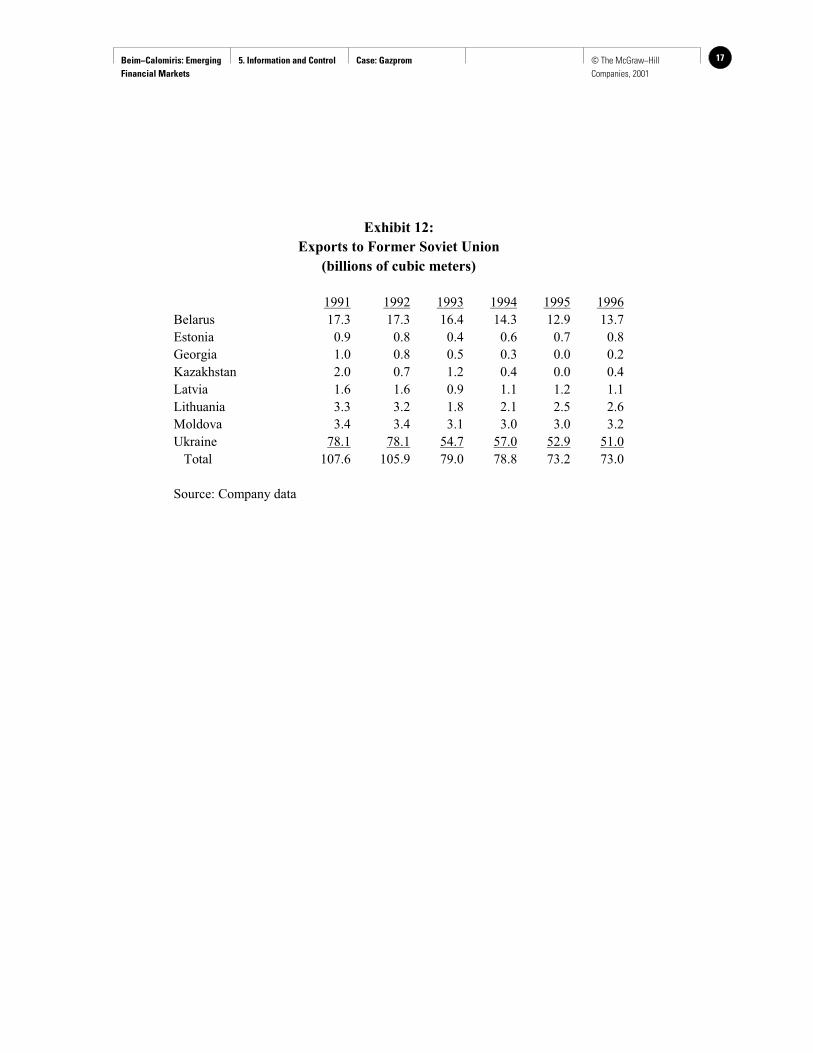
Gazprom's exports to the Former Soviet Union countries were shrinking by 3-5% a year in the late1990s, due to the continuing economic contraction in the region and the countries’ inability to pay. Theexport emphasis had shifted westwards very significantly: while in 1991 exports to the FSU countries (107bcm) were comparable to those to Europe (105 bcm) by 1996 the picture had changed significantly: exportsto Europe comprised 117 bcm compared to 73 bcm to FSU countries. Gazprom's exports to the FSUcountries are shown in Exhibit 12.
Political and economic realities of the region forced Gazprom to use short-term (up to one year)contracts in FSU countries. Baltic states (Latvia, Lithuania and Estonia) were traded with on a cash-onlybasis. Due to political considerations, Gazprom was forced to extend credit to other countries of the region,resulting in non-payments more often than not. The Ukraine was Gazprom's biggest FSU customer and alsoits biggest debtor. Its debt at different times reached as much as $5 billion, mostly as a result of inability tocurb its demand in the changing economic environment. The situation was further complicated by theexistence of several different Ukrainian gas distribution companies. Furthermore, 90% of Gazprom'sexports to Europe (except for Finland) passed through the Ukraine.
There were several occasions when Ukrainians diverted Gazprom's export gas for their own use,following a cut in the supply level as a result of non-payment. However, the Ukraine could not afford tocause a serious disruption to Gazprom's European exports. Annual transit fees that the Ukraine receivedfrom Gazprom (in gas) were estimated at $1.5 billion in 1996. Additionally, the Ukraine depended heavilyon Russian imports and any diversions from Gazprom could have very serious political and economicalconsequences. However, in order to quell customers' fears in Central and Western Europe, Gazprom hadarranged for several large underground gas storage facilities in those regions to assure uninterrupted supply.The interplay of all these factors meant that Gazprom was paid in cash for at most half of its FSU exports.
Beim−Calomiris: Emerging Financial Markets
5. Information and Control Case: Gazprom6 © The McGraw−Hill Companies, 2001
Gazprom's assets
Gazprom owned the rights to 23% of world's total proven gas reserves. In the beginning of 1997Gazprom had 33,400 bcm of A, B and C1 gas reserves. According to the Russian classification system, A,B and C1 include volumes of gas fields under development and volumes of gas fields where field boundarieshad been defined by delineation drilling. A Western audit of Gazprom's reserves was to be delivered in1998. The audit ultimately showed Gazprom's reserve estimates to be quite accurate (within 8%). Inaddition to natural gas, Gazprom had control over gas condensate and oil reserves of approximately 2,000million tons. In 1996 the company produced 564.7 bcm of gas, 7.6 million tons of gas condensate and960,000 tons of oil.
In terms of barrels of oil equivalent (BOE) Gazprom controlled more assets than any other companyin the world. Iran's gas reserves were 60% of Gazprom's, but the entire Middle East had fewer gas reservesthan Gazprom. Six out of eight world's largest gas fields are located in Russia and controlled by Gazprom.The company's reserves were constantly being revised upwards as a result of continuing prospecting.Gazprom spent significant amounts of money on exploration, and in 1996 alone Gazprom enhanced itsreserve base by 1,000 bcm through exploration, reserve revisions and acquisitions. It was expected thatGazprom's reserves would continue this upward trend, especially liquid hydrocarbons (oil and condensate),which had been systematically underestimated in the past due to the focus on gas.
The majority of Gazprom's reserves were located in Western Siberia and required extensiveinfrastructure, both physical and social. Their extraction also required a well-developed system of pipelines.One therefore had to adjust the economic value of Gazprom's reserves for the high cost of exploitation.While there were some gas liquefaction and condensation technologies that could possibly simplify thetransportation of gas, they were still too complex to be used commercially in the difficult conditions inwhich Gazprom operated.
Gazprom's extensive gas reserves would have little value without the infrastructure necessary toextract and transport them. Gazprom owned the world's largest gas transmission system: 150,000 km ofhigh-pressure pipelines serviced by 249 compressor stations with the nominal installed capacity of 40.3 mw.The general direction of the pipeline was from east to west, spanning the entire continent. The main pipelinewas linked with smaller ones, allowing for more flexible and efficient service. This infrastructure accountedfor most of Gazprom's capital investment. It was estimated that over the next 5-6 years depreciation chargesalone would represent $3.5 - 6.5 billion.
The transmission network's efficiency was assessed by 13 international gas consultancies in 1995and was deemed to be satisfactory, both in terms of operational reliability and security. System losses in1995 accounted for 1.4% and a further 46 bcm were consumed by the compressor stations. While therewere no serious faults in the system, it suffered from sporadic bottlenecks and quality deficiencies, mostlydue to inadequacy of Russian construction practices. Gazprom worked continuously to improve thenetwork's efficiency and reduce downtimes. The failure rate went from 0.58 failures per 1,000 km of pipesin 1985 to 0.21 failures in 1996. Since most of the pipeline was laid in 1970s and 1980s, the average age ofthe network was about 15 years in the late 1990s, which is acceptable by international standards. Gazpromconducted extensive rehabilitation, maintenance and replacement work in order to keep the network in agood condition. It gained significant amounts of gas otherwise lost in transportation from improvements innetwork efficiency. Gazprom contracted Italian Tragaz for the modernization and rehabilitation of 161compressor units to further improve the system's capacity and reliability.
Gazprom had a number of projects intended to develop its existing reserves and to increase the flowin its pipelines. The flagship project was the construction of the Yamal-Europe pipeline and relateddevelopment of the huge Yamal gas field, plus the entire infrastructure required to transport this gas. Theinfrastructure part of the project had already started; sections of the pipeline were being constructed inPoland, Belarus and Germany (note the circumvention of the Ukraine). Development of the reserves couldtake place rapidly or slowly, depending on the state of Russian economy and domestic demand. In case
Beim−Calomiris: Emerging Financial Markets
5. Information and Control Case: Gazprom 7© The McGraw−Hill Companies, 2001
domestic demand stayed at the current level or went down, Gazprom would most likely be able to supply thenew pipelines from existing sources. The cost of putting in place a Western Russia-Belarus-Poland-Germany pipeline (two 1,659 km 56" pipelines) pales in comparison to the cost of developing the new fieldand building a new trans-Siberian pipeline ($6.7 billion versus $32-35 billion, of which $23 billion ispipeline construction). The new trans-Siberian pipeline would be huge even by Gazprom's standards (triple56" pipeline, 2,462 km long).
Gazprom was also hoping to develop Russia's large offshore gas reserves to meet the demand forgas. However, because of its lack of experience in offshore production and huge capital costs required, itwas unlikely that any production would start before 2005. The company was also looking into building apipeline to Finland and then expanding it through Scandinavia and possibly into Germany. This wouldallow Gazprom to enter a new market and save significantly on transit charges. Finally, following a $13.5billion contract signed with Turkey, Gazprom was planning to build a 400 km undersea pipeline to supplyTurkey directly from Russia's southern shores. With all of these projects and existing infrastructure in needof constant repair, yearly capital expenditures would remain at the $9-10 billion level for several yearsbefore slowly declining.
Besides pure exploration and production Gazprom was involved in a number of other activities, bothrelated and unrelated. In 1996 the company produced 7.6 million tons of gas condensate and 960,000 tonsof crude oil. Gazprom's six processing plants produced 541,000 tons of gasoline, 1,100,000 tons of dieselfuel, 579,000 tons of LNG and 2.24 million tons of crystallized sulfur. Gazprom was building a 300,000tons/year ethylene plant in cooperation with BASF, as well as a 680,000 tons/year methanol plant.
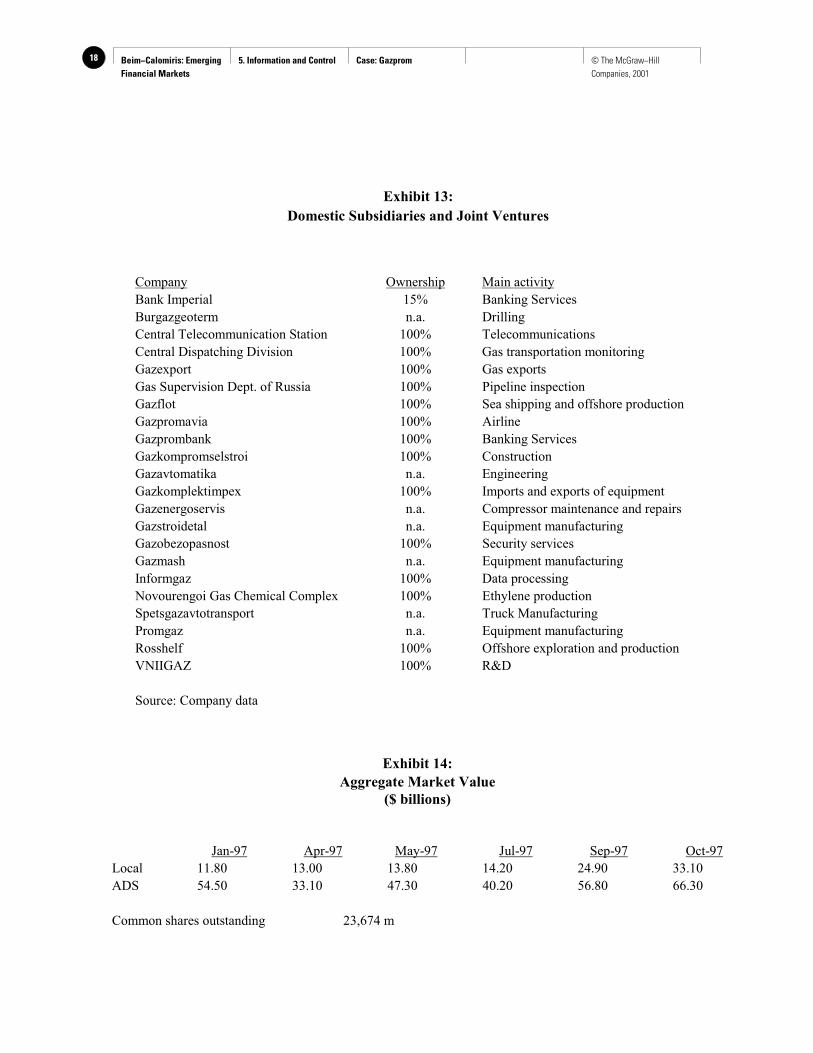
Gazprom owned a number of construction and machinery building subsidiaries. It also inherited anumber of research institutes involved in a number of areas related to gas industry. Gazprom was one ofmajor shareholders in Imperial Bank, one of the largest banks in Russia. It also had its own Gazprombank,which performed clearing operations between the subsidiaries. Besides banking, Gazprom was involved in anumber of other businesses, which in a normal country could have been contracted out, such as airline,telecommunications, truck manufacturing and security services. A full list of Gazprom's domesticsubsidiaries and joint ventures is given in Exhibit 13.
Governmental relations
Since the gas industry was critical to the country's economic health, the Russian government washeavily involved in dealings of Gazprom. Former Russian Prime Minister Viktor Chernomyrdin was aformer CEO of Gazprom and its largest shareholder. The intertwined relationship was not a simple one.
As Russia's largest corporate taxpayer Gazprom was often leaned upon quite heavily. Whenever theRussian government ran out of money, it would step up its tax collection efforts. Since the Russian taxsystem was very new and its legal underpinnings were weak, the government turned most naturally to itseasiest target, in which it still maintained a 40% interest. This power, however, had to be used sparingly soas not to kill the goose that laid golden eggs. While it was hoped that the statutory tax rate would somedayfall from 55% to a more normal world level of 35%, the constant needs of the Russian government made thisunlikely in the near term.
Gazprom played an important role in the political landscape as well, especially in relations with theFSU countries. Their obligations to Gazprom were used as pawns in different political games, ranging fromsovereignty disputes to Black sea fleet division. For instance, Gazprom could be “advised” to supply gas toa friendly regime without concern for the payment. However, as the Russian government became moresophisticated and the relationships with the former republics normalized, these practices became lessfrequent.
Gazprom's domestic pricing was heavily regulated, resulting in a price disparity between domesticindustrial and residential consumers. Industrial customers paid 2.5 times more than the residential, but that
Beim−Calomiris: Emerging Financial Markets
5. Information and Control Case: Gazprom8 © The McGraw−Hill Companies, 2001
still amounted to less than half the world price. A system of discounts and incentives supported selectedtypes of customers. In addition, the price was somewhat differentiated depending on the proximity to theproduction regions. Finally, Gazprom had recently been granted a right to offer up to 40% discounts to pre-paying customers. The current “blended” domestic price was around $38 and was expected to grow by 5-10% a year.
Following its privatization, Gazprom retained "the moral obligation to supply domestic customersunder any circumstances". This resulted in the company’s being unable to cut off the non-paying customers,especially utilities. From the government's point of view this made sense; social unrest would beunavoidable if the heat were to be cut off in the middle of the winter. For the company's shareholders,whose objective was to maximize the performance of the company, this simply acted as an expensiveadditional tax.
The government incurred large portions of Gazprom’s accounts receivable, and this was rapidlybecoming the government's favorite source of financing. In the past it had allowed the company to offset itstax obligations against the government debts, but this practice had come to an end and showed no signs ofbeing revived.
The valuation problem
James Bolden felt that the risks of the Russian environment required a rate of return of at least 15%and preferably higher. If Mobaco made its required $1.2 billion cash investment in exchange for a Gazprombond bearing an interest rate of 8%, a number which had been discussed during negotiations, then the totalreturn which Mobaco would get on its Russian project would be a somewhat unsatisfactory 12%. Higherreturns might be possible with a stock investment or a bond with a conversion privilege or option onGazprom stock, but framing this required a view on the stock's present and likely future value.Unfortunately, even the stock’s present value was subject to dispute.
He contemplated the aggregate value of the Gazprom stock as traded in the local and theinternational markets at several points during the past year, as shown in Exhibit 14. The disparity was hugeand also volatile, ranging between five times and two times difference within a single year. He could onlyscratch his head in amazement. Finance theory said that such things were not supposed to happen. Whatcould possibly account for it, and which one should he focus on?
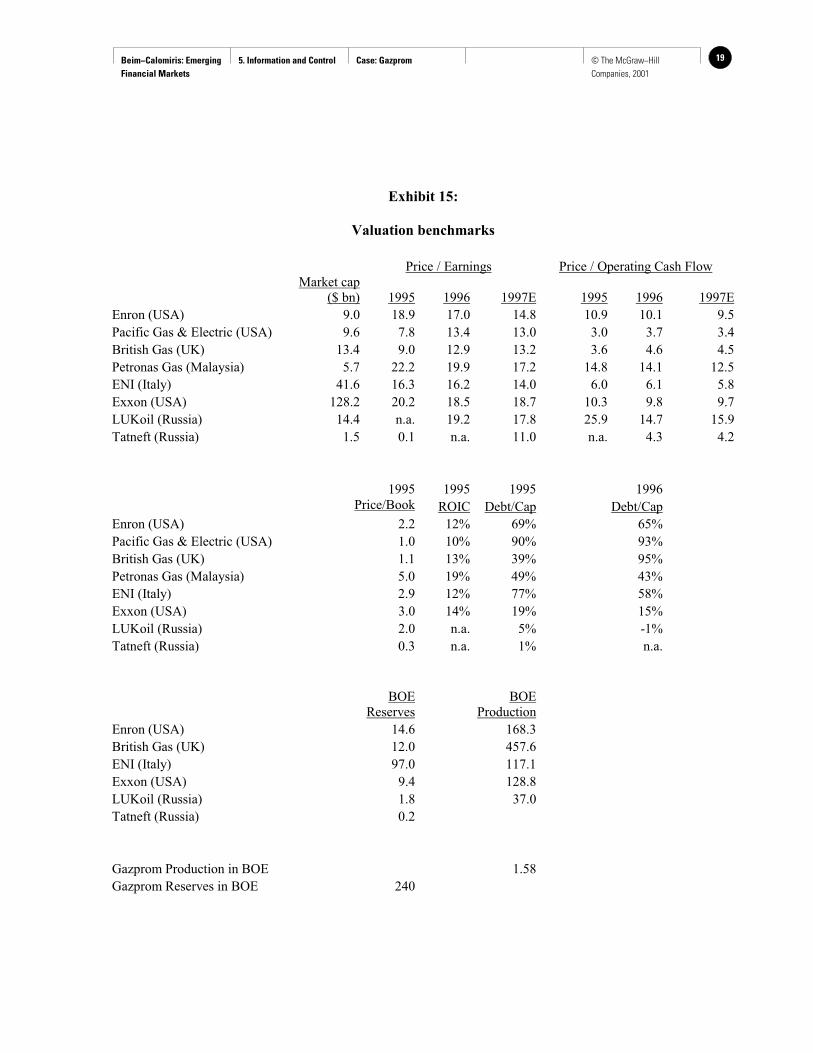
Mr. Bolden's staff had put together the summary comparison of gas companies in a few othercountries as shown as Exhibit 15. Mr. Bolden knew that he needed some guidelines to interpret the marketprices of Gazprom's stock, and he hoped that this comparison would help him. However, it seemed thatconditions in Russia were quite different from those in the other countries, so it was not obvious whether anysimple ratio analysis based on foreign comparables would be useful. But were the Russian comparables anymore useful?
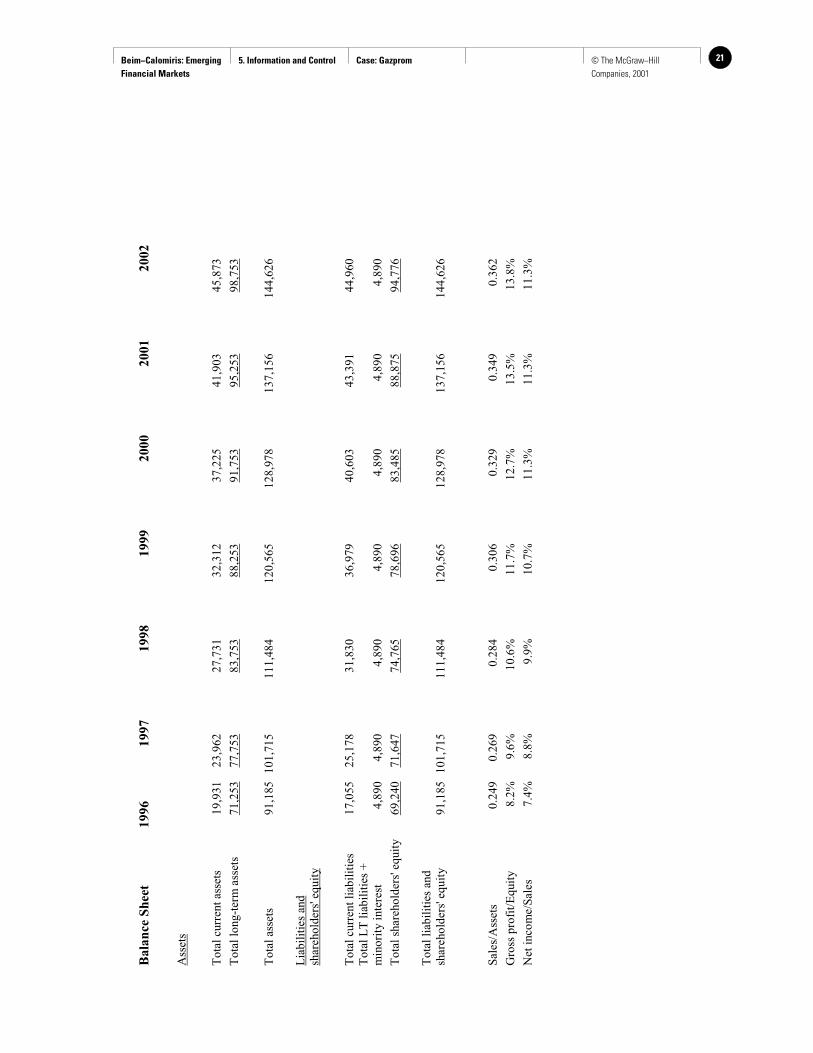
He also had been given five-year financial projections, translated to dollars, of Gazprom's incomestatement and balance sheet, but was not sure how to translate these numbers, shown in Exhibit 16, into cashflow. In this environment, wouldn't any free cash flow be pre-empted by the government? Did theshareholders really own any cash flow in this cash-starved economy? More generally, could the financialstatements for Gazprom be relied upon to correctly reflect the company's financial condition? The unusualcircumstances of barter and nonpayment seemed to undermine the application of standard cash projectionsand discounting, but Mr. Bolden was quite unsure what adjustments he would need to make to take this intoaccount. And time was running out.
Beim−Calomiris: Emerging Financial Markets
5. Information and Control Case: Gazprom 9© The McGraw−Hill Companies, 2001
Exhibit 1:
Summary of Russian Economic Performance
Change in GDP Inflation
1991 -13.0% n.a.
1992 -15.0% n.a.
1993 -9.0% 875%
1994 -14.0% 307%
1995 -4.0% 197%
1996 -5.0% 48%
1997 0.4% 7%
Source: Goskomstat, International Financial Statistics
Exhibit 2:
Shareholding Structure
Privatization Plan
Treasury Stock 10%
Residents of Yamal 5%
Residents of production regions 29%
Management and employees 15%
Rosgazifikatsiya 1%
Russian Federation 40%
100%
As of June 1997
Treasury Stock 10%
Russian Federal Property Fund 1%
Russian Corporate 16%
Russian Investors 2%
Russian Individuals 30%
Rosgazifikatsiya 1%
Russian Federation 40%
100%
Source: Company data
Beim−Calomiris: Emerging Financial Markets
5. Information and Control Case: Gazprom10 © The McGraw−Hill Companies, 2001
Exhibit 3:
Gazprom Income Statement, 1996
(billions of rubles)
Net Sales 126,239
Operating Expenses 94,617
Gross Profit 31,622
Net Other Income* -10,933
Income before taxes 20,689
Taxes 11,300
Net Income 9,389
Minority Interest -409
Net Income and minority interest 8,980
*includes monetary effects
Source: Company reports
Beim−Calomiris: Emerging Financial Markets
5. Information and Control Case: Gazprom 11© The McGraw−Hill Companies, 2001
Exhibit 4:
Gazprom Balance Sheet
(billions of rubles)
Assets As of Dec. 31Liabilities and shareholders'equity As of Dec. 31
1995 1996 1995 1996
Cash and equivalents 7,529 7,665 Accounts payable 21,474 36,605
Accounts receivable 59,635 79,045 Taxes payable 29,510 54,642
Inventories 17,246 21,829 Short-term loans + current LTD 2,096 3,407
Other 6,938 2,080 Total current liabilities 53,080 94,654
Total current assets 91,348 110,619
Long term debt 8,230 15,042
Net property, plant andequipment
344,563 375,303Deferred taxes
8,271 7,680
Investments 11,946 18,887 Provisions for liabilities 1,642 2,662
Other 238 1,265 Total long-term liabilities 18,143 25,384
Total long-term assets 356,747 395,455
Minority interests 1,346 1,755
Share capital 237 237
Treasury stock 0 -577
Retained earnings 375,289 384,621
Total shareholders' equity 375,526 384,281
Total assets 448,095 506,074 Total liabilities and equity 448,095 506,074
Common Shares23,674 mm
Local Stock Price $1.43
ADS Price* $20.58
Number of rubles that = $1.00: 4,640 5,560 *Each ADS represents 10 local shares
Source: Company reports
Beim−Calomiris: Emerging Financial Markets
5. Information and Control Case: Gazprom12 © The McGraw−Hill Companies, 2001
Exhibit 5:
Gazprom Cash Flow Statement, 1996
(in billions of rubles)
Cash flow from operating activities
Net income 9,389
Depreciation and amortisation 18,671
Increase in accounts receivable -19,410
Increase in inventories -4,583
Decrease in other current assets 4,858
Increase in accounts payable 14,929
Increase in taxes payable 24,541
Increase in provision for liabilities 1,020
Increase in other long-term assets -1,027
Increase in equity in subsidiaries -377
Net cash from operations 48,011
Cash flow from investing activities
Capital expenditure -50,490
Investments -6,350
Net cash from investing activities -56,840
Cash flow from financing activities
Increase in loans 8,123
Dividends paid -224
Purchases of treasury shares -817
Sales of treasury shares 1,883
Net cash from financing activities 8,965
Change in cash balance 136
Source: Company reports

Beim−Calomiris: Emerging Financial Markets
5. Information and Control Case: Gazprom 13© The McGraw−Hill Companies, 2001
Exhibit 6:
Gas Prices
(in U.S. $ per 1000 cubic meters)
Russian Russian
European Industrial Residential
Jan-94 88 12 0
Apr-94 88 14 0
Jul-94 88 15 0
Oct-94 88 13 0
Jan-95 90 14 3
Apr-95 90 19 3
Jul-95 90 38 3
Oct-95 90 52 12
Jan-96 92 48 11
Apr-96 92 45 10
Jul-96 92 43 10
Oct-96 92 43 9
Jan-97 92 42 18
Apr-97 92 41 18
Jul-97 92 40 18
Oct-97 92 40 20
Source: Company data
Beim−Calomiris: Emerging Financial Markets
5. Information and Control Case: Gazprom14 © The McGraw−Hill Companies, 2001
Exhibit 7a:
Domestic consumption of gas
(billions of cubic meters)
1991 392.3
1992 371.4
1993 349.5
1994 317.8
1995 306.1
1996 304.1
Source: Company data
Exhibit 7b:
Domestic consumers of gas, 1996
Power generation 41%
Industry 28%
Municipal 8%
Households 9%
Other 14%
Source: Company data, Goskomstat

Beim−Calomiris: Emerging Financial Markets
5. Information and Control Case: Gazprom 15© The McGraw−Hill Companies, 2001
Exhibit 8:
Exports to Central Europe
(billions of cubic meters)
1991 1992 1993 1994 1995 1996
Bosnia, Croatia, Bosnia 4.3 3.0 1.7 2.2 2.0 1.9
Bulgaria 5.7 5.2 4.8 4.7 5.8 6.0
Czech Republic 7.8 7.3 7.5 7.9 8.6 9.4
Hungary 6.0 4.8 5.7 5.3 6.3 7.7
Poland 7.2 6.7 5.9 6.2 7.2 7.1
Romania 5.4 4.6 4.6 4.5 6.1 7.2
Slovakia 5.9 5.5 5.7 5.9 6.3 7.1
Yugoslavia 0.0 0.0 0.0 0.0 0.0 2.1
Total 42.3 37.1 35.9 36.7 42.3 48.5
Source: Company data
Exhibit 9:
Joint Ventures and Subsidiaries in Central Europe
Country NameGazprom
share Partner Main activities
Bulgaria TopEnergy 50% Bulgargas Gas transmission and distribution
Hungary Panrusgaz 50% MOL (35%)/DKG East (15%) Gas distributionPoland Europol Gaz 48% POGC (48%)/ Gaztrading (4%) Construction of the Belarus-Poland
pipeline
Gaztrading 48% POGC Gas distribution
Romania WIROM 25% Romgaz 50%/WIEH 50% Gas distribution
Serbia Progress Trading 50% Progress Gas distribution
Slovenia Tagdem 7.60% Petrol Gas distribution
Source: Company data

Beim−Calomiris: Emerging Financial Markets
5. Information and Control Case: Gazprom16 © The McGraw−Hill Companies, 2001
Exhibit 10:
Exports to Western Europe
(billions of cubic meters)
1991 1992 1993 1994 1995 1996
Austria 5.2 5.1 5.3 4.7 6.1 6.0
Finland 2.9 3.0 3.1 3.4 3.5 3.7
France 11.4 12.1 11.6 12.2 13.0 12.4
Germany 24.4 22.9 25.7 29.6 32.1 32.9
Italy 14.5 14.1 13.8 13.8 14.3 14.0
Switzerland 0.4 0.4 0.4 0.4 0.4 0.4
Turkey 4.1 4.5 5.0 5.1 5.7 5.6
Total 62.9 62.1 64.9 69.2 75.1 75.0
Source: Company data
Exhibit 11:
Joint Ventures and Subsidiaries in Western Europe
Country NameGazprom
share Partner Main activities
Austria GWH 50% OMV Trading
Finland Gasum Oy 25% Neste Oy Gas distribution
North Transgas Oy 50% Neste Oy Feasibility study of trans-Baltic pipeline
France Fragaz 50% Gaz de France Gas distribution
Germany Wingas 35% Wintershall Gas transmission and storage
WIEH 50% Wintershall Gas distribution
Zarubezhgas 100% Gas distribution
Ditgaz 49% Wintershall Gas distribution
VNG 5% Ruhrgas, Wintershall Gas transmission and distribution
British Gas, Elf
Greece Prometheus Gas 50% DEPA Gas distribution
Italy Promgas 50% SNAM Gas storage and distribution
Volta 49% Edison Gas transmission and distribution
Turkey ABB/Etnes Construction of 860 MW station in Ankara
UK/Belgium Interconnector 10% British Gas, Elf Gas transmission
BP, Conoco, others
Source: Company data
Beim−Calomiris: Emerging Financial Markets
5. Information and Control Case: Gazprom 17© The McGraw−Hill Companies, 2001
Exhibit 12:
Exports to Former Soviet Union
(billions of cubic meters)
1991 1992 1993 1994 1995 1996
Belarus 17.3 17.3 16.4 14.3 12.9 13.7
Estonia 0.9 0.8 0.4 0.6 0.7 0.8
Georgia 1.0 0.8 0.5 0.3 0.0 0.2
Kazakhstan 2.0 0.7 1.2 0.4 0.0 0.4
Latvia 1.6 1.6 0.9 1.1 1.2 1.1
Lithuania 3.3 3.2 1.8 2.1 2.5 2.6
Moldova 3.4 3.4 3.1 3.0 3.0 3.2
Ukraine 78.1 78.1 54.7 57.0 52.9 51.0
Total 107.6 105.9 79.0 78.8 73.2 73.0
Source: Company data
Beim−Calomiris: Emerging Financial Markets
5. Information and Control Case: Gazprom18 © The McGraw−Hill Companies, 2001
Exhibit 13:
Domestic Subsidiaries and Joint Ventures
Company Ownership Main activity
Bank Imperial 15% Banking Services
Burgazgeoterm n.a. Drilling
Central Telecommunication Station 100% Telecommunications
Central Dispatching Division 100% Gas transportation monitoring
Gazexport 100% Gas exports
Gas Supervision Dept. of Russia 100% Pipeline inspection
Gazflot 100% Sea shipping and offshore production
Gazpromavia 100% Airline
Gazprombank 100% Banking Services
Gazkompromselstroi 100% Construction
Gazavtomatika n.a. Engineering
Gazkomplektimpex 100% Imports and exports of equipment
Gazenergoservis n.a. Compressor maintenance and repairs
Gazstroidetal n.a. Equipment manufacturing
Gazobezopasnost 100% Security services
Gazmash n.a. Equipment manufacturing
Informgaz 100% Data processing
Novourengoi Gas Chemical Complex 100% Ethylene production
Spetsgazavtotransport n.a. Truck Manufacturing
Promgaz n.a. Equipment manufacturing
Rosshelf 100% Offshore exploration and production
VNIIGAZ 100% R&D
Source: Company data
Exhibit 14:
Aggregate Market Value
($ billions)
Jan-97 Apr-97 May-97 Jul-97 Sep-97 Oct-97
Local 11.80 13.00 13.80 14.20 24.90 33.10
ADS 54.50 33.10 47.30 40.20 56.80 66.30
Common shares outstanding 23,674 m
Beim−Calomiris: Emerging Financial Markets
5. Information and Control Case: Gazprom 19© The McGraw−Hill Companies, 2001
Exhibit 15:
Valuation benchmarks
Price / Earnings Price / Operating Cash FlowMarket cap
($ bn) 1995 1996 1997E 1995 1996 1997E
Enron (USA) 9.0 18.9 17.0 14.8 10.9 10.1 9.5
Pacific Gas & Electric (USA) 9.6 7.8 13.4 13.0 3.0 3.7 3.4
British Gas (UK) 13.4 9.0 12.9 13.2 3.6 4.6 4.5
Petronas Gas (Malaysia) 5.7 22.2 19.9 17.2 14.8 14.1 12.5
ENI (Italy) 41.6 16.3 16.2 14.0 6.0 6.1 5.8
Exxon (USA) 128.2 20.2 18.5 18.7 10.3 9.8 9.7
LUKoil (Russia) 14.4 n.a. 19.2 17.8 25.9 14.7 15.9
Tatneft (Russia) 1.5 0.1 n.a. 11.0 n.a. 4.3 4.2
1995 1995 1995 1996Price/Book ROIC Debt/Cap Debt/Cap
Enron (USA) 2.2 12% 69% 65%
Pacific Gas & Electric (USA) 1.0 10% 90% 93%
British Gas (UK) 1.1 13% 39% 95%
Petronas Gas (Malaysia) 5.0 19% 49% 43%
ENI (Italy) 2.9 12% 77% 58%
Exxon (USA) 3.0 14% 19% 15%
LUKoil (Russia) 2.0 n.a. 5% -1%
Tatneft (Russia) 0.3 n.a. 1% n.a.
BOEReserves
BOEProduction
Enron (USA) 14.6 168.3
British Gas (UK) 12.0 457.6
ENI (Italy) 97.0 117.1
Exxon (USA) 9.4 128.8
LUKoil (Russia) 1.8 37.0
Tatneft (Russia) 0.2
Gazprom Production in BOE 1.58
Gazprom Reserves in BOE 240

Beim−Calomiris: Emerging Financial Markets
5. Information and Control Case: Gazprom20 © The McGraw−Hill Companies, 2001
Ex
hib
it 1
6:
Pro
ject
ion
s fo
r G
azp
rom
(in
mil
lio
ns
of
U.S
. d
oll
ars
)
Inco
me
Sta
tem
ent
19
96
19
97
19
98
19
99
20
00
20
01
20
02
Sal
es D
istr
ibuti
on
Act
ual
Pri
ceV
olu
me
Pri
ceV
olu
me
Pri
ceV
olu
me
Pri
ceV
olu
me
Pri
ceV
olu
me
Pri
ceV
olu
me
Ru
ssia
30
43
83
00
42
29
04
62
80
51
27
05
72
60
65
25
0
Fo
rmer
So
vie
t U
nio
n7
36
07
06
56
57
06
07
55
58
05
08
04
5
Wes
tern
Euro
pe
75
81
85
85
10
09
01
20
95
14
01
00
15
01
00
17
0
Cen
tral
Euro
pe
48
81
60
85
80
90
10
09
51
20
10
01
40
10
01
55
50
05
15
53
55
60
58
56
00
62
0
Vo
lum
e gro
wth
3%
4%
5%
4%
3%
3%
Rev
enues
22
,746
27
,345
31
,647
36
,874
42
,481
47
,820
52
,350
Op
erat
ing E
xp
ense
s1
7,0
48
20
,495
23
,720
27
,638
31
,840
35
,841
39
,237
Gro
ss P
rofi
t5
,69
86
,85
07
,92
79
,23
71
0,6
41
11
,979
13
,113
Oth
er I
nco
me/
Exp
ense
-1,9
70
-1,5
00
-1,0
00
-50
00
00
Inco
me
Bef
ore
Tax
es3
,72
85
,35
06
,92
78
,73
71
0,6
41
11
,979
13
,113
Tax
es @
55
%2
,03
62
,94
23
,81
04
,80
55
,85
36
,58
87
,21
2
Net
Inco
me
1,6
92
2,4
07
3,1
17
3,9
32
4,7
89
5,3
90
5,9
01
Dep
reci
atio
n3
,36
43
,50
04
,00
04
,50
04
,50
04
,50
04
,50
0
Cap
ital
Exp
end
iture
s9
,09
71
0,0
00
10
,000
9,0
00
8,0
00
8,0
00
8,0
00
Beim−Calomiris: Emerging Financial Markets
5. Information and Control Case: Gazprom 21© The McGraw−Hill Companies, 2001
Bala
nce
Sh
eet
19
96
19
97
19
98
19
99
20
00
20
01
20
02
Ass
ets
To
tal
curr
ent
asse
ts1
9,9
31
23
,962
27
,731
32
,312
37
,225
41
,903
45
,873
To
tal
long-t
erm
ass
ets
71
,253
77
,753
83
,753
88
,253
91
,753
95
,253
98
,753
To
tal
asse
ts9
1,1
85
10
1,7
15
11
1,4
84
12
0,5
65
12
8,9
78
13
7,1
56
14
4,6
26
Lia
bil
itie
s an
dsh
areh
old
ers'
eq
uit
y
To
tal
curr
ent
liab
ilit
ies
17
,055
25
,178
31
,830
36
,979
40
,603
43
,391
44
,960
To
tal
LT
lia
bil
itie
s +
min
ori
ty i
nte
rest
4,8
90
4,8
90
4,8
90
4,8
90
4,8
90
4,8
90
4,8
90
To
tal
shar
eho
lder
s' e
quit
y6
9,2
40
71
,647
74
,765
78
,696
83
,485
88
,875
94
,776
To
tal
liab
ilit
ies
and
shar
eho
lder
s' e
qu
ity
91
,185
10
1,7
15
11
1,4
84
12
0,5
65
12
8,9
78
13
7,1
56
14
4,6
26
Sal
es/A
sset
s0
.24
90
.26
90
.28
40
.30
60
.32
90
.34
90
.36
2
Gro
ss p
rofi
t/E
quit
y8
.2%
9.6
%1
0.6
%1
1.7
%1
2.7
%1
3.5
%1
3.8
%
Net
inco
me/
Sal
es7
.4%
8.8
%9
.9%
10
.7%
11
.3%
11
.3%
11
.3%

Beim−Calomiris: Emerging Financial Markets
9. Building Financial Institutions
Case: Peregrine Investments
22 © The McGraw−Hill Companies, 2001
Peregrine Investments Holdings Ltd.*
Introduction
Philip Tose’s career as an investment banker began on a racetrack in England in 1968.The son of a London banker, Mr. Tose, then in his twenties, decided to pursue his fortunes behindthe wheel of a Formula 3 race car. He was enjoying moderate success, traveling in Europe withtop level Grand Prix racers, when one day, at 26, his car spun out of control on a wet track inBrand’s Hatch, England and crashed into a barrier. As the car skidded, its steering wheel becamejammed under Mr. Tose’s leg and when it stopped, he found his leg shattered and twisted oddlybehind his body. The car was a heap. After reconstructive surgery on his leg and four months inthe hospital, his father called him into his London office and demanded that he sign an agreementto quit racing and become a banker.
Thirty years later, on January 12 1998, Mr. Tose, still limping from that 1968 accident,found himself in a crash of a different sort. Not long after going to work for his father at Vickersda Costa, a London brokerage, Mr. Tose moved to Hong Kong to set up an Asian operation forthe merchant bank. After Vickers da Costa was taken over by Citibank, he teamed up with acolleague, Francis Leung, and the two started their own investment bank: Peregrine InvestmentsHoldings. In ten years, they built Peregrine into Asia’s leading regional investment bank outsideof Japan, with assets of more than $5 billion at its height. By 1997, the bank had become a localrival of Wall Street’s bulge bracket firms like Goldman Sachs and Morgan Stanley, who werecompeting hard for equity business in China, and it had built Asia’s largest regional debtbusiness. But on that January day, with Asia’s currencies in chaos and Peregrine’s creditorswavering about its exposure to regional debt, Mr. Tose was forced to place the investment bankinto the hands of liquidators. Peregrine, which had become a symbol of the rise of Asia’s tigereconomies, lay in a heap like his Formula 3 race car 30 years earlier.
Some years before Peregrine’s collapse, reflecting on his days as a racer, Mr. Tose told agroup of visiting Harvard Business School students, “Whenever I came out of a corner at 150-miles-an-hour in one piece, I knew that my risk management systems were intact.” In fact, manylocal bankers wondered whether those systems were intact in the months leading up toPeregrine’s collapse. A relatively new bond operation had huge exposures to some of Asia’shardest hit economies during the meltdown of 1997. But Mr. Tose said the collapse of Peregrinewas beyond his control. After all, the financial maelstrom that had sent the Indonesian rupiahfrom 2,500 versus the U.S. dollar to more than 11,000 versus the dollar in a matter of monthscould not have been predicted by even the most sophisticated risk management models, many ofwhich Peregrine had in place. “We got caught in a completely unprecedented meltdown,” Mr.Tose said just days after Peregrine’s collapse.
Was that the case? Had the track simply become too wet for any regional investmentbank to navigate, as Mr. Tose argued after Peregrine’s fall? Or were the machine and its driversill-equipped? And if they had survived, was this machine in any shape to drive again? Thesewere not inconsequential questions in the days leading up to Peregrine’s demise and in themonths since. The investment bank, in fact, did have a chance to survive. Financial institutionsdon’t just collapse. They fail when their creditors let them fail, or their regulators shut themdown.
* This case was written by Jon Hilsenrath under the supervision of Professor David O. Beim of Columbia
Business School. Copyright 2001 by the McGraw-Hill Companies, Inc. All rights reserved.

Beim−Calomiris: Emerging Financial Markets
9. Building Financial Institutions
Case: Peregrine Investments
23© The McGraw−Hill Companies, 2001
Peregrine’s rise
When Mr. Tose came to Hong Kong in the early 1970s, he set his sights on the colony’snew local entrepreneurs, rather than focus on the old colonial trade houses like Jardine Matheson,which were the target of most British merchant bankers. Mr. Tose had concluded long beforemany others that Hong Kong’s future lay not in these old trading houses, which made theirfortunes in the 19th century opium trade, but in the Chinese themselves. One of his firstdiscoveries at Vickers da Costa was Li Ka-shing, a Chinese entrepreneur who was on his way tojoining the ranks of Hong Kong billionaires through his vast investments in the former colony’sbudding property market. Mr. Tose wrote a research report on Mr. Li’s property company,Cheung Kong Holdings, and quickly won the business of the rising tycoon.
By the time Mr. Tose had set off on his own in 1988, he and his partner, Francis Leung,had built up a network of local connections who promised them both startup capital and businessonce the investment bank was off the ground. When Tose launched Peregrine with $38 million instartup capital, his list of investors read like a Who’s Who of Hong Kong’s business elite,including local tycoons like Mr. Li and Gordon Wu, an infrastructure developer. In return fortheir support, Mr. Tose promised Hong Kong business executives an ability to deal directly with abanker who could make decisions on the spot. He disdained the hierarchical structures and thechecks and balances of his Western competitors. Indeed, he had fled London years earlierbecause he found the atmosphere too stultifying. Instead, he sought to build an investment bankat the outset that could act quickly and decisively. When Li Ka-shing sought to raise nearly $700million in early 1996, for instance, he gave Morgan Stanley just 20 minutes to evaluate his plan,and Morgan Stanley rejected it. But when Mr. Li went to Mr. Tose, he took the deal in twominutes and placed it with local investors. “Francis and myself are able to make decisions veryquickly and commit the firm’s capital very quickly,” Mr. Tose reflected after the deal. “Thepeople who work with us understand our culture and philosophy on doing business. They feelthey can come to us or ring us up at any time to get bottlenecks unblocked or deals done.”
If Peregrine was known as fast-moving deal maker, it also became known as anautocratic operation, mirroring in many ways the Chinese enterprises whose business it courted.Like Mr. Li’s Cheung Kong, many of these enterprises were run by their founders. Mr. Tose andMr. Leung were Peregrine’s founders. They brought in much of the investment bank’s business,and they made many of its decisions. As such, the culture of Peregrine in many ways grew out ofthe race car driver’s own personality. It quickly became known in Exchange Square – HongKong’s equivalent of Wall Street – as an investment bank that was willing to take big risks. Andits bankers were known for their brashness.
Sometimes that culture got Mr. Tose in trouble. In 1993, Hong Kong regulators censuredPeregrine for trading irregularities. The bank also made forays into Asia’s financial backwatersthat proved to be big embarrassments. Authorities in Bangladesh arrested a Peregrine employeein what Mr. Tose called a political witch-hunt. Another staffer was jailed in Vietnam. And aBurma venture ended up in a bitter lawsuit with a New York partner. Mr. Tose himself caughtflak for saying in a speech to visiting U.S. business students that the main reason that China’seconomy had outstripped India’s was because China’s government was not burdened by thetethering of a democracy.
Despite these episodes, Peregrine’s ability to raise equity capital for well-connectedclients in Greater China became its trademark and a source of growing profits. While Mr. Tosenurtured Hong Kong clients, Mr. Leung built a presence for Peregrine in China. Mr. Leung’sbreakthrough deal came in 1990, when he helped Larry Yung, a mainland contact and a Peregrineinvestor, transform a sleepy Hong Kong property company called Tylfull Co., into the listedinvestment arm of China International Trust and Investment Corp. (CITIC), China’s leadinginvestment trust company. CITIC transferred airline and property assets into the new company,called CITIC Pacific, creating Hong Kong’s first red chip, named for its close connections toChina, and a strange new term in investment banking – asset injection – that would later fuel a
Beim−Calomiris: Emerging Financial Markets
9. Building Financial Institutions
Case: Peregrine Investments
24 © The McGraw−Hill Companies, 2001
mad speculative rush into the sector. Asset injections, it was reasoned, were a cheap way to getaccess to China’s growth potential.
With the help of Yung, the “princling” son of vice president Rong Jiren, and other well-connected contacts, Mr. Leung and a small team of investment bankers set out scouring Shanghaiand the southern province of Guandong for opportunities to expose mainland companies tointernational equity markets. The timing was strained, because investors turned negative aboutChina after the Tiananmen Square massacre. And the effort was difficult because their audience,a little more than a decade into economic reform, was still unschooled in the ways of openfinancial markets. “At that time, they had no idea what are investment bankers, what is corporatefinance, what is the role of lawyers,” said Alex Ko, who was a part of Mr. Leung’s original team.
Like Mr. Tose, Mr. Leung was a hands-on manager, who recalled 13 hour journeystraveling on rickety Chinese trains into remote provinces in search of business. He was known tocall colleagues late at night to discuss details of a deal. But his roots could not have been moredifferent than Mr. Tose’s. The only one of five children to go to college, he grew up in a tinystone shack near an industrial site in Hong Kong, sharing a bed with his brother. As a teenager, heworked as a messenger boy who lugged electronic equipment around factories, and later, when hemoved to Toronto where he earned a college degree and an MBA, he worked as a bus boy forextra cash.
Mr. Leung was a “mid-level guy” doing property deals at the investment banking arm ofHongkong & Shanghai Banking Corp. in 1985, when Mr. Tose approached Mr. Leung’scolleague, Francis Yuen, a young, fast-rising banker, in hopes of luring away a group to build anew team at Citicorp. Mr. Leung went and rose quickly, within a year leading or taking part inlarge deals. After the 1987 stock market crash, Mr. Tose’s Citicorp team broke up. Mr. Yuenwent on to become the chairman of the Stock Exchange of Hong Kong. Three other colleaguesset up their own firm. But Mr. Leung stuck with his British mentor, who gave Mr. Leung “a lot ofautonomy” and opened him up to a world of powerful people.
By 1996, in fact, the equity team had propelled Peregrine to the top of Asia’s equitymarket league tables. That year, Asiamoney Magazine listed Peregrine as the region’s toparranger of initial public offerings and private equity placements. It raised $3.2 billion for clients,mostly Chinese and Hong Kong clients nurtured by Mr. Leung and Mr. Tose, outstrippingcompetitors like Morgan Stanley and Goldman Sachs by $2 billion.
The bond operation
By 1997, however, Peregrine was moving quickly beyond its roots as an equity house. In1994, it had pushed into the fixed income business by hiring away a team of 15 executives fromLehman Brothers. Mr. Tose had decided that to become a true regional powerhouse, he needed toestablish a presence in Asia’s immature bond markets before they developed. Leading the groupwas a young, intense and ambitious executive named Andre Lee, then just 31 years old. Mr. Lee,a Korean-American, had risen quickly through the ranks at Lehman Brothers by nurturing hisconnections in Seoul. After graduating from Colgate University in New York in 1985, he beganhis professional career humbly by selling Japanese industrial sewing machines to garmentfactories in New York City’s immigrant neighborhoods like Chinatown, Brooklyn and the SouthBronx. By 1989, Mr. Lee was intent on making a name for himself on Wall Street. After severalrejections, he answered a newspaper advertisement and took a job as a trainee in the retailbrokerage unit at Shearson Lehman Brothers. “I was really just looking for a way into theindustry,” he reflected in mid-1997. “My real goal was to do business with Korean institutions.”Before long, he was doing just that. To the consternation of some of Lehman’s own bondsalesman, Mr. Lee had reached outside the equity brokerage business and begun, on his own,selling US Treasury bonds to Korean bankers who had taken him under their wing. “I didn’tknow anything about the bond market at the time,” he would say later. But his Korean clients,
Beim−Calomiris: Emerging Financial Markets
9. Building Financial Institutions
Case: Peregrine Investments
25© The McGraw−Hill Companies, 2001
several of whom were being approached by Lehman’s actual bond salesmen, explained thebusiness to him and helped him book large orders. Despite the complaints his actions generated,he was moved out of the equity business and hired as a salesman on Lehman’s institutional bondmarket team and soon after that transferred to Hong Kong.
“It was difficult,” Mr. Lee later reflected later, in an interview with Euromoneymagazine, on his first months in Hong Kong. “Very few banks in Korea were actually buyingbonds other than floating-rate notes, and Lehman decided to get out of that business about threemonths after I arrived in Hong Kong. The only thing I could sell was straight bonds and Koreansjust wouldn't buy straight bonds, so I was left to my own devices to figure out ways to dobusiness with Korea. I ended up taking the route whereby I tried to focus on doing privateplacements, which again, I guess, wasn't supposed to be part of my menu.”
Asia’s fixed income markets were nothing like the deep, mature bond markets of the U.S.in which Mr. Lee first learned his trade. The fixed income market had long been dominated bybanks. By some estimates, more than 80% of the credit extended in Asia was extended by banks,through direct or syndicated loans. The remaining 20% was a mish-mash of Yankee bonds, soldto U.S. investors; Eurobonds, sold to a more global base; samurai bonds, denominated in yen;dragon bonds, sold within East Asia, and short-term paper. There were many reasons for theimmature state of the market. For one, the infrastructure wasn’t there. Clearance and settlementsystems were almost non-existent. Tax codes were confusing on how fixed income paper wouldbe treated. And most Asian corporations were not rated by international credit rating agencies,like Moody’s and Standard & Poor’s. Furthermore, because Asia’s pension systems were notwell developed, the region did not have a natural base of institutional bond investors. Andbecause most of Asia’s tiger economies ran fiscal surpluses, the bond markets did not havegovernment benchmarks like a U.S. Treasury off which bonds could be priced. Almost everyAsian country lacked any discernible yield curve. And by borrowing directly from banks, Asia’smany family-run corporations could avoid much public financial disclosure about their tightlycontrolled companies.
But in 1992, Mr. Lee sold his bosses in New York on a plan to develop local currencybond and money market instruments. In Mr. Lee’s view, and in the view of many others, Asia’sbond markets were bound to develop as the region’s economies grew larger and its needs forinfrastructure spending expanded. Indeed, a few years later the World Bank would estimate thatby 2004, East Asia’s bond markets would grow to more than $1 trillion. According to Mr. Lee’splan, trading in these local currency bonds would be greased by the development of currencyswap markets which would allow investors to swap the proceeds of, say, an instrumentdenominated in Thai baht, into the currency of their choice. This market, in turn, would beunderpinned by the fact that central banks in the region sought to peg their currencies to the U.S.dollar, providing a source of stability.
The early days were not easy. “There were a lot of doors that I knocked on which werepromptly closed, trying to convince people that it would make sense to buy a Thai baht bill ofexchange from a bank and swap it for US dollars and achieve a higher yield than they could findelsewhere,” Mr. Lee told Euromoney. But by March of 1993, he had found his first issuer in theInternational Finance Corp. of Thailand. And by late in the year, with long-term interest rates inthe United States falling, his efforts at Lehman Brothers took off, as investors sought higheryielding investments and turned to Thailand to park their cash. In short time, Mr. Lee and a teamof 15 colleagues moved to Peregrine, where he was given the opportunity by Mr. Tose to buildthe investment bank’s fixed income business from scratch.
Mr. Lee was just five years into his career as a financier. He came with a reputation as ahard working innovator in the market. But he also left behind rumors that Lehman Brothers hadbeen saddled with a loss-making inventory of fixed-income instruments. (He denied this.) Thechallenge of starting up a fixed-income business at Peregrine was even more daunting than hisefforts at Lehman Brothers. He reflected to Euromoney:
Beim−Calomiris: Emerging Financial Markets
9. Building Financial Institutions
Case: Peregrine Investments
26 © The McGraw−Hill Companies, 2001
“It was like learning how to build an investment bank from scratch. We didn't havetelephones; we didn't have a desk. We had no funding lines. We didn't have custodians; we didn'thave relationships with banks. There was just so much we didn't have. We didn't haveaccountants; we didn't have a P&L function. All these things that I guess we took for granted atLehman, that Lehman had built over 100 years or so, Peregrine just didn't have.”
But Mr. Lee soon discovered that if Asia’s bond markets, and Peregrine’s fixed incomedepartment, were undeveloped, they did not suffer from a lack of eager borrowers. The region,particularly Thailand and Indonesia, had many corporations who were eager to catch the wave offoreign capital that had been rushing into Asia for several years, helping to fuel its phenomenalgrowth rates. Lee’s strategy was to target the second-tier companies that didn’t yet have the cloutto tap international Yankee Bond or Eurobond markets, and to grow Peregrine with them. Healso found a source of capital in a familiar place, Korea, where domestic interest rates werefalling and forcing Korean bankers to look further afield for more attractive yields. Withcurrencies pegged to the U.S. dollar, Lee brought them Indonesian and Thai instruments, issuedby companies with no credit ratings, that yielded 15% or more.
The strategy began to bear fruit in the second half of 1995, when Peregrine syndicated a3-year, $175 million floating rate note for PT Citra Marga Nusaphala Persada, an Indonesian toll-road operator that was controlled by President Suharto’s daughter, Siti Hardiyanti Rukmana, orTutut, as many called her. The deal happened after Peregrine had arranged short-termcommercial paper loans for the company several months earlier. It would be a prelude to anexplosion of issues from Southeast Asia’s second-tier companies. His group was driven, workingmany 16 hour days, seven days a week as they built a market from nothing. Despite all of theinfrastructure problems, between 1994 and 1996, he helped scores of unrated Asian companiesraise $36 billion, effectively transforming Peregrine in just three years into Asia’s leading junkbond house and turning Mr. Lee into the presumptive king of Asia’s bond markets.
In the process, the bond operation became a driving force on Peregrine’s incomestatement. By 1997, it had more than 200 employees, including one of Asia’s most respectedcredit and foreign exchange research teams. And the group, which originated debt and traded init actively, accounting for nearly a third of the investment bank’s profits by 1997.
In many ways, Mr. Tose sought to nurture Mr. Lee the way he nurtured Mr. Leung, byoffering him great autonomy and encouraging his ambitions. But Mr. Lee’s autonomy was fargreater than Mr. Leung’s, because Mr. Tose brought very little experience to the fixed-incomebusiness, and little oversight to its operations. In an interview in mid-1997, he said flatly, “Idon’t manage that business.” But Mr. Tose and Mr. Lee appeared to develop an increasingadmiration for each others’ work, often settling down to lengthy, private conversations about thefuture of the firm in Mr. Tose’s office. Some believed that Mr. Lee, not Mr. Leung, was beinggroomed to eventually succeed Peregrine’s founder at the top of the bank. In the process, Mr.Lee developed an autocratic style that mirrored in many ways the style of his boss. He wasknown to lock employees out of morning meetings when they arrived late and to circulate longmemos written in the tone of a rambunctious football coach. In one memo as Indonesia’scurrency unraveled in August 1997, he complained, “Why does a country with 7% plus GDP, 5%plus inflation, manageable external and domestic debt, with stable commodity prices have to seeone quarter of its domestic wealth disappear? To appease some snot-nosed 26-year-old (foreign-exchange) trader at a Eurofag bank in Singapore.”
Mr. Lee also quickly became Peregrine’s highest paid employee, topping even Mr. Tose.In 1996, he was estimated to have earned more than $5 million in salary and bonus. Tose laterexplained the compensation plan for the fixed income department to Euromoney magazine:“Fixed income tends to be run much more along American investment-banking lines. Salaries arerelatively low, and the bonus packages are relatively high. Therefore good producers earnsignificant amounts. Bad ones just get their salaries.” Mr. Lee was a producer. Before long, hemoved into a luxury townhouse in an exclusive neighborhood on the south side of Hong Kong

Beim−Calomiris: Emerging Financial Markets
9. Building Financial Institutions
Case: Peregrine Investments
27© The McGraw−Hill Companies, 2001
island, and was rumored to have stationed a red Ferrari in Seoul for his frequent visits to theKorean capital. Ironically, a friend crashed the car soon after it was purchased, according to localpress reports.
1994-1997: An organization in flux
It was not lost on Mr. Tose that Peregrine’s stunning growth meant that the organizationwould have to change, too. To convince clients and Peregrine’s creditors that he was prepared tocompete in the big leagues of investment banking, Peregrine needed to drop its swashbucklingimage, and develop the systems and controls that helped financial institutions navigate volatilityin markets and rein in renegade employees. Mr. Tose learned that lesson in 1995 when he tried toacquire the fund management arm of a large U.S. insurance company. He was turned down,according to the Far Eastern Economic Review, because the firm feared Peregrine’s reputationwould frighten off its pension fund clients.
Reputation and style became increasingly important themes for Peregrine, because Mr.Tose realized that in order to continue to compete in the fixed income markets, Peregrine wouldneed to expand its capital base. This was especially important in Asia’s illiquid bond markets,because Peregrine was often willing to place offerings on its own books before lining upinvestors, known in the industry as doing “bought deals,” much like the commitment Mr. Tosehad made to Cheung Kong when asked to place new shares in early 1996. In addition to a strongcapital base, Peregrine needed to secure the confidence of creditors to finance its fast-growingbalance sheet. And on derivatives trades, many counterparties would only deal with well-capitalized banks, forcing Peregrine to seek guarantees from highly rated banks. As a result, Mr.Tose increasingly needed to strike a difficult balance between culture, reputation andorganization. “I hope that we will never lose the aggressive posture that we have today,” he saidin an interview in mid-1997. “We have to fight for everything we get, because we are not aslarge as some of our competitors. But I also hope that people realize that we are not just massiverisk takers.”
To soften the image, Peregrine’s 1996 annual report featured a fencer on its cover, ratherthan the trademark predatory falcon after which the company was named. But many of the otherchanges were more than cosmetic. In 1995, for instance, he reorganized the investment bankalong product lines, to rein in satellite offices and joint ventures around the region that had begunto operate like fiefdoms. That effort became a new source of tension within the organization, asexecutives outside of Hong Kong lost the authority to command deals autonomously. Anothersource of tension was also brewing in the organization between the equity side of the businessand the fixed income side of the business. From his first days at the organization, Mr. Lee sayshe felt besieged by shaken egos and suspicious glances from other investment bankers. Many ofthem, in fact, wondered whether he had the wherewithal to build the organization, and change it,at the fast pace he and Mr. Tose were moving.
Against this backdrop, Mr. Tose tried to build a risk management operation. John Lee, aBrooklyn native and the group’s treasurer, had been hired by Mr. Tose from Lehman Brothers, aspart of the move that brought Andre Lee’s fixed income team to Peregrine. Early on, John Lee’shighest priority appeared to be the widening of Peregrine’s access to creditors to help finance therapid expansion of the investment bank’s balance sheet. He launched a commercial paperprogram and raised $120 million by issuing 3-year floating rate notes in 1996. He also wasPeregrine’s lead player in an effort to secure a credit rating from an international rating agency.In this case it came from the Japan Bond Research Institute, which gave Peregrine an investmentgrade rating in early 1997, an accomplishment in which Mr. Tose took great pride.
John Lee also became increasingly involved in overseeing Peregrine’s risk managementprocedures, though he did not formerly have that responsibility until early 1997. He helped set upa Group Market Risk Management department, which monitored market risk on a daily basis
Beim−Calomiris: Emerging Financial Markets
9. Building Financial Institutions
Case: Peregrine Investments
28 © The McGraw−Hill Companies, 2001
using the industry-standard Value At Risk, a management tool which estimates the likelymaximum loss of a portfolio using the historical volatility of financial instruments. ACommitments Committee to oversee debt and equity underwriting operations and a Group CreditRisk Committee to evaluate the creditworthiness of clients also met “periodically or on an asneeded basis,” according to Peregrine’s annual report.
One result of these changes was to further centralize the operations of Peregrine, and toconcentrate decision-making into the hands of a key few executives. “One of the key things that Ilearned from Barings is how important the central treasury function was,” Mr. Tose said monthsbefore Peregrine collapsed. “No money can be paid out without me knowing about it. It’s allcentralized. There is one treasurer, one treasury function. People can’t spend money without usknowing.”
Mid-1997: Asia unravels
By mid-1997, Peregrine appeared to be on top of the world. With Hong Kong’shandover to China approaching, the red chip market pioneered by Mr. Leung was booming, andPeregrine was reaping many of the gains. When the investment arm of the Beijing municipalgovernment listed its own company on the Stock Exchange of Hong Kong, it chose Peregrine andMorgan Stanley to underwrite the deal, and the listing generated so much interest in Hong Kongthat local investors lined up for hours outside of the Bank of China just to get their hands on acopy of the prospectus. In June, Mr. Tose was named by Time Magazine one of Hong Kong’s 25most influential people. The magazine also included two of Mr. Tose’s patrons on its list: Li Ka-shing and Larry Yung. And the fixed income business was continuing to grow at phenomenalrates, by mid-year more than doubling its contribution to operating profits from the previous year.Rumors began circulating in Exchange Square that Peregrine was becoming overextended, butMr. Tose dismissed these rumors as nonsense. “There is a lot of jealousy in this town,” he said inthe days leading up to the Beijing Enterprises listing.
In fact, a storm was brewing in Asia, and its ferocity would astound even the region’sgloomiest prognosticators. At that point the storm was circling over Thailand, whose banks andfinance companies had large quantities of non-performing assets, just as its exports slowed,putting pressure on the nation’s U.S. dollar reserves. For many months, hedge funds and theproprietary trading desks at investment banks had been profiting on what were known as carrytrades. In essence, they sold their U.S. dollars for Thailand’s local currency, and enjoyed the highinterest rates they could earn in local deposits. With the currency pegged, a high return in dollarsappeared almost certain. Local corporations and local finance companies had essentially madethe same bet, borrowing low-rate U.S. dollars to finance local investments - typically grandproperty projects - with the apparent security of a stable currency. But by late 1996, the hedgefunds and trading desks had begun unwinding those carry trades, concerned that Thailand’sfinancial system had become unstable. The local borrowers also began to scramble for U.S.dollars, further depleting Thailand’s reserves. By July, the central bank’s reserves wereexhausted after futile attempts to prop up the currency. It had turned to the InternationalMonetary Fund for assistance and the baht was devalued.
The financial chaos that ensued had a panic quality. Asia’s remarkable economic growthrates had been fueled in part by an influx of capital from Western bankers and Westerninstitutional investors. The devaluation of the baht set off a swift reassessment of the risk thatcame with those investments, forcing creditors and investors to cover their foreign exchangeexposures just as local borrowers scrambled for dollars to pay off loans. Investors and bankershad become increasingly concerned that their capital was being put to use in projects that did notgenerate very inspiring returns and that local banks, many operating on an assumption that theywould be supported by their central banks, had become fundamentally unstable. At the sametime, many local investors in the region sought to protect their wealth by moving it off-shore.

Beim−Calomiris: Emerging Financial Markets
9. Building Financial Institutions
Case: Peregrine Investments
29© The McGraw−Hill Companies, 2001
The actual problems varied from country to country: from an overheated property marketin Thailand to an over-leveraged, inefficient corporate sector in Korea, to a corrupted politicalsystem in Indonesia. But the result was similar throughout the region in the ensuing months:currencies collapsed (with the exception of Hong Kong, Singapore and China), stock marketsimploded, and credit dried up.
By then, Peregrine had become much more vulnerable than it appeared on the surface.Its balance sheet had swollen from $3.1 billion at the end of 1996 to $5.3 billion in a matter ofmonths. It too carried substantial foreign exchange risks (dollar borrowing financing localcurrency assets). That is to say nothing of the off-balance sheet items that flowed out of theinvestment bank’s derivatives operations, such as currency and interest rate swap agreements thatPeregrine had in place with now struggling customers.
Peregrine had foreseen the trouble that was heading for Thailand. In late 1996, aftergenerating 40% of his business in Thailand, Andre Lee decided to shut down the originationbusiness out of Thailand completely, convinced that the currency was heading for a rough ride.But he continued to push headlong into Indonesia, even as investors, particularly the Koreanbanks, had become increasingly reluctant to buy the unrated paper in which Peregrine specialized.That forced the investment bank to hold its “bought deals” on its own books just as the regionwas heading for trouble.
Mid-1997: Not so steady, not so safe
By mid-year, Andre Lee was in the process of cementing perhaps the most troubling anddamaging financing of his short career, one that many found emblematic of the way the fixedincome department operated. His counterpart was an Indonesian wheeler-dealer named JopieWidjaja, president of PT Steady Safe, an Indonesian taxi company which charged local driversthe equivalent of about $7.50 a day to lease from its fleet of about 1000 blue and gray taxis. Mr.Widjaja had made a name for himself as the first Indonesian to try a hostile takeover on theJakarta Stock Exchange. But he was known more widely for the close ties he had forged withPresident Suharto’s daughter, Tutut, who controlled many of Jakarta’s prime transportationprojects through PT Citra Marga Nusaphala Persada, the transportation company she ran. Thatwas the same company from which Andre Lee had his breakthrough deal at Peregrine in 1995.
In July, Steady Safe and Citra Marga entered into an unusual transaction in which SteadySafe would purchase a 20% stake in Citra Marga. Tutut, in turn, would become chairman ofSteady Safe and place three allies on Steady Safe’s board of directors. Call it a reverse takeover.She took seats on his board, but placed no equity in Mr. Widjaja’s operation. However hedeemed the connection with the President’s powerful daughter as ample cause for the strangeterms of the deal, expecting the arrangement to reap lucrative new contracts for the expandedtransportation company he envisioned, one that would operate not just in local taxis, but also inferries and trains.
Peregrine had already been lined up to help provide the cash for the acquisition and theexpansion that was expected to flow out of it. Under the plan, Steady Safe would issue at least$265 million in short-term promissory notes in several tranches for three purposes: 1) to helpfinance the acquisition of the Citra Marga stake, 2) to pay off a loan due to HSBC Holdings PLCand 3) to fund the expansion. The HSBC loan had to be refinanced because the transaction withCitra Marga would have violated Steady Safe’s loan covenants with its banker. Peregrine filledin the gaps, and as he had with Citra Marga years earlier, Andre Lee planned eventually torefinance the short-term loans with a sale of long-term notes, sealing more business. Steady Safealso had filed an application with Indonesia’s securities regulator to issue additional shares tohelp reduce its debt load. Peregrine would be the underwriter for that deal, too.
While other international investment banks were also after Steady Safe’s business, inJakarta many local analysts were suspicious of the company, which was already highly leveraged,
Beim−Calomiris: Emerging Financial Markets
9. Building Financial Institutions
Case: Peregrine Investments
30 © The McGraw−Hill Companies, 2001
capitalized as it was with about twice as much debt as equity. More troubling, Steady Safe’srevenues were entirely based in local currency, the rupiah, yet its obligations were in U.S. dollars,just as pressure mounted on the Thai baht. Had Andre Lee consulted his Jakarta office about thetransaction, those concerns might have become more apparent to him, but relations between thehead office in Hong Kong and the regional offices had become increasingly frayed. Months afterthe transaction, Peregrine’s Jakarta representatives said they knew nothing about Peregrine’srelationship with Steady Safe. Andre Lee and his Hong Kong-based lieutenants had worked thetransaction out of their Jakarta hotel rooms, as they had many other transactions in the monthsafter Mr. Tose reorganized Peregrine’s operations along product lines. In the end, Peregrine heldmost of Steady Safe’s promissory notes on its own books, as its network of investors had becomeincreasingly reluctant to hold any Indonesian securities.
By August, Asia’s financial markets and Peregrine became unglued. By then it wasapparent that the devaluation of the baht would not be an isolated incident. In the third week ofAugust the Indonesian rupiah was devalued and the Malaysian ringgit was beginning to free fall.Rumors began to circulate that Peregrine had huge currency exposures to the region, and facedlarge currency losses in rupiah. In fact, its fundamental problem was credit exposure toborrowers whose many problems included currency imbalances. By some estimates, Peregrinehad held a corporate bond portfolio as large as $3 billion – two-thirds of its assets – at its height.It was filled with credits from companies which were suddenly struggling to pay off their U.S.dollar debt as their own currencies depreciated in value and their bankers reined in credit. AndreLee, meanwhile, worked furiously to restructure the fixed income business. According to theAsian Wall Street Journal, in an August 20 email to his bond department staff, he said: “We needto put our existing staff in order.” He said the department would set up a new team to search forcredit problems, and the group would become cautious in arranging new issues. “The focus thenbecomes on doing deals that we can REALLY SELL.”
Compounding problems, Hong Kong’s red chip stocks, which had soared in the monthsleading up to and after the handover to China, had begun to implode. Equity investors hadbecome increasingly suspicious about the chances that mainland authorities would actually handover assets to their Hong Kong-listed associates at hugely discounted prices, as so many hadexpected. So another important source of income for Peregrine, Francis Leung’s China equitybusiness, went into decline.
Rumors were intensifying about Peregrine’s financial health. They had made Peregrine’screditors nervous, and some started to pull their credit lines to the bank just as it was trying toshrink its balance sheet by selling off assets into increasingly illiquid markets. The timing couldnot have been worse. While Mr. Tose pinned the rumors on Peregrine’s jealous rivals, Andre Leesuspected that some of the rumors were coming from the investment bank’s own equitydepartment. Relations between the two departments had become that strained. Indeed, thetension within Peregrine over the fixed income business reached the highest levels of theinvestment bank. When asked by a Euromoney reporter to respond to complaints by some seniorPeregrine executives that they were kept in the dark about the company’s fixed incomeexposures, Mr. Tose responded: “What the hell's it got to do with them? Why don't they get onand do their business?” He added, “They don't understand the business.”
In October, with Hong Kong’s stock market crashing, Mr. Tose took two extraordinarysteps. First, he announced that he had hired Kroll, a private detective agency, to locate the sourceof the rumors and to put an end to them. Second, he announced a series of steps to try to easepublic concerns about Peregrine’s financial standing, revealing that Peregrine planned to reserve$35 million against possible write-offs from its bond portfolio, on top of the $25 million that hadbeen reserved at mid-year. He issued a press release offering an overview of the investmentbank’s positions. He also announced plans, by mid-December, to release income results throughOct. 31 and to push Peregrine’s financial year-end to Nov. 30 from Dec. 31, making fully auditedaccounts available by January. (Hong Kong companies are required to release fully auditedaccounts only for their financial year-end. Income statements are required at mid-year, but

Beim−Calomiris: Emerging Financial Markets
9. Building Financial Institutions
Case: Peregrine Investments
31© The McGraw−Hill Companies, 2001
balance sheets and cash flow statements are not. These disclosure requirements can leaveinvestors in an information vacuum on a company’s financial standing for months on end. InPeregrine’s case, they would not have seen a balance sheet for another six months had Mr. Tosenot acted.)
Yet Peregrine’s problems mounted, and its bond portfolio wasn’t shrinking nearly as fastas it needed to. By Oct. 31, the face value of the bonds and notes it held, by then mostlyIndonesian credits, stood at more than $1 billion. Their market value was clearly much smallerthan that. Its largest holding was Steady Safe, at $265 million, a third of its adjusted sharecapital.
The rescue
In the midst of these challenges, Mr. Tose had been in discussions with the Zurich Group–a Swiss insurance giant with a pristine credit rating – about cooperating in a direct investmentfund. Leading those talks for the Zurich Group was an American hockey buff named StevenGluckstern. Mr. Gluckstern, a stocky man who wore a thick beard and mustache, had movedquickly up the ranks of Wall Street in the 1980s and landed for a while under the tutelage ofinvestor Warren Buffett. Mr. Gluckstern pioneered the use of investment banking techniques inthe insurance industry. He joined the Zurich Group after Mr. Buffett rejected a plan to set up aBermuda-based “finite risk” reinsurance business in 1987. In late 1997, he was working bothends of the globe, positioning himself to buy a controlling stake in the New York Islanders, aprofessional hockey team, and looking for direct investments in shell-shocked Asia. (He wasalready a joint owner of another professional hockey team, the Phoenix Coyotes, which he movedfrom Arizona from Winnipeg in 1996.)
By late October, it had become clear that what Peregrine needed was a direct investoritself, one with access to significant amounts of capital and one with enough clout in internationalfinancial markets to settle the concerns of Peregrine’s creditors. In many ways, the Zurich Groupwas a perfect fit for the situation. Mr. Gluckstern specialized in financial institutions, and theSwiss insurance group, with a reputation for conservatism, could help ease investors’ suspicionsthat Peregrine was an organization that never grew out of its buccaneering ways. And Mr.Gluckstern was eager to find assets in the region while prices seemed cheap. In Peregrine, hefound an investment bank with a known franchise and extensive contacts throughout Asia. OnNov. 16, both sides announced that the Zurich Group would invest $200 million in newly issuedpreferred shares that could be converted into a 24% equity holding and the Swiss group would begiven three seats on Peregrine’s nine-member board of directors.
For Mr. Tose, who had boasted for years about Peregrine’s ability to compete with thebest and the biggest from the West, the transaction was a letdown. In a December interview, Mr.Tose insisted that Peregrine remained an independent investment bank. When asked about thethree executives the Zurich Group would have on Peregrine’s board of directors, Mr. Toseremarked, “So what? We don't run the company through the board. We never have, and neverwill.”
Despite his obviously mixed feelings, it was clear to Mr. Tose that he needed thepartnership to put an end to concerns about Peregrine’s financial health. The deal was contingenton the Zurich Group completing several weeks of due diligence. With the rupiah continuing tosink, the clock for Peregrine had begun ticking.
The collapse
By December, Peregrine had signed up another investor: First Chicago NBD Corp.,which was also the investment bank’s largest creditor. First Chicago agreed to invest $25 millioninto Peregrine, an important vote of confidence. But events in the region were spinning further

Beim−Calomiris: Emerging Financial Markets
9. Building Financial Institutions
Case: Peregrine Investments
32 © The McGraw−Hill Companies, 2001
out of control, beyond the expectations of most observers. To appreciate the extent of the chaos,consider this. When Mr. Gluckstern and Mr. Tose agreed on the investment, the rupiah stood atabout 3,600 to the U.S. dollar. In performing stress tests on Peregrine’s portfolio, his team ofanalysts used a value-at-risk approach to assessing the downside. They looked at the currencyand its historical volatility and they calculated how far it would move if it weakened by a measureof two standard deviations from its present level. Statistical models suggested that there was agreater than 90% chance that the rupiah would not weaken beyond 5,000 rupiah to the dollar,based on its historical volatility. When a local economist suggested that Mr. Gluckstern plug arupiah at 10,000 into his financial models of Peregrine’s portfolio, he hesitated. Such a move wasbeyond any historical precedent for volatility, representing a shift of more than 6 standarddeviations, which the models said carried a probability of a tiny fraction of one percent. In fact,the rupiah plunged further, particularly during January 1998 (see Figure 1).
If Mr. Tose was concerned, he certainly didn’t show it. On Dec. 24, with Asia’s marketssinking rapidly, he went on a vacation tour of the palaces of Rajasthan, India, according to the FarEastern Economic Review. But soon after he left, both Moody’s and Standard & Poor’sdowngraded their ratings on Indonesian debt to junk bond status, pushing sovereign Indonesiandebt into the realm of Steady Safe. The downgrades helped to drive institutional investorscompletely out of Indonesian debt, since many were barred by their official mandates fromholding non-investment grade securities, further weakening the currency.
At the same time, Steady Safe was heading for trouble. In early January, the Indonesiansecurities regulator demanded that Steady Safe postpone its plans to raise equity in a five-for-onerights issue. Tutut, Mr. Widjaja’s well-connected link to the Suharto administration, was not tobe heard from. By early January, with payments on its promissory notes looming, the marketcapitalization of Steady Safe’s stock had sunk to less than $4 million and the price of most cabrides had sunk to a few cents in U.S. dollar terms. Its debt could not be sold at almost any price.
Figure 1
Indonesian Rupiah per Dollar
0
2000
4000
6000
8000
10000
12000
8/6/97
8/13/97
8/20/97
8/27/97
9/3/97
9/10/97
9/17/97
9/24/97
10/1/97
10/8/97
10/15/97
10/22/97
10/29/97
11/5/97
11/12/97
11/19/97
11/26/97
12/3/97
12/10/97
12/17/97
12/24/97
12/31/97
1/7/98
1/14/98
1/21/98

Beim−Calomiris: Emerging Financial Markets
9. Building Financial Institutions
Case: Peregrine Investments
33© The McGraw−Hill Companies, 2001
By now Peregrine’s exposure to Steady Safe had been widely reported in the press,raising new concerns about the investment bank’s risk management procedures. Many ofPeregrine’s senior executives, including Francis Leung, its second-in-command, said they hadknown nothing about the Steady Safe loan until months after it had been completed. Mr. Leung,Peregrine’s managing director, would later say he was too busy with his China business to payattention. John Lee, Peregrine’s head of risk management, also said they knew nothing of theSteady Safe holdings until months after it had been completed. In a letter to the Asian WallStreet Journal after Peregrine collapsed, John Lee said the bond department, “advanced fundsgradually to this company by purchasing securities over a long period of time and settling themthrough the operations department as normal securities purchases.” After the collapse, John Leealso complained that he had little time to fix Peregrine’s risk management procedures after beinggiven that responsibility in early 1997. “In between an extensive travel schedule and addressingother ‘fires’ in the organization, I recruited staff and moved to gain control and consolidatevarious credit functions… Many said it was unfortunate I could not have been given thisresponsibility earlier.” Andre Lee later disputed many of these arguments. “Fixed incomecomplied with normal reporting lines,” he told Euromoney magazine. “The reporting lines onSteady Safe were no different than on other deals. Everyone within the firm who needed to knowabout the deal knew.”
While questions about Steady Safe mounted, Peregrine’s stock was sinking fast. Thatplaced Mr. Gluckstern in a dilemma. The November deal valued Peregrine at HK$8 per share,but by early January, the share price had fallen to HK$4.375. The deal would clearly need to berenegotiated. But now there was an additional dilemma. Hong Kong’s listing rules require thatinvestors who buy more than 35% of a company’s shares make a general offer for all of theshares. If Mr. Gluckstern invested the planned $200 million, he would move over that limit,meaning he had to reduce his offer.
As the rupiah plunged toward 11,000 to the U.S. dollar, Mr. Gluckstern’s team spentseveral long nights in early January analyzing the pros and cons of staying in the deal. The grouphad developed its own concerns about Peregrine’s culture, but was still attracted to the franchise.He came up with a new offer of $175 million, but refused to deliver the funds until the followingweek, just as Peregrine faced payments on obligations to creditors. Peregrine would need $60million for three or four days until Zurich’s investment arrived. The new arrangement actedessentially as a test of the willingness of Peregrine’s creditors, particularly First Chicago, to standby its side for a few more days. First Chicago was a secured creditor and when they wavered, thedeal fell apart.
By Friday, Hong Kong’s securities regulators demanded that it stop dealing in the localstock and futures markets. During the weekend, Mr. Leung and Mr. Tose searched frantically fornew investors, looking primarily among their clique of mainland contacts. But in these volatilemarkets, none dared to step forward. On Monday, January 12, Peregrine filed for liquidation.
A day later, Mr. Tose walked with his trademark limp into a room filled with reporters,Mr. Leung at his side. He explained with his voice wavering how he learned by telephone at 5a.m. on Jan. 9 that the expected credit line had been pulled. “We got caught as a result of ourilliquidity and a meltdown in currencies,” he said, continuing later, “It’s very sad, but those arethe facts. Now I’d like a bit of peace and quiet.”
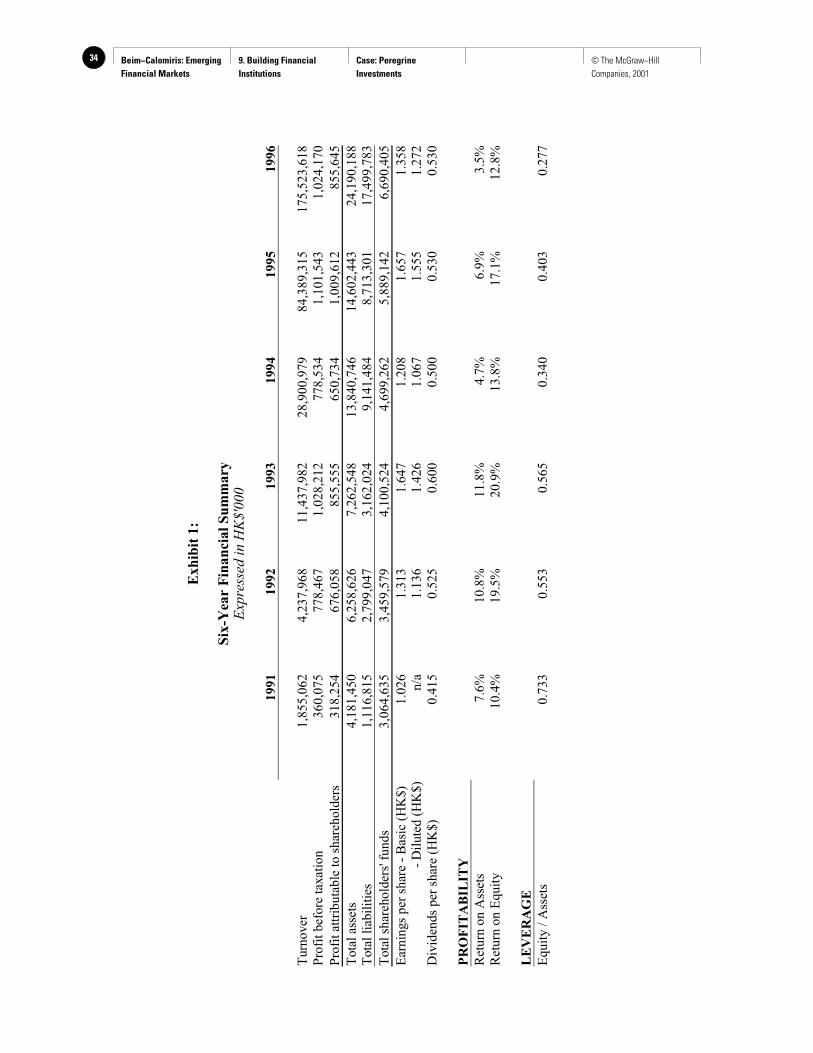
Beim−Calomiris: Emerging Financial Markets
9. Building Financial Institutions
Case: Peregrine Investments
34 © The McGraw−Hill Companies, 2001
Ex
hib
it 1
:
Six
-Yea
r F
ina
nci
al
Su
mm
ary
Exp
ress
ed i
n H
K$'0
00
1991
1992
1993
1994
1995
1996
Turn
over
1,8
55
,06
24
,23
7,9
68
11
,43
7,9
82
28
,90
0,9
79
84
,38
9,3
15
17
5,5
23
,618
Pro
fit
bef
ore
tax
atio
n3
60
,07
57
78
,46
71
,02
8,2
12
77
8,5
34
1,1
01
,54
31
,02
4,1
70
Pro
fit
attr
ibu
tab
le t
o s
har
ehold
ers
31
8,2
54
67
6,0
58
85
5,5
55
65
0,7
34
1,0
09
,61
28
55
,64
5
Tota
l as
sets
4,1
81
,45
06
,25
8,6
26
7,2
62
,54
81
3,8
40
,74
61
4,6
02
,44
32
4,1
90
,18
8T
ota
l li
abil
itie
s1
,11
6,8
15
2,7
99
,04
73
,16
2,0
24
9,1
41
,48
48
,71
3,3
01
17
,49
9,7
83
Tota
l sh
areh
old
ers'
fu
nd
s3
,06
4,6
35
3,4
59
,57
94
,10
0,5
24
4,6
99
,26
25
,88
9,1
42
6,6
90
,40
5
Ear
nin
gs
per
sh
are
- B
asic
(H
K$)
1.0
26
1.3
13
1.6
47
1.2
08
1.6
57
1.3
58
- D
ilu
ted
(H
K$)
n/a
1.1
36
1.4
26
1.0
67
1.5
55
1.2
72
Div
iden
ds
per
sh
are
(HK
$)
0.4
15
0.5
25
0.6
00
0.5
00
0.5
30
0.5
30
PR
OF
ITA
BIL
ITY
Ret
urn
on
Ass
ets
7.6
%1
0.8
%1
1.8
%4
.7%
6.9
%3
.5%
Ret
urn
on
Eq
uit
y1
0.4
%1
9.5
%2
0.9
%1
3.8
%1
7.1
%1
2.8
%
LE
VE
RA
GE
Eq
uit
y /
Ass
ets
0.7
33
0.5
53
0.5
65
0.3
40
0.4
03
0.2
77
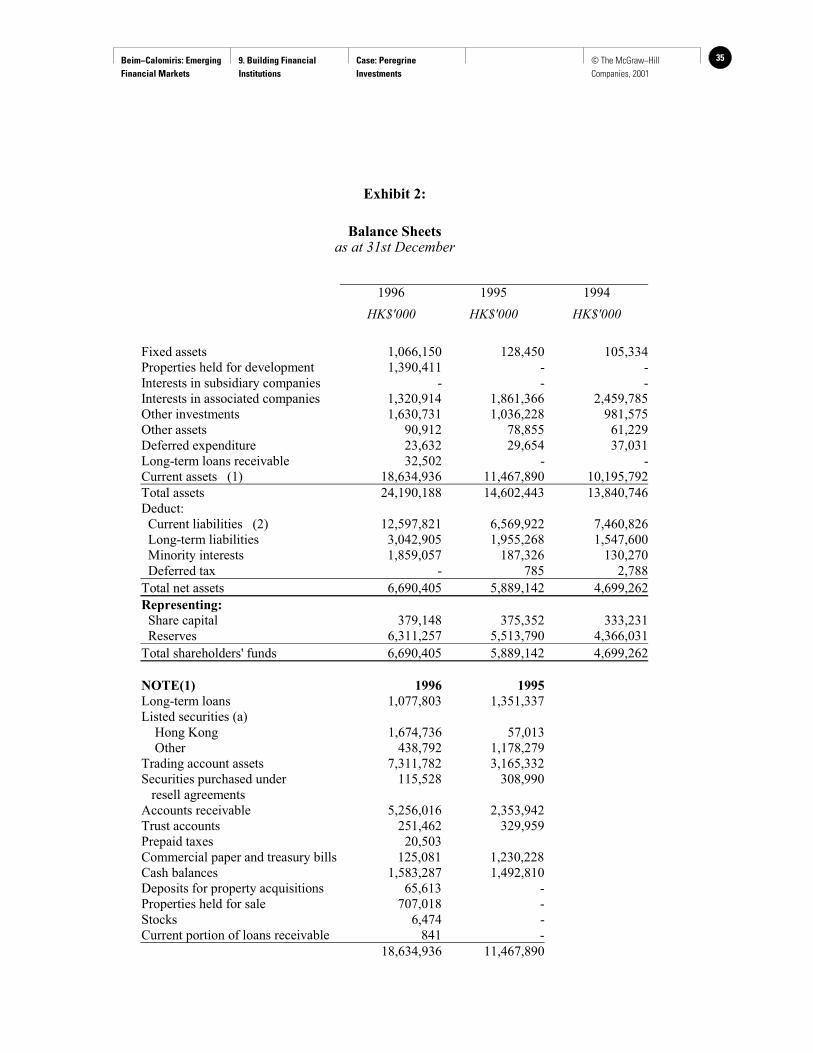
Beim−Calomiris: Emerging Financial Markets
9. Building Financial Institutions
Case: Peregrine Investments
35© The McGraw−Hill Companies, 2001
Exhibit 2:
Balance Sheetsas at 31st December
1996 1995 1994
HK$'000 HK$'000 HK$'000
Fixed assets 1,066,150 128,450 105,334Properties held for development 1,390,411 - -Interests in subsidiary companies - - -Interests in associated companies 1,320,914 1,861,366 2,459,785Other investments 1,630,731 1,036,228 981,575Other assets 90,912 78,855 61,229Deferred expenditure 23,632 29,654 37,031Long-term loans receivable 32,502 - -Current assets (1) 18,634,936 11,467,890 10,195,792
Total assets 24,190,188 14,602,443 13,840,746Deduct: Current liabilities (2) 12,597,821 6,569,922 7,460,826 Long-term liabilities 3,042,905 1,955,268 1,547,600 Minority interests 1,859,057 187,326 130,270 Deferred tax - 785 2,788
Total net assets 6,690,405 5,889,142 4,699,262
Representing:
Share capital 379,148 375,352 333,231 Reserves 6,311,257 5,513,790 4,366,031
Total shareholders' funds 6,690,405 5,889,142 4,699,262
NOTE(1) 1996 1995
Long-term loans 1,077,803 1,351,337Listed securities (a) Hong Kong 1,674,736 57,013 Other 438,792 1,178,279Trading account assets 7,311,782 3,165,332Securities purchased under 115,528 308,990 resell agreementsAccounts receivable 5,256,016 2,353,942Trust accounts 251,462 329,959Prepaid taxes 20,503Commercial paper and treasury bills 125,081 1,230,228Cash balances 1,583,287 1,492,810Deposits for property acquisitions 65,613 -Properties held for sale 707,018 -Stocks 6,474 -Current portion of loans receivable 841 -
18,634,936 11,467,890

Beim−Calomiris: Emerging Financial Markets
9. Building Financial Institutions
Case: Peregrine Investments
36 © The McGraw−Hill Companies, 2001
Exhibit 2, cont.
(a) 1996 1995
Market value 2,141,995 1,244,641
NOTE (2) 1996 1995
Bank loans and overdrafts 955,811 29,179Other loans 1,580,867 474,124Securities sold under repurchase 598,172 347,624 agreementsSecurities sold, not yet purchased 200,447 248,331Commercial paper 3,905,158 1,921,650Unclaimed dividends 2,207 2,975Accounts payable 4,514,640 2,988,392Trust accounts 251,462 329,959Taxes due 124,007 51,521Proposed final dividend 177,166 176,167Deposits received on properties 287,884
12,597,821 6,569,922

Beim−Calomiris: Emerging Financial Markets
9. Building Financial Institutions
Case: Peregrine Investments
37© The McGraw−Hill Companies, 2001
Exhibit 3:
Consolidated Profit and Loss AccountFor years ended 31st December
1996 1995 1994
HK$'000 HK$'000 HK$'000
Turnover 175,523,618 84,389,315 28,900,979
Operating profit 848,613 902,066 344,427Operating profit is stated after crediting/(debiting) the following exceptional items: Profit on disposal of associated companies - 843,744 - Loss on disposal of other investments - (65,963) - Provision for losses in long-term investments - (113,885) -Share of results of associated companies 175,557 199,477 434,107
Profit before taxation 1,024,170 1,101,543 778,534Taxation 104,974 (107,496) (140,676)
Profit after taxation 919,196 994,047 637,858(Profit)/Loss attributable to minority shareholders (63,551) 15,565 12,876
Profit attributable to shareholders 855,645 1,009,612 650,734Dividends (334,990) (333,079) (294,656)
Retained profit for the year 520,655 676,533 356,078
Earnings per share Basic HK$1.358 HK$1.657 HK$1.208
Fully diluted HK$1.272 HK$1.555 HK$1.067
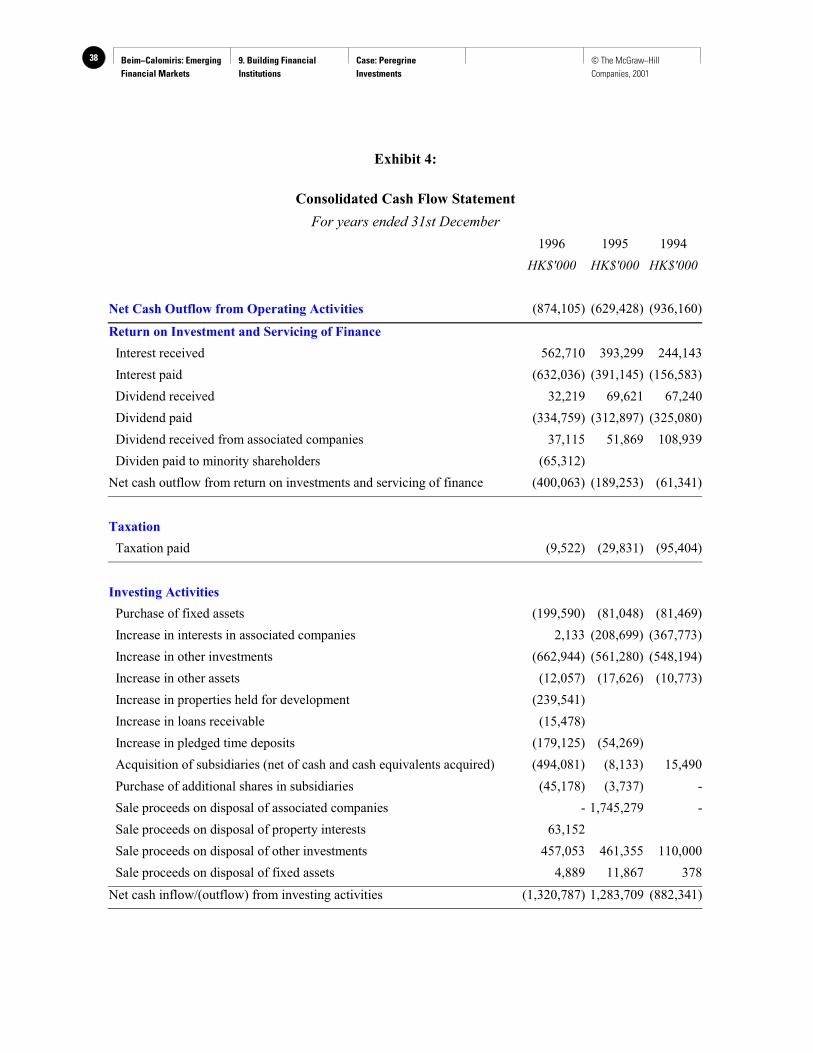
Beim−Calomiris: Emerging Financial Markets
9. Building Financial Institutions
Case: Peregrine Investments
38 © The McGraw−Hill Companies, 2001
Exhibit 4:
Consolidated Cash Flow Statement
For years ended 31st December
1996 1995 1994
HK$'000 HK$'000 HK$'000
Net Cash Outflow from Operating Activities (874,105) (629,428) (936,160)
Return on Investment and Servicing of Finance
Interest received 562,710 393,299 244,143
Interest paid (632,036) (391,145) (156,583)
Dividend received 32,219 69,621 67,240
Dividend paid (334,759) (312,897) (325,080)
Dividend received from associated companies 37,115 51,869 108,939
Dividen paid to minority shareholders (65,312)
Net cash outflow from return on investments and servicing of finance (400,063) (189,253) (61,341)
Taxation
Taxation paid (9,522) (29,831) (95,404)
Investing Activities
Purchase of fixed assets (199,590) (81,048) (81,469)
Increase in interests in associated companies 2,133 (208,699) (367,773)
Increase in other investments (662,944) (561,280) (548,194)
Increase in other assets (12,057) (17,626) (10,773)
Increase in properties held for development (239,541)
Increase in loans receivable (15,478)
Increase in pledged time deposits (179,125) (54,269)
Acquisition of subsidiaries (net of cash and cash equivalents acquired) (494,081) (8,133) 15,490
Purchase of additional shares in subsidiaries (45,178) (3,737) -
Sale proceeds on disposal of associated companies - 1,745,279 -
Sale proceeds on disposal of property interests 63,152
Sale proceeds on disposal of other investments 457,053 461,355 110,000
Sale proceeds on disposal of fixed assets 4,889 11,867 378
Net cash inflow/(outflow) from investing activities (1,320,787) 1,283,709 (882,341)
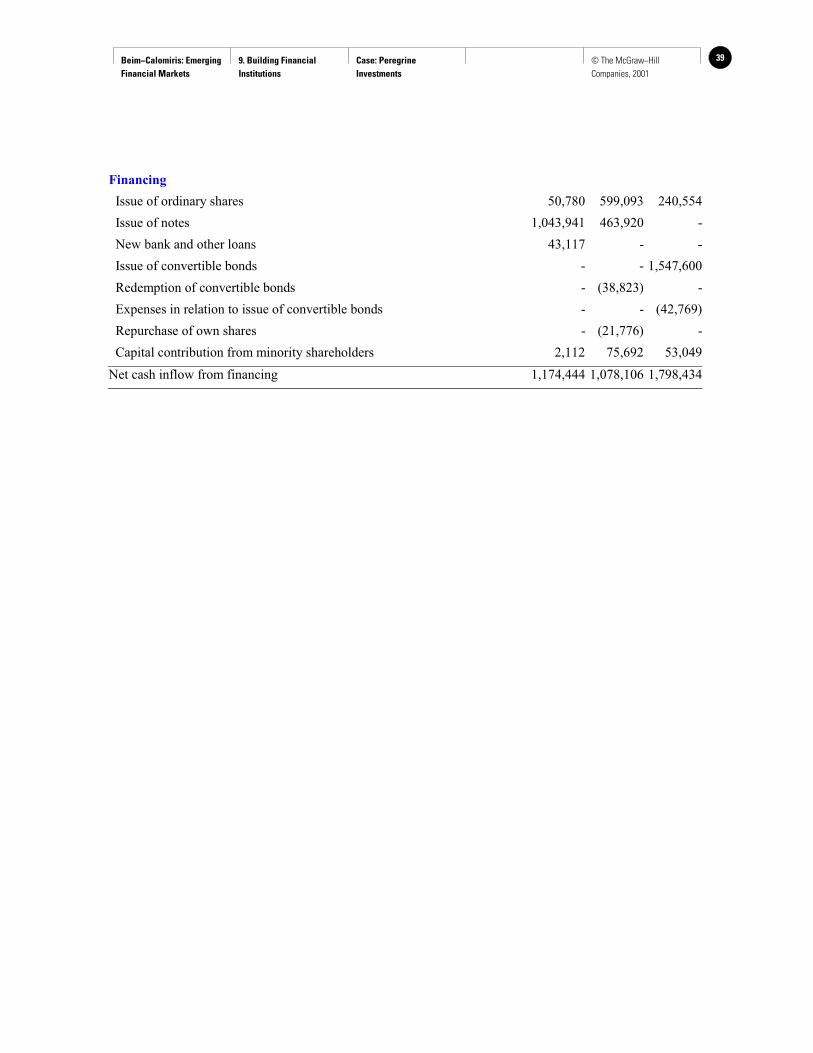
Beim−Calomiris: Emerging Financial Markets
9. Building Financial Institutions
Case: Peregrine Investments
39© The McGraw−Hill Companies, 2001
Financing
Issue of ordinary shares 50,780 599,093 240,554
Issue of notes 1,043,941 463,920 -
New bank and other loans 43,117 - -
Issue of convertible bonds - - 1,547,600
Redemption of convertible bonds - (38,823) -
Expenses in relation to issue of convertible bonds - - (42,769)
Repurchase of own shares - (21,776) -
Capital contribution from minority shareholders 2,112 75,692 53,049
Net cash inflow from financing 1,174,444 1,078,106 1,798,434

Beim−Calomiris: Emerging Financial Markets
9. Building Financial Institutions
Case: Peregrine Investments
40 © The McGraw−Hill Companies, 2001
Exhibit 5:
Operating Profit Before Tax and Administrative Expense
PRINICIPAL ACTIVITIES1996 % 1995 %
Equity Products 284,652 28% 169,423 16%
Fixed Income Products 381,499 37% 158,220 15%
Direct Investments 45,653 4% (23,643) -2%
Asset Management (26,937) -3% (18,945) -2%
Property Investment 65,484 6% - 0%
Investment Trading 145,803 14% 702,047 66%
Foreign Exchange and Commodities - 0% (23,296) -2%
Other 128,869 13% 107,568 10%
TOTAL 1,025,023 100% 1,071,374 100%

Beim−Calomiris: Emerging Financial Markets
9. Building Financial Institutions
Case: Peregrine Investments
41© The McGraw−Hill Companies, 2001
Exhibit 6:
Directors and Share Distribution
LIST OF DIRECTORS
Philip Tose Andre Lee Timothy GrayFrancis Leung Alex Adamovich Judd Clark Kinne
Peter Wong Russell Leiman Alex KoJohn Lee Anderson Whamond Anthony Loh
Alan Mercer Bruce Seton Paul PhebyPeter Fu Warren Allderige Francis Bruce Pike
Andrew Jamieson Ramon Arnaiz Timothy VoakeFrederick Kinmonth Mark John Crosbie
DIRECTORS INTERESTS IN SHARES
Person or Entity Number of Shares Number of WarrantsFrancis Leung 520923 52092
Philip Tose 345861 34586Peter Wong (*) 650000 65000
The Kwong Sang Hong International Ltd
Alan Mercer (#) 70,000 Philip Tose 250,000
DIRECTORS INTERESTS IN OPTIONS
Date Granted Number of OptionsPrice Paid on
Exercise of OptionFrancis Leung 8-Feb-94 500,000 $17.20
26-Jan-95 250,000 $7.90 5-Feb-96 250,000 $11.90
Alan Mercer 8-Feb-94 100,000 $16.30 26-Jan-95 200,000 $7.90 5-Feb-96 200,000 $11.90
Philip Tose 8-Feb-94 500,000 $17.20 26-Jan-95 250,000 $7.90 5-Feb-96 250,000 $11.90
Peter Wong 13-Jan-93 450,000 $7.95 8-Feb-94 230,000 $17.20 26-Jan-95 250,000 $7.90 5-Feb-96 250,000 $11.90
* Deputy Managing Director in charge of finance, Mr. Wong came with Tose from Vickers.# Mr. Mercer was Group Legal Counsel.