The Role of Managed Futures Strategies Within Investment...
17
SSARIS Advisors, LLC ; A State Street Global Alliance Company SSARIS Advisors, LLC • Financial Centre • 695 East Main Street • Suite 102 • Stamford, CT 06901 Client Serv i c e :(203)328-7200 | Fax:(203)328-7299 | I n t e rn e t: www.ssaris.com | e m a i l:[email protected] | The Role of Managed Futures Strategies Within Investment Portfolios Presented By Mark Rosenberg Chairman and Chief Investment Officer YALE UNIVERSITY November 4, 2005
Transcript of The Role of Managed Futures Strategies Within Investment...

SSARIS Advisors, LLC ; A State Street Global Alliance Company
SSARIS Advisors, LLC • Financial Centre • 695 East Main Street • Suite 102 • Stamford, CT 06901Client Serv i c e :(203)328-7200 | F a x :(203)328-7299 | I n t e rn e t: w w w.ssaris.com | e m a i l:[email protected] |
The Role of Managed Futures StrategiesWithin Investment Portfolios
Presented By
Mark RosenbergChairman and Chief Investment Officer
YALE UNIVERSITYNovember 4, 2005

SSARIS Advisors, LLC ; A State Street Global Alliance Company
MARK ROSENBERG
Mark Rosenberg is Chairman ofthe Board and Chief InvestmentOfficer at SSARIS Advisors, LLC.SSARIS and its predecessor com-pany, RXR Capital Management,have combined to create ab-solute return investments thatprovide consistent performancewith return characteristics that
complement traditional portfolio assets since 1983.
Mr. Rosenberg has over 30 years experience in the in-vestment management industry and is widely recognizedas one of the founders of the managed futures industry.His first job was on the floor of the New York Stock Ex-change (NYSE), and subsequently the New York Mercan-tile Exchange (NYMEX), where he managed proprietarycapital using a variety of quantitative techniques for Weis,Voisen & Cannon, a private investment boutique.
In 1974, he joined Merrill Lynch & Co. and organized agroup that was responsible for managing hedging and al-ternative investment strategies for Merrill’s institutionalclients. This entity became the Financial Futures and Op-tions Group.
MARK ROSENBERG
In 1983, Mr. Rosenberg left Merrill and formed RXR,where he became increasingly focused on creating effi-cient portfolios using quantitative investment strategies.RXR was a Registered Investment Advisor and Commod-ity Trading Advisor and managed absolute return invest-ments including long/short equity, relative value fixed in-come and global macro strategies.
Mr. Rosenberg is responsible for all investment manage-ment and investment research initiatives at SSARIS. He isa fourth term Director of the Board of the Futures Indus-try Association (FIA), and on the board of the ManagedFutures Association (MFA), the leading hedge fund asso-ciation. He is also an arbiter for the National Futures As-sociation (NFA) and is a former member of the FinancialAdvisory Boards of both the Chicago Mercantile Ex-change (CME) and the Commodity Exchange, Inc.(COMEX). Mr. Rosenberg is also a former Director of theFoundation of Finance and Banking Research.
Mr. Rosenberg is involved in several community activities.He has donated time to Domus House, a refuge for aban-doned children, and various entrepreneurial projects tar-geting low-income families.
1SSARIS Advisors, LLC ; A State Street Global Alliance Company
Is it Prudent to Fund Fixed Liabilitieswith Equity Investments?
Fundamental Question

2SSARIS Advisors, LLC ; A State Street Global Alliance Company
Is it Prudent to Fund Fixed Liabilitieswith Equity Investments?
What if Equities Don’t Provide Investorsa Risk Premium over the Next Decade?
Fundamental Questions

3SSARIS Advisors, LLC ; A State Street Global Alliance Company
“Investing in Any Asset Classwith Absolute Returns and Low
Correlation to Other AssetsImproves the Risk / Reward
Characteristics of the Entire Portfolio”
Absolute Return

4SSARIS Advisors, LLC ; A State Street Global Alliance Company
Managed Futures
One of the Oldest Hedge Fund Strategies
Includes Commodities, Interest Rates, EquityIndexes and Foreign Exchange Markets
Relatively High Volatility
Non Correlated / Negatively Correlated
Regulated by the CFTC

5SSARIS Advisors, LLC ; A State Street Global Alliance Company
Philosophy
Markets are Efficient
Most of the Time,
But from Time to Time
They Become Irrational

6SSARIS Advisors, LLC ; A State Street Global Alliance Company
Risk Table 01/95 – 06/04
Compound ROR 11.48 %Standard Deviation 3.44 %Gain Deviation 2.11 %Loss Deviation 5.29 %Efficiency 3.19Skewness (2.73)Kurtosis 16.44
Largest Length Recovery Peak ValleyDrawdowns
(8.25) % 5 6 May-98 Oct-98(1.39) % 2 4 May-02 Jul-02(0.54) % 1 1 Jan-02 Feb-02(0.42) % 1 1 Aug-01 Sep-01(0.16) % 1 1 Oct-00 Nov-00
H I STO G R A M
• Sub Index Allocation
– 33% Equity Market Neutral
– 33% Relative Value
– 33% Event Driven
• Abnormal Kurtosis
• Tight Return Distribution (Less Volatile)
• Negative Skewness
(i.e. Negative Outlier)
Example Convergent Index
S o u rce: CSFB Tremont Index

7SSARIS Advisors, LLC ; A State Street Global Alliance Company
Risk Table 01/95 – 2Q03
Compound ROR 14.92 %Standard Deviation 15.27 %Gain Deviation 10.89 %Loss Deviation 8.10 %Sharpe (5.00%) 0.67Skewness 0.14Kurtosis 0.45
Managed Futures Portfolio / Divergent
Drawdown Length Recovery Peak Valley
(13.06) % 4 22 Sep-98 Jan-99(9.18) % 1 8 Jan-96 Feb-96(8.10) % 6 3 Oct-01 Apr-02(7.73) % 2 - Oct-02 Nov-02(6.00) % 5 2 Jan-98 Jun-98(5.77) % 3 2 Mar-01 Jun-01(4.63) % 1 4 Jul-97 Aug-97
H I STO G R A M
• Wide Return Distribution
• Positive Skewness

8SSARIS Advisors, LLC ; A State Street Global Alliance Company
Largest Length Recovery Peak ValleyDrawdowns
(4.61) % 7 5 Mar-98 Oct-98(2.31) % 1 0 Feb-04 Jun-04(1.72) % 1 2 Sep-02 Oct-02(1.37) % 1 2 Jan-96 Feb-96(1.33) % 1 2 Oct-01 Nov-01(1.26) % 1 1 Sep-99 Oct-99(1.08) % 1 2 Jan-02 Feb-02(1.06) % 4 1 Jul-97 Aug-97
Risk Table 01/95 – 06/04
Compound ROR 9.69 %Standard Deviation 4.46 %Gain Deviation 3.16 %Loss Deviation 2.63 %Efficiency 2.10Skewness (0.13)Kurtosis 0.51
• Sub Index Allocation
-75% Convergent
-25% Managed Futures
• Normal Return Distribution
• Skewness Approaching Zero
• Drawdowns Reduced
Convergent with Managed Futures
H I STO G R A M30
25
20
15
10
5
0- 2 . 6 % -1 . 9 % -1 . 2 % - 0 . 5 % - 0 . 2 % 0 . 9 % 1 . 6 % 2 . 2 % 2 . 9 % 3 . 6 % 4 . 3 % M o re
S o u rce: SSARIS Advisors, LLC
9SSARIS Advisors, LLC ; A State Street Global Alliance Company
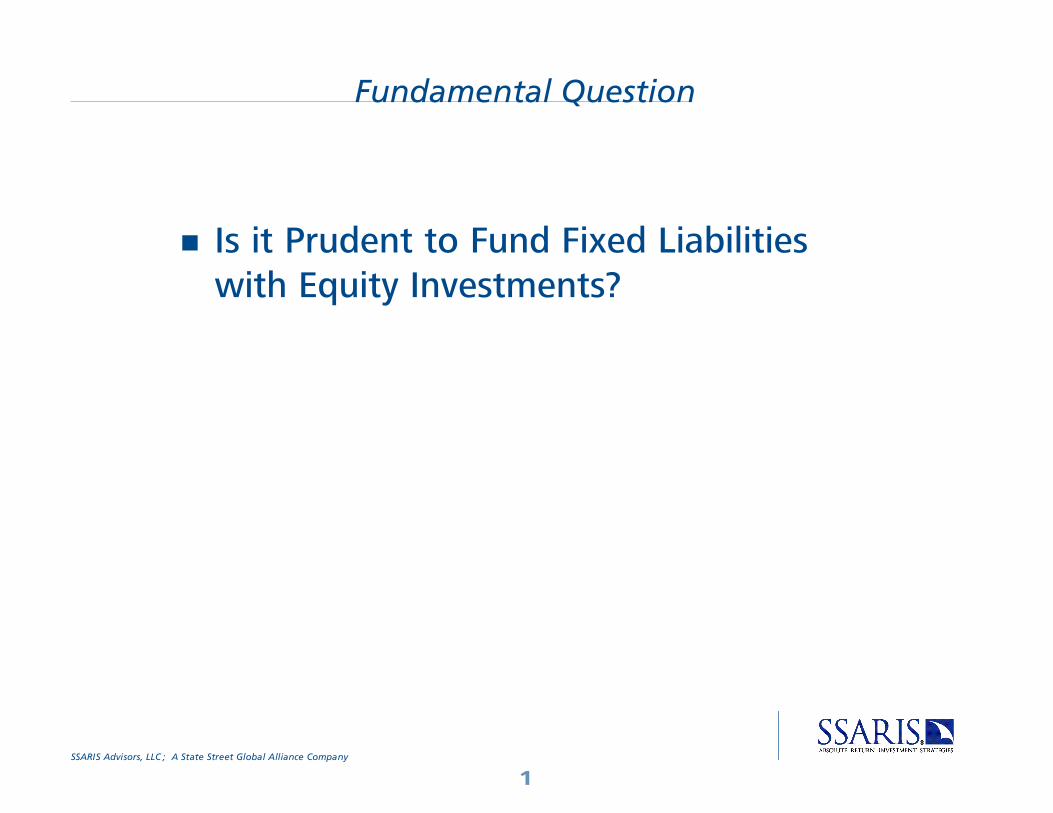
PE R F O R M A N C E I N A DE C L I N I N G ST O C K MA R K E T1
Period Managed Futures S&P 500
May ‘84 21.8% (6.7)%
Jul ‘86 (5.1)% (5.6)%
Sep ‘86 (14.4)% (8.3)%
Oct ‘87 (2.0)% (21.5)%
Nov ‘87 4.2% (8.2)%
Jan ‘90 3.8% (6.7)%
Aug ‘90 (1.9)% (9.0)%
Aug ‘97 (4.6)% (5.6)%
Aug ‘98 13.3% (14.5)%
Jan ‘00 2.3% (5.0)%
Sep ‘00 (4.2)% (5.3)%
Nov ‘00 3.8% (7.9)%
Feb ‘01 (2.5)% (9.1)%
Mar ‘01 11.1% (6.3)%
Aug ‘01 6.1% (6.3)%
Sep ‘01 5.5% (8.1)%
Apr ‘02 (1.7)% (6.1)%
Jun ‘02 7.0% (7.1)%
Jul ‘02 7.1% (7.8)%
Sep ‘02 5.7% (10.9)%
Dec ‘02 4.6% (5.9)%
Total 59.9% (170.7)%
1 Compares the S&P 500 Index in months where the Index declined by more than 5% since 1990.
Performance Comparisons
PERFORMANCE IN A DECLINING BOND MARKET1
Period Managed Futures LB LTG
May ‘83 34.9% (3.5)%
Jul ‘83 (15.8)% (4.9)%
May ‘84 21.8% (5.4)%
Feb ‘85 7.9% (4.7)%
May ‘86 0.8% (5.7)%
Sep ‘86 (14.4)% (3.7)%
Apr ‘87 37.3% (4.9)%
Sep ‘87 (1.1)% (4.4)%
Mar ‘88 (6.6)% (3.1)%
Jan ‘90 3.8% (3.6)%
Aug ‘90 (1.9)% (4.3)%
Jan ‘92 (5.7)% (3.1)%
Feb ‘94 (2.6)% (4.1)%
Mar ‘94 8.7% (4.4)%
Sep ‘94 4.4% (3.2)%
Feb ‘96 (9.2)% (4.9)%
Feb ‘99 8.3% (4.8)%
Nov ‘01 (7.3)% (4.8)%
Mar ‘02 1.3% (4.0)%
Jul ‘03 (1.4)% (9.2)%
Apr ‘04 (6.7)% (5.6)%
Total 56.5% (96.3)%1 Compares the Lehman Brothers Long Term Government Indexin months we Index declined by 3% or more since 1990.
Managed Futures is represented by a CTA Proxy
10SSARIS Advisors, LLC ; A State Street Global Alliance Company
Inefficiencies Exist Price Overshooting
I m p e rfect Information, Speculative Bubbles & Human Emotions (Fear, Greed, etc)
Hedgers Transferring Risk
Diversification Using Divergent Investment Te c h n i q u e s Convergent Strategies Focus on Overvalued / Undervalued Situations that
Tend to do Well During Periods of Stable or Declining Volatility
Divergent Strategies Capitalize on Prices that Serial Correlate During Periodsof Rising Volatility
Investment Philosophy

11SSARIS Advisors, LLC ; A State Street Global Alliance Company
A B P
Majority Owned by State Street Global Alliance (SSgA and ABP)Senior Partners of SSARIS Have a Direct Ownership Interest in the Firm
– Over $1 trillion under management
– Over $9 trillion under custody (State Street Bank and Trust)
– Largest European pension fund
– C150 billion in pension assets
– Fund of hedge funds advisor for SSgA
– $1 billion in pension, endowment and other
institutional assets
Clients Include Public and Corporate Pension Funds, Taft-Hartley and otherFinancial Institutions
A B P
SSARIS Advisors LLC

12SSARIS Advisors, LLC ; A State Street Global Alliance Company
Three Directional Models to Enter and Exit Trades Using Long, Neutral and Short Signals
- Intermediate Trend Following- Long-Term Trend Following- Intermediate Momentum
Tra i l i n g Stops Used on All Positions
Confirming “Strength of Buy /Sell Signal” to Deal with Intra-day Volatility
160 Markets Evaluated Annually for Inclusion in Portfolio
EVALUATION PROCESS MARKETS QUALIFYING1) CFTC Regulations and Market Liquidity . . . . . . . . . . . . . . . . . . . . . . . . . . . . . . . . . . . . . . . . . . . . . . . .80 Markets2) Consistency of Performance Using Three Model Approach . . . . . . . . . . . . . . . . . . .70 Markets3) Correlation Analysis to Reduce Concentration Risk . . . . . . . . . . . . . . . . . . . . . . . . . . . . . . .45 Markets
Positions are Equal Weighted Quarterly by Relative Value at Risk (VAR),and Adjusted Daily When Pre-determined Volatility Bands are Breached
Real-time Monitoring at Fund, Sector and Position Level
Investment Process

13SSARIS Advisors, LLC ; A State Street Global Alliance Company
Snapshot of Summary Risk Report:
[1] Mathematical summation of all individual open positions' absolute value of daily 5% VaR which calculated externally.
Return and Risk is Measured and Evaluated Daily Fund Level Sector Level Market Level
Risk Management

Absolute Return Investment Strategies
Competitive Advantages
Length of Performance History
Evaluation of Markets Profit Potential and Consistency
Before Including in Portfolio
Confirming Buy / Sell Signal to Reduce Intra-day Volatility
Using VAR to Equal Weight Positions in Portfolio to Avoid
Concentration Risk
Active Research and Risk Management Process
Shared Resources of State Street Global Advisors
Diversified Trading Program Summary

15SSARIS Advisors, LLC ; A State Street Global Alliance Company
– Thank You –