Journal of Financial Economics - Faculty...
25
Convertible bond arbitrage, liquidity externalities, and stock prices $ Darwin Choi a,1 , Mila Getmansky b,2 , Heather Tookes a, a Yale School of Management, P.O. Box 208000, New Haven, CT 06520-8000, USA b Isenberg School of Management, University of Massachusetts, 121 Presidents Drive, Room 308C, Amherst, MA 01003, USA article info Article history: Received 19 March 2007 Received in revised form 23 January 2008 Accepted 25 February 2008 Available online 25 November 2008 JEL classification: G12 G14 Keywords: Convertible bond arbitrage Liquidity Market efficiency Hedge funds abstract In the context of convertible bond issuance, we examine the impact of arbitrage activity on underlying equity markets. In particular, we use changes in equity short interest following convertible bond issuance to identify convertible bond arbitrage activity and analyze its impact on stock market liquidity and prices for the period 1993 to 2006. There is considerable evidence of arbitrage-induced short selling resulting from issuance. Moreover, we find strong evidence that this activity is systematically related to liquidity improvements in the stock. These results are robust to controlling for the potential endogeneity of arbitrage activity. & 2008 Elsevier B.V. All rights reserved. 1. Introduction Does arbitrage activity impact market quality? Although this question is not new, the proliferation of hedge funds in recent years has brought increasing attention to important questions regarding their impact on both liquidity and market efficiency (see, e.g., Secu- rities and Exchange Commission (SEC) Staff Report, 2003). In this paper, we focus on one particular strategy: convertible bond arbitrage. The growth in the issuance of the equity-linked debt securities can be attributed, at least in part, to the growing supply of capital provided by hedging strategies. Convertible bond issuance has in- creased more than sixfold in the past 15 years, from $7.8 billion in 1992 to $50.2 billion in 2006 (Securities Data Corporation (SDC), Global New Issues database). In fact, the widespread belief among Wall Street practitioners is that convertible bond arbitrage hedge funds purchase 70% to 80% of the convertible debt offered in primary markets. 1 Contents lists available at ScienceDirect journal homepage: www.elsevier.com/locate/jfec Journal of Financial Economics ARTICLE IN PRESS 0304-405X/$ - see front matter & 2008 Elsevier B.V. All rights reserved. doi:10.1016/j.jfineco.2008.02.008 $ We would like to thank Vikas Agarwal, Nick Bollen, Ben Branch, John Burke, Michael Epstein, Richard Evans, Shuang Feng, Laura Frieder, William Fung, Paul Gao, William Goetzmann, Robin Greenwood, Jennifer Jeurgens, Charles Jones, Nikunj Kapadia, Hossein Kazemi, Camelia Kuhnen, Owen Lamont, Laura Lindsay, David Modest, Sanjay Nawalkha, Thomas Schneeweis, Matthew Spiegel, Norman Wechsler, Rebecca Zarutskie, and seminar participants at Yale University, the Batten Young Finance Scholars Conference, UMASS-Amherst, the NBER Microstructure working group, and the FDIC/JFSR Bank Research Conference on Liquidity and Liquidity Risk for helpful discussions. We are extremely grateful to Paul Bennett and the NYSE for providing the short-interest data. We also thank Eric So for his assistance with the Nasdaq data and Scott Zhu for excellent research assistance. We are grateful to an anonymous referee for suggestions that greatly improved the paper. We thank the International Center of Finance at the Yale School of Management for its financial support. Any errors are our own. Corresponding author. Tel.: +1203 436 0785. E-mail addresses: [email protected] (D. Choi), msherman@ som.umass.edu (M. Getmansky), [email protected] (H. Tookes). 1 Tel.: +1203 432 5661. 2 Tel.: +1413 5773308; fax:1413 545 3858. 1 While they do not constitute the entire universe of convertible bond arbitrageurs, hedge funds are an important subset. Mitchell, Pedersen, and Pulvino (2007), report that convertible arbitrage funds account for 75% of the market. Similar estimates can be found in the popular press. See, e.g., a Wall Street Journal article (Pulliam, 2004) on convertible bond issuance in 2004: ‘‘As much as 80% of those issues were bought by hedge funds, according to brokers who work on Journal of Financial Economics 91 (2009) 227–251
Transcript of Journal of Financial Economics - Faculty...

ARTICLE IN PRESS
Contents lists available at ScienceDirect
Journal of Financial Economics
Journal of Financial Economics 91 (2009) 227–251
0304-40
doi:10.1
$ We
Burke,
William
Jeurgen
Kuhnen
Thomas
Zarutsk
Finance
working
and Liq
Paul Be
thank E
excellen
for sug
Interna
its finan� Cor
E-m
som.um1 Te2 Te
journal homepage: www.elsevier.com/locate/jfec
Convertible bond arbitrage, liquidity externalities, and stock prices$
Darwin Choi a,1, Mila Getmansky b,2, Heather Tookes a,�
a Yale School of Management, P.O. Box 208000, New Haven, CT 06520-8000, USAb Isenberg School of Management, University of Massachusetts, 121 Presidents Drive, Room 308C, Amherst, MA 01003, USA
a r t i c l e i n f o
Article history:
Received 19 March 2007
Received in revised form
23 January 2008
Accepted 25 February 2008Available online 25 November 2008
JEL classification:
G12
G14
Keywords:
Convertible bond arbitrage
Liquidity
Market efficiency
Hedge funds
5X/$ - see front matter & 2008 Elsevier B.V.
016/j.jfineco.2008.02.008
would like to thank Vikas Agarwal, Nick Bolle
Michael Epstein, Richard Evans, Shuang Fe
Fung, Paul Gao, William Goetzmann, Robin G
s, Charles Jones, Nikunj Kapadia, Hossein
, Owen Lamont, Laura Lindsay, David Modest
Schneeweis, Matthew Spiegel, Norman
ie, and seminar participants at Yale Universit
Scholars Conference, UMASS-Amherst, the N
group, and the FDIC/JFSR Bank Research Conf
uidity Risk for helpful discussions. We are ex
nnett and the NYSE for providing the short-in
ric So for his assistance with the Nasdaq dat
t research assistance. We are grateful to an
gestions that greatly improved the pape
tional Center of Finance at the Yale School o
cial support. Any errors are our own.
responding author. Tel.: +1203 436 0785.
ail addresses: [email protected] (D. Choi)
ass.edu (M. Getmansky), heather.tookes@yal
l.: +1203 432 5661.
l.: +1413 577 3308; fax:1413 545 3858.
a b s t r a c t
In the context of convertible bond issuance, we examine the impact of arbitrage activity
on underlying equity markets. In particular, we use changes in equity short interest
following convertible bond issuance to identify convertible bond arbitrage activity and
analyze its impact on stock market liquidity and prices for the period 1993 to 2006.
There is considerable evidence of arbitrage-induced short selling resulting from
issuance. Moreover, we find strong evidence that this activity is systematically related
to liquidity improvements in the stock. These results are robust to controlling for the
potential endogeneity of arbitrage activity.
& 2008 Elsevier B.V. All rights reserved.
1. Introduction
Does arbitrage activity impact market quality?Although this question is not new, the proliferation of
All rights reserved.
n, Ben Branch, John
ng, Laura Frieder,
reenwood, Jennifer
Kazemi, Camelia
, Sanjay Nawalkha,
Wechsler, Rebecca
y, the Batten Young
BER Microstructure
erence on Liquidity
tremely grateful to
terest data. We also
a and Scott Zhu for
anonymous referee
r. We thank the
f Management for
, msherman@
e.edu (H. Tookes).
hedge funds in recent years has brought increasingattention to important questions regarding their impacton both liquidity and market efficiency (see, e.g., Secu-rities and Exchange Commission (SEC) Staff Report, 2003).In this paper, we focus on one particular strategy:convertible bond arbitrage. The growth in the issuanceof the equity-linked debt securities can be attributed, atleast in part, to the growing supply of capital provided byhedging strategies. Convertible bond issuance has in-creased more than sixfold in the past 15 years, from $7.8billion in 1992 to $50.2 billion in 2006 (Securities DataCorporation (SDC), Global New Issues database). In fact,the widespread belief among Wall Street practitioners isthat convertible bond arbitrage hedge funds purchase 70%to 80% of the convertible debt offered in primary markets.1
1 While they do not constitute the entire universe of convertible
bond arbitrageurs, hedge funds are an important subset. Mitchell,
Pedersen, and Pulvino (2007), report that convertible arbitrage funds
account for 75% of the market. Similar estimates can be found in the
popular press. See, e.g., a Wall Street Journal article (Pulliam, 2004) on
convertible bond issuance in 2004: ‘‘As much as 80% of those issues
were bought by hedge funds, according to brokers who work on

ARTICLE IN PRESS
D. Choi et al. / Journal of Financial Economics 91 (2009) 227–251228
In order to clarify the intuition as to why convertiblebond arbitrage might impact liquidity in underlyingequity markets, it is useful to outline the basics of thestrategy. The aim of convertible bond arbitrage is toexploit mispricing in convertible bonds, usually by buyingan undervalued convertible bond (Henderson, 2005) andtaking a short position in the equity.2 A typical convertiblebond arbitrage strategy employs delta-neutral hedging, inwhich an arbitrageur buys the convertible bond and sellsshort the underlying equity at the current delta. There aretwo important components of the strategy (shown inFig. 1). The first is the initial position, which is set up sothat no profit or loss is generated from very smallmovements in the underlying stock price and where cashflows are captured from both the convertible bond’s yieldand the short position’s interest rebate. The second isdynamic hedging activity that follows the initial shortposition. If the price of the stock increases, the arbitrageuradds to the short position because the delta has increased.Similarly, when the stock price declines, the arbitrageurbuys stock to cover part of the short position due to thedecrease in delta. Aggregate equity market tradingdemand, in contrast, is expected to move in the oppositedirection. For example, Chordia, Roll, and Subrahmanyam(2002) show a positive correlation between stock returnsand order imbalances. This means that the dynamichedging activities of convertible bond arbitrageurs, a classof investors trading against net market demand, shouldimprove liquidity. This potentially positive role for hedgefunds and other convertible bond arbitrageurs is contraryto the view of a destabilizing role for arbitrageurs inmarkets (see Mayhew, 2000, for a survey of thisliterature).
Although we do not have direct data on convertiblebond arbitrage activity in individual stocks, we are able toidentify firms and dates on which we know that initialarbitrage positions are taken: convertible bond issuancedates. We use these initial positions as a proxy for thepresence of convertible bond arbitrageurs in the marketfor the stock (i.e., their future dynamic hedging). For theperiod 1993 to 2006, we calculate changes in shortinterest at issuance. Our approach is simple, yet itcaptures the strategy, as we observe large increases inshort interest near convertible debt offerings. The meth-odology allows us to use aggregate data to identify thepresence of a particular type of trader in equity markets.
Our proxy for arbitrage activity (initial change in shortinterest of issuing firms) has several advantages overusing hedge fund databases to estimate convertible bond
(footnote continued)
convertible-bond trading desks.’’ The Financial Times (Skorecki, 2004)
reports that hedge funds bought 70% of new issues in 2003 and that 95%
of trades in converts are made by hedge funds. The evidence presented in
this study of large increases in short selling near issuance is consistent
with that view.2 A convertible bond is a hybrid debt instrument: it is a bond that
may, at the option of the holder, be converted into stock at a specified
price for a given time period. Due to the conversion option, convertible
bond purchasers may profit from equity price gains, but they also have
downside protection since they are guaranteed bond payments (and, in
the event of bankruptcy, are senior to equity holders).
arbitrage activity. First, this provides a measure ofpositions taken by arbitrageurs in individual securities.Fund flows data in hedge fund databases are self-reportedand therefore provide an incomplete measure of con-vertible bond arbitrage activity. The databases onlypartially represent the hedge fund universe, with manylarge funds choosing not to participate. Second, there canbe style misclassification and funds reporting multiplestrategies to hedge fund databases. Third, even if wemeasured the assets of the funds perfectly, the positionswould still be unobservable due to the use of leverage.
We find considerable evidence of arbitrage activity(i.e., short selling in the stock at the date of bondissuance). We also find increased equity market liquidityfollowing bond issuance. Moreover, these liquidity im-provements are positively and significantly related to ourproxy for convertible bond arbitrage activity. We alsoobserve changes in stock return volatility. Followingconvertible debt issuance there is an average decrease intotal return volatility as well as the idiosyncratic compo-nent of volatility. However, we do not find evidence of asystematic relationship between convertible bond arbit-rage activity and these changes. We measure priceefficiency using return autocorrelation and variance ratios(as in Lo and MacKinlay, 1988), to capture the extent towhich stock prices follow a random walk. We do notobserve significant changes in either of these measuresfollowing issuance. Taken together, we interpret thefindings as evidence that convertible bond arbitrageactivity tends to positively affect equity markets; however,this is primarily through liquidity improvements, notthrough stock prices.
A critical aspect of the analysis is that we do notobserve arbitrage activity directly. Instead, we infer itbased on changes in short interest at bond issuance. Weconduct several tests to examine the validity of thisimportant assumption.3 First, we rule out the possibilitythat changes that we observe are due to changes inmarket-wide variables or to factors impacting firms withsimilar characteristics. We do this by conducting allanalyses based on changes relative to a set of controlfirms (matched on industry, exchange, size, book-to-market, and turnover). Second, it could be that the shortselling that we observe is due to valuation shortingresulting from news of the convertible bond issue, notdue to classic convertible bond arbitrage. In order toaddress this issue, we hand-collect announcement datesfor our sample of issues. The announcement and issuedates allow us to separate the impact of announcementperiod shorting versus issue period shorting, which weinterpret as valuation shorting versus convertible bondarbitrage, respectively. In all of these tests, we findevidence consistent with the view that the short sellingthat we observe near convertible bond issues is due toconvertible bond arbitrage. We also conduct robustnesstests, in which we explicitly control for other potentialsources of volume that can be associated with the
3 We thank an anonymous referee for encouraging this line of
inquiry.

ARTICLE IN PRESS
D. Choi et al. / Journal of Financial Economics 91 (2009) 227–251 229
convertible bond issue. In addition, we control forpotential endogeneity of arbitrage activity and find similarresults.
The main contribution of this paper is that we identifyarbitrage activity and are able to estimate its impact onmarket quality (we use changes in equity market liquidityand price efficiency as measures of quality). By identifyinga particular trader type, our methodology allows us toshed additional light on the mechanisms through whichquality changes following issuance occur. The primaryfindings suggest that changes in liquidity vary system-atically with the positions taken by arbitrageurs. Thefindings in this paper may be of interest to managers ofissuing firms concerned about liquidity and efficiencyspillovers in their stock as a result of their capitalstructure decisions.
This paper is organized as follows. Section 2 contains abrief review of related literature. Section 3 constructs themain hypotheses. Section 4 describes the data and sample.Section 5 presents the analysis of arbitrage activity,liquidity, and prices. Several robustness checks are alsopresented. Finally, Section 6 concludes.
2. Related literature
The notions of liquidity and efficiency ‘‘externalities’’underlie much of the analysis in this paper. The idea inRoss (1976) and subsequent theoretical works (e.g., Easley,O’Hara, and Srinivas, 1998; Biais and Hillion, 1994;Grossman, 1988) that the introduction of options marketscan enhance efficiency by making markets less incompleteor by positively impacting informativeness of stock priceshas been followed by empirical investigations of theimpact of derivatives markets on the market for theunderlying asset (e.g., Kumar, Sarin, and Shastri, 1998;DeTemple and Jorion, 1990).4 Mayhew (2000) provides anexcellent survey of this literature. The main findingsindicate that derivatives markets have a positive impacton liquidity and no negative impact on price efficiency.Most authors report a decrease in total volatility and anincrease in trading volume following the introduction ofoptions. We consider our study of the liquidity andefficiency externalities of convertible bond markets to bean extension of this line of research. Because of theembedded option in the convertible bond, the issuance ofconvertible bonds is analogous to the introduction ofoptions.5 Our identification (based on short selling) allowsus to provide a more direct test of the impact ofarbitrageurs. While prior work has provided evidencethat new securities markets can impact equity marketquality on average, we identify the mechanisms throughwhich quality changes occur.
4 More recently, Basak and Croitoru (2006) show how the presence
of arbitrageurs improves market quality and risk sharing in the context
of rational markets with heterogeneous risk-averse investors and short-
sales constraints.5 In fact, in unreported analysis, we find that the absence of put or
call options on a particular stock is associated with greater convertible
bond arbitrage activity. This confirms the idea that the existence of
substitute markets is critical in any trading decision.
Our basic empirical strategy uses increases in shortinterest near debt issuance to identify arbitrage activity.In that way, it is closely related to the growing empiricalliterature on short selling activity. There has beenconsiderable focus on the relationship between futurestock returns and both observed short sales and short-sales constraints (see, e.g., Diether, Lee, and Werner,2008; Boehme, Danielsen, and Sorescu, 2006; Asquith,Pathak, and Ritter, 2005; Jones and Lamont, 2002;Dechow, Hutton, Meulbroek, and Sloan, 2001; Asquithand Meulbroek, 1996). The information content of shortsales in event settings has also received attention in therecent empirical literature (e.g., Christophe, Ferri, andAngel, 2004). All of these papers provide evidence thatshort selling and short-sales constraints impact stockprices, suggesting that short sellers help to incorporatenegative information into prices.
Although short sellers can help facilitate the incor-poration of negative information into prices, many areuninformed. They use short sales to hedge other positions.Little has been done to distinguish this type of shortseller.6 This is an important distinction because theimpact of short selling on market quality will obviouslydepend largely on who is engaging in the short sale.Uninformed short sellers are likely to add liquidity tomarkets (rather than reduce it as a result of potentialadverse selection). Asquith, Pathak, and Ritter (2005,p. 270) note that, ‘‘Of course, a firm might have a highshort-interest ratio because there is both valuation short-ing, and arbitrage shorting taking place simultaneously.Unfortunately, we cannot identify these situations pre-cisely.’’ Our event-based approach takes us furthertowards identifying this specialized investment strategyfrom the aggregate data and distinguishing this activityfrom valuation shorting.
Three recent papers use changes in short interest nearevents to infer the impact of a particular type of trader.Arnold et al. (2005) use the Tax Payer Relief Act of 1997,which made selling short against the box more costly, as alaboratory for testing hypotheses regarding changes in theinformation content of short interest when tax-motivatedshort sellers (i.e., uninformed sellers) no longer haveincentives to short. This event-driven approach to traderidentification is similar in spirit to ours; however, weexamine not only average changes, but also cross-sectional implications of the introduction of a particulartrader type. That is, we examine the sensitivity ofsubsequent changes in liquidity and efficiency to themagnitude of the increase in short selling due to arbitrage.Mitchell, Pulvino, and Stafford (2004) use short interest inacquirers near merger announcements to identify activ-ities by risk arbitrageurs and estimate their impact onprices. Bechmann (2004) provides evidence that shortselling induced by hedging activities explains part ofthe stock price decline following convertible bond calls.
6 Boehmer, Jones, and Zhang (2008) use proprietary order-level data
from the NYSE to quantify the information content of the flow of
shorting activity by the type of account initiating the sale. Their focus is
on characterizing the information content of short sales, by size and
trader (account type).

ARTICLE IN PRESS
D. Choi et al. / Journal of Financial Economics 91 (2009) 227–251230
In both Bechmann (2004) and Mitchell, Pulvino, andStafford (2004), the focus is mainly on price pressureinduced by short selling activity while our focus is on theimpact of arbitrage on stock market liquidity and prices.
Although they do not constitute the entire universe ofconvertible bond arbitrageurs, convertible bond arbitragehedge funds do play a role in primary issues of convertibledebt and can impact stock market quality. Henderson(2005) studies the underpricing of convertible bonds atissue, as well as the risk and returns of the convertiblebond arbitrage strategy.7 He finds that new issues ofconvertible bonds are underpriced at issue but that excessreturns occur soon after issuance (mainly in the first sixmonths). This can decrease the presence of convertiblebond arbitrageurs over longer horizons.8 Mitchell, Pedersen,and Pulvino (2007) analyze the impact of capital outflowsin hedge funds on convertible bond prices. Finally, Choi,Getmansky, Henderson, and Tookes (2008) examinesupply and demand in the convertible bond market. Theymap the measure of arbitrage activity used in this paper tofund flows and returns in convertible bond arbitragehedge funds. Overall, findings in these papers suggest asignificant role for hedge funds in convertible bond andrelated markets.
3. Arbitrage, liquidity, and stock prices: predictions
This section outlines the main predictions. We measurechanges in short interest near convertible bond issuanceand relate this to changes in liquidity and stock priceefficiency. We test the following two null hypotheses:
H0 (LiquidityÞ: Convertible bond arbitrage activity,proxied by increased short interest near issuance, isuncorrelated with changes in liquidity.
H0 (Efficiency): Convertible bond arbitrage activity isuncorrelated with changes in efficiency.
The typical convertible bond arbitrage strategy (deltahedging) implies that arbitrageurs engaged in dynamichedging are likely to trade in the opposite direction of therest of the market: they increase their short positions asstock prices increase, and decrease them when stockprices decrease. This should result in improved marketliquidity (the alternative hypothesis).
The expected improvement in liquidity describedabove assumes that convertible bond arbitrageurs haveno special knowledge about the value of the underlyingshares. If they are instead privately informed about futurestock values, adverse selection costs can increase, andequity market liquidity can decrease. While it is anempirical question, we do not expect to observe evidenceof this because convertible bond arbitrageurs typically actto exploit perceived underpricing in the bond, not equity.
In addition to liquidity changes, convertible bondarbitrageurs can also impact the efficiency of equityprices. In theory, if the short selling that we identify in
7 The risks and rewards of liquidity provision by convertible bond
arbitrage hedge funds are studied in Agarwal, Fung, Loon, and Naik
(2007).8 This finding aids in defining windows used in our main analysis of
the potential impact of convertible bond activity.
the data is due to an informational advantage about equitymarket valuation, price efficiency would increase follow-ing issuance.9 Even if these short sellers are not privatelyinformed but are trading to exploit a known inefficiencysuch as autocorrelation, efficiency will also increasefollowing issuance.10 On the other hand, if short sellersare taking equity market positions primarily to hedgetheir positions in the bonds, then their presence wouldnot directly impact efficiency of stock prices. We con-jecture that although convertible bond arbitrageurs aresophisticated traders, they are relatively uninformed. Thatis, they have no private information about the value of theequity that they short. They are trading to manage equityrisk exposure, not to exploit mispricing.11 If this is thecase, we predict:
P1: Convertible bond arbitrage activity, proxied by theincrease in short interest near issuance, will be associatedwith improved market liquidity. This occurs via dynamichedging strategies, in which arbitrageurs’ trading activitytends to be in the opposite direction of the market.
P2: Convertible bond arbitrage activity will not impactthe efficiency of prices.
For a more precise interpretation of prediction P2, theanalysis will make a distinction between convertible bondarbitrage and other arbitrage activity (e.g., valuationshorts or exploitation of known autocorrelation). It maybe reasonable to expect short selling due to generalarbitrage activity to improve price efficiency; however,convertible bond arbitrageurs typically take their posi-tions to hedge their bond positions and thus, stock priceefficiency should not be affected.
In the empirical analysis, we use a variety of proxies forboth liquidity and price efficiency. For liquidity, weexamine: turnover, number of trades, the Amihud (2002)illiquidity measure, order imbalance (the absolute value ofthe difference between the number of buyer- and seller-initiated trades, classified based on Lee and Ready, 1991),quoted spread, quoted depth, and the ratio of spread todepth. High values for turnover, number of trades, anddepth are interpreted as high liquidity. Low values of theAmihud (2002) measure, order imbalance, spread, andspread=depth are interpreted as high liquidity. Thespread=depth measure is of interest because it reflectsboth the price (spread) and quantity (depth) aspects ofstock quotes and can provide more insight than examiningthese measures separately. The ratio of spread to depthhas also been used in prior work examining the impact ofa derivatives market for the quality of the underlyingstock market (see Kumar, Sarin, and Shastri, 1998). Forstock price efficiency, we use: (1) the variance ratio, whichcompares stock price variances over different frequencies,where smaller deviations from one imply greater effi-ciency12; and (2) autocorrelation, where smaller magni-tude of return autocorrelation is interpreted as greater
9 For example, see Diamond and Verrecchia (1987).10 We thank the referee for suggesting this possibility.11 Chakraborty and Yilmaz (2006) suggest convertible bonds as a
solution to adverse selection problems in the market for new securities
when investors are uninformed.12 See Lo and MacKinlay (1988).

ARTICLE IN PRESS
Table 1Issuing firms and characteristics.
This table presents summary statistics for the sample of convertible bond issues between July 1993 and May 2006. Market cap is the issuing firm’s
equity market capitalization. NYSE and Nasdaq are dummy variables, indicating where the issuing firm is listed. Debt/equity is the ratio of long-term debt
to equity market capitalization in the fiscal year prior to issuance. Daily dollar volume is the average daily dollar volume of the stock. Beta is the coefficient
estimate of the regression of daily stock excess returns on CRSP value-weighted market excess return. Issue size is the face value of the convertible bond
times its offer price. Short interest is the average monthly short interest. Institutional holdings/shares outstanding is the institutional holdings (by 13f
institutions) divided by shares outstanding in the calendar year end prior to issuance. Credit rating is the bond rating issued by S&P.a All daily and monthly
measures are calculated using data from the six months ending one month prior to announcement of the issue.
Number of observations ¼ 846.
Mean Median Standard deviation
Market cap ($ million) 4,687 1,179 13,457
NYSE 0.49 0 0.50
Nasdaq 0.51 1 0.50
Debt/equity 0.60 0.18 1.58
Daily dollar volume ($ million) 42.58 12.67 103.10
Beta 1.34 1.27 0.75
Issue size ($ million) 291.20 175.50 368.92
Issue size/market cap (%) 17.97 14.90 13.38
Short interest (000 shares) 5,497 2,152 14,753
Short interest/shares outstanding (%) 4.47 3.05 4.75
Institutional holdings/shares outstanding (%) 65.00 68.37 22.45
Credit rating BB BB-
aIf the bond is not rated by S&P, Moody’s or Fitch rating is used, in that order, as available. Of 846 bonds 444 are rated by at least one of the three agencies.
For calculating the mean and median credit rating, a number is assigned to each rating: best (AAA or Aaa) ¼ 1, second best ¼ 2, etc. Using this system,
mean rating ¼ 12:29, which lies between BB and BB- for S&P and Fitch (or Ba2 and Ba3 for Moody’s), median ¼ 13 (BB- or Ba3), standard
deviation ¼ 3:85. Only rated issues are included in the calculation.
D. Choi et al. / Journal of Financial Economics 91 (2009) 227–251 231
efficiency.13 We also examine long-run stock returnsfollowing bond issue. The latter is a test of efficiency inthat it asks whether the short-sales positions that weobserve in the data would make money over varioushorizons.
4. Data and sample selection
4.1. Short interest and convertible debt issues
The initial sample consists of all convertible debtissues (public, private, and Rule 144a) by U.S. publiclytraded firms for the period July 1993 through May 2006.14
Issue dates and other characteristics of the issues are fromthe SDC Global New Issues database and the MergentFixed Income Securities Database (FISD). We obtainmonthly short-interest data directly from the NYSE andNasdaq and match the short-interest data with the SDCdata using ticker and date identifiers. Because themonthly short-interest files reflect short sales throughthree trading days (five for the first years of the sample)prior to the 15th of each month, we calculate a trade date
13 In unreported tests, we examined two additional efficiency
measures: idiosyncratic volatility and R-squared. Results using these
two measures are similar to the other efficiency measures. The
distinction between idiosyncratic and systematic volatility is motivated
by Bris et al. (2007). They interpret an observed low R-squared as
evidence of efficiency. Similarly, we interpret an increase in idiosyncratic
volatility as evidence of improved price efficiency because it suggests
that more firm-specific information is incorporated into prices.14 We begin the analysis in 1993 because NYSE Trade and Quote
(TAQ) data are used to construct some of the liquidity and price-
efficiency measures.
for each file and use that date to match to the SDC data.15
We then match these data to the Center for Research inSecurity Prices (CRSP)/Compustat tapes and NYSE TAQDatabase. We also obtain data on institutional holdingsfrom the Thomson Financial Institutional (13f) Holdingsand analyst opinion from Institutional Brokers EstimateSystem (I/B/E/S). For inclusion in the final sample, werequire non-missing data on short interest, all liquidityand efficiency measures, and all control variables such asinstitutional holdings, analyst opinion, and historicalreturn volatility. This results in a final sample of 846convertible bond issues.
Table 1 contains summary statistics. The issuing firmshave a mean (median) market capitalization of $4.7 ($1.2)billion. The convertible bond issue sizes constitutesignificant proportion of equity value, with the mean(median) dollar value of proceeds equal to 18.0% (14.9%) ofequity market capitalization. The firms for which weobserve credit ratings are typically rated ‘‘junk,’’ withmedian Standard & Poor’s (S&P) rating of BB-. In addition,
15 It is critical to correctly match the short-interest dates to the issue
dates. The monthly short-interest data are based on short interest as of
trade dates that occur during the middle of the month at non-constant
days across months (due to settlement). Following the documentation
from the short-interest files that we received from Nasdaq and the NYSE,
we define the cutoff trade date for a given month as: five trading days
before the 15th (or the preceding trading day if the 15th is not a trading
day), through June 1995; and three trading days before the 15th after
June 1995. If a bond is issued before the cutoff trade date of a given
month, the short-interest data file for that month is matched to the issue
month. Otherwise, the short-interest data for the following month is
matched to the issue month. This algorithm is consistent with Bechmann
(2004).

ARTICLE IN PRESS
Initial hedge:buy bond and short stock(according to delta)
Time
Adjust short positionsaccording tochanges in delta
Issue date
Time
Fig. 1. Convertible bond arbitrage delta-neutral hedging. This figure presents the timing of a delta-neutral hedge, in which the convertible bond
arbitrageur buys a convertible bond and shorts the underlying stock according to the delta of the option embedded in the bond. As stock price changes
over time, the position must also be adjusted in order to maintain a delta-neutral hedge. The arbitrageur will sell short additional stock when the stock
price increases and buy/cover the short position as stock price declines.
D. Choi et al. / Journal of Financial Economics 91 (2009) 227–251232
the sample consists of about the same number of NYSEand Nasdaq issuers. We do observe some short selling inthese stocks prior to issuance and announcement, withmean (median) short interest during the six months priorto announcement equal to 4.5% (3.1%) of shares out-standing. This is relevant, as arbitrageurs are likely to beattracted to stocks for which a relatively liquid shortselling market exists.
4.2. Proxy for the presence of the convertible bond arbitrage
strategy
Our proxy for the presence of the convertible bondarbitrageurs is the change in short-interest intensity(‘‘DSI’’) during the month of the convertible bond issue.As discussed in Section 1, the typical convertible bondarbitrage strategy employs delta-neutral hedging, andconsists of two parts. The arbitrageur initially buys theconvertible bond and sells short the underlying equity atthe current delta. Next, if the price of the stock increases,the arbitrageur adds to the short position because the deltahas increased. Similarly, when the stock price declines, thearbitrageur buys stock due to the decrease in delta. Fig. 1provides a timeline. Importantly, dynamic hedging isexpected to improve liquidity because aggregate equitymarket trading demand is expected to move in theopposite direction (see Chordia, Roll, and Subrahmanyam,2002). We do not directly observe arbitrageurs’ dynamicshorting and covering transactions. Fortunately, theirinitial arbitrage positions can be reasonably captured sinceit is straightforward to identify the dates on which they areestablished. We expect the shares initially shorted byconvertible bond arbitrageurs to be a good proxy for post-issue dynamic hedging activity because it measures thepresence of arbitrageurs in the equity market. We initiallydefine two measures to proxy for arbitrage activity:
16 However (in unreported tests) we have replicated the analysis
� using DSI_%Issuet . All liquidity results are qualitatively similar (butweaker). The efficiency results are almost identical.17 Though it is true that short sellers can also short due to private
information (see, e.g., Christophe et al., 2004, for short selling prior to
earnings announcements) or other types of arbitrage activity, the fact
DSI_%Shroutt is the change in short interest (number ofshares) during period t, scaled by total shares out-standing in period t � 1. The change in short interest isthe difference between short interest in month t andshort interest during month t � 1.
that we capture the increase in shorting over a relatively short horizon
� relative to the bond issue date suggests that our DSI measures are, inlarge part, capturing convertible bond arbitrage. We explicitly distin-
guish valuation shorting from arbitrage shorting in an analysis of short
selling near announcement of the issue versus the actual issue date (see
the discussion in Sections 5.4).
DSI_%Issuet is the dollar value change in short interestduring the period t, divided by issue proceeds.
The first measure, DSI_%Shroutt provides a measure ofthe relative importance of the new arbitrageurs in the
market for the stock. The second measure, DSI_%Issuet , isrelated to issue characteristics—namely, the amount ofshort selling activity as a fraction of the issue size (whichcan be directly linked to hedging activity).
We do not expect convertible bond arbitrageurs to shortbefore the bond issue due to the risk associated with havingan unhedged stock position. Similarly, we do not expectthem to delay the initial hedge since the bond position willalso give them unhedged exposure to equity risk. Fig. 2reports means and medians of the DSI measures duringmonths �6 to þ6 relative to the issue date. Consistent withour ex ante expectation, the figures show that we arecapturing an increase in short interest related to the issue.The median increase in short interest relative to sharesoutstanding at issue month 0 (DSI_%ShrouttÞ is 1.7%. Themedian dollar value increase in short interest relative toissue size at issue month 0 (DSI_%IssuetÞ, is 13.1%.
As shown in the Fig. 2, both DSI_%Shroutt andDSI_%Issuet capture similar variation in short sellingactivity. The main analysis uses DSI_%Shroutt as a proxyfor convertible bond arbitrage activity due to our interestin the implications of convertible bond arbitrage for themarket for the underlying stock.16 In addition, we focus onthe issue month 0, given the large increase in short interestthat occurs at that time. For notational convenience, wedenote the proxy for convertible bond arbitrage activity asDSI (i.e., we drop both _%Shrout and the t subscript).17
Fig. 3 provides a description of the time series ofconvertible bond issuance and the size of convertiblebond arbitrage hedge funds. Issuance has steadily in-creased over time. We have also seen growth in the totalassets managed by convertible bond arbitrage hedgefunds, which is consistent with a role for hedge funds assuppliers of capital as discussed in Section 1. We alsoexamined the time series of changes in short interestduring the sample period and, not surprisingly, observe

ARTICLE IN PRESS
2.5%25%
MEAN CHANGE IN SHORT INTERESTDURING EVENT WINDOW
2.5%25%
MEDIAN CHANGE IN SHORT INTERESTDURING EVENT WINDOW
1.5%
2.0%
15%
20%
1.5%
2.0%
15%
20%
1.0%10%
ΔSI_
%IS
SU
Et
1.0%10%
ΔSI_
%IS
SU
Et
0.0%
0.5%
0%
5%
-6 -5 -4 -3 -2 -1 0 1 2 3 4 5 6 -6 -5 -4 -3 -2 -1 0 1 2 3 4 5 6
ΔSI_
%S
HR
OU
T t
0.0%
0.5%
0%
5%
ΔSI_
%S
HR
OU
T t
ΔSI_%Issuet
ΔSI_%Shroutt
ΔSI_%Issuet
ΔSI_%Shroutt
-0.5%-5%MONTH RELATIVE TO ISSUE
-0.5%-5%MONTH RELATIVE TO ISSUE
Fig. 2. Mean and median change in short interest ðnumber of observations ¼ 846Þ. The charts show the mean and median change in short interest during
the event window (months �6 to þ6). DSI_%Issuet is the dollar value of the change in short interest during month t, divided by issue size. That is:
difference between short interest in month t and short interest in month t � 1, times the closing stock price in month t, divided by issue size (face value of
the convertible bond times offer price). DSI_%Shroutt is the change in short interest during month t divided by the number of shares outstanding in month
t � 1. The sample period is from July 1993 to May 2006.
30
DOLLAR VALUE OF PROCEEDS
80
NUMBER OF ISSUES
25
60
70
15
20
40
50
10PR
OC
EE
DS
($ B
ILLI
ON
)
30NU
MB
ER
OF
ISS
UE
S
510
20
0
1994
Q1
1995
Q1
1996
Q1
1997
Q1
1998
Q1
1999
Q1
2000
Q1
2001
Q1
2002
Q1
2003
Q1
2004
Q1
2005
Q1
2006
Q1
0
1994
Q1
1995
Q1
1996
Q1
1997
Q1
1998
Q1
1999
Q1
2000
Q1
2001
Q1
2002
Q1
2003
Q1
2004
Q1
2005
Q1
2006
Q1
50
TOTAL ASSETS OF CONVERTIBLE BONDARBITRAGE HEDGE FUNDS
40
45
25
30
35
15
20
TOTA
L A
SS
ETS
($ B
ILLI
ON
)
5
10
0
1994
Q1
1995
Q1
1996
Q1
1997
Q1
1998
Q1
1999
Q1
2000
Q1
2001
Q1
2002
Q1
2003
Q1
2004
Q1
2005
Q1
2006
Q1
Fig. 3. Dollar value of proceeds, number of issues, and hedge fund size. The charts show the total dollar value of proceeds from convertible bonds, the
number of convertible bond issues, and the total assets of convertible bond arbitrage hedge funds from 1993 Q3 to 2006 Q2.
18 Convertible bonds often have call provisions; however, beginning
with Ingersoll (1977) the empirical evidence has suggested that firms
call too late. Further, callability should minimally impact our study over
D. Choi et al. / Journal of Financial Economics 91 (2009) 227–251 233
significant time-series variation in the data. Given thisobservation and findings in the literature of distinct time-series patterns in short interest (see, e.g., Lamont andStein, 2004), we include year and month fixed effects in allcross-sectional regression specifications.
In the main analysis of changes in liquidity and stockprice efficiency we examine a relatively short time
horizon in order to isolate the impact of the convertiblebond arbitrage strategy.18 Specifically, we examine

ARTICLE IN PRESS
Convertible bondarbitrage: initialhedge (buy bondand short stocks)
Convertible bondarbitrageurs:adjust shortpositionsValuation
shorts
Months+6X-6 X +1X-1 0
Issu
e
Ann
ounc
emen
t
Post-issueperiod
Pre-issueperiod
Fig. 4. Time intervals for short interest, liquidity, and stock price variables. This figure illustrates the time horizons over which changes in short interest,
liquidity, and stock price-efficiency variables are measured. The ‘‘post-issue period’’ is the six-month (120 trading days) period beginning one month
(20 trading days) after the bond issue (Day 0). The ‘‘pre-issue period’’ is the six-month (120 trading days) period ending one month (20 trading days) prior
to the announcement of the convertible bond issue (Day X).
D. Choi et al. / Journal of Financial Economics 91 (2009) 227–251234
changes in liquidity and efficiency from the pre-issueperiod to the post-issue period. The ‘‘post-issue’’ period isdefined as the six months (120 trading days) beginningone month (20 trading days) following the bond issue. The‘‘pre-issue’’ period is defined as the six months (120trading days) ending one month (20 trading days) prior tothe announcement of the bond. We skip the two monthsimmediately surrounding announcement and issuance incalculating pre- and post-issue liquidity and stock pricemeasures.19 We do this to avoid the direct impact oftraders establishing valuation and/or initial arbitragepositions. A timeline defining these windows of interestis given in Fig. 4.
As Fig. 4 shows, the initial delta hedge associatedwith buying the bond and shorting the stock is imple-mented at issuance. After the issue, arbitrage activityassociated with dynamic delta-hedging occurs. Note thatvaluation shorting is expected to occur near the an-nouncement (not the issuance) of the bond. Note also thatthe liquidity changes are expected to occur over anextended time period via the dynamic arbitrage activityfollowing issuance. Because this hedging activity isunobservable, we capture the initial positions taken bythe arbitragers (at t ¼ 0) to proxy for their presence in thepost-issue market for the stock. We relate this measure topost-issue liquidity changes.
(footnote continued)
the six-month horizon because callable bonds often have call protection
periods, generally greater than six months. See, e.g., Asquith (1995).19 The bond announcement dates are hand-collected. Of 846 issues,
the newswires suggest that 28 are issued before announcement (23 of
these are private issues). For these observations, the pre- and post-
periods are defined as: 120 trading days ending one month prior to
issuance and beginning one month following announcement, respec-
tively. Our results are not affected if we instead drop these 28 issues from
the sample.
5. Convertible bond arbitrage, liquidity, and stock prices
In this section, we examine links between changes inshort interest near issuance and equity market character-istics.
5.1. Summary of firm characteristics, by DSI portfolio
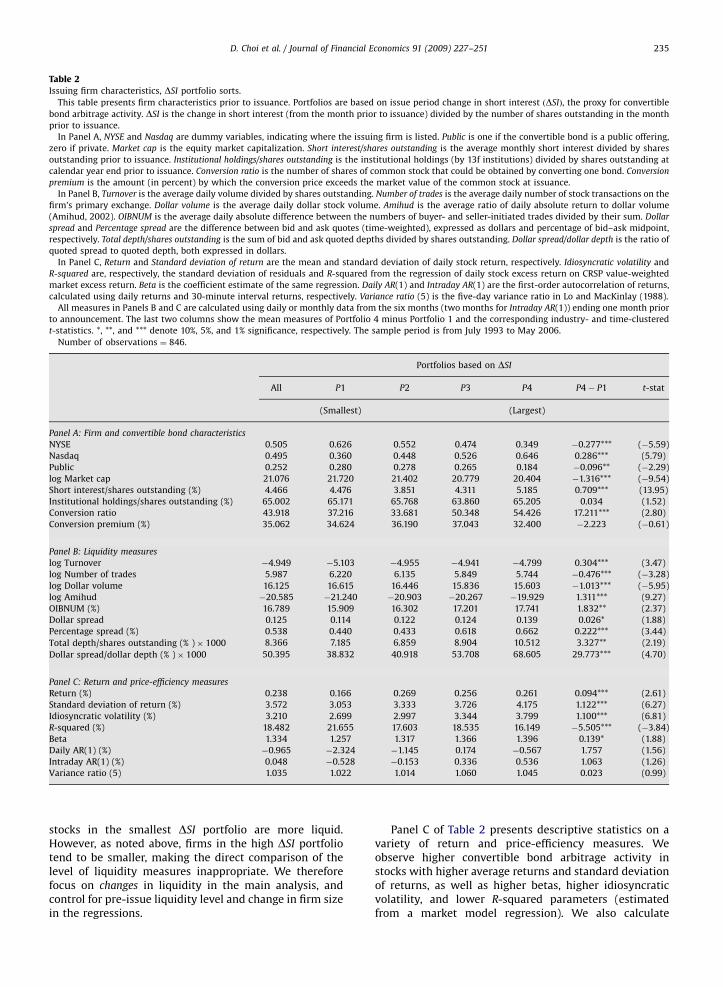
Table 2 provides summary statistics of all of the samplefirms prior to issuance.20 The column ‘‘All’’ describes thefull sample of issuers. We also divide the sample into fourportfolios based on the change in short interest at issue(the DSI measure) in order to provide some insight intothe types of issuers for which the convertible bondarbitrage strategy is most evident. Portfolio 1(4) corre-sponds to the smallest (largest) short-interest change.There are several relevant observations from Panel A ofthe table. First, Nasdaq stocks see the largest DSI followingissuance. Second, small issuers and private issues experi-ence higher DSI in their underlying stocks. Third,convertible bond arbitrage activity is higher in stocks thathave a high pre-issue short interest, indicating thatarbitrageurs choose issues where they believe they willhave the ability to short the stock. Finally, as would beexpected if convertible bond arbitrageurs are shortingshares to manage equity risk, the amount of short sellingat issuance is positively and significantly related to theconversion ratio (number of shares into which the bondcan be converted).
Panel B of Table 2 reports stock market liquiditymeasures. The number of trades, dollar volume, theAmihud (2002) illiquidity measure, order imbalance,spread, and spread-to-depth measures all indicate that
20 All measures are calculated using daily or monthly data from the
six months (two months for Intraday AR(1)) ending one month prior to
announcement of the bond issue.
ARTICLE IN PRESS
Table 2
Issuing firm characteristics, DSI portfolio sorts.
This table presents firm characteristics prior to issuance. Portfolios are based on issue period change in short interest ðDSIÞ, the proxy for convertible
bond arbitrage activity. DSI is the change in short interest (from the month prior to issuance) divided by the number of shares outstanding in the month
prior to issuance.
In Panel A, NYSE and Nasdaq are dummy variables, indicating where the issuing firm is listed. Public is one if the convertible bond is a public offering,
zero if private. Market cap is the equity market capitalization. Short interest/shares outstanding is the average monthly short interest divided by shares
outstanding prior to issuance. Institutional holdings/shares outstanding is the institutional holdings (by 13f institutions) divided by shares outstanding at
calendar year end prior to issuance. Conversion ratio is the number of shares of common stock that could be obtained by converting one bond. Conversion
premium is the amount (in percent) by which the conversion price exceeds the market value of the common stock at issuance.
In Panel B, Turnover is the average daily volume divided by shares outstanding. Number of trades is the average daily number of stock transactions on the
firm’s primary exchange. Dollar volume is the average daily dollar stock volume. Amihud is the average ratio of daily absolute return to dollar volume
(Amihud, 2002). OIBNUM is the average daily absolute difference between the numbers of buyer- and seller-initiated trades divided by their sum. Dollar
spread and Percentage spread are the difference between bid and ask quotes (time-weighted), expressed as dollars and percentage of bid–ask midpoint,
respectively. Total depth/shares outstanding is the sum of bid and ask quoted depths divided by shares outstanding. Dollar spread/dollar depth is the ratio of
quoted spread to quoted depth, both expressed in dollars.
In Panel C, Return and Standard deviation of return are the mean and standard deviation of daily stock return, respectively. Idiosyncratic volatility and
R-squared are, respectively, the standard deviation of residuals and R-squared from the regression of daily stock excess return on CRSP value-weighted
market excess return. Beta is the coefficient estimate of the same regression. Daily AR(1) and Intraday AR(1) are the first-order autocorrelation of returns,
calculated using daily returns and 30-minute interval returns, respectively. Variance ratio (5) is the five-day variance ratio in Lo and MacKinlay (1988).
All measures in Panels B and C are calculated using daily or monthly data from the six months (two months for Intraday AR(1)) ending one month prior
to announcement. The last two columns show the mean measures of Portfolio 4 minus Portfolio 1 and the corresponding industry- and time-clustered
t-statistics. *, **, and *** denote 10%, 5%, and 1% significance, respectively. The sample period is from July 1993 to May 2006.
Number of observations ¼ 846.
Portfolios based on DSI
All P1 P2 P3 P4 P4� P1 t-stat
(Smallest) (Largest)
Panel A: Firm and convertible bond characteristics
NYSE 0.505 0.626 0.552 0.474 0.349 �0.277*** (�5.59)
Nasdaq 0.495 0.360 0.448 0.526 0.646 0.286*** (5.79)
Public 0.252 0.280 0.278 0.265 0.184 �0.096** (�2.29)
log Market cap 21.076 21.720 21.402 20.779 20.404 �1.316*** (�9.54)
Short interest/shares outstanding (%) 4.466 4.476 3.851 4.311 5.185 0.709*** (13.95)
Institutional holdings/shares outstanding (%) 65.002 65.171 65.768 63.860 65.205 0.034 (1.52)
Conversion ratio 43.918 37.216 33.681 50.348 54.426 17.211*** (2.80)
Conversion premium (%) 35.062 34.624 36.190 37.043 32.400 �2.223 (�0.61)
Panel B: Liquidity measures
log Turnover �4.949 �5.103 �4.955 �4.941 �4.799 0.304*** (3.47)
log Number of trades 5.987 6.220 6.135 5.849 5.744 �0.476*** (�3.28)
log Dollar volume 16.125 16.615 16.446 15.836 15.603 �1.013*** (�5.95)
log Amihud �20.585 �21.240 �20.903 �20.267 �19.929 1.311*** (9.27)
OIBNUM (%) 16.789 15.909 16.302 17.201 17.741 1.832** (2.37)
Dollar spread 0.125 0.114 0.122 0.124 0.139 0.026* (1.88)
Percentage spread (%) 0.538 0.440 0.433 0.618 0.662 0.222*** (3.44)
Total depth/shares outstanding (% )� 1000 8.366 7.185 6.859 8.904 10.512 3.327** (2.19)
Dollar spread/dollar depth (% )� 1000 50.395 38.832 40.918 53.708 68.605 29.773*** (4.70)
Panel C: Return and price-efficiency measures
Return (%) 0.238 0.166 0.269 0.256 0.261 0.094*** (2.61)
Standard deviation of return (%) 3.572 3.053 3.333 3.726 4.175 1.122*** (6.27)
Idiosyncratic volatility (%) 3.210 2.699 2.997 3.344 3.799 1.100*** (6.81)
R-squared (%) 18.482 21.655 17.603 18.535 16.149 �5.505*** (�3.84)
Beta 1.334 1.257 1.317 1.366 1.396 0.139* (1.88)
Daily AR(1) (%) �0.965 �2.324 �1.145 0.174 �0.567 1.757 (1.56)
Intraday AR(1) (%) 0.048 �0.528 �0.153 0.336 0.536 1.063 (1.26)
Variance ratio (5) 1.035 1.022 1.014 1.060 1.045 0.023 (0.99)
D. Choi et al. / Journal of Financial Economics 91 (2009) 227–251 235
stocks in the smallest DSI portfolio are more liquid.However, as noted above, firms in the high DSI portfoliotend to be smaller, making the direct comparison of thelevel of liquidity measures inappropriate. We thereforefocus on changes in liquidity in the main analysis, andcontrol for pre-issue liquidity level and change in firm sizein the regressions.
Panel C of Table 2 presents descriptive statistics on avariety of return and price-efficiency measures. Weobserve higher convertible bond arbitrage activity instocks with higher average returns and standard deviationof returns, as well as higher betas, higher idiosyncraticvolatility, and lower R-squared parameters (estimatedfrom a market model regression). We also calculate

ARTICLE IN PRESS
D. Choi et al. / Journal of Financial Economics 91 (2009) 227–251236
autocorrelation of returns and variance ratios (see Lo andMacKinlay, 1988), which we use as measures of the degreeof price efficiency. Daily and intraday AR(1) parametersare calculated using daily returns and 30-minute intervalreturns, respectively. From the table we do not observe asignificant relationship between changes in short interestand these efficiency measures. This suggests that stockprice efficiency is not an important factor in convertiblebond arbitrage (as would be expected, if equity positionsare taken primarily to hedge equity risk).
5.2. Impact of convertible bond arbitrage on liquidity and
prices
5.2.1. Average changes, by DSI portfolio
In Table 3a, we present the changes in firm character-istics, sorted by portfolios based on change in shortinterest at issuance ðDSIÞ. The column ‘‘All’’ includes datafor the full sample of issuers and is presented forcomparability to previous studies of changes in liquidityand stock return volatility following the introduction ofderivatives markets. As in Table 2, the portfolio sortgroups issuers into Portfolios 1 through 4, which corre-spond to the smallest through largest issue-month short-interest changes. All changes in liquidity and stock pricevariables are defined as the post-issue period mean minusthe pre-issue period mean. Along with changes in shortinterest, we measure changes in the following liquidityproxies: share turnover, number of trades, dollar volume,the illiquidity measure developed by Amihud (2002),order imbalance (absolute difference between buyer- andseller-initiated trades), and time-weighted averagequotes.21 The Amihud (2002) measure is a proxy forKyle’s (1985) l and is defined as absolute return dividedby dollar volume.
We find strong evidence of an increase in liquiditybased on all measures following issuance, with theexception of quoted depth (which indicates a decrease inliquidity).22 Consistent with the prediction ðP1Þ, theseimprovements increase systematically with the proxy forarbitrage activity, DSI. For example, the change in (log)turnover for the largest DSI portfolio is 0.31 higher thanthat for the smallest DSI portfolio. Importantly, becausewe link liquidity changes to DSI, we provide directevidence of the impact of arbitrageurs on liquidity. Priorliterature on the impact of derivatives markets on stockmarkets shows only average changes in these variables(see, e.g., Mayhew, 2000, for a survey) and does notexamine systematic relationships with arbitrage activity.
For stock prices and efficiency, we examine thefollowing measures: average daily returns, standarddeviation of daily returns, idiosyncratic volatility,R-squared, beta, AR(1) parameters, and variance ratios.In regression analysis, we rely on the latter two variablesto capture changes in efficiency. If arbitrageurs impactstock price efficiency, then we would expect decreases in
21 We also examine opening quotes. Results are qualitatively similar.22 However, regression analysis (Table 4) shows that quoted depth
increases with arbitrage activity, after we control for other variables.
return predictability, as captured by the AR(1) parameters.Further, the variance ratio (Lo and MacKinlay, 1988)captures the extent to which stock prices follow a randomwalk. The standard deviation of returns is included inTable 3a so that we can compare the results with theempirical regularity of decreases in volatility following theintroduction of options markets. Beta and R-squared aremotivated by Bris et al. (2007).
The portfolio sorts presented in Panel B of Table 3asuggest that the impact of convertible bond arbitrage onstock price efficiency is very weak. Consistent with priorwork, we do find an average decrease in both total returnvolatility and the idiosyncratic component of volatilityfollowing convertible bond issuance. However, we do notfind evidence that these average declines vary system-atically with short selling activity. That is, there is noevidence that arbitrage is what is driving the declines.Average returns decrease after issuance and these decreasesare higher for the highest DSI portfolios, consistent with theobservation that returns decrease following announcementof convertible bond issues. Beta and R-squared bothincrease. We do not observe significant changes in theAR(1) parameters or variance ratios. Across DSI portfolios,the only systematic variation that we observe is in returnsand beta. Taken together, the results in Panel B of Table 3ado not indicate an impact of convertible bond arbitrage onstock price efficiency. Regression analysis (below) willfurther investigate these findings.
5.2.2. Control sample
It is possible that the liquidity results in Table 3a arebeing driven by market-wide changes in liquidity, ratherthan convertible bond arbitrage activity. To examine thispotentially important issue, we attempt to isolate changesdue to the convertible bond event by analyzing themeasures in Table 3a for a set of control firms. In Table3b, we examine the possibility that the results are drivenby the market-wide trends in general, rather thanconvertible bond arbitrage. To do this, we match firms inthe sample based on industry, exchange, size, market-to-book, and turnover before issuance. To identify thecontrol firms, we begin with all firms in the CRSP/Compustat database. From this initial sample the se-quence of identifying control firms proceeds as follows:
�
2
for e
contr
First, firms that have issued any convertible debtduring years �1 to þ1 relative to issue are eliminatedfrom the universe of potential control firms.
� Second, control firms must trade on the sameexchange as issuing firms (e.g., NYSE issuers arematched only to NYSE firms). This is done to eliminatepotential problems associated with exchange-relatedtrends in liquidity and stock price movements.
� Third, control firms must be in the issuing firm’sindustry, based on Fama and French (1997) industrycode.23
3 After filtering, the mean (median) number of valid control firms
ach issuing firm is 166 (101) and there are at least two potential
ol firms for each issuer.

ARTICLE IN PRESS
Table 3(a) Changes in firm characteristics.
This table presents the changes (from pre- to post-issue) in firm characteristics, by portfolios based on issue period change in short interest ðDSIÞ, the
proxy for convertible bond arbitrage activity. DSI is the change in short interest (from the month prior to issuance) divided by the number of shares
outstanding in the month prior to issuance. Changes in firm characteristics ðDÞ are defined as the average measure in post-issue period minus the pre-
issue period average measure. The ‘‘pre-issue period’’ is defined as the six months (two months for Intraday AR(1)) ending one month prior to
announcement. The ‘‘post-issue period’’ is the six months (two months for Intraday AR(1)) starting one month after issuance.
In Panel A, Short interest/shares outstanding is the average monthly short-interest level divided by shares outstanding. Turnover is the average daily
volume divided by shares outstanding. Number of trades is the average daily number of stock transactions on the firm’s primary exchange. Dollar volume is
the average daily dollar stock volume. Amihud is the average ratio of daily absolute return to dollar volume (Amihud, 2002). OIBNUM is the average daily
absolute difference between the numbers of buyer- and seller-initiated trades divided by their sum. Dollar spread and Percentage spread are the difference
between bid and ask quotes (time-weighted), expressed as dollars and percentage of bid–ask midpoint, respectively. Total depth/shares outstanding is the
sum of bid and ask quoted depths divided by shares outstanding. Dollar spread/dollar depth is the ratio of quoted spread to quoted depth, both expressed in
dollars.
In Panel B, Return and Standard deviation of return are the mean and standard deviation of daily stock return, respectively. Idiosyncratic volatility and
R-squared are, respectively, the standard deviation of residuals and R-squared from the regression of daily stock excess return on CRSP value-weighted
market excess return. Beta is the coefficient estimate of the same regression. jDaily ARð1Þj and jIntraday ARð1Þj are the absolute value of first-order
autocorrelation of returns, calculated using daily returns and 30-minute interval returns, respectively. jVariance ratioð5Þ � 1j is the absolute deviation of
the five-day variance ratio in Lo and MacKinlay (1988) from one.
The last column shows the mean measures of Portfolio 4 minus Portfolio 1. Industry- and time-clustered t-statistics of the changes and differences are
in parentheses. *, **, and *** denote 10%, 5%, and 1% significance, respectively. The sample period is from July 1993 to May 2006.
Number of observations ¼ 846.
Portfolios based on DSI
All P1 P2 P3 P4 P4� P1
(Smallest) (Largest)
Panel A: Changes in liquidity measures
DShort interest/shares outstanding (%) 2.371*** 0.181 1.233*** 2.598*** 5.465*** 5.284***
(17.90) (1.02) (8.44) (11.55) (19.27) (15.81)
Dlog Turnover 0.239*** 0.079*** 0.217*** 0.272*** 0.387*** 0.308***
(15.06) (3.25) (7.27) (9.41) (11.29) (7.35)
Dlog Number of trades 0.325*** 0.195*** 0.343*** 0.336*** 0.426*** 0.231***
(15.74) (6.52) (9.07) (9.67) (10.57) (4.60)
Dlog Dollar volume 0.441*** 0.241*** 0.436*** 0.510*** 0.574*** 0.333***
(15.88) (6.75) (9.37) (10.77) (9.13) (4.60)
Dlog Amihud �0.458*** �0.330*** �0.475*** �0.510*** �0.519*** �0.188**
(�17.02) (�8.55) (�11.52) (�11.20) (�8.05) (�2.51)
DOIBNUM (%) �1.041*** �0.893*** �0.924*** �0.961*** �1.385*** �0.492
(�7.07) (�3.72) (�3.26) (�3.57) (�4.58) (�1.27)
DDollar spread �0.021*** �0.022*** �0.017*** �0.019*** �0.027*** �0.006
(�7.40) (�4.30) (�3.21) (�4.42) (�4.70) (�0.77)
DPercentage spread (%) �0.134*** �0.081*** �0.105*** �0.188*** �0.160*** �0.079***
(�11.48) (�5.36) (�9.36) (�5.52) (�6.57) (�2.77)
DTotal depth/shares outstanding (% )� 1000 �0.712** �0.287 �0.192 �1.903 �0.467 �0.180
(�1.97) (�0.95) (�0.35) (�1.58) (�0.96) (�0.31)
DDollar spread/dollar depth (% )� 1000 �13.970*** �9.260*** �11.230*** �14.900*** �20.470*** �11.210***
(�14.06) (�5.21) (�6.18) (�7.46) (�9.61) (�4.04)
Panel B: Changes in return and price-efficiency measures
DReturn (%) �0.201*** �0.128*** �0.230*** �0.214*** �0.232*** �0.105**
(�11.70) (�4.26) (�7.76) (�6.83) (�5.91) (�2.12)
DStandard deviation of return (%) �0.250*** �0.341*** �0.183* �0.356*** �0.123 0.219
(�4.20) (�3.98) (�1.94) (�3.49) (�0.96) (1.42)
DIdiosyncratic volatility (%) �0.275*** �0.339*** �0.209** �0.358*** �0.193* 0.146
(�5.37) (�4.26) (�2.55) (�3.88) (�1.66) (1.04)
DR-squared (%) 2.309*** 1.678* 1.790** 2.152** 3.612*** 1.934
(4.48) (1.88) (2.10) (2.24) (3.66) (1.45)
DBeta 0.083*** 0.046 0.025 0.080* 0.180*** 0.135**
(3.06) (1.21) (0.47) (1.67) (3.41) (2.07)
DjDailyARð1Þjð%Þ �0.295 0.077 �0.419 �0.431 �0.406 �0.483
(�0.87) (0.11) (�0.58) (�0.66) (�0.61) (�0.50)
DjIntradayARð1Þjð%Þ 2.521 9.973 0.856 �0.276 �0.447 �10.420
(1.34) (1.34) (1.23) (�0.67) (�0.77) (�1.40)
DjVariance ratio ð5Þ � 1j ð%Þ �1.102 �0.584 �0.911 �2.490 �0.428 0.156
(�1.43) (�0.41) (�0.60) (�1.47) (�0.28) (0.07)
D. Choi et al. / Journal of Financial Economics 91 (2009) 227–251 237

ARTICLE IN PRESS
(b) Control firm results: changes in firm characteristics.
This table shows the changes (from pre- to post-issue) in issuing firm characteristics minus the changes in control firm characteristics. Portfolios are
based on issue period change in short interest ðDSIÞ, the proxy for convertible bond arbitrage activity. DSI is the change in short interest (from the month
prior to issuance) divided by the number of shares outstanding in the month prior to issuance. Control firms are matched based on size, book-to-market,
and turnover before issuance, exchange, and industry. Changes in firm characteristics ðDÞ are defined as the average measure in post-issue period minus
the pre-issue period average measure. The ‘‘pre-issue period’’ is defined as the six months (two months for Intraday AR(1)) ending one month prior to
announcement. The ‘‘post-issue period’’ is the six months (two months for Intraday AR(1)) starting one month after issuance.
In Panel A, Short interest/shares outstanding is the average monthly short interest of the stock divided by shares outstanding. Turnover is the average daily
volume divided by shares outstanding. Number of trades is the average daily number of stock transactions on the firm’s primary exchange. Dollar volume is
the average daily dollar stock volume. Amihud is the average ratio of daily absolute return to dollar volume (Amihud, 2002). OIBNUM is the average daily
absolute difference between the numbers of buyer- and seller-initiated trades divided by their sum. Dollar spread and Percentage spread are the difference
between bid and ask quotes (time-weighted), expressed as dollars and percentage of bid–ask midpoint, respectively. Total depth/shares outstanding is the
sum of bid and ask quoted depths divided by shares outstanding. Dollar spread/dollar depth is the ratio of quoted spread to quoted depth, both expressed in
dollars.
In Panel B, Return and Standard deviation of return are the mean and standard deviation of daily stock return, respectively. Idiosyncratic volatility and
R-squared are, respectively, the standard deviation of residuals and R-squared from the regression of daily stock excess return on CRSP value-weighted
market excess return. Beta is the coefficient estimate of the same regression. jDaily ARð1Þj and jIntraday ARð1Þj are the absolute value of first-order
autocorrelation of returns, calculated using daily returns and 30-minute interval returns, respectively. jVariance ratioð5Þ � 1j is the absolute deviation of
the five-day variance ratio in Lo and MacKinlay (1988) from one.
The last column shows the mean measures of Portfolio 4 minus Portfolio 1. Industry- and time-clustered t-statistics of the differences are in parentheses.
*, **, and *** denote 10%, 5%, and 1% significance, respectively. The sample period is from July 1993 to May 2006.
Number of observations ¼ 846.
Portfolios based on DSI
All P1 P2 P3 P4 P4� P1
(Smallest) (Largest)
Panel A: Liquidity measures (changes in issuing firm minus changes in control firm)
DShort interest/shares outstanding (%) 2.462*** 0.252 0.875*** 3.003*** 5.726*** 5.473***
(12.29) (1.22) (3.17) (5.80) (16.21) (13.38)
Dlog Turnover 0.209*** 0.048 0.184*** 0.223*** 0.379*** 0.331***
(10.09) (1.40) (4.44) (5.39) (8.84) (6.04)
Dlog Number of trades 0.162*** 0.041 0.185*** 0.134*** 0.289*** 0.248***
(7.66) (1.13) (4.36) (3.13) (6.41) (4.30)
Dlog Dollar volume 0.321*** 0.076 0.319*** 0.356*** 0.531*** 0.455***
(10.34) (1.53) (5.61) (5.46) (7.57) (5.29)
Dlog Amihud �0.334*** �0.123** �0.317*** �0.351*** �0.545*** �0.422***
(�11.45) (�2.46) (�6.13) (�5.74) (�8.12) (�5.04)
DOIBNUM (%) �0.370* 0.233 �0.643 �0.370 �0.696* �0.929
(�1.71) (0.58) (�1.48) (�0.85) (�1.65) (�1.60)
DDollar spread 0.001 0.001 0.001 0.005 �0.003 �0.004
(0.26) (0.18) (0.17) (0.72) (�0.47) (�0.47)
DPercentage spread (%) �0.045** 0.031 �0.063* �0.069 �0.077* �0.107**
(�2.42) (1.32) (�1.81) (�1.62) (�1.82) (�2.23)
DTotal depth/shares outstanding (% )� 1000 0.569 1.482 �0.942 �0.145 1.880 0.398
(0.48) (0.78) (�0.26) (�0.09) (1.05) (0.15)
DDollar spread/dollar depth (% )� 1000 �2.539 6.465* �1.668 0.931 �15.826*** �22.291***
(�1.30) (1.69) (�0.62) (0.19) (�3.96) (�4.04)
Panel B: Return and price-efficiency measures (changes in issuing firm minus changes in control firm)
DReturn (%) �0.102*** �0.032 �0.067 �0.152*** �0.155*** �0.124**
(�4.65) (�0.93) (�1.30) (�4.17) (�3.41) (�2.17)
DStandard deviation of return (%) �0.130* �0.079 0.032 �0.358*** �0.118 �0.039
(�1.77) (�0.90) (0.19) (�3.48) (�0.64) (�0.19)
DIdiosyncratic volatility (%) �0.142* �0.085 0.012 �0.354*** �0.142 �0.057
(�1.94) (�0.94) (0.07) (�3.23) (�0.76) (�0.28)
DR-squared (%) 0.757 0.165 0.588 1.014 1.259 1.094
(1.42) (0.16) (0.61) (1.00) (1.09) (0.71)
DBeta 0.002 �0.043 0.006 �0.058 0.104 0.147*
(0.07) (�1.03) (0.09) (�1.10) (1.60) (1.90)
DjDaily AR(1)j (%) �0.020 1.108 �0.671 �0.418 �0.097 �1.206
(�0.04) (1.16) (�0.66) (�0.46) (�0.09) (�0.86)
DjIntraday AR(1)j (%) 4.152 2.691 6.651 8.521 �1.240 �3.930
(1.40) (0.32) (1.22) (1.35) (�1.52) (�0.46)
DjVariance ratio (5) �1j (%) 0.026 1.652 �0.302 �1.506 0.259 �1.392
(0.02) (0.89) (�0.15) (�0.63) (0.11) (�0.45)
Table 3 (continued)
D. Choi et al. / Journal of Financial Economics 91 (2009) 227–251238

ARTICLE IN PRESS
D. Choi et al. / Journal of Financial Economics 91 (2009) 227–251 239
�
2
follow
mark
(med
Finally, for the remaining sample of potential controlfirms, we assign a score based on turnover, marketcapitalization, and book-to-market during year t � 1,where t is the issue year. For each potential controlfirm we calculate a
score ¼ absturnovert�1
issuer turnovert�1� 1
� ��
þ absmarket capt�1
issuer market capt�1� 1
� �
þabsbook-to-markett�1
issuer book-to-markett�1� 1
� ��.
The firm with the lowest score (i.e., average distancealong these three dimensions from the issuing firm) ischosen as the control firm.24
Results from the control sample are reported in Table3b. All results in Table 3b are presented as differences
between the issuers and control firms. From the table, it isclear that the liquidity results are robust to measuring thechanges relative to control firms. For stock price-efficiencymeasures we do not observe significant differencesbetween the issuing firms and control firms, suggestinglittle or no role in stock price efficiency for convertiblebond arbitrageurs. If convertible bond arbitrageurstake positions mainly to exploit mispricing in the bond(and not the stock), then this would be expected. Becauseit is important to control for market-wide effects, thechange variables in the analysis henceforth are presentedas deviations from control firms.
5.2.3. Regression analysis
We use an event study methodology to furthercharacterize the relationships among convertible bondarbitrage, liquidity, and stock prices. These tests are morerestrictive than the tests based on portfolio sorts in Tables3a and b; however, we would like to explicitly control forfactors other than DSI, issue period change in short-interest intensity. We use regression analysis to estimatethe impact of convertible bond arbitrage and other stockcharacteristics of issuing firm i on changes in liquidity andprice-efficiency measures.
DLiquidityi or DEfficiencyi
¼ aþ b1DSIi þ b2DMarket Capi þ b3DVolatilityi
þ b4DInstitutional Holdingsi þ b5Pre-Issue Pricei
þ b6NYSEi þ b7Publici þ b8DPrePosti
þX2006Apr
t¼1993Jul
b9tYearMonthDumi;t þ �i. (1)
Explanatory variables are defined below. All changevariables are calculated as deviations from control firms.
�
DSI is change in short interest (number of shares)divided by total shares outstanding. The change in4 The inputs to the score measure for a year t issue are calculated as
s: turnovert�1 is the average monthly turnover in year t � 1;
etcapt�1 and book-to-markett�1 are year-end values. The mean
ian) score of the 846 control firms is 0.241 (0.198).
liqu
ann
dat
short interest is the difference between short interestin the issue month and short interest in the previousmonth. This measure is a proxy for arbitrage activity.
� DMarket Cap is the change in (log) market capitaliza-tion, defined as (log) average daily shares outstandingtimes closing stock price. The change in marketcapitalization is calculated as post-period marketcapitalization minus pre-period capitalization.
� DVolatility (used in liquidity regressions only) is thechange in the standard deviation of daily returns.
� DInstitutional Holdings is the change in institutionalholdings (shares held by 13f institutions) divided bytotal shares outstanding. The change is calculated asthe holdings at the issuing calendar year end minus theholdings at the prior calendar year end.
� Pre-Issue Price is the average (log) price during the pre-issue period.
� NYSE is a dummy variable, equal to one if the firm islisted on NYSE and zero otherwise.
� Public is a dummy variable, equal to one if theconvertible bond is a public offering, and zero other-wise.
� DPrePost is the number of days between the pre- andthe post-issue period.25
�
YearMonthDumt are year and month fixed effects,indicating timing of the convertible bond issue.The estimated coefficient on DSI is of primary interest.We expect to observe a positive role for DSI in liquiditychanges (Prediction P1) and no impact of DSI on changesin price efficiency (Prediction P2). Control variablesinclude changes in size, stock return volatility, andinstitutional holdings (a proxy for the supply of sharesto short sellers). We also control for changes in volatilityin the liquidity regressions due to relationships found inthe literature. For example, Pastor and Stambaugh (2003)find correlation of 0.57 between market illiquidity andvolatility. Spiegel and Wang (2005) report high correlationbetween idiosyncratic volatility and liquidity (i.e., liquid-ity produces perfect volatility sorts for a cross-section ofstocks). We anticipate more room for marginal liquidityimprovements in less-liquid stocks, so pre-issue price isincluded as a proxy for liquidity level (price and liquidityare negatively correlated; higher-priced stocks have lowerspreads due to the fixed component). We also allow forvariation based on exchange and whether an issue ispublic or private (e.g., liquidity of the bond issue might behigher for public issues), and we also include time effects.
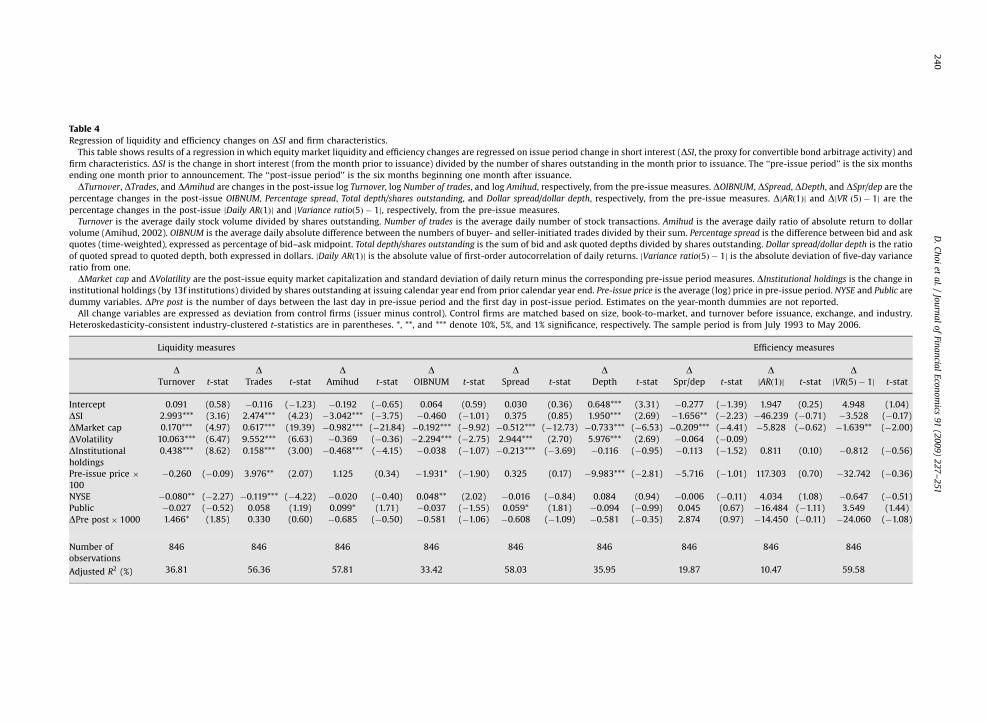
The main results are presented in Table 4. All standarderrors are heteroskedasticity-consistent and include in-dustry clustering based on Fama and French (1997)industry definitions. The proxy for convertible bondarbitrage activity ðDSIÞ is significantly and positivelyrelated to liquidity improvements based on five of theseven liquidity measures: number of trades, turnover,
25 In order to separate the potential impact of the announcement on
idity and efficiency variables, we skip the 20 trading days prior to the
ouncement of the issue through 20 trading days following the issue
e.
ARTIC
LEIN
PRESS
Table 4
Regression of liquidity and efficiency changes on DSI and firm characteristics.
This table shows results of a regression in which equity market liquidity and efficiency changes are regressed on issue period change in short interest (DSI, the proxy for convertible bond arbitrage activity) and
firm characteristics. DSI is the change in short interest (from the month prior to issuance) divided by the number of shares outstanding in the month prior to issuance. The ‘‘pre-issue period’’ is the six months
ending one month prior to announcement. The ‘‘post-issue period’’ is the six months beginning one month after issuance.
DTurnover, DTrades, and DAmihud are changes in the post-issue log Turnover, log Number of trades, and log Amihud, respectively, from the pre-issue measures. DOIBNUM, DSpread, DDepth, and DSpr/dep are the
percentage changes in the post-issue OIBNUM, Percentage spread, Total depth/shares outstanding, and Dollar spread/dollar depth, respectively, from the pre-issue measures. DjARð1Þj and DjVR ð5Þ � 1j are the
percentage changes in the post-issue jDaily ARð1Þj and jVariance ratioð5Þ � 1j, respectively, from the pre-issue measures.
Turnover is the average daily stock volume divided by shares outstanding. Number of trades is the average daily number of stock transactions. Amihud is the average daily ratio of absolute return to dollar
volume (Amihud, 2002). OIBNUM is the average daily absolute difference between the numbers of buyer- and seller-initiated trades divided by their sum. Percentage spread is the difference between bid and ask
quotes (time-weighted), expressed as percentage of bid–ask midpoint. Total depth/shares outstanding is the sum of bid and ask quoted depths divided by shares outstanding. Dollar spread/dollar depth is the ratio
of quoted spread to quoted depth, both expressed in dollars. jDaily ARð1Þj is the absolute value of first-order autocorrelation of daily returns. jVariance ratioð5Þ � 1j is the absolute deviation of five-day variance
ratio from one.
DMarket cap and DVolatility are the post-issue equity market capitalization and standard deviation of daily return minus the corresponding pre-issue period measures. DInstitutional holdings is the change in
institutional holdings (by 13f institutions) divided by shares outstanding at issuing calendar year end from prior calendar year end. Pre-issue price is the average (log) price in pre-issue period. NYSE and Public are
dummy variables. DPre post is the number of days between the last day in pre-issue period and the first day in post-issue period. Estimates on the year-month dummies are not reported.
All change variables are expressed as deviation from control firms (issuer minus control). Control firms are matched based on size, book-to-market, and turnover before issuance, exchange, and industry.
Heteroskedasticity-consistent industry-clustered t-statistics are in parentheses. *, **, and *** denote 10%, 5%, and 1% significance, respectively. The sample period is from July 1993 to May 2006.
Liquidity measures Efficiency measures
D D D D D D D D DTurnover t-stat Trades t-stat Amihud t-stat OIBNUM t-stat Spread t-stat Depth t-stat Spr/dep t-stat jARð1Þj t-stat jVRð5Þ � 1j t-stat
Intercept 0.091 (0.58) �0.116 (�1.23) �0.192 (�0.65) 0.064 (0.59) 0.030 (0.36) 0.648*** (3.31) �0.277 (�1.39) 1.947 (0.25) 4.948 (1.04)
DSI 2.993*** (3.16) 2.474*** (4.23) �3.042*** (�3.75) �0.460 (�1.01) 0.375 (0.85) 1.950*** (2.69) �1.656** (�2.23) �46.239 (�0.71) �3.528 (�0.17)
DMarket cap 0.170*** (4.97) 0.617*** (19.39) �0.982*** (�21.84) �0.192*** (�9.92) �0.512*** (�12.73) �0.733*** (�6.53) �0.209*** (�4.41) �5.828 (�0.62) �1.639** (�2.00)
DVolatility 10.063*** (6.47) 9.552*** (6.63) �0.369 (�0.36) �2.294*** (�2.75) 2.944*** (2.70) 5.976*** (2.69) �0.064 (�0.09)
DInstitutional
holdings
0.438*** (8.62) 0.158*** (3.00) �0.468*** (�4.15) �0.038 (�1.07) �0.213*** (�3.69) �0.116 (�0.95) �0.113 (�1.52) 0.811 (0.10) �0.812 (�0.56)
Pre-issue price �
100
�0.260 (�0.09) 3.976** (2.07) 1.125 (0.34) �1.931* (�1.90) 0.325 (0.17) �9.983*** (�2.81) �5.716 (�1.01) 117.303 (0.70) �32.742 (�0.36)
NYSE �0.080** (�2.27) �0.119*** (�4.22) �0.020 (�0.40) 0.048** (2.02) �0.016 (�0.84) 0.084 (0.94) �0.006 (�0.11) 4.034 (1.08) �0.647 (�0.51)
Public �0.027 (�0.52) 0.058 (1.19) 0.099* (1.71) �0.037 (�1.55) 0.059* (1.81) �0.094 (�0.99) 0.045 (0.67) �16.484 (�1.11) 3.549 (1.44)
DPre post� 1000 1.466* (1.85) 0.330 (0.60) �0.685 (�0.50) �0.581 (�1.06) �0.608 (�1.09) �0.581 (�0.35) 2.874 (0.97) �14.450 (�0.11) �24.060 (�1.08)
Number of
observations
846 846 846 846 846 846 846 846 846
Adjusted R2 (%) 36.81 56.36 57.81 33.42 58.03 35.95 19.87 10.47 59.58
D.
Ch
oi
eta
l./
Jou
rna
lo
fFin
an
cial
Eco
no
mics
91
(20
09
)2
27
–2
512
40

ARTICLE IN PRESS
D. Choi et al. / Journal of Financial Economics 91 (2009) 227–251 241
Amihud, depth, and spread=depth. We do not observesystematic variation of DSI with either order imbalance orspread. The spread result is somewhat puzzling becausethis measure showed significant changes based onportfolio sorts; however, change in market capitalizationalready captures a price change, and therefore thecoefficient on percentage spread (change in spreaddivided by price) in the regression equation may pick upchanges in dollar spread, rather than percentage spread.Importantly, the spread=depth measure, a more completemeasure of the quality of the quote than spread or depthalone, suggests a significant relationship between con-vertible bond arbitrage activity and liquidity improve-ments. Although it is not the main focus of the analysis, itis also interesting to note that liquidity increases withincreases in institutional holdings, market capitalization,and volatility. Neither of the price-efficiency measures arerelated to DSI. We interpret this as evidence that thesetraders do not enhance efficiency and simply providesupply to equity markets, as in the prediction ðP2Þ.26 In thenext section, we provide another returns-based efficiencytest.
An assumption underlying much of the analysis in thispaper is that the change in short interest near issuance isdue to convertible bond arbitrage activity, which we donot directly observe. It is possible that the observed shortselling near issuance is being driven by valuation shorting.We attempt to separate other possible explanations of theobserved short selling by conducting several tests ofwhether the data are consistent with convertible bondarbitrage. First, we examine long-run stock returnsfollowing issuance. If the increase in short interest isdue to valuation shorting, we would expect short sellers tomake money from their positions. We then conduct asecond test using hand-collected announcement dates forthe sample of issuers to isolate the impact of convertiblebond announcement- versus issue-period shorting, whichwe interpret as valuation shorting and convertible bondarbitrage, respectively. The basic intuition is that valua-tion short sellers will be able to trade at the announce-ment of the bond, whereas convertible bond arbitrageurswill not short until the actual issue of the bond. This isdone in order to avoid stock exposure that would result ifconvertible bond arbitrageurs took short equity positions
26 In addition to the control firms identified according to the
procedure outlined in Section 5.2.2, we conduct robustness checks
based on two ‘‘issue matches.’’ We match convertible bond issuers to a
sample of straight-debt issuers (matched by exchange, industry, size,
book-to-market, and issue size). The basic aim is to distinguish the effect
of convertible bond issuance from a general increase in leverage. Results
are similar to those in Table 4: we find that DSI is positively and
significantly related to increases in turnover and number of trades; and
DSI is negatively and significantly related to both spread and Amihud
(2002) illiquidity measure. In our second ‘‘issue match,’’ we match
convertible bond issuers to firms issuing seasoned equity because
purchasers of the equity issue would not need to manage a short
inventory, as is the case for convertible bond arbitrage. Results are
similar to those in the straight-debt analysis. In general, we find that the
impact of DSI is somewhat stronger in these robustness checks than in
the main analysis. Detailed results and the matching procedure are
available upon request. We thank William Fung for encouraging the
equity issuer robustness check.
prior to issuance. The results of these tests are consistentwith short selling due to convertible bond arbitrage andare presented below.
5.3. Long-run returns
As a final efficiency check, we test whether shortsellers make money from their equity market positions.The primary goal is to shed further light on thepossibilities noted in Section 3, that issue-period shortsellers are either: (1) privately informed about the value ofthe underlying equity or (2) that they exploit known priceinefficiencies such as return autocorrelation. Evidence ofnegative long-run returns following issuance would beconsistent with these possibilities. A finding of noabnormal returns following issuance would be consistentwith prediction P2, that convertible bond arbitrageurs donot play a role in stock price efficiency.
Results are presented in Table 5 and are consistentwith the findings for the other efficiency measures: thereis no evidence that issue-period short sellers make moneyfrom their positions; however, we do observe a signifi-cantly negative return of �1:30% per day betweenannouncement and issue date (when they are at leasttwo trading days apart). Therefore, it may be thatvaluation shorts make money based on positions takenat the announcement of the issue (Day X in Fig. 4), whileshort sellers engaged in convertible bond arbitragestrategies take positions near issuance (Day 0 in Fig. 4)and do not earn abnormal returns from equity positions.Importantly, this also implies that there is no evidencethat valuation shorts will have incentive to maintain theirshort positions following issuance and are unlikely toimpact post-issuance liquidity changes that we observe inthe main analysis. This is because abnormal returns fromthe short positions occur only between announcementand issuance.
Table 5 also suggests that there may be importantdifferences between short selling observed on announce-ment versus issue dates. These differences might providepowerful identification for the type of short selling (i.e.,convertible bond arbitrage versus other types of arbitrage)that we are observing in the data. In the next section, wedelve deeper into this question by using the data onannouncement dates. This allows us to separate theimpact of short selling due to the market’s knowledgethat the bond is being issued from actual convertible bondarbitrage (which would be more likely to coincide withthe issue itself).
5.4. Robustness analysis: convertible bond arbitrage versus
valuation shorts
Because we do not observe convertible bond arbitrageactivity directly, we face the challenge that we may bepicking up the impact of short selling on liquidity andefficiency due to some other factor. A particular concern isvaluation short selling due to news that the firm is raisingconvertible debt. In order to address this issue, we hand-collect announcement dates of all convertible bond issues

ARTICLE IN PRESS
Table 5Long-run returns.
This table summarizes post-issuance and post-announcement returns over 6-, 12-, 18-, and 24-month horizons. In Panels A and B, Cumulative return is
the average holding period return from long stock positions starting after market close on the convertible bond issue date and announcement date,
respectively. Panel C shows the average daily return of issuers and control firms between market close on announcement date and the trading day prior to
issue date, for issues that are announced at least two trading days prior to issuance. Control firms are matched based on size, book-to-market, and
turnover before issuance, exchange, and industry. Industry- and time-clustered t-statistics of the differences in returns are in parentheses. *** denotes 1%
significance. The sample period is from July 1993 to May 2006.
Number of observations ¼ 846.
Cumulative return (not annualized) Issue date þ6 months þ12 months þ18 months þ24 months
Panel A: Long-run returns after issuance
Issuing firm 6.57% 9.22% 12.24% 16.53%
Control firm 5.47% 8.85% 13.68% 17.66%
Difference 1.10% 0.37% �1.44% �1.13%
t-stat (0.58) (0.13) (�0.41) (�0.31)
Cumulative return (not annualized) Announcement date þ6 months þ12 months þ18 months þ24 months
Panel B: Long-run returns after announcement
Issuing firm 3.94% 6.64% 9.73% 13.82%
Control firm 6.26% 10.16% 14.00% 18.31%
Difference �2.32% �3.52% �4.27% �4.49%
t-stat (�1.14) (�1.14) (�1.21) (�1.21)
Number of observations ¼ 348.
Panel C: Returns between announcement and issuance
Average daily return between announcement and issue dates
Issuing firm �1.30%
Control firm 0.13%
Difference �1.43%***
t-stat (�6.80)
Average number of trading days 10.21
D. Choi et al. / Journal of Financial Economics 91 (2009) 227–251242
in the sample.27 We identify 132 issues for which theannouncement date and the issue date are such that theobserved change in short interest for announcement andissuance occur during different short-interest reportingmonths. This allows us to clearly separate valuationshorting from convertible bond arbitrage. Table 6 presentsthe results of analysis for this subsample. The findings areconsistent with the main regressions in Table 4. With theexception of depth and spread-to-depth, all liquiditychanges that are significantly related to the proxy forconvertible bond arbitrage in the main analysis are alsosignificant in this subsample analysis. Most important,changes in short interest during the announcementmonth ðDSI_AnnouncementÞ are not significantly relatedto any observed liquidity and efficiency changes.
5.5. Robustness analysis: potential endogeneity of arbitrage
It is possible that convertible bond arbitrageurs areattracted to stocks for which they expect increases inliquidity. While our prior is that the direction of thecausality runs from the arbitrageurs, we explicitly accountfor potential simultaneity by estimating a simultaneous
27 We use Lexis-Nexis and Factiva news searches to identify the
earliest date on which the bond issue is mentioned in the news.
equations model of both changes in market quality andshort-interest changes. We estimate the following system:
DLiquidityi
¼ aþ b1DSIIVi þ b2DMarket Capi þ b3DVolatilityi
þ b4DInstitutional Holdingsi þ b5Pre-Issue Pricei þ b6NYSEi
þ b7Publici þ b8DPrePosti þX2006Apr
t¼1993Jul
b9tYearMonthDumi;t þ �i
(2)
and
DSIi ¼ aþ b1DLiquidityIVi þ b2Dollar Volumei þ b3Volatilityi
þ b4Institutional Holdingsi þ b5Dividendsi
þ b6Conversion Premiumi
þ b7NYSEi þ b8Publici þ b9DPrePosti
þX2006Apr
t¼1993Jul
b10tYearMonthDumi;t þ �i.
(3)
As in Table 4, all change variables are calculated asdeviations from firm i’s control firm in order to control formarket-wide trends in the variables of interest. Theexplanatory variables in the liquidity change regressionsare identical to those in Table 4, except DSIIV
i isinstrumented. Similarly, liquidity change variables are

ARTIC
LEIN
PRESS
Table 6Identification of convertible bond arbitrageurs versus valuation shorts: analysis of the impact of shorting at announcement compared to issue date.
This table shows results of a regression in which equity market liquidity and efficiency changes are regressed on change in short interest (DSI and DSI_Announcement, calculated at issuance and
announcement, respectively) and firm characteristics. DSI is the proxy for convertible bond arbitrage activity and is defined as the change in short interest (from the month prior to issuance) divided by the
number of shares outstanding in the month prior to issuance. DSI_Announcement is calculated in the same way but is based on announcement month rather than issue month. Only issues where issuing and
announcement months fall into different monthly short-interest files are included. The ‘‘pre-issue period’’ is the six months ending one month prior to announcement. The ‘‘post-issue period’’ is the six months
beginning one month after issuance.
DTurnover, DTrades, and DAmihud are changes in the post-issue log Turnover, log Number of trades, and log Amihud, respectively, from the pre-issue measures. DOIBNUM, DSpread, DDepth, and DSpr/dep are the
percentage changes in the post-issue OIBNUM, Percentage spread, Total depth/shares outstanding, and Dollar spread/dollar depth, respectively, from the pre-issue measures. DjARð1Þj and DjVRð5Þ � 1j are the
percentage changes in the post-issue jDaily ARð1Þj and jVariance ratioð5Þ � 1j, respectively, from the pre-issue measures.
Turnover is the average daily stock volume divided by shares outstanding. Number of trades is the average daily number of stock transactions. Amihud is the average daily ratio of absolute return to dollar
volume (Amihud, 2002). OIBNUM is the average daily absolute difference between the numbers of buyer- and seller-initiated trades divided by their sum. Percentage spread is the difference between bid and ask
quotes (time-weighted), expressed as percentage of bid–ask midpoint. Total depth/shares outstanding is the sum of bid and ask quoted depths divided by shares outstanding. Dollar spread/dollar depth is the ratio
of quoted spread to quoted depth, both expressed in dollars. jDaily ARð1Þj is the absolute value of first-order autocorrelation of daily returns. jVariance ratioð5Þ � 1j is the absolute deviation of five-day variance
ratio from one.
DMarket cap and DVolatility are the post-issue equity market capitalization and standard deviation of daily return minus the corresponding pre-issue period measures. DInstitutional holdings is the change in
institutional holdings (by 13f institutions) divided by shares outstanding at issuing calendar year end from prior calendar year end. Pre-issue price is the average (log) price in pre-issue period. NYSE and Public are
dummy variables. DPre post is the number of days between the last day in pre-issue period and the first day in post-issue period. Estimates on the year-month dummies are not reported.
All change variables are expressed as deviation from control firms (issuer minus control). Control firms are matched based on size, book-to-market, and turnover before issuance, exchange, and industry.
Heteroskedasticity-consistent industry-clustered t-statistics are in parentheses. *, **, and *** denote 10%, 5%, and 1% significance, respectively. The sample period is from July 1993 to May 2006.
Liquidity measures Efficiency measures
D D D D D D D D DTurnover t-stat Trades t-stat Amihud t-stat OIBNUM t-stat Spread t-stat Depth t-stat Spr/dep t-stat jARð1Þj t-stat jVRð5Þ � 1j t-stat
Intercept �0.414 (�0.81) �0.609 (�1.35) 0.793 (1.06) 0.208 (0.93) 0.053 (0.20) 0.625 (1.65) 0.887 (1.61) 7.563 (0.52) 0.064 (0.00)
DSI 9.680** (2.43) 8.345** (2.25) �11.594** (�2.59) �1.714 (�0.98) �1.319 (�0.94) 6.022 (1.34) �5.984 (�1.57) �105.969 (�0.96) �41.277 (�0.38)
DSI_Announcement 1.446 (0.24) �5.137 (�0.64) 8.512 (0.89) �0.501 (�0.17) 3.914 (1.15) �4.645 (�0.56) 7.020 (1.65) �185.934 (�1.00) �134.303 (�0.88)
DMarket cap 0.060 (0.29) 0.428** (2.30) �0.770*** (�3.07) �0.177* (�1.68) �0.511*** (�5.45) �0.601*** (�2.91) �0.092 (�0.32) �0.975 (�0.17) �3.814 (�0.57)
DVolatility 8.027*** (3.37) 5.105* (1.96) �4.295 (�1.30) �0.779 (�0.38) �2.003** (�2.26) 5.175* (1.77) �3.644** (�2.29)
DInstitutional holdings 0.485** (2.30) 0.093 (0.34) �0.185 (�0.54) �0.131 (�0.78) �0.385*** (�3.41) �0.366 (�1.31) �0.159 (�0.77) 5.621 (0.57) 0.529 (0.10)
Pre-issue price � 100 15.117 (0.98) 20.535 (1.63) �27.128 (�1.41) �1.689 (�0.28) �1.174 (�0.22) �3.577 (�0.28) �31.369* (�1.93) �40.640 (�0.12) 98.382 (0.33)
NYSE �0.097 (�0.58) �0.114 (�0.92) 0.228 (0.77) �0.136 (�1.20) 0.006 (0.06) �0.253 (�1.22) 0.192 (1.13) �4.848 (�1.08) 4.654 (0.75)
Public �0.080 (�0.36) 0.022 (0.10) 0.073 (0.24) �0.076 (�0.90) 0.111* (1.74) �0.001 (�0.01) 0.185 (1.14) �10.027 (�1.27) 8.833 (1.01)
DPre post � 1000 �1.487 (�0.95) �2.150 (�1.32) 0.910 (0.24) �0.168 (�0.08) �0.052 (�0.07) �4.122 (�1.12) 2.455 (1.05) 32.060 (0.54) �36.330 (�0.48)
Number of observations 132 132 132 132 132 132 132 132 132
Adjusted R2 (%) 75.70 81.64 68.40 72.51 89.10 70.80 91.43 70.29 78.67
D.
Ch
oi
eta
l./
Jou
rna
lo
fFin
an
cial
Eco
no
mics
91
(20
09
)2
27
–2
512
43

ARTICLE IN PRESS
D. Choi et al. / Journal of Financial Economics 91 (2009) 227–251244
instrumented in the DSIi regressions. The other explana-tory variables in the DSIi regression are chosen to proxyfor characteristics of firms that tend to be attractive toconvertible bond arbitrageurs28:
�
Dollar Volume is the mean daily dollar volume duringthe pre-issue period. This variable is included tocapture the impact of stock liquidity levels on con-vertible bond arbitrage activity. It is easier to dynami-cally hedge more liquid stocks. � Volatility is the mean standard deviation of dailyreturns during the pre-issue period. Convertible bondarbitrageurs are expected to prefer higher volatilityissuers. This is because there are higher potentialtrading profits due to the embedded option in thebond.
� Institutional Holdings is the level of institutionalholdings (shares held by 13f institutions) divided byshares outstanding at calendar year end prior toissuance. This variable is a proxy for the availabilityof shares to borrow.
� Dividends are stock dividend yields and are includedbecause convertible bond arbitrageurs are expected toprefer low or no dividend-paying stocks since shortsellers have to pay dividends.
� Conversion Premium is the amount (in percent) bywhich the conversion price exceeds the market value ofthe common stock at issuance. Calamos (2003, p. 25)states that arbitrageurs tend to prefer stocks withconversion premia that are less than 25% because a lowconversion premium implies lower interest rate andcredit risk.
� NYSE is a dummy variable, equal to one if the firm islisted on NYSE and zero otherwise.
� Public is a dummy variable, equal to one if theconvertible bond is a public offering, and zero other-wise.
� DPrePost is the number of days between the pre- andthe post-issue period.
�29 The percentage of shares affected is highly significant (t-statistic
of 6.21) in the first-stage regression of arbitrage activity. We thank an
anonymous referee for suggesting the importance of the conversion
ratio. Analyst opinion is also significant (t-statistic of 1.92) in the first-
stage. For first-stage liquidity regressions, the analyst coverage variable
is significant for four of seven measures: turnover, number of trades,
order imbalance, and depth. Price deviation from $30 is significant in
spread and depth. We use all exogenous variables and instruments in the
first-stage regressions. We also confirm that the instruments for the
liquidity changes are not significant in the DSI regressions and vice versa.
First-stage results are not reported (for brevity) and are available upon
request.30 For example, Stein (1992) shows that convertible bonds can
essentially be a ‘‘backdoor’’ to equity financing. It is also possible that the
introduction of the new security causes overall volume to increase;
however, this would be picked up by the estimated intercepts (as in
Kumar, Sarin, and Shastri, 1998), not the coefficient on DSI, the proxy for
arbitrage activity.
YearMonthDumt are year and month fixed effects,indicating timing of the convertible bond issue.
In the first-stage regressions for arbitrage activity, weuse percentage of shares affected by the issue (conversionratio � number of bonds=shares outstanding) and analystopinion prior to issuance (percentage of buy recommen-dations) as instruments, in addition to the explanatoryvariables specified in the simultaneous equations. Theseinstruments are chosen because convertible bond arbi-trageurs will short more when a high percentage of sharesare affected by the issue. Analyst recommendations areincluded because short sellers can have trading strategiesbased on these recommendations. In the first-stageregressions for DLiquidityi, we include change in analystcoverage and change in absolute price deviation from $30as instruments (in addition to the other exogenousvariables). We expect that there is a high correlation
28 See Calamos (2003, p. 25).
between analyst coverage and liquidity levels, and that astock price close to $30 indicates higher liquidity.29
The results from simultaneous equations for eachliquidity measure are presented in Table 7. The mainfindings are qualitatively similar to the main regression(with the exception of depth, for which we do not observea statistically significant increase after controlling forpotential endogeneity). Moreover, the liquidity changes donot impact arbitrage activity, which is proxied by DSI
(Panel B of the table).
5.6. Robustness analysis: other potential sources of volume
It is possible that following the issue of a convertiblebond, there is a mechanical increase in trading volumedue to a potential future increase in shares outstanding(i.e., investors eventually exercising the conversion op-tion).30 In this case, we would expect to observe increasesin volume and turnover that are proportional to thefraction of new shares. We may also observe correspond-ing increases in other liquidity measures. We would like todistinguish increases in volume from hedging trades dueto convertible bond arbitrage (i.e., the post-issuancetrading activity depicted in Fig. 1) and increases in volumedue to other sources.31 To address the important concernthat the results may be driven by other sources of volume,we conduct two sets of robustness tests.
First, we replicate the main analysis (i.e., Table 4regressions), but add an explicit control for expectedincreases in volume (unrelated to convertible bondarbitrage activity), which is proportional to the fractionof new shares:
EðDVolumeÞ ¼shares underlying the issue
shares outstanding prior to issue
�
�pre-issueðlogÞvolumei:32
The results are presented in Table 8 and show thatexpected changes in volume are positively and signifi-cantly related to realized changes for trading activitymeasures that are linked to volume (turnover, number oftrades, and the Amihud, 2002, illiquidity measure), as one
31 We thank an anonymous referee for suggesting this distinction.32 Shares underlying the issue is defined as the conversion shares
ratio (reported in SDC Platinum) times the number of bonds.

ARTIC
LEIN
PRESS
Table 7
Simultaneous equations estimation: change in liquidity and DSI.
This table presents a simultaneous equation system of equity market liquidity changes and issue period change in short interest ðDSIÞ, the proxy for convertible bond arbitrage activity. DSI is the change in
short interest (from the month prior to issuance) divided by the number of shares outstanding in the month prior to issuance. Panel A shows the regressions of liquidity changes on DSIIV and other variables,
while Panel B shows the regressions of DSI on DLiquidityIV and other variables. First-stage results are not reported. The ‘‘pre-issue period’’ is the six months ending one month prior to announcement. The ‘‘post-
issue period’’ is the six months beginning one month after issuance.
DTurnover, DTrades, and DAmihud are changes in the post-issue log Turnover, log Number of trades, and log Amihud, respectively, from the pre-issue measures. DOIBNUM, DSpread, DDepth, and DSpr/dep are the
percentage changes in the post-issue OIBNUM , Percentage spread, Total depth/shares outstanding, and Dollar spread/dollar depth, respectively, from the pre-issue measures. DjARð1Þj and DjVRð5Þ � 1j are the
percentage changes in the post-issue jDaily ARð1Þj and jVariance ratioð5Þ � 1j, respectively, from the pre-issue measures.
Turnover is the average daily stock volume divided by shares outstanding. Number of trades is the average daily number of stock transactions. Amihud is the average daily ratio of absolute return to dollar
volume (Amihud, 2002). OIBNUM is the average daily absolute difference between the numbers of buyer- and seller-initiated trades divided by their sum. Percentage spread is the difference between bid and ask
quotes (time-weighted), expressed as percentage of bid–ask midpoint. Total depth/shares outstanding is the sum of bid and ask quoted depths divided by shares outstanding. Dollar spread/dollar depth is the ratio
of quoted spread to quoted depth, both expressed in dollars. jDaily ARð1Þj is the absolute value of first-order autocorrelation of daily returns. jVariance ratioð5Þ � 1j is the absolute deviation of five-day variance
ratio from one.
In Panel A, DSIIV is estimated from a first-stage regression (see Section 5.5 for specification). DMarket cap and DVolatility are the post-issue equity market capitalization and standard deviation of daily return
minus the corresponding pre-issue period measures. DInstitutional holdings is the change in institutional holdings (by 13f institutions) divided by shares outstanding at issuing calendar year end from prior
calendar year end. Pre-issue price is the average (log) price in pre-issue period. NYSE and Public are dummy variables. DPre post is the number of days between the last day in pre-issue period and the first day in
post-issue period. Estimates on the year-month dummies are not reported.
In Panel B, DLiquidityIV are the different liquidity changes (DTurnover, DTrades, DAmihud, DOIBNUM, DSpread, DDepth, and DSpr/dep) estimated from first-stage regressions (see Section 5.5 for specification).
Pre-issue dollar volume and Pre-issue volatility are, respectively, the average (log) dollar volume and standard deviation of daily return in pre-issue period. Pre-issue institutional holdings are the institutional
holdings divided by shares outstanding at calendar year end prior to issuance. Pre-issue dividend is the dividend yield one year prior to issuance. Conversion premium is the amount (in percent) by which the
conversion price exceeds the market value of the common stock at issuance. Estimates on the year-month dummies are not reported.
All change variables are expressed as deviation from control firms (issuer minus control). Control firms are matched based on size, book-to-market, and turnover before issuance, exchange, and industry.
Heteroskedasticity-consistent industry-clustered t-statistics are in parentheses. *, **, and *** denote 10%, 5%, and 1% significance, respectively. The sample period is from July 1993 to May 2006.
Panel A: Liquidity changes
D D D D D D DTurnover t-stat Trades t-stat Amihud t-stat OIBNUM t-stat Spread t-stat Depth t-stat Spr/dep t-stat
Intercept �0.124 (�0.72) �0.237** (�2.18) �0.055 (�0.21) 0.076 (0.67) 0.004 (0.05) 0.569*** (2.61) �0.187 (�1.00)
DSIIV 10.963*** (4.43) 6.931*** (3.81) �8.073*** (�3.19) �0.888 (�1.06) 1.318 (1.63) 4.857 (1.38) �4.971* (�1.94)
DMarket cap 0.142*** (2.72) 0.601*** (16.98) �0.964*** (�18.44) �0.190*** (�10.07) �0.516*** (�12.49) �0.743*** (�5.94) �0.197*** (�4.02)
DVolatility 10.487*** (7.64) 9.789*** (7.42) �0.637 (�0.54) �2.317*** (�2.85) 2.994*** (2.89) 6.131*** (2.74) �0.240 (�0.29)
DInstitutional holdings 0.408*** (7.11) 0.141** (2.48) �0.449*** (�3.84) �0.037 (�1.00) �0.217*** (�3.77) �0.127 (�0.99) �0.101 (�1.31)
Pre-issue price � 100 4.646 (1.32) 6.719*** (2.79) �1.971 (�0.66) �2.194** (�2.01) 0.905 (0.48) �8.193** (�2.32) �7.757 (�1.18)
NYSE �0.027 (�0.45) �0.089** (�2.23) �0.054 (�0.84) 0.045* (1.92) �0.010 (�0.53) 0.104 (0.96) �0.028 (�0.52)
Public 0.028 (0.55) 0.089* (1.79) 0.064 (1.04) �0.040 (�1.55) 0.065** (2.08) �0.074 (�0.85) 0.022 (0.31)
DPre post � 1000 0.233 (0.28) �0.360 (�0.50) 0.093 (0.00) �0.510 (�0.99) �0.750 (�1.34) �1.030 (�0.60) 3.386 (1.06)
Number of observations 846 846 846 846 846 846 846
Adjusted R2 (%) 18.94 44.25 46.81 18.80 48.68 21.63 2.08
D.
Ch
oi
eta
l./
Jou
rna
lo
fFin
an
cial
Eco
no
mics
91
(20
09
)2
27
–2
512
45

ARTICLE IN PRESS
All
coe
ffic
ien
tsa
re�
10
00
Pa
nel
B:D
SI
Wh
enD
Liq
uid
ity
IV¼
DD
DD
DD
D
Tu
rno
ve
rt-
sta
tT
rad
es
t-st
at
Am
ihu
dt-
sta
tO
IBN
UM
t-st
at
Sp
rea
dt-
sta
tD
ep
tht-
sta
tS
pr/
de
pt-
sta
t
Inte
rce
pt
11.4
48
*(1
.78
)1
2.9
87
*(1
.85
)11
.47
7*
(1.8
3)
13
.52
8*
(1.9
0)
13
.42
3*
(1.6
7)
15
.18
1*
(1.6
9)
7.6
31
(1.0
2)
DLi
qu
idit
yIV
9.6
86
(0.8
9)
5.3
02
(0.7
1)
�5
.27
0(�
1.4
7)
�17
.79
0(�
0.7
7)
�9
.18
0(�
1.5
5)
�3
.73
0(�
0.9
9)
�11
.74
0(�
0.6
4)
Pre
-iss
ue
do
lla
rv
olu
me
�0
.71
0(�
0.6
0)
�1.
12
0(�
1.0
1)
�1.
25
0(�
1.0
7)
�1.
21
0(�
1.0
8)
�1.
52
0(�
1.1
5)
�1.
41
0(�
1.0
7)
�1.
36
0(�
1.1
4)
Pre
-iss
ue
vo
lati
lity
19
9.2
39
*(1
.95
)17
5.5
34
**(1
.96
)1
42
.30
4**
*(2
.70
)1
88
.69
2*
(1.7
3)
14
6.3
62
**(2
.50
)1
62
.16
1**
(2.3
7)
13
4.2
91
***
(2.7
3)
Pre
-iss
ue
inst
itu
tio
na
lh
old
ing
s6
.78
5**
(2.1
5)
5.4
71
*(1
.71
)5
.93
7*
(1.9
2)
5.2
27
(1.5
2)
5.4
40
*(1
.72
)5
.49
3(1
.60
)5
.43
4*
(1.7
0)
Pre
-iss
ue
div
ide
nd
�7.
35
0(�
1.3
4)
�7.
04
0(�
1.2
0)
�7.
64
0(�
1.3
5)
�7.
76
0(�
1.11
)�
7.0
10
(�1.
22
)�
5.8
70
(�1.
09
)�
11.3
30
(�0
.99
)
Co
nv
ers
ion
pre
miu
m(%
)�
0.0
50
**(�
2.4
2)�
0.0
50
***
(�2
.57
)�
0.0
40
*(�
1.8
8)
�0
.06
0**
*(�
2.9
1)
�0
.05
0**
(�2
.29
)�
0.0
60
***
(�3
.24
)�
0.0
40
(�1.
15
)
NY
SE
�7.
12
0*
(�1.
82
)�
7.4
00
**(�
2.0
4)
�7.
86
0**
(�2
.48
)�
7.3
00
**(�
1.9
6)
�8
.18
0**
(�2
.56
)�
8.0
40
***
(�2
.69
)�
8.2
00
**(�
2.5
6)
Pu
bli
c�
6.5
10
**(�
1.9
6)
�7.
46
0**
(�2
.36
)�
6.5
80
**(�
2.0
7)
�7.
95
0**
(�2
.21
)�
6.7
90
**(�
2.2
0)
�7.
69
0**
(�2
.38
)�
6.4
30
*(�
1.8
5)
DP
rep
ost
0.1
58
***
(2.9
5)
0.1
76
***
(2.9
7)
0.1
76
***
(2.9
8)
0.1
69
***
(3.2
3)
0.1
75
***
(2.9
2)
0.1
79
***
(3.0
6)
0.2
10
**(2
.19
)
Nu
mb
er
of
ob
serv
ati
on
s8
46
84
68
46
84
68
46
84
68
46
Ad
just
ed
R2
(%)
5.1
34
.98
5.5
14
.89
4.7
24
.06
3.9
7
Ta
ble
7(c
on
tin
ued
)
a
v
W
o
q
c
i
s
b
n
v
A
D. Choi et al. / Journal of Financial Economics 91 (2009) 227–251246
might expect. However, these expected mechanicalvolume changes do not explain non-volume-basedliquidity improvements (i.e., insignificant relationshipswith depth, order imbalance, and spread-to-depth, withthe exception of a significant and positive relationshipwith percentage spread). More importantly for thisanalysis, the significant relationship between the arbit-rage activity proxy ðDSIÞ and all liquidity changesreported in the main analysis are largely unaffected bythe inclusion of expected changes in volume.33
A benefit of the measures above is that both the proxyfor convertible arbitrage activity and expected changes involume are calculated at time 0 relative to the issue date.This is a clean, well-defined window for measuring thepresence of convertible bond arbitrageurs. Ideally, wewould want to measure the impact of actual convertiblebond arbitrage activity, controlling for actual changes involume. A challenge in this paper’s framework is thatchanges in actual volume include two components:changes in volume due to convertible bond arbitrageand non-arbitrage related changes (the mechanicalchanges described above or other sources). One possibi-lity would be to put actual volume changes, measuredover months þ1 through þ6, into the regression in whichthe convertible bond arbitrage activity proxy, DSI, iscalculated at issue month 0. This approach is notappealing since one would expect actual volume changesto have the most power in explaining liquidity changes(simply because the volume change measure is calculatedover the same þ1 through þ6 interval as the liquiditychanges). In this case, it would be very difficult todistinguish whether the convertible bond arbitrage ornon-arbitrage component of volume drives the change.
To circumvent this potential issue, we return to theintuition that convertible bond arbitrageurs will dyna-mically hedge following issuance: they will short morewhen stock prices rise and cover their short positions asstock prices fall. This will increase the volatility of shortinterest relative to the pre-issue period. In the secondrobustness test, we introduce an alternative proxy fordynamic hedging activity, Dynamic_Hedge, which isdefined as the average (log) absolute value of short-interest changes during post-issue period minus theaverage absolute value of short-interest changes duringthe pre-issue period.34 In Fig. 4, these are months þ1through þ6 and X� 6 and X� 1, respectively. Theintuition for Dynamic_Hedge is that monthly decreases
33 In addition to expected increase in volume, we replicate the
nalysis using expected increase in turnover and dollar volume (since
olume can be affected by changes in the number of shares outstanding).
e also eliminate observations in which there is a change in the number
f shares outstanding during the horizon of interest. All results are
ualitatively similar to those shown in Table 8.34 In unreported analysis, we also conduct a third test, which
ontrols for mechanical increases in volume due to the potential
ncrease in shares outstanding. We match convertible bond issuers to a
ample of straight equity issuers (matched by exchange, industry, size,
ook-to-market, and issue size), in which there is a clear increase in the
umber of shares outstanding. We re-run the analysis, where all
ariables are measured as deviations from this ‘‘issue-control’’ sample.
s noted earlier, results are similar to those in the main analysis.

ARTIC
LEIN
PRESS
Table 8
Regression of liquidity and efficiency changes on DSI and expected volume increase.
This table presents results of a regression in which equity market liquidity and efficiency changes are regressed on issue period change in short interest (DSI, the proxy for convertible bond arbitrage activity),
expected change in volume ðEðDVolumeÞ), and firm characteristics. DSI is the change in short interest (from the month prior to issuance) divided by the number of shares outstanding in the month prior to
issuance. EðDVolumeÞ is the pre-issue average (log) daily volume in number of shares, times shares underlying the issue divided by shares outstanding prior to issuance. The ‘‘pre-issue period’’ is the six months
ending one month prior to announcement. The ‘‘post-issue period’’ is the six months beginning one month after issuance.
DTurnover, DTrades, and DAmihud are changes in the post-issue log Turnover, log Number of trades, and log Amihud, respectively, from the pre-issue measures. DOIBNUM, DSpread, DDepth, and DSpr/dep are the
percentage changes in the post-issue OIBNUM, Percentage spread, Total depth/shares outstanding, and Dollar spread/dollar depth, respectively, from the pre-issue measures. DjARð1Þj and DjVRð5Þ � 1j are the
percentage changes in the post-issue jDaily ARð1Þj and jVariance ratioð5Þ � 1j, respectively, from the pre-issue measures.
Turnover is the average daily stock volume divided by shares outstanding. Number of trades is the average daily number of stock transactions. Amihud is the average daily ratio of absolute return to dollar
volume (Amihud, 2002). OIBNUM is the average daily absolute difference between the numbers of buyer- and seller-initiated trades divided by their sum. Percentage spread is the difference between bid and ask
quotes (time-weighted), expressed as percentage of bid–ask midpoint. Total depth/shares outstanding is the sum of bid and ask quoted depths divided by shares outstanding. Dollar spread/dollar depth is the ratio
of quoted spread to quoted depth, both expressed in dollars. jDaily ARð1Þj is the absolute value of first-order autocorrelation of daily returns. jVariance ratioð5Þ � 1j is the absolute deviation of five-day variance
ratio from one.
DMarket cap and DVolatility are the post-issue equity market capitalization and standard deviation of daily return minus the corresponding pre-issue period measures. DInstitutional holdings is the change in
institutional holdings (by 13f institutions) divided by shares outstanding at issuing calendar year end from prior calendar year end. Pre-issue price is the average (log) price in pre-issue period. NYSE and Public are
dummy variables. DPre post is the number of days between the last day in pre-issue period and the first day in post-issue period. Estimates on the year-month dummies are not reported.
All change variables are expressed as deviation from control firms (issuer minus control). Control firms are matched based on size, book-to-market, and turnover before issuance, exchange, and industry.
Heteroskedasticity-consistent industry-clustered t-statistics are in parentheses. *, **, and *** denote 10%, 5%, and 1% significance, respectively. The sample period is from July 1993 to May 2006.
Liquidity measures Efficiency measures
D D D D D D D D DTurnover t-stat Trades t-stat Amihud t-stat OIBNUM t-stat Spread t-stat Depth t-stat Spr/dep t-stat jARð1Þj t-stat jVRð5Þ � 1j t-stat
Intercept �0.144 (�1.00) �0.214** (�2.09) �0.031 (�0.13) 0.048 (0.40) �0.031 (�0.32) 0.505** (2.22) �0.171 (�0.93) 3.744 (0.44) 5.440 (0.94)
DSI 1.999** (2.17) 2.062*** (3.44) �2.364*** (�2.70) �0.529 (�1.09) 0.120 (0.24) 1.348** (2.40) �1.207* (�1.80) �38.650 (�0.55) �1.451 (�0.07)
E(DVolume) 0.088*** (4.44) 0.036** (2.08) �0.060** (�2.06) 0.006 (0.60) 0.022** (2.05) 0.053 (1.37) �0.039 (�1.44) �0.670 (�0.40) �0.183 (�0.32)
DMarket cap 0.195*** (5.63) 0.627*** (19.65) �0.999*** (�22.37) �0.190*** (�9.79) �0.506*** (�12.26) �0.718*** (�6.85) �0.220*** (�4.30) �6.026 (�0.63) �1.693** (�2.02)
DVolatility 9.920*** (6.67) 9.493*** (6.75) �0.272 (�0.28) �2.304*** (�2.76) 2.907*** (2.65) 5.890*** (2.71) 0.001 (0.00)
DInstitutional holdings 0.433*** (9.23) 0.156*** (2.91) �0.465*** (�4.09) �0.039 (�1.06) �0.214*** (�3.77) �0.119 (�0.97) �0.111 (�1.52) 0.845 (0.10) �0.803 (�0.56)
Pre-issue price� 100 4.064 (1.33) 5.769*** (2.68) �1.823 (�0.65) �1.626 (�1.45) 1.433 (0.81) �7.365** (�2.26) �7.667 (�1.15) 84.538 (0.43) �41.708 (�0.39)
NYSE �0.063 (�1.63) �0.112*** (�3.77) �0.032 (�0.59) 0.049** (2.11) �0.012 (�0.64) 0.094 (0.98) �0.013 (�0.26) 3.900 (1.02) �0.683 (�0.56)
Public �0.026 (�0.46) 0.058 (1.16) 0.098 (1.62) �0.037 (�1.53) 0.059* (1.87) �0.094 (�0.99) 0.045 (0.64) �16.492 (�1.11) 3.547 (1.43)
DPre post� 1000 1.425* (1.77) 0.313 (0.59) �0.657 (�0.47) �0.584 (�1.07) �0.618 (�1.12) �0.606 (�0.37) 2.892 (0.97) �14.160 (�0.11) �23.980 (�1.09)
Number of observations 846 846 846 846 846 846 846 846 846
Adjusted R2 (%) 38.25 56.60 58.13 33.45 58.20 36.19 20.12 10.47 59.58
D.
Ch
oi
eta
l./
Jou
rna
lo
fFin
an
cial
Eco
no
mics
91
(20
09
)2
27
–2
512
47

ARTICLE IN PRESS
D. Choi et al. / Journal of Financial Economics 91 (2009) 227–251248
in short interest represent arbitrageurs covering shortpositions, and increases represent additional shorting. Theincrease in the average amount of shorting and coveringthat takes place following issuance is interpreted asdynamic hedging by convertible bond arbitrageurs.35
The actual change in volume, DVolume, is measured overthe same period as Dynamic_Hedge and is also included inthe regression.36 This variable is defined as average (log)post-issue period volume minus average (log) pre-issueperiod volume. Table 9 presents results of the analysis inwhich the contemporaneous measures Dynamic_Hedge
and DVolume replace Table 8’s DSI and EðDVolumeÞ,respectively.37 As with all other variables, these arepresented as deviations from control firms. The evidencein Table 9 is similar to Table 8 and suggests a robust,positive role for convertible bond arbitrageurs in stockmarket liquidity.38
5.7. Further evidence of convertible bond arbitrage:
2005–2006 Reg-SHO data
Ideally, the main analysis would measure short sellingactivity or the change in short interest during the few dayssurrounding issuance. However, the short-interest dataare available only on a monthly basis and therefore do notperfectly capture short-sales transactions. We take ad-vantage of newly available data on short selling activity(beginning in 2005, as a result of Regulation SHO) toinvestigate whether the increases in short interest that weobserve using the monthly data are due to short-salestransactions close to the issue date. The SHO transactionsdata allow us to supplement the main analysis in twoways: (1) we are able to observe trading at the issue dateand (2) we can examine changes in short selling activityfollowing issuance. The latter is of interest since, ifarbitrageurs dynamically hedge, we would expect toobserve an increase in short selling following issuance.
Fig. 5 illustrates short selling activity near theconvertible bond issue date for the sample of 64 issuesfor which Reg-SHO data are available (those in 2005 and2006). The increase in short selling on Day 0 providesfurther evidence that we are identifying convertible bondarbitrage activity and not short selling due to otherfactors. The figure also suggests that the level of shortselling activity following issuance is higher, which is
35 A second benefit of this measure relative to DSI is that both
arbitrage activity and the liquidity and efficiency measures are
calculated over the same window. We thank an anonymous referee for
encouraging robustness analysis using synchronous time windows.36 Kumar, Sarin, and Shastri (1998) also include changes in log
volume in their investigation of the impact of the introduction of options
markets on stock market liquidity. In their regressions using volume, the
authors focus on liquidity changes that are not volume-based (e.g.,
spread, depth, and the depth-to-spread ratio).37 Results are robust to defining DVolume as the change in buy
volume, rather than the change in total volume.38 In addition, we used two alternative definitions for dynamic
hedging: (1) the change in (log) standard deviation of monthly short
interest and (2) change in (log) short interest during positive return
months. The latter aims to capture the intuition that convertible bond
arbitrageurs will short more when stock prices rise. Both measures yield
results that are qualitatively similar to those presented in Table 9.
consistent with dynamic hedging by arbitrageurs. Weexplicitly test whether short selling increased.
Table 10 summarizes changes in short selling activityin stocks of convertible bond issuers between March 2005and May 2006. The ‘‘pre-period’’ is defined as the 20trading days ending one month prior to announcement.The ‘‘post-period’’ is defined as the 20 trading daysbeginning one month following issuance. The change isdefined as the mean (or median) measure in post-periodminus the mean (median) measure in pre-period.39 Forcomparison, we also present results for control firms.A key observation from the table is consistent withdynamic hedging: short selling activity increases follow-ing issuance. Moreover, we do not find similar results forthe control firms.
6. Conclusion
In this paper, we investigate the link between con-vertible bond arbitrage, liquidity, and stock prices withthe goal of improving our understanding of the impact ofarbitrageurs on market quality, measured by stockliquidity and efficiency. A typical convertible bondarbitrage strategy employs delta-neutral hedging in whichan arbitrageur buys the convertible bond and sells theunderlying equity at a specific delta. If the price of thestock increases, to keep the same delta hedge, thearbitrageur sells the stock. When the stock price de-creases, the arbitrageur buys back the stock. Becauseaggregate trading demand tends to move in the oppositedirection of this convertible bond arbitrage activity,arbitrageurs are expected to improve liquidity in thestock.
We examine changes in short interest near an event inwhich the convertible bond arbitrage strategy is widelyused (bond issuance date), and are able to use aggregatedata to estimate the equity positions taken by convertiblebond arbitrageurs. Specifically, we examine the sensitivityof subsequent changes in liquidity and stock price-efficiency measures to this proxy for convertible bondarbitrage activity. We add to findings in previous studiesthat show average changes in equity market quality whennew securities are introduced in that we are able toexamine cross-sectional implications of the introductionof a particular trader type. This helps to shed additionalempirical light on the issue of how the introduction ofnew securities that are used by arbitrageurs can impactoverall market quality.
We show improvements in liquidity following issuanceof convertible debt. More important, we find that theincrease in liquidity is systematically related to our proxyfor convertible bond arbitrage activity. This suggestspositive liquidity spillovers due to the arbitrage activityin equity markets. We do not find evidence of a systematicrelationship between arbitrage activity and stock return
39 Note that this ‘‘pre-’’ and ‘‘post-’’ period definition differs from
that used in the main analysis. We tighten the window over which we
measure transactions in order to maximize the number of issues for
analysis, given that the SHO data do not begin until 2005.

ARTIC
LEIN
PRESS
Table 9Regression of liquidity and efficiency changes on dynamic hedging activity and volume change.
This table presents results of a regression in which equity market liquidity and efficiency changes are regressed on the proxy for dynamic hedging activity (Dynamic_Hedge), change in volume ðDVolumeÞ, and
firm characteristics. Dynamic_Hedge is defined as the average (log) absolute value of short-interest changes during post-issue period minus the average (log) absolute value of short-interest changes during pre-
issue period. The short-interest change is scaled by the number of shares outstanding in the prior month. DVolume is the post-issue average (log) daily volume in number of shares minus the pre-issue average
(log) daily volume in number of shares. The ‘‘pre-issue period’’ is the six months ending one month prior to announcement. The ‘‘post-issue period’’ is the six months beginning one month after issuance.
DTurnover, DTrades, and DAmihud are changes in the post-issue log Turnover, log Number of trades, and log Amihud, respectively, from the pre-issue measures. DOIBNUM, DSpread, DDepth, and DSpr/dep are the
percentage changes in the post-issue OIBNUM , Percentage spread, Total depth/shares outstanding, and Dollar spread/dollar depth, respectively, from the pre-issue measures. DjARð1Þj and DjVRð5Þ � 1j are the
percentage changes in the post-issue jDaily ARð1Þj and jVariance ratioð5Þ � 1j, respectively, from the pre-issue measures.
Turnover is the average daily stock volume divided by shares outstanding. Number of trades is the average daily number of stock transactions. Amihud is the average daily ratio of absolute return to dollar
volume (Amihud, 2002). OIBNUM is the average daily absolute difference between the numbers of buyer- and seller-initiated trades divided by their sum. Percentage spread is the difference between bid and ask
quotes (time-weighted), expressed as percentage of bid–ask midpoint. Total depth/shares outstanding is the sum of bid and ask quoted depths divided by shares outstanding. Dollar spread/dollar depth is the ratio
of quoted spread to quoted depth, both expressed in dollars. jDaily ARð1Þj is the absolute value of first-order autocorrelation of daily returns. jVariance ratioð5Þ � 1j is the absolute deviation of five-day variance
ratio from one.
DMarket cap and DVolatility are the post-issue equity market capitalization and standard deviation of daily return minus the corresponding pre-issue period measures. DInstitutional holdings is the change in
institutional holdings (by 13f institutions) divided by shares outstanding at issuing calendar year end from prior calendar year end. Pre-issue price is the average (log) price in pre-issue period. NYSE and Public are
dummy variables. DPre post is the number of days between the last day in pre-issue period and the first day in post-issue period. Estimates on the year-month dummies are not reported.
All change variables are expressed as deviation from control firms (issuer minus control). Control firms are matched based on size, book-to-market, and turnover before issuance, exchange, and industry.
Heteroskedasticity-consistent industry-clustered t-statistics are in parentheses. *, **, and *** denote 10%, 5%, and 1% significance, respectively. The sample period is from July 1993 to May 2006.
Liquidity measures Efficiency measures
D D D D D D D D DTurnover t-stat Trades t-stat Amihud t-stat OIBNUM t-stat Spread t-stat Depth t-stat Spr/dep t-stat jARð1Þj t-stat jVRð5Þ � 1j t-stat
Intercept 0.151 (1.55) �0.069 (�0.69) �0.513** (�2.13) 0.087 (0.87) 0.042 (0.51) 0.558*** (2.84) �0.504 (�1.51) 0.817 (0.05) 4.798 (0.89)
Dynamic_Hedge 0.061*** (3.44) 0.005 (0.55) �0.068*** (�3.16) 0.004 (0.48) �0.027** (�2.07) 0.065*** (2.67) �0.035 (�1.46) 2.922 (0.78) �0.244 (�0.41)
DVolume 0.774*** (24.57) 0.628*** (32.01) �0.558*** (�13.26) �0.116*** (�5.46) �0.039 (�1.31) 0.309*** (4.88) �0.367*** (�8.79) 6.330 (1.41) �2.243* (�1.79)
DMarket cap �0.163*** (�7.18) 0.347*** (13.79) �0.761*** (�19.13) �0.141*** (�6.75) �0.490*** (�11.13) �0.877*** (�6.02) �0.063 (�1.36) �8.749 (�0.90) �0.812 (�1.00)
DVolatility 0.994* (1.81) 2.618*** (5.97) 6.527*** (4.20) �1.043 (�1.31) 3.593*** (2.91) 2.021 (1.11) 4.360*** (3.08)
DInstitutional holdings 0.242*** (6.12) 0.024 (0.45) �0.324*** (�2.64) �0.017 (�0.48) �0.186*** (�3.05) �0.223 (�1.56) �0.022 (�0.27) �2.492 (�0.36) �0.221 (�0.14)
Pre-issue price� 100 �3.880*** (�3.28) 0.030 (0.02) 3.530 (1.35) �1.177 (�1.18) �0.163 (�0.08) �11.195*** (�2.85) �4.142 (�0.80) 136.899 (0.72) �15.335 (�0.19)
NYSE �0.002 (�0.08) �0.059*** (�2.97) �0.063 (�1.53) 0.037 (1.59) �0.028 (�1.31) 0.120 (1.36) �0.035 (�0.71) �6.023 (1.39) 1.040 (�0.75)
Public �0.031 (�1.41) 0.032 (1.39) 0.063 (1.47) �0.029 (�1.15) 0.045* (1.69) �0.108 (�1.08) 0.024 (0.30) �15.221 (�1.05) 3.542 (1.46)
DPre post� 1000 0.405 (0.58) 0.208 (0.23) 4.431** (2.14) �1.085 (�1.60) �0.182 (�0.21) 0.707 (0.31) 6.531 (0.97) �54.640 (�0.19) �22.680 (�0.45)
Number of observations 841 841 841 841 841 841 841 841 841
Adjusted R2 (%) 85.29 83.58 71.95 37.24 58.40 40.10 30.41 10.63 59.76
D.
Ch
oi
eta
l./
Jou
rna
lo
fFin
an
cial
Eco
no
mics
91
(20
09
)2
27
–2
512
49
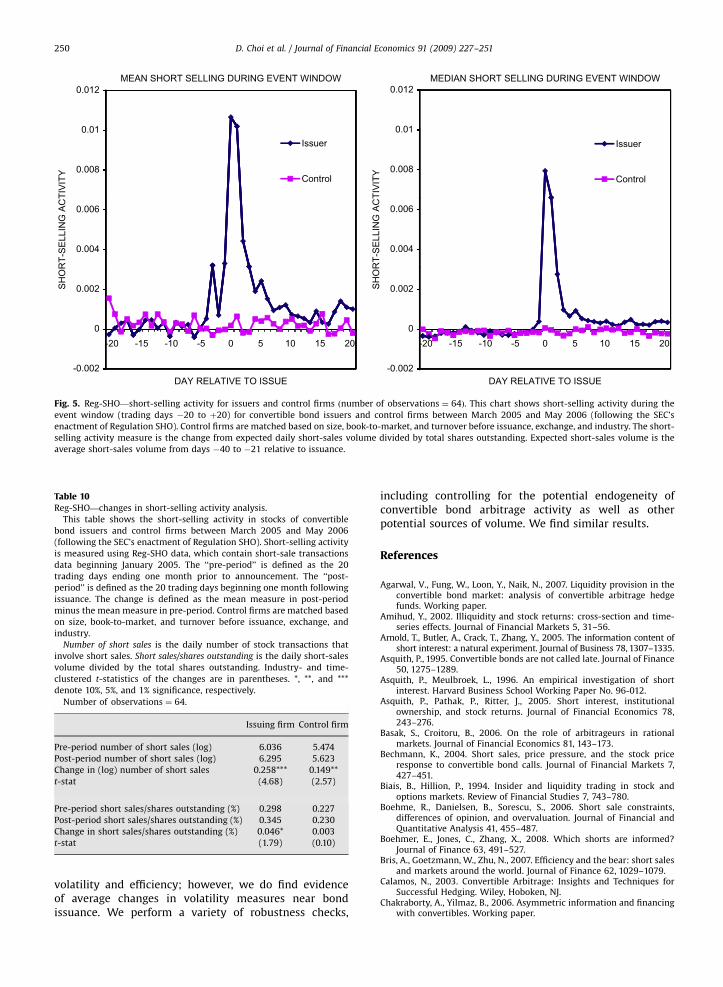
ARTICLE IN PRESS
0.012
0.01
MEAN SHORT SELLING DURING EVENT WINDOW0.012
0.01
MEDIAN SHORT SELLING DURING EVENT WINDOW
0.008
Issuer
Control0.008
Issuer
Control
0.004
0.006
0.004
0.006
0
0.002SH
OR
T-S
ELL
ING
AC
TIV
ITY
SH
OR
T-S
ELL
ING
AC
TIV
ITY
0
0.002
-0.002
-20
DAY RELATIVE TO ISSUE-0.002
DAY RELATIVE TO ISSUE
-15 -10 -5 0 5 10 15 20 -20 -15 -10 -5 0 5 10 15 20
Fig. 5. Reg-SHO—short-selling activity for issuers and control firms ðnumber of observations ¼ 64Þ. This chart shows short-selling activity during the
event window (trading days �20 to þ20) for convertible bond issuers and control firms between March 2005 and May 2006 (following the SEC’s
enactment of Regulation SHO). Control firms are matched based on size, book-to-market, and turnover before issuance, exchange, and industry. The short-
selling activity measure is the change from expected daily short-sales volume divided by total shares outstanding. Expected short-sales volume is the
average short-sales volume from days �40 to �21 relative to issuance.
Table 10Reg-SHO—changes in short-selling activity analysis.
This table shows the short-selling activity in stocks of convertible
bond issuers and control firms between March 2005 and May 2006
(following the SEC’s enactment of Regulation SHO). Short-selling activity
is measured using Reg-SHO data, which contain short-sale transactions
data beginning January 2005. The ‘‘pre-period’’ is defined as the 20
trading days ending one month prior to announcement. The ‘‘post-
period’’ is defined as the 20 trading days beginning one month following
issuance. The change is defined as the mean measure in post-period
minus the mean measure in pre-period. Control firms are matched based
on size, book-to-market, and turnover before issuance, exchange, and
industry.
Number of short sales is the daily number of stock transactions that
involve short sales. Short sales/shares outstanding is the daily short-sales
volume divided by the total shares outstanding. Industry- and time-
clustered t-statistics of the changes are in parentheses. *, **, and ***
denote 10%, 5%, and 1% significance, respectively.
Number of observations ¼ 64.
Issuing firm Control firm
Pre-period number of short sales (log) 6.036 5.474
Post-period number of short sales (log) 6.295 5.623
Change in (log) number of short sales 0.258*** 0.149**
t-stat (4.68) (2.57)
Pre-period short sales/shares outstanding (%) 0.298 0.227
Post-period short sales/shares outstanding (%) 0.345 0.230
Change in short sales/shares outstanding (%) 0.046* 0.003
t-stat (1.79) (0.10)
D. Choi et al. / Journal of Financial Economics 91 (2009) 227–251250
volatility and efficiency; however, we do find evidenceof average changes in volatility measures near bondissuance. We perform a variety of robustness checks,
including controlling for the potential endogeneity ofconvertible bond arbitrage activity as well as otherpotential sources of volume. We find similar results.
References
Agarwal, V., Fung, W., Loon, Y., Naik, N., 2007. Liquidity provision in theconvertible bond market: analysis of convertible arbitrage hedgefunds. Working paper.
Amihud, Y., 2002. Illiquidity and stock returns: cross-section and time-series effects. Journal of Financial Markets 5, 31–56.
Arnold, T., Butler, A., Crack, T., Zhang, Y., 2005. The information content ofshort interest: a natural experiment. Journal of Business 78, 1307–1335.
Asquith, P., 1995. Convertible bonds are not called late. Journal of Finance50, 1275–1289.
Asquith, P., Meulbroek, L., 1996. An empirical investigation of shortinterest. Harvard Business School Working Paper No. 96-012.
Asquith, P., Pathak, P., Ritter, J., 2005. Short interest, institutionalownership, and stock returns. Journal of Financial Economics 78,243–276.
Basak, S., Croitoru, B., 2006. On the role of arbitrageurs in rationalmarkets. Journal of Financial Economics 81, 143–173.
Bechmann, K., 2004. Short sales, price pressure, and the stock priceresponse to convertible bond calls. Journal of Financial Markets 7,427–451.
Biais, B., Hillion, P., 1994. Insider and liquidity trading in stock andoptions markets. Review of Financial Studies 7, 743–780.
Boehme, R., Danielsen, B., Sorescu, S., 2006. Short sale constraints,differences of opinion, and overvaluation. Journal of Financial andQuantitative Analysis 41, 455–487.
Boehmer, E., Jones, C., Zhang, X., 2008. Which shorts are informed?Journal of Finance 63, 491–527.
Bris, A., Goetzmann, W., Zhu, N., 2007. Efficiency and the bear: short salesand markets around the world. Journal of Finance 62, 1029–1079.
Calamos, N., 2003. Convertible Arbitrage: Insights and Techniques forSuccessful Hedging. Wiley, Hoboken, NJ.
Chakraborty, A., Yilmaz, B., 2006. Asymmetric information and financingwith convertibles. Working paper.

ARTICLE IN PRESS
D. Choi et al. / Journal of Financial Economics 91 (2009) 227–251 251
Choi, D., Getmansky, M., Henderson, B., Tookes, H., 2008. Convertiblebond arbitrageurs as suppliers of capital. Working paper, YaleInternational Center for Finance.
Chordia, T., Roll, R., Subrahmanyam, A., 2002. Order imbalance, liquidity,and market returns. Journal of Financial Economics 65, 111–130.
Christophe, S., Ferri, M., Angel, J., 2004. Short-selling prior to earningsannouncements. Journal of Finance 59, 1845–1876.
Dechow, P., Hutton, A., Meulbroek, L., Sloan, R., 2001. Short sellers,fundamental analysis, and stock returns. Journal of FinancialEconomics 61, 77–106.
DeTemple, J., Jorion, P., 1990. Option listing and stock returns. Journal ofBanking and Finance 14, 781–801.
Diamond, D., Verrecchia, R., 1987. Constraints on short-selling and asset priceadjustment to information. Journal of Financial Economics 18, 277–311.
Diether, K., Lee, K., Werner, I., 2008. Short-sale strategies and returnpredictability. Review of Financial Studies, forthcoming.
Easley, D., O’Hara, M., Srinivas, P., 1998. Option volume and stock prices:evidence on where informed traders trade. Journal of Finance 53,431–465.
Fama, E., French, K., 1997. Industry costs of equity. Journal of FinancialEconomics 43, 153–193.
Grossman, S., 1988. An analysis of the implications for stock and futuresprice volatility of program trading and dynamic hedging strategies.Journal of Business 61, 275–298.
Henderson, B., 2005. Convertible bonds: new issue performance andarbitrage opportunities. Working paper.
Ingersoll, J., 1977. An examination of corporate call policies onconvertible securities. Journal of Finance 32, 463–478.
Jones, C., Lamont, O., 2002. Short-sale constraints and stock returns.Journal of Financial Economics 66, 207–239.
Kumar, R., Sarin, A., Shastri, K., 1998. The impact of options trading on themarket quality of the underlying security: an empirical analysis.Journal of Finance 53, 717–732.
Kyle, A., 1985. Continuous auctions and insider trading. Econometrica 53,1315–1335.
Lamont, O., Stein, J., 2004. Aggregate short interest and marketvaluations. American Economic Review 94, 29–32.
Lee, C., Ready, M., 1991. Inferring trade direction from intraday data.Journal of Finance 46, 733–746.
Lo, A., MacKinlay, C., 1988. Stock market prices do not follow randomwalks: evidence from a simple specification test. Review of FinancialStudies 1, 41–66.
Mayhew, S., 2000. The impact of derivatives on cash markets: What havewe learned? Working paper, University of Georgia.
Mitchell, M., Pulvino, T., Stafford, E., 2004. Price pressure aroundmergers. Journal of Finance 59, 31–63.
Mitchell, M., Pedersen, L., Pulvino, T., 2007. Slow moving capital.American Economic Review 97, 215–220.
Pastor, L., Stambaugh, R., 2003. Liquidity risk and expected stock returns.Journal of Political Economy 111, 642–685.
Pulliam, S., 2004. Mixed blessing: How hedge-fund trading sent acompany’s stock on wild ride. Wall Street Journal December28, A1.
Ross, S., 1976. Options and efficiency. Quarterly Journal of Economics 90,75–89.
Securities and Exchange Commission, 2003. Implications of the growthof hedge funds. Staff Report, September.
Skorecki, A., 2004. Convertibles enter era of change: the strategy ofselling to hedge funds was always controversial. Financial TimesJanuary 16, 43.
Spiegel, M., Wang, X., 2005. Cross-sectional variation in stock returns:liquidity and idiosyncratic risk. Yale ICF Working Paper No. 05-13.
Stein, J., 1992. Convertible bonds as backdoor equity financing. Journal ofFinancial Economics 32, 3–21.