Figures - SLAC National Accelerator Laboratory€¦ · Web view... Derived Throughput kbits/sec...
56
International Committee for Future Accelerators (ICFA) Standing Committee on Inter-Regional Connectivity (SCIC) Chairperson: Professor Harvey Newman, Caltech ICFA SCIC Network Monitoring Report Prepared by the ICFA SCIC Monitoring Working Group On behalf of the Working Group: Shawn McKee [email protected] Les Cottrell [email protected] Marian Babik [email protected] 1
Transcript of Figures - SLAC National Accelerator Laboratory€¦ · Web view... Derived Throughput kbits/sec...

International Committee for Future Accelerators (ICFA)
Standing Committee on Inter-Regional Connectivity (SCIC) Chairperson: Professor Harvey Newman, Caltech
ICFA SCIC Network Monitoring Report
Prepared by the ICFA SCIC Monitoring Working GroupOn behalf of the Working Group:
Shawn McKee [email protected] Cottrell [email protected]
Marian Babik [email protected]
1

2015 - 2016 Report of the ICFA-SCIC Monitoring Working Group
Edited by Shawn McKee, Les Cottrell and Marian Babik On behalf of the ICFA-SCIC Monitoring WG
Contributions from Brian Tierney, Soichi Hayashi, Henryk Giemza, Mike O’Connor, Ilija Vukotic
Created January 18, 2016, Finished February 4, 2016
ICFA-SCIC Home Page | Monitoring WG Home Page
This report is available from:
http://linat05.grid.umich.edu/ICFA-SCIC/NM-WG-report-2016.docx
2

Table of Contents
Figures..................................................................................................................................................... 4
Executive Overview............................................................................................................................. 5
Introduction........................................................................................................................................... 8
Methodology.......................................................................................................................................... 8
PingER Status......................................................................................................................................... 9Deployment....................................................................................................................................................... 9Historical Growth of PingER Coverage Since 1998...............................................................................9Metrics.............................................................................................................................................................. 10
Yearly Throughput Trends........................................................................................................................................10PingER Progress in 2015............................................................................................................................ 13
High Performance Network Monitoring....................................................................................15Introduction.................................................................................................................................................... 15The perfSONAR Project............................................................................................................................... 16
Recent Changes to perfSONAR................................................................................................................................17perfSONAR next steps.................................................................................................................................................18
Network Monitoring in Open Science Grid...........................................................................................19OSG Vision........................................................................................................................................................................ 19Network Datastore....................................................................................................................................................... 20
Infrastructure and Service Monitoring......................................................................................22WLCG Network and Transfer Metrics Working Group.....................................................................23
Network Performance Monitoring and Metrics...............................................................................................24Experiments Use Cases...............................................................................................................................................24WLCG perfSONAR network.......................................................................................................................................25Future Work for the WLC Network and Transfer Metrics Working Group.........................................26
New and Ongoing Monitoring and Diagnostic Efforts in HEP.........................................................27Using and Managing perfSONAR............................................................................................................................27
WLCG Experiments and Network Monitoring.....................................................................................30ATLAS................................................................................................................................................................................. 30LHCb Experiment Interface......................................................................................................................................31Complementary End-to-End Monitoring......................................................................................................34Summary: Progress in HEP Network Monitoring for 2015................................................................34
Related HEP Network Research............................................................................................................... 35Comparison with HEP Needs..................................................................................................................... 36
Recommendations............................................................................................................................. 36
Future Support for PingER............................................................................................................. 37
Acknowledgements........................................................................................................................... 38
Appendices.......................................................................................................................................... 38Appendix A: PingER Presentations etc. in 2015.................................................................................38
Publications and White papers (most recent first)......................................................................................38
3

Talks (most recent first).............................................................................................................................................39Appendix B: ICFA/SCIC Network Monitoring Working Group.......................................................39
Goals of the Working Group.....................................................................................................................................40
Figures Please note that for all yearly graphs the data point is for the end of the year.
Figure 1: Locations of PingER monitoring and remote sites as of January 2016. Red sites are monitoring sites, blue sites are beacons that are monitored by most monitoring sites, and green sites are remote sites that are monitored by one or more monitoring sites......................................9Figure 2: The growth in PingER monitoring hosts, remote hosts monitored, countries monitored & monitor-remote site pairs...........................................................................................................10Figure 3: Derived Throughput kbits/sec from SLAC to the World (since the throughputs in this graph are not normalized we have not shown N. America) until Dec 2015..................................10Figure 4: Derived Throughput kbits/sec from SLAC to the World until Dec 2015 shown as the exponential trendlines. The yellow line is to help show the rate of change..................................11Figure 5: Extrapolations on the throughput data with a focus on Africa.......................................12Figure 6: Derived annual throughputs seen from SLAC to African regions together with exponential trendlines....................................................................................................................13Figure 7 perfSONAR public network as of January 2016, there are currently around 1600 known deployed instances with likely an equal number of private deployments.....................................17Figure 8: OSG Network Monitoring Pipeline...............................................................................20Figure 10 The OSG network datastore architecture used to gather, organize and archive network metrics from the global OSG and WLCG perfSONAR deployment and make them available for visualization or higher-level services............................................................................................21Figure 11: Example of MaDDash dashboard in prototype instance at AGLT2 showing the USATLAS meshes for bandwidth and latency..............................................................................22Figure 12: OMD Check_MK screenshot showing some of the monitored perfSONAR hosts in WLCG............................................................................................................................................23Figure 13 WLCG perfSONAR network as of January 2016, there are 246 registered and active instances measuring latency/packet loss, network path and achievable throughput. Each red dot represents a WLCG recommended deployment of the latency and bandwidth instance, where each instance contains measurement tools, configuration tools (regular testing), local datastore and visualization............................................................................................................................26Figure 14 OSG centralized perfSONAR configuration system.....................................................28Figure 15: Example of OSG's mesh-management tool interface...................................................29
4

Executive Overview
This year’s report has a truncated PingER contribution because of insufficient support for that effort. Much of the focus will be on monitoring and network management activities in High-Energy Physics (HEP).
Internet performance is improving each year with throughputs typically improving by 15% (for developed regions), 20% (for some developing regions such as Russia, South and Central Asia) per year and losses improving by up to 25% per year. Most countries have converted from using Geostationary Satellite (GEOS) connections to terrestrial links. This has improved performance in particular for Round Trip Time (RTT) and throughput. GEOS links are still important to countries with poor telecommunications infrastructure, landlocked developing countries, remote islands, and for outlying areas. In some cases they are also used as backup links. In future, developing techniques such as weather balloons, solar powered drones, and low and medium earth satellites may assist in providing much reduced latencies and hence performance to remote areas1.
In general, throughput measured from within a region is much higher than when measured from outside. Links between the more developed regions including N. America2, E. Asia (in particular Japan, South Korea and Taiwan) and Europe are much better than elsewhere (2 - 10 times more throughput achievable). Regions such as S.E. Asia, S.E. Europe and Latin America are 5-9 years behind. However, in 2009, Africa was ~18 years behind Europe, also Africa’s throughput was 12-14 times worse than Europe and extrapolating the data indicated that it would further degrade to almost 60 times worse by 2040. Since 2009, due in large part to the installation of multiple submarine fibre optic cables to sub-Saharan Africa, there has been a significant improvement in Africa’s performance. It now appears to be catching up, such that if the present improvements are maintained, it could catch Europe by around 2040. However, since the initial bump in performance in 2010 and 2011, the growth rate has dropped. Hopefully future cable deployments3 will assist in accelerating the performance once again, especially for East Africa.
Africa and South Asia are two regions where the Internet has seen phenomenal growth, especially in terms of usage. However, it appears that network capacity is not keeping up with demand in these regions. In fact many sites in Africa and India appear to have throughputs less than that of a well-connected (cable, DSL, etc.) home in Europe, North America, Japan or Australia. Further the end-to-end networking is often very fragile both due to last mile effects and poor infrastructure (e.g. power) at the end sites, and also due to lack of adequate network backup routes. Africa is a big target of opportunity with over a billion people of which in 2012 only 15.6% were Internet users. This grew to 28.6% in 20154. It also had a 7,231% (compared to
1 Providing Internet access for hard to reach places, see https://confluence.slac.stanford.edu/display/IEPM/Providing+Internet+Access+for+hard+to+reach+places. 2 Since North America officially includes Mexico, the Encyclopedia Britannica recommendation is to use the terminology Anglo America (US + Canada). However, in this document North America is taken to mean the U.S. and Canada.3 A Giant Leap 2016? Africa is narrowing its Techno-gap, see http://www.huffingtonpost.com/david-tereshchuk/a-giant-leap-in-2016-africa_b_8901556.html4 See http://www.internetworldstats.com/stats.htm
5

832% for the world) growth in number of Internet users from 2000-2015. However, there are many challenges including lack of power, import duties, lack of skills, disease, corruption, and protectionist policies. In almost all measurements, Africa stands out as having the poorest performance. Further Africa is a vast region and there are great differences in performance between different countries and regions within Africa.
There is a moderate to strong positive correlation between the Internet performance metrics and economic and development indices available from the UN and International Telecommunications Union (ITU)5. Given the difficulty of developing the human and technical indicators (at best they are updated once a year and usually much less frequently); having non-subjective indicators such as PingER that are constantly and automatically updated is a very valuable complement.
Between the Fertility Rate6 and PingER derived throughput, there is a negative correlation7 (i.e. countries with higher Fertility Rates have lower Internet performance). This is very concerning since Fertility Rates drive population growth and predictions indicate the world population will exceed 11 billion by 2100. This is driven by Africa for which the population could exceed 6 billion8 by 2100. Such extreme growth threatens Africa’s development and stability. Add to this that achieving significant fertility declines requires education and easy access to information, and this in turn is enabled by good internet access. Thus countries such as Niger, Burkina Faso and Zambia with high Fertility Rates and low Internet performance are particularly at risk.
For modern HEP collaborations and Grids there is an increasing need for high-performance monitoring to set expectations, provide planning and trouble-shooting information, and to provide steering for applications. As link performance continues to improve, the losses between developed regions are decreasing to levels that are not measureable by PingER. Though the measurements for RTT, jitter, and unreachability9 are still correct, as the measured losses go to zero this also makes the throughput derivation unreliable. Alternative solutions to measuring the throughput are available, however they can be harder to install and absorb more network bandwidth. Examples of other measurement projects using the more intense methods are the MonALISA10 project that uses the pathload11 packet pair technique as well as file transfers, and perfSONAR12 that uses the iperf13 (and more recently iperf314) TCP transport mechanism.
In the last year there have been the following changes:
5 Development Indices and PingER Correlations at https://confluence.slac.stanford.edu/display/IEPM/Development+Indices+and+PingER+Correlations6 List of sovereign states and dependent territories by fertility rate at https://en.wikipedia.org/wiki/List_of_sovereign_states_and_dependent_territories_by_fertility_rate.7 Correlation of PingER throughput and Fertility at https://confluence.slac.stanford.edu/display/IEPM/Correlation+of+PingER+throughput+and+Fertility8 Six Billion in Africa, Robert Engleman, Scientific American February 2016.9 A host is considered unreachable when there is no response to any of the pings sent to it.10 MonALISA, see http:// monalisa.caltech.edu11 Pathload, see http://www.cc.gatech.edu/fac/Constantinos.Dovrolis/bw-est/pathload.html12 What is perfSONAR available at http://www.perfsonar.net/13 Iperf home page is available at http://dast.nlanr.net/Projects/Iperf/14 Iperf3 at ESnet is available at http://software.es.net/iperf/
6

Case study of Networking within Malaysia and S. E. Asia15.
Case study on the correlation of Fertility rates by country and Internet performance7.
Thiago Barbosa, a student from Brazil spent 3 months at SLAC successfully developing a PingER big data data warehouse using a 4 node cluster with the Hadoop File System, MapReduce, and Cloudera Impala. This demonstrated the utility of near real time flexible queries of the PingER database. Unfortunately due to insufficient development time, access is currently limited to SLAC only. We plan to continue this activity in the coming year with another student from Brazil.
There was a project to evaluate PingER monitoring using a Raspberry Pi16. It successfully demonstrated that the results were statistically the same as for a regular PingER host at the same location, and the robustness was similar. The idea was to provide a fully loaded server, to be powered by solar for remote sites such as Bario in the Kelabit Highlands of Borneo.
To quantify and help bridge the Digital Divide, enable world-wide collaborations, remote workforces, and workforce globalization in particular each-out to scientists world-wide, it is imperative to continue the PingER monitoring coverage to all countries with HEP programs and significant scientific enterprises. However, the funding for PingER is currently a major challenge.
15 PingER Malaysia-Internet Performance Measuring Project: A Case Study, Saqib Ali, , R. Les Cottrell and Anjum Naveed, presented at NETAPPS2015, see https://confluence.slac.stanford.edu/download/attachments/123309267/saqib-pres.pptx 16 R. Les Cottrell, Thiago Barbosa, Bebo White, Johari Abdullah and Topher White, Worldwide Internet Performance Measurements using a Raspberry Pi, presented at NETAPPS2015, see https://confluence.slac.stanford.edu/download/attachments/123309267/netapps-rpi.pptx
7

IntroductionThis report may be regarded as a follow up to the previous ICFA Standing Committee on Inter-regional Connectivity (SCIC) Monitoring working group’s Network reports17 dating back to 1997.
The current report updates the January 2015 report. As noted, PingER activities will not be covered in the same depth as earlier reports because of a lack of funding for this effort . We will be including some new areas related to network monitoring in HEP including updates and status on the perfSONAR efforts globally as well as the WLCG Network and Transfer Metrics Working Group activities.
MethodologyThere are two complementary types of Internet monitoring reported on in this report.
1. In the first we use PingER 18 which uses the ubiquitous "ping" utility available standard on most modern hosts. Details of the PingER methodology can be found in the Tutorial on Internet Monitoring & PingER at SLAC 19 . PingER provides low intrusiveness (~ 100bits/s per host pair monitored20) RTT, loss, jitter, and reachability (if a host does not respond to a set of 30 pings it is presumed to be non-reachable). The low intrusiveness enables the method to be very effective for measuring regions and hosts with poor connectivity. Since the ping server is pre-installed on all remote hosts of interest, minimal support is needed for the remote host (no software to install, no account needed etc.)
2. The second method (perfSONAR21 etc.) is for measuring high network and application throughput between hosts with excellent connections. Examples of such hosts are to be found at HEP accelerator sites and the Large Hadron Collider (LHC) tier 1 and 2 sites, major Grid sites, and major academic and research sites in N. America, Japan and Europe. The method can be quite intrusive (for each remote host being monitored from a monitoring host, it can utilize hundreds of Mbits/s or more for ten seconds to a minute, each hour). To minimize intrusion, the WLCG scheduling utilizes 30 second tests every 6-24 hours (depending upon host-pair groupings) rather than every hour. It also requires more support from the remote host. In particular either various services must be installed and run by the local administrator or an account is required, software (servers) must be installed, disk space, compute cycles etc. are consumed, and there are potential security issues22. The method provides expectations of throughput achievable at the network and application levels, as well as information on how to achieve it, and trouble-shooting information.
17 ICFA/SCIC Monitoring Working Group’s Annual Reports, see http://www.slac.stanford.edu/xorg/icfa/scic-netmon/#annual18 "PingER". Available http://www-iepm.slac.stanford.edu/pinger/; W. Matthews and R. L. Cottrell, "The PingER Project: Active Internet Performance Monitoring for the HEP Community", IEEE Communications Magazine Vol. 38 No. 5 pp 130-136, May 2002.19 R. L. Cottrell, "Tutorial on Internet Monitoring & PingER at SLAC". See http://www.slac.stanford.edu/comp/net/wan-mon/tutorial.html 20 In special cases, there is an option to reduce the network impact to ~ 10bits/s per monitor-remote host pair. 21 PERFormance Service Oriented Network monitoring Architecture , see http://www.perfsonar.net/ 22 WLCG/OSG perfSONAR details: https://twiki.opensciencegrid.org/bin/view/Documentation/DeployperfSONAR
8

PingER Status DeploymentDetails on the deployment of PingER can be found in the 2015 ICFA/SCIC Networking 2015 Annual Report23. The current January 2016 deployment of PingER can be seen in Figure 1 below.
Figure 1: Locations of PingER monitoring and remote sites as of January 2016. Red sites are monitoring sites, blue sites are beacons that are monitored by most monitoring sites, and green sites are remote sites that
are monitored by one or more monitoring sites.
Historical Growth of PingER Coverage Since 1998Figure 2 shows the growth in the number of PingER monitoring sites, countries monitored, active remote sites monitored by PingER from SLAC and monitor-remote host pairs since 1998. Initially the main regions monitored were North America, Europe, East Asia, and Russia. These were the regions with the main HEP interest. Starting in 2003-2004, we increased the number of hosts monitored in developing regions such as Africa, Latin America, Middle East and South Asia. Starting in 2007 the number of countries monitored plateaued at 160-170, and in 2011 the number of monitor-remote site pairs plateaued fluctuating between 700 and 850. Also less apparent but more important the number of monitoring sites (Monitors) dropped from 97 in 2011 to just over 70 in 2015. This was driven by the reduced support from the Higher Education Commission in Pakistan and somewhat masked by the addition of support from Malaysian Universities. We expect a further drop in number of monitors in 2016 as we disable more non –responding monitors in Pakistan.
23 International Committee for Future Accelerators - Standing Committee on Inter-Regional Connectivity (ICFA-SCIC) 2015 Report on Networking , compiled by Les Cottrell and Shawn McKee on behalf of the working group, January 2015.
9

Figure 2: The growth in PingER monitoring hosts, remote hosts monitored, countries monitored & monitor-remote site pairs
MetricsSee 25 for details on the use of the various PingER metrics and the measurements between 1998 and 2014. Here we only report on what is probably the most used metric, i.e. the throughput.
Yearly Throughput Trends
Figure 3 shows the annual throughput measured from SLAC using the Mathis formula24 to derive the throughput from PingER measured RTT and loss. Since the throughput derivation depends critically on the inverse RTT we have not shown SLAC to N. America since the small RTTs would distort the results.
Figure 3: Derived Throughput kbits/sec from SLAC to the World (since the throughputs in this graph are not normalized we have not shown N. America) until Dec 2015
It is seen that throughput performance for the world divides roughly into two with Europe, Australia, East Asia and North America leading, and the Middle East, Central Asia, South Asia and Africa bringing up the rear. Latin America and Russia are hovering on joining the leaders.24 M. Mathis, J. Semke, J. Mahdavi, T. Ott, "The Macroscopic Behavior of the TCP Congestion Avoidance Algorithm",Computer Communication Review, volume 27, number 3, pp. 67-82, July 1997
10

Parts of Latin America moved from satellite to fibre in 2000, and E. Asia in 1999. Also note the impact of moving the ESnet routing from E. Asia (in particular Japanese academic and research networks) to the US via New York in 2001 to a more direct route via the West Coast of the US. Also note that there is almost a 10 times difference in throughput between Africa and N. America, Europe and Oceania. Africa is the worst off region and had the slowest rate of improvement until 2008.To make the overall changes stand out more clearly, Figure 4 shows just the exponential trendline fits to monthly averages of the derived throughput on a log-linear scale (exponentials show up as straight lines).
Figure 4: Derived Throughput kbits/sec from SLAC to the World until Dec 2015 shown as the exponential trendlines. The yellow line is to help show the rate of change
The improved performance for Russia in 2001 is partially an artifact of measuring a single host (the Institute of High Energy Physics in Moscow) with high losses in 1999-2000 and adding a second host (Institute of High Energy Physics in Novosibirsk) with low losses in 2001. The slow increase for Europe and East Asia in Figure 4Error: Reference source not found is partially an artifact of the difficulty of accurately measuring loss with a relatively small number of pings (14,400 pings/month at 10 pings/30 minute interval, i.e. a loss of one packet ~ 1/10,000 loss rate). We looked at using a method25 that allows for zero packet loss, however it requires one to know the maximum congestion window size. Unfortunately this varies from host to host and can easily be changed, so we did not pursue it.
Looking at the data points one can see:
East Asia and Oceania are catching Europe; Russia is 6 years behind Europe and catching up; Latin America and the Middle East are 8 years behind and falling further behind; S. E. Asia is also 8 years behind but is catching up; S. Asia and Central Asia are 13 years behind and keeping up; We deal with Africa in the next section.
25 “Modeling TCP throughput: A simple model and its empirical validation” by J. Padhye, V. Firoiu, D. Townsley and J. Kurose, in Proc. SIGCOMM Symp. Communications Architectures and Protocols Aug. 1998, pp. 304-314.
11

Africa
Africa is 14 years behind Europe. See Figure 5 Error: Reference source not foundwhere it is seen:
In 2008-2009 Africa was 12-14 years behind Europe and even worse was falling further behind such that in 2030 it would have been 60 times worse off or almost 28 years behind.
Prior to 2008 the rate of improvement was a factor of 2 in 7 years Since 2008 the improvement is a factor of 3 in 5years and at the current rate it could
catch up with Europe by around 2040. This remarkable improvement is largely a reflection of the impact of the multiple
terrestrial links installed since 200826, initially driven by the soccer world cup. However, there is evidence that the rate of catch up has fallen off in 2013, 2014 and
2015.
Figure 5: Extrapolations on the throughput data with a focus on Africa.
More detail on the derived throughput seen from SLAC for the various African sub-regions is seen in Figure 6.
26 African Undersea Cables, see http://manypossibilities.net/african-undersea-cables/
12

Figure 6: Derived annual throughputs seen from SLAC to African regions together with exponential trendlines
It is seen that: North Africa, for long the leader is being caught up to by Southern and West African
countries, Sub-Sahara tracking all Africa but about 10% lower. East Africa and West Africa saw big improvement in 2010. It is still improving but much
more slowly, possibly more linearly rather than exponentially. The East African region appears to have the worst performance.
There are reports3 that a new subsea cable, is to be laid off Africa's eastern coastline by Liquid Sea, a literally offshore subsidiary of Liquid Telecom, which already runs a pan-African network based on terrestrial fiber-optic cable supplemented by satellite links for rural and remote areas. “It will offer speeds of 20-30Tbps, up to 10 times the capacity of existing submarine cables in the region, enabling a reliable and affordable international connectivity service to both coastal and landlocked countries in Eastern, Central and Southern Africa.” Hopefully this will measurably assist in dramatically improving access in East Africa.
PingER Progress in 2015There is a complete history of the PingER project this millennium27. Here we only report on 2015.
We extended the collaboration with the University of Malaysia in Sarawak (UNIMAS), the University of Malaya (UM) in Kuala Lumpur and Universiti Technologi Malaysia (UTM) in Johor Bahru to add Universiti Utara in Northern mainland Malaysia (UUM) and the Malaysia Research and Education Network (MYREN) Internet Service Provider. We held 12 (monthly) Skype meetings28 with NUST, UM, UTM, UUM, UNIMAS and MTREN.27 History of PingER this Millenium, see https://confluence.slac.stanford.edu/display/IEPM/History+of+growth+in+PingER+hosts+this+millenium 28 2015 PingER Meetings, see https://confluence.slac.stanford.edu/display/IEPM/2015+PingER+meetings.
13

We worked with the Rector of NUST and the new Director of SEECS to ensure continuity of the PingER project at NUST, following Dr. Arshad Ali’s move from the Director of SEECS to the executive director of the Pakistani Higher Education Commission (HEC). This post is the second highest in HEC, right after the chairman.
We met with Colombia RENATA NREN leaders and the Colombia minister of IT to discuss the use of PingER in Colombia. To assist we put together a short case study on Colombia29. However after several months this collaboration did not go anywhere.
To support multiple Big Data Analysis of PingER data projects at UM, UUM, UFRJ, and Amity University in New Delhi we gathered both the raw (as measured) data and the hourly analyzed data from 1998 to the present and made it available30 via anonymous FTP. We also provided information on retrieving the data31.
To prepare for moving the PingER monitor at SLAC to a virtual machine we verified thatr this made no significant statistical difference32. Following this the PingER monitor at SLAC has been moved to a virtual machine and the old bare metal host retired.
We successfully ported PingER to a Raspberry Pi version 133.
To support the porting of PingER to an Android smartphone we made the PingER measurement Agent available via Github34.
Utilizing a SLAC 4 host cloud with~16Gbytes each, plus access to 220Gbytes each, with Hadoop, Cloudera and Impala, Thiago Barbosa put together a warehouse of hourly PingER data going back to 1998. It successfully provided database queries to access the full set of PingER data with response times of several seconds. Unfortunately due to lack of time at SLAC, we were unable to make the access available outside of SLAC.
We put together a report on Duplicate ping responses35.
We put together a case study on the impact of demonstrations against the government in Malaysia (August 28-31st 2015) on various Malaysian hosts36.
29 Colombia, see https://confluence.slac.stanford.edu/display/IEPM/Colombia. 30 Archiving PingER data by tar for retrieval by anonymous FTP, see https://confluence.slac.stanford.edu/display/IEPM/Archiving+PingER+data+by+tar+for+retrieval+by+anonymous+ftp. 31 Retrieving Archived PingER data from Anonymous FTP, see https://confluence.slac.stanford.edu/display/IEPM/Retrieving+Archived+PingER+data+from+Anonymous+FTP. 32 PingER on a Virtual Machine at SLAC, see https://confluence.slac.stanford.edu/display/IEPM/PingER+on+a+Virtual+Machine+at+SLAC 33 ePingER Project at SLAC, see https://confluence.slac.stanford.edu/display/IEPM/ePinger+Project+at+SLAC. 34 Official pinger2 network monitoring, see https://github.com/iepm/. 35 Duplicate packets, see https://confluence.slac.stanford.edu/display/IEPM/Duplicate+packets. 36 Malayisan unrest Aug-Sep 2015, see https://confluence.slac.stanford.edu/display/IEPM/Malaysian+unrest+Aug-Sep+2015.
14

We put together the study on the correlation between Fertility Rates and PingER measured Internet performance7.
We prepared and presented five papers at the 4th International Conference on Internet Applications, Protocols and Services (NETAPP2015) Cyberjaya, Malaysia, 1-3 December 201537.
Bebo White made a keynote presentation at the CITA 9 th International Conference on IT in Asia38 on Transforming Big Data into Knowledge. Bebo used PingER as a case study on what you can do with PingER and how to access the data.
High Performance Network Monitoring
IntroductionPingER is an excellent light-weight way to measure global network trends as was shown earlier in this report, but doesn’t provide enough detail for high-performance network monitoring requirements in the Worldwide LHC Computing Grid (WLCG) or in the Open Science Grid (OSG). Grid sites with significant amounts of storage and/or computing power critically rely upon the network to enable them to function effectively with their peer sites globally. Problems in the network can both be severely disruptive and hard to identify and locate. For example, very low levels of packet-loss can significantly degrade the throughput between sites with large round-trip times (RTT). Routes between sites can unexpectedly change pushing traffic onto less capable or improperly configured network paths. Bandwidth between sites may be significantly less than what is provisioned (wire-speed) because of misconfigurations or competing traffic. We need tools that can track and identify how our networks are performing in detail.
To gather more detailed metrics we have chosen to deploy the perfSONAR toolkit39 at our WLCG and OSG sites worldwide. Over the last 5 years we have crafted a consortium amongst the perfSONAR developers, the WLCG experiments and the Open Science Grid to gather detailed network metrics amongst our largest grid sites, persistently store those metrics and provide visualization and analytics tools for users to understand how the networks are behaving. In the following sections we will discuss the components and collaborations we have in place to provide the needed network monitoring with HEP.
perfSONAR for HEP
High-energy physics grid sites rely upon the network to provide access to their computing and storage. The network provides the basis for users to access those resources and for virtual organizations to organize the sharing and use of their member's resources. When there are problems in the network, it can significantly degrade or even disable users and VOs ability to do their science.
37 4th International Conference on Internet Applications, Protocols and Services (NETAPP2015) Cyberjaya, Malaysia, 1-3 December 2015, see http://netapps2015.internetworks.my/v2/. 38 CITA 9th International Conference on IT in Asia, see http://www.cita.my/cita2015/. 39 The perfSONAR toolkit, see deployment information http://www.perfsonar.net/deploy/.
15

Networking problems can be difficult to identify and isolate for numerous reasons:
Network paths typically span multiple administrative domains with no single entity having complete access to the end-to-end infrastructure components
Applications that work well on a Local Area Network (LAN) may behave significantly differently when run on a Wide Area Network (WAN) due to the impact of latency on the network communication involved
End-host or LAN issues may be the actual source of problems and differentiating HOST vs LAN vs WAN problems can be difficult without sufficient expertise
Problems that actually exist on a host or in the LAN may not be "visible" in local use and only show up when the application is used in the WAN. The tendency is to believe the WAN is the problem even though it many cases it isn't
Real WAN problems are hard to localize and it is not practical or effective to contact every entity managing a portion of the network path on which you see a problem.
For high-performance, data intensive sites, PingER is insufficient to address these issues. Our goal is to help users, Virtual Organizations (VOs) and site administrators better understand their network infrastructure and enable them to more effectively find problems and isolate their root cause. To do this WLCG is mandating its Tier-0/Tier-1/Tier-2 sites deploy perfSONAR Toolkit instances in their infrastructure. The following sections will highlight their management and use for HEP.
The perfSONAR ProjectBecause our working group relies upon perfSONAR for our high performance network monitoring it is appropriate to review the status of the perfSONAR effort. perfSONAR is an open source software project that enables seamless deployment of a network monitoring infrastructure. perfSONAR is currently a successful medium size open source project with ~1,600 known public deployed instances, and likely an equal number of private deployments. The global Research & Education (R&E) network ecosystem is comprised of hundreds of international, national, regional and local-scale networks. While these networks all interconnect, each network is owned and operated by separate organizations (called “domains”) with different policies, customers, funding models, hardware, bandwidth and configurations. This complex, heterogeneous set of networks must operate seamlessly from “end to end” to support science and research collaborations that are distributed globally.
The perfSONAR collaboration is an Open Source project lead by ESnet, Internet2, Indiana University, and GEANT. Each organization has committed 1.5 FTE effort to the project. The project also gets additional help from many others in the community, such as OSG, RNP, SLAC, and others.
The perfSONAR Roadmap is influenced by the following: requests on the project issue tracker; annual user surveys sent to everyone on the user list; regular meetings with VOs using perfSONAR such as the WLCG and OSG; and discussions at various perfSONAR related workshops.
16
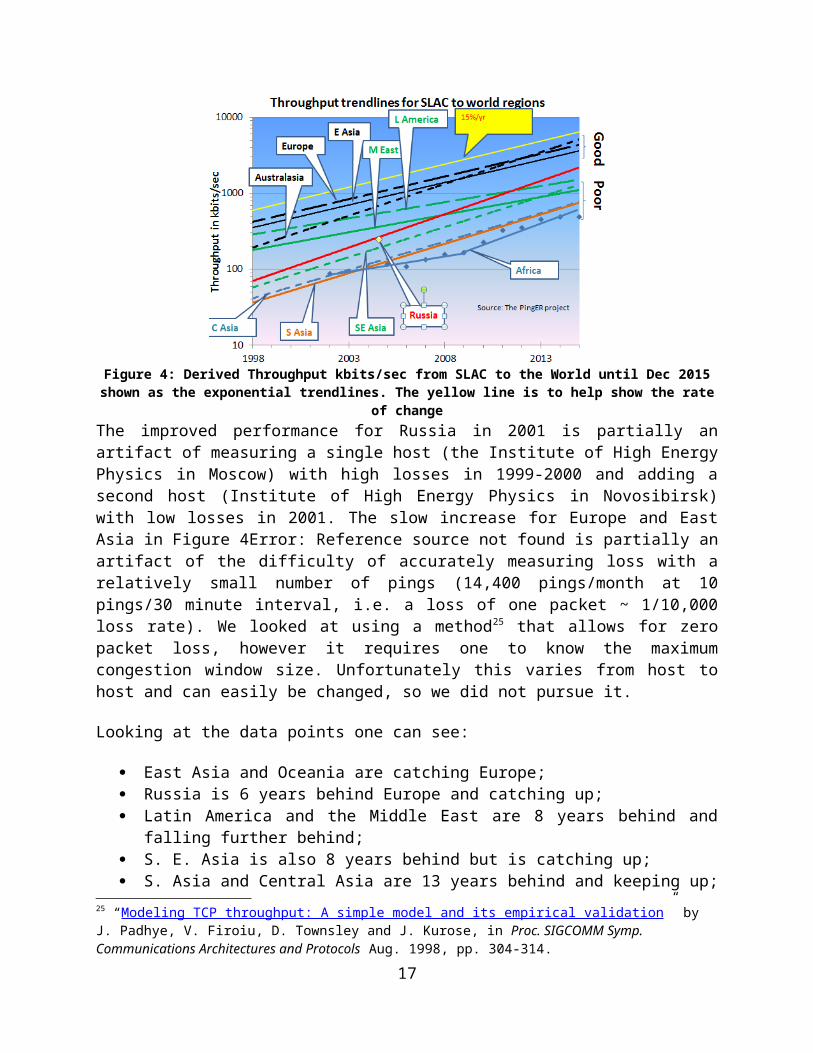
Figure 7 perfSONAR public network as of January 2016, there are currently around 1600 known deployed instances with likely an equal number of private deployments
Recent Changes to perfSONAR
perfSONAR has historically been packaged as the perfSONAR Toolkit: an ISO containing a custom distribution of the CentOS operating system with all of the perfSONAR tools and services. Starting with perfSONAR 3.5, there are several other installation options as well for certain versions of both CentOS and Debian/Ubuntu:
1. perfSONAR-Tools: This bundle includes all tools used by perfSONAR. These tools are useful for network testing and troubleshooting in general, and we recommend you install these tools on any host where you need to maximize network performance, such as a Data Transfer Node.
2. perfSONAR-TestPoint: This bundle is targeted at organizations that run a centrally managed test mesh and use a central measurement archive. It contains all perfSONAR tools, including those to publish the location of these services to the perfSONAR-PS Simple Lookup Service and to run scheduled measurements. This is also the bundle to use on low-end hardware.
3. perfSONAR-Core: The perfSONAR-Core install includes everything in the perfSONAR-TestPoint install plus the measurement archive.
4. perfSONAR-Complete: This is the full set of perfSONAR packages Toolkit distribution. It includes everything in perfSONAR-Core and also contains web interfaces and Toolkit configuration. This provides an option for installing these packages without using the Toolkit ISO.
5. perfSONAR-CentralManagement: The perfSONAR-CentralManagement Bundle installs the central mesh config, MaDDash40, centralized config service and the autoconfig.
40 Monitoring and Debugging Dashboard, http://software.es.net/maddash/
17

perfSONAR next steps
The current perfSONAR release is version 3.5. The theme for the 3.6 release is control and scalability, and release is currently scheduled for September, 2016.In the 3.6 release, there will be a noticeable impact to both users and perfSONAR developers, and to also lay the groundwork for future releases. What the users get:
A test scheduler:- Shared by all tests and aware of the resources each uses- Containing finer grained controls about who can run tests and what tests they are
allowed to run.- Increased visibility and control as to when tests will be run
New graphs that allow for easier comparison of multiple metrics A web interface for creating test meshes Easier selection of endpoints based on topology location, geographic location,
accessibility and/or custom searches Dashboards that support alerting based on patterns across an entire mesh Debian 8 support CentOS 7 versions of the tools, testpoint, core, and central management bundles The ability to publish summarized results about private deployments Ability to easily view perfSONAR logs in Kibana using logstash
(https://www.elastic.co/)
What developers (both internal and external to the core team) get: Additional metadata about deployed hosts A test scheduler with a public rest API they can integrate into their applications, such as
SDN-like applications A framework for integrating new tools with the perfSONAR test scheduler, without
changing the scheduler code. A new LS cache that only requires a query to one location and includes a richer search
API An alerting API from MaDDash that allows easier diagnosis of network or measurement
infrastructure issues APIs to determine the closest measurement node APIs to determine if a test can be run to a node
What is setup for future versions: A new test scheduling platform that allows for easier integration of new tools and
addition of new control in the future The start of a CentOS 7 transition for the full toolkit. Pieces needed for a true test setup wizard where the user provides little to no criteria and
the tools come up with a reasonable mesh. Additional experience with users running large deployments
18

Network Monitoring in Open Science GridThe Open Science Grid (OSG) facilitates access to distributed high throughput computing for research in the US. Since 2012, part of OSGs focus has included the network because of its centrality in connecting the components of science computing grids. OSG intends to provide networking information for its constituents and its partners (like the Worldwide LHC Computing Grid (WLGC)).
OSG Vision
OSG intends to become the network information provider for its users and its partners. To do this OSG has been guiding and supporting the deployment of perfSONAR toolkit instances at its member and partner sites. More importantly OSG has developed a “Network Datastore” which it operates to gather perfSONAR toolkit information from its member and partner sites and make it available for anyone to use. In addition OSG provides tools to register perfSONAR instances and organize testing between sites. Details on the datastore are in the following section and Figure 8below illustrates the overall data flow.
Figure 8: OSG Network Monitoring Pipeline
Network Datastore
19

OSG and WLCG have worked closely together on perfSONAR for high-energy physics (and others). OSG, as a member of WLCG, has agreed to become the control hub for the global perfSONAR deployment and has developed a Network Datastore, based upon the Esmond41 datastore in perfSONAR v3.5, to host all the perfSONAR metrics. This datastore collects in near real time all perfSONAR test results from OSG/WLCG perfSONAR instances and allows users to query the test results from a single Esmond instance. The datastore also publishes the test results through ActiveMQ server hosted by WLCG that users can subscribe to. Figure 9 provides an architecture diagram of the OSG network datastore, showing the use of a back-end Cassandra42 database easily scaled by adding additional instances. This datastore is intended to become the source of network metrics for OSG and WLCG and went production in November 2015.
Figure 9 The OSG network datastore architecture used to gather, organize and archive network metrics from the global OSG and WLCG perfSONAR deployment and make them available for visualization or higher-level services.
perfSONAR Metric Visualization
While perfSONAR provides a convenient way to gather standardized network metrics via deploying a toolkit instance, it can still be cumbersome to try to gather, check and interpret this data. As USATLAS began deploying perfSONAR instances we realized that a critical missing 41 ESnet Monitoring Daemon, http://software.es.net/esmond/42 See the Apache Cassandra project, http://cassandra.apache.org/
20

component was a means of centrally monitoring and displaying the information we were collecting. ESnet had some initial efforts in this direction by creating Nagios “plugins” that could query individual perfSONAR instances and check to see if the data returned was within bounds.
Originally we started a project to provide a visualization and management dashboard, called the Modular Dashboard project. However the developer left BNL (where the project was hosted) in 2013 and we replaced it with MaDDash, a project created and supported by ESnet. We now use MaDDash to monitor all our WLCG and OSG metrics. The prototype instance can be seen at http://maddash.aglt2.org/maddash-webui/ (and in Figure 10). Colors indicate whether the metrics tracked are OK (green), WARNING (yellow), CRITICAL (red) or UNAVAILABLE (orange). MaDDash also supports “drilling-down” by clicking on the cell which will take the user to an interface with historical data, graphs and details of the test results.
Figure 10: Example of MaDDash dashboard in prototype instance at AGLT2 showing the USATLAS meshes for bandwidth and latency.
OSG hosts the production instance at https://psmad.grid.iu.edu/MaDDash-webui/ .
Infrastructure and Service MonitoringIn addition to metric visualization, the global perfSONAR deployment has another challenge. We need to be able to quickly find problems in the measurement infrastructure itself. While perfSONAR has evolved to be more robust over time, there are still cases where it has problems and fails to gather the needed metrics. To address this we have created a simple-to-deploy infrastructure monitoring system based upon OMD (Open Monitoring Distribution; http://omdistro.org/ ) which is a single RPM install of Nagios and many integrated applications. This has allowed us to quickly find infrastructure issues and better support end-sites when they have problems. We have created service checks for all perfSONAR services (by host type) as well as checks on registration information like admin name and email, latitude and longitude and program version. See Figure 11 for a view of OMD summarizing the WLCG perfSONAR host status.
21

Figure 11: OMD Check_MK screenshot showing some of the monitored perfSONAR hosts in WLCG.
OSG hosts the production version@ https://perfsonar2.grid.iu.edu/WLCGperfSONAR/check_mk
WLCG Network and Transfer Metrics Working GroupThe Worldwide LHC Computing Grid (WLCG) relies on the network as a critical part of its infrastructure to inter-connect site’s’ resources. Recently, networks have been evolving, both in terms of their speed and corresponding network traffic growth, as well as in the emergence of new technologies and paradigms. This evolution has caused rapid growth of the traffic between sites; both in terms of achievable peak transfer rates as well as in total amount of data transferred. Some of the major Research and Education Networks (R&E), such as ESnet, have seen traffic grow a factor of 10 every four years. LHC experiments have adapted their computing models to benefit from this trend by introducing a more interconnected system, moving away from strict tier-based hierarchies. As the scale and complexity of the current LHC network grows rapidly, network virtualization technologies such as Software Defined Networking (SDN) are paving the way for performance and cost- optimized networks. This has been recognized by the LHC experiments and new projects, such as NSF- funded ANSE, are trying to exploit the possibility to create on- demand topologies (via dynamic advance network bandwidth allocations) to increase efficiency of the transfers between LHC data centers.
To follow up on the recent developments in the network area a working group has been established within WLCG as part of the WLCG Operations Coordination initiative called Network and Transfer Metrics. It aims to identify, document, integrate and combine all the network-related monitoring data collected by the WLCG infrastructure. This includes FTS monitoring information, monitoring data from the XRootD federations as well as results from the perfSONAR tests. In addition, it aims to establish a WLCG-wide perfSONAR network that focuses on measuring latencies, traceroutes and throughput on the LHCOPN/LHCONE and commission it to full production operations in collaboration with OSG. During the 2-3 LHCOPN/LHCONE meetings per year we discuss various network monitoring issues in that context, including connecting Tier2 & Tier3 computing centers to LHCONE, measuring
22

LHCONE routing reachability - can all sites route to each other and gathering NSP LHCONE aggregate usage metrics.
In the following sections we will describe the main use cases driving the working group, current status of the perfSONAR network and plans for the near future. The working group has been also involved in other areas described in the document, such as configuration and capacity management, design of the common datastore and analytics, integration with transfer systems, visualization as well as operations and support.
Network Performance Monitoring and Metrics
Network performance monitoring has been introduced in WLCG by a dedicated task force back in 2013, which has established a pervasive network monitoring infrastructure based on the perfSONAR Toolkit. The main goals that motivated a large- scale deployment at all sites were the ability to find and isolate network problems, characterize network usage, and provide a source of network metrics to the higher level services. The choice of the open source perfSONAR toolkit was mainly driven by the consensus and prior experience of the R&E network providers that have formed the perfSONAR consortium to help develop the tools and establish a network that would allow identifying and better debugging Wide Area Network (WAN) issues.
Network performance monitoring has also been deployed in parallel by several data management systems, which were focusing mainly on measuring transfer rates and data link quality from the perspective of the data transfers. It was therefore logical to join the two areas and combine metrics from both network and transfer systems. This has led to the Network and Transfer Metrics working group being established in the autumn of 2014. Among the initial objectives of the work group was the continuation of the commissioning and maintenance process of the WLCG network monitoring based on perfSONAR, but also to establish pilot projects that would facilitate the integration of the network and transfer metrics.
Experiments Use Cases
As part of the working group effort we have solicited desired use-cases for network and transfer metrics from the LHC experiments, as well as feedback from the network related middle-ware and applications teams on what they are able to provide. This section summarizes the information we were able to gather.In general, the core use case is to have the capability to define and understand slow transfers that are observed by the experiments. This involves identifying the weak links with a combination of different tools that provide network measurements, and being able to narrow down the source of the problem that can be then addressed by sites, experiment operations or network providers. The main focus so far has been on the ability to combine existing perfSONAR network measurements with monitoring information from transfer systems such as FTS and XRootD and use them to distinguish between pure network and storage related issues. For network related problems, we benefit from the existing perfSONAR infrastructure to further debug the Wide Area Network (WAN) issues and localize the problem.
23

Another important aspect that has been requested is to introduce a coordinated response to the network performance problems. Since network problems can often become quite complex, defining procedures that would involve all the relevant parties and also inform all the experiments would be very beneficial. In addition, providing notification and alerting mechanisms would be extremely useful.
Enabling network-aware tools is another common use case, mainly driven by the need to optimize transfers and/or experiment workflows. This involves providing a uniform way to access and integrate existing measurements and the ability to define a so called “distance” metric between storage elements (and/or sites) that would integrate a range of different metrics such as link status, utilization, functional tests, occupancy, etc. and provide a cost matrix that can be used to decide on the job placement, finding closest replicas, determine closest storage where data can be uploaded, etc.
Finally, the experiments desire the ability to understand both new and existing network connections between sites. They want to easily commission new links by running on-demand throughput and latency tests. By also providing regular testing between all sites (full mesh) we can provide a baseline (expectation setting) for each network path and potentially replace some of the existing regular (synthetic) transfer tests that all experiments run to fill in the blank areas that have no production traffic. This also provides an opportunity to consolidate the number of existing regular testing activities that are currently run over the network.
WLCG perfSONAR network
One of the important sets of metrics our working groups is tasked with providing concerns measurements of the network along specific paths of interest. This is to be contrasted with end-to-end measurements (typically data transfers or data access over the WAN) that include the effects of the end-hosts and the applications involved in the process. Having network-only metrics is critical for identifying when there are issues in the network itself, which requires a very different resolution process, versus problems in the end-hosts, applications and/or their interaction with the network.
To gather network-specific metrics, we rely upon the WLCG/OSG perfSONAR deployment, which was mandated for all WLCG Tier-2 and above sites in autumn of 2013. Our working group is responsible for ensuring those metrics are consistently and correctly collected and made available for the experiments’ use. We rely upon the perfSONAR Toolkit to instrument our end-sites with the capability to make a standardized set of network- related measurements.
Each WLCG/OSG Tier-[0/1/2] needs to provide two types of perfSONAR services: 1) latency and 2) bandwidth. The latency instances are measuring end-to-end latency, packet loss, packet re-ordering and number of TTLs hops by implementing the One-way latency measurement protocol (OWAMP). During the year 2015 the working group has commissioned a configuration that continuously measured all the latency metrics at 10Hz (600 packets/minute) on more than 8000 links (i.e., full mesh testing between 95 sites). The bandwidth instance is measuring achievable throughput, including number of packet retransmits (using iperf3 tool) and network path (configurable via traceroute or tracepath tools). At the end of 2015 we have been
24

continuously measuring 12000 network paths every hour (full mesh testing between 113 sites). In order to facilitate debugging, the working group has also mandated deployment of the instances at the R&E providers, including both ends of the transatlantic links, ESNet, Internet2 and GEANT. All measured metrics are centrally collected and are available both as a (near real-time) stream as well as on request via OSG central datastore API.
The working group maintains a WLCG and OSG specific documentation on perfSONAR, its motivation, installation, configuration, use and troubleshooting.
Figure 12 WLCG perfSONAR network as of January 2016, there are 246 registered and active instances measuring latency/packet loss, network path and achievable throughput. Each red dot represents a WLCG recommended deployment of the latency and bandwidth instance, where each instance contains measurement tools, configuration tools (regular testing), local datastore and visualization.
Future Work for the WLC Network and Transfer Metrics Working Group
In summary, the working group has established and made progress in several areas of the WLCG network monitoring and plans to continue to focus on the following areas in the near-term.
Integration with transfer systems is foreseen to become the main driver of the evolution for the working group. The near-term plan is to finalize the work on the existing pilot projects and evolve the existing prototypes to a production level. A particular interesting area of work that came out of studying the ways how to determine network proximity between hosts (which was needed to connect storage and network topologies) was to use graph databases and algorithms to develop a model of the current state of the WLCG network, auto-detect network issues and issue notifications/alerts.
In visualization and dashboards we foresee an increased activity in integrating the network measurements in the existing dashboards including, both general purpose ones such as FTS and
25

XRootD dashboards, as well as experiments specific ones such as ATLAS Distributed Data Management Dashboard.
In operations and support, we foresee the need to tune the existing support channels, both perfSONAR support and the recently established WLCG Network Throughput based on the feedback received from experiments and sites. We also plan to evolve the current infrastructure monitoring by adding site alerting as well as integrate it with the current operational availability policies of the experiments. Finally, we will be looking into adoption of the perfSONAR 3.6 to be released later this year, which will introduce a new central configuration management tool that would help us move away from the current WLCG specific solution to a more standardized one.
New and Ongoing Monitoring and Diagnostic Efforts in HEPMost HEP users are not "network wizards" and don't wish to become one. In fact as pointed out by Mathis, the gap in throughput between what a network wizard and a typical user can achieve was growing significantly from the late 1980’s to the late 1990’s.
Within the last 15 years, because of improvements in default OS TCP stack settings, new protocols, hardware, firmware and software, this gap has significantly decreased but still remains in 2016. Because of HEP's critical dependence upon networks to enable their global collaborations and grid computing environments, it is extremely important that more end-user focused tools be developed to support these physicists and continue to decrease the gap between what an expert can achieve and what a typical user can get “out of the box”.
In this report we have documented the effort in the HEP community to develop and deploy a network measurement and diagnostic infrastructure which includes end hosts as test points along end-to-end paths in the network. This is critical for isolating problems, identifying bottlenecks and understanding infrastructure limitations that may be impacting HEP’s ability to fully utilize their existing networks. The history of the effort was documented in previous year’s report and we won’t repeat it here, instead highlighting updates during the last year in the following sections.
Using and Managing perfSONAR
One of the challenges for a large scale deployment of perfSONAR is managing the tests amongst the participating sites. When USATLAS began deploying perfSONAR in 2008, all configuration for each site was controlled by “emails” to the perfSONAR administrators. Every change (addition or deletion) required every administrator to update their configuration. The perfSONAR developers provided a solution with the so called “mesh-configuration” (see Figure13). The perfSONAR toolkit was updated to provide a mesh agent that could get its configuration from URL. A web server could provide the JSON configuration for a whole mesh and changes could be made centrally. The perfSONAR administrators just needed to configure their agent to read from the specified URL for each mesh they participate in.
26

Figure 13 OSG centralized perfSONAR configuration system
In 2014, OSG improved upon this system by providing a secured GUI in MyOSG (see Figure14) that could construct meshes based upon the perfSONAR registration information required by OSG and WLCG. All perfSONAR instances in OSG are required to be registered in OIM while all such instances in WLCG (not in OSG) are required to be registered in GOCDB. This allows OSG to centrally gather all needed information to create meshes for use by perfSONAR instances all over the world. Once created the meshes automatically update as registration information is updated.
One further interesting capability was enabled by OSG because of their mesh-management system: since OSG knows which perfSONAR hosts are participating in which meshes it is possible to have each perfSONAR instance configure a single URL (even if they participate in multiple meshes). We call this new URL the “auto-mesh” URL and is identical for all perfSONAR hosts except for the last part, which is the perfSONAR host’s fully qualified domain name, e.g., https://myosg.grid.iu.edu/pfmesh/mine/hostname/<FQDN>. This is very powerful in that now perfSONAR admins no longer need to update their configuration if meshes are added or changed.
Using the mesh management system from OSG, we can now easily manage how, where and when tests are run. We need to walk a careful line of testing only enough to meet our needs. We have a tension between those who would like better test coverage vs those concerned about using available bandwidth to test.
27

Figure 14: Example of OSG's mesh-management tool interface
The latency test we have configured are managed by OWAMP and measures one-way delays between the latency node and its test partner at another site. We send 10Hz of small UDP packets to each test partner continuously (600 packets/minute). Since absolute time accuracy is critical for this test, part of a latency node configuration includes setting up a reliable time service (ntpd) configuration to ensure the node keeps accurate time. From this measurement we get the one-way delay to the partner site as well as information on any packet losses for each 1 minute interval (how many of the 600 packets were lost?). It is the packet loss measurement that is very sensitive to problems along the network path.
The second type of test measures throughput using Iperf3. Within a Tier-1 cloud mesh we schedule a 30 second throughput test in each direction (source to destination and destination to source) every 6 hours. In addition EACH end schedules it (both ways) so we end up with two 30 second tests each direction each 6 hours. We additionally are trying to sample ALL network paths but at a much lower cadence. To do this we have setup a WLCG-wide mesh which tries to run a 30 second throughput test each direction, once per week. Until we can determine the impact of this, we have limited the WLCG mesh to be the largest 50 sites (according to their published disk storage numbers).
The last type of test is a critical one: traceroute. The traceroute test tracks the network path between the host and any destination and is run every 20 minutes to EACH destination which is being tested. If the route changes, we record the new route in the perfSONAR measurement
28

archive. This is required to understand the topology we are measuring and can alert us to routing changes that may be correlated with observed network problems.
Details about how to setup and configure perfSONAR for OSG/WLCG are maintained at https://twiki.opensciencegrid.org/bin/view/Documentation/DeployperfSONAR
As of the end of 2015, OSG has developed a prototype standalone instance of the mesh-configuration utility. This version can be easily installed outside of OSG’s OIM infrastructure and doesn’t require the OIM or GOCDB registration data to find perfSONAR toolkits to manage. Instead this version leverages the perfSONAR lookup service used by all installations, making it much more lightweight to deploy and use. The goal is to eventually replace the OSG OIM version with this one.
WLCG Experiments and Network Monitoring
ATLAS
The ATLAS experiment, especially because of the involvement of the PANDA team with the ANSE project, has been actively updating their software to take advantage of network information in making higher-level decisions about workflows, data-access modes and data movement. Underlying this is getting all the relevant data easily accessible within the ATLAS information systems. During the last half of 2015, significant progress was made in incorporating the network metrics, gathered by OSG, into an analytics platform based upon ElasticSearch. This effort was led by Ilija Vukotic.
The idea was to create a network analytics service that indexes historical network related data while providing predictive capabilities for near term network throughput performance.Its primary functions are to:
● Aggregate, and index, network related data associated with WLCG “links”● Serve derived network analytics to ATLAS production, DDM & analysis clients● Provide a generalized network analytics platform for other communities in the OSG
There are a number of important sources of data about how the network is behaving:
perfSONAR: The metrics are already available from the Open Science Grid and this project used the Active Message Queue at CERN that OSG publishes all its data to. FTS: File Transfer Service - the lowest-level data movement service doing point-to-point file transfers on behalf of Rucio. FAX: Federated ATLAS storage system using XRootD protocol. Provides a global namespace, direct access to data from anywhere. Indexing FAX cost matrix.
Shown in Figure 15 is the logical architecture that was developed to get all the relevant data into the envisioned analytics platform based upon ElasticSearch and Kibana.
29

Figure 15: Network data analytics logical architectureATLAS has had this functioning since December 2015. The python collectors not only collect, and parse source information but also add mapping information loaded from AGIS. Collectors, (currently run on a single VM) were tested up to levels much higher than actually needed. The collectors can handle up to 24 h of ElasticSearch outage without dropping data. ElasticSearch index and search performance was measured to be higher than predicted needs of all our clients, both in terms of number of parallel requests and latency. The relevant data rates for the types of data gathered:
Data source Data rate [MB/day] Documents/dayperfSonar 880 5MFAX cost 15 120kFTS transfers 50-150 200k – 600k
The ElasticSearch instance used by ATLAS is currently hosted by CloudLab at Clemson. Data are backed up off site at University of Chicago. Work is ongoing on establishing one more ElasticSearch cluster at CERN, to be used exclusively by the production level ATLAS services like PanDA and Rucio.
Users can access all the data and construct their own graphs and dashboards at http://cl-analytics.mwt2.org:5601/
Work is ongoing to test the impact of using this data as part of ATLAS operations. Various data enhancements (transforms and calculated values) are also being developed to augment the
30

collected data. Additional sources of network information will be added starting with LHCONE flow data.
LHCb Experiment Interface
The LHCb experiment is interested in monitoring data transfer activities on the network layer for its distributed computing activities by means of metrics provided by perfSONAR. The main goal is to understand if a given problem is caused by the network layer or has some other source. LHCb uses the DIRAC43 middleware to interface to distributed computing resources for its data management and data processing activities. The idea is to correlate transfer quality acquired by Data Management Operations with packet loss rate provided by perfSONAR. If the result is positive then shifters can easily determine a problematic endpoint and prepare an incident ticket to the relevant site. A possible extension of this idea will also provide information about the routing path, that could help to determine if the problem is caused by a local issue or some routers between the endpoints. Moreover, throughput and one-way-delay measurements provided by perfSONAR could help in the future to optimally select a destination for data produced by LHCb payloads.
Architecture of the perfSONAR-DIRAC bridgeOne of the goals in 2015 was to create a bridge between perfSONAR and DIRAC. Since network metrics provided by all perfSONAR endpoints was already available in the Network Datastore (Esmond), the initial question was how to push the data to consumers in a way beneficial for multiple VOs. Possible solutions were discussed during a meeting of WLCG Network and Transfer Metrics WG and it turned out that usually only a stream of the most up-to-date metrics was really needed. As a result a decision was made that an additional interface, based on standard message queues (MQ), should be implemented. Such solution provided a VO-agnostic interface and introduced an additional benefit in form of a layer that protects Esmond from a query flood.
The architecture of the perfSONAR-DIRAC bridge is presented in the diagram below.
43 Distributed Infrastructure with Remote Agent Control, http://lhcb-comp.web.cern.ch/lhcb-comp/DIRAC/
31

The bridge consists of the following elements:Network Datastore (Esmond) – gathers, stores and publishes all network metrics via Esmond API (HTTP GET requests)Esmond2MQ – a python module responsible for selecting the most up-to-date metrics and publishing them as messagesActiveMQ – a message queue that provides several different topic (packet-loss-rate, one-way-delay, throughput, etc.)NetworkAgent – a message queue client implemented as a DIRAC agentExcluding NetworkAgent all elements were deployed as production instances in 2015.
Metrics visualisationThe DIRAC framework provides a convenient way to visualize data. Required records are taken from the internal database which is continuously updated by the NetworkAgent with data received from the message queue. Since the bucket length in the internal database is equal to 15 minutes, it is convenient to only store summaries (one measurement per perfSONAR instance every 5 minutes).Currently the agent is only subscribed to the packet-loss-rate topic. For this metric two types of quality plots have been prepared in the DIRAC framework (see figure below):
Standard (left figure below), where colour of the box is proportional to the value of packet loss rate in the whole range (0-100%)
Magnified (right figure below), where colour of the box is proportional in the range from 0 to 10% and above 10% the box is always red
32

The development instance of DIRAC is available at: https://dirac.cis.gov.pl (authentication with a grid certificate required). Integration with the production instance of LHCb DIRAC is planned for the Spring 2016. Before that time additional plots, i.e. throughput and one-way-delay, will be added. After the integration is finished it will be possible to easily correlate perfSONAR measurements with other data management activities in DIRAC.
Complementary End-to-End Monitoring
The WLCG network and transfer metrics working group is trying to identify additional metrics related to ongoing data-transfers that can also provide insight into both the networks WLCG uses as well as the end-to-end data transfers continually underway. Both ATLAS and CMS rely upon FTS (and now FTS3) to handle transfers of files between sites and the transfer details (file size, source, destination, time, transfer rate) are tracked centrally. In addition the LHC experiments are also using the XRootD protocol to provide WAN access to data files directly, rather than copying the files first. To check the XRootD behavior regular XRootD file transfers are regularly scheduled between various sites and the results are stored in a central database at CERN.
The combination of file transfer metrics end-to-end along with the set of network metrics provided by perfSONAR will allow us to quickly differentiate between end-site issues and network issues. As noted in the ATLAS example in the previous section, we finally have all the relevant data in an analytics platform that allows us to make sophisticated analyses using a variety of types of data.
Summary: Progress in HEP Network Monitoring for 2015
As noted above, efforts to ensure commonality in both monitoring and provisioning of networks have seen a significant increase in activity in HEP during 2015. Originally, the GLIF44 and DICE45 communities were both working toward implementing “managed” network services and the corresponding monitoring that will be needed to support their efforts. During 2015 there were a number of new or expanded initiatives within global HEP:44 “Global Lambda Integrated Facility”, see http://www.glif.is/45 “DANTE-Internet2-CANARIE-ESnet collaboration, see http://www.geant2.net/server/show/conWebDoc.1308
33

The WLCG community completed deploying perfSONAR toolkits at sites to provide needed network visibility for users, site-admins and eventually higher-level services via the WLCG Network and Transfer Metrics Working Group.
The Open Science Grid (OSG) is focused on gathering OSG and WLCG perfSONAR metrics worldwide and making those metrics available to everyone.
The WLCG experiments have been engaged in the networking efforts from various projects. The ATLAS and LHCb experiments already have significant examples in place and are testing and tuning their software stacks in the use of network metrics.
To summarize, 2015 has seen a convergence to a standard network monitoring infrastructure based upon perfSONAR. The goal is to have a single infrastructure providing network related metrics for HEP. This is feasible because HEP’s use of the network is qualitatively the same between HEP collaborations. It is desirable because network providers and users don’t want to have multiple “network measurement infrastructures” making redundant (and possibly interfering) measurements nor do they wish to have to develop, deploy and support many such instances when one will do.
Related HEP Network Research There has been a significant amount of research around managed networks for HEP that we should note. Some of the existing monitoring discussed in previous sections either came out of these efforts or is being further developed by them.
In summer 2010 a new NSF MRI project was funded called DYNES46. The DYNES collaboration (Internet2, Caltech, Michigan and Vanderbilt) intends to create a virtual distributed instrument capable of creating dynamic virtual circuits on-demand between the participating member sites. The LHC community and its data access and transport requirements are the primary “users” targeted by this new infrastructure. Funding was provided to initially deploy DYNES at 40 institutions and 14 regional networks within the United States. DYNES leverages prior work related to virtual circuit construction, QoS and perfSONAR to enable the required capabilities. Instrument deployment began in spring 2011. The DYNES project was completed in July 2013 but work is continuing on a best effort basis to improve the ability of DYNES sites to utilize end-to-end circuits.
During 2012, with the LHC Long Shutdown 1 (LS1) approaching in 2013 through the spring of 2015, many people realized we have an opportunity to better integrate networking within our various LHC computing and software infrastructure. Two specific proposals targeting this area were funded in 2012 and have been active through 2015:
Advanced Network Services for Experiments (ANSE), NSF funded (Caltech, Michigan, Vanderbilt and U Texas Arlington)
Next Generation Workload Management and Analysis System for Big Data, PANDA integration with networking, DOE ASCR funded (BNL, U Texas Arlington)
ANSE is focusing on the integration of advanced network services into the software stacks of ATLAS and CMS with a goal of transparently integrating new networking capabilities to increase the overall efficiency and effectiveness of their globally distributed computing and 46 “Development of Dynamic Network System”, Internet2, see http://www.internet2.edu/ion/dynes.html
34

storage resources. The ATLAS PANDA proposal had a similar focus and updated the PANDA infrastructure with network “awareness” and the ability to interact with network services to prioritize and manage its workload.
Comparison with HEP Needs
Previous studies of HEP needs, for example from the Trans-Atlantic Networking Report (http://gate.hep.anl.gov/lprice/TAN/Report/TAN-report-final.doc) focused on communications between developed regions such as Europe and North America. In such reports packet loss less than 1%, vital for unimpeded interactive log-in, is assumed and attention is focused on bandwidth needs and the impact of low, but non-zero, packet loss on the ability to exploit high-bandwidth links. The PingER results show clearly that much of the world suffers packet loss impeding even very basic participation in HEP experiments and points to the need for urgent action. In addition the more detailed monitoring via perfSONAR shows that even many of our high-performance network links in nominally “good” areas of the world suffer from packet loss at a level that can significantly impact HEP dataflows.
The PingER throughput predictions based on the Mathis formula assume that throughput is mainly limited by packet loss. The 15% per year growth curve in Error: Reference source notfound is somewhat lower than the 79% per year growth in future needs that can be inferred from the tables in the TAN Report. True throughput measurements have not been in place for long enough to measure a growth trend. Nevertheless, the throughput measurements, and the trends in predicted throughput, indicate that current attention to HEP needs between developed regions could result in needs being met. In contrast, the measurements indicate that the throughput to less developed regions is likely to continue to be well below that needed for full participation in future experiments.
Recommendations
There is interest from ICFA, ICTP, IHY and others to extend the monitoring further to countries with no formal HEP programs, but where there are needs to understand the Internet connectivity performance in order to aid the development of science. Africa is a region with many such countries. The idea is to provide performance within developing regions, between developing regions and between developing regions and developed regions.
We should strive for >=2 remote sites monitored in each major Developing Country. All results should continue to be made available publicly via the web, and publicized to the HEP community and others. Typically HEP leads other sciences in its needs and developing an understanding and solutions. The outreach from HEP to other sciences is to be encouraged. The results should continue to be publicized widely.
We need assistance from ICFA and others to find sites to monitor and contacts in the developing and the rest of the world, especially where we have <= 1 site/country. A current list of countries with active nodes can be found at http://www-iepm.slac.stanford.edu/pinger/sites-per-country.html.
35

Work on high performance monitoring of the network using perfSONAR must continue. It is critical that we provide a robust toolkit deployment that requires minimal local administrator maintenance. The value of these deployments depends upon the broad-scale deployment so we have the metrics to identify and localize network problems. Beyond just having a resilient infrastructure operating worldwide, we need to make additional progress in alerting and alarming when specific network problems are found. This will maximize the value of our deployments for all HEP users.
Future Support for PingER
The PingER project with members in: Pakistan at NUST Islamabad and the University of Agriculture Faisalabad; the Malaysian Universities of UNIMAS, UM, and UUM; and SLAC continues to meet monthly by Skype. In addition there are collaborators at the Federal University of Rio de Janeiro, and the Federal Rural University of Rio de Janeiro.
The funding we had at SLAC is now exhausted as is the Pakistani Higher Education Commission (HEC) funding for PingER at NUST. As a result the resources available to PingER in Pakistan dropped and the number of working monitoring hosts in Pakistan has dropped by about 50% (~20).
Hassaan Khaliq of NUST has submitted a proposal to HEC and is optimistic that if the proposal is accepted then we can easily have a full time RA for the project. However it may take a while to get acceptance and funding. In the meantime NUST has also added another student on this project who will be working to improve the monitors in Pakistan. In addition the father/mentor of PingER in Pakistan Dr. Arshad Ali has now left NUST and is now the executive director of HEC. This post is the second highest in HEC, right after the chairman.
In the coming year we need to automate updating of the FTP PingER archive to enable others to use big data mining, analysis and representation.
In the coming year: There is still interest in Africa as seen in the recent Huffington Post Article6 so we will
be ensuring that we continue to track Africa’s Internet performance; We look forward to a successful resolution of NUSTs proposal to HEC; This summer, we plan to host a student from Brazil for 3 months at SLAC to continue
the work on the PingER data warehouse; We are working with a team including 9 students at Amity University in Delhi India who
are working on analyzing PingER data. Once the students have their degree we plan to invite them to SLAC.
AcknowledgementsWe gratefully acknowledge the following: the assistance from NUST SEECS in improving the PingER toolkit and management has been critical to keeping the project running, with respect to this we particularly acknowledge the support of their leader Arshad Ali; and the students and lecturers who have assisted including recently: Umar Kalim, Anjum Navid, Raja Asad Khan of
36

NUST SEECS who helped in updating some of the graphs, the case studies on Africa and Pakistan and implementation of PingER tools such as TULIP. Mike Jensen provided much useful information on the status of networking in Africa47. Alberto Santoro of UERJ provided very useful information on Latin America. Sergio Novaes of UNESP and Julio Ibarra of Florida International University provided useful contacts in Latin America. We received much encouragement from Marco Zennaro and Enrique Canessa of ICTP and from the ICFA/SCIC in particular from Harvey Newman the chairman.
We must also not forget the help and support from the administrators of the PingER monitoring sites worldwide as well as all the perfSONAR site managers, the Open Science Grid and the WLCG working group members. Last, but not least, we would like to acknowledge the significant support the National Science Foundation has provide to perfSONAR and to various related networking projects.
Appendices
Appendix A: PingER Presentations etc. in 2015.Publications and White papers (most recent first)
Survey on Big Data Indexing strategies, Fatima Bintu Adama, Adib Habbal, Suhaidi Hassan, R. Les Cottrell. Bebo White, Ibrahim Abdullahi, presented at NETAPPS 201548, SLAC-PUB-16460.
Worldwide Internet Performance Measurements Using Lightweight Measurement PlatformsR. Les Cottrell, Thiago Barbosa, Bebo White, Johari Abdullah and Topher White, presented at NETAPPS 201534, SLAC-PUB-16461.
Applying Data Warehousing and Big Data Techniques to Analyze Internet Performance, T. M. S. Barbosa, R. F. Souza, S. M. S. Cruz, M. L. Campos and R. Les Cottrell. SLAC PUB, presented at NETAPPS2015 34, SLAC-PUB-16464.
PingER Malaysia-Internet Performance Measuring Project: A Case Study, Saqib Khan, R. Les A Cottrell, Anjum Naveed, presented at NETAPPS 201534, SLAC-PUB-16462
Adaptive Geolocation of Internet Hosts, Raja A.A. Khan, R. Les. Cottrell, Anjum Naveed, presented at NETAPPS 201534, SLAC-PUB-16463.
International Committee for Future Accelerators - Standing Committee on Inter-Regional Connectivity (ICFA-SCIC) 2015 Report on Networking , compiled by Les Cottrell and Shawn McKee on behalf of the working group, January 2015.
Talks (most recent first)
PingER Malaysia-Internet Performance Measuring Project: A Case Study , Saqib Ali, R. Les Cottrell, Anjum Naveed, presented at NetApps2015, Dec 2015
47 Mike Jensen, "Connectivity Mapping in Africa", presentation at the ICTP Round Table on Developing Country Access to On-Line Scientific Publishing: Sustainable Alternatives at ITCP, Trieste, October 2002. Available http://www.ictp.trieste.it/~ejds/seminars2002/Mike_Jensen/jensen-full.ppt48 4th International Conference on Internet Applications, Protocols and Services [NETAPPS2015] Cyberjaya, Malaysia, 1-3 December 2015, see http://netapps2015.internetworks.my/v2/
37

Applying Data Warehousing and Big Data Techniques to Analyze Internet Performance , Thiago Barbosa, Renan Souza, Sergio Serra, R. Les Cottrell presented at NetApps2015, Dec 2015
Worldwide Internet performance measurements using a Raspberry P i, presented at NetApps2015, Dec 2015. Also a video.
Adaptive Geolocation of Internet Hosts, Raja A. A. Khan, Anjum Naveed, R. Les Cottrell presented at NetApps2015, Dec 2015
A Survey on Big Data Indexing Strategies , Fatima Binta Adama, Adib Habbal, Suharidi Hassan, R. Les Cottrell, Bebo White, Ibrahim Abdullahi, presented at NETAPPS2015, Dec 2015.
Monitoring the World's Networks , Les Cottrell et. al., presented by Prof Harvey Newman at the ICFA meeting CERN February 2015.
Appendix B: ICFA/SCIC Network Monitoring Working Group
The formation of this working group was requested at the ICFA/SCIC meeting at CERN in March 2002 49 . The mission is to: Provide a quantitative/technical view of inter-regional network performance to enable understanding the current situation and making recommendations for improved inter-regional connectivity.
When the ICFA/SCIC Network Monitoring team was assembled in 2002, the lead person for the monitoring working group was identified as Les Cottrell. Les assembled a team of 5 others to assist in preparing the report. By the end of 2015 only Les and Shawn McKee were still active and Les was unable to continue as team leader, in part because of the lack of funding for PingER.
For 2016 a new team needed to be put into place. Shawn McKee and Marian Babik agreed to take over assembling the report and a new team was recruited:
Table 1: Members of the ICFA/SCIC Network Monitoring teamShawn McKee Michigan OSG, USATLAS, WLCG [email protected] Babik CERN WLCG, CERN [email protected] Cottrell SLAC US, PingER [email protected] Hayashi Indiana OSG [email protected] Tierney LBNL perfSONAR [email protected] Giemza NCBJ LHCb [email protected] Vukotic Chicago ATLAS [email protected] O’Connor BNL ESnet, LHCONE [email protected]
49 "ICFA/SCIC meeting at CERN in March 2002". Available http://www.slac.stanford.edu/grp/scs/trip/cottrell-icfa-mar02.html
38

The working group wants to explicitly acknowledge Les’s excellent leadership and the exceptional work that he has put into 14 years organizing and writing these annual reports. We hope he will be able to continue his participation for future reports!
Goals of the Working Group
Obtain as uniform picture as possible of the present performance of the connectivity used by the ICFA community.
Prepare reports on the performance of HEP connectivity, including, where possible, the identification of any key bottlenecks or problem areas.
39