
FDI Flows in Service Sector: Evidence from India - …irjbm.org/irjbm2013/Oct2014/Paper5.pdf · FDI...
13
IRJBM – (www.irjbm.org ) Volume No – VII October - 2014 Issue – 10 Page 33 © Global Wisdom Research Publications – All Rights Reserved. FDI Flows in Service Sector: Evidence from India Dr. M. Sumathy Associate Professor School of Commerce, Bharathiar University Coimbatore -641046, South India L.S. Sridhar Research Scholar School of Commerce, Bharathiar University Coimbatore -641046, South India Abstract The paper investigates objective of this paper is to examine the Foreign Direct Investment (FDI) inflows in India and especially in service sector. In this study using time series data of FDI along with GDP (Service Sector) and the period of study is from 2000 to 2014. In this research attempts the FDI and its impact in GDP, mainly we have seen the relationship between the GDP with FDI flows. This analysis has revealed that Foreign Direct Investment has positive and significant impact on GDP We understand the FDI Inflows in service Sector is showing the consecutive growth trend to getting FDI inflows. Key words: FDI Service Sector JEL Classification: F21 Foreign capital plays a constructive role in a country’s economic development. Foreign direct investment (FDI) is regarded as a factor that drives economic growth (Wang, 2009). Many governments from developed and developing countries believe that FDI can help them get through stagnation and even circumvent the poverty trap (Brooks et al., 2010). India is the second fastest growing major economy in the world. Indian economy is diverse and encompasses agriculture, handicrafts, manufacturing, textile and a multitude of services (Wang et al., 2010). India adopted a socialist inspired approach for most of its independent history with the strict government control over private sector participation, foreign trade and foreign direct investment. In 1991, Government of India initiated a no. of economic reforms. As a result of the various policy initiatives taken, India has rapidly changing from restrictive regime to a liberal one. According to International Monetary Fund (IMF), FDI is defined as “an investment operating in an economy other than that of the investor.” The investor’s purpose is to have an effective voice in the management of the enterprise (IMF, 1977). • FDI is the process by which the residents of one country (the source) acquire the ownership of assets for the purpose of controlling the production, distribution and other productive activities of a firm in another country (the host country) There are two types of FDI Greenfield Investment: A form of FDI where a parent company starts a new venture in a foreign country by constructing new factories and/or stores. Mergers and Acquisition: It occurs when a transfer of existing assets from local firms takes place.
Transcript of FDI Flows in Service Sector: Evidence from India - …irjbm.org/irjbm2013/Oct2014/Paper5.pdf · FDI...
IRJBM – (www.irjbm.org ) Volume No – VII October - 2014 Issue – 10 Page 33 © Global Wisdom Research Publications – All Rights Reserved.
FDI Flows in Service Sector: Evidence from India
Dr. M. Sumathy Associate Professor
School of Commerce, Bharathiar University Coimbatore -641046, South India
L.S. Sridhar
Research Scholar School of Commerce, Bharathiar University
Coimbatore -641046, South India
Abstract The paper investigates objective of this paper is to examine the Foreign Direct Investment (FDI) inflows in India and especially in service sector. In this study using time series data of FDI along with GDP (Service Sector) and the period of study is from 2000 to 2014. In this research attempts the FDI and its impact in GDP, mainly we have seen the relationship between the GDP with FDI flows. This analysis has revealed that Foreign Direct Investment has positive and significant impact on GDP We understand the FDI Inflows in service Sector is showing the consecutive growth trend to getting FDI inflows. Key words: FDI Service Sector JEL Classification: F21
Foreign capital plays a constructive role in a country’s economic development. Foreign direct investment (FDI) is regarded as a factor that drives economic growth (Wang, 2009). Many governments from developed and developing countries believe that FDI can help them get through stagnation and even circumvent the poverty trap (Brooks et al., 2010). India is the second fastest growing major economy in the world. Indian economy is diverse and encompasses agriculture, handicrafts, manufacturing, textile and a multitude of services (Wang et al., 2010). India adopted a socialist inspired approach for most of its independent history with the strict government control over private sector participation, foreign trade and foreign direct investment. In 1991, Government of India initiated a no. of economic reforms. As a result of the various policy initiatives taken, India has rapidly changing from restrictive regime to a liberal one.
According to International Monetary Fund (IMF), FDI is defined as “an investment operating in an economy other than that of the investor.” The investor’s purpose is to have an effective voice in the management of the enterprise (IMF, 1977).
• FDI is the process by which the residents of one country (the source) acquire the ownership of assets for the purpose of controlling the production, distribution and other productive activities of a firm in another country (the host country)
There are two types of FDI
Greenfield Investment: A form of FDI where a parent company starts a new venture in a foreign country by constructing new factories and/or stores. Mergers and Acquisition: It occurs when a transfer of existing assets from local firms takes place.
IRJBM – (www.irjbm.org ) Volume No – VII October - 2014 Issue – 10 Page 34 © Global Wisdom Research Publications – All Rights Reserved.
0
10,000
20,000
30,000
40,000
50,000
60,000
70,000
80,000
Mar
uitiu
s
Singa
pore
U.K
Japa
nUSA
Net
herla
nds
Cyp
rus
Ger
man
y
Franc
e
Switz
erla
nd
Share of Top Ten Countries - FDI Inflows
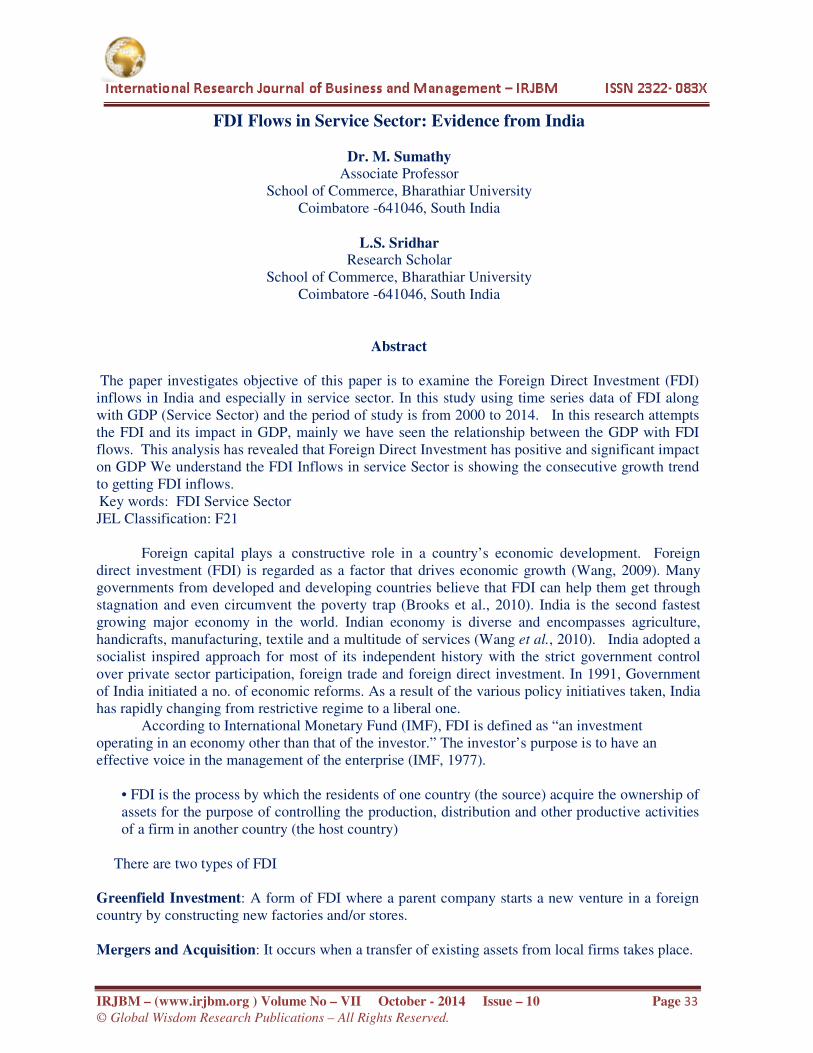
According to the UNCTAD report of 2014, China has the highest FDI inflows among all the developing countries like Hong Kong, Russia, Singapore, Brazil and India; because China has introduced FDI over 20 years ago and has progressively pursued foreign investment while adjusting its FDI policies. Since 1993, China has attracted the largest amount of FDI of all developing countries while increasing its levels of both exports and technological advancement (Monhanty et
al., 2007) The FDI has coming from various parts of world, in that the major ten countries sharing huge. The figure 1, shows that the major contribution has come from the Maruitius, Singapore and U.K has sharing second and third places respectively. There were 50-60 countries has been deposited their funds in the form of FDI in India every year.
Figure-1: Top Ten Countries FDI Inflows
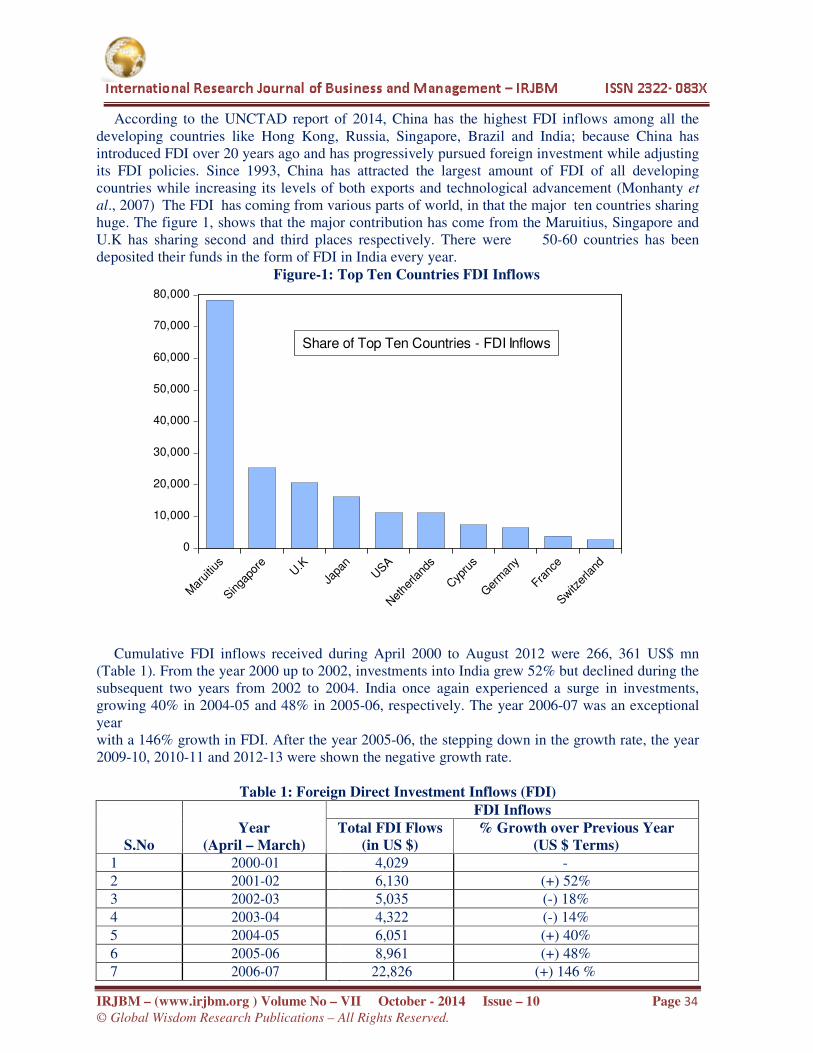
Cumulative FDI inflows received during April 2000 to August 2012 were 266, 361 US$ mn
(Table 1). From the year 2000 up to 2002, investments into India grew 52% but declined during the subsequent two years from 2002 to 2004. India once again experienced a surge in investments, growing 40% in 2004-05 and 48% in 2005-06, respectively. The year 2006-07 was an exceptional year with a 146% growth in FDI. After the year 2005-06, the stepping down in the growth rate, the year 2009-10, 2010-11 and 2012-13 were shown the negative growth rate.
Table 1: Foreign Direct Investment Inflows (FDI)
S.No Year
(April – March)
FDI Inflows Total FDI Flows
(in US $) % Growth over Previous Year
(US $ Terms) 1 2000-01 4,029 -
2 2001-02 6,130 (+) 52%
3 2002-03 5,035 (-) 18%
4 2003-04 4,322 (-) 14%
5 2004-05 6,051 (+) 40%
6 2005-06 8,961 (+) 48%
7 2006-07 22,826 (+) 146 %
IRJBM – (www.irjbm.org ) Volume No – VII October - 2014 Issue – 10 Page 35 © Global Wisdom Research Publications – All Rights Reserved.
8 2007-08 34,843 (+) 53%
9 2008-09 41,873 (+) 20%
10 2009-10 (P)+ 37,745 (-) 10%
11 2010-11 (P)+ 34,847 (-) 08%
12 2011-12 (P) 46,553 (+) 34%
13 2012-13(P) 34,298 (-) 26 %
14
2013-14 (P)
36,396 (+) 6%
Cumulative Total (from April,2000 to March,2014) - 149,663 P –Provisional , “+” – Reinvested and other capital
Source: Department of Industrial Policy & Promotion, Govt. of India
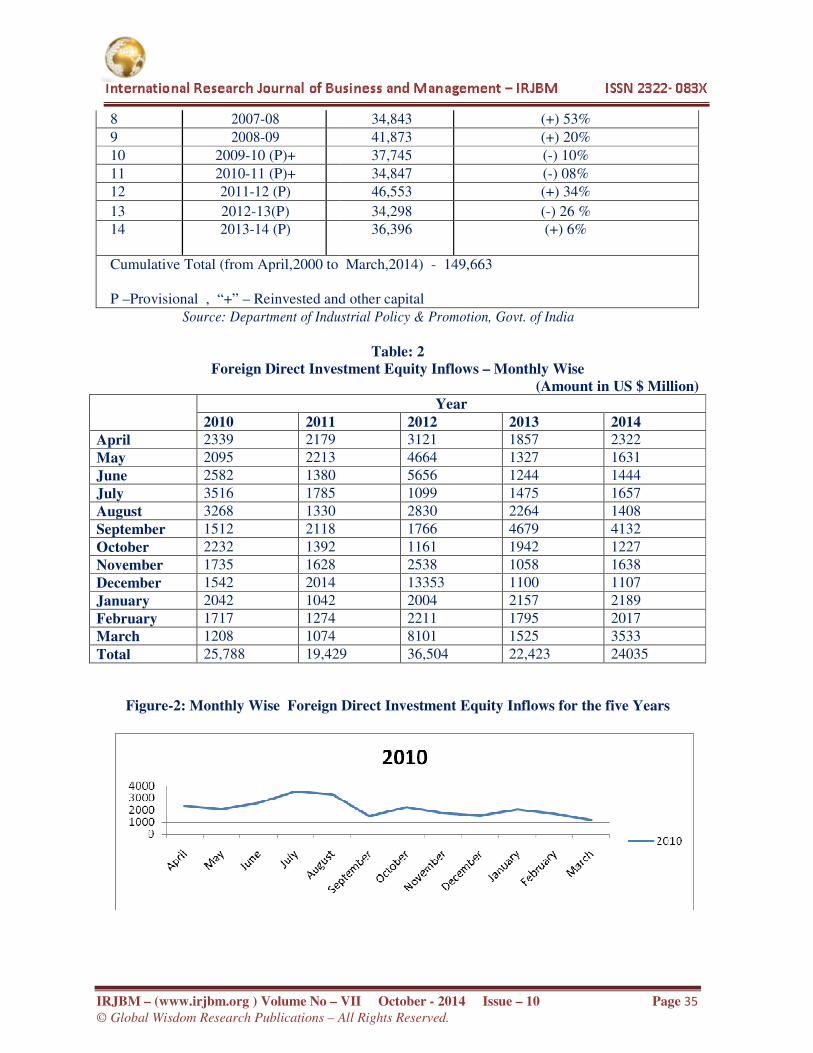
Table: 2
Foreign Direct Investment Equity Inflows – Monthly Wise (Amount in US $ Million)
Year
2010 2011 2012 2013 2014 April 2339 2179 3121 1857 2322
May 2095 2213 4664 1327 1631
June 2582 1380 5656 1244 1444
July 3516 1785 1099 1475 1657
August 3268 1330 2830 2264 1408
September 1512 2118 1766 4679 4132
October 2232 1392 1161 1942 1227
November 1735 1628 2538 1058 1638
December 1542 2014 13353 1100 1107
January 2042 1042 2004 2157 2189
February 1717 1274 2211 1795 2017
March 1208 1074 8101 1525 3533
Total 25,788 19,429 36,504 22,423 24035
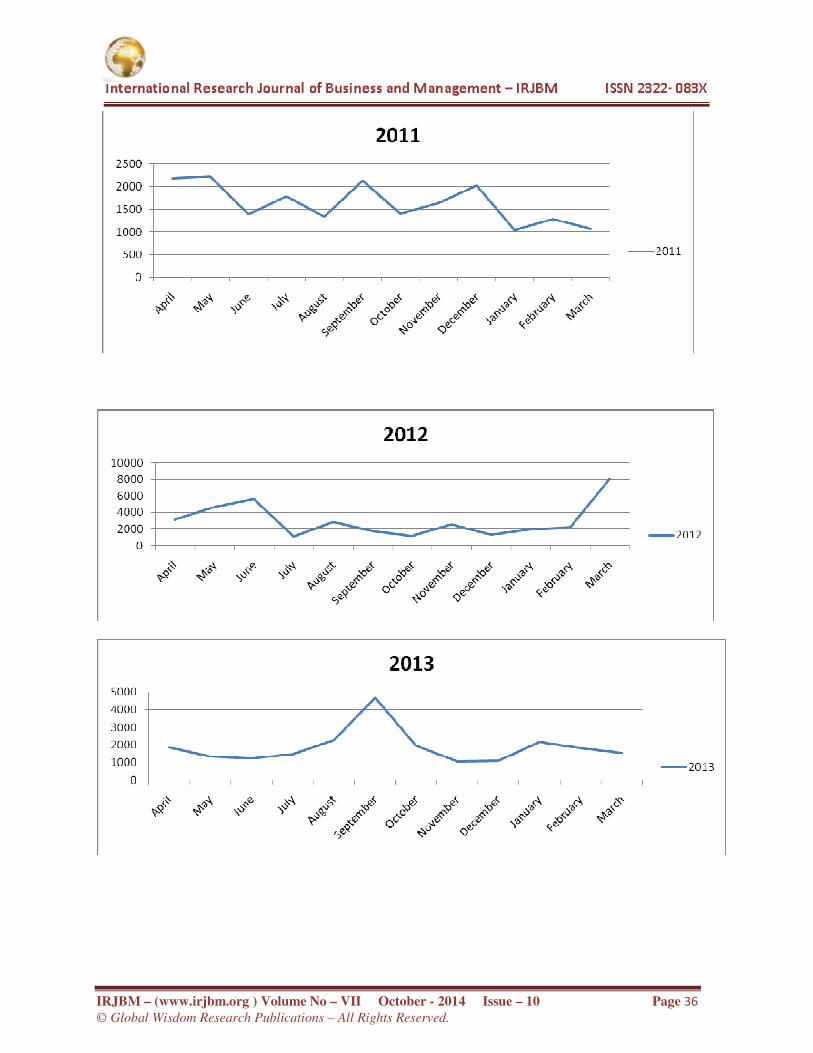
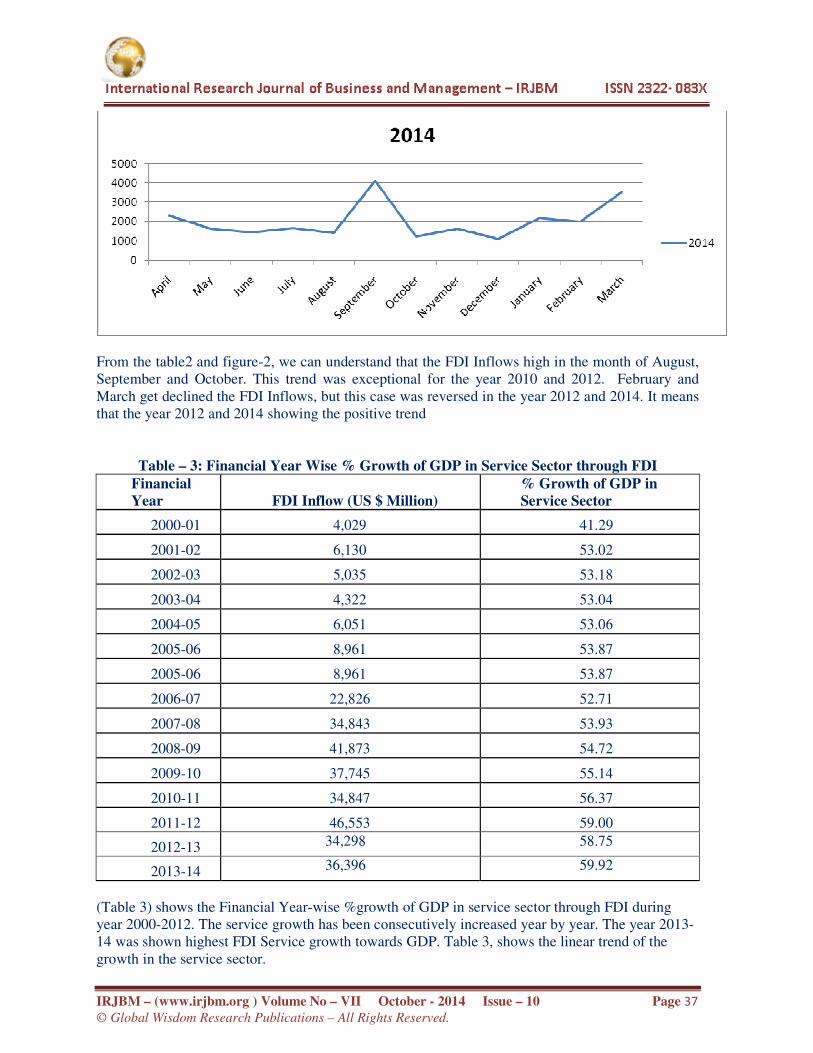
Figure-2: Monthly Wise Foreign Direct Investment Equity Inflows for the five Years
IRJBM – (www.irjbm.org ) Volume No – VII October - 2014 Issue – 10 Page 36 © Global Wisdom Research Publications – All Rights Reserved.
IRJBM – (www.irjbm.org ) Volume No – VII October - 2014 Issue – 10 Page 37 © Global Wisdom Research Publications – All Rights Reserved.
From the table2 and figure-2, we can understand that the FDI Inflows high in the month of August, September and October. This trend was exceptional for the year 2010 and 2012. February and March get declined the FDI Inflows, but this case was reversed in the year 2012 and 2014. It means that the year 2012 and 2014 showing the positive trend
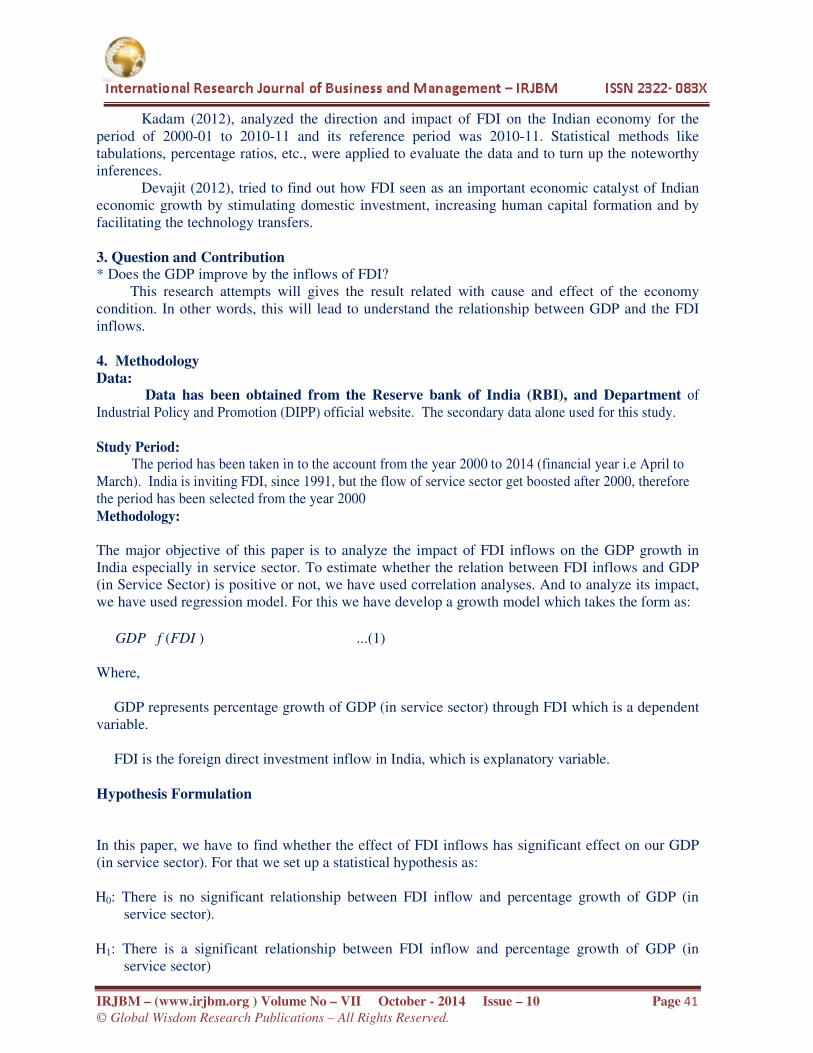
Table – 3: Financial Year Wise % Growth of GDP in Service Sector through FDI
Financial Year FDI Inflow (US $ Million)
% Growth of GDP in Service Sector
2000-01 4,029 41.29
2001-02 6,130 53.02
2002-03 5,035 53.18
2003-04 4,322 53.04
2004-05 6,051 53.06
2005-06 8,961 53.87
2005-06 8,961 53.87
2006-07 22,826 52.71
2007-08 34,843 53.93
2008-09 41,873 54.72
2009-10 37,745 55.14
2010-11 34,847 56.37
2011-12 46,553 59.00
2012-13 34,298 58.75
2013-14 36,396 59.92
(Table 3) shows the Financial Year-wise %growth of GDP in service sector through FDI during year 2000-2012. The service growth has been consecutively increased year by year. The year 2013-14 was shown highest FDI Service growth towards GDP. Table 3, shows the linear trend of the growth in the service sector.

IRJBM – (www.irjbm.org ) Volume No – VII October - 2014 Issue – 10 Page 38 © Global Wisdom Research Publications – All Rights Reserved.
Figure -3: Total FDI Inflows and FDI Inflows in Service Sector (Amount in US$ Million)
Figure- 4: Top Five State Capital – FDI Equity Inflows

IRJBM – (www.irjbm.org ) Volume No – VII October - 2014 Issue – 10 Page 39 © Global Wisdom Research Publications – All Rights Reserved.
From the figure 4, we can understand the FDI inflows towards Mumbai got decreased in the year 2013-14. Delhi has got advantage. Chennai is maintaining the same position (3rd position). The year 2012-13 and 2013-14, there were no much change in Chennai position.
Table 4: Top Five Sectors FDI Inflows Ranks Sector FDI Inflows (in US $ Million)
2009-10
2010-11
2011-12
2012-13
2013-14
Cumulative Inflows (April 2000- March,2014)
% to Total Inflows (US $)
1 Service Sector **
4,176 3,296 5,216 4,833 2,225 39,460 18 %
2 Construction on Development- Infrastructure
2,852 1,103 3,141 1,332 1,226 23,306 11%
3 Telecommunication
2,539 1,665 1,997 304 1,307 14,163 7%
4 Computer Software and Hardware
872 780 796 486 1,126 12,817 6%
5 Drugs and Pharmaceuticals
213 209 3,232 1,123 1,279 11,598 5%
** Services sector includes Financial, Banking, Insurance, Non-Financial / Business, Outsourcing, R&D, Courier, Tech. Testing and Analysis
(Table 4) explains the sectors attracting highest FDI Equity Inflows .The service sector (financial and non- financial), construction development, and telecommunications are the top three sectors that received maximum investment inflows during the financial period 2010 to 2014. 2. Literature Review
Various theories have been developed since the 1960s to explain FDI. These theories
proclaim a number of determinants that could explain foreign direct investment flows, involving the micro (e.g., organisational aspects) and macro (e.g., resource allocation) dimensions (Dunning and Lundan, 2008). The micro dimension includes factors intrinsic to the company itself, such as ownership advantages, cost reduction and economies of scale, whereas the macro dimension concerns market specific factors such as barriers to entry, availability of resources, political stability, country risk and market size, among others (Faeth, 2009)

IRJBM – (www.irjbm.org ) Volume No – VII October - 2014 Issue – 10 Page 40 © Global Wisdom Research Publications – All Rights Reserved.
Balasubramanyam and Mahambare (2003) as well as Fischer (2002) argue that the reforms
implemented so far have not eliminated the distinct anti-export bias of India's trade policy. Janicki and Wunnava (2004), using the Institutional Investor country risk rating, provided
evidence that higher risk reduces the FDI receipts. Kinoshita and Campos (2003) provided evidence that rule of law and quality of bureaucracy, are significant FDI drivers. On the other hand, the FDI restrictions were found to be efficient barrier to FDI inflows.
Arabi (2005) and Agarwal (2001), FDI in India has remained domestic market seeking. It is
widely believed that the type of FDI and its structural composition matter at least as much for economic growth effects as does the overall volume of inward FDI.
Agrawal and Shahani (2005) reckon that it is the quality of FDI that matters for a country like India rather than its quantity. FDI is often supposed to be of higher quality if it is export oriented, transfers foreign technologies to the host country, and induces economic spillovers benefiting local enterprises and workers (Ender wick 2005).
Agrawal (2005) estimates a fixed effects model based on pooled data for five South Asian
host countries, among which India figures prominently, and the period 1965-1996. The coefficient of the FDI-to-GDP ratio turns out to be negative, though not significant. However, this approach ignores that FDI is endogenous. Moreover, the inclusion of exports as a right hand side variable may bias the coefficient of the FDI variable downwards to the extent that the growth impact of FDI may run through export promotion.
Bitzenis (2006), reviewing the various definitions of FDI, concludes that key features of the
foreign direct investments are “...investing / acquiring / obtaining a foreign firm or asset and influencing / controlling the management operations”.
FDI is expected to accelerate or contribute to the economic growth of all countries. The nexus between FDI and economic growth has been a subject of great discussion for several past years. Monhanty et al (2007) examined the interrelations among the variables FDI, GDP, exports, and imports of the four countries, china, India, Malaysia, and Singapore, using the technique of Panel Data Analysis. Their study confirmed that FDI promotes economic growth, provided an estimate that on dollar of FDI adds about 3.27 dollars to the GDP of each of the four countries.
Narayana et al. (2008), analysed theoretically India’s economic growth and the role of FDI. They showed the comparative analysis of the Indian and Chinese economy.
Elboiashi et al. (2009), investigated the causal relationships between FDI, domestic investment (DI) and economic growth (GDP) in Egytian, Moroccan and Tunisian economies. They applied co-integration time series techniques, Vector Error Correction (VEC) model over the sample period of 1970-2006. They found a unidirectional causality between FDI and GDP in Egypt and Morocco, and bi-directional causality between FDI and GDP in Tunisia.
Wang et al. (2010), examined logistics FDI and GDP in two aspects of time series and growth rate of china. They found empirically that logistic FDI improved the quality of foreign investment and promoted the change of China’s economic growth pattern to ensure the development of China’s economy.
Agrawal et al. (2011), investigated the effect of FDI on economic growth of China and India. They studied possible reasons behind China’s great showed of FDI and the lessons India should learn from China for better utilization of FDI.
Bose (2012) studied directed towards detecting the positive and negative sides for the foreign investors while they go for direct investment in India and China. A descriptive and explorative research study had been carried out for investigating the current proposition of the concerned case of FDI in those two countries.
IRJBM – (www.irjbm.org ) Volume No – VII October - 2014 Issue – 10 Page 41 © Global Wisdom Research Publications – All Rights Reserved.
Kadam (2012), analyzed the direction and impact of FDI on the Indian economy for the period of 2000-01 to 2010-11 and its reference period was 2010-11. Statistical methods like tabulations, percentage ratios, etc., were applied to evaluate the data and to turn up the noteworthy inferences.
Devajit (2012), tried to find out how FDI seen as an important economic catalyst of Indian economic growth by stimulating domestic investment, increasing human capital formation and by facilitating the technology transfers.
3. Question and Contribution * Does the GDP improve by the inflows of FDI? This research attempts will gives the result related with cause and effect of the economy condition. In other words, this will lead to understand the relationship between GDP and the FDI inflows. 4. Methodology Data: Data has been obtained from the Reserve bank of India (RBI), and Department of Industrial Policy and Promotion (DIPP) official website. The secondary data alone used for this study. Study Period: The period has been taken in to the account from the year 2000 to 2014 (financial year i.e April to March). India is inviting FDI, since 1991, but the flow of service sector get boosted after 2000, therefore the period has been selected from the year 2000 Methodology: The major objective of this paper is to analyze the impact of FDI inflows on the GDP growth in India especially in service sector. To estimate whether the relation between FDI inflows and GDP (in Service Sector) is positive or not, we have used correlation analyses. And to analyze its impact, we have used regression model. For this we have develop a growth model which takes the form as:
GDP f (FDI ) ...(1) Where,
GDP represents percentage growth of GDP (in service sector) through FDI which is a dependent variable.
FDI is the foreign direct investment inflow in India, which is explanatory variable. Hypothesis Formulation In this paper, we have to find whether the effect of FDI inflows has significant effect on our GDP (in service sector). For that we set up a statistical hypothesis as: H0: There is no significant relationship between FDI inflow and percentage growth of GDP (in
service sector). H1: There is a significant relationship between FDI inflow and percentage growth of GDP (in
service sector)
IRJBM – (www.irjbm.org ) Volume No – VII October - 2014 Issue – 10 Page 42 © Global Wisdom Research Publications – All Rights Reserved.
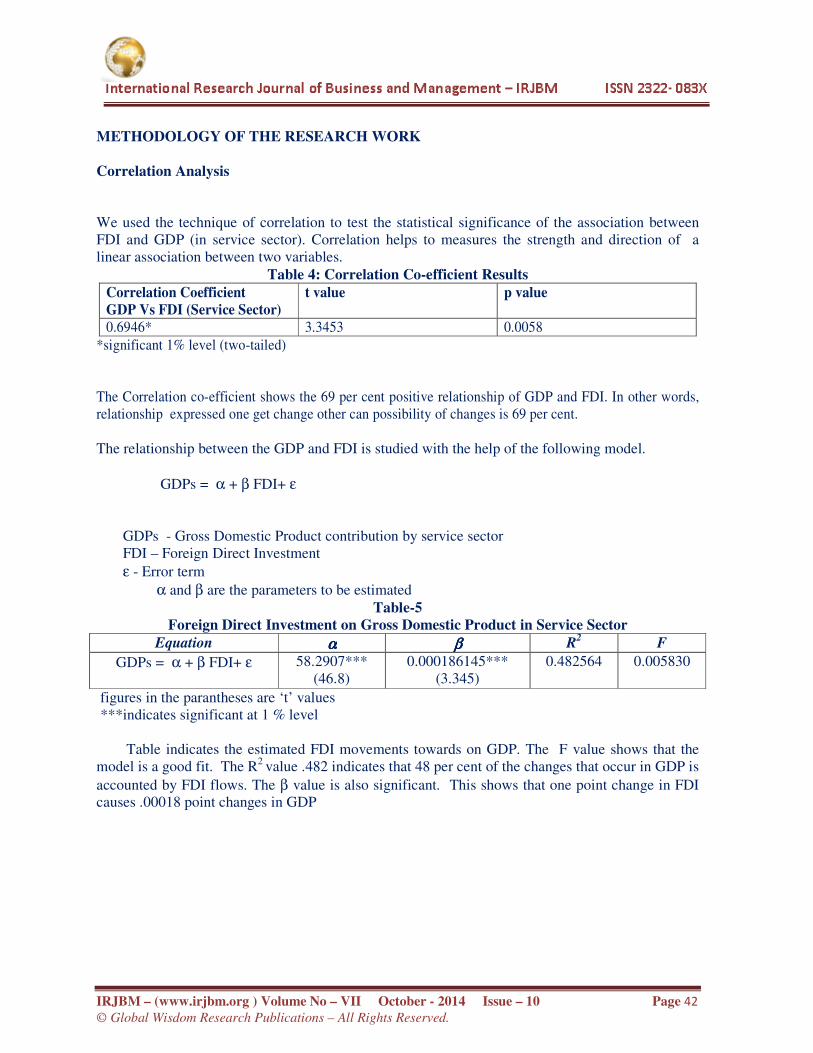
METHODOLOGY OF THE RESEARCH WORK Correlation Analysis We used the technique of correlation to test the statistical significance of the association between FDI and GDP (in service sector). Correlation helps to measures the strength and direction of a linear association between two variables.
Table 4: Correlation Co-efficient Results Correlation Coefficient GDP Vs FDI (Service Sector)
t value p value
0.6946* 3.3453 0.0058
*significant 1% level (two-tailed) The Correlation co-efficient shows the 69 per cent positive relationship of GDP and FDI. In other words, relationship expressed one get change other can possibility of changes is 69 per cent. The relationship between the GDP and FDI is studied with the help of the following model.
GDPs = α + β FDI+ ε GDPs - Gross Domestic Product contribution by service sector FDI – Foreign Direct Investment
ε - Error term
α and β are the parameters to be estimated Table-5
Foreign Direct Investment on Gross Domestic Product in Service Sector Equation αααα ββββ R
2 F
GDPs = α + β FDI+ ε
58.2907*** (46.8)
0.000186145*** (3.345)
0.482564 0.005830
figures in the parantheses are ‘t’ values ***indicates significant at 1 % level Table indicates the estimated FDI movements towards on GDP. The F value shows that the model is a good fit. The R2 value .482 indicates that 48 per cent of the changes that occur in GDP is
accounted by FDI flows. The β value is also significant. This shows that one point change in FDI causes .00018 point changes in GDP
IRJBM – (www.irjbm.org ) Volume No – VII October - 2014 Issue – 10 Page 43 © Global Wisdom Research Publications – All Rights Reserved.
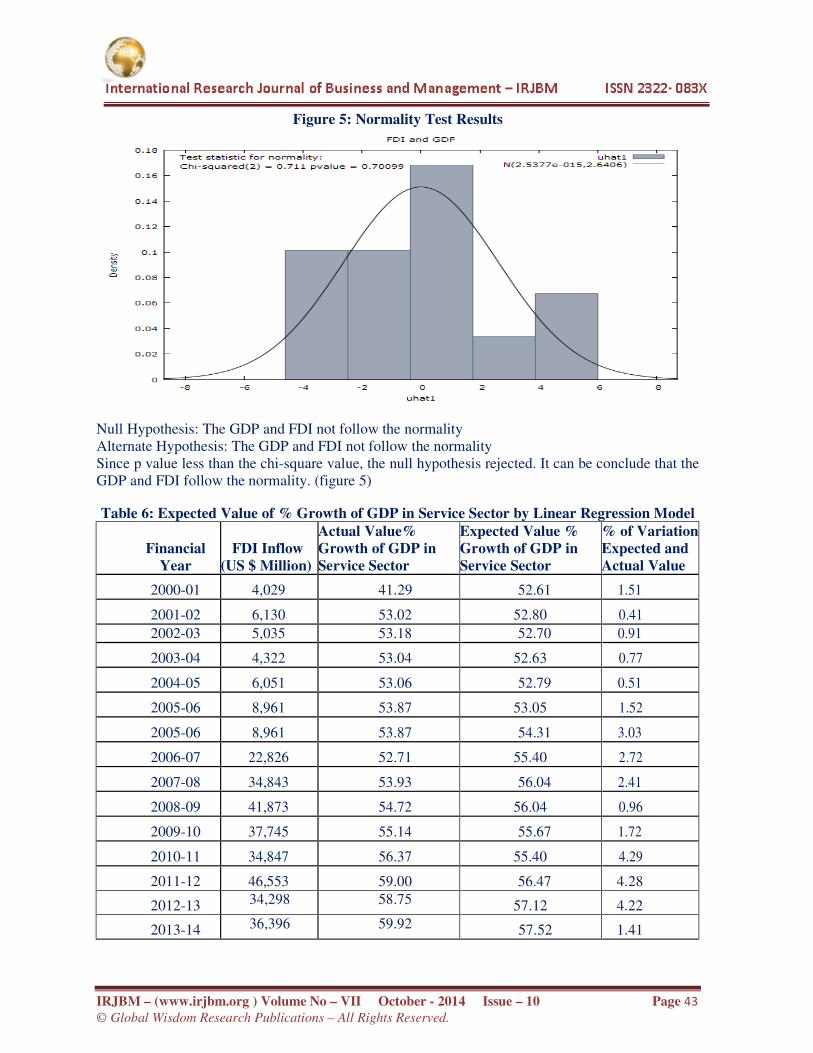
Figure 5: Normality Test Results
Null Hypothesis: The GDP and FDI not follow the normality Alternate Hypothesis: The GDP and FDI not follow the normality Since p value less than the chi-square value, the null hypothesis rejected. It can be conclude that the GDP and FDI follow the normality. (figure 5)
Table 6: Expected Value of % Growth of GDP in Service Sector by Linear Regression Model
Financial Year
FDI Inflow (US $ Million)
Actual Value% Growth of GDP in Service Sector
Expected Value % Growth of GDP in Service Sector
% of Variation Expected and Actual Value
2000-01 4,029 41.29 52.61 1.51
2001-02 6,130 53.02 52.80 0.41
2002-03 5,035 53.18 52.70 0.91
2003-04 4,322 53.04 52.63 0.77
2004-05 6,051 53.06 52.79 0.51
2005-06 8,961 53.87 53.05 1.52
2005-06 8,961 53.87 54.31 3.03
2006-07 22,826 52.71 55.40 2.72
2007-08 34,843 53.93 56.04 2.41
2008-09 41,873 54.72 56.04 0.96
2009-10 37,745 55.14 55.67 1.72
2010-11 34,847 56.37 55.40 4.29
2011-12 46,553 59.00 56.47 4.28
2012-13 34,298 58.75 57.12 4.22
2013-14 36,396 59.92 57.52 1.41
IRJBM – (www.irjbm.org ) Volume No – VII October - 2014 Issue – 10 Page 44 © Global Wisdom Research Publications – All Rights Reserved.
Forecast evaluation statistics Mean Error 4.0602e-015 Mean Squared Error 3.2763 Root Mean Squared Error 1.81 Mean Absolute Error 1.5811 Mean Percentage Error -0.10376 Mean Absolute Percentage Error 2.8613 95 % Confidence Interval 54.1165 to 57.6921 (t –value: 3.3453) From the table 6, it shows that the forecasted and actual lies in the normal curve. The 95% confidence interval shows the significant result. It can be concluded the Growth of GDP in Service Sector is a highly predictable one. It means growth of GDP follows the normality. Conclusion: India is the one of most attracting developing country to receiving FDI Inflows. Service sector is getting highly attractive one. In this research attempts the FDI and its impact in economy, mainly we have seen the positive relationship between the GDP (service Sector) with FDI flows. We have found the GDP of service Sector is getting boosted by to invite the FDI Inflows We understand the FDI Inflows in service Sector is showing the consecutive growth trend to getting FDI inflows. References:
1. Angles M et al., (2002) “Political Institutions, Capital Flows and Developing Country Growth: An Empirical Investigation”, Review of Development Economics, 6(2), 248-262.
2. Aggarwal Aradhna (2007), “The Influence of Labour Markets on FDI: Some Empirical Explorations in Export Oriented and Domestic Market Seeking FDI across Indian States”, presented at RIS for Developing countries, 1st February, New Delhi, India.
3. Balasubramanayam V. N., M. Salisu, and D. Spasford. 1996. “Foreign Direct investment and Growth EP and IS Countries.” Economic Journal 106: 92-105.
4. Blomstrom, M. and A. Kokko. 2003. “The Economics of Foreign Direct Investment Incentives.”
5. NBER Working Paper 9489. 6. Blomstrom, M. and A. Kokko. 1996. “Multinational Corporations and Spillovers.” Journal
of Economic Surveys 12: 247-277. 7. Barrell, R. and Pain, N. (1997) ‘The growth of Foreign Direct Investment in Europe’,
NationalInstitute Economic Review, pp.63–75. 8. Bitzenis, A. (2004). Why Foreign Banks Entering in Transition Economies; the Case of
Bulgaria. Global Business & Economics Review Journal, Vol.6, No.1, 2004, p.107-133. 9. Bitzenis, A (2006) "Decisive barriers that affect multinationals’ business in a transition
country". Global Business & Economics Review (special issue) – The political economy of transition, Vol. 8, Issue 1&2, p. 87-118
10. Bose Kanti Tarun (2012), “Advantages and Disadvantages of FDI in China and India”, Internationa Business Research, Vol. 5, No. 5, pp. 164-174
11. Devajit Mahanta (2012), “Impact of Foreign Direct Investment on Indian Economy”, Research Journal of Management Sciences, Vol. 1, No. 2, pp. 29-31
12. Elboiashi Hosein, Noorbakhsh Farhad, Paloni Alberto and Azemar Celine (2009), “The Causal Relationships between Foreign Direct Investment (FDI), Domestic Investment (DI) and Economic Growth (GDP) in North Africa Non-Oil Producing Countries: Empirical
IRJBM – (www.irjbm.org ) Volume No – VII October - 2014 Issue – 10 Page 45 © Global Wisdom Research Publications – All Rights Reserved.
Evidence from Co integration Analysis”, Advances in Management, Vol. 2, No. 11. 13. Kadam N Ravindranath (2012), “Attracting Foreign Direct Investment by India: A today’s
Great Challenge”, International Journal of Social Science Tomorrow, Vol. 1, No. 4, pp. 1-8. 14. Long Guoqiang, China’s Policies on FDI: Review and Evaluation, http://www.piie.
com/publications/chapters_preview/3810/ 12iie3810.pdf 15. Rodriguez-Clare, A. 1996. “Multinationals, Linkages and Economic Development.”
American Economic Review 86: 852-873. 16. Smarzynska, B. 2002. “Does Foreign Direct Investment Increase the Productivity of
Domestic 17. Firms? In Search of Spillovers through Backward Linkages.” World Bank Working Paper
2923. 18. UNCTAD, 1999 “Trends in international investment agreements: An Overview” UNCTAD
Series on Issues in International Investment Agreements. 19. UNCTAD, 2001. Trade and Investment Report. New York: The United Nations. 20. Wang, J.Y. and M. Blomstrom. 1992. “Foreign Investment and Technology Transfer: A
Simple Model.” European Economic Review 36: 137-155. 21. Mohanty B Bidhu, Dondeti V Reddy (2007), “Impact of Foreign Direct Investment on the Gross Domestic Product”, Exports and Imports of Four Asian Countries, Delhi Business Review, Vol. 8, No. 1, pp. 1-21